1. Introduction
Scientific evidence shows that climate change is occurring, mainly due to human activities. Global warming is mainly due to the emissions of CO2 caused by the combustion of fossil fuels (coal, natural gas, and oil) for energy production and transportation. Producing more energy from renewable sources is a way to reduce carbon emissions. Due to these considerations, the so-called green economy is no longer an idea, but a reality.
The first electric vehicles were manufactured in the late nineteenth century. At the end of the twentieth century, research on electric vehicles began again. New types of electric vehicles have been implemented [
1,
2,
3]:
- -
FHEV (full hybrid electric vehicle): with internal combustion engine (ICE) and electric motor working in parallel, it can be driven for short distances under electric power alone.
- -
PHEV (plug-in hybrid electric vehicle): a full hybrid electric vehicle with a larger battery pack which can be recharged from the electricity grid, enabling a longer electric-only driving range.
- -
EREV (extended range electric vehicle): an ICE and an electric motor working in series. A battery electric vehicle with an on-board charger (ICE and a generator) for the battery pack, to enable longer range than a battery electric vehicle.
- -
BEV (battery electric vehicle): lacks an ICE. Powered by energy stored in the battery, recharged from the electricity grid, to provide propulsion via electric motor.
- -
FCEV (fuel cell electric vehicle): the fuel (typically hydrogen) is processed on board in a stack of fuel cells to generate electricity for powering an electric motor.
Future fuel and powertrain options have been deeply investigated by the EUCAR/JRC/CONCAWE wells-to-wheel study [
4]. Current BEVs have some serious limitations, such as the high cost of the batteries, limited driving range, and a high recharge time. To make battery electric vehicles fit for the mass market, the energy density and efficiency of battery packs must be increased. Along with research on advanced electrochemistry, the integration of batteries’ primary cells into battery packs has a great role to play. Furthermore, the impact of recharging BEVs on the grid, and the lack of an adequate electrical infrastructure for charging purposes, are relevant problems to be faced [
5,
6,
7].
Because of their high-energy densities and long lifetimes, lithium-ion batteries are increasingly used not only in electrical vehicles, but also in many other applications addressing “smart grid” applications, such as energy storage systems for renewable-energy power plants.
1.1. Lithium-Ion Electrical Model
A key point in the management of lithium-ion batteries is expanding their energy storage capabilities and lifetimes. To achieve this, an accurate model of the battery is essential. An accurate estimation of the state of charge (SoC) and state of health of the battery pack is needed to allow a precise design of the control algorithms for energy storage systems.
One widely used electric model is based on the connection—in series—of a constant voltage generator and a resistor. The generator produces open circuit voltage, while the resistor accounts for internal resistance. In many models, one or more additional Resistor-Capacitor (RC) series are added in the circuit to track voltage transients during current steps [
8,
9,
10,
11,
12,
13,
14,
15,
16,
17]. In these models, the electrical parameters depend on the SoC and temperature of the battery. The models are a compromise between accuracy and simulation speed.
1.2. Parameter Extraction Procedure
An important aspect to address is the measurement procedure and algorithm used to capture battery cell performance characteristics, such as internal resistance, capacity, and time constants. Two main categories of measurements and related parameter extraction procedures are mainly used:
- -
The static capacity test measures battery cell capacity in ampere-hours at a constant current discharge rate.
- -
Hybrid pulse power characterization (HPPC) uses a sequence of pulses of charge and discharge to characterize battery voltage response at various states of charge and current rates.
Reference [
18] presents a summary of extraction procedure methodologies: HPPC [
9,
12,
13], the discharge test, ampere-hour integration, open circuit voltage, SoC estimation, neural network, fuzzy logic, and the Kalman filter.
1.3. Thermal Model
Lithium-ion battery performance characteristics are sensitive to cell operating temperature. Recoverable power is significantly reduced at operating temperatures above 50 °C, and capacity is reduced at temperatures below −10 °C. The SoC and internal resistivity of batteries depend on temperature. The modeling of the temperature dynamic is therefore essential in the analysis of battery performance. In recent papers, a thermal model has been added to the electrical model [
9,
14,
15,
18]. Reference [
19] presents a deep review of the major thermal issues for lithium-ion batteries and thermal models, the temperature dependence of their performances, and battery thermal management strategies. Specific attention is paid to the effects of temperature and thermal management on capacity/power fading, thermal runaway, and pack electrical imbalance, and to the performance of lithium-ion cells at cold temperatures.
1.4. Cell Variability
In many applications (e.g., in automotive applications), when the voltage or current to be supplied is high, the cells are connected in series–parallel combination. Due to variations in the production process, the cells differ from each other and do not reach full charge at the same time during charging. The variations of cell capacity, capacity fade rate, battery life, self-discharge rate, SoC, internal resistance, and thermal parameters can be very high and affect battery performance [
18]. Furthermore, non-uniformity of the temperature of battery packs exacerbates non-uniformity between the cells in the battery pack. The battery management systems (BMS) takes care of cell balancing, along with other issues. The easiest physical equalization method is to achieve equalization through external circuits, with the aim of dissipating the capacity of the single cells that need to be equalized through resistances. Moreover, thermal management strategies may be useful in uniformly cooling the batteries and in managing the electrical balance among the cells.
1.5. BMS
Battery safety is extremely important. Notwithstanding the infamous case of the Samsung Galaxy Note 7, battery failure or explosion is improbable, due to the control of the BMS. The BMS protects a battery from damage and maintains it in safe and operational conditions. The BMS estimates the state of charge, the state of health, and the remaining useful life of a battery. The battery’s lifetime and performance depends on its charging and discharging profile, thermal conditions, frequency of charging, deep discharge, and high pulse current.
A review of BMS is presented in Reference [
18], with a deep analysis of battery cell voltage measurement, battery states estimation, and battery equalization.
An accurate electrothermal model of a single battery cell and its characterization, and an accurate model of the statistical variability of single cells in a battery pack, are fundamental to defining an efficient BMS algorithm.
1.6. Simulation Environment
In the existing literature, several BMS simulation models have been presented [
8,
9,
10,
11,
12,
13,
20,
21,
22]. The simulation environments widely used for cell modeling are MATLAB and Simulink [
9,
10,
11,
12,
17].
In Reference [
14], the Symscape environment was used in addition to Simulink. These models and design environments used in the literature cannot be easily integrated with a system-level view of the BMS: for example, integration with an electric engine model, integration with the general control system of a vehicle such as a Controller Area Network (CAN bus), integration with a remote monitoring system for user or manufacturer to monitor battery status [
23], integration with a recharge station [
5,
7], or integration with a smart grid.
SystemC is a consolidated design language and environment based on C++ used for system-level description of electronic systems. SystemC is very well-suited to the design and refinement of Hardware/Software systems from system level down to register transfer-level. SystemC was used in the modeling of a BMS in References [
24,
25]. For a broad range of applications, the digital parts of an electronic system closely interact with the analog chemical and mechanical parts, and thus with the continuous-time environment. SystemC-WMS [
26,
27] has been used for applications of this type with digital and analog parts: for example, for a Bluetooth transceiver and solid state dimming [
28,
29].
The novelty of the proposed work includes defining a novel lumped-electrothermal circuit of a single battery cell, using diodes to model the different behaviors during charge and discharge; defining the extraction procedure for determining the parameters of the single cell from experiments; and defining a simulation environment in SystemC-WMS for the simulation of a battery pack.
The presented model and simulation environment has been tested for the characterization of 50 Ah lithium iron phosphate (LFP) cell. The SystemC-WMS environment allows a simple definition and simulation of a battery pack with many cells in series and in parallel, while considering random variations of the nominal capacity, SoC, and parameters of the single cells. The simulation environment can be used for the statistical simulation of a battery pack and for analyzing the effect of different BMS strategies for cell balancing on a battery pack, while considering the statistical variations of the cells.
The paper is organized as follows:
Section 2 presents the electrothermal model used, and
Section 3 the SystemC-WMS environment used to simulate it.
Section 4 reports the definition of the extraction procedure based on the HPPC. Measurements were carried out on a lithium-ion cell with 50 Ah nominal capacity and were used for the characterization shown in
Section 5. The cell characterization and simulation environment allows for simulation of a 48-cell battery pack (a series of eight modules of six cells in parallel). Results and comments are reported in
Section 6, and conclusions are carried out in
Section 7.
2. Electrothermal Cell Model
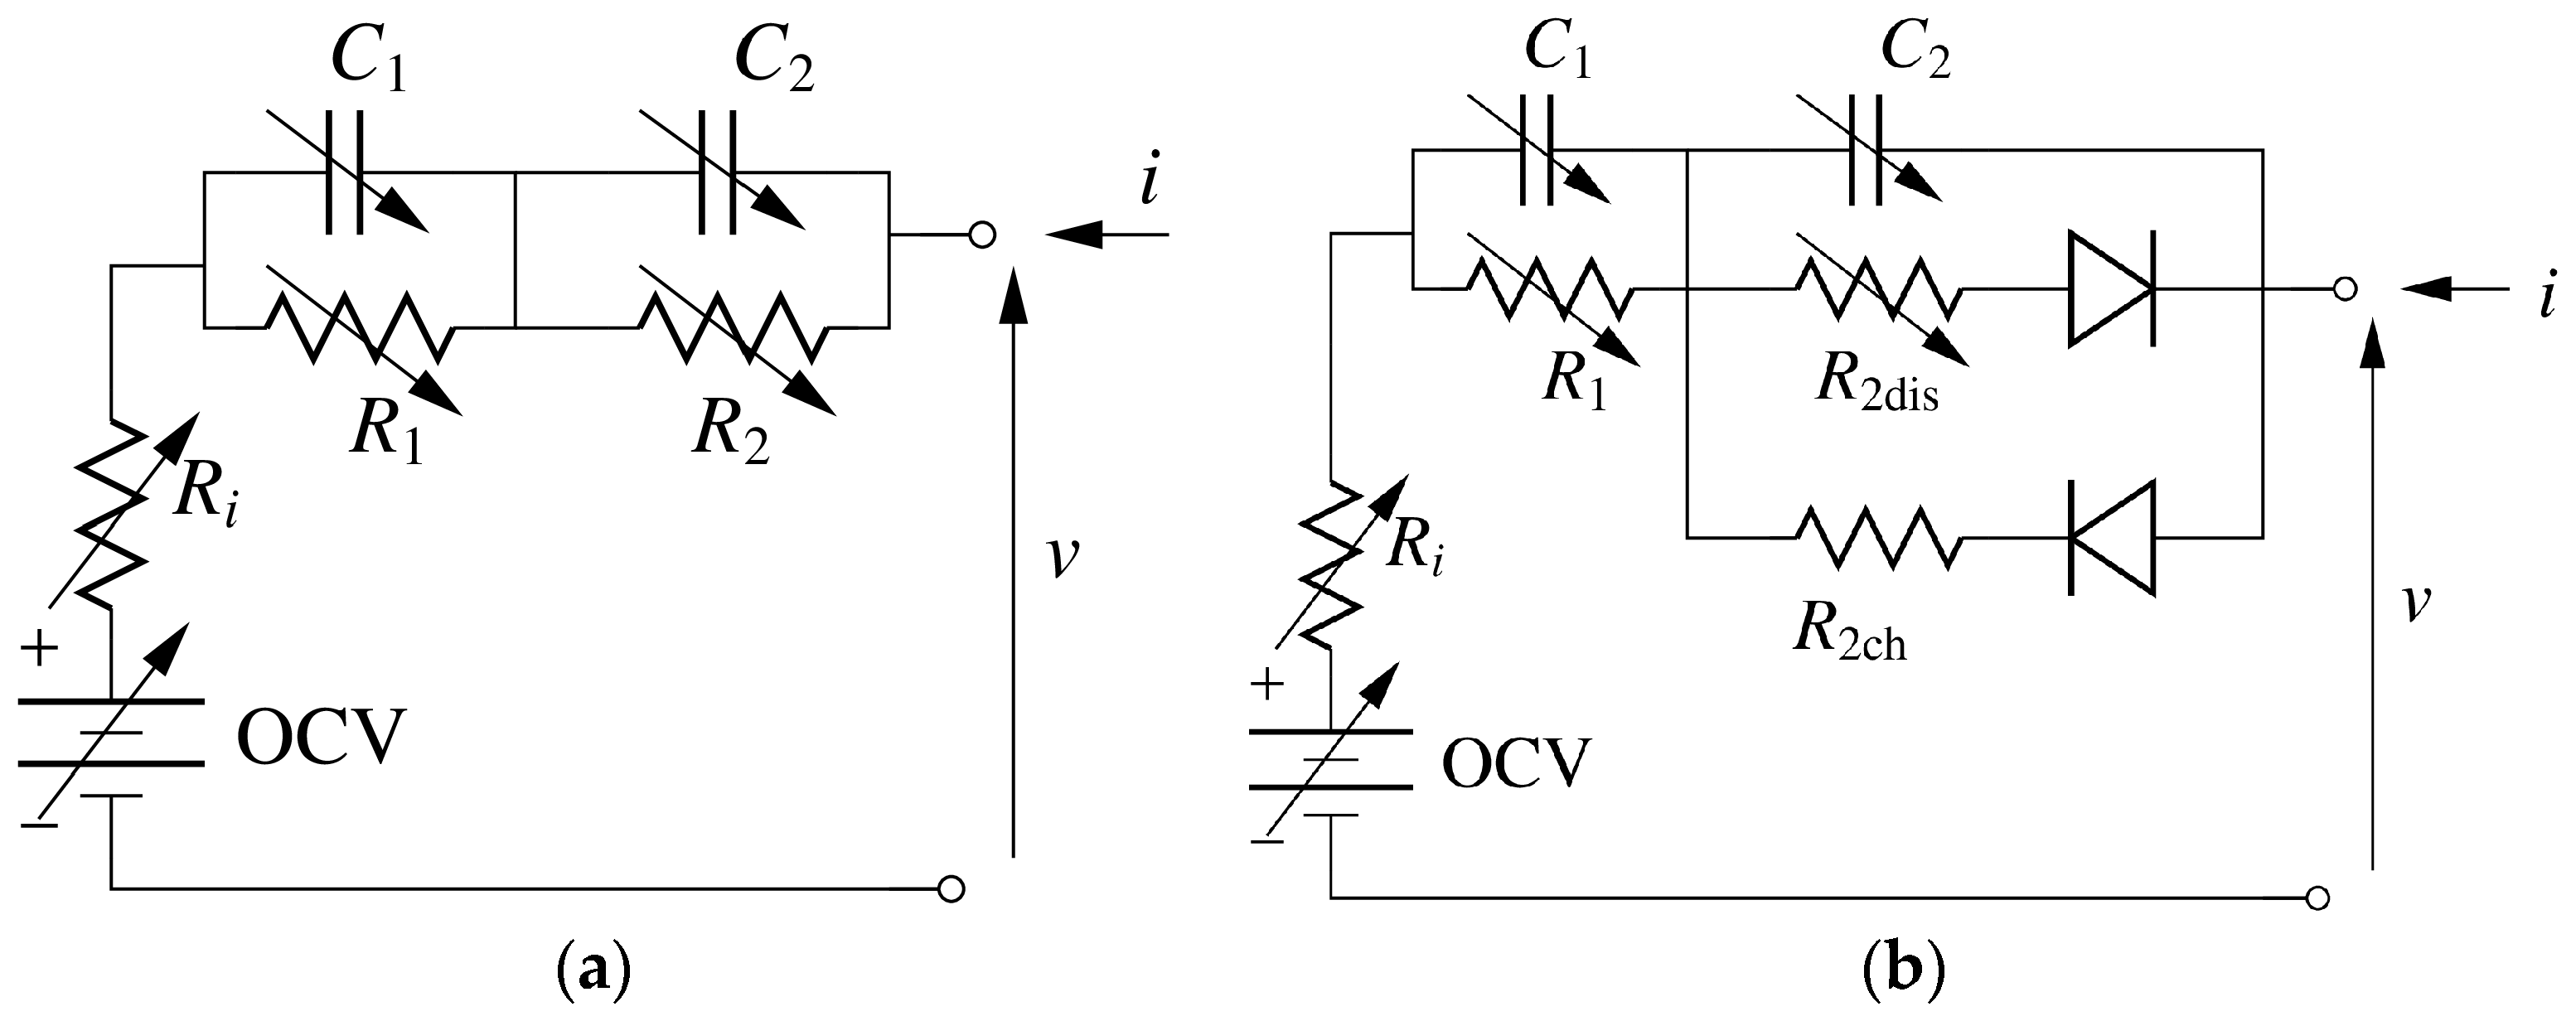
The typical electrical equivalent model consists of a voltage source in series with a resistance and a number (usually from 0 to 3) of resistors and capacitors connected in parallel. This model has been widely used [
8,
9,
10,
11,
12,
13,
14,
15,
16,
17]. The electrical part of the proposed model of a single battery cell is based on the schematic reported in
Figure 1a.
This circuit can be described by the following relations:
where
and
are state variables,
and
are the port variables, and OCV is an ideal voltage generator representing the open circuit voltage of the cell.
The parameters of the model are: an internal resistance
, two resistances
and two capacitances
. The last four parameters characterize the transient response of the cell.
have a dependence on the temperature
T and on the SoC of the cell, as reported in References [
30,
31,
32,
33,
34]. Such a dependence has been modelled in a bidimensional piecewise linear fashion, where coefficients were obtained using the characterization procedure reported in the next section. The SoC is obtained by the following relationship:
where
is the nominal capacity of the cell and
is the cell’s initial state of charge.
Due to the non-symmetric behavior of the cell during charge and discharge, recorded during the experimental measurements, reported in
Section 5, and evidenced in References [
8,
10], the model of
Figure 1a has been lightly modified as shown in
Figure 1b, considering two different values of
during the charge and discharge phases. The value of
.
is a constant, negligible with respect to
, so that the transient of
is much faster with respect to
.
In References [
8,
10], the different behaviors of the cell in charge and discharge mode were considered by polarization or hysteresis models applied to the OCV. The model proposed in this work and represented in
Figure 1b has the advantage of being much simpler.
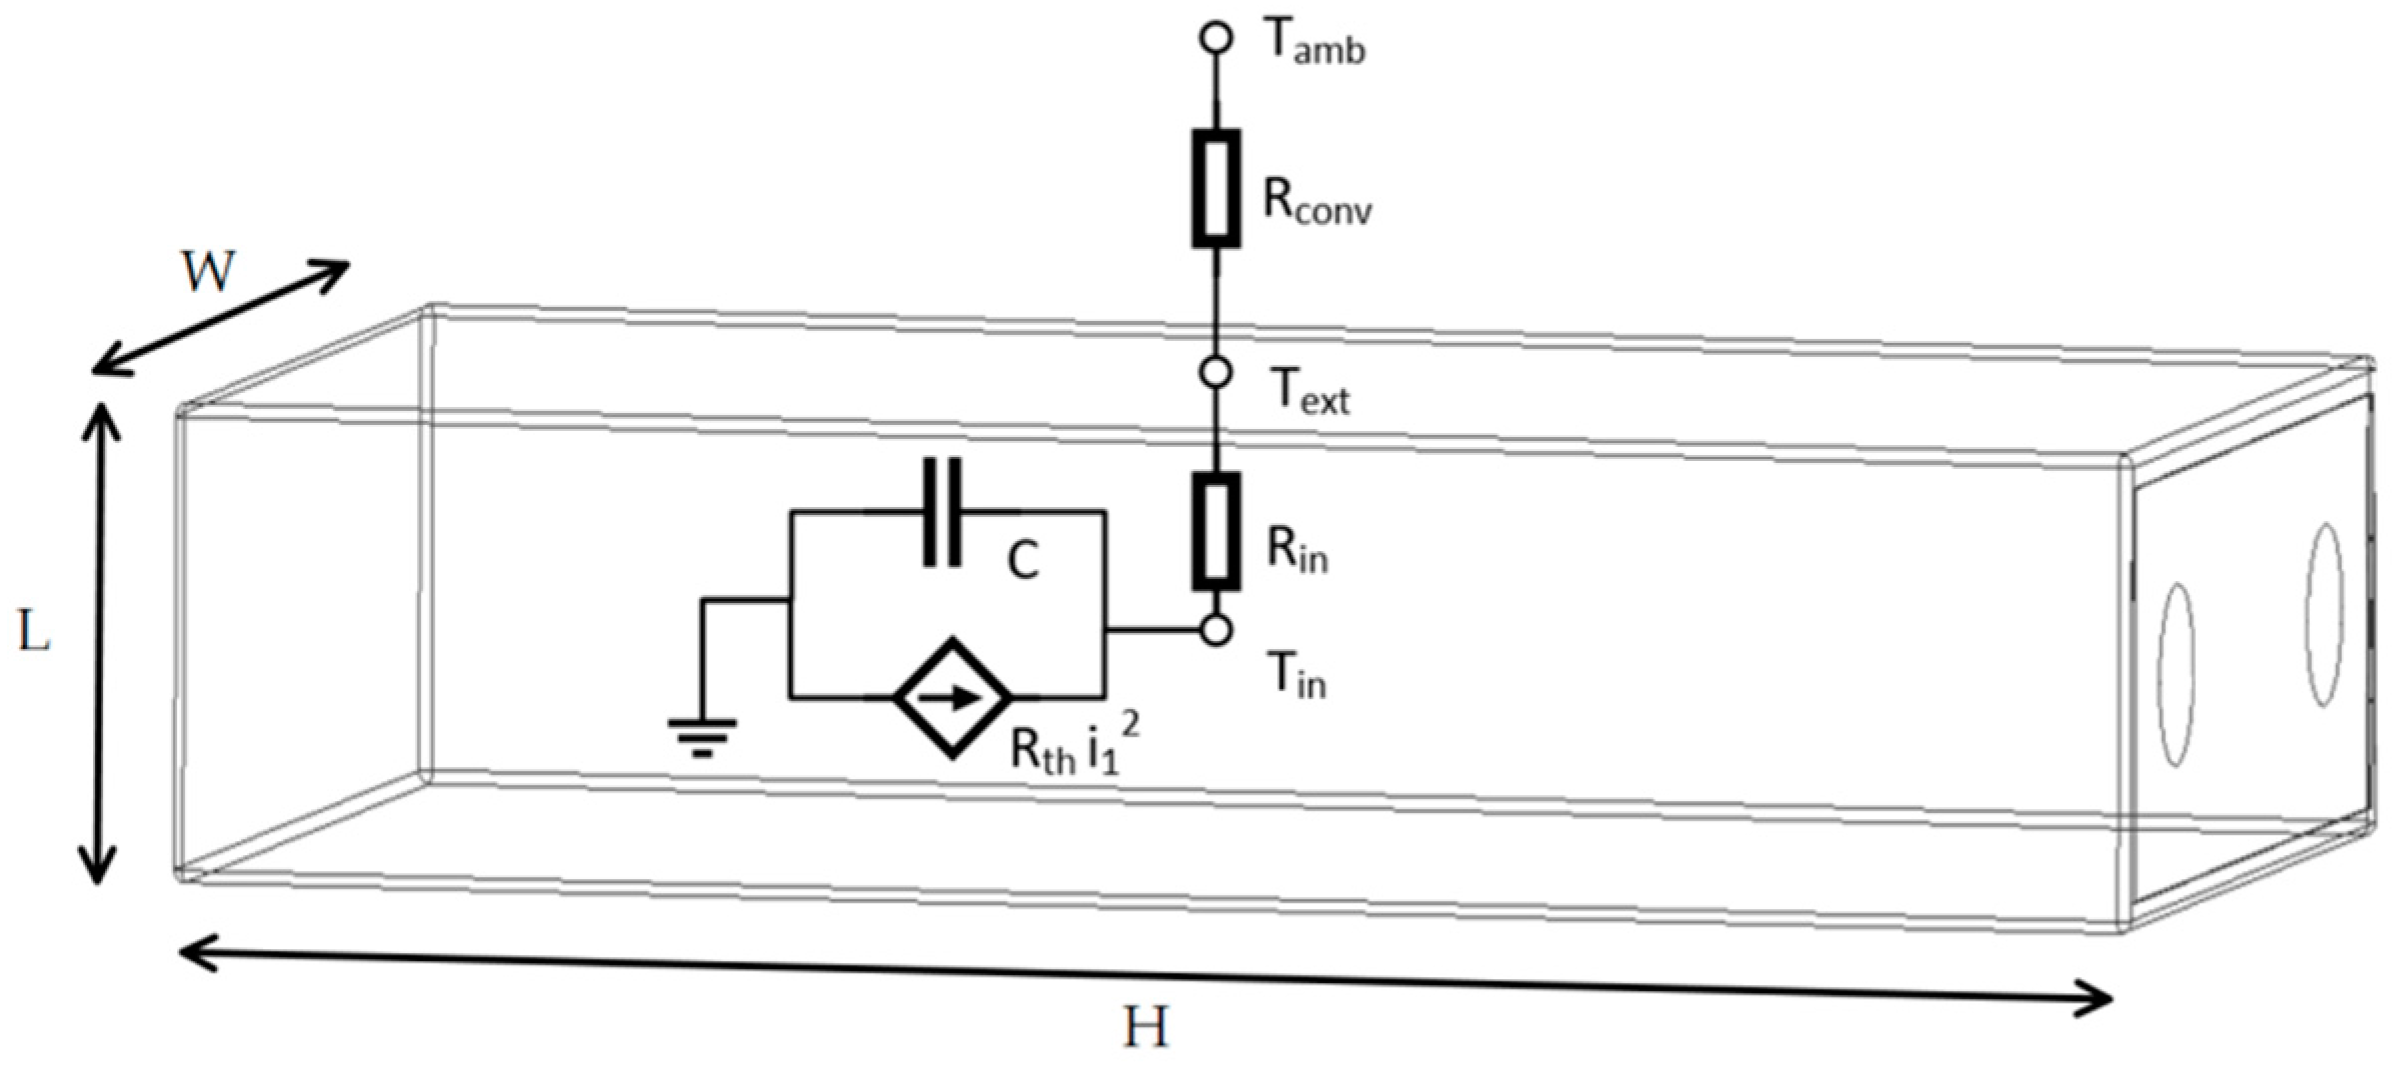
A lumped thermal model has been used to model the thermal behavior of the single cell. The thermal model of the battery is obtained by the energetic balance between the joule heating and the thermal conduction, as reported in the following equations:
where
is cell internal temperature,
is the temperature on the surface of the cell,
is the ambient temperature,
is the internal heat capacity,
is the internal thermal conductivity,
is the thermal conductivity,
is conductance length,
accounts for the convective heat transfer,
is the convective heat transfer coefficient,
is the convector area, and
is the internal generated heat flow rate.
Battery heat generation is dominated by the ohmic heat generated over battery internal resistances, since this term is proportional to the square of load current. Therefore, battery heat generation is modelled as , where is the sum of the internal resistances , , .
In this paper, we assume that the inner cell temperature is uniform and that heat generation is uniformly distributed within the cell. Heat conduction and convection are assumed to be the only forms of heat transfer between the internal cell and the ambient environment. For single-cell modeling, thermal resistance is negligible with respect to and , and it is not reported in Equations (3) and (4), where the heat flow transferred by conduction effect equals that absorbed by convection.
Thermal resistance of the case will be introduced in the battery pack simulations to model the heath exchange between neighboring cells; therefore, Equation (4) will be modified accordingly.
Table 1 reports the values of the thermal coefficients and geometrical parameters used for the simulation of the single cell, as reported in
Section 5.
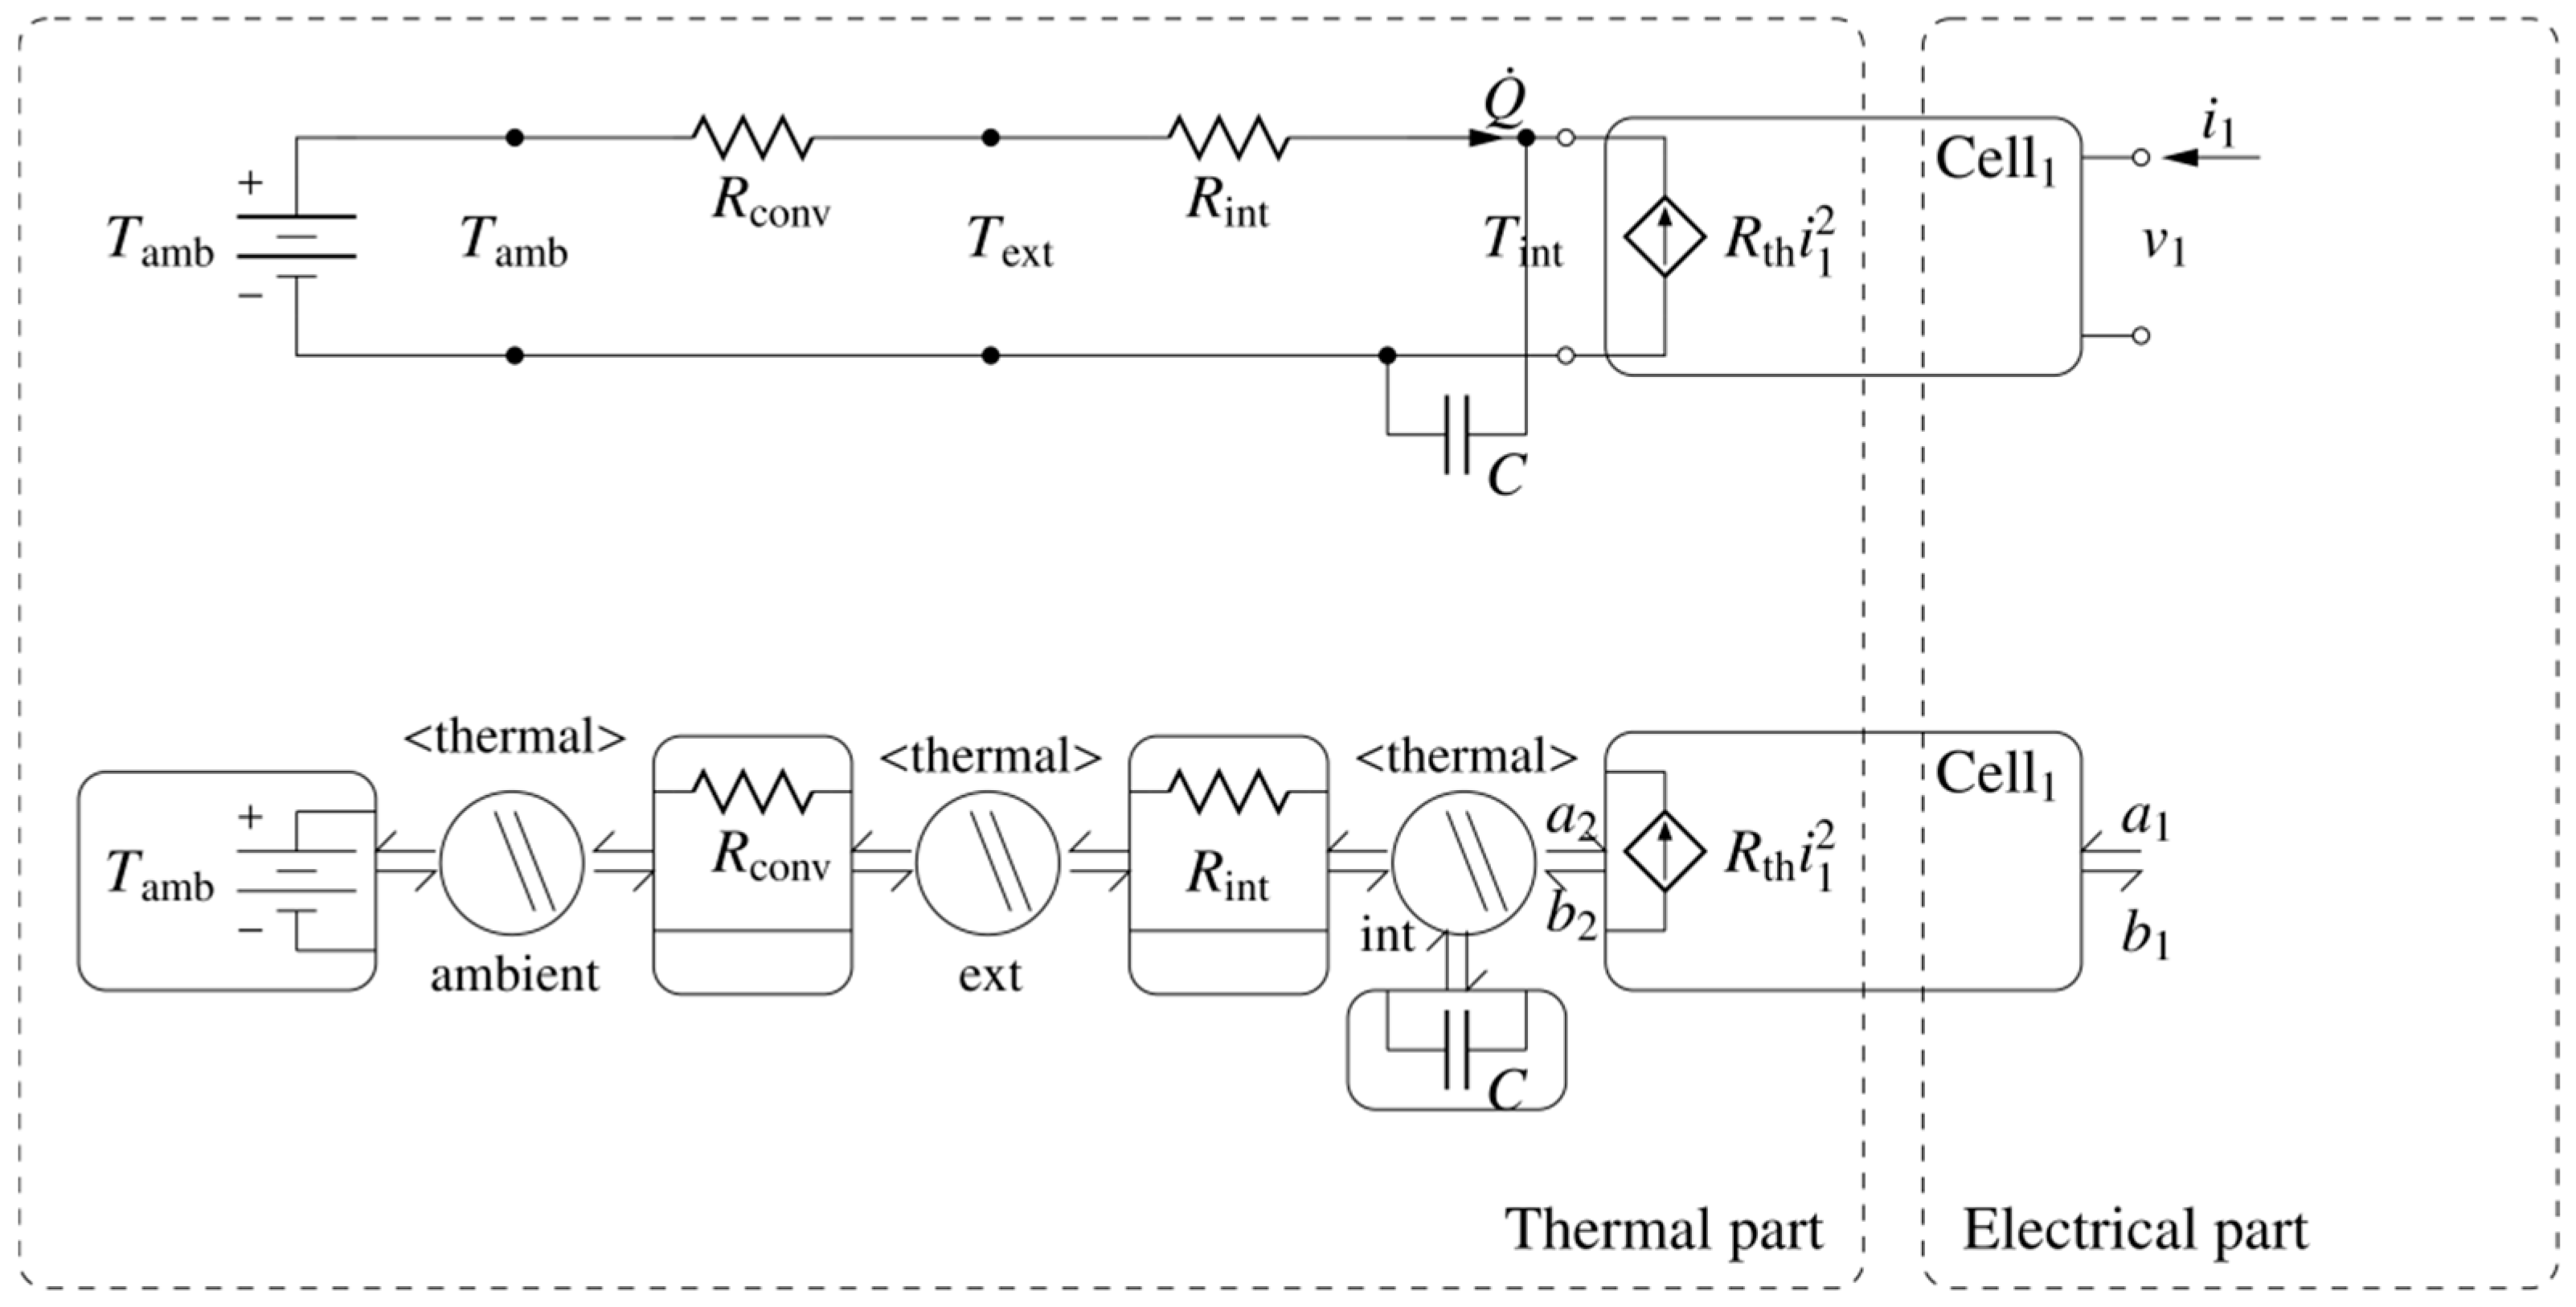
Figure 2 bounds the geometric representation of a cell with the electrothermal circuit that implements Equations (3) and (4), while
Figure 3 compares the same circuit with a schematic representation of this model in our simulation environment (the SystemC-WMS), described in the next section.
3. Simulation Environment
The simulation environment used to simulate the single cell, the battery pack consisting of many cells in series and parallel connection, and the digital battery management system is the SystemC-WMS [
26,
27]. SystemC-WMS is a C++ library allowing the extension of SystemC to heterogeneous analog blocks (electrical analog, mechanical, thermic). SystemC was developed to design, simulate, and debug a system-on-chip described at the system level. SystemC provides an event-driven simulation kernel that schedules the execution of the processes that implement the functionality of modules and channels.
Our methodology is based on the use of a standard analog interface for the connection of the modules based on wave exchange. To that end, the
parameters [
26,
27] are used as input/output quantities. Each analog module is described by a system of nonlinear ordinary differential equations (ODE) of the following type:
where
and
are vector expressions describing system dynamics, while
, and
are state, output, and input vectors, respectively. The use of the incident/reflected wave model simplifies the problem of accounting for the connection between modules, since it can be mandated that modules use incident waves as inputs and produce reflected waves as outputs. Parallel, series, or other types of connections can be accounted for by using an appropriate channel called the wave channel that dispatches waves to the modules it connects together and permits the formulation of a generic and standard analog interface usable across a variety of natures.
The description of the electrical part of the cell in Equation (1) can be rewritten in SystemC-WMS in terms of the
parameters by the following:
where
is the normalization resistance used in the conversion between voltage and currents and incident and reflected waves.
In
Figure 3, the boxes represent modules described in terms of the
parameters, while the circles represent the wave channels. Modules can describe a system in electrical, thermal, mechanical, acoustical, hydraulic, rotational, and three-phase domains (also called natures) using a nonlinear ODE like Equation (5). The wave channels are implemented as a simple scattering matrix operating among the
parameters of the connected modules.
A basic library of modules is provided for each nature. With a simple C++ template, the wave channels can be made to belong to any nature.
SystemC-WMS is a free SystemC library that can be downloaded from Reference [
37]. The advantage of the use of SystemC-WMS is the ability it provides to easily integrate the single cell model into a complex framework including, for example, the battery management system, the CAN bus [
24,
25], and the mechanical model of the electrical engine driven by the battery.
4. Parameter Extraction Procedure
Different parameter estimation methodologies exist for estimating the parameters of lumped electrical models. The most common is called the hybrid pulse power characterization procedure [
9,
12,
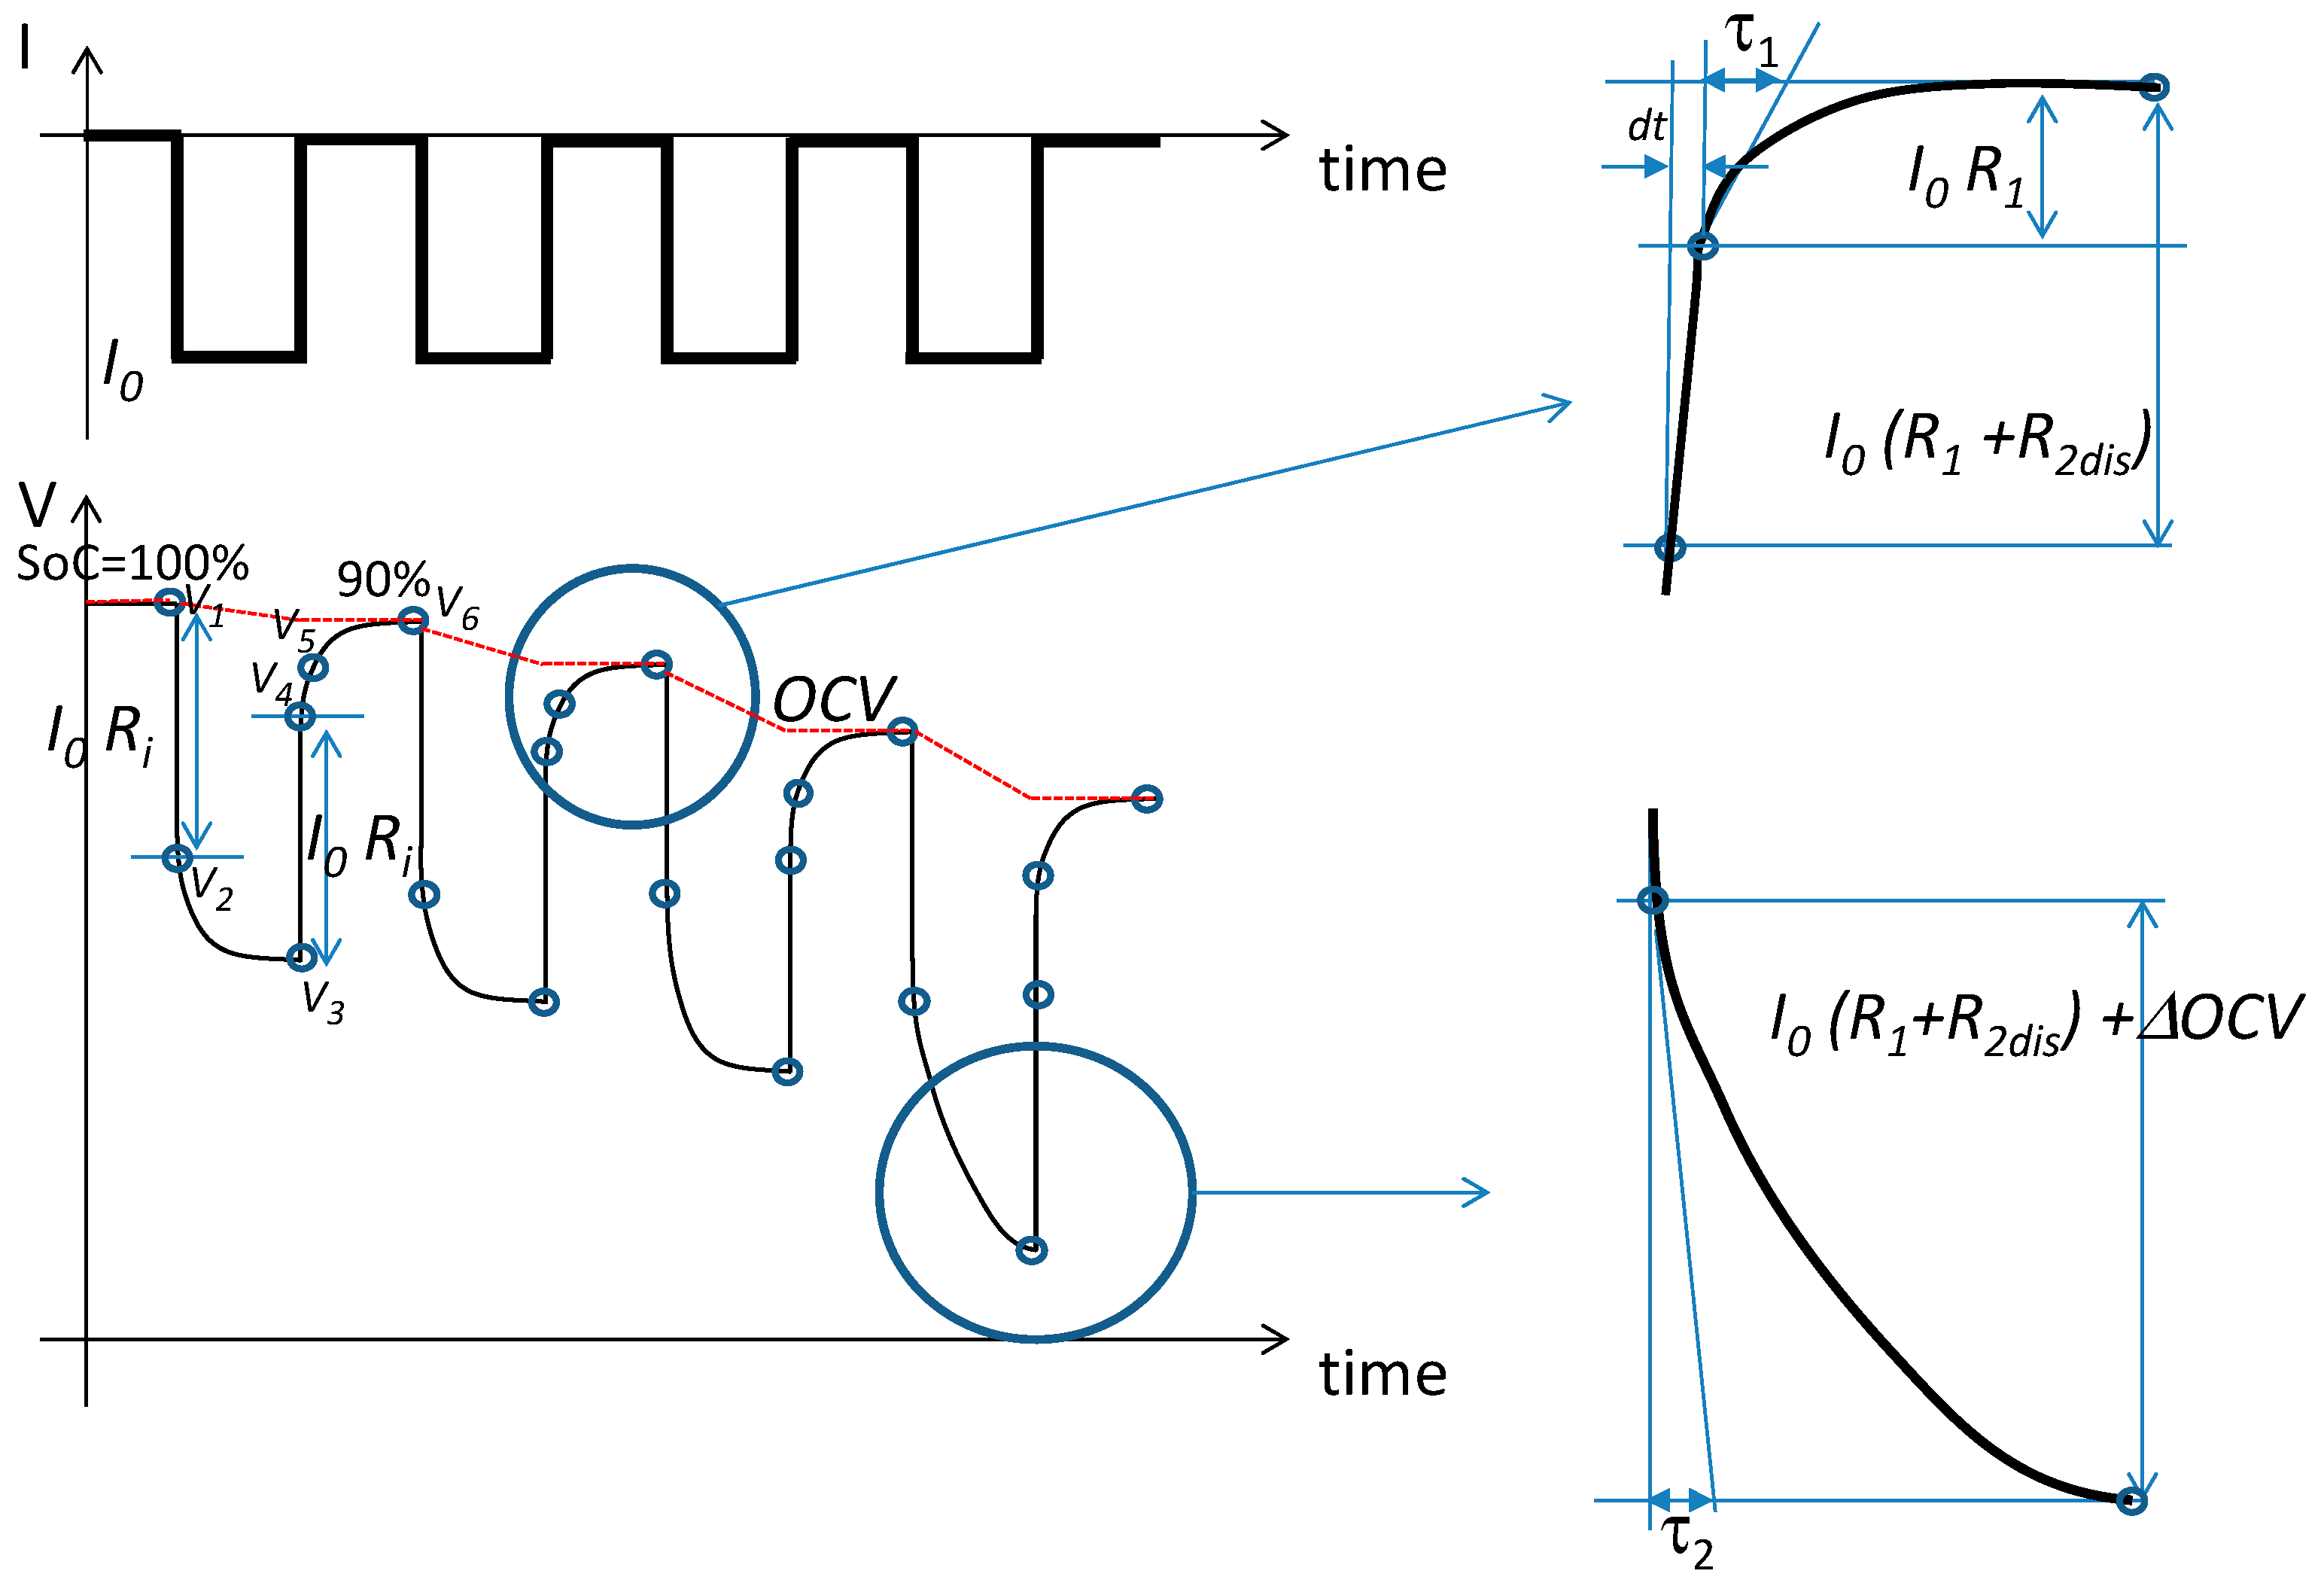
13]. The cell battery is forced by a sequence of charge and discharge pulses. The algorithm used for the extraction of the parameters of the model as a function of SoC and temperature is based on the HPPC procedure. Starting with a fully charged battery (SoC = 100%), a constant current is taken from the cell for the time required to achieve a 10% reduction in the SoC. Then, the current is set to zero until a steady state is reached. The procedure is repeated until the SoC reaches 10% of the nominal values. Then, the battery is fully charged with a constant current. The shape of the input current is shown at the top of
Figure 4; below, typical cell voltage behavior is shown. Details of the charge and discharge phases are reported on the right-hand-side of
Figure 4.
Let us consider the steady state values of the voltage of the battery cell as reported in
Figure 4:
,
, and
.
and
are the values of the voltage one sample after the falling and rising steps of the input current.
is the value of the output voltage a short time, d
t, after the rising step.
As a first step, the OCV is obtained using the steady state values in the rest period. We therefore obtain the values of OCV for SoC = 100%, 90%, 80%, …, 10%:
A step in the input current causes an instantaneous voltage drop over
. Therefore,
is estimated by the following equations:
Similarly, the values
for SoC = 90%, 80%, …, 10% are obtained. The values of
cannot be easily obtained. Assuming that the time constant
is less than
, the first short transient is due to the discharge of
, and the remaining is due to the discharge of
. Therefore, considering that the second part of the transient is due to
, we use the following equations to estimate
and
:
Similarly, the values of
and
are estimated by the first part of the transient during discharge as:
where
The estimation of the parameters described by Equations (7)–(16) and reported in
Figure 4 is carried out, keeping the temperature constant at 0 °C, 25 °C, and 40 °C during the experiments.
In this way, we obtain the values of the parameters for different values of temperature and SoC. As a successive step, a bidimensional piecewise linear model is derived starting from these values, minimizing error between the model and the experimental measurements.
5. Results: Single Cell Characterization
The parameter extraction procedure described above was applied to model an LFP cell used by the MIDAC company with a nominal capacity of 50 Ah, nominal voltage of 3.2 V, dimensions of 37 × 101 × 192 , a discharge voltage limit of 2.5 V, and a charge voltage limit of 3.8 V.
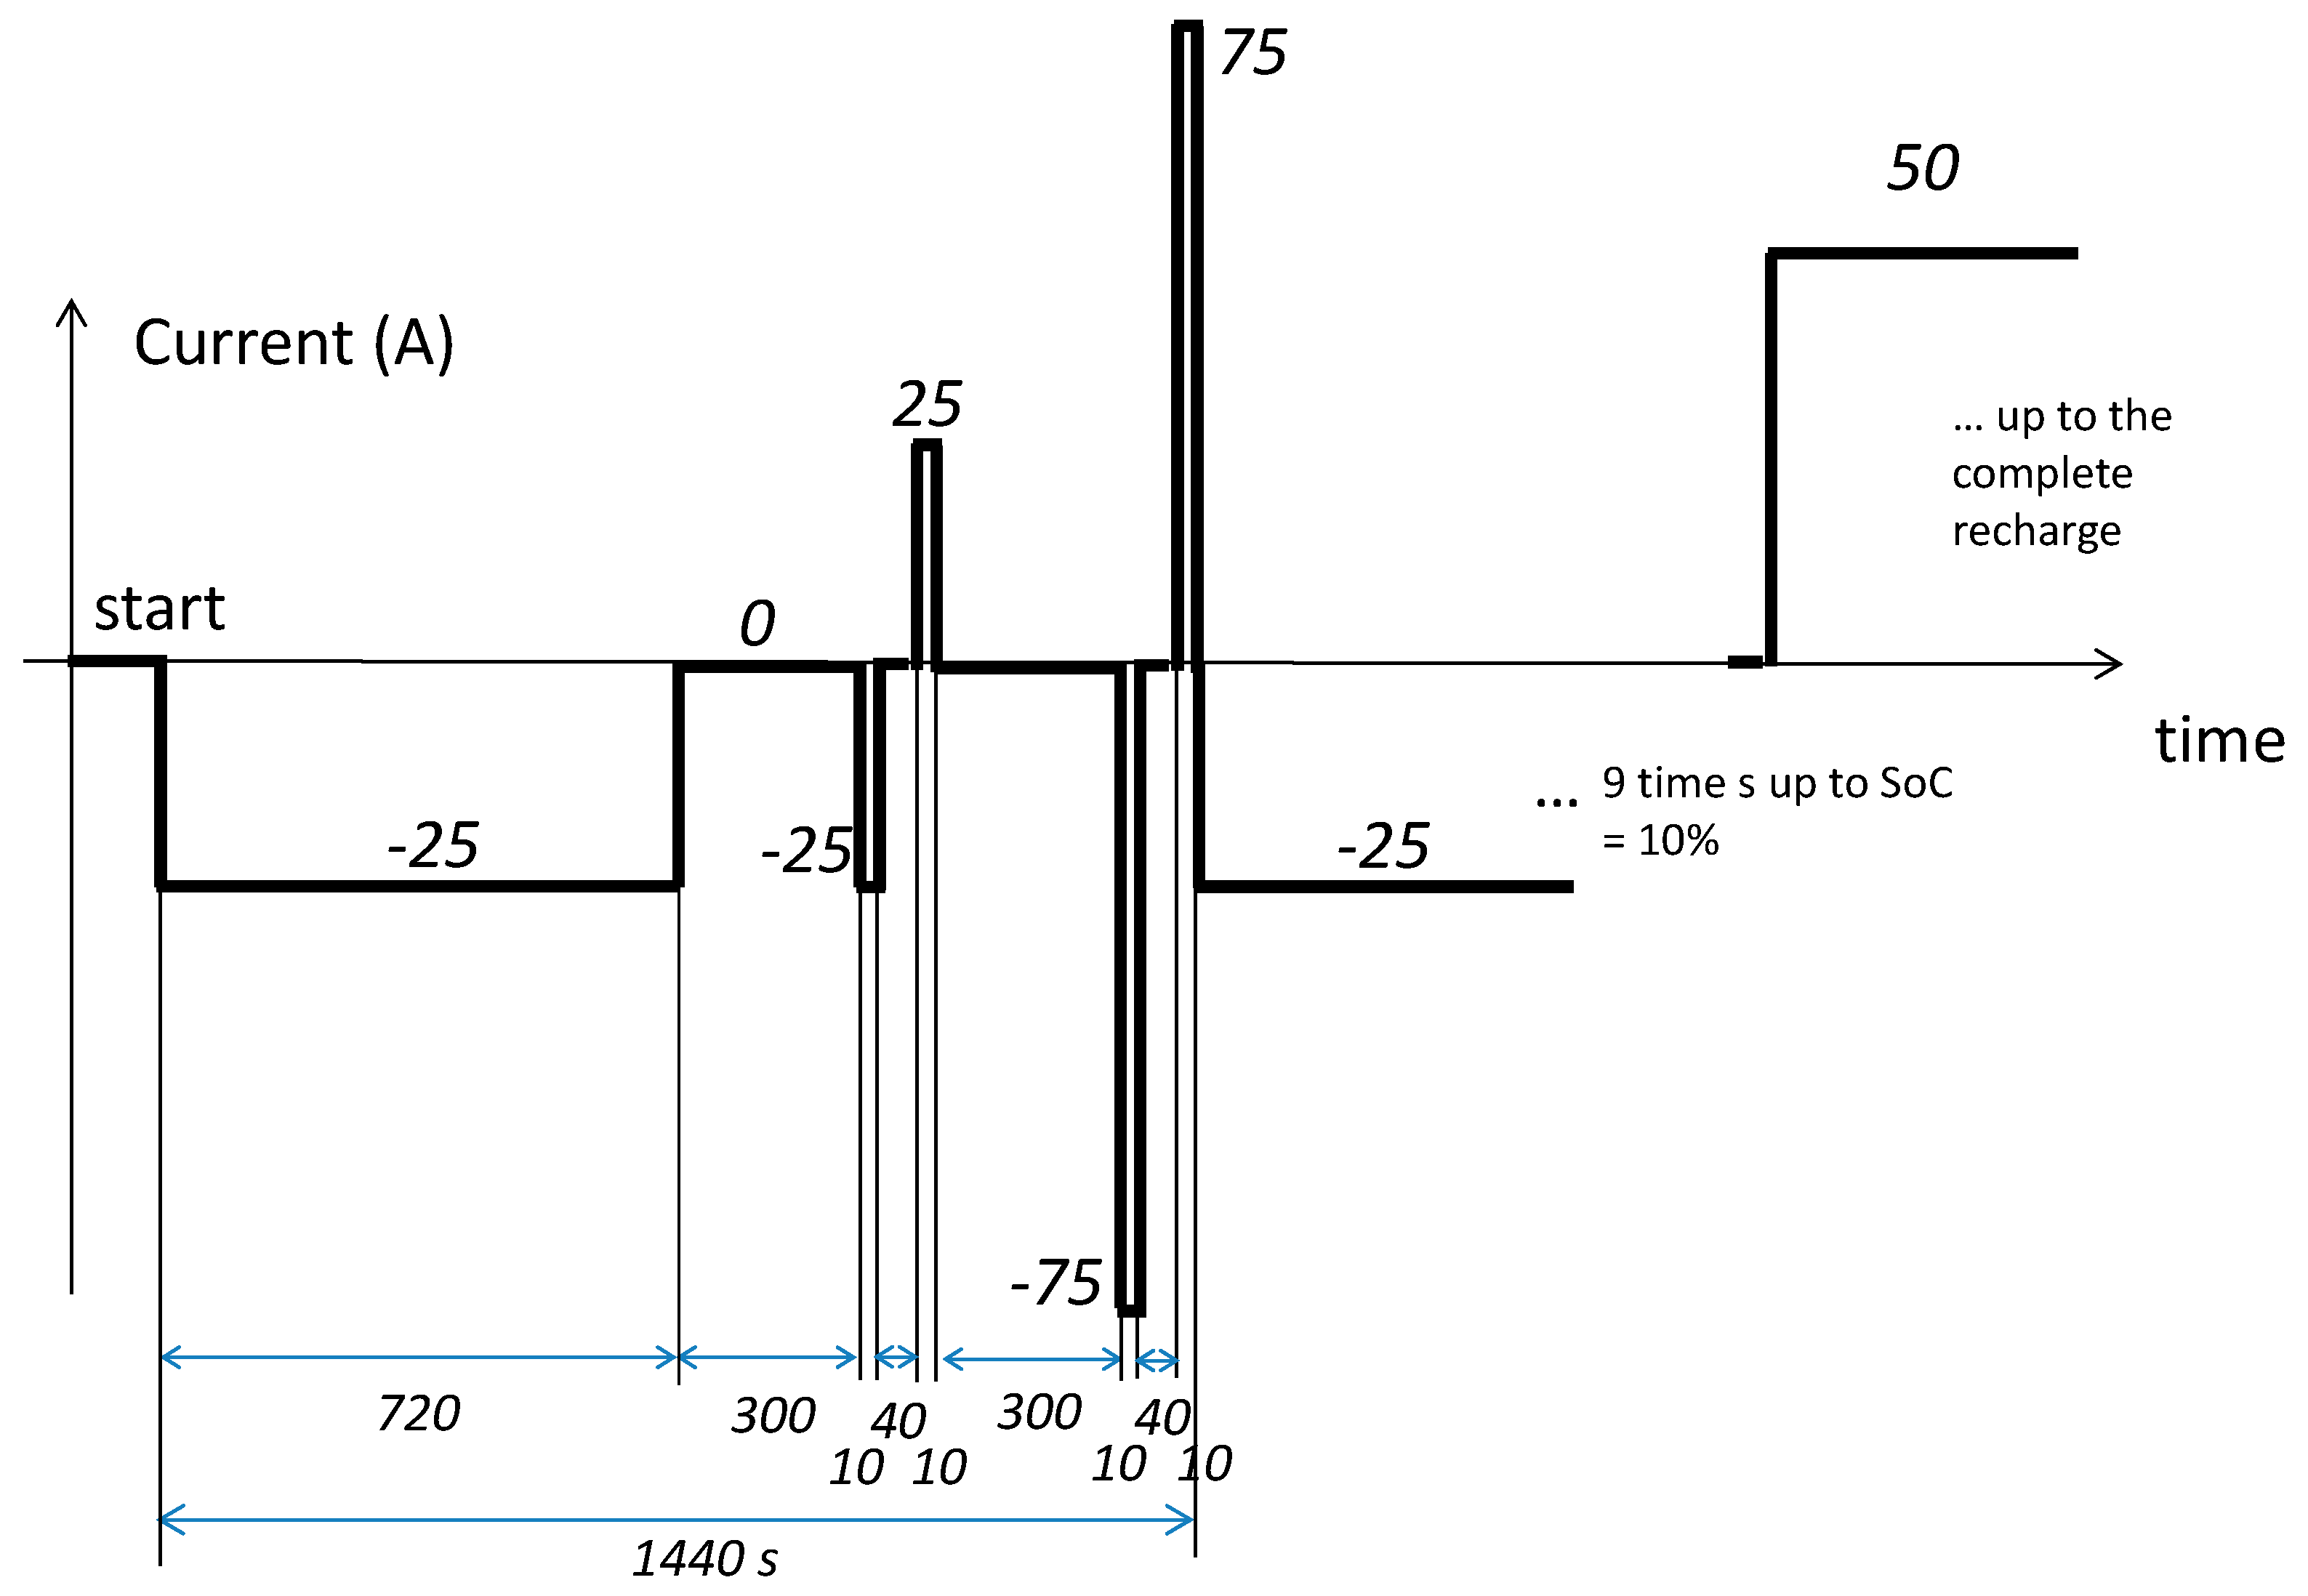
The test current profile—lightly modified with respect to the classic HPPC—is reported in
Figure 5. A constant current of 25 A was taken from the battery for 720 s, corresponding to a charge of 25 A× 720 s × 1 h / 3600 s = 5 Ah; that is, 10% of the nominal capacity of the cell. Two consecutive discharge and charge current pulses of 25 A were applied after a rest period of 300 s. After another rest period of 300 s, two further consecutive discharge and charge current pulses of 75 A were applied. The pulses were used to verify the independence of
with the value of the current applied. They do not modify the SoC. The cycle was repeated nine times, so that the SoC reached 10% of its nominal capacity. Finally, a 50 A constant current was applied up to the complete recharge of the battery.
The temperature of the cell was forced to maintain constant in a climatic chamber. Measurements were carried out at 0 °C, 25 °C, and 40 °C.
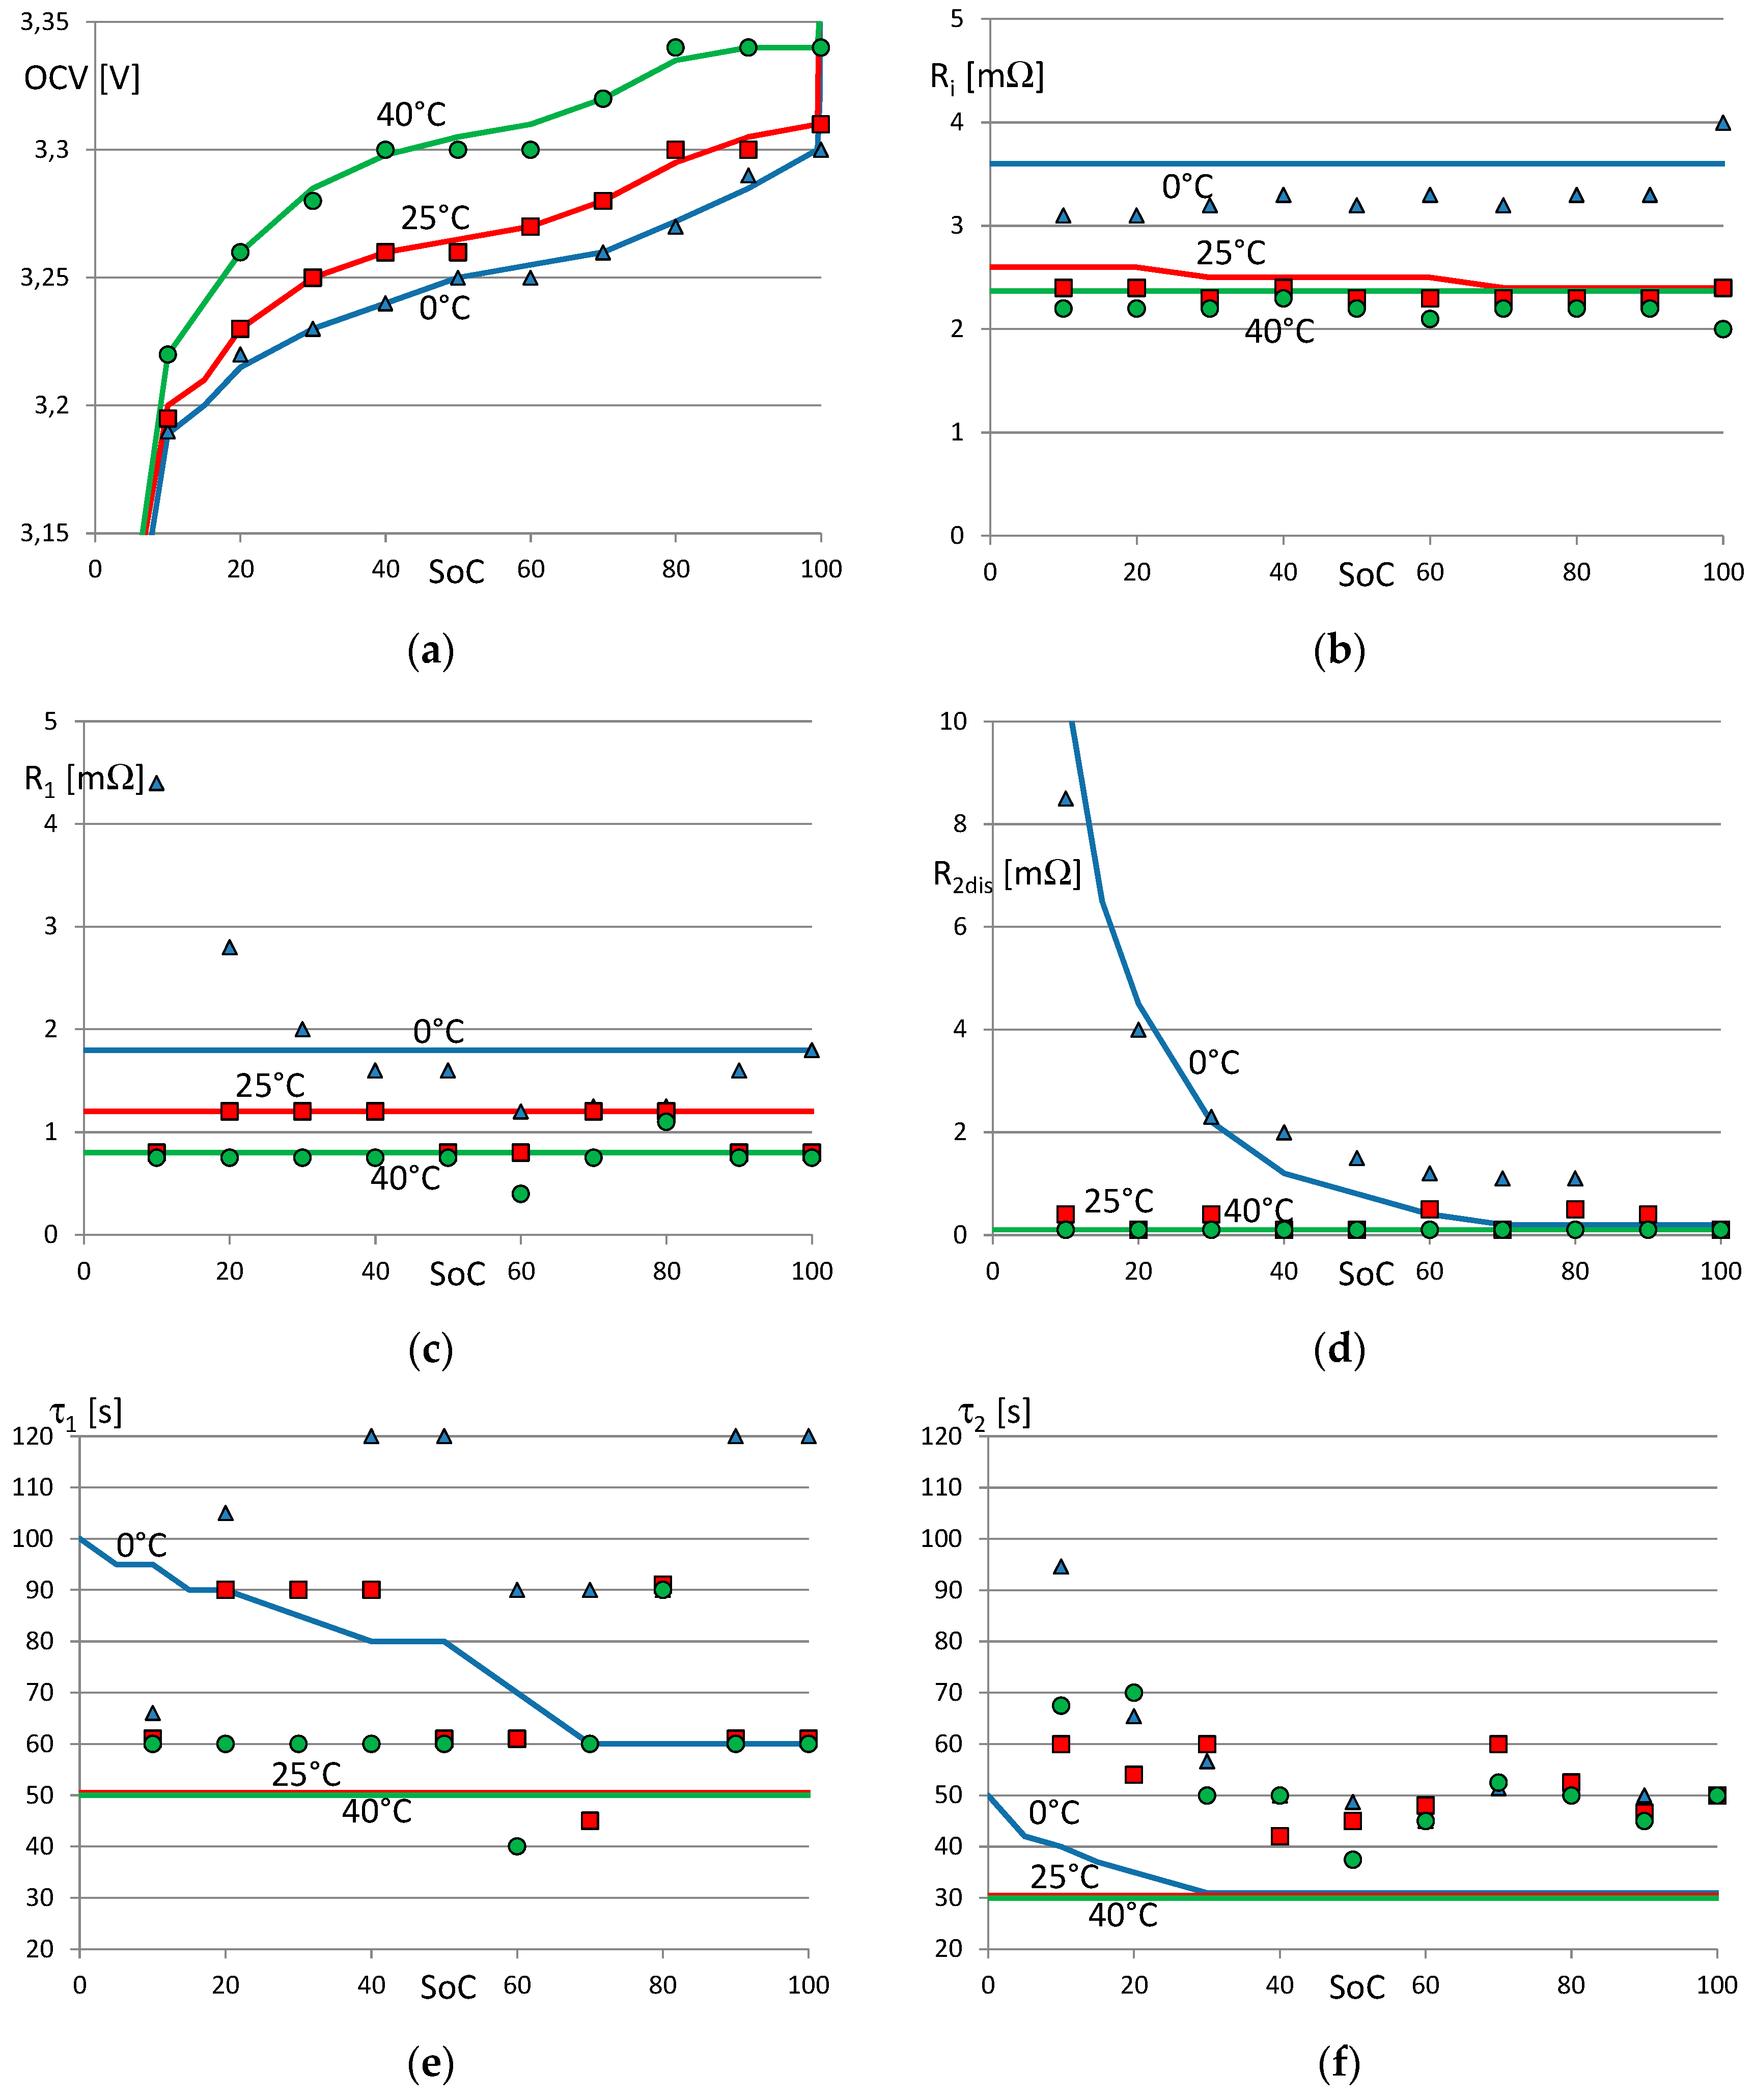
Figure 6a–f show the values of the parameters
obtained by the extraction procedure (represented by dots), and the bidimensional (SoC and temperature) piecewise linear model (represented by continuous lines) after the optimization. The OCV (see
Figure 6a) has a typical nonlinear shape: it increases rapidly when the SoC is close to 100% and decreases when the SoC is low. The OCV increases slightly with the temperature. The shape of the piecewise linear optimized model is more regular and smooth with respect to the data derived by the extraction procedure. The internal resistances
,
, and
increase with the temperature, as has been shown in other works [
14,
38]. The increment of the resistances in conjunction with the reduction of OCV causes the well-known effect of reduced battery efficiency at low temperature.
is negligible at 25 °C and 40 °C, as shown in
Figure 6d. Conversely, its value increases during discharge at 0 °C when the SoC is low.
The value of
is low during the final charging phase. For this reason, we used the model in
Figure 1b with the diodes instead of the model in
Figure 1a. This effect has been modeled in References [
8,
10,
39] with hysteresis in the OCV.
Figure 6c shows that the extraction procedure (dots) evidenced an increment of
at 0 °C when the SoC is low, like
. In the final optimized piecewise linear model, this effect is attributed only to
.
Figure 6e,f show that the time constants
and
vary irregularly as a function of temperature and SoC when estimated by the extraction procedure (dots). The extraction procedure is not able to discriminate easily between the two contributions of
and
. The successive optimization procedure results in more regular and smooth functions of temperature and SoC.
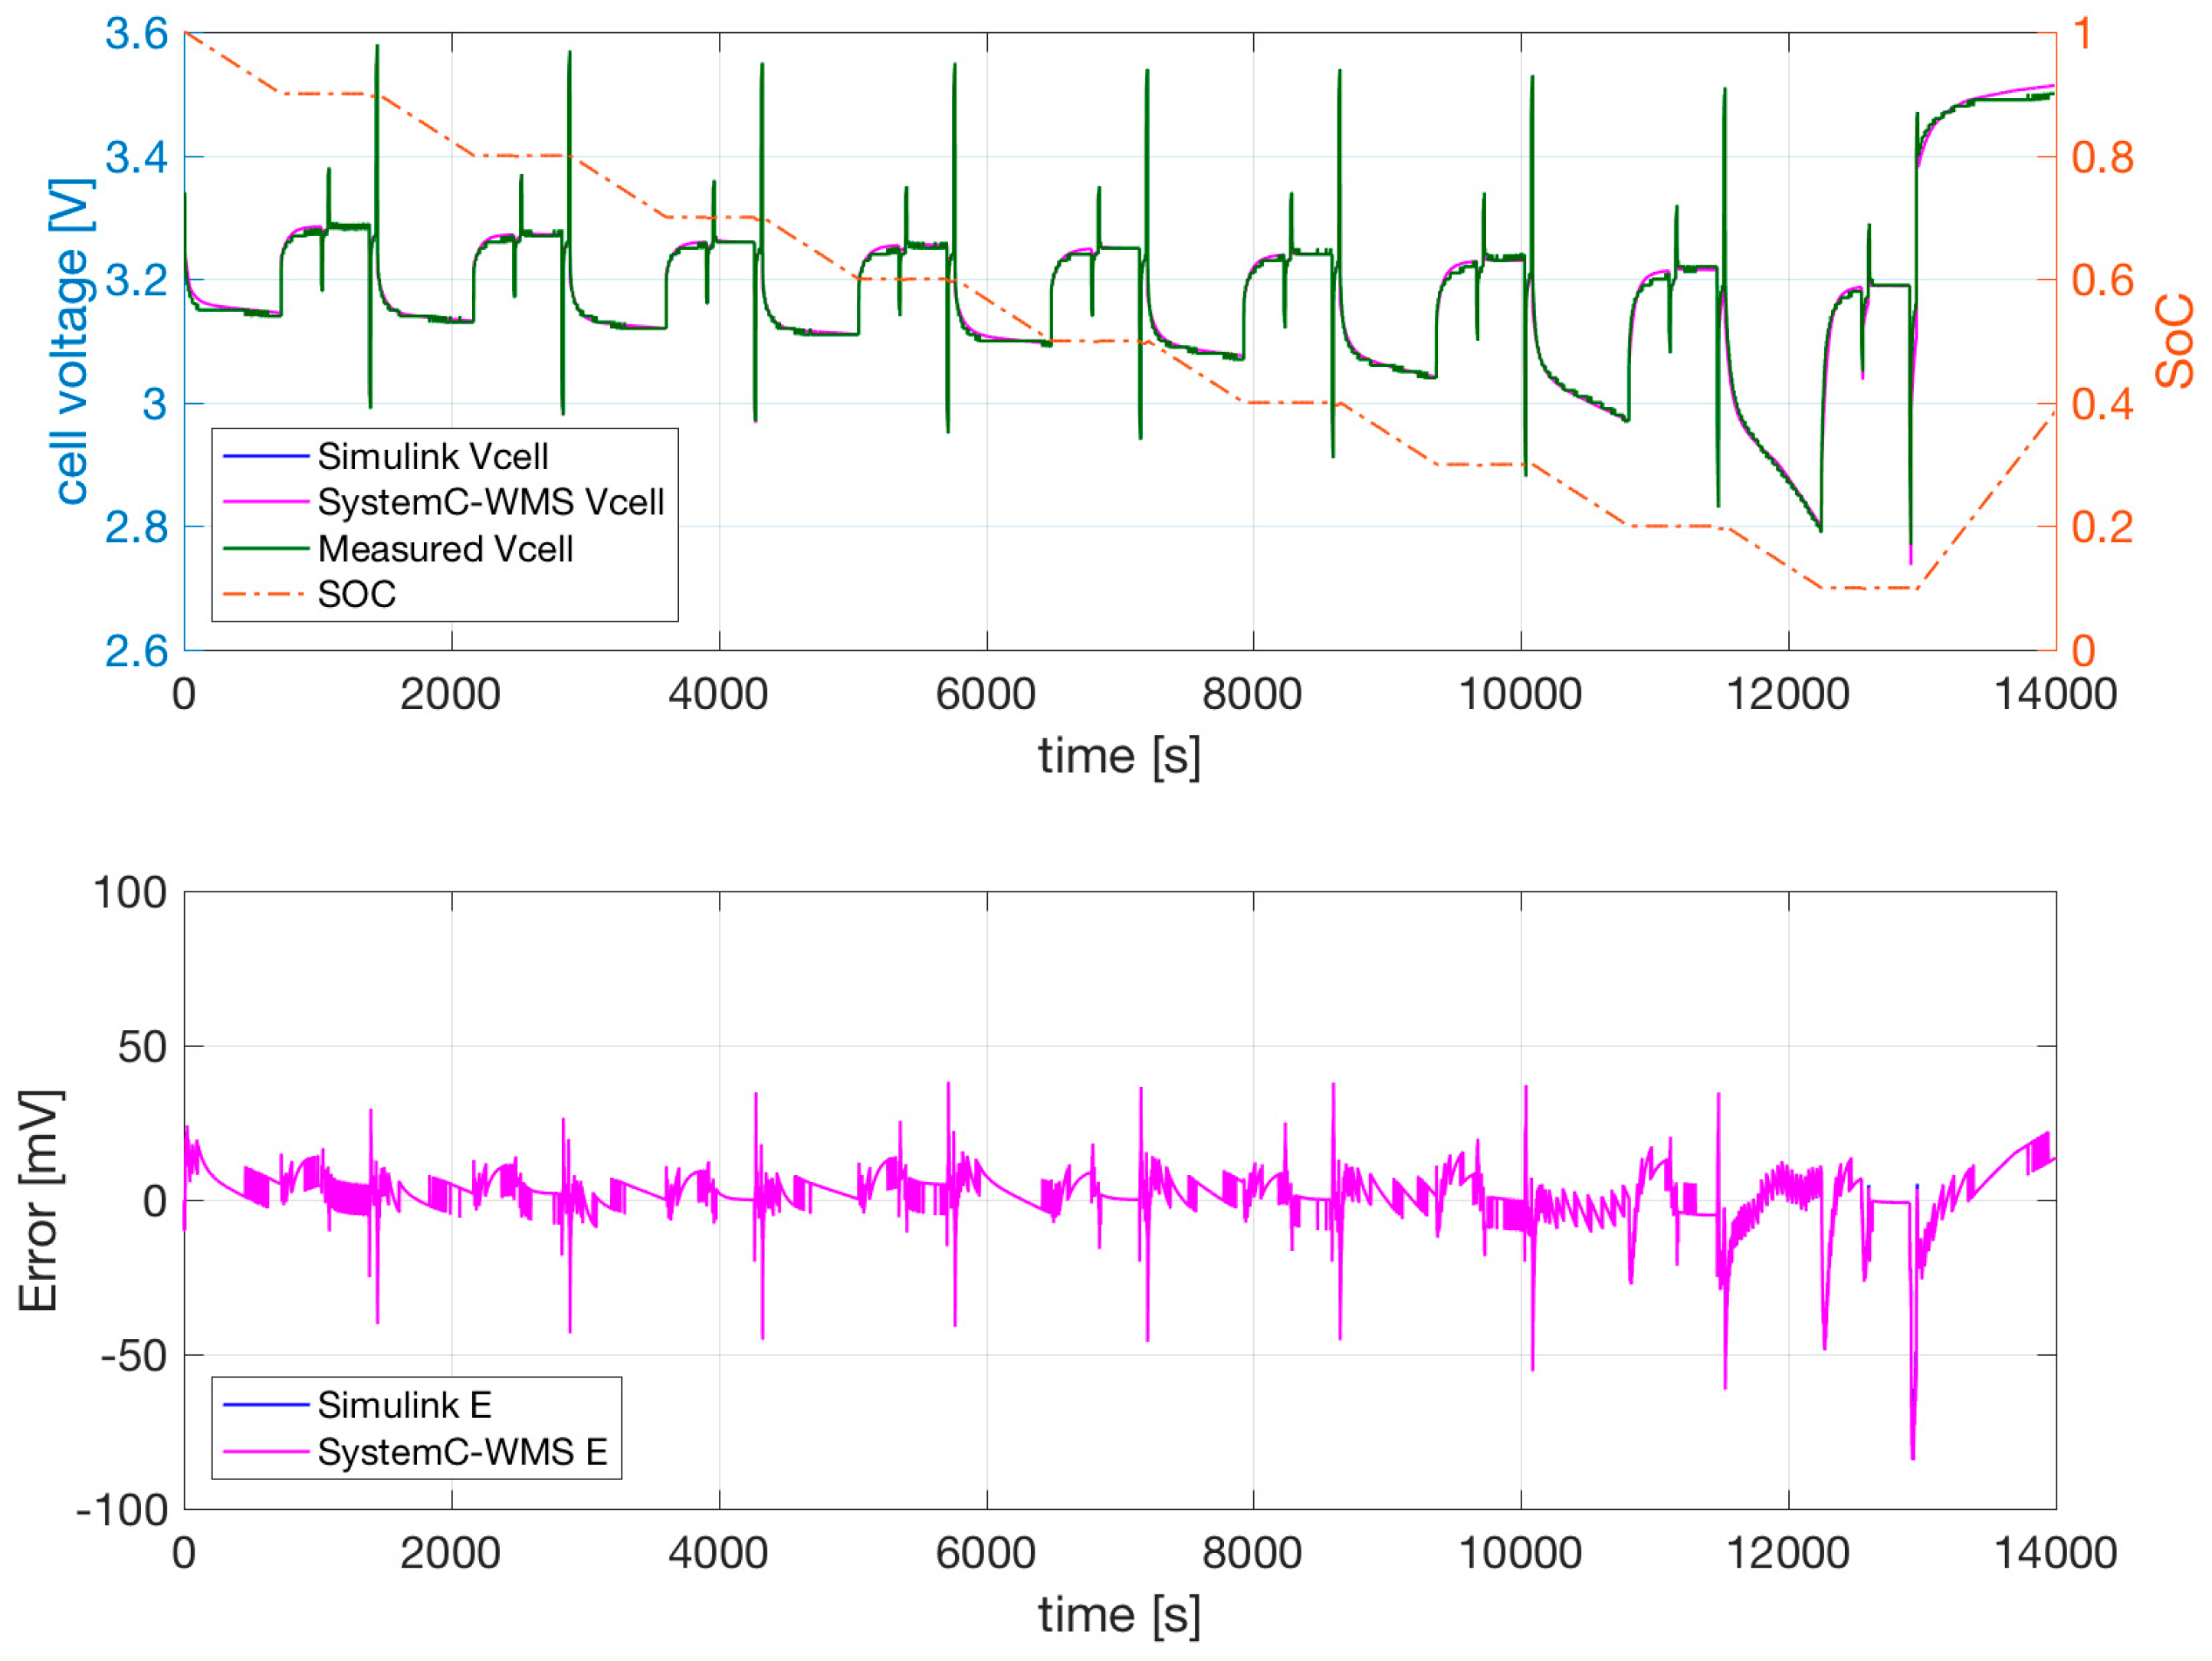
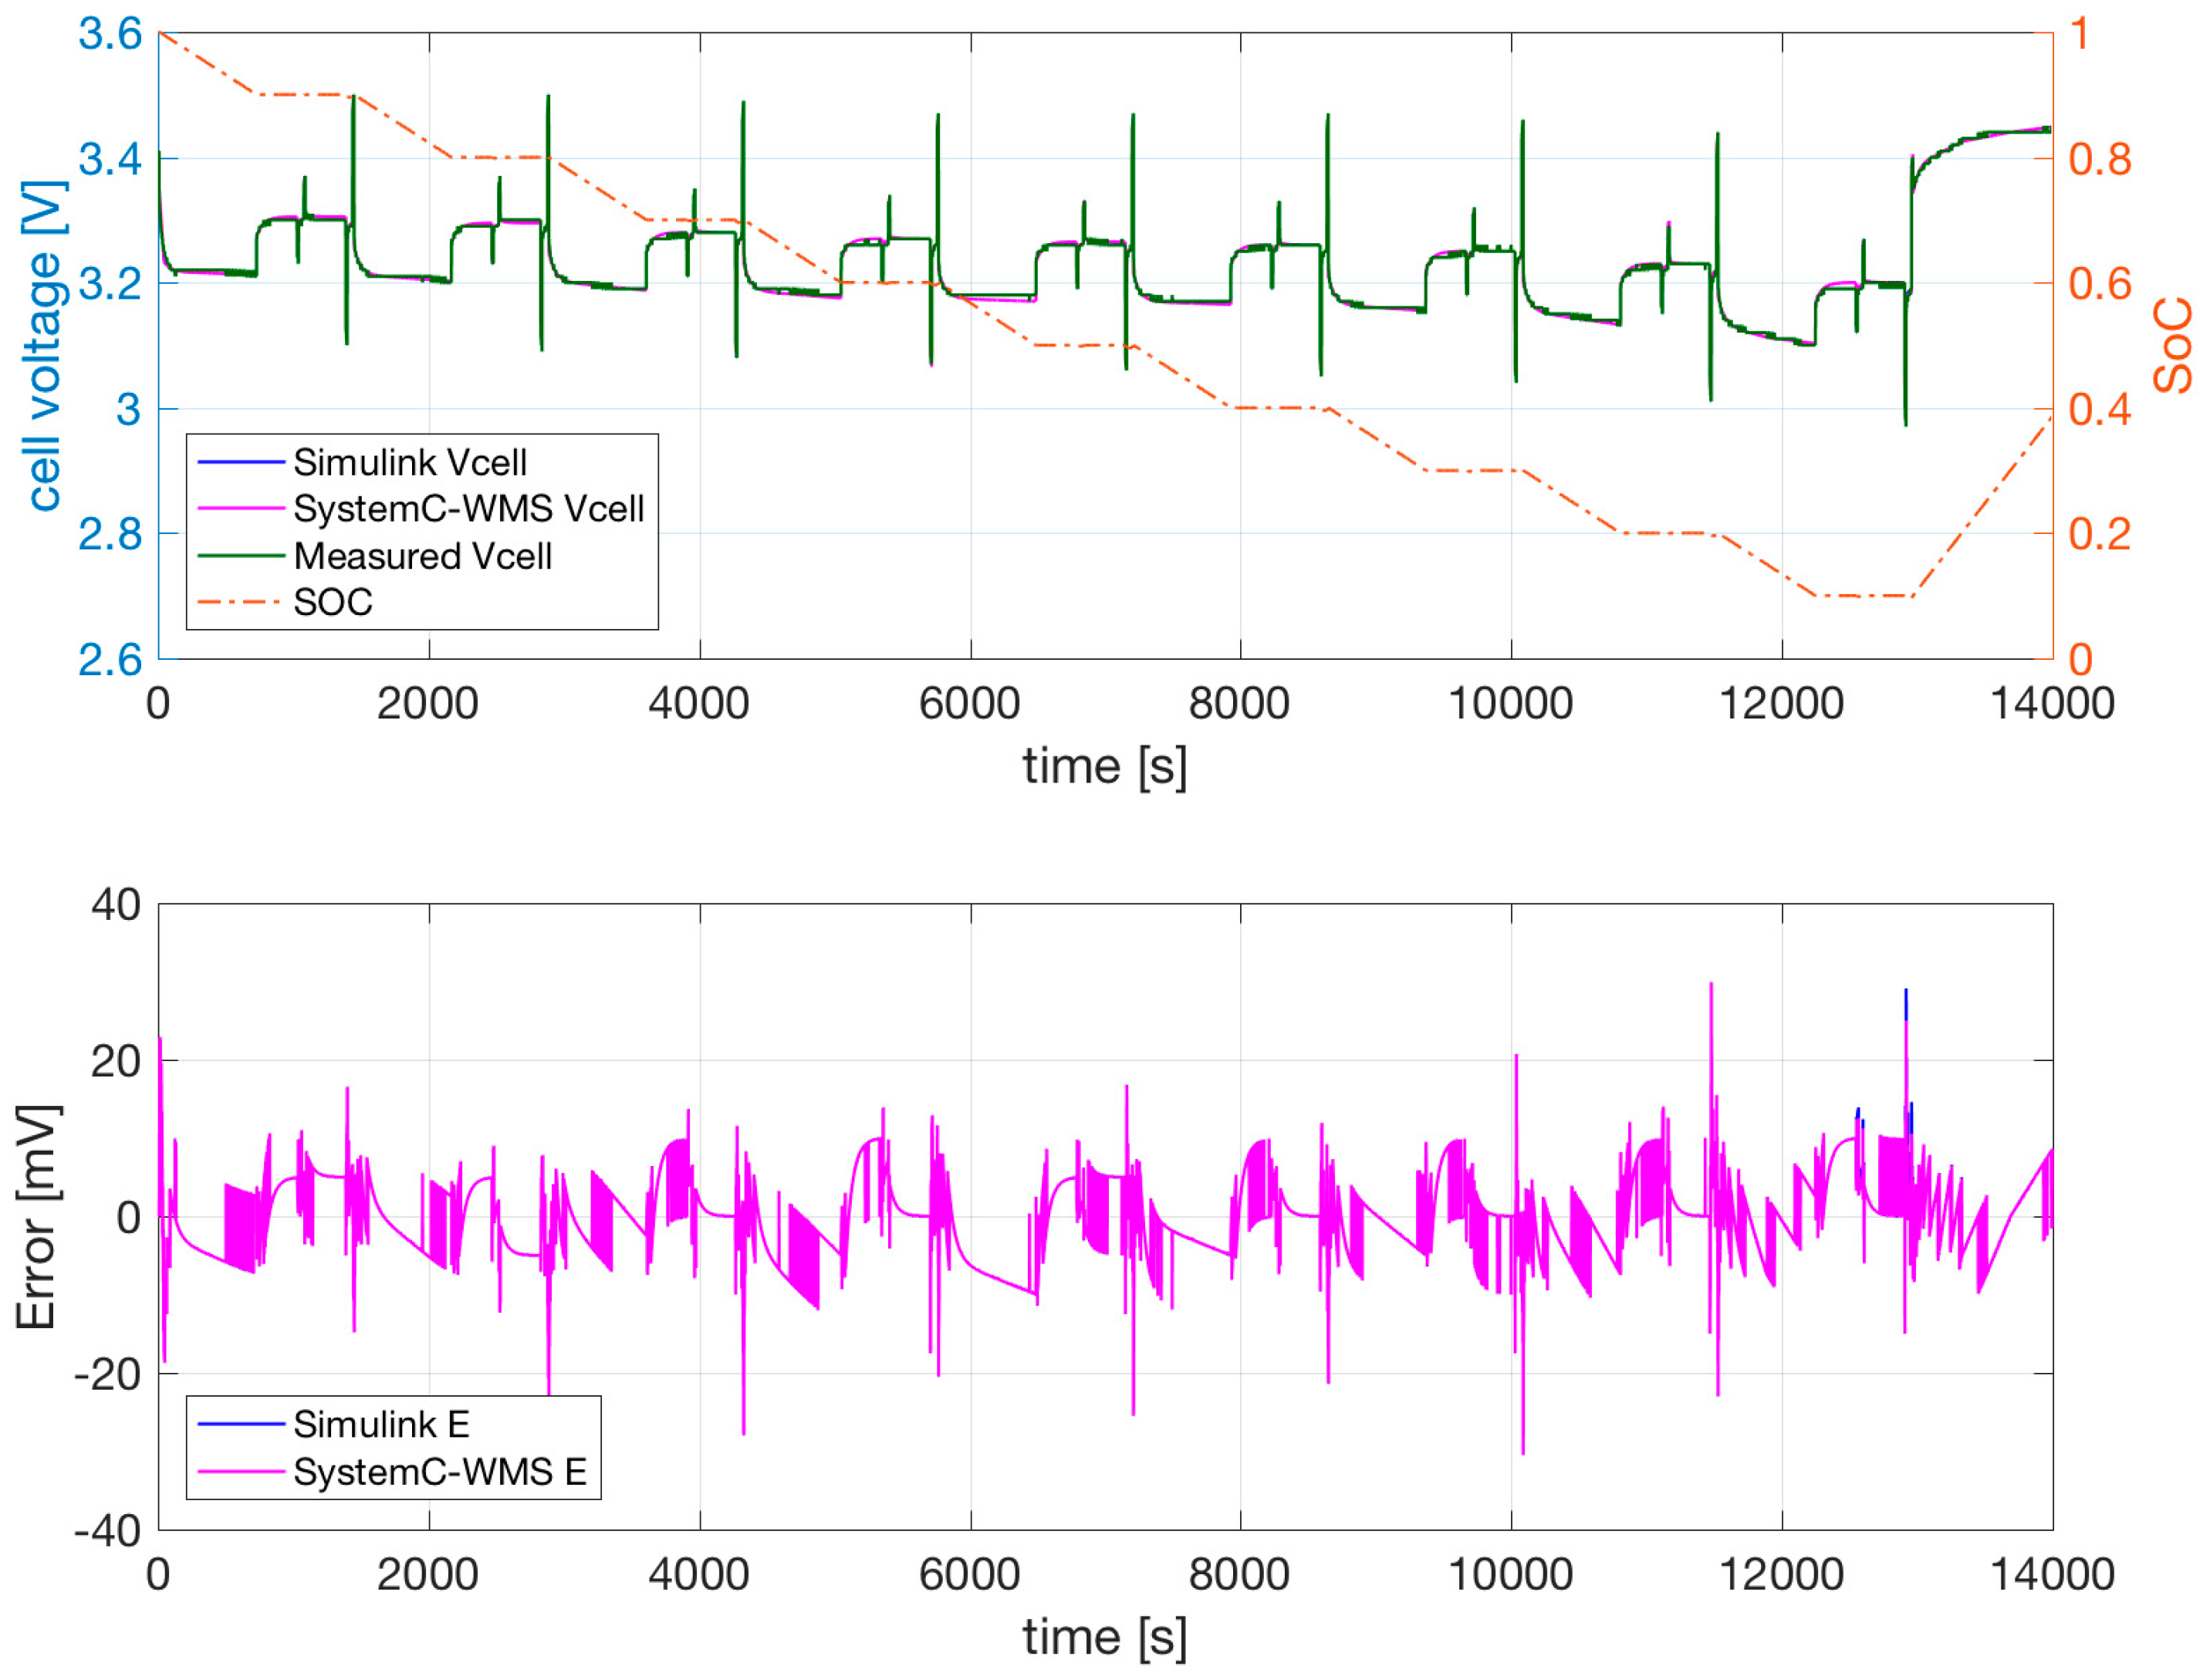
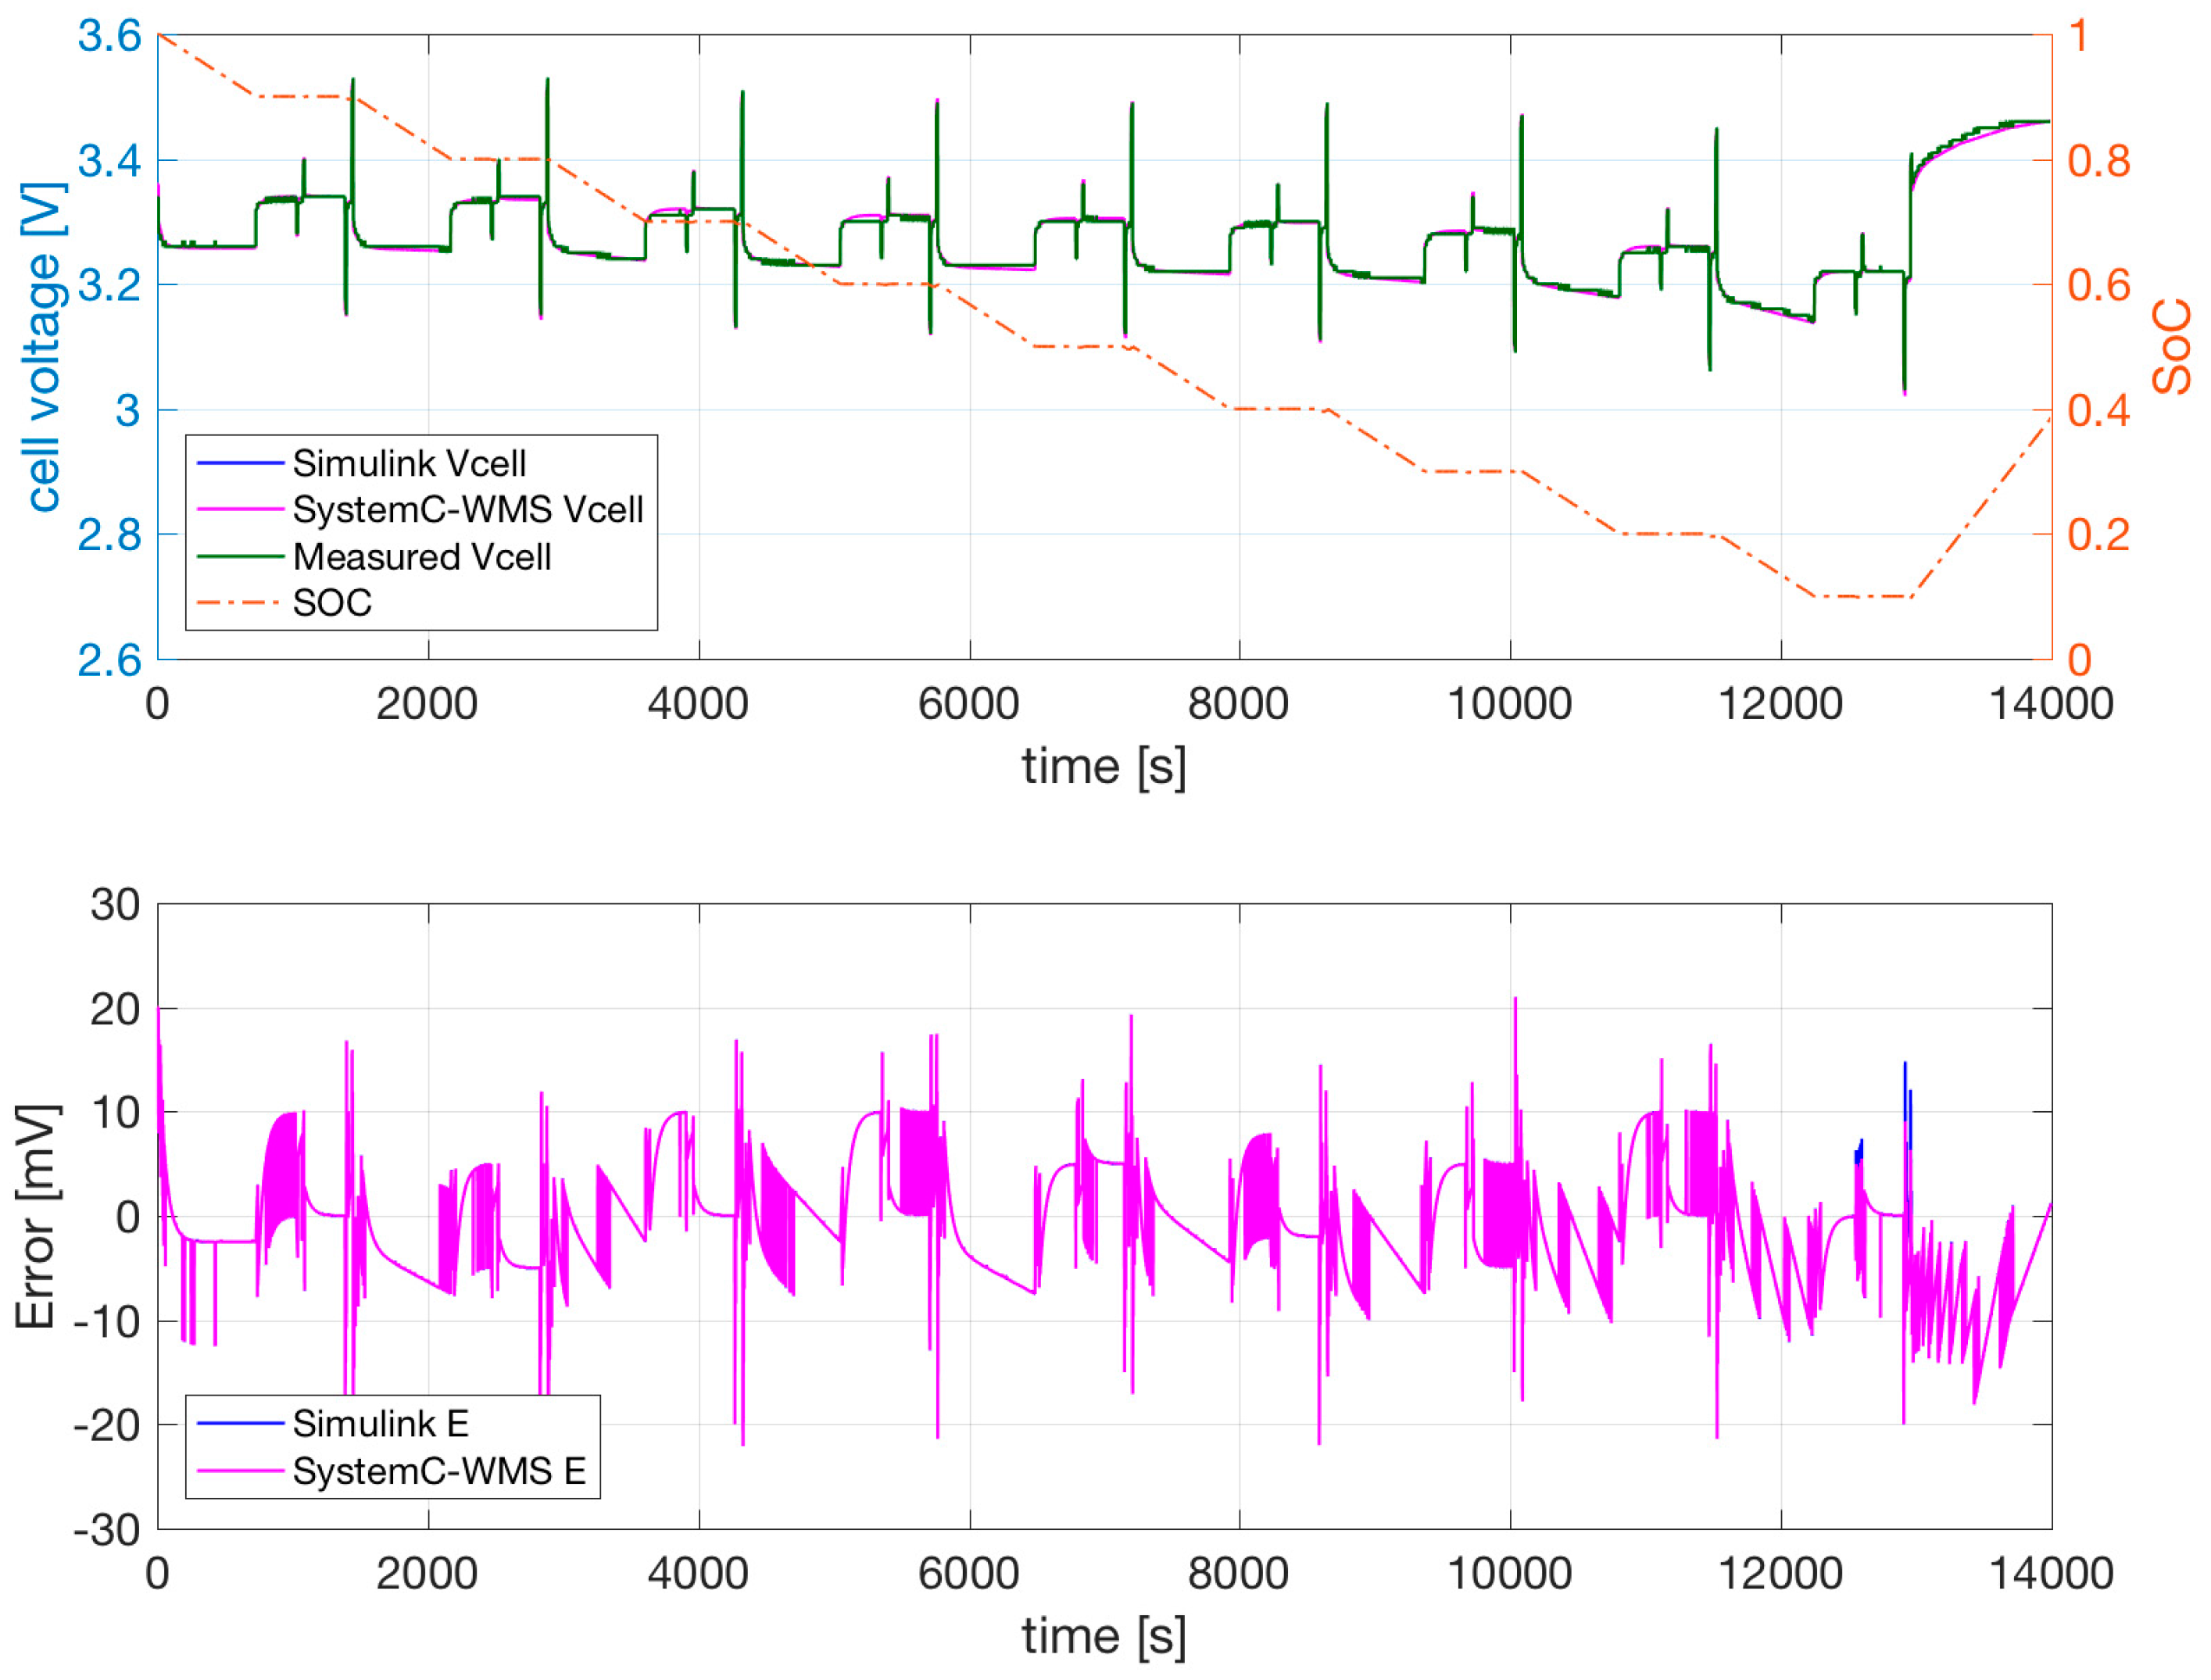
The accuracy of the model is shown in
Figure 7,
Figure 8 and
Figure 9.
Figure 7 reports the measured voltage, the SoC, SystemC-WMS, and Simulink simulations of the model of
Figure 1b with parameters obtained using the extraction procedure and successive optimization. The temperature of the cell was forced to a constant 0 °C in a climatic chamber. Similar results are shown for the same cell at 25 °C and 40 °C in
Figure 8 and
Figure 9, respectively.
The SystemC-WMS and Simulink simulations resemble each other closely. Their difference is mainly due to the fact that the Simulink model does not consider the thermal part, but the value of the convective resistance is low in order to simulate the constant climatic chamber. The measurements and simulations shown in
Figure 7,
Figure 8 and
Figure 9 evidence that the cell output voltage at low temperatures is lower at 25 °C and 40 °C—especially when the SoC is low. During the two consecutive discharge and charge current pulses of 25 A and 75 A, the effect of
and
is negligible. The effect of the current pulses on the output voltage is mainly due to the value of
.
Figure 7,
Figure 8 and
Figure 9 evidence the ability of the model to follow the transient during these current pulses. The dependence of
on temperature allows good results at all temperatures. The possible dependence of
on the current values is not necessary, and is therefore not included in our model.
6. Results: Battery Pack Simulations
A battery pack consisting of series and parallel cells can be modelled as a single block, like those used in References [
8,
9,
10,
11,
12,
13,
14,
15,
16,
17]. This type of model cannot be used to analyze the effects of a mismatch between single cells on the degradation of battery pack performance.
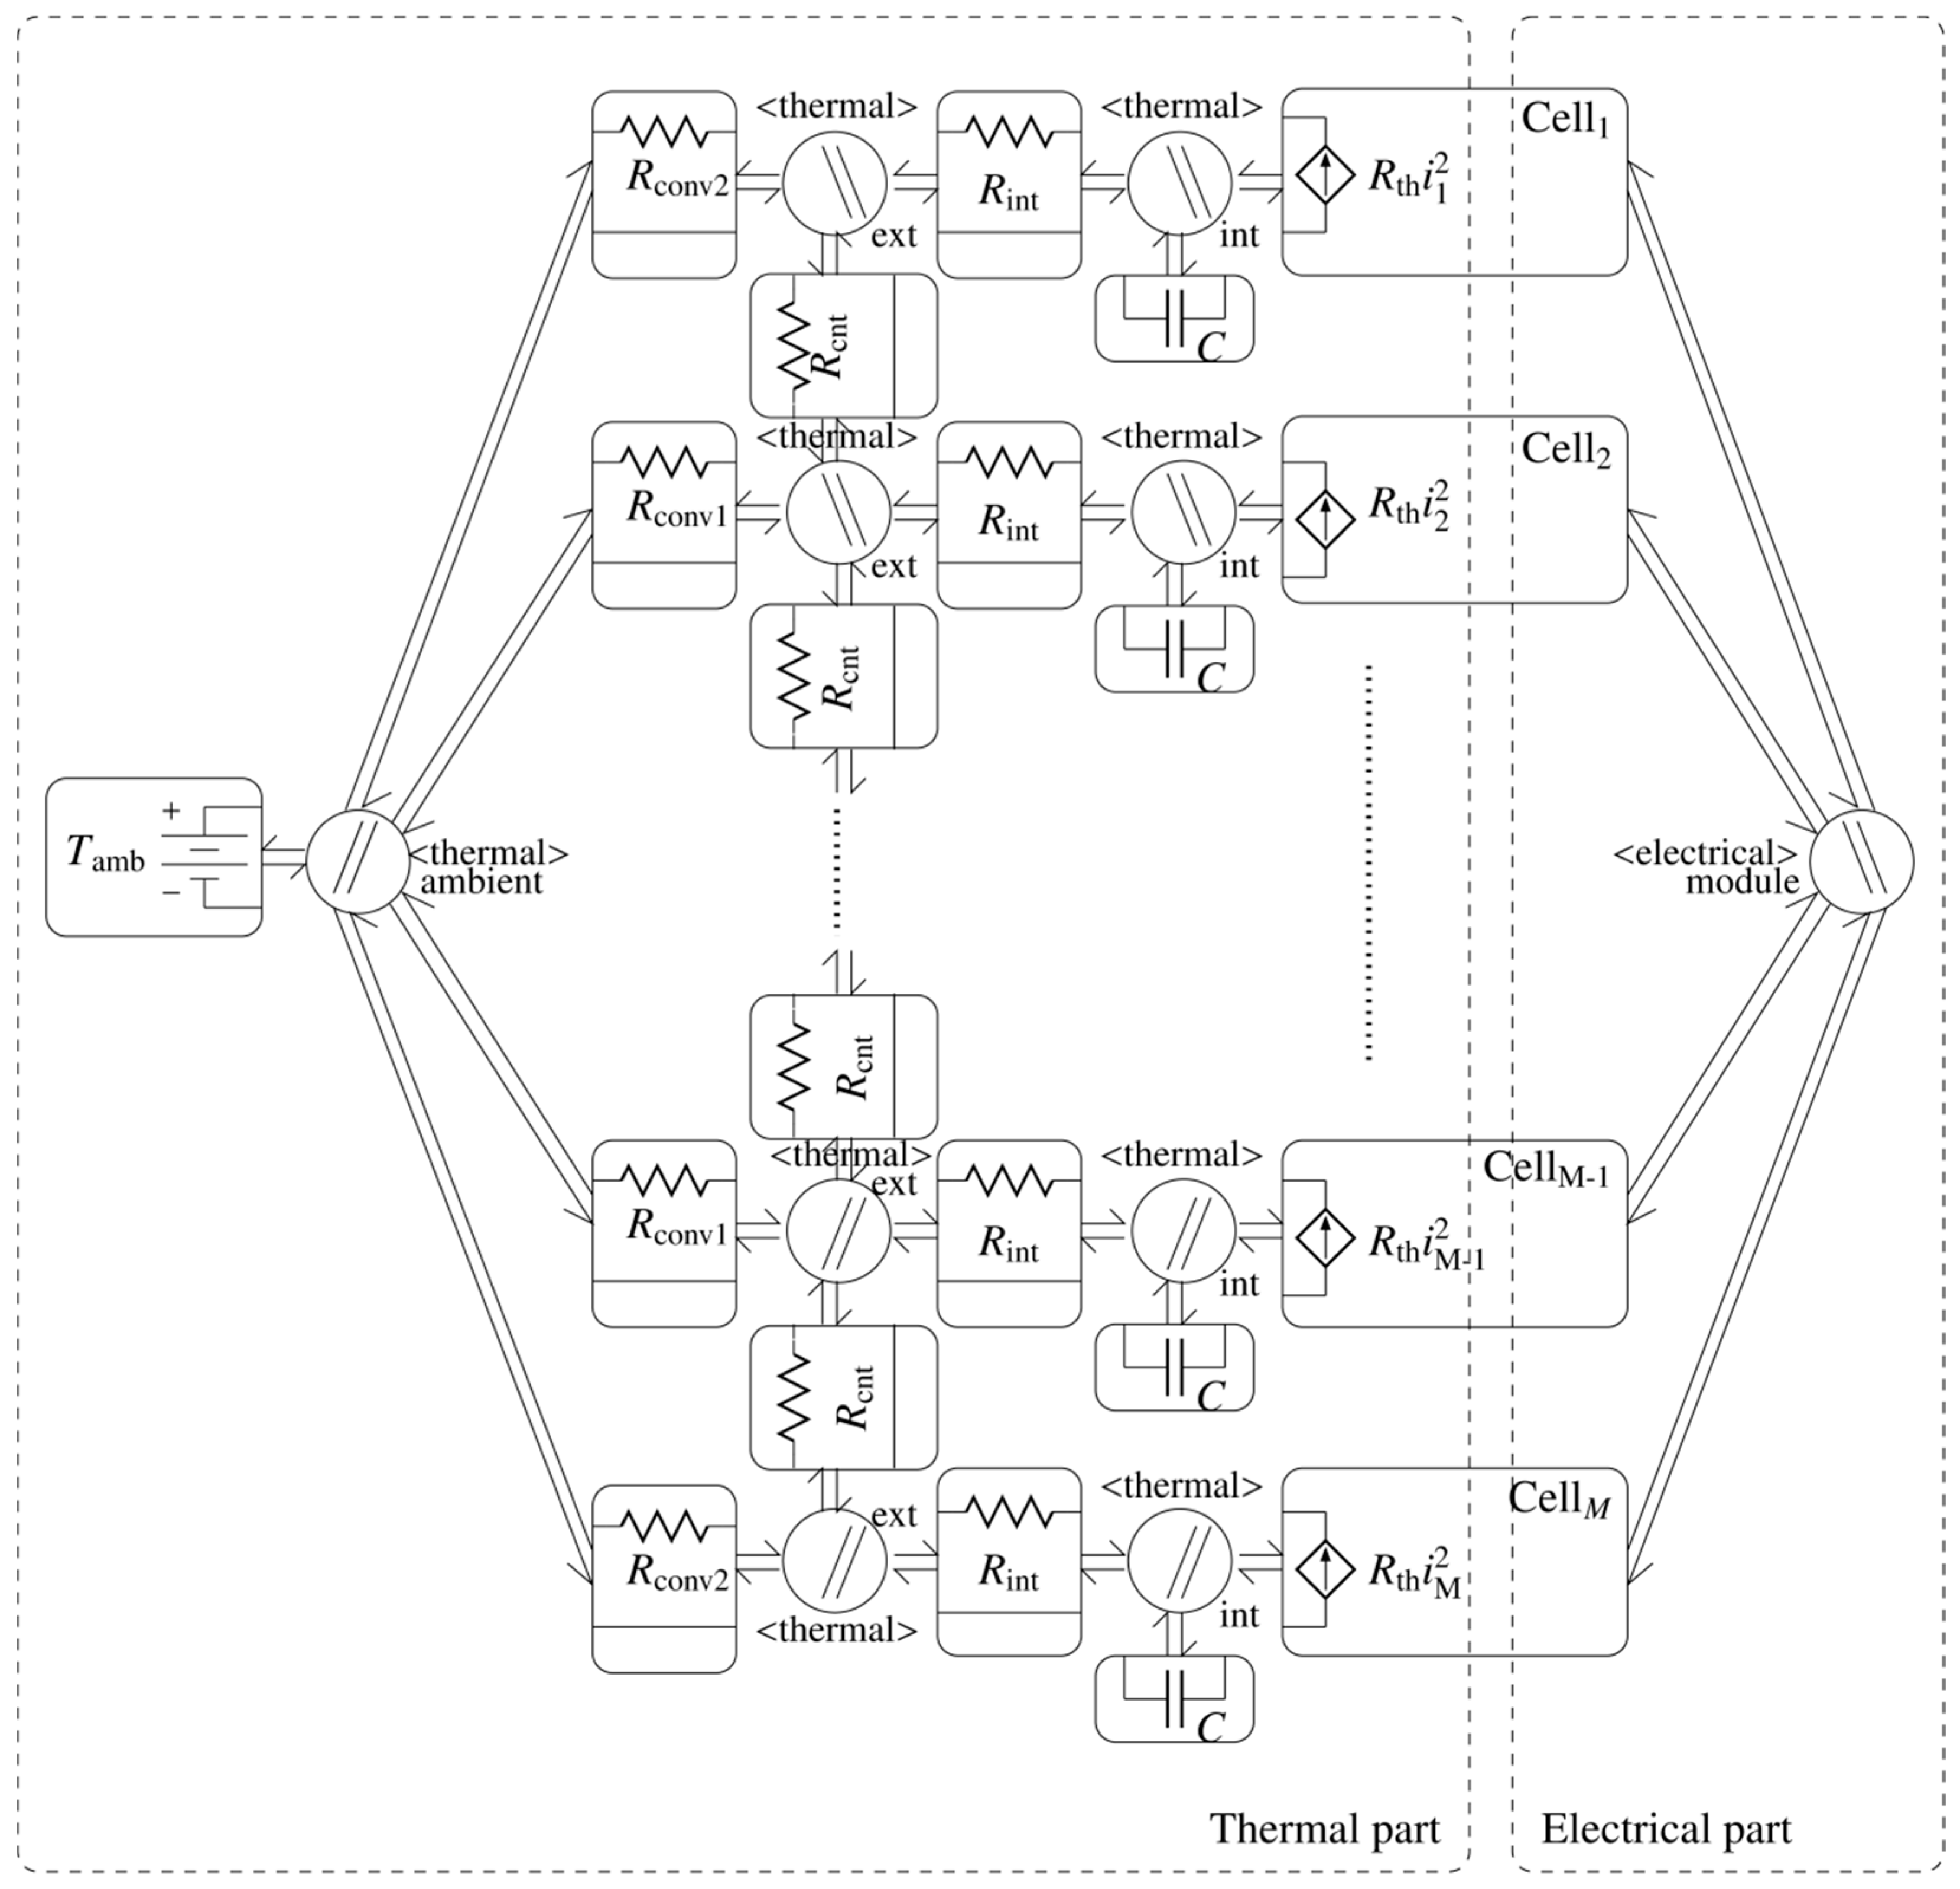
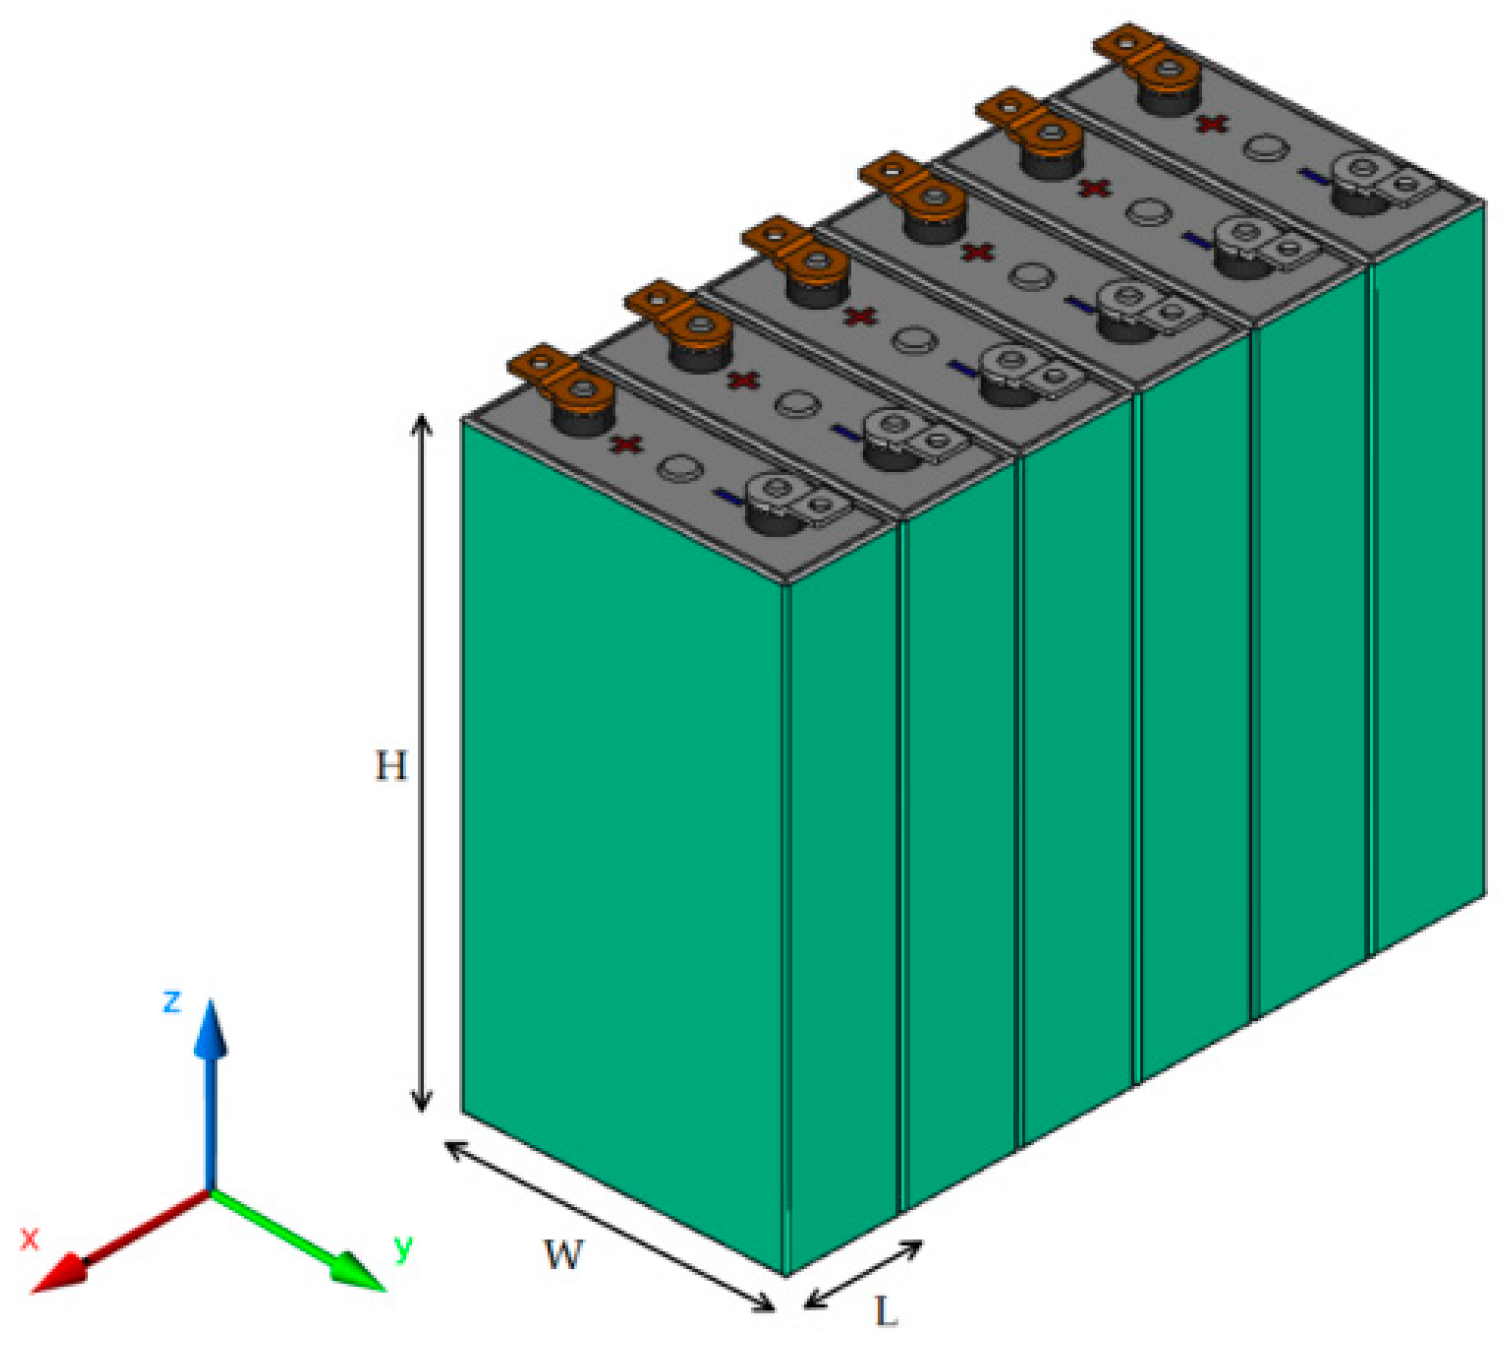
A battery pack is typically composed of a group of cells from the same production lot. However, even slight differences among the cells can cause different issues. During the battery charge, dissimilar OCVs in series-connected cells could lead to overcharging the cells with higher OCV. Similarly, cells with weak OCVs may be over-discharged when current is drained from the battery. A dual issue is also present when the cells are connected in parallel: the cells’ voltages are forced to be the same, but their SoC values may be different. The result is that some cells reach an SoC of 0% while others still have some available charge. Differences in temperature also imply differences in model parameters. In this work, the battery pack has been modelled by connecting the models of the single cells, as shown in
Section 3. In this study, we consider a battery pack consisting of eight modules in series. Each module contains six cells connected in parallel, as shown in
Figure 10.
In this case, the generated heat of each cell is propagated in adjacent cells and is transferred towards the surface by conduction. This means that the thermal resistances between the cells cannot be neglected.
Finally, the battery pack is connected to an external cooling system. In this way, heat is dissipated by convection. Thus, thermal power exchanged by the external cells is modelled by thermal convection as , where is the area of the radiator given by the peripheral area plus the cross-section area of the cell. The thermal power exchanged by the internal cells is instead modelled by the thermal conductance , where is the peripheral area of the cell.
Table 2 reports the values of the thermal coefficients and geometrical parameters used for the simulation of the battery pack, in addition to the parameters of the single cell reported in
Table 1.
Furthermore, the extension of the battery cell to a complex battery pack with
M series connection of
N cells in parallel has been developed.
Figure 11 shows the SystemC-WMS scheme of this battery module.
The code corresponding to this schematic is shown below. The user must declare the Li cell and connect its ports—an electrical port, e_port; a thermal port, th_port; and a SystemC clock port, clock_port, that controls the sampling of cell parameters that varies as a function of temperature and SoC—to the corresponding channels. The number of cells in series and parallel can be changed simply by changing parameters M and N.
  for(unsigned i = 0; i < M; i++){      //series
     for(unsigned j = 0; j < N; j++){  // parallel
        // Cells
        std::string name = "B_cell_" + std::to_string(i)+ std::to_string(j);
	B_cell[i][j] = new Li_cell_itrp(name.c_str(), param_names, soc_i+soc_n(engine), Qnom+Qnom_n(engine), *params[i][j]);
	B_cell[i][j]->e_port(Cell_ch_sh[i]);
	B_cell[i][j]->th_port(Cell_th_ch_int[i][j]);
	B_cell[i][j]->clock_port(clk);
	B_cell[i][j]->set_steplimits(1.0e-2, 1.0);
	B_cell[i][j]->set_tolerances (1e-9, 1e-3, 1e-1);
	// Thermal resistance from inner of the cell to outside
	name = "Rint_" + std::to_string(i)+ std::to_string(j);
	Rint[i][j]   = new Thermal_resistance(name.c_str(), Rin_val);
	(*Rint[i][j])(Cell_th_ch_int[i][j],Cell_th_ch_ext[i][j]);

	// Thermal resistance between a couple of cell
	if ((i*N+j != M*N/2-1)&&(i*N+j != M*N-1))
	   if (j<N-1) {
	      name = "Rcnt_" + std::to_string(i)+ std::to_string(j);
	      Rcnt[i][j]   = new Thermal_resistance(name.c_str(), Rcnt_val);
	      (*Rcnt[i][j])(Cell_th_ch_ext[i][j],Cell_th_ch_ext[i][j+1]);
	   } else {
	      name = "Rcnt_" + std::to_string(i)+ std::to_string(j);
	      Rcnt[i][j]   = new Thermal_resistance(name.c_str(), Rcnt_val);
	      (*Rcnt[i][j])(Cell_th_ch_ext[i+1][0],Cell_th_ch_ext[i][j]);
	   };
	// Thermal capacitance of the cell
	name = "C_" + std::to_string(i)+ std::to_string(j);
	Cap[i][j]   = new Thermal_capacitance(name.c_str(), Cap_val);
A key aspect to be faced in the design of the BMS of a battery pack is that the single cells are not identical to each other, and the BMS must balance the mismatch between the cells [
36]. In our simulation environment, the mismatch effect was accounted for by adding a random value (normal distribution with a standard deviation defined by the user) to the values of the electrothermal parameters of the cell
), the nominal value of the capacitance (
), and the initial SoC (
).
Section 6 reports the results of battery pack simulations considering the mismatch among the cells. The statistical variations of the parameters of the cell have been modeled after the measurements of the single cell reported in References [
11,
18,
40,
41]:
The electrothermal SystemC-WMS model of the battery pack including statistical variations was used to simulate an 8 × 6 battery pack. The average capacity of the cells was 50 Ah; therefore, the nominal capacity of the battery pack was 300 Ah with a nominal voltage of 3.2 V × 8 = 25.6 V. The average values of the parameters are reported in
Figure 6, where the ambient and initial temperature of the cells was 25 °C and the average initial SoC of the cells was 95%. A constant current of 200 A was driven from the pack throughout the simulation of 1 h, with an average current of 33.33 A from each cell.
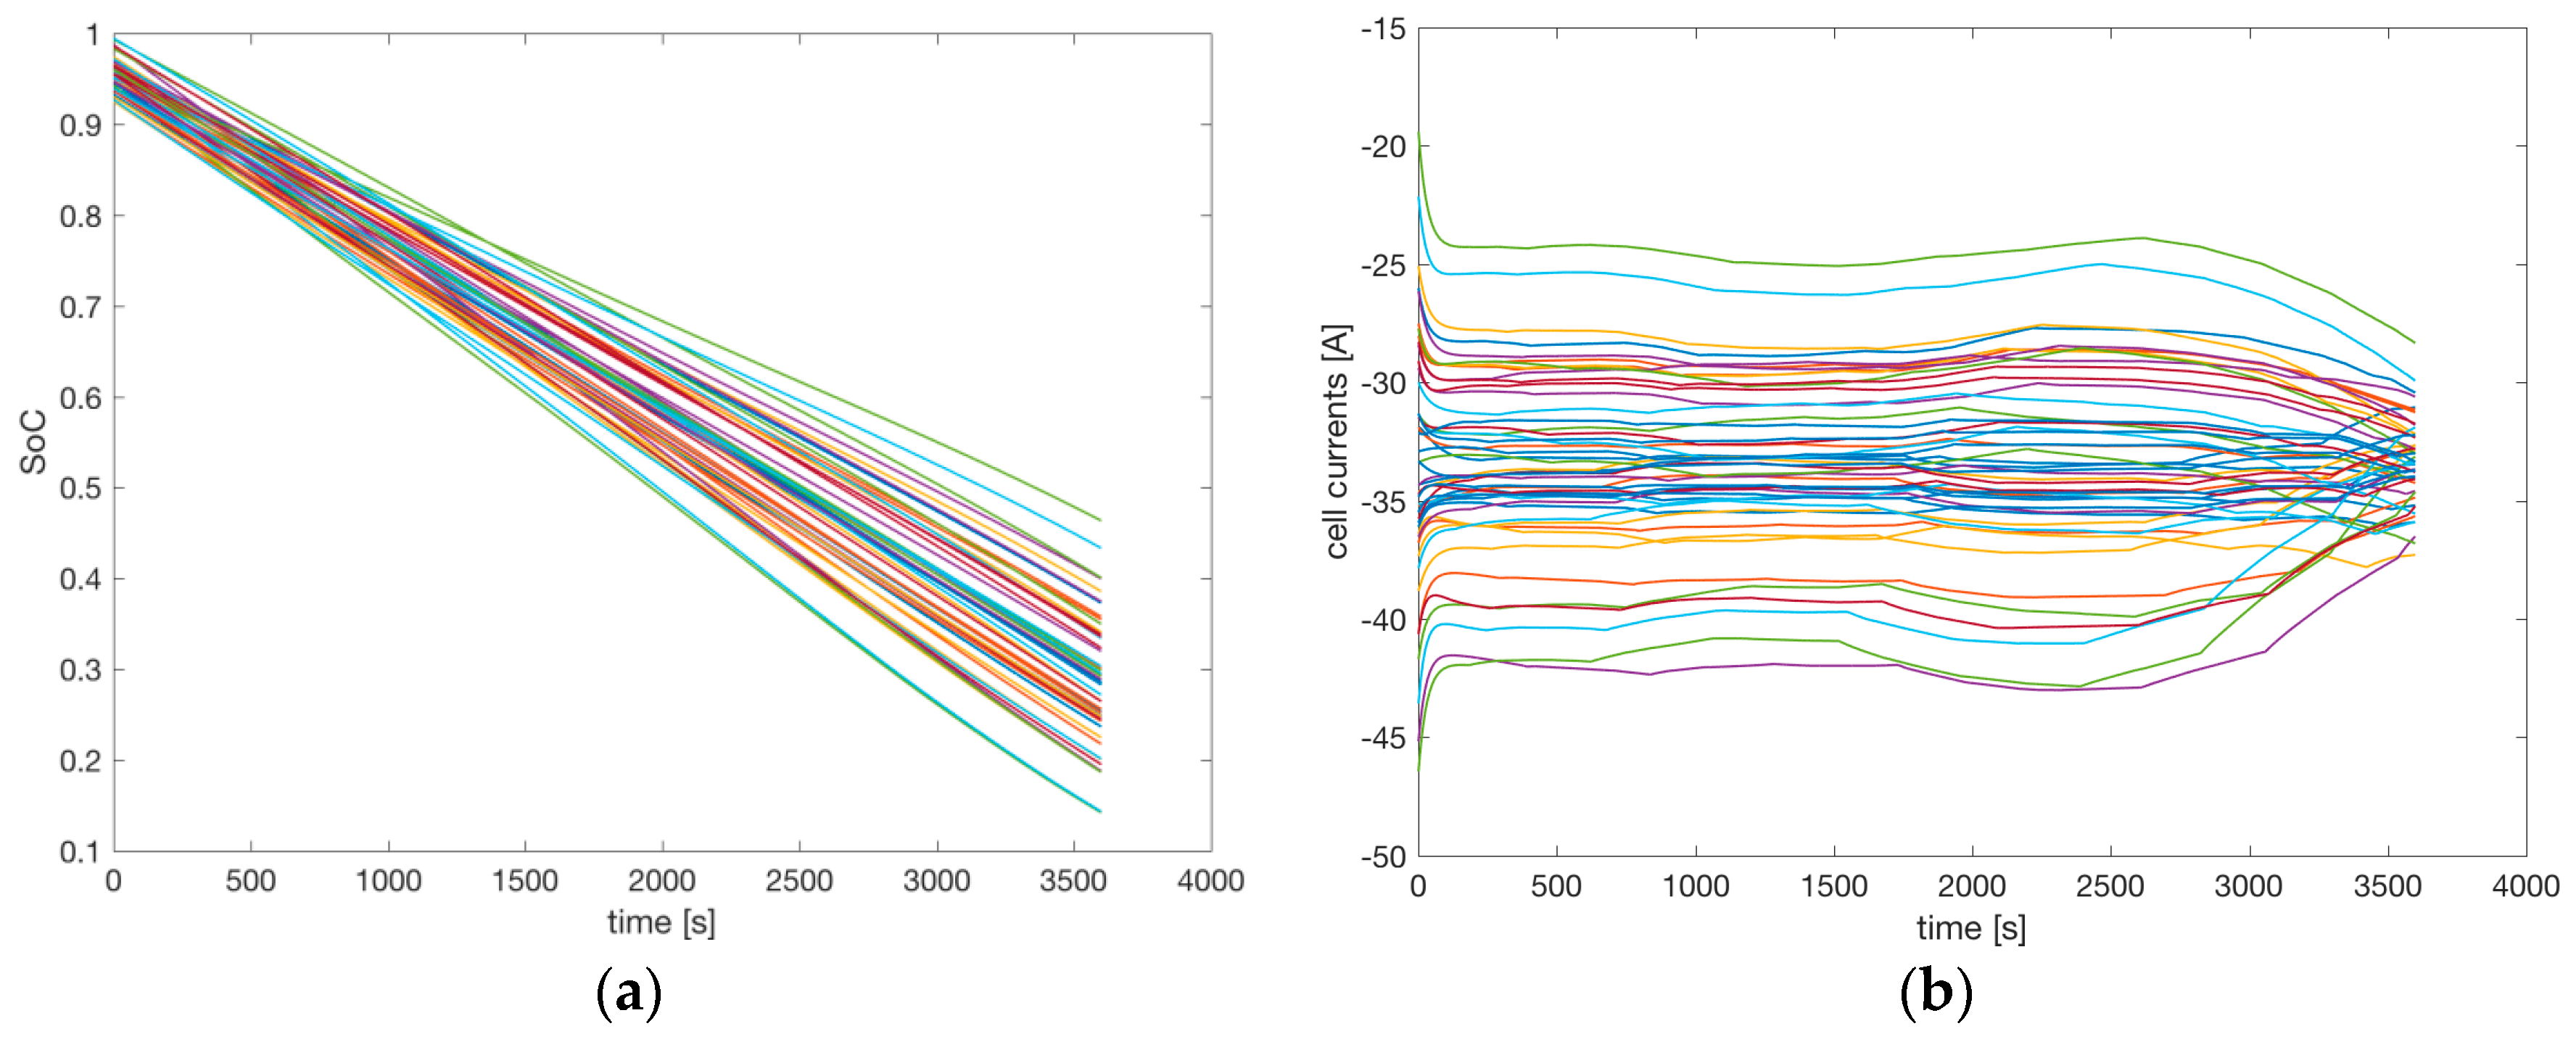
Figure 12,
Figure 13 and
Figure 14 show the results of the simulation. Data of each of the 48 cells are reported. The curves are reported in eight different colors, and the same color is used for all the cells connected in parallel.
Figure 12a shows the SoC of the 48 cells.
Figure 12b shows the current driven from each cell. The initial SoC starts from an average value of 95% with the imposed statistical variations. Due to different values of the parameters of the cells (e.g., a random shift of the OCV between the cells), the cells connected in parallel provide different currents: the one with the highest OCV provides higher current than the one with the lowest OCV. Since the total current driven is 200 A, the average among the six cells is 33.33 A.
Figure 12b shows the current variations. The cells providing higher current discharged more rapidly than the others, as can be seen in the slope of the SoC in
Figure 12a. Therefore, at the end of the simulation some of the cells have an SoC close to 10%, while others have an SoC close to 50%. The OCV decreases rapidly when the cell is close to complete discharge, as shown in
Figure 6a. The cells that gave higher current in the first part of the discharge had less SoC at the end of the discharge, and therefore reduced the current they provided. The reduction of the variations between the currents at the end of the simulations shown in
Figure 12b evidences this effect.
The total charge driven from the battery during the simulation was 200 Ah; that is, two thirds of the nominal capacity. After one hour, the SoC of an ideal battery pack with identical cells should be (0.95–200 Ah/300 Ah) = 28.3%. The nominal battery pack should reach 10% of SoC (the minimum value that should be reached to keep the battery in safe conditions) after (0.95−0.1) × 300 Ah/200 A = 1 h 16 min. In contrast, due to cell variability,
Figure 12a shows that one of the cells reached about 10% of SoC after one hour, with a reduction of 78% of the real duration of an ideal battery pack without mismatch.
The developed simulation environment allows the detailed analysis of the behavior of a battery pack with statistical variations among the cells, and consequently the development of BMS optimizing the performances of the cell balancing.
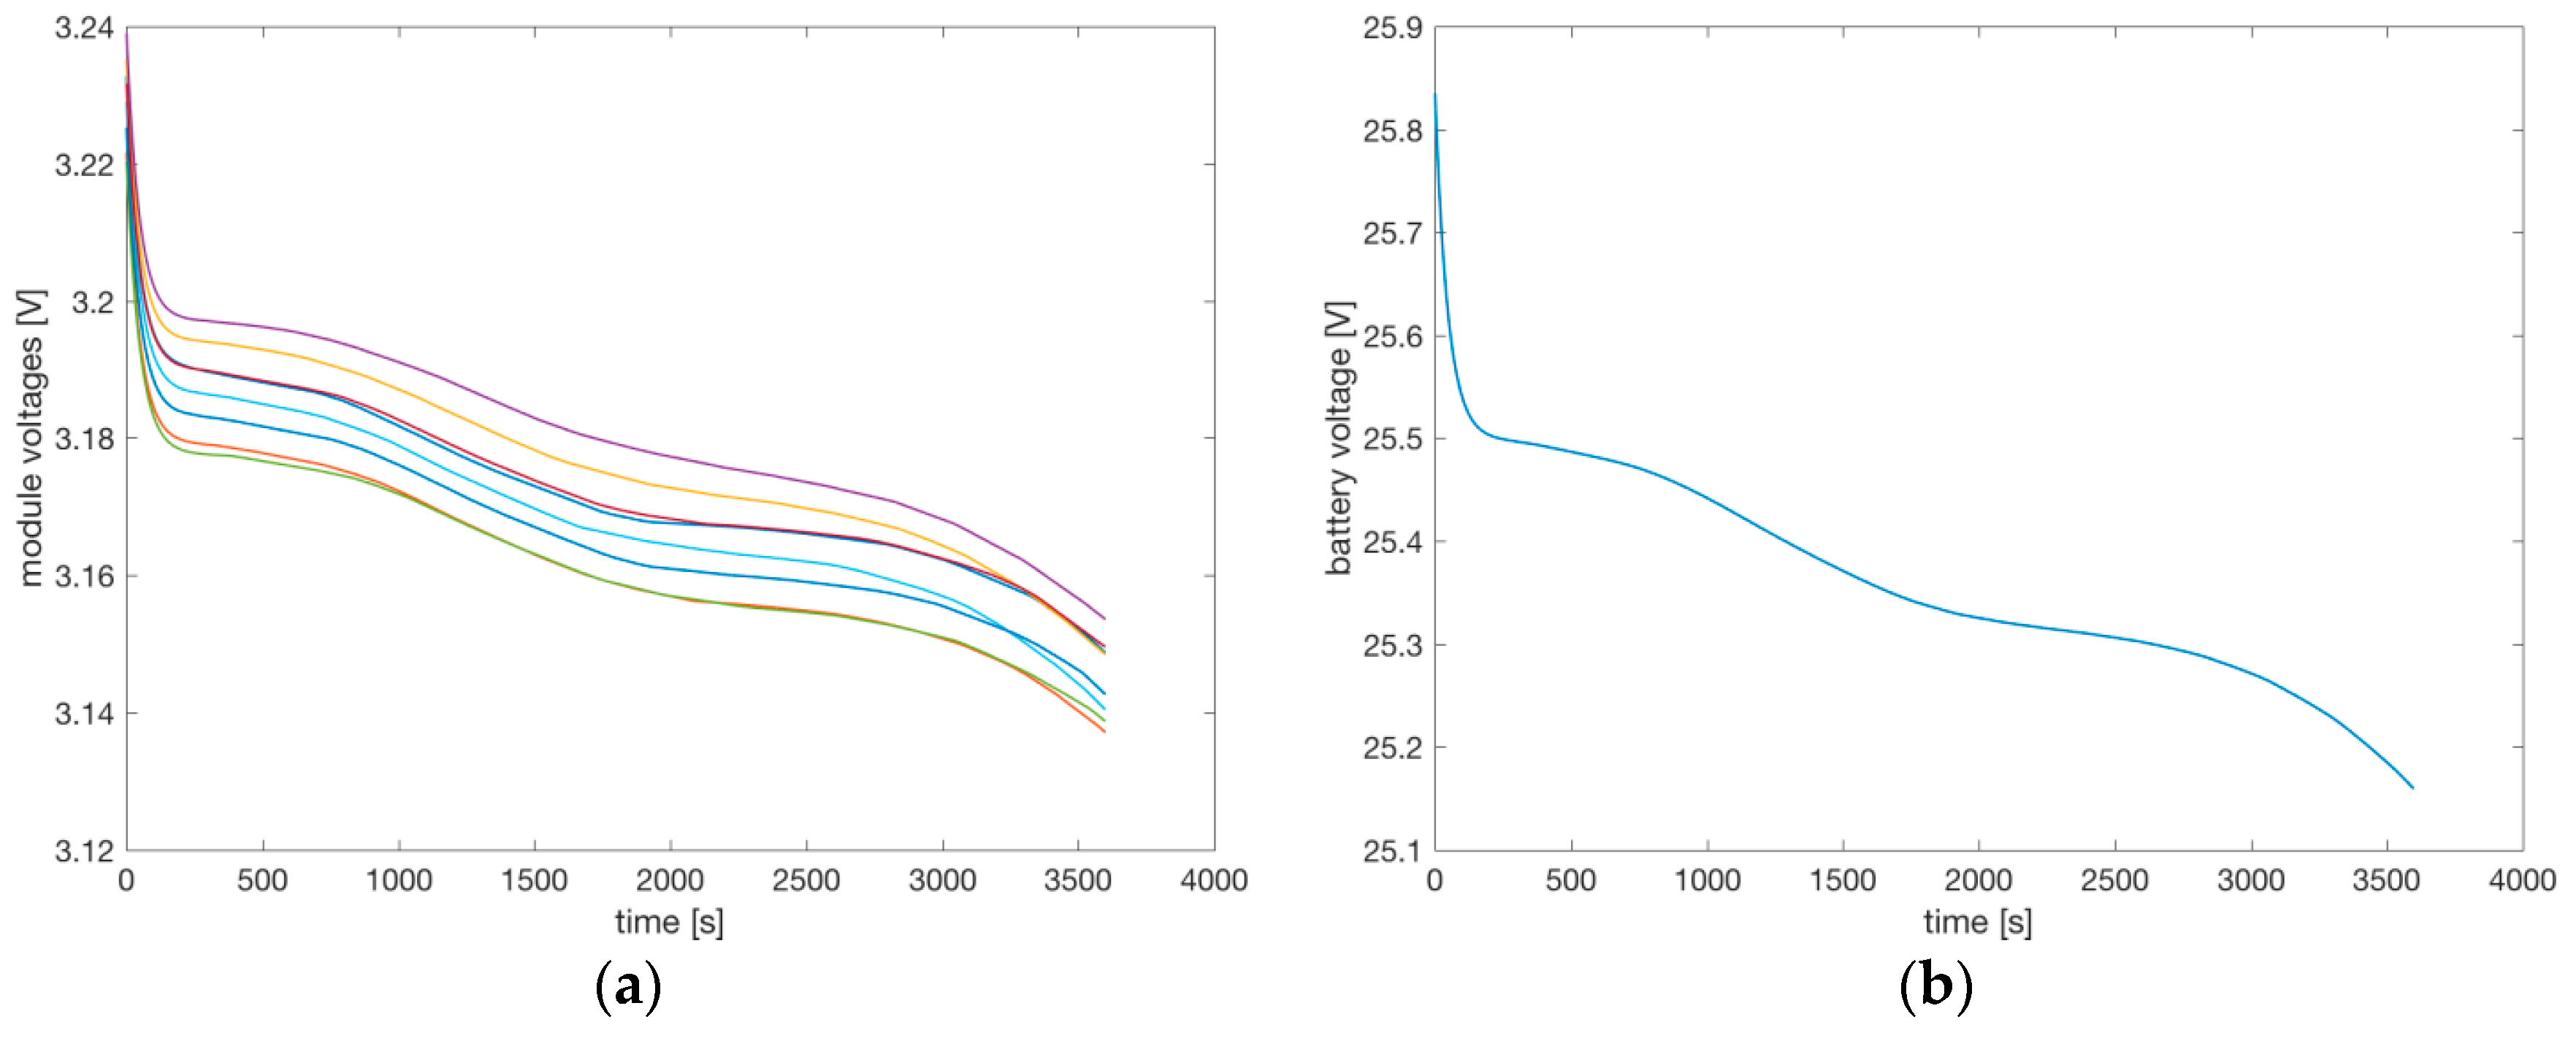
Figure 13a shows the output voltage over time of the eight packs connected in series, and
Figure 13b shows the voltage of the complete battery. The initial voltage drop in the first 200 s is due to the internal resistors and capacitors of the cells, then the voltages decrease due to the reduction of the SoC. The variations among the output voltages of the eight battery packs are evident, although the parallel connection of the six cells in each pack partially averages the variation among the six cells. The variations among the eight packs in series are mainly due to the variation on the OCV. At the end of the simulation, some of the cells have a low SoC, causing a reduction on the OCV and therefore a reduction of the output voltage of some of the packs in series (shown in
Figure 13a), and globally the reduction of the total output voltage (see
Figure 13b).
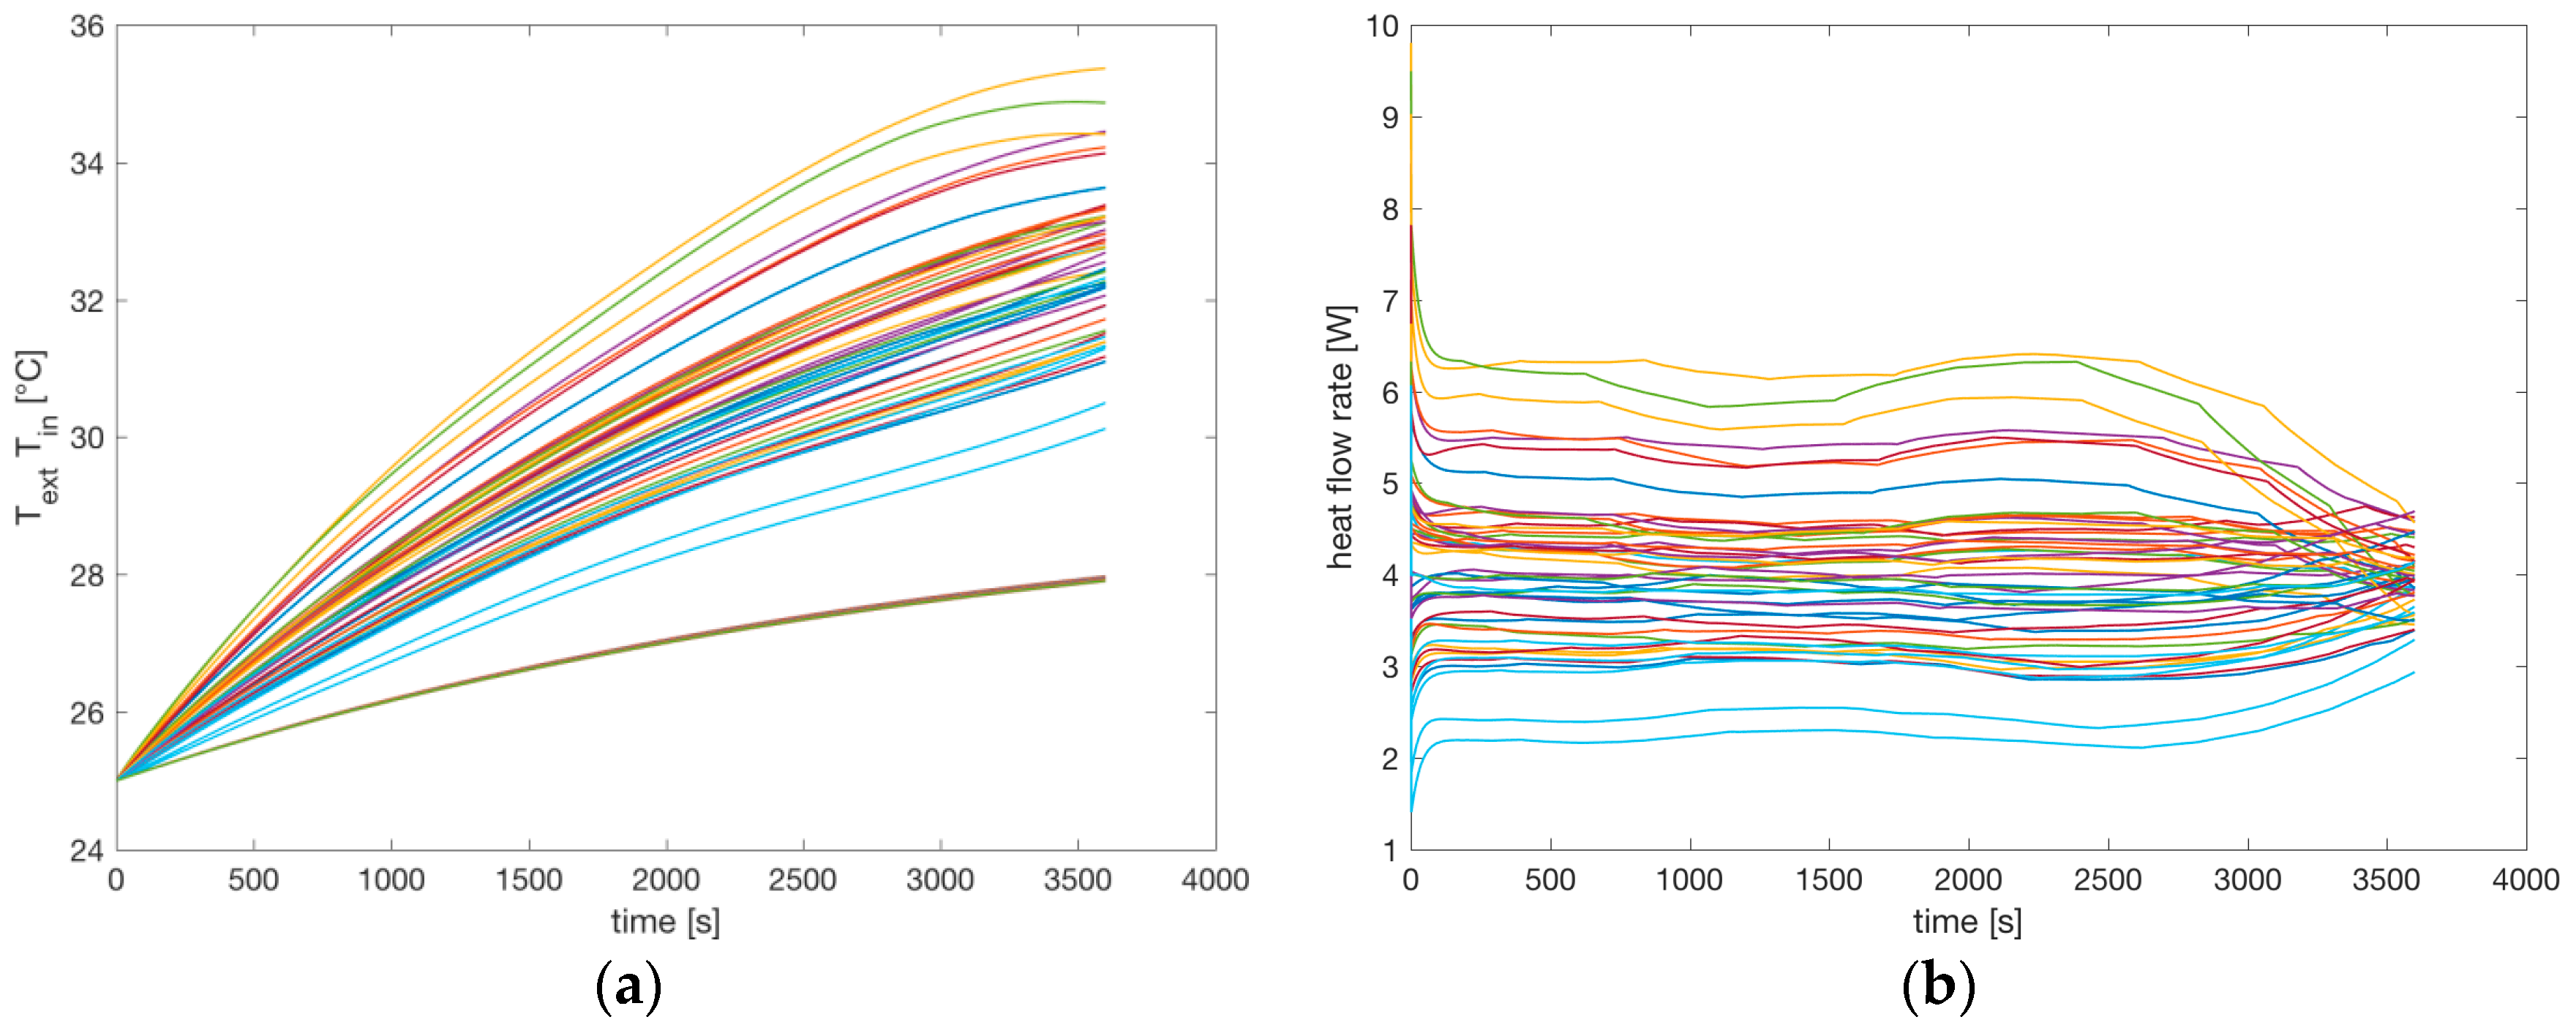
Figure 14a shows the 48 internal and 48 external temperatures of the cells. The external temperature variations are very low, so they look like a single thick line in the bottom of
Figure 14a. The upper lines represent the external temperatures. The temperatures increase over time due to the heat generation inside each cell, and the steady state temperature is reached at the end of the simulation. The variations among the internal temperatures are due to the variations of the temperature coefficients, and principally due to the different currents flowing in each cell.
Figure 14b shows the 48 heat flow rates of each cell. The variations are mainly due to the different currents flowing in each cell. The effect of the temperature variation on the parameters of the cell (OCV and internal resistances) are considered by the simulation environment. On the other hand, the effect of a cooling and heating battery system can be considered by simply changing the thermal parameters of the model.
7. Conclusions
This work presents a complete environment for the simulation of a battery pack while considering the statistical variations of the parameters among the cells. Different aspects have been considered in this work:
- -
The definition of a novel lumped electrothermal circuit of a single battery cell based on the widely used OCV and RC model, with the novelty of using diodes to model the different behaviors during charge and discharge.
- -
The definition of the extraction procedure of the parameters of the single cells from experiments, based on the HPPC procedure.
- -
The creation of libraries using the SystemC-WMS simulation environment for the simulation of a single cell and a battery pack.
Experimental measurements were carried out to validate our model and the extraction procedure.
A simulation environment was used for the statistical simulation of a battery pack. Many considerations can be drawn from our simulations, since it is possible to examine all the different internal voltages, currents, and temperatures of each cell—information that is usually extremely difficult (if not impossible) to measure.
The simulation environment is extremely useful for analyzing the effect of different BMS strategies for cell balancing in a battery pack while considering the statistical variations of the cells; therefore, it is useful for optimizing the BMS. Further work in this direction is under development by the authors.
Finally, an extension of the simulation environment at the system level can be easily done; for example, integrating the BMS with an automotive control system or the extension to a vehicle-to-grid integration.


