
Real-Time Forecasting of EV Charging Station Scheduling for Smart Energy Systems

 , ,
, ,
Abstract
:1. Introduction
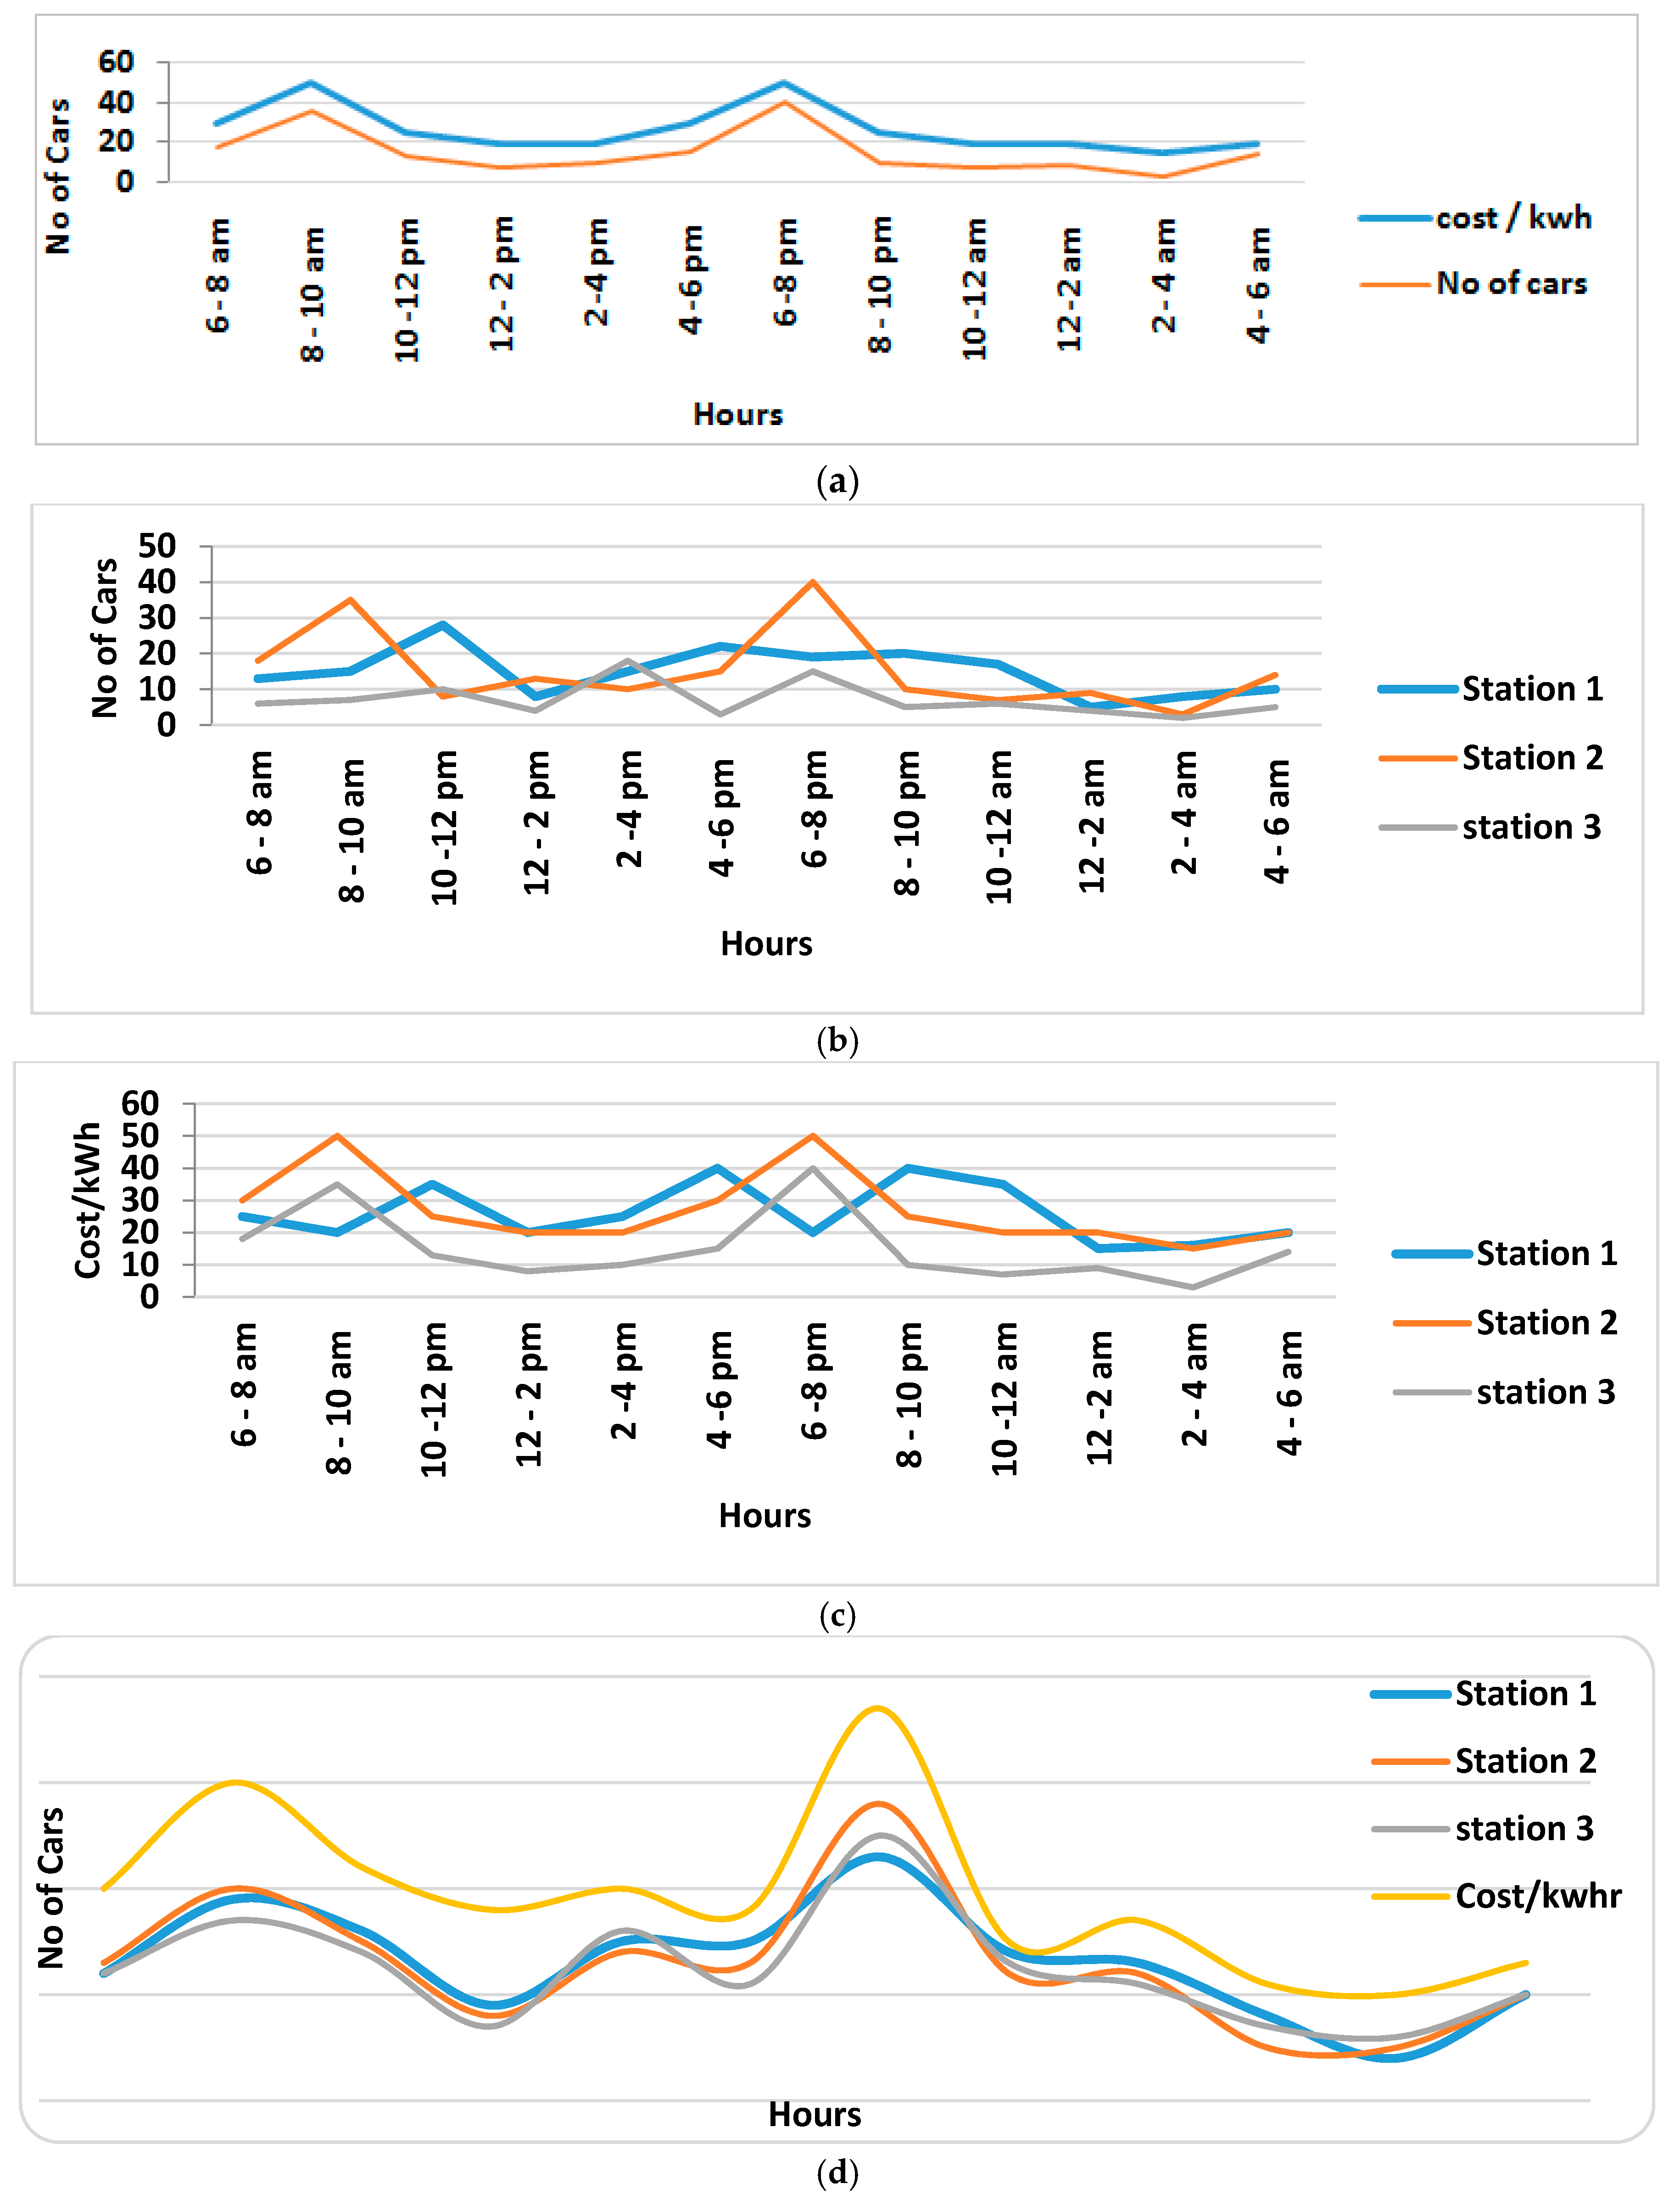
2. Load Forecasting
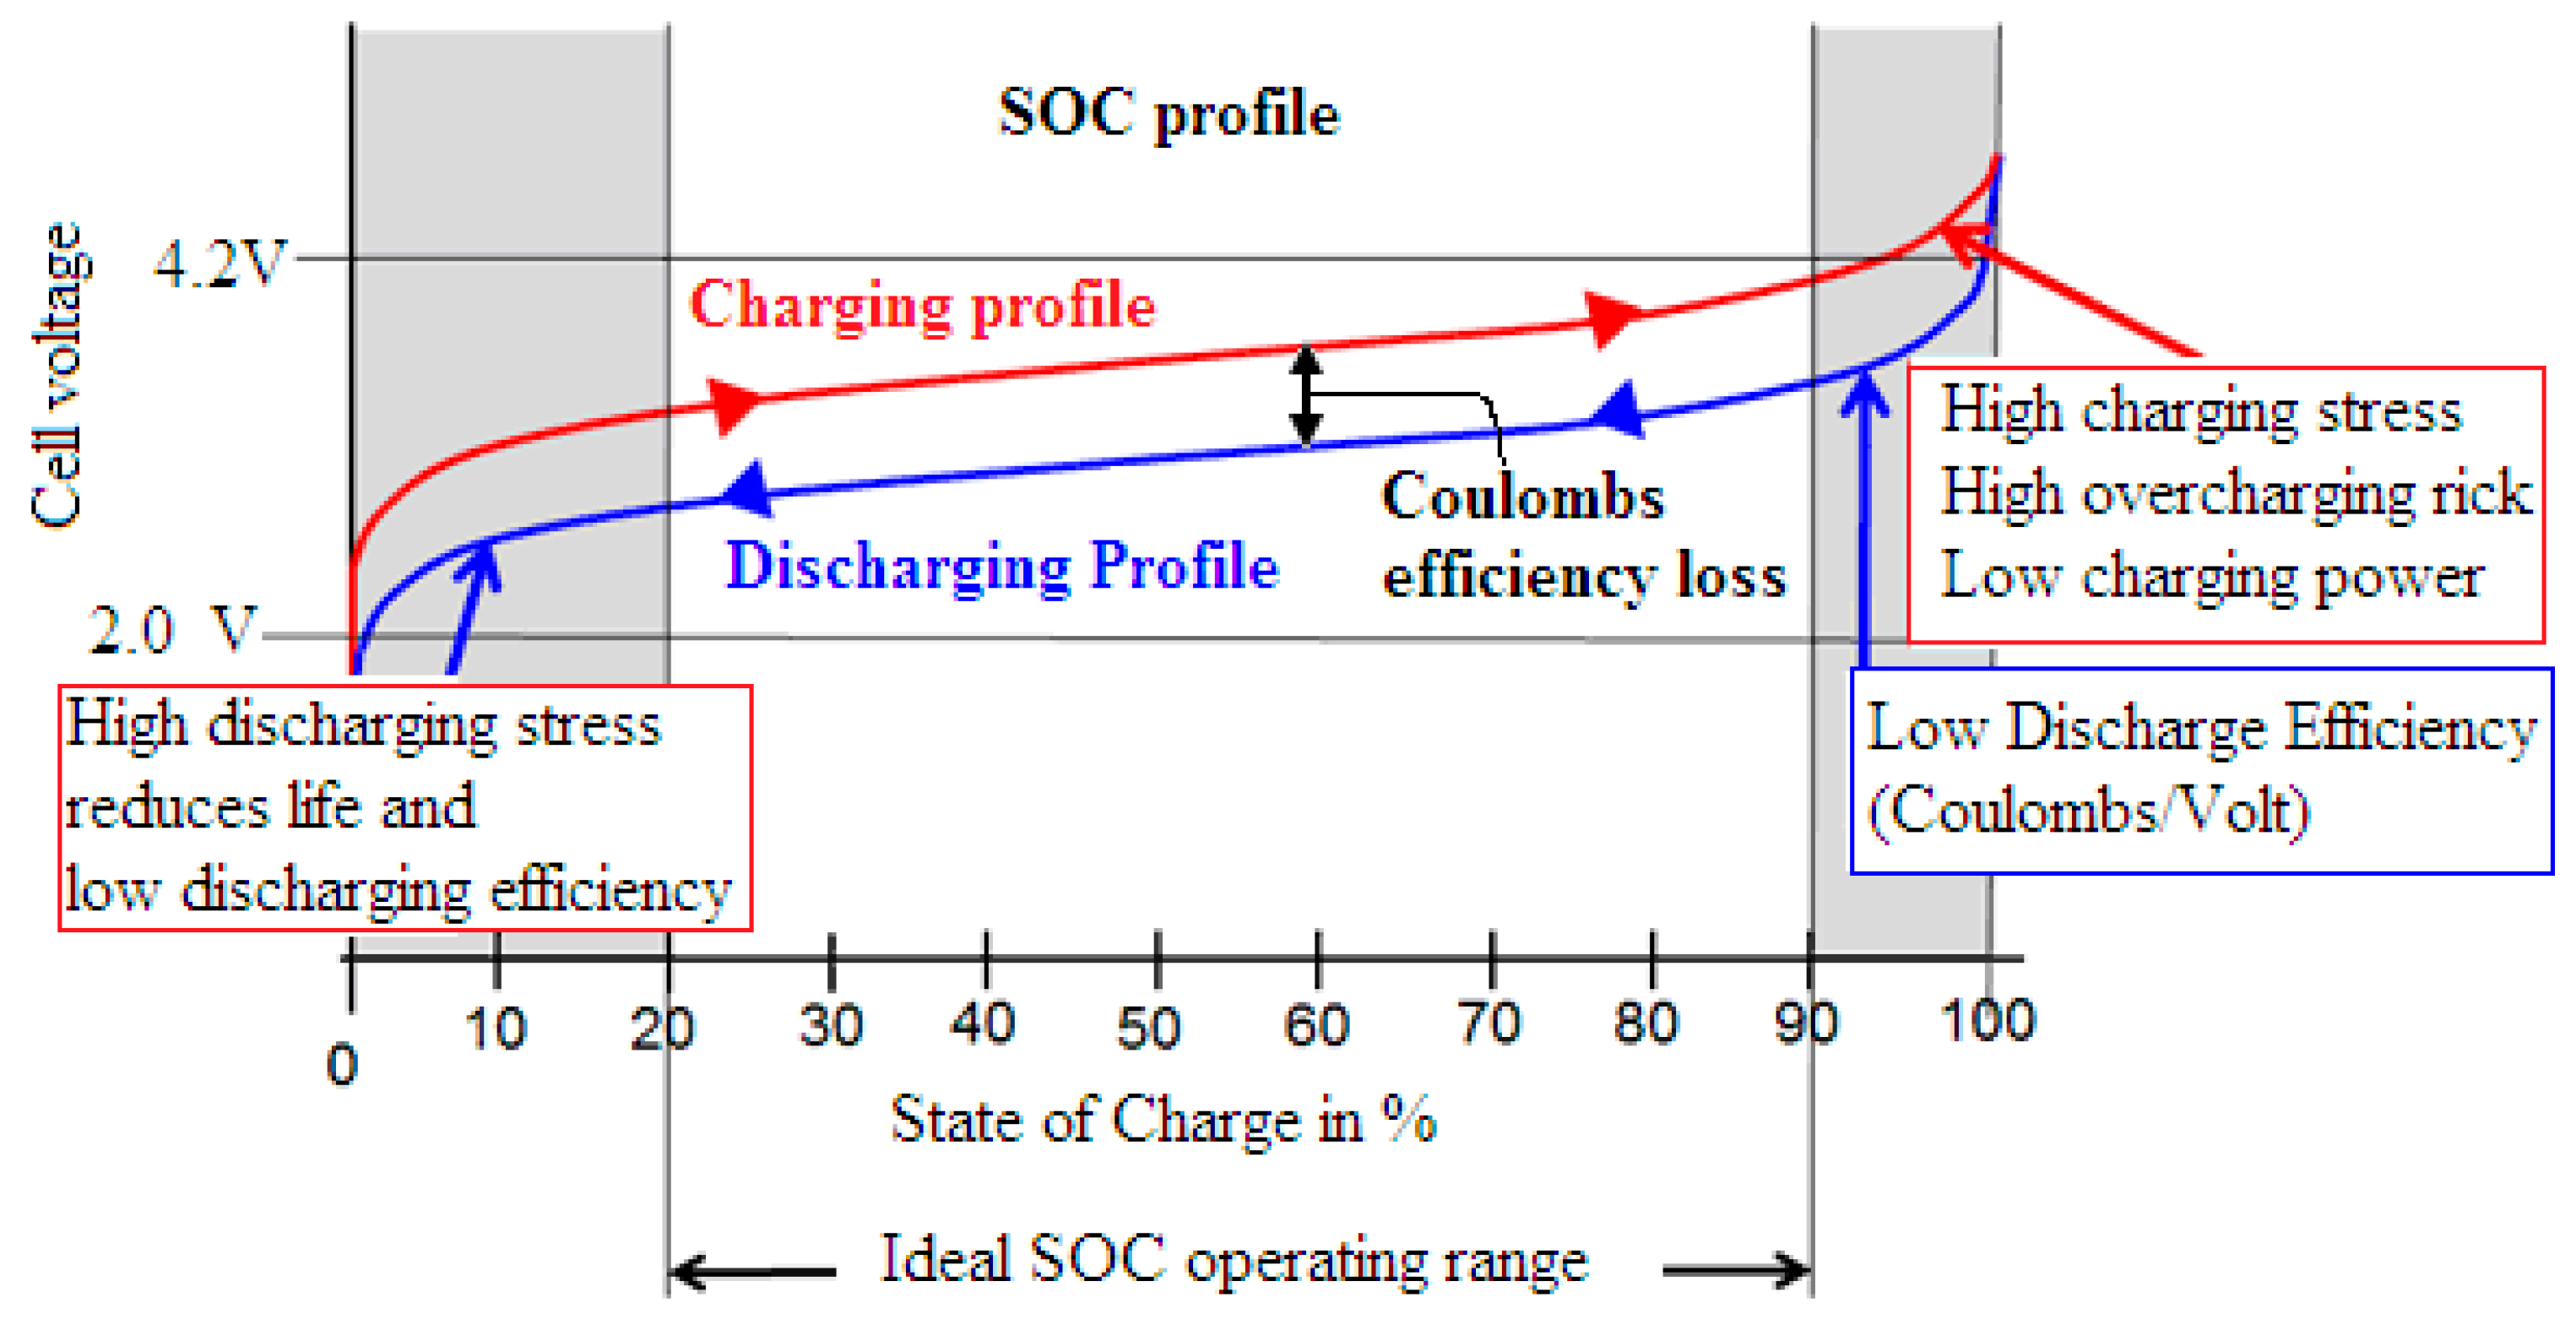
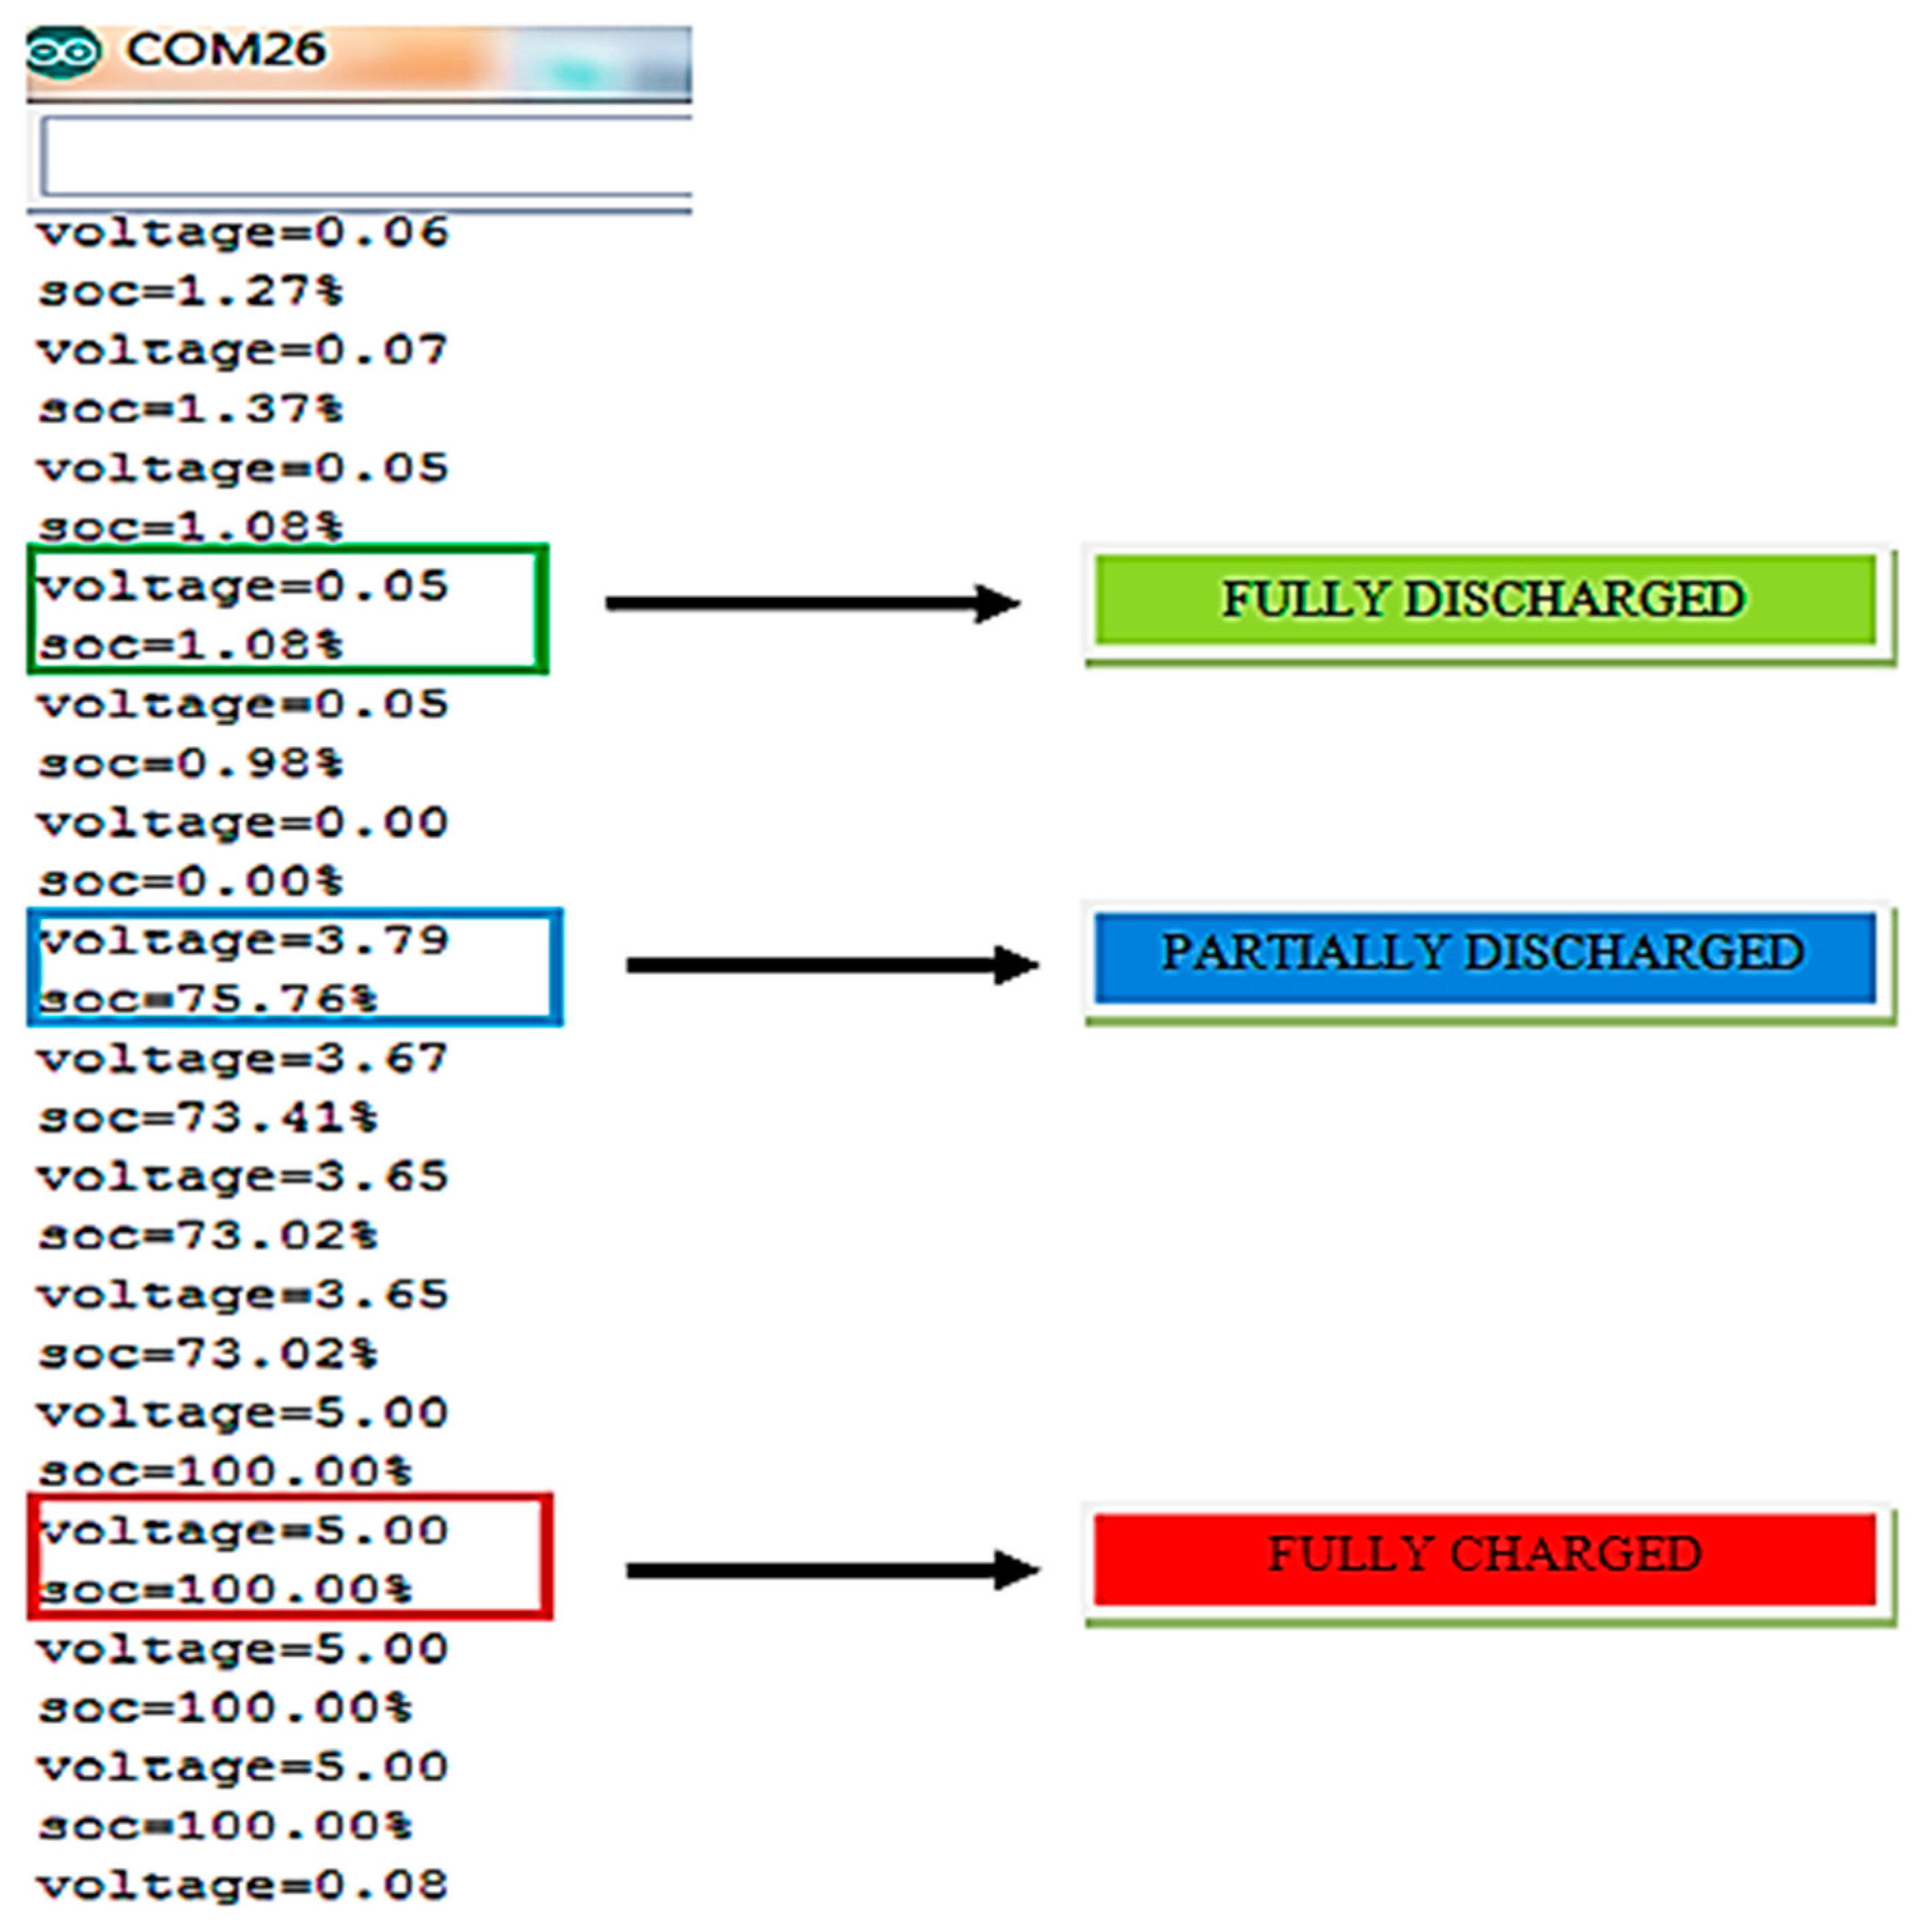
3. State of Charge Measurement
Coulomb Counting Method
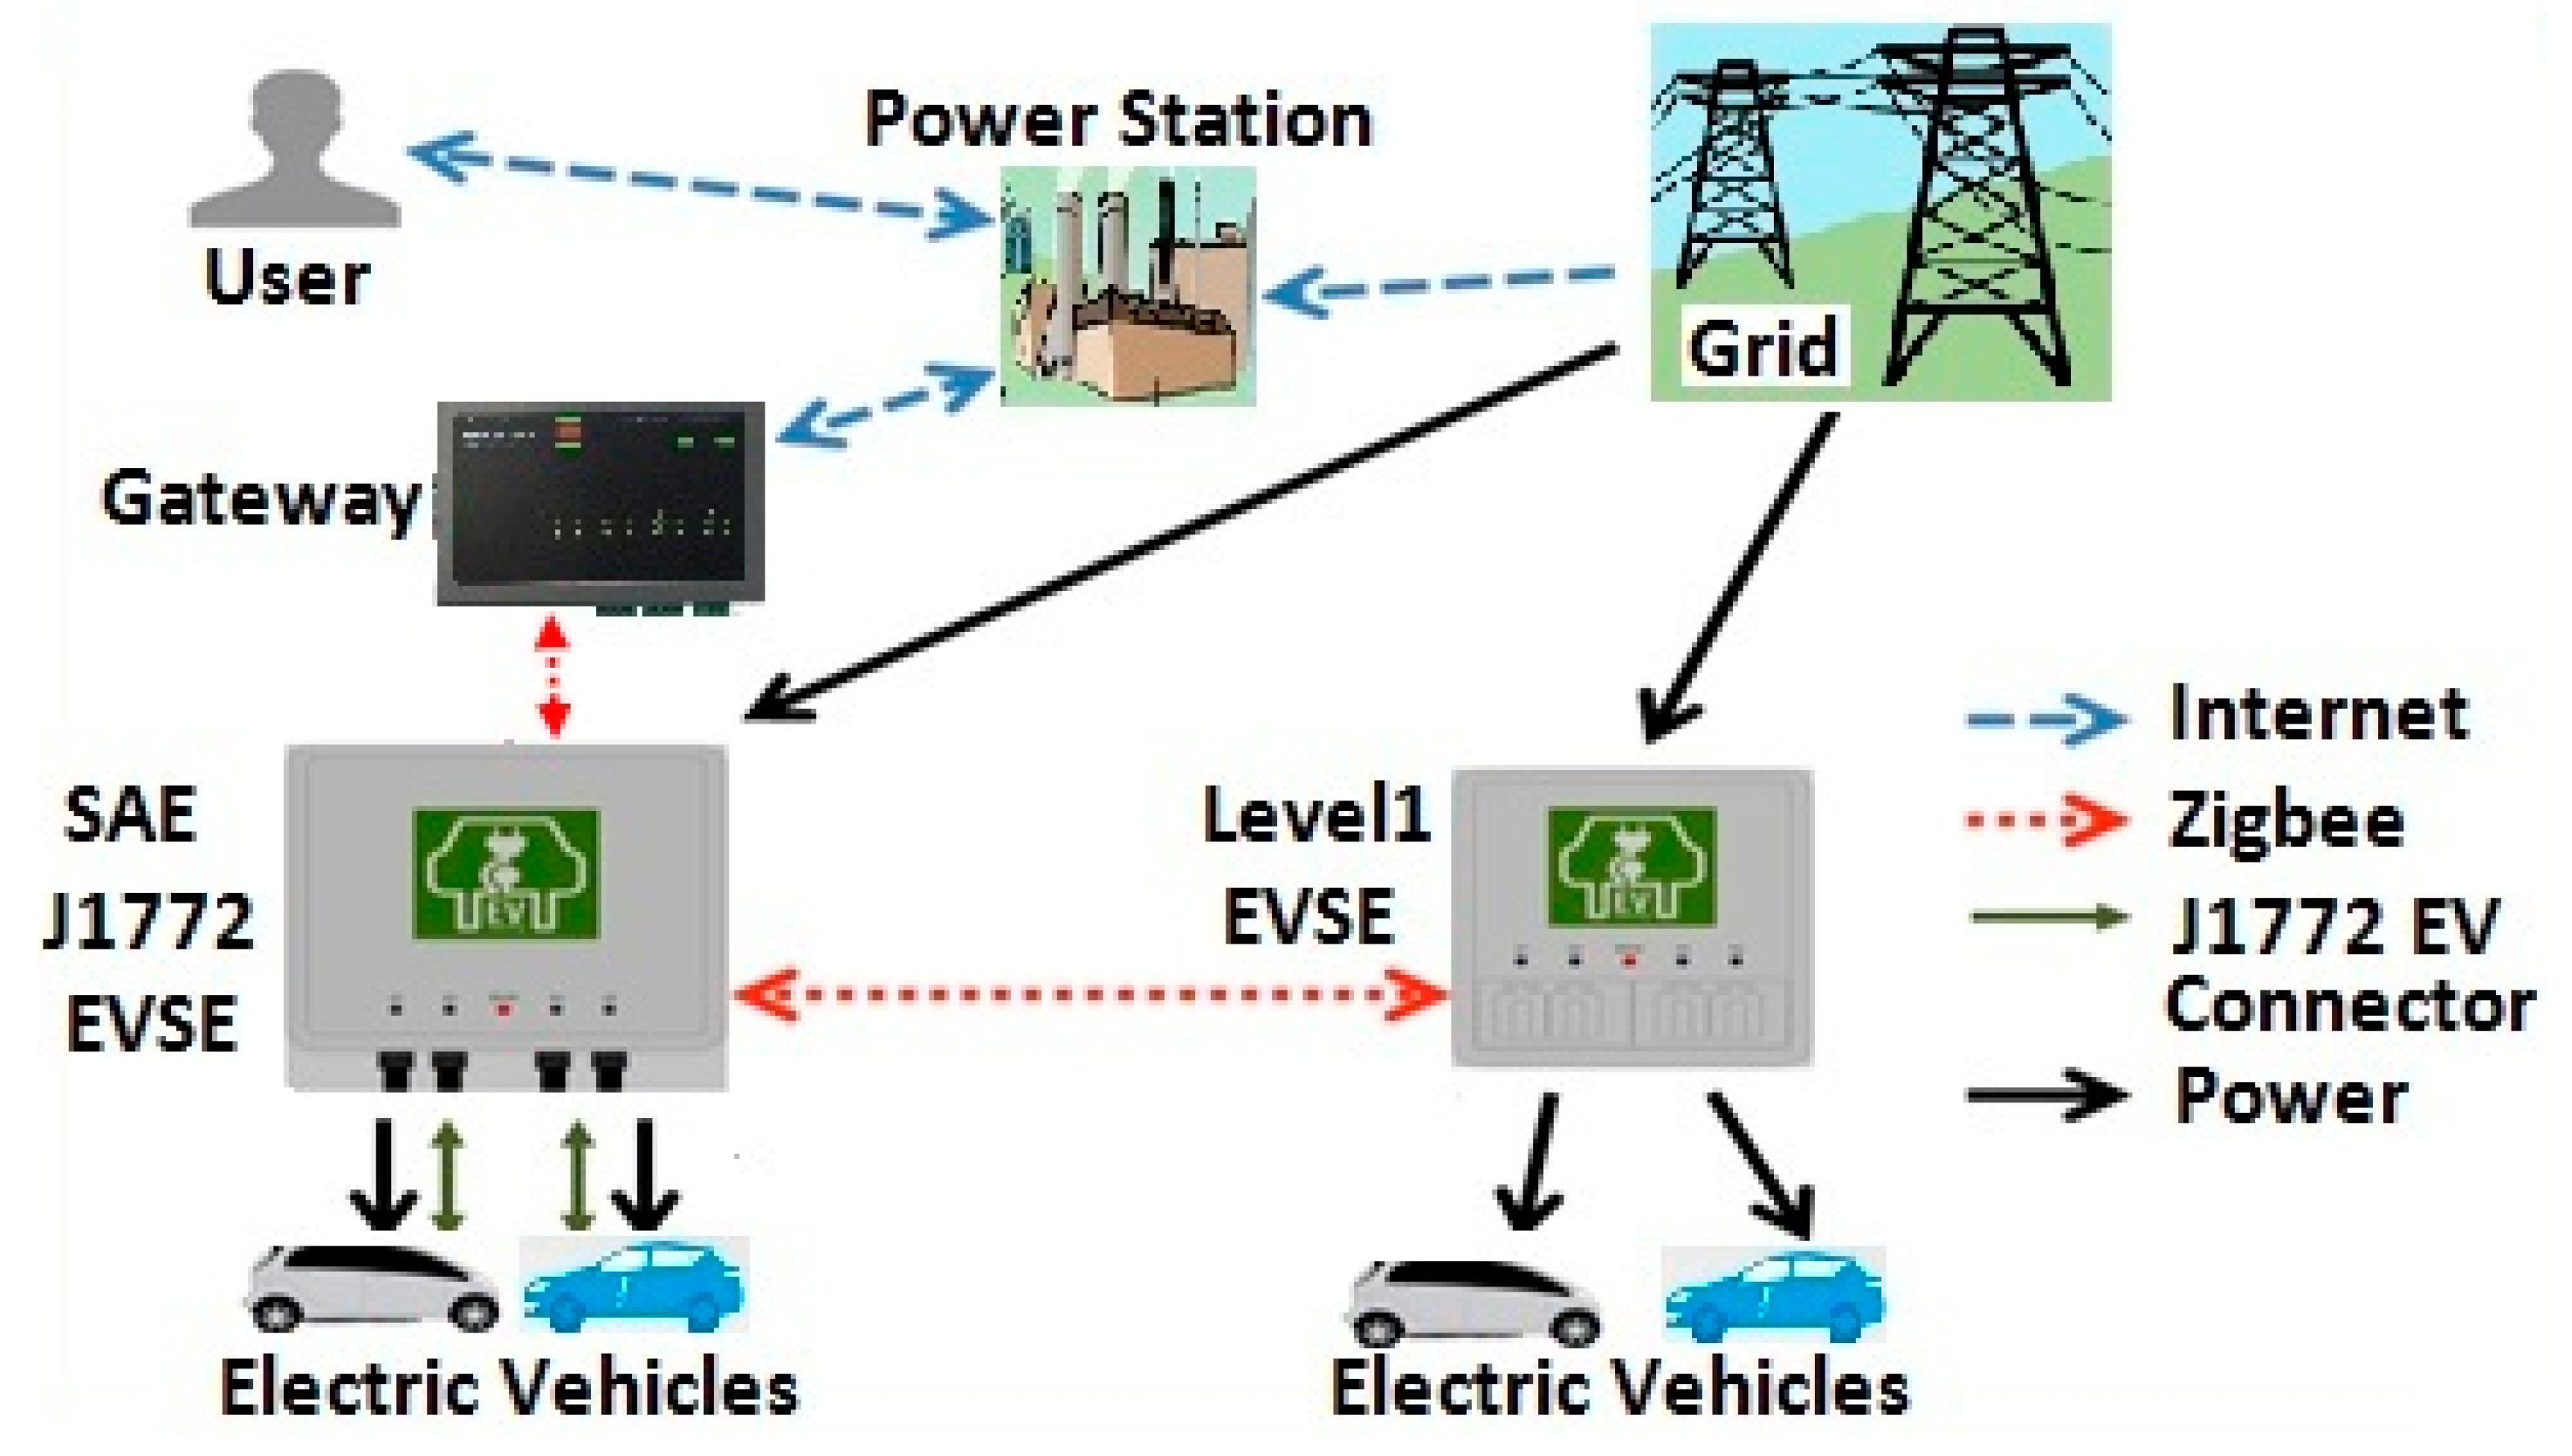
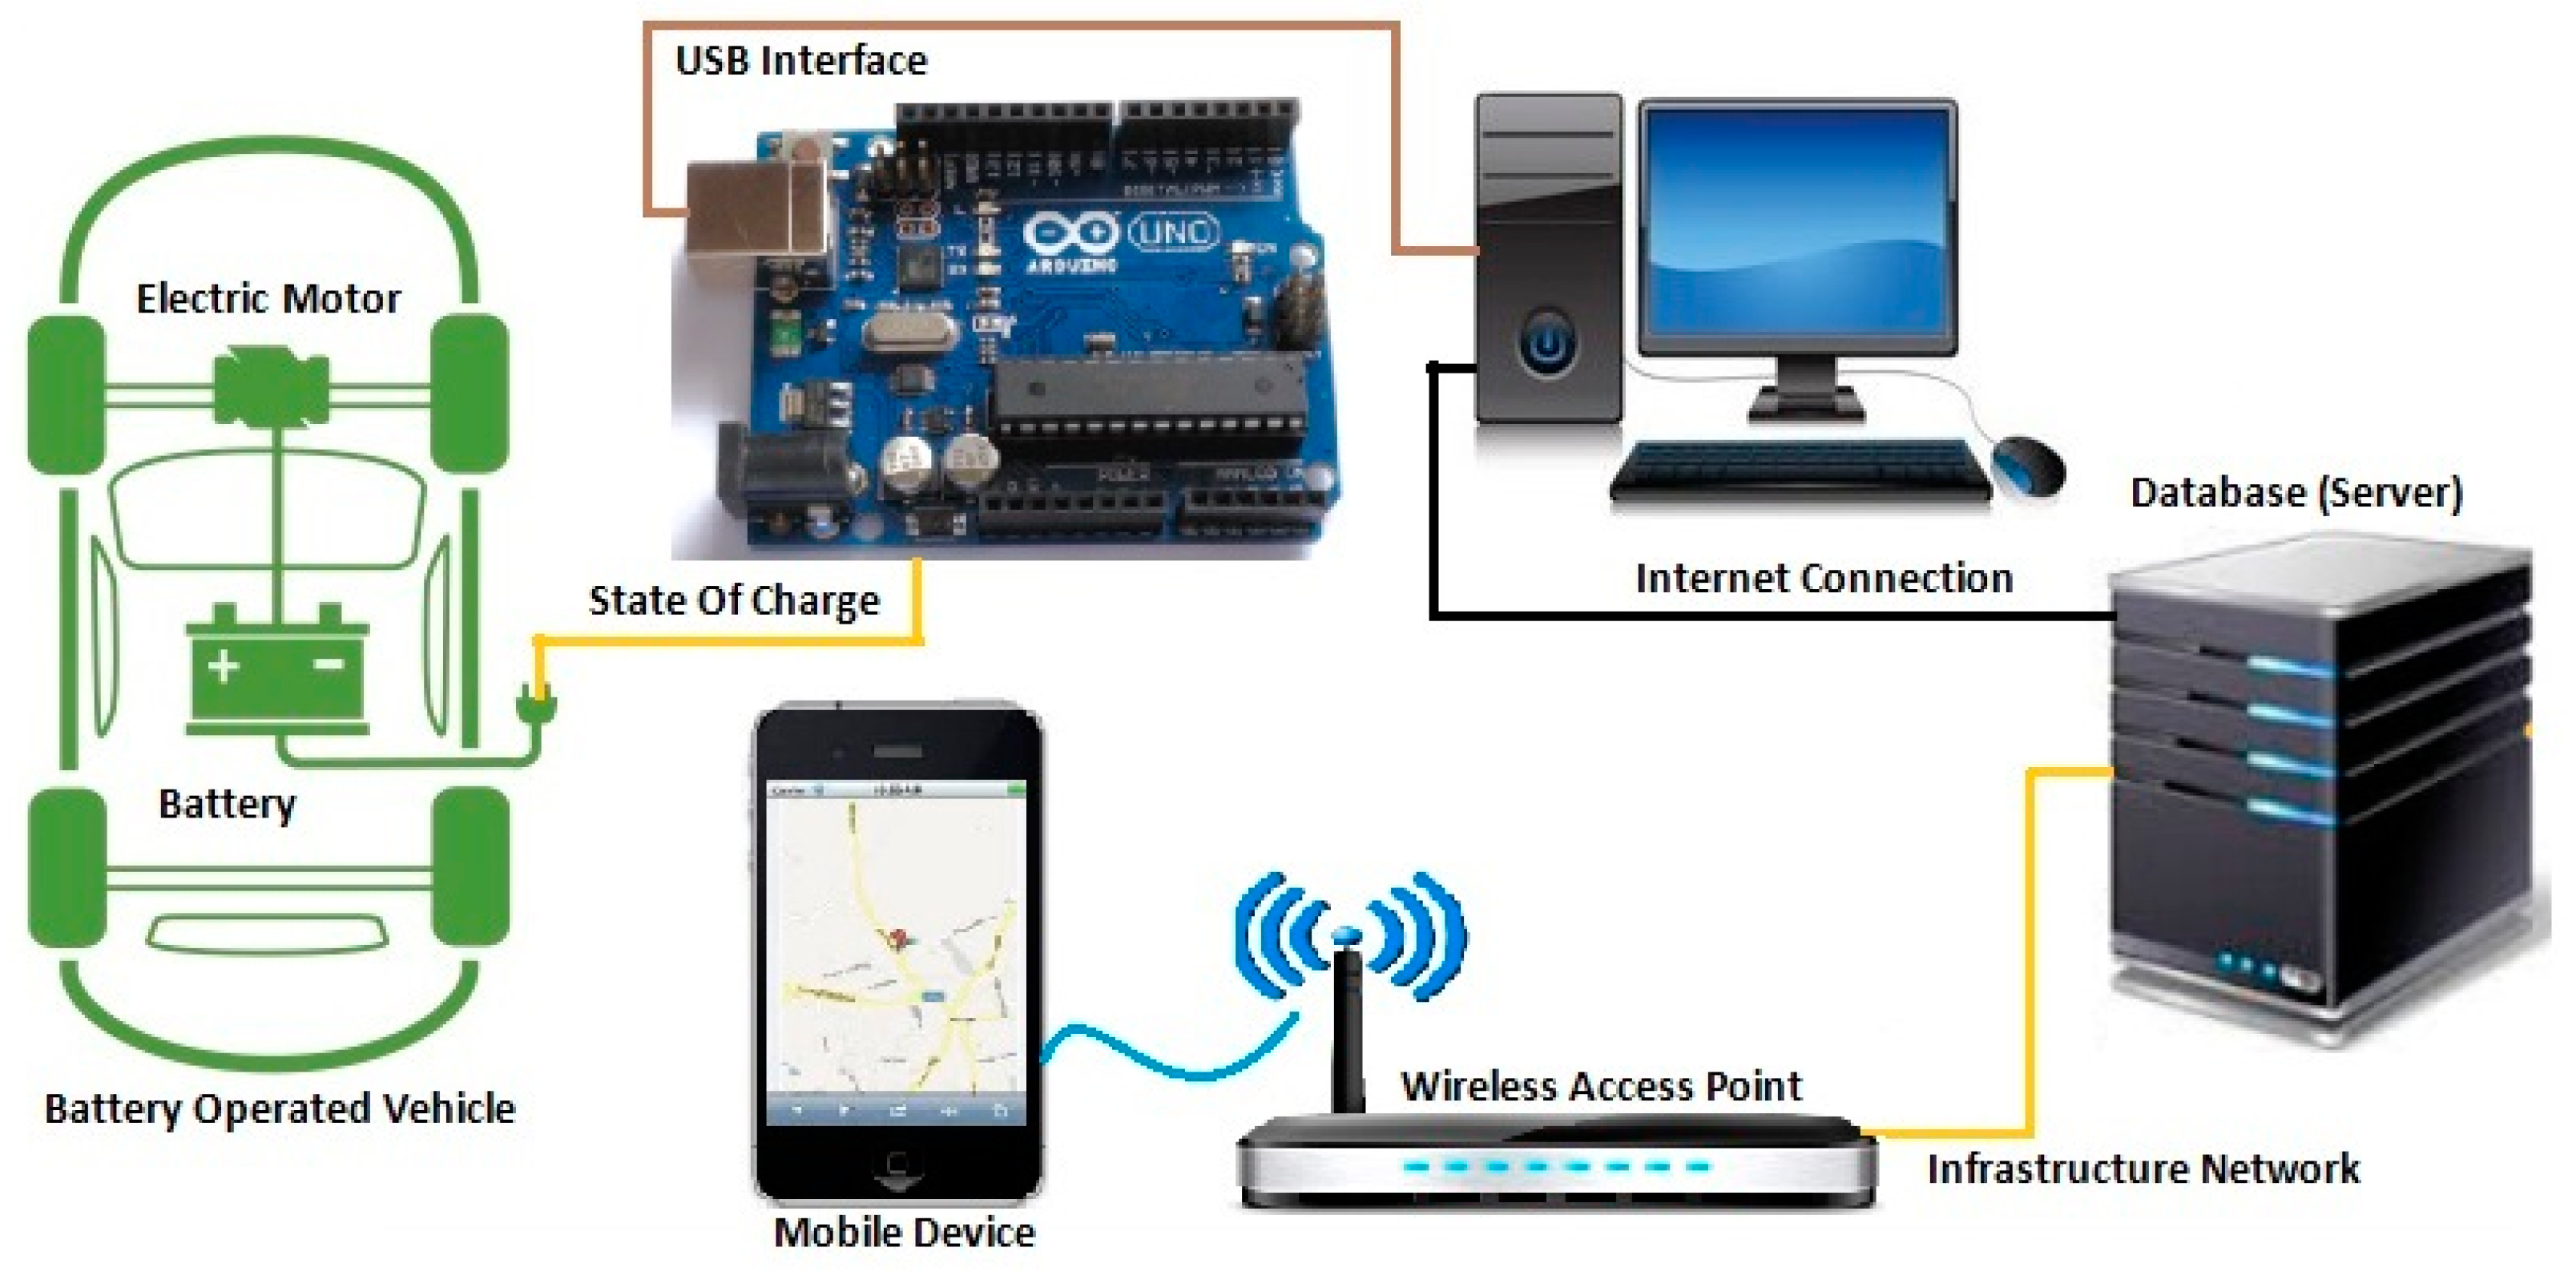
4. Communication Network Architecture
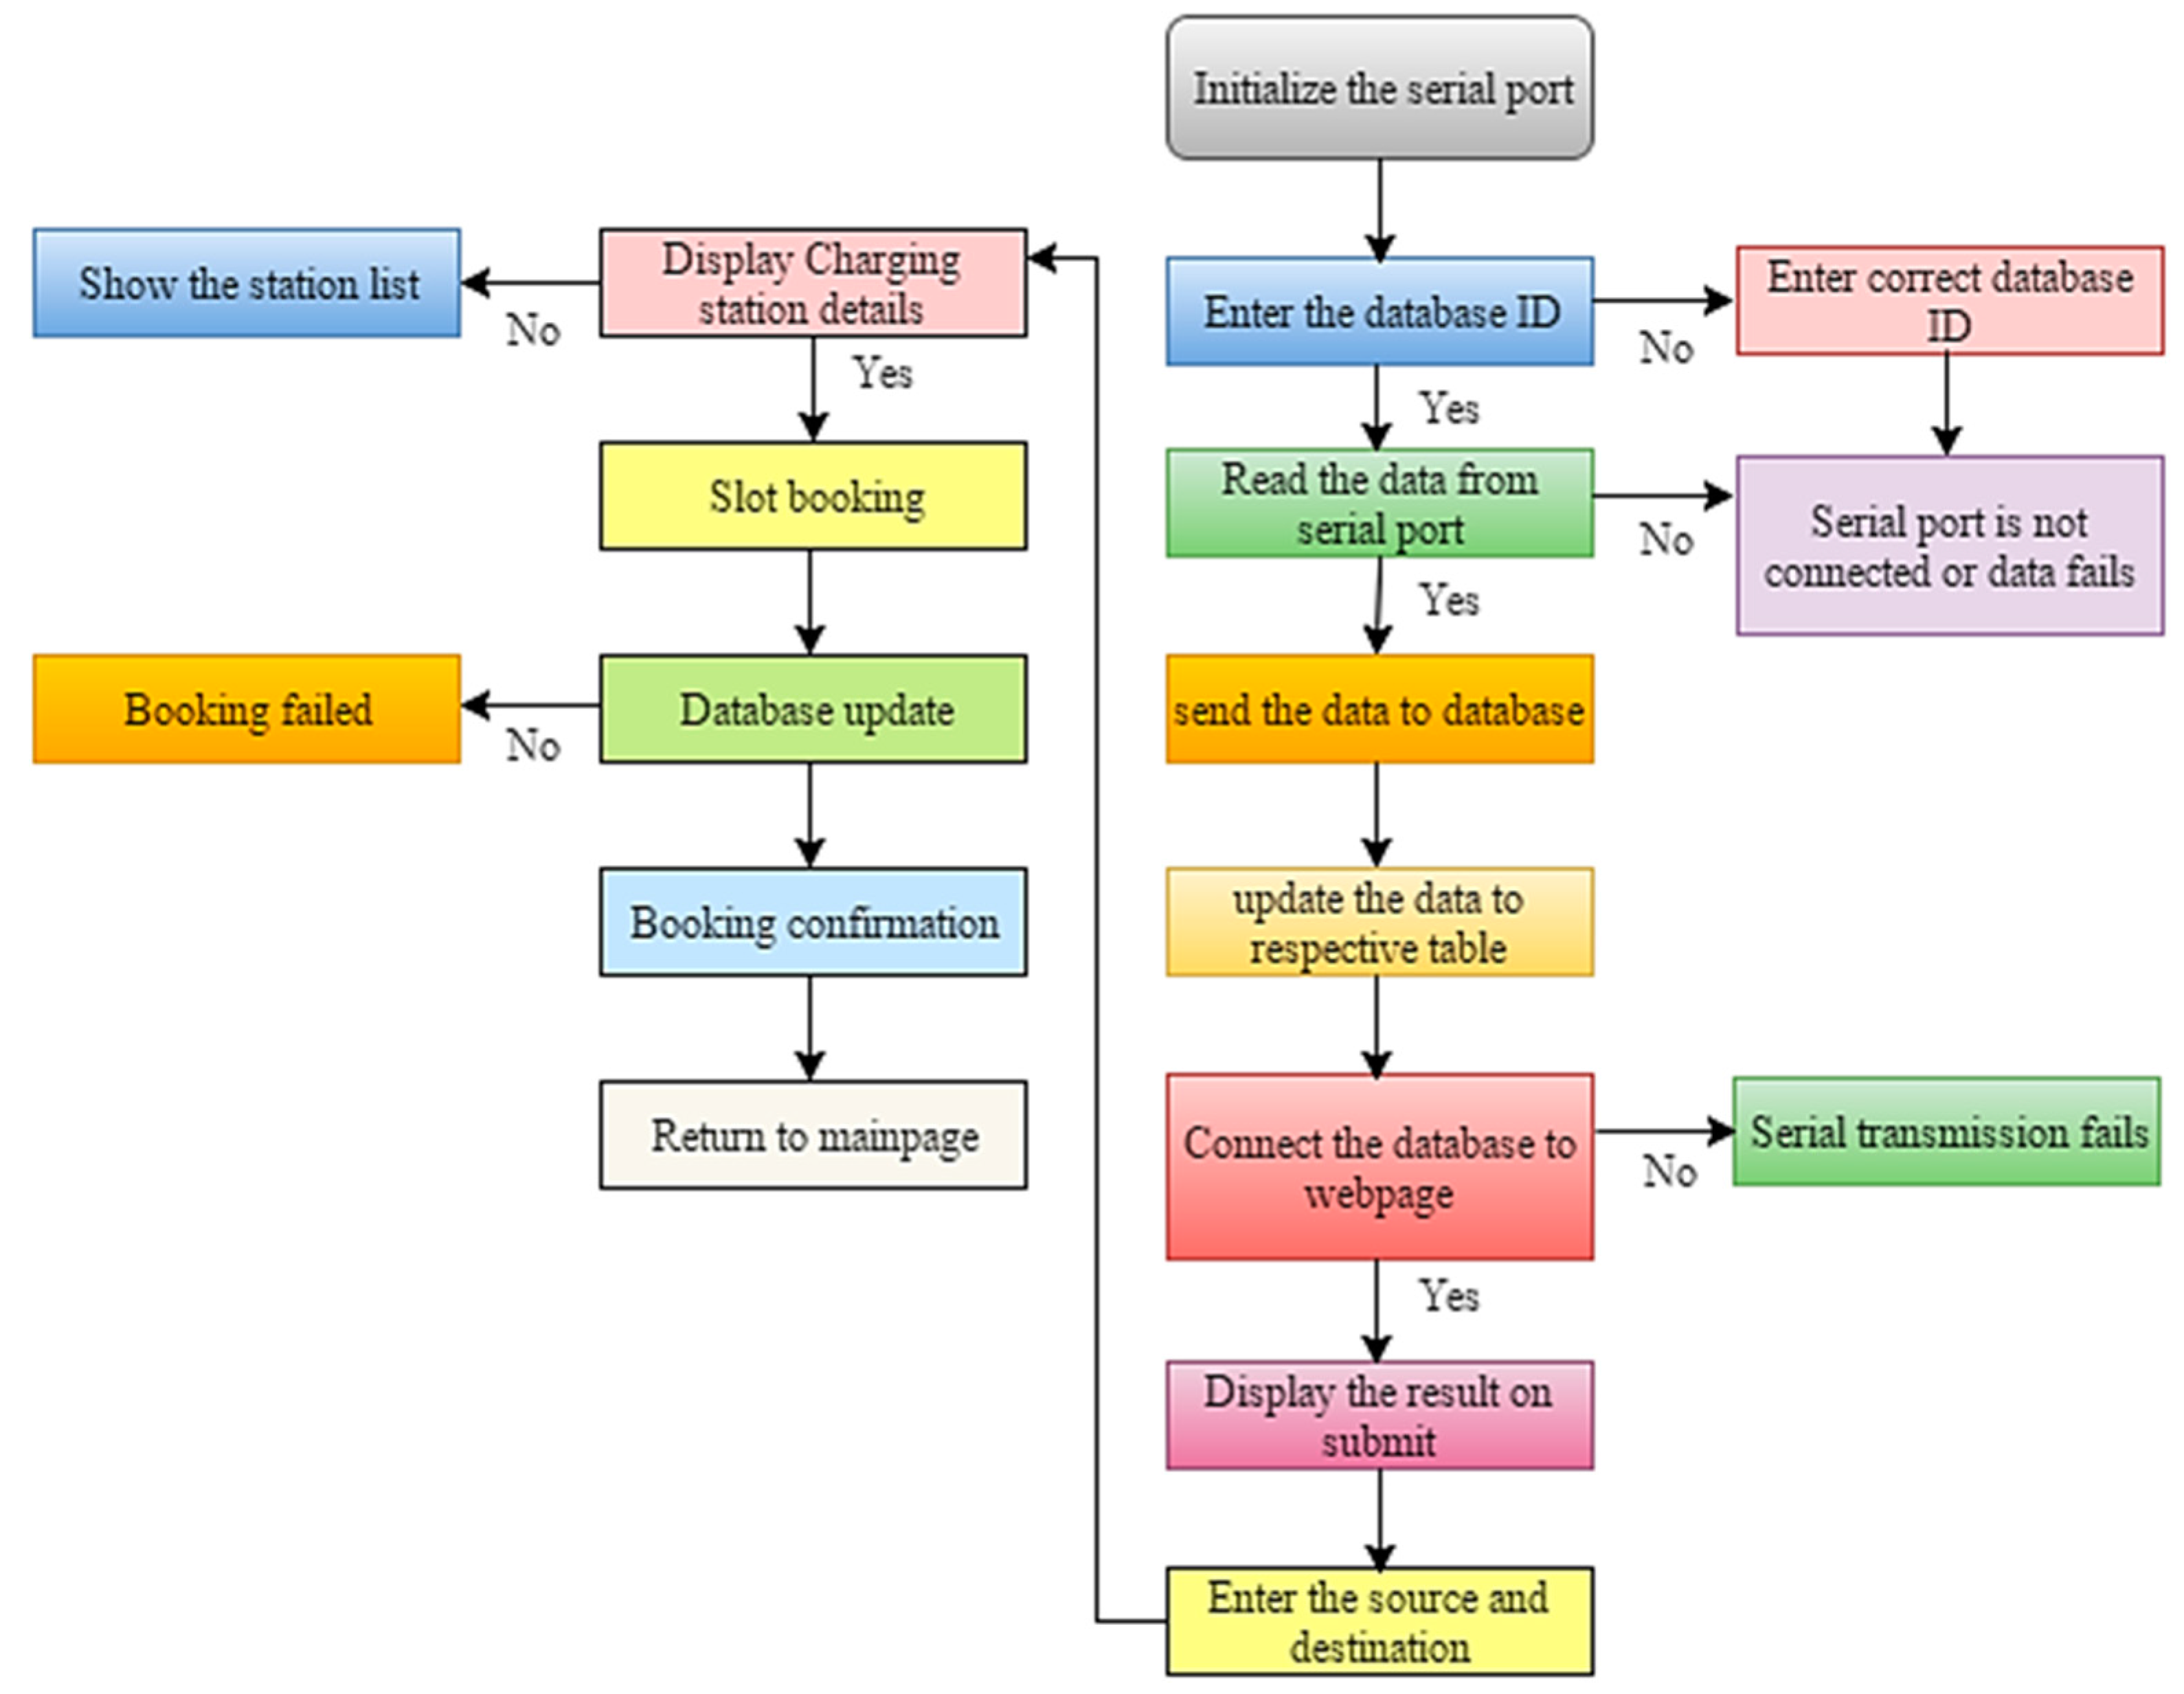
5. Algorithm for SOC Estimation and Database Creation
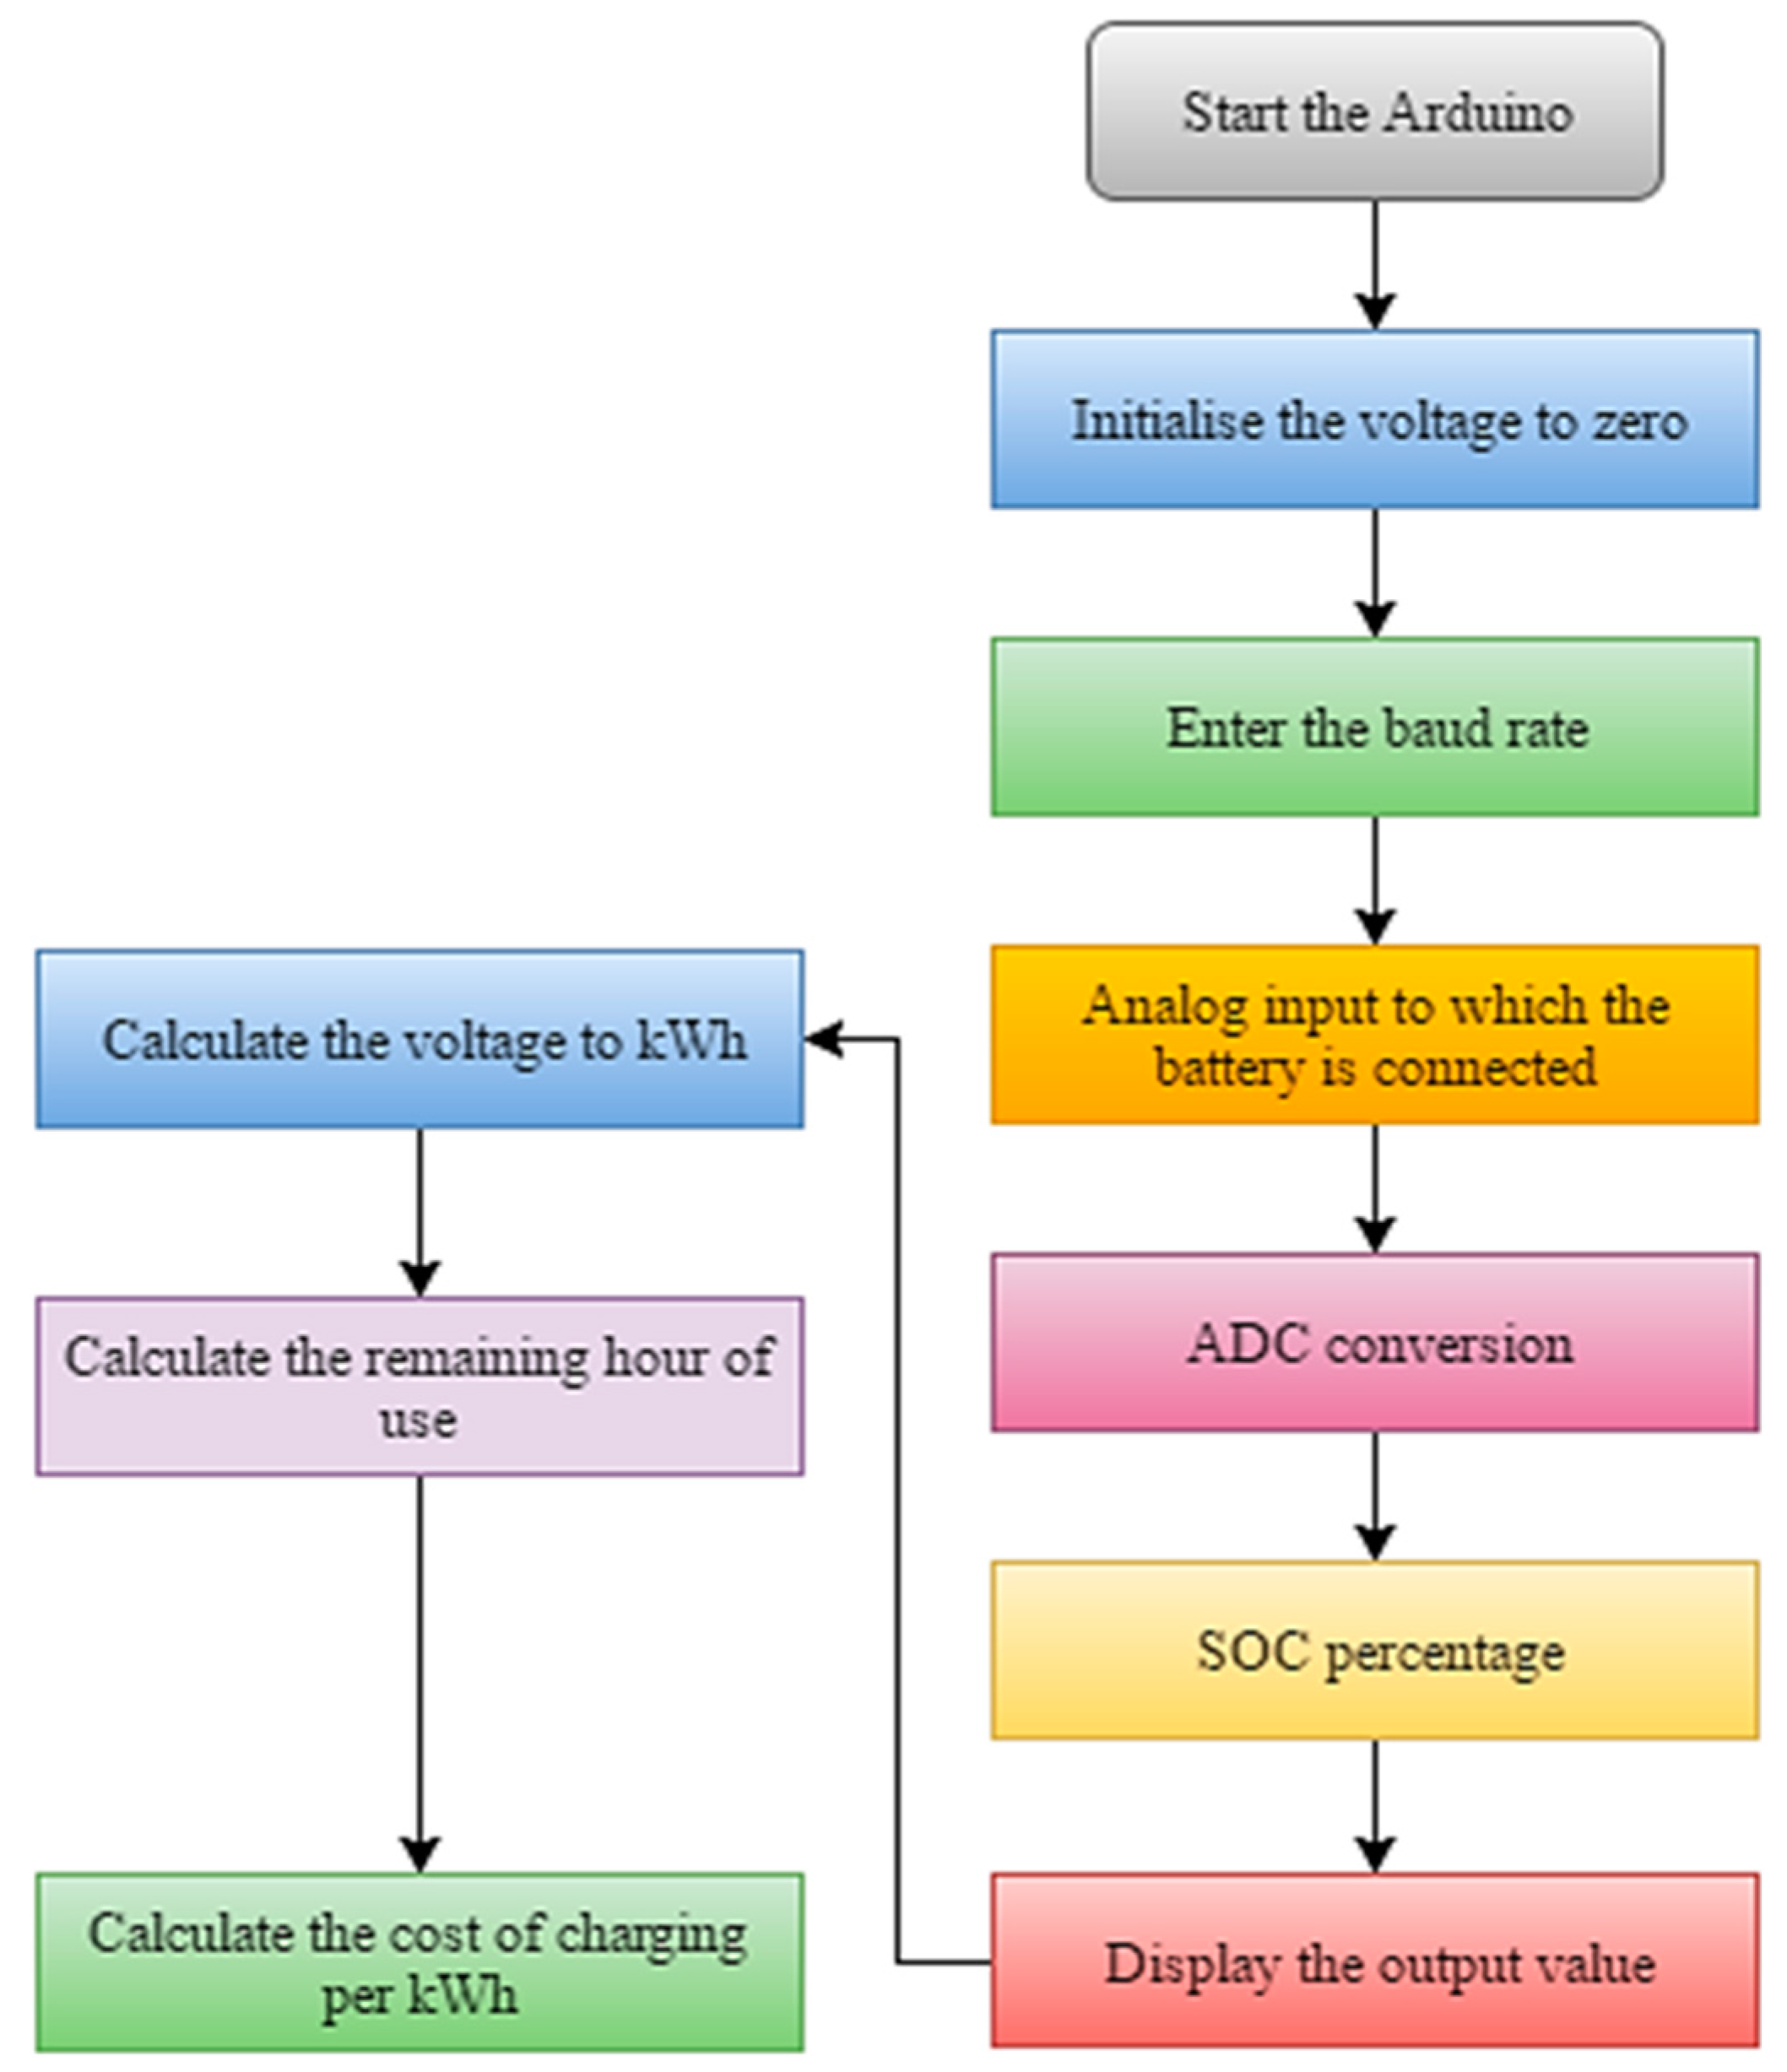
5.1. Algorithm & Flowchart for SOC Estimation as Shown in Figure 7
- Step 1:
- Initialize the Arduino and set the voltage to zero
- Step 2:
- Set the baud rate to establish communication between the Arduino and PC
- Step 3:
- After determining the Amp hour of the Li-ion battery that will feed into the analog pin of the Arduino its equivalent digital value (ADC Value) is stored in it.
- Step 4:
- Based on the updated battery status, the remaining usage hours of the battery will be computed
- Step 5:
- Cost of charging will vary depending on the charging distance and time
- Step 6:
- Repeat from Step3
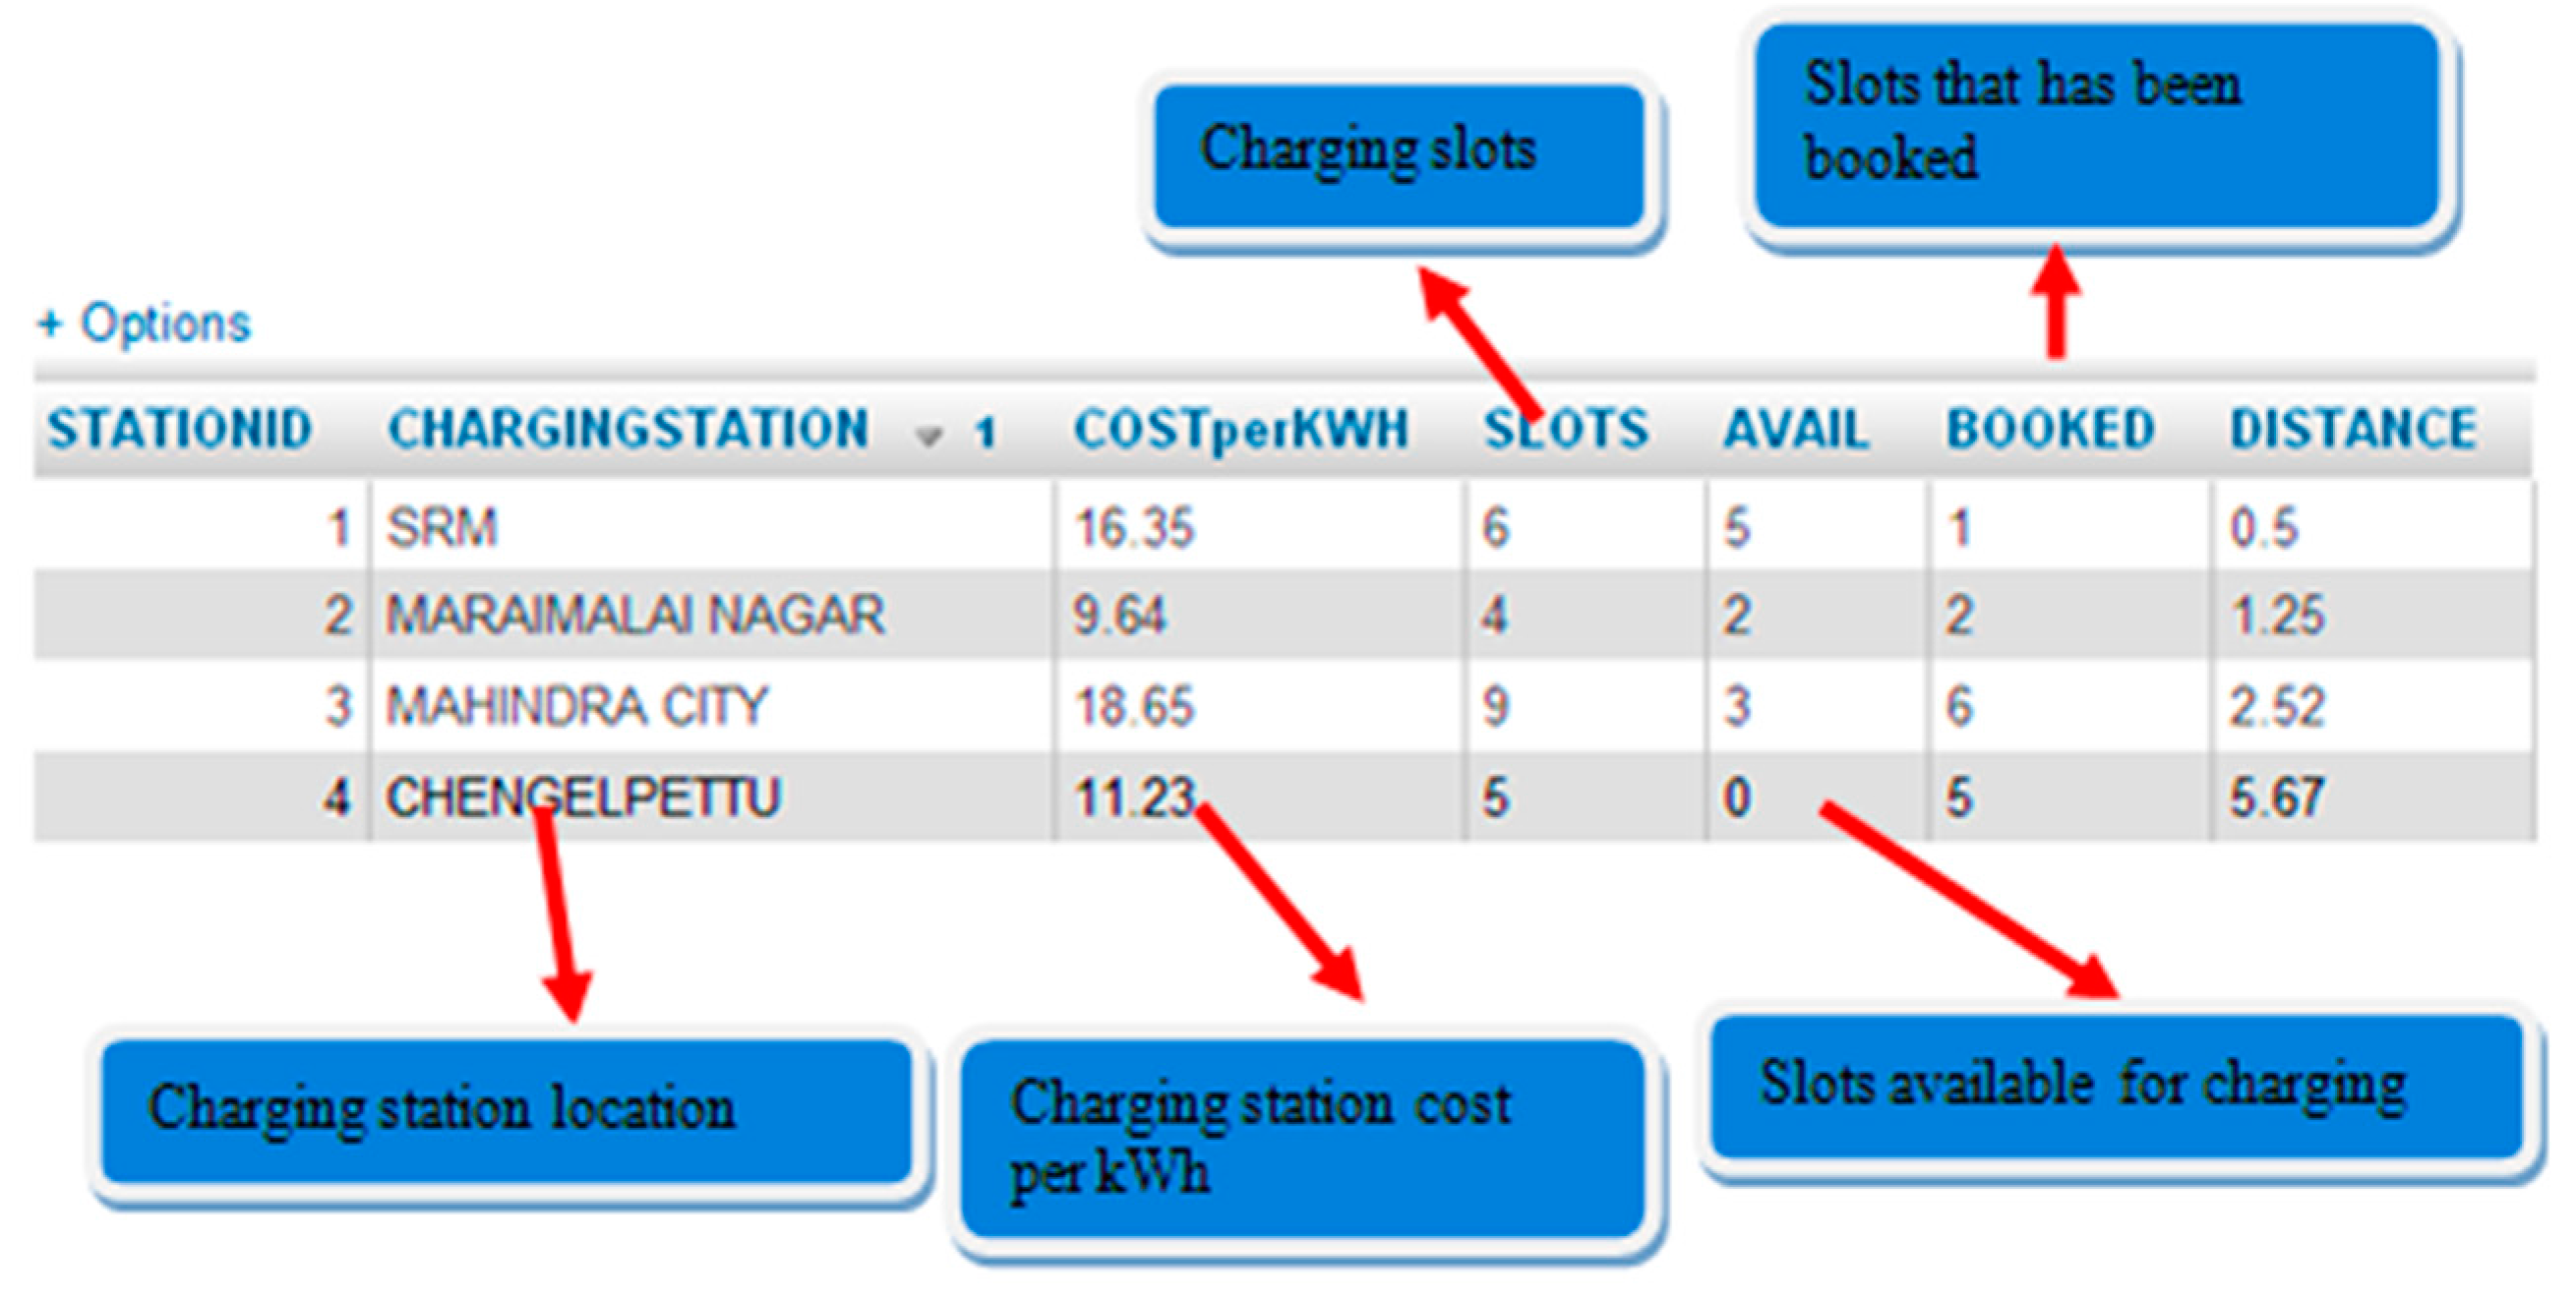
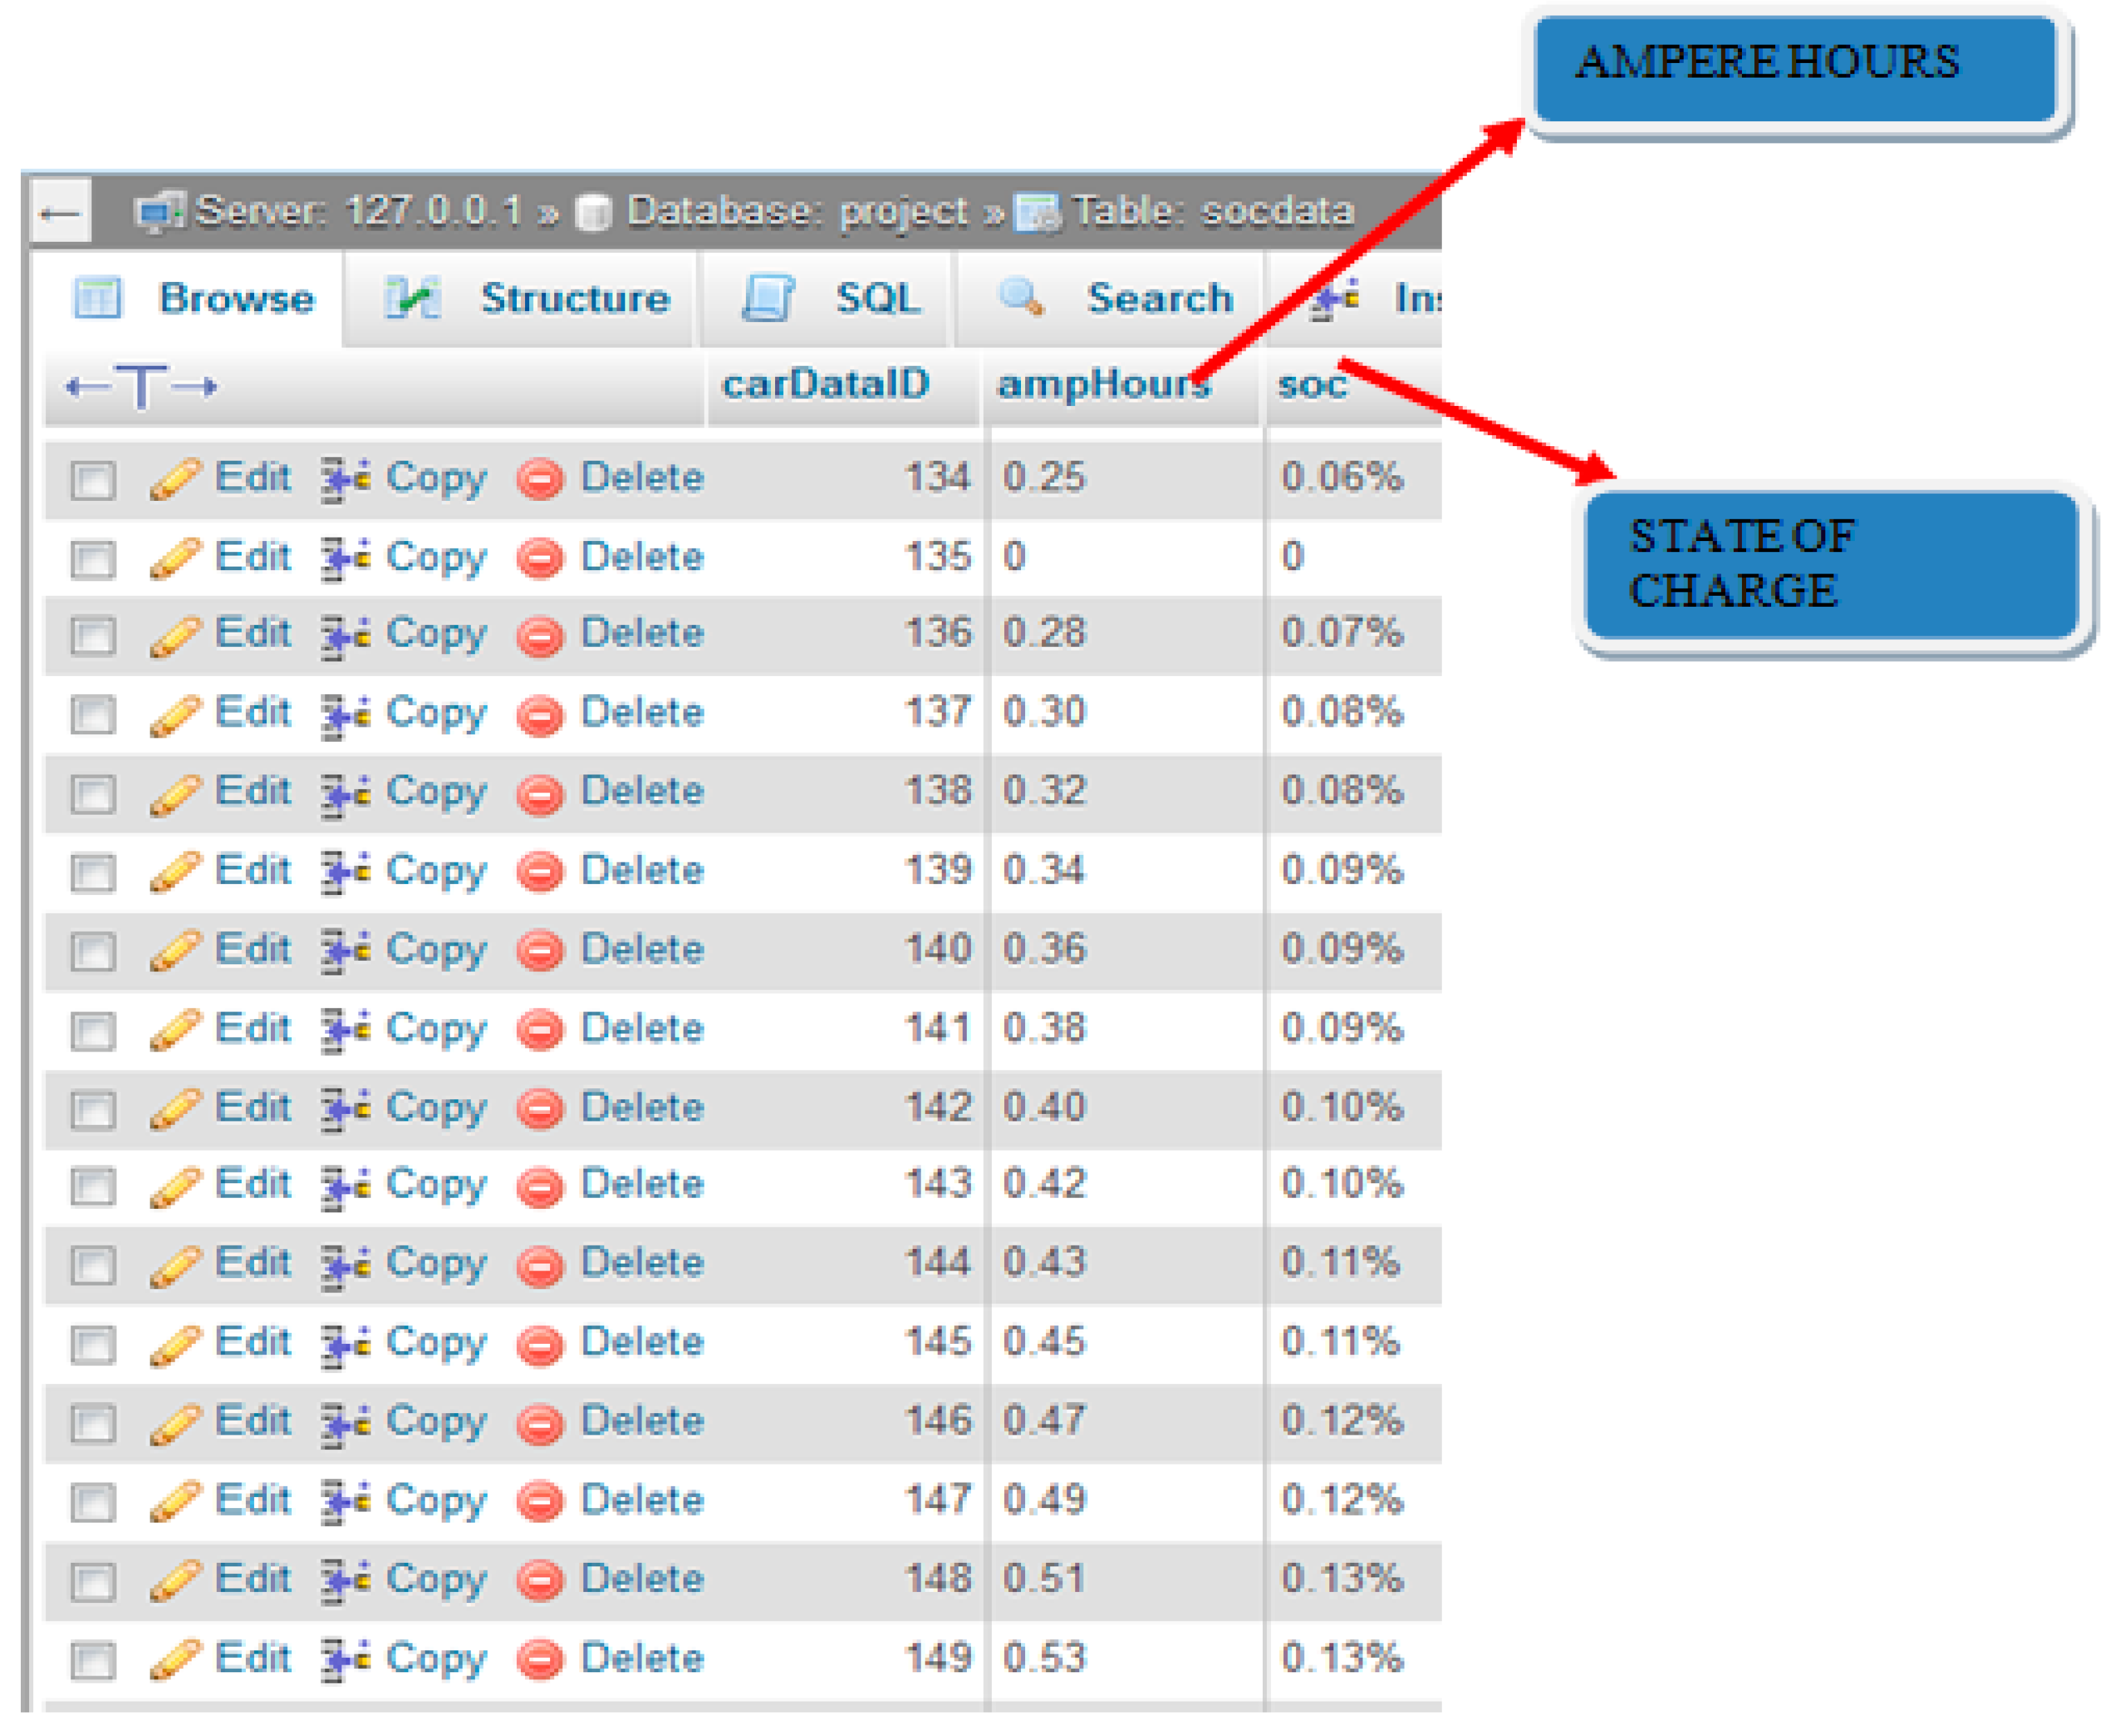
5.2. Database Creation
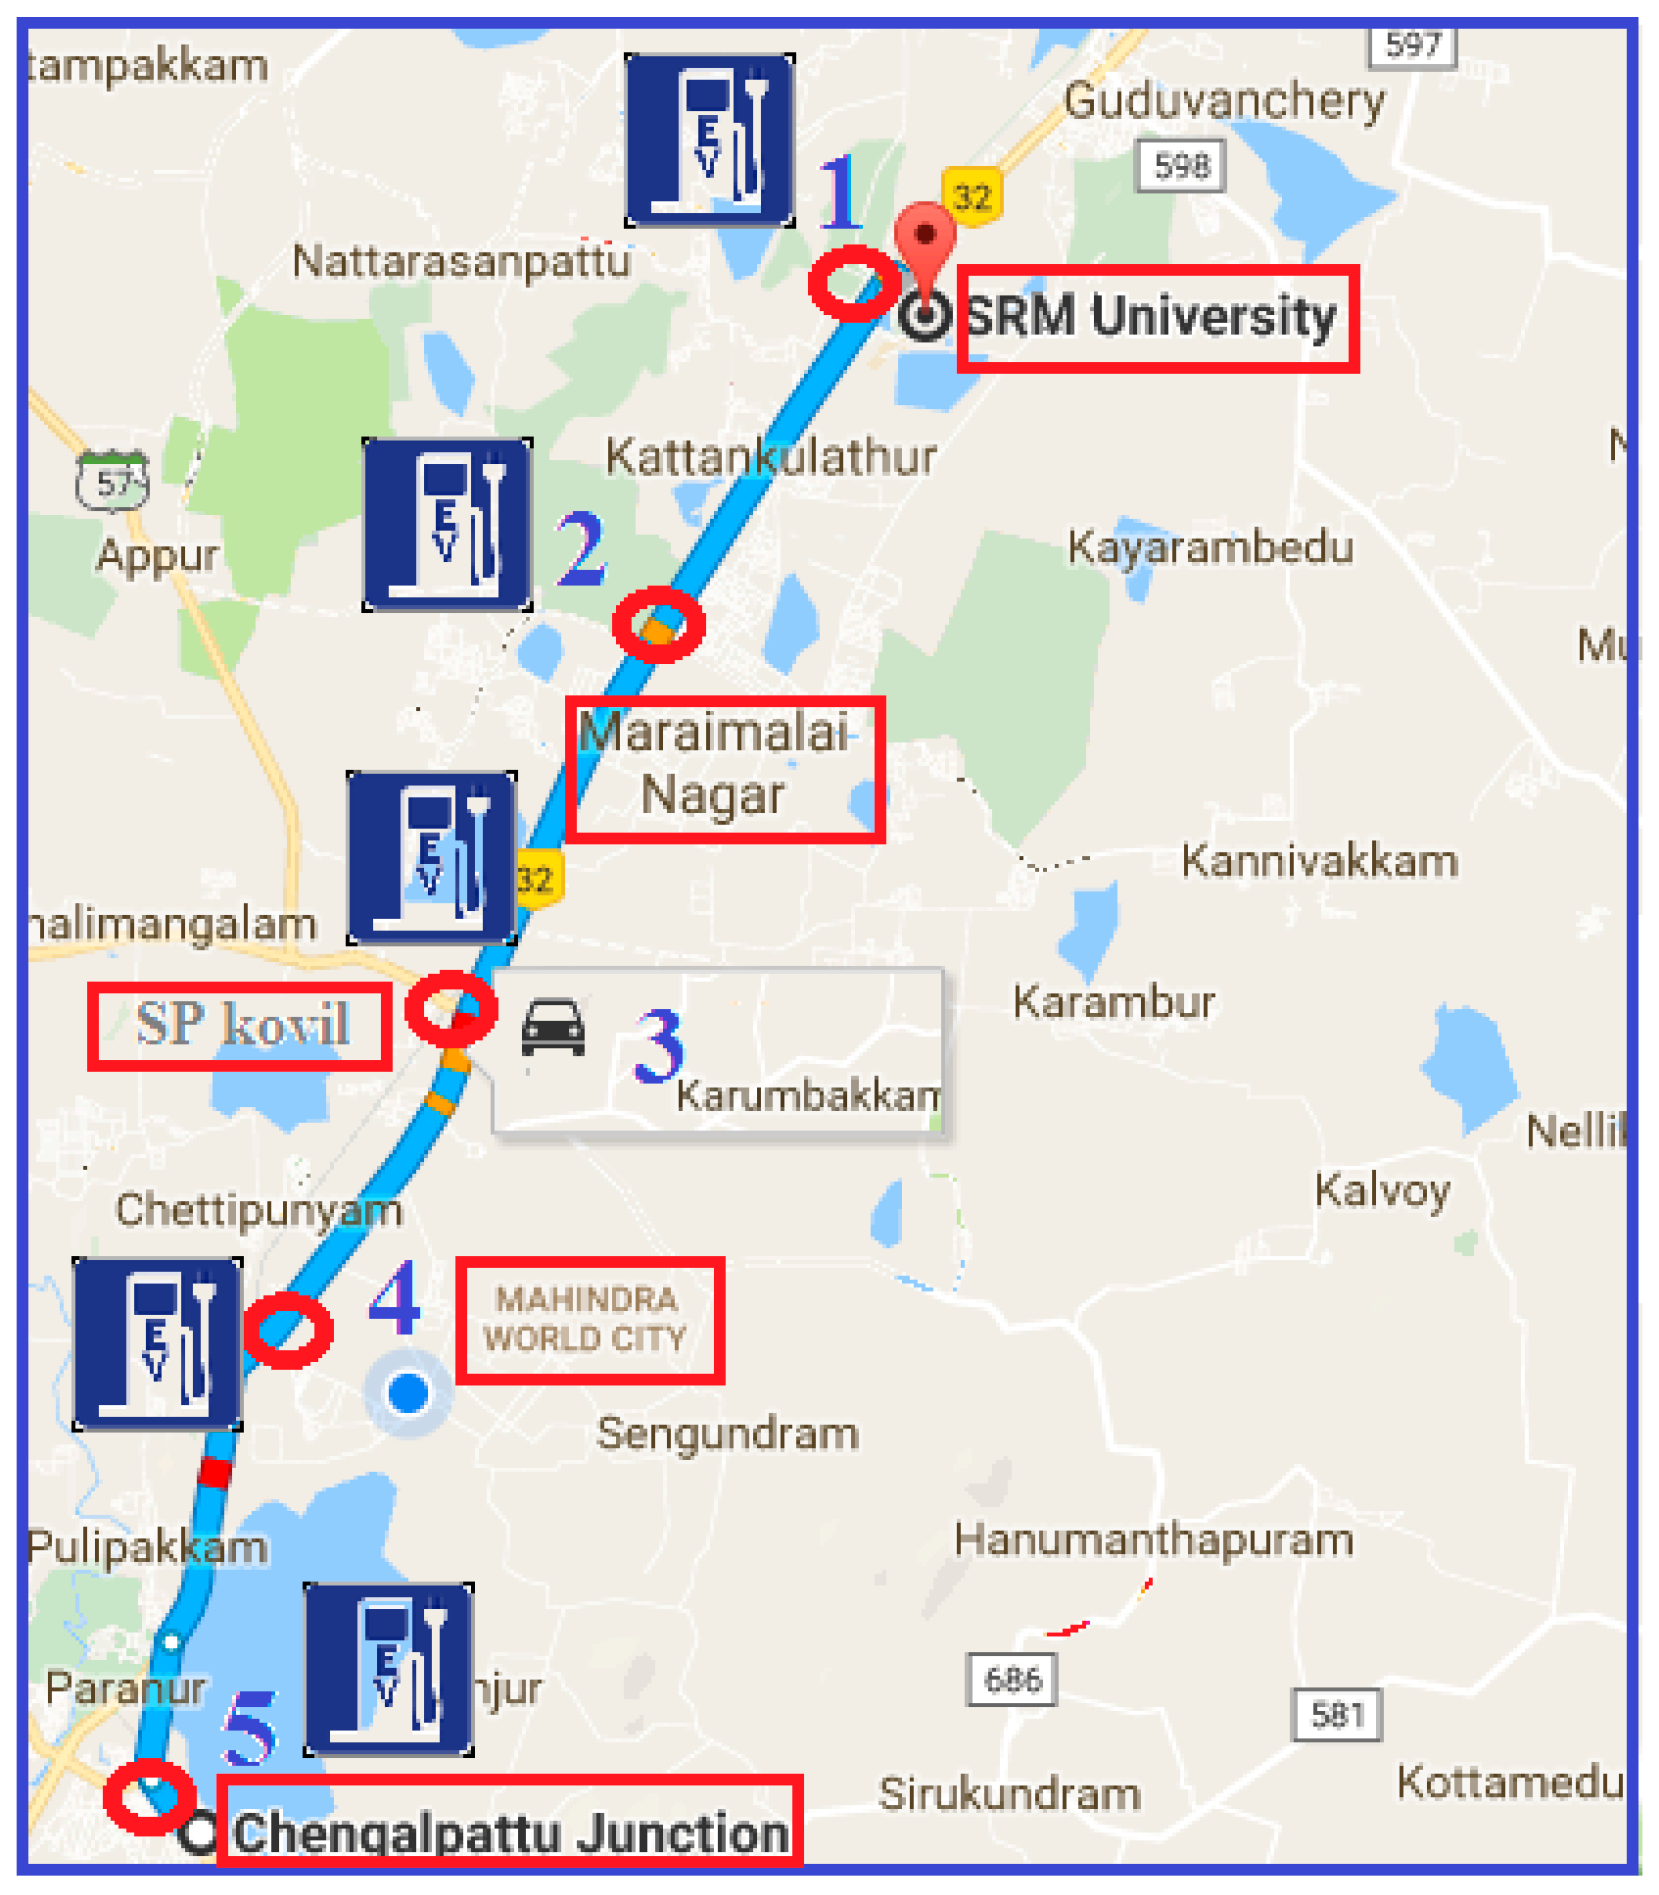
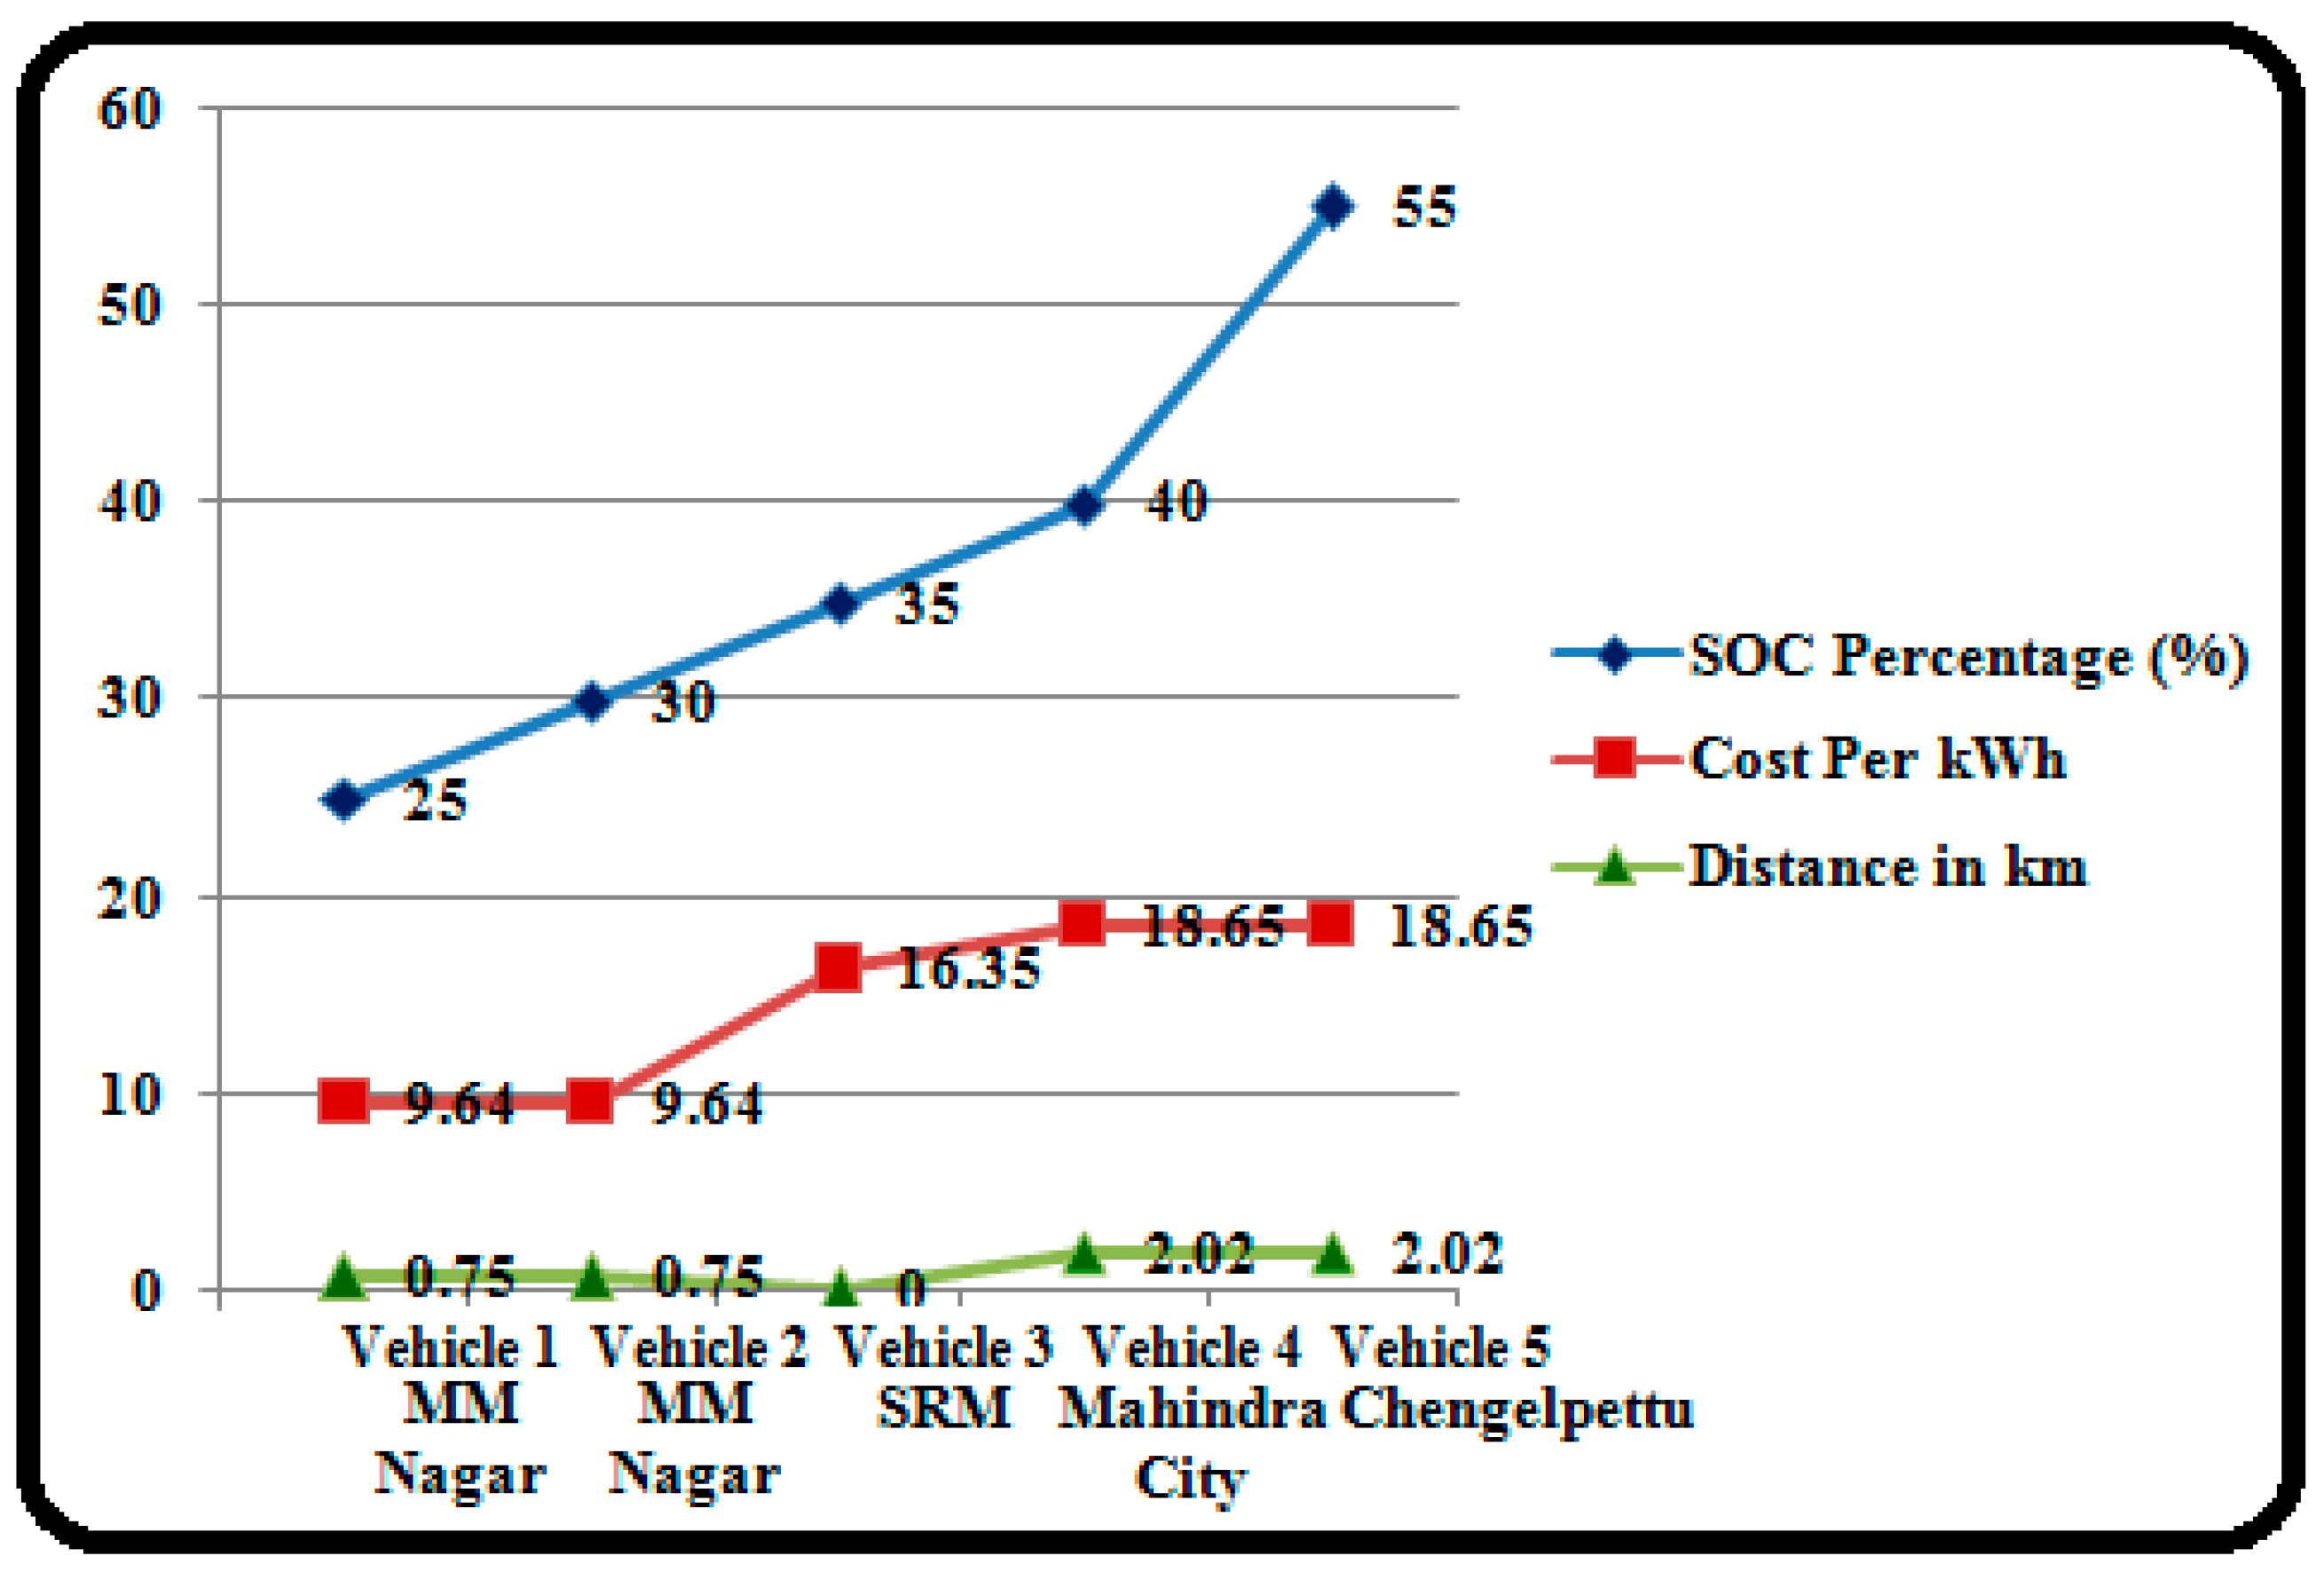
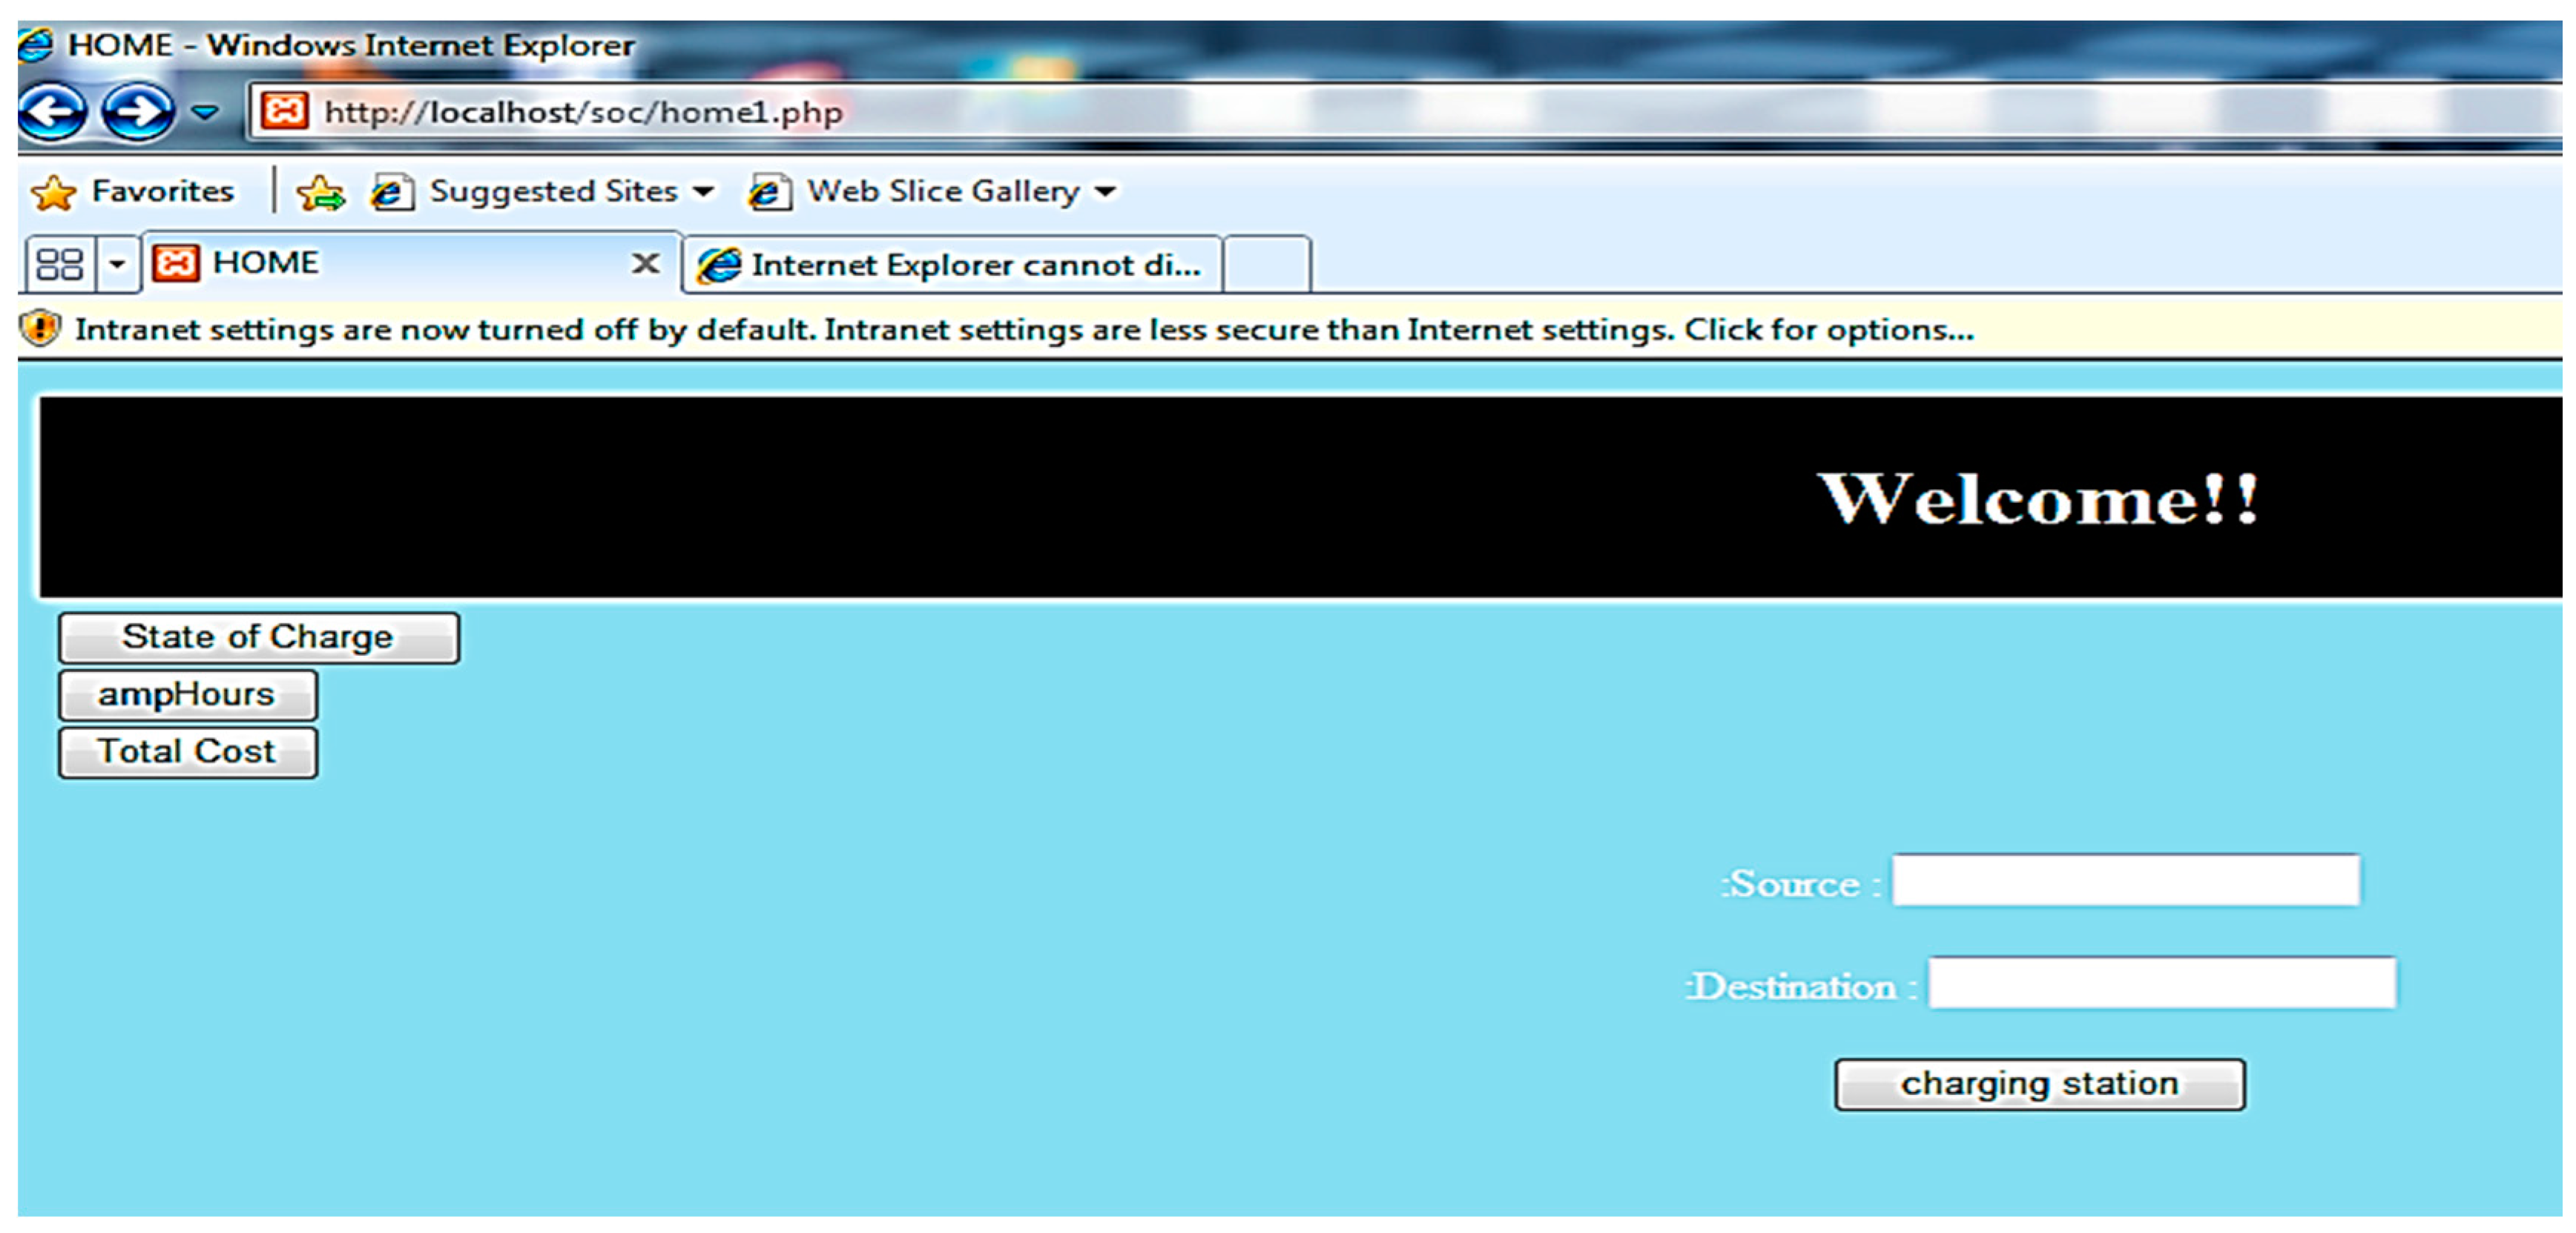
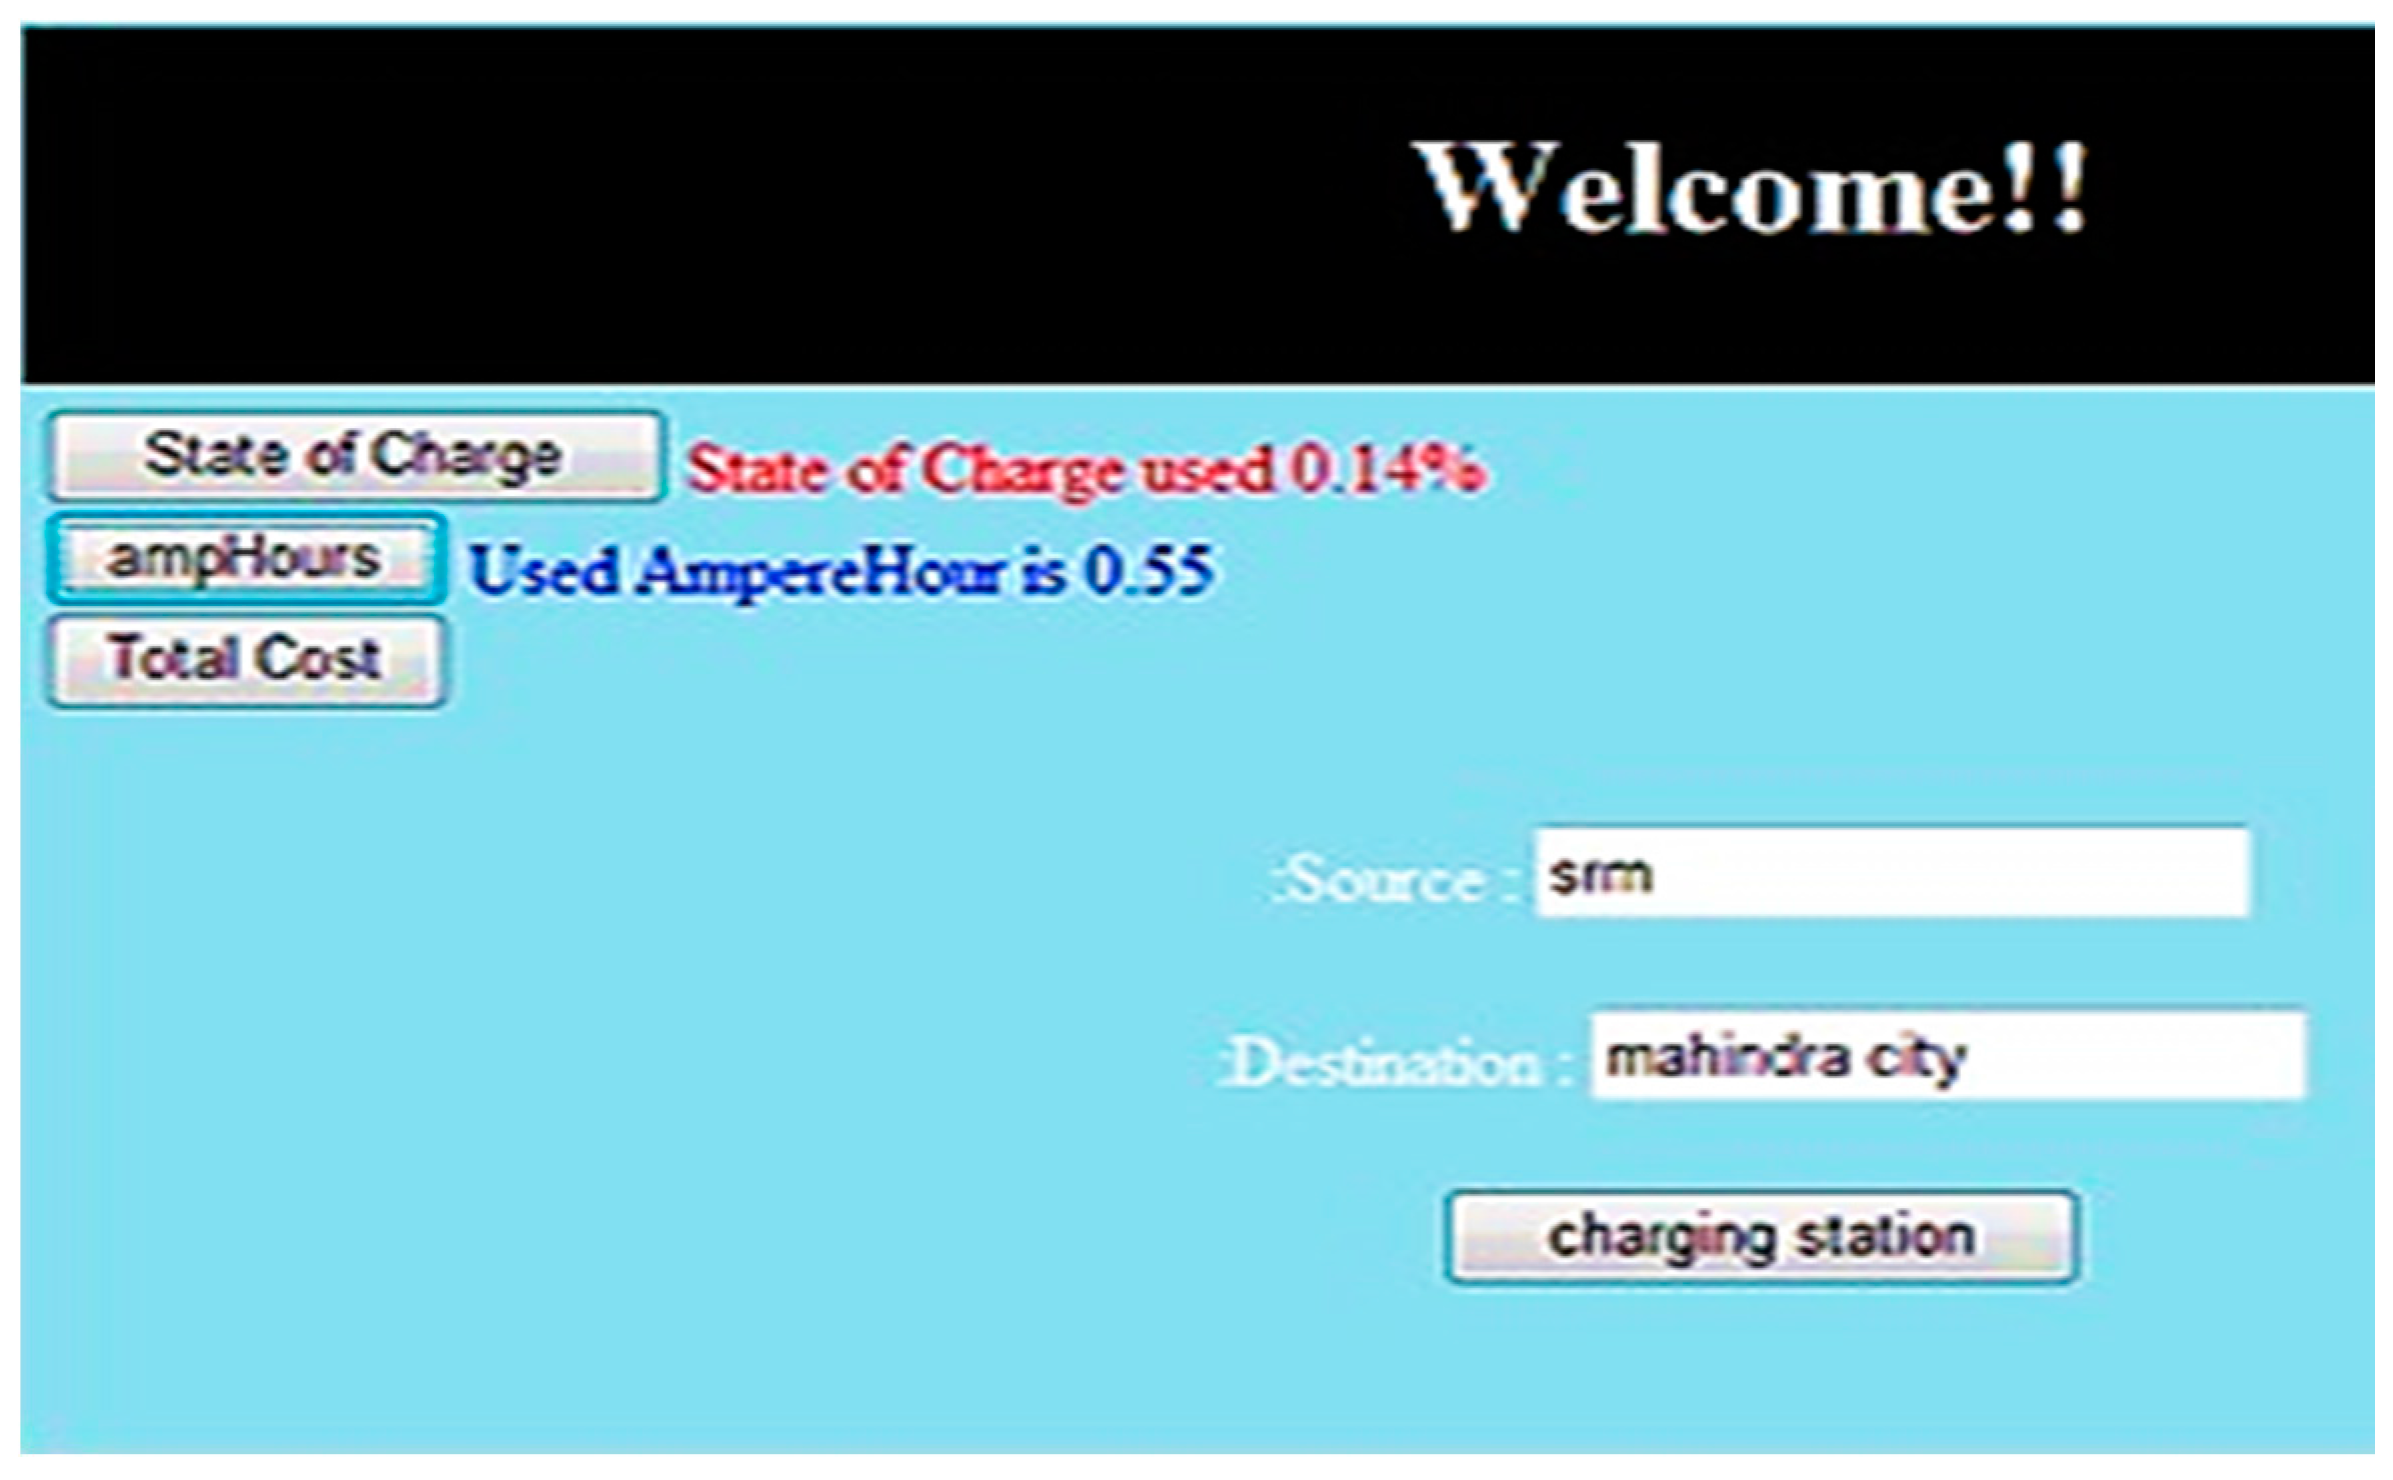
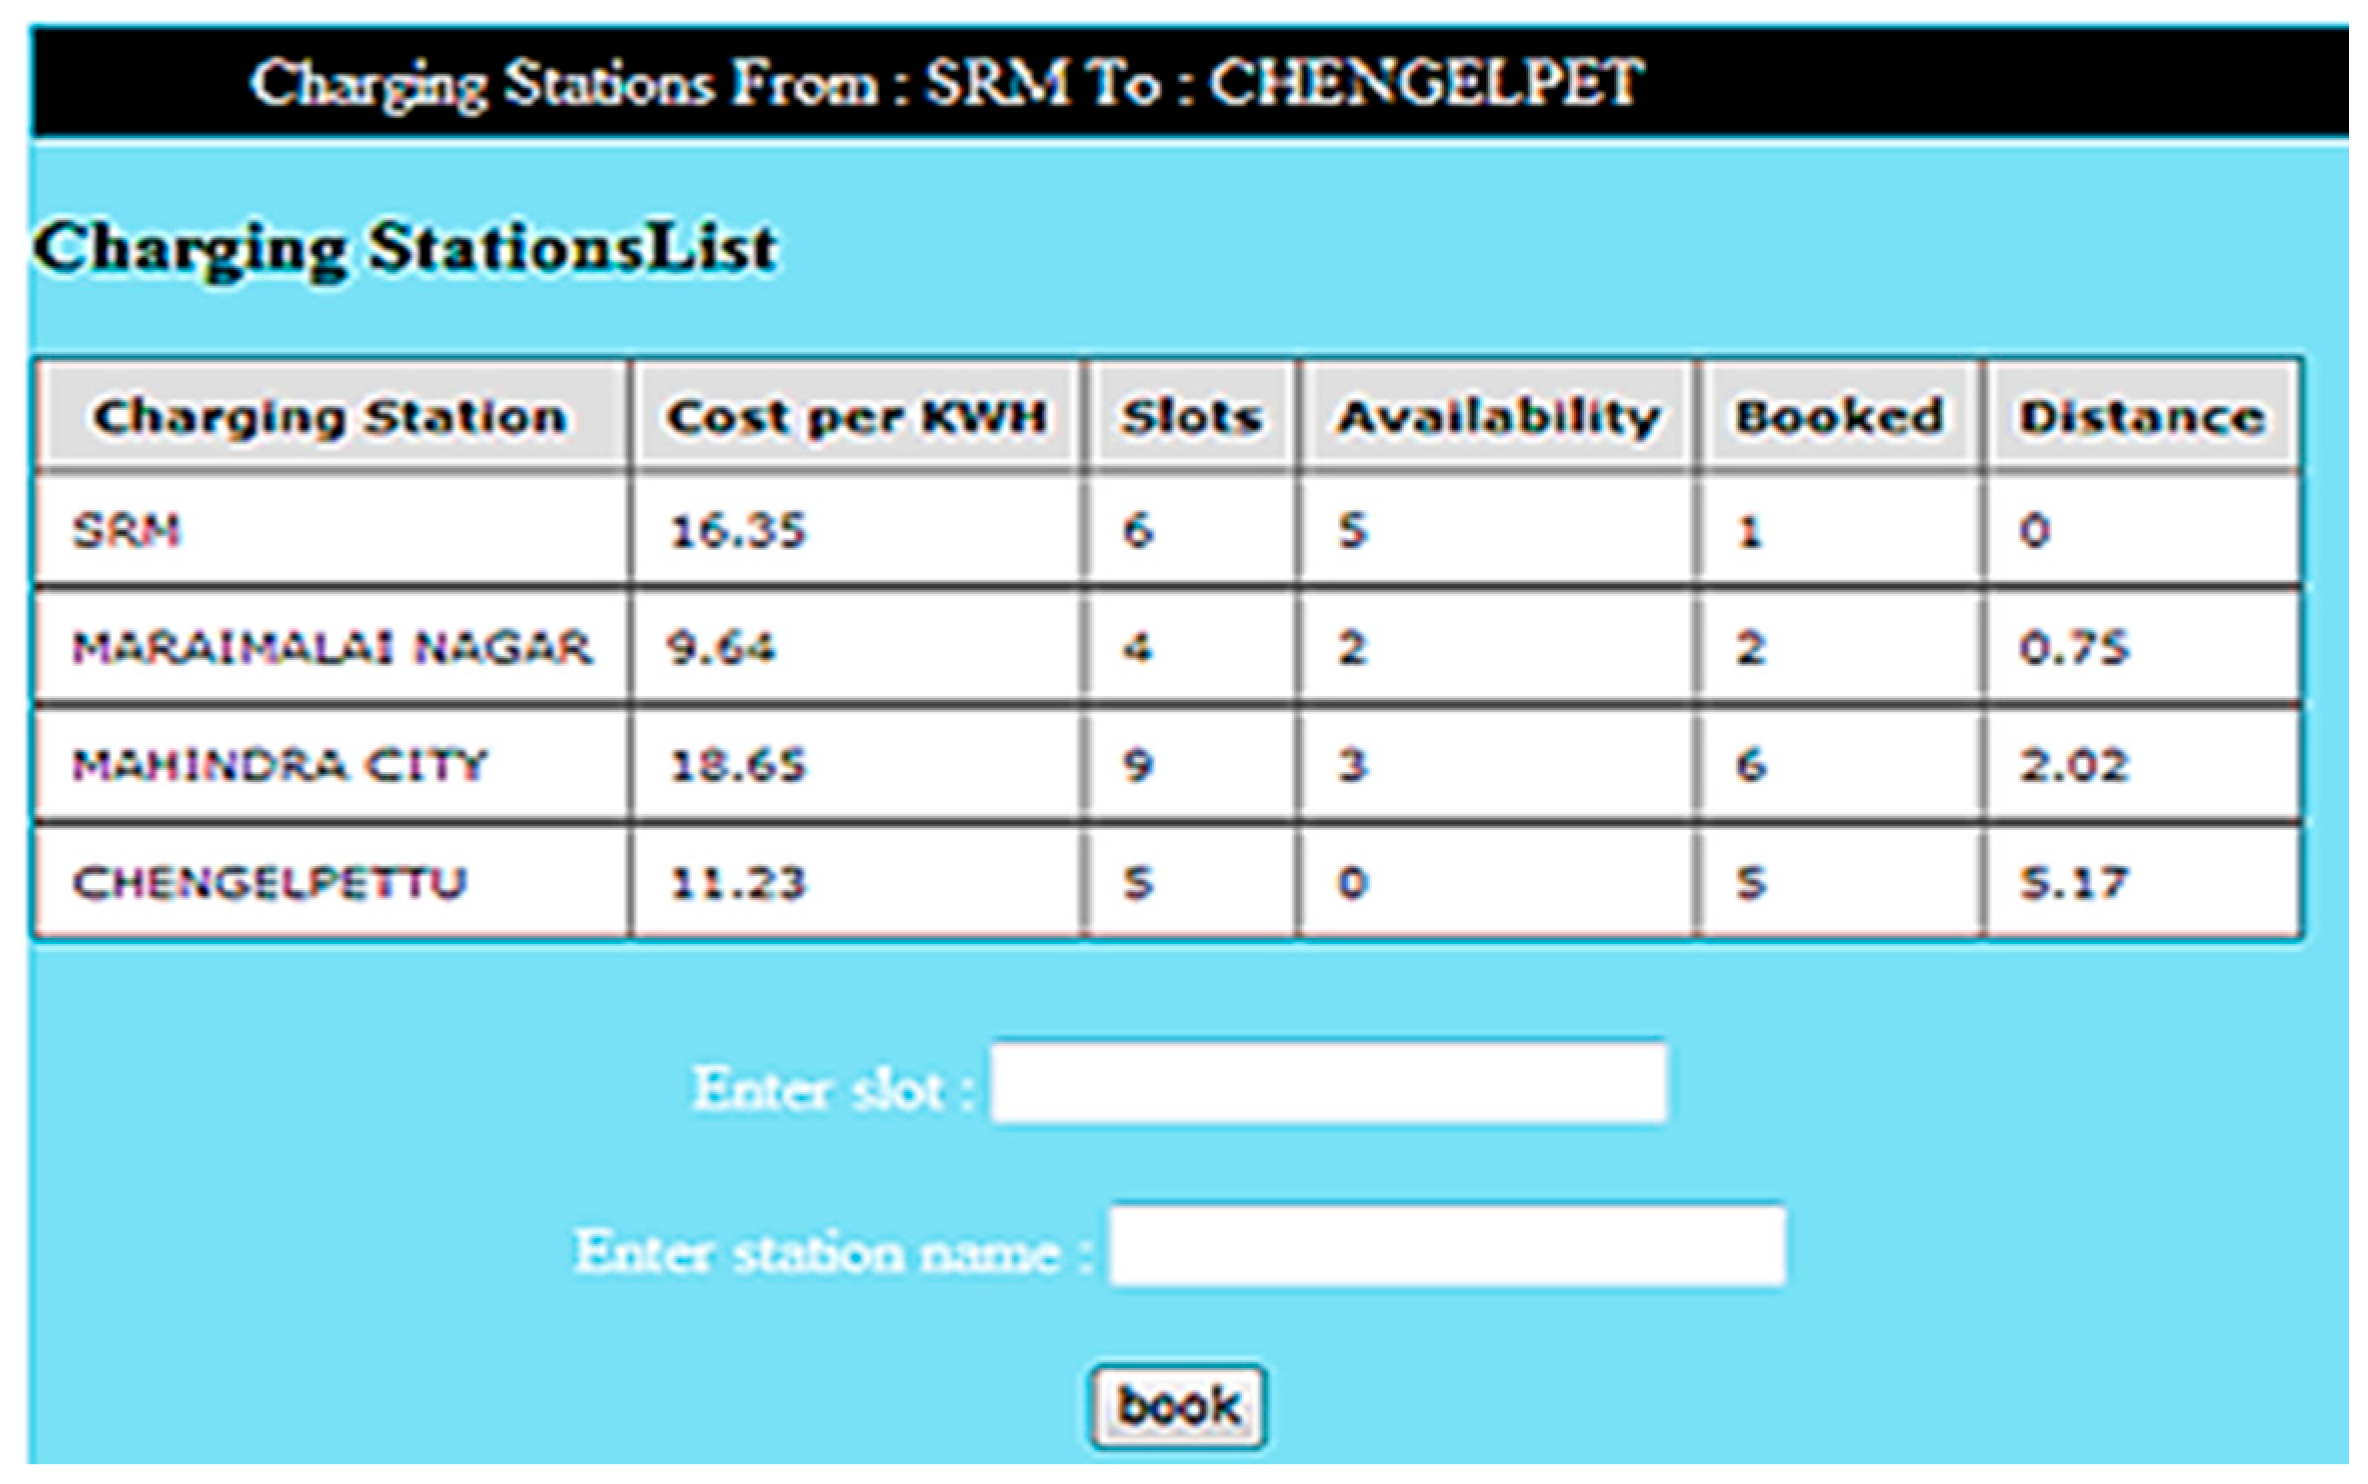
6. Area of Charging Station Selection
7. Results and Discussion
8. Conclusions
Author Contributions
Conflicts of Interest
References
- Hayes, J.G. Battery Charging Systems for Electric Vehicles. In Proceedings of the IEE Colloquium on Electric Vehicles—A Technology Roadmap for the Future (Digest No. 1998/262), London, UK, 5 May 1998.
- Su, W.; Eichi, H.; Zeng, W.; Chow, M.-Y. A survey on the electrification of transportation in a smart grid environment. IEEE Trans. Ind. Inf. 2012, 8, 1–10. [Google Scholar] [CrossRef]
- Moura, T.; Moura, F. Vehicle-to-grid systems for sustainable development: An integrated energy analysis. Technol. Forecast. Soc. Chang. 2008, 75, 1091–1108. [Google Scholar]
- Ciaravolo, R.J.; Cousland, A.W.; Blieden, G.; Hosseinzadeh, N. The design of a battery charger and charging management system for an electric vehicle. In Proceedings of the 45th International Universities Power Engineering Conference (UPEC2010), Cardiff, UK, 31 August–3 September 2010; pp. 1–6.
- Haghbin, S.; Kha, K.; Lundmark, S.; Alaküla, M. Integrated chargers for EV’s and PHEV’s: Examples and new solutions. In Proceedings of the IEEE International Conference on Electrical Machines (ICEM), Rome, Italy, 6–8 September 2010; pp. 1–6.
- Shao, S.; Pipattanasomporn, M.; Rahman, S. Grid integration of electric vehicles and demand response with customer choice. IEEE Trans. Smart Grid 2012, 3, 543–550. [Google Scholar] [CrossRef]
- Verzijlbergh, R.A.; De Vries, L.J.; Lukszo, Z. Renewable Energy Sources and Responsive Demand. Do We Need Congestion Management in the Distribution Grid? IEEE Trans. Power Syst. 2014, 29, 2119–2128. [Google Scholar] [CrossRef]
- Chang, W.-Y. The State of Charge Estimating Methods for Battery: A Review. ISRN Appl. Math. 2013, 2013, 953792. [Google Scholar] [CrossRef]
- Zhang, Y.; Gjessing, S.; Liu, H.; Ning, H. Securing vehicle-to-grid communications in the smart grid. IEEEWirel. Commun. 2013, 20, 66–73. [Google Scholar] [CrossRef]
- Xie, F. Research on electric vehicle charging station load forecasting. In Proceedings of the International Conference on Advanced Power System Automation and Protection (APAP’11), Beijing, China, 16–20 October 2011; Volume 3, pp. 2055–2060.
- Etezadi-Amoli, M.; Choma, K.; Stefani, J. Rapid-Charge Electric-Vehicle Stations. IEEE Trans. Power Deliv. 2010, 25, 1883–1887. [Google Scholar] [CrossRef]
- Foley, A.M.; Winning, I.J.; Ó Gallachóir, B.P. State-of-the-Art in Electric Vehicle Charging Infrastructure. In Proceedings of the 2010 IEEE Vehicle Power and Propulsion Conference (VPPC), Lille, France, 1–3 September 2010; pp. 1–6.
- Faria, R.; Moura, P.; Delgado, J.; de Almeida, A.T. Managing the Charging of Electrical Vehicles: Impacts on the Electrical Grid and on the Environment. IEEE Intell. Transp. Syst. Mag. 2014, 6, 54–65. [Google Scholar] [CrossRef]
- Ramesh, K.; Bharatiraja, C.; Raghu, S.; Vijayalakshmi, G.; Sambanthan, P.L. Design and Implementation of Real-Time Charging Optimization for Hybrid Electric Vehicles. Int. J. Power Electron. Drive Syst. 2016, 7, 201–291. [Google Scholar] [CrossRef]
- Chen, Z.; Li, X.; Shen, J.; Yan, W.; Xiao, R. A Novel State of Charge Estimation Algorithm for Lithium-Ion Battery Packs of Electric Vehicles. Energies 2016, 9, 710. [Google Scholar] [CrossRef]
- Wang, Y.; Zhang, C.; Chen, Z. On-line battery state-of-charge estimation based on an integrated estimator. Appl. Energy 2017, 185, 2026–2032. [Google Scholar] [CrossRef]
- Chynoweth, J.; Chung, C.-Y.; Qiu, C.; Chu, P. Smart electric vehicle charging infrastructure overview. In Proceedings of the IEEE Power and Energy Society Conference on Innovative Smart Grid Technologies Conference (IEEE-ISGT’14), Washington, DC, USA, 19–22 February 2014; pp. 1–5.
- Su, W.; Chow, M.-Y. Computational intelligence-based energy management for a large-scale PHEV/PEV enabled municipal parking deck. Appl. Energy 2012, 96, 171–182. [Google Scholar] [CrossRef]
- Mukherjee, C.; Gupta, A. A review of charge scheduling of electric vehicles in the smart grid. IEEE Syst. J. 2015, 9, 1541–1553. [Google Scholar] [CrossRef]
- Jin, C.; Tang, J.; Ghosh, P. Optimizing electric vehicle charging: A customer’s perspective. IEEE Trans. Veh. Technol. 2013, 62, 2919–2927. [Google Scholar] [CrossRef]
- Ma, T.; Mohammed, O. Optimal charging of plug-in electric vehicles for a car-park infrastructure. IEEE Trans. Ind. Appl. 2014, 50, 2323–2330. [Google Scholar] [CrossRef]
- Cheng, K.W.E.; Divakar, B.P.; Wu, H.; Ding, K. Battery-Management System (BMS) and SOC Development for Electrical Vehicles. IEEE Trans. Veh. Technol. 2010, 60, 76–88. [Google Scholar] [CrossRef]
- Chen, Z.; Xia, B.; Mi, C.C. A novel state-of-charge estimation method for a lithium-ion battery pack of electric vehicles. In Proceedings of the 2015 IEEE Transportation Electrification Conference and Expo (ITEC), Metro Detroit, MI, USA, 14–17 June 2015.
- Zhang, C.; Jiang, J.; Zhang, L.; Liu, S.; Wang, L.; Loh, P.C. A Generalized SOC-OCV Model for Lithium-Ion Batteries and the SOC Estimation for LNMCO Type equation Battery. Energies 2016, 9, 900. [Google Scholar] [CrossRef]


| SAE J-1766 | Recommended Practice for Electric and Hybrid Electric Vehicle Battery Systems Crash Integrity Testing |
| SAE J-1797 | Recommended Practice for Packaging of Electric Vehicle Battery Modules |
| SAE J-1798 | Recommended Practice for Performance Rating of Electric Vehicle Battery Modules |
| SAE J-2288 | Life Cycle Testing of Electric Vehicle Battery Modules |
| SAE J-2289 | Electric Vehicle Battery Pack System: Functional Guidelines |
| SAE J-2380 | Vibration Testing of Electric Vehicle Batteries |
| ISO/CD 12405-1 | Electrically propelled road vehicles—Test specification for lithium-ion traction battery packs and systems—Part1 High power applications |
| SAE J-1772 | SAE Electric Vehicle Conductive Charge Coupler |
| SAE J-1773 | SAE Electric Vehicle Inductive Coupled Charging |
| SAE J-1850 | Class B Data Communications Network Interface |
| SAE J-2293 Part 2 | Energy Transfer System for EV Part2: Communication Requirements and Network Architecture |
| SAE J-2836 Part 1 | Use Cases for Communications between Plug-In Vehicles and Utility Grid |
| SAE J-2836 Part 2 | Use Cases for Communications between Plug-In Vehicles and the Supply Equipment (EVSE) |
| SAE J-2836 Part 3 | Use Cases for Communications between Plug-In Vehicles and the Utility Grid for Reverse Flow |
| SAE J-2847 Part 1 | Communications between Plug-In Vehicles and Utility Grid |
| SAE J-2847 Part 2 | Communications between Plug-In Vehicles and the Supply Equipment (EVSE) |
| SAE J-2847 Part 3 | Communications between Plug-In Vehicles and the Utility Grid for Reverse Flow |
| Ampere Hour | 68 × 1 = 68 mAh |
| SOC | (68/400) × 100 = 99.83% |
| kWh | 68 × 9 = 0.612 |
| Charging Station Locations | Distance Reference from SRM University (1) in km | Population of the EV Estimated Per Day | No. of Charging Point Availability | Fast Charging SlotsAvailability | Reserved/Not Working |
|---|---|---|---|---|---|
| 1 | 0 | 3600/Day | 35 | Yes | 2 |
| 2 | 0.75 | 1200/Day | 21 | No | 3 |
| 3 | 1.02 | 1100/Day | 23 | No | 4 |
| 4 | 2.02 | 5600/Day | 41 | Yes | 4 |
| 5 | 5.17 | 3200/Day | 38 | Yes | 4 |
© 2017 by the authors. Licensee MDPI, Basel, Switzerland. This article is an open access article distributed under the terms and conditions of the Creative Commons Attribution (CC BY) license ( http://creativecommons.org/licenses/by/4.0/).
Share and Cite
Chokkalingam, B.; Padmanaban, S.; Siano, P.; Krishnamoorthy, R.; Selvaraj, R. Real-Time Forecasting of EV Charging Station Scheduling for Smart Energy Systems. Energies 2017, 10, 377. https://doi.org/10.3390/en10030377
Chokkalingam B, Padmanaban S, Siano P, Krishnamoorthy R, Selvaraj R. Real-Time Forecasting of EV Charging Station Scheduling for Smart Energy Systems. Energies. 2017; 10(3):377. https://doi.org/10.3390/en10030377
Chicago/Turabian StyleChokkalingam, Bharatiraja, Sanjeevikumar Padmanaban, Pierluigi Siano, Ramesh Krishnamoorthy, and Raghu Selvaraj. 2017. "Real-Time Forecasting of EV Charging Station Scheduling for Smart Energy Systems" Energies 10, no. 3: 377. https://doi.org/10.3390/en10030377