Article

Energy Management of Parallel-Connected Cells in Electric Vehicles Based on Fuzzy Logic Control

1
State Key Laboratory of Automotive Simulation and Control, Jilin University, Changchun 130022, China
2
School of Mechanical Science and Engineering, Jilin University, Changchun 130022, China
3
College of Automotive Engineering, Jilin University, Changchun 130022, China
*
Author to whom correspondence should be addressed.
Energies 2017, 10(3), 404; https://doi.org/10.3390/en10030404
Submission received: 24 December 2016 / Revised: 13 March 2017 / Accepted: 17 March 2017 / Published: 21 March 2017

Abstract

:
Inconsistencies that are associated with parallel-connected cells used in electric vehicles induce varied states of charge (SOCs) in each cell. Thus, loop current in the battery pack is inevitable, and this reduces overall capacity, energy utilization rate, and pack lifetime. However, no method is available to address loop current. To reduce loop current and the resulting battery inconsistency, a parallel-connected cell pack (PCCP) model that considers thermal effects is established, and a novel Simscape model that is based on PCCP is successfully constructed. Furthermore, the strategy of parallel-connected cell energy management (PCCEM) is proposed to utilize fuzzy logic control (FLC) strategy, which automatically adjusts the number of cells in a circuit in accordance with the load demand, and turns on the first N switches in the corresponding SOC order. The New European Driving Cycle (NEDC) driving cycle simulation shows that the PCCEM strategy considerably reduces loop current and improves the consistency of battery performance and the utilization rate of battery power.

1. Introduction

The lithium battery is associated with numerous concerns because of its high-energy density, large capacity, and no memory effect [1,2,3]. Nonetheless, the lithium battery has been considered one of the major viable energy storage media in electric cars [4,5,6,7]. To meet the voltage and power requirements of cars, if we use small-capacity and low-power lithium cells, as in Tesla’s Model S, then the cells should be connected in parallel or/and series fashion [8,9,10,11]. A parallel-connected cell pack (PCCP) can be regarded as a larger single cell by omitting the differences among cells. However, given the differences in internal resistance, capacity, aging property, and temperature of cells, the discrepancy in the state of charge (SOC) and/or voltage among the parallel batteries is inevitable [12,13,14]. As a result, circulating current among batteries with different SOC and/or voltage is unavoidable. Connecting cells in parallel, which entails a number of engineering complications that must be resolved, is not the first choice. Still, when we apply cells into a large-capacity demand area, such as an electric vehicle, we have no choice but to connect cells in parallel. However, the overall performance of the Li-ion battery deteriorates over time because the system is repeatedly cycled through iterations of charge and discharge. Although the cells used in an electric vehicle at a state of health (SOH) = 100% would have almost the same capacities and SOC, the battery would have deteriorated capacities after being discharged and charged for thousands of times. As a result, some cells would be left with less than 80% of their original capacities, and some cells would have lower SOC than others. As shown in Figure 1, several cells have high capacity or high SOC, whereas others have relatively low capacity or low SOC. The gradually increasing inconsistencies in the cells will increase the difference in working current, which results in uneven temperature distribution. Figure 2a shows that loop current will occur between parallel cells in standby mode when all the switches are closed. Consequently, various problems, including increased battery temperature, energy loss and reduced service time, will occur simultaneously. Moreover, the uneven distribution of the current and temperature will produce different cell aging rates.
Many researchers have discussed cell inconsistency from different perspectives. Bruen et al. [15] evaluated the variation in energy among cells and investigated its probable effect on the design of highly parallelized battery systems. Yang et al. [1] introduced the influence of uneven temperature distribution on PCCP discharge characteristics and service life. They pointed out that the cell with higher temperature will have a higher discharge current during the early stage of discharge and a lower current during the later stages. Moo et al. studied the current characteristics of PCCP charge and discharge. They reported that the battery pack releases more energy and increases energy efficiency through controlling the PCCP’s discharge sequence. Hsu et al. [16] introduced an energy management method that increases uninterrupted power supply (UPS) energy output by alternately driving the load. Barre and Maher et al. [17,18] pointed out that the current of each cell cannot be measured by traditional battery management system (BMS) and that the differences among currents cannot be detected. Offer et al. [19] reported that cells closer to the main circuit have higher currents than those of cells that are further from the main circuit. This condition causes capacity difference in the long term, which indicates that parallel cells have different SOC values despite having the same terminal voltage. Gong et al. [4] studied the characteristics of the parallel four-cell pack and reported the adverse effects of inconsistency on the pack, such as different aging degrees and accelerated aging rate, which in turn increases the inconsistency of the pack. Bruen et al. [20] established a model and reported that significant differences in current occur and affect cell aging rate and temperature distribution.
The above analysis indicates that several studies have provided valuable results. However, prior studies have mainly focused on phenomenon analysis, modeling, and simulation. No rational method has been proposed to handle circulating currents in parallel-connected cells. Therefore, the present study investigates the energy management of parallel-connected cells. Figure 2 shows the operating principle. To minimize the circulating current, we can control the switch S11-SMNon the basis of power demand, which ensures that the cell with a higher SOC has a higher discharge priority. If the discharge current is low, then only part of the battery will be involved in discharging. Cells with lower SOCs will be disconnected from the circuit. Then, the cell with a lower state of charge (SOH) is isolated from the pack when its performance decays to a certain value by turning off the corresponding switch. Therefore, this study attempts to reduce the circulating current by appropriately controlling each cell’s discharge process.
First, this study builds a parallel-connected cell pack (PCCP) model that considers thermal effect. The PCCP model is constructed on the foundation of a previous work [21]. Then, the PCCEM strategy is proposed. The strategy changes the working mode of each cell in accordance with real conditions and load on the basis of fuzzy logic control (FLC). Finally, the PCCEM algorithm is applied to the PCCP model to evaluate its influence on a highly parallel battery system. The NEDC driving cycle simulation and hardware-in-the-loop experiments show that this strategy improves the consistency of battery performance and the utilization rate of battery power.
The experimental method and model in this article serve as a guide for the energy management of parallel-connected cells to optimize the energy utilization rate. Section 2 provides the single cell model and Simulink model of parallel-connected cells. Section 3 presents the PCCEM strategy. Section 4 discusses the simulation results. Section 5 presents the conclusions and prospects.

2. Simulink Model Parallel-Cell Pack

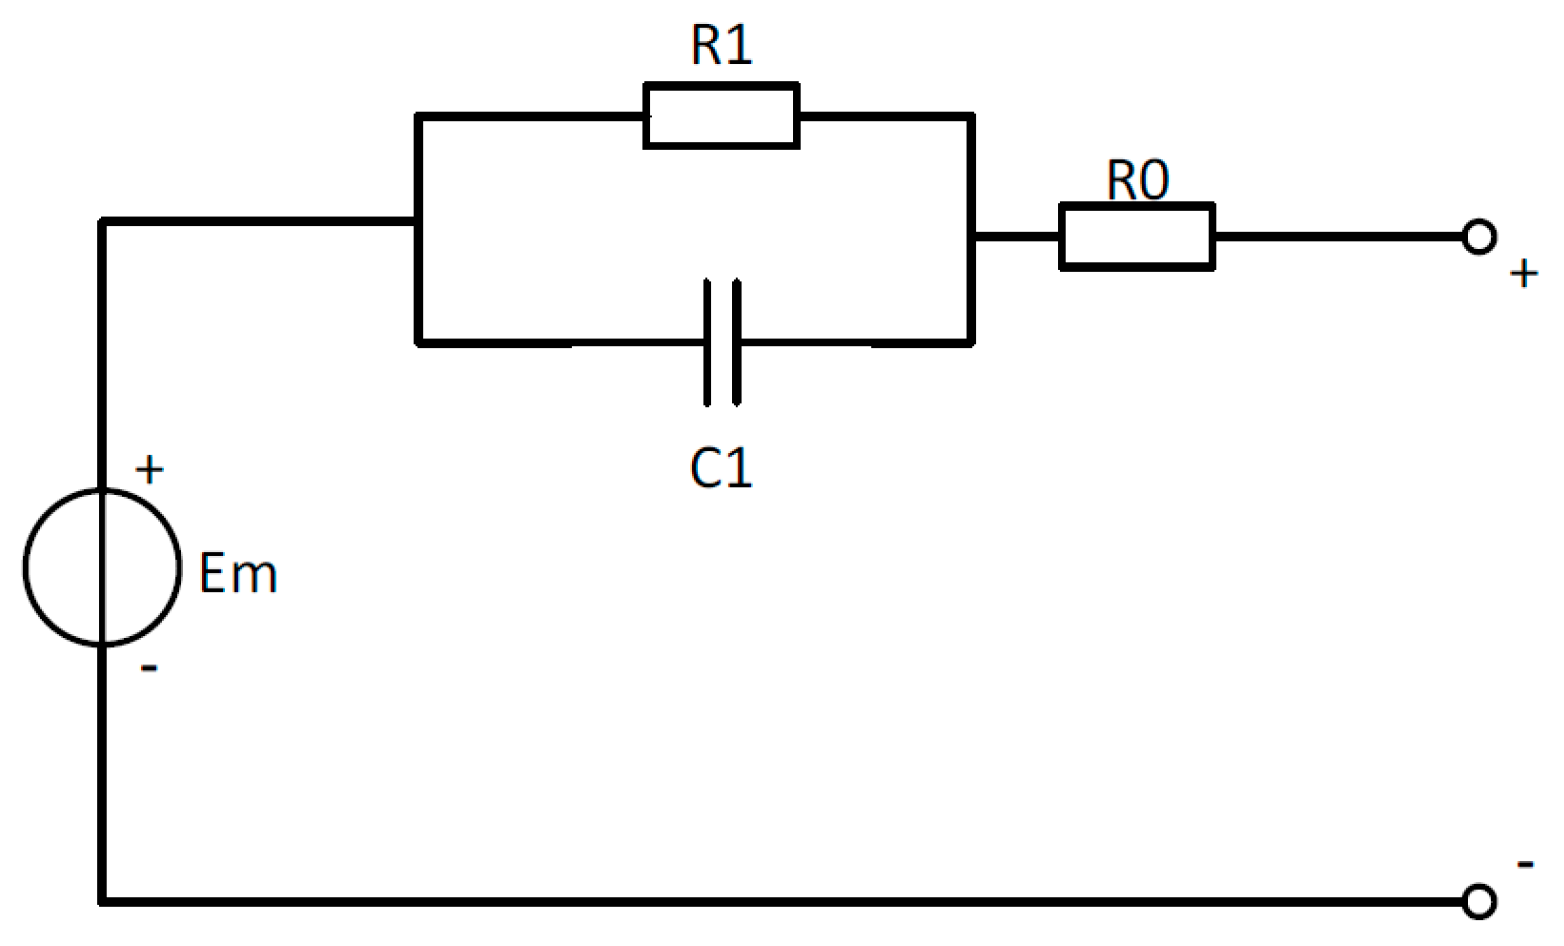
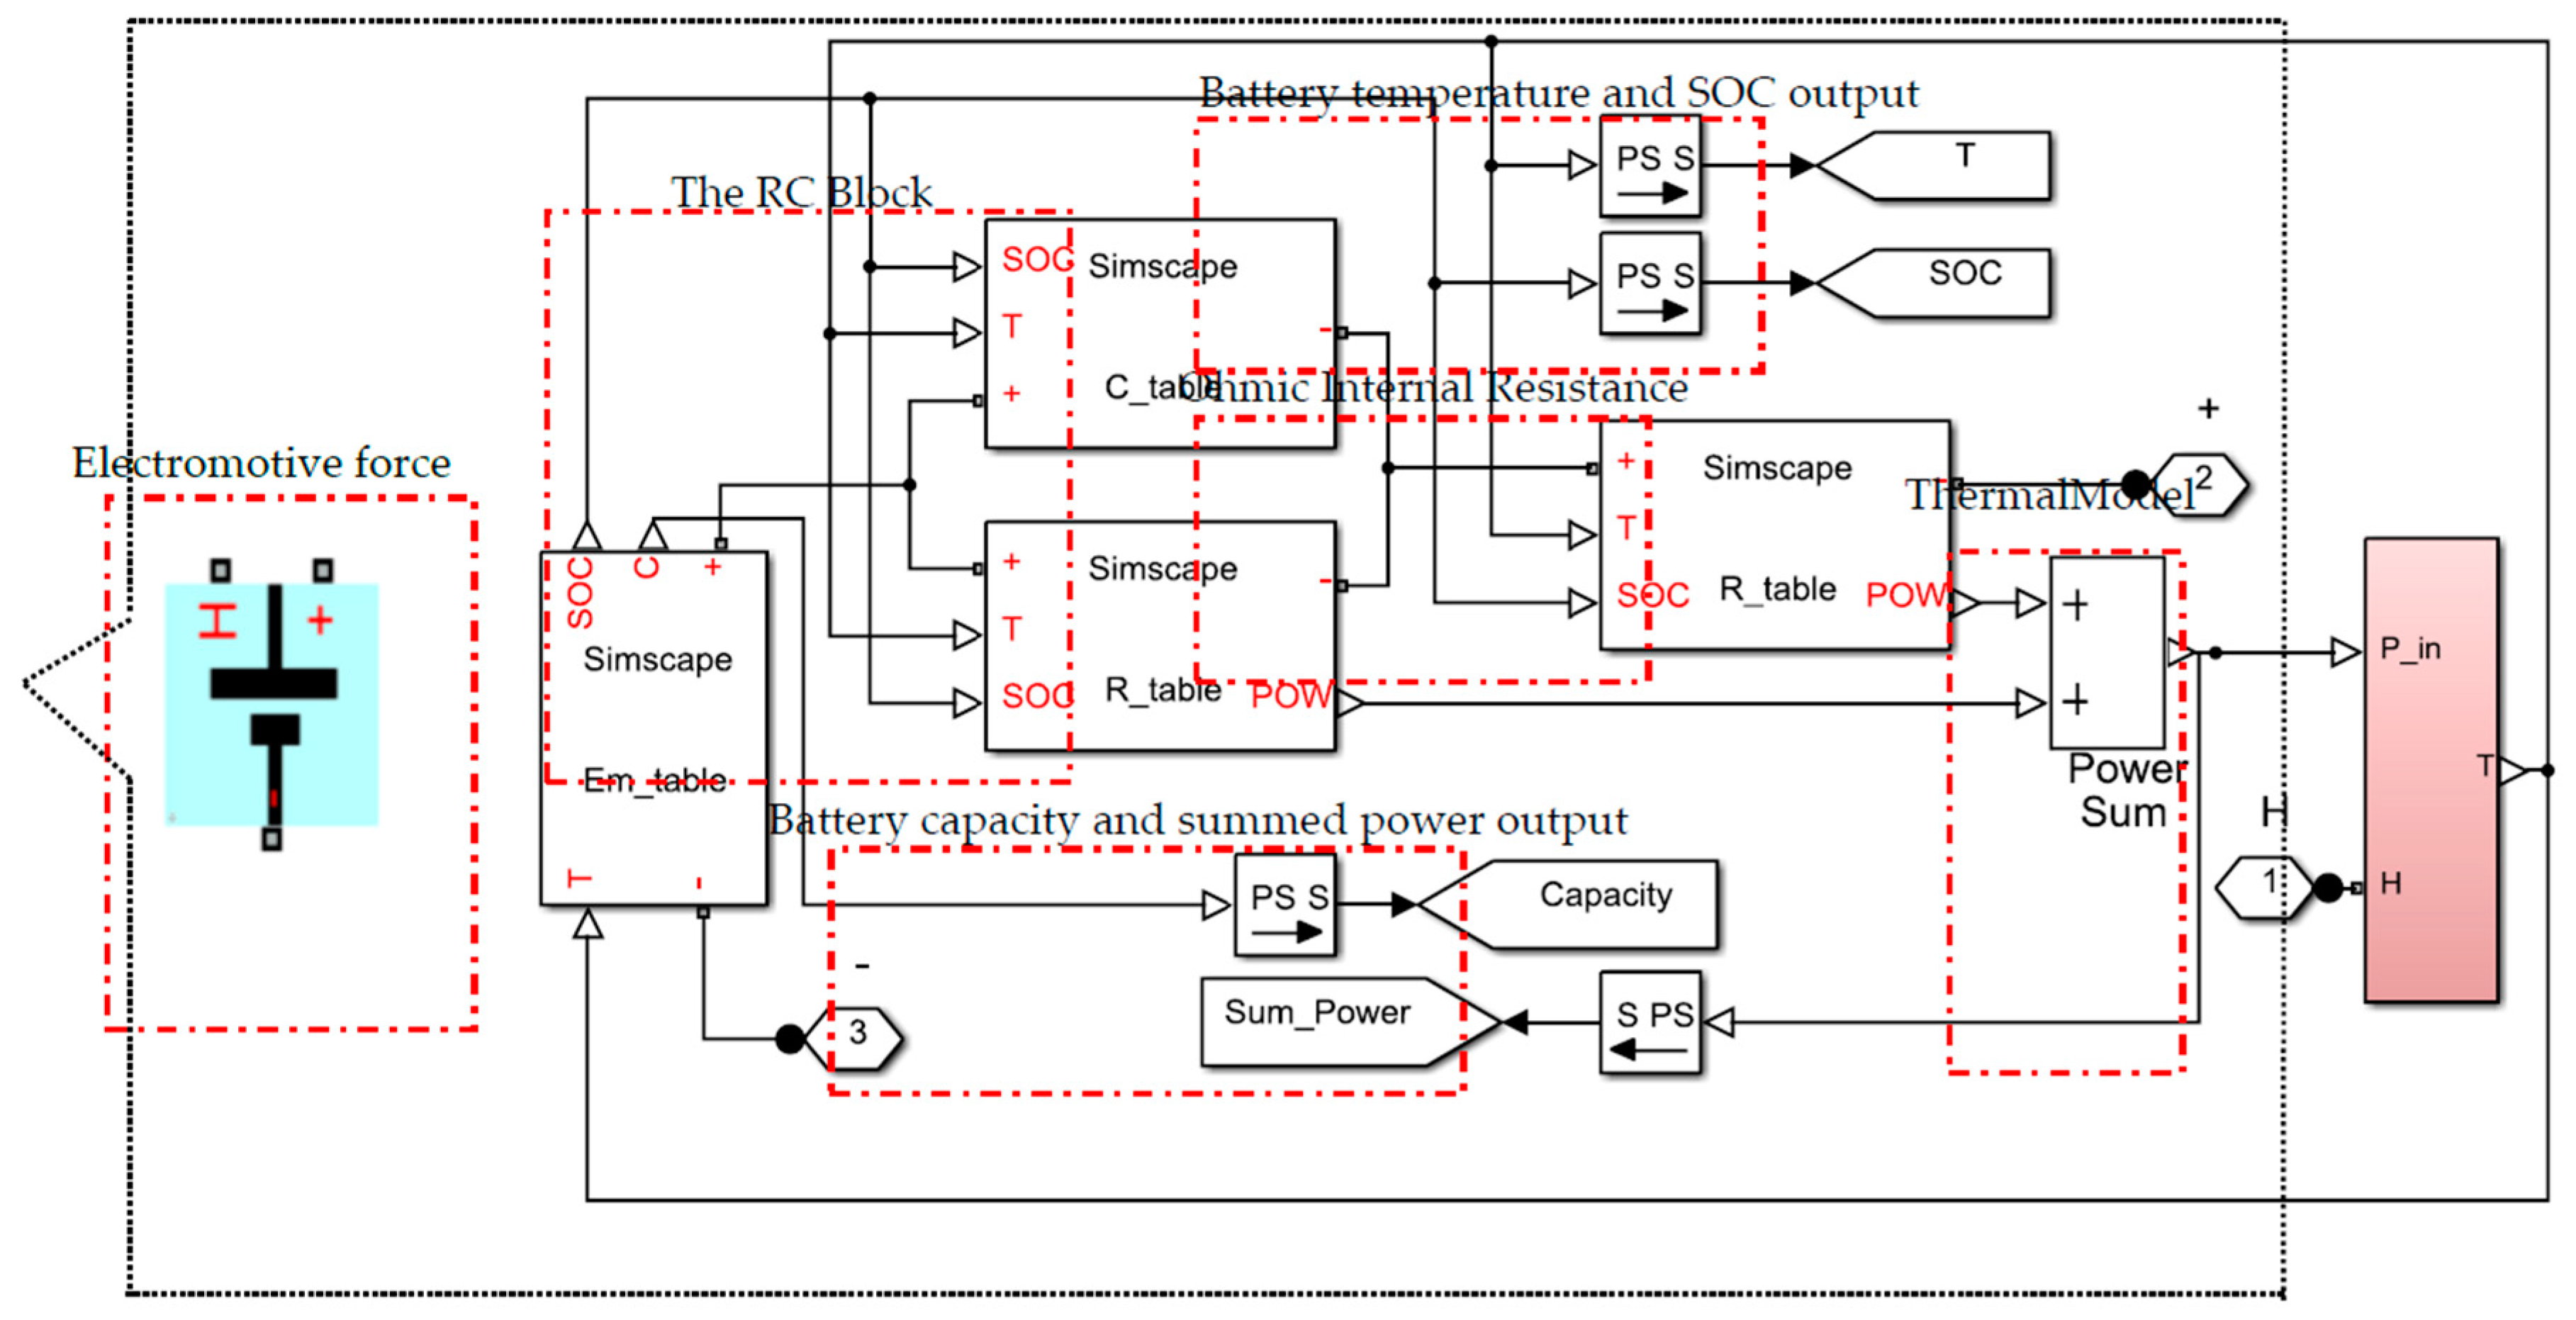
2.1. First-Order RC Equivalent Circuit Model

PCCP energy management is based on accurate and real-time SOC estimation. Thus, the battery SOC must be accurate under all conditions [22]. Hence, constructing a battery model to estimate the SOC is advisable. A number of researchers [17,18,23,24] mention several battery models and describe cell charge and discharge characteristics. The first-order equivalent circuit model is very common in simulating cell voltage change because the model is relatively simple, can easily obtain parameters, and runs in real time. The core goal of the equivalent circuit model is to simulate the actual battery voltage response of the current input [20]. Huria et al. [21] reported that the first-order resistance capacitance (RC) circuit model is precise for most industrial applications. Increasing the order will significantly elevate the amount of calculation, but will not increase accuracy greatly [25]. The first-order equivalent circuit model is advocated by Thomas and Huria et al. for its accuracy and feasibility, and many researchers [26,27,28,29] have adapted this model in their studies. The equivalent circuit model, which contains a voltage source, series resistor, and a pair of RC, accurately describes cell characteristics. In practice, Coulomb counting method suffers from drift. According to the suggestion of Seaman et al. [27], we made the resistors and capacitance dependent on SOC and temperature to increase the fidelity of the battery model. Figure 3 shows the classic first-order RC equivalent circuit model.
In Figure 3, Em represents the open circuit voltage; R1 and C1 represent the resistance and capacitance of polarization effect, respectively; and R0 represents the ohmic resistance of battery. Em, R1, C1, and R0 are functions of SOC and temperature. Specifically, these four elements can be obtained from the two-dimensional look-up tables:
R0 = R0 (SOC, T)
R1 = R1 (SOC, T)
C1 = C1 (SOC, T)
Em = Em (SOC, T)
Those look-up tables were obtained by using a parameter estimation tool in Simulink Design Optimization with series pulse discharge data under different temperatures. Additionally, these look-up tables were selected based on seven different points of SOC. The pulse discharge curve for each temperature was run individually through estimation. This will produce a set of one-dimensional look-up tables versus SOC for the four parameters at each temperature. Simulink Design Optimization iteratively simulated the discharge profile in Simscape while comparing the simulation results with experimental data. Then, using nonlinear least squares algorithm, the error gradient across each of the 28 parameters (four tables × seven breakpoints) to minimize the sum of squared error.
The battery model in the reference [21], which is a fidelity electrical model with thermal dependence, was used for characterization and simulation of high-power lithium battery cells. The cell temperature is computed by using the thermal model in [21].The inner cell temperature is assumed to be uniform and taken as the average temperature inside the cell. SOC was calculated through Coulomb counting by using Formula (5). SOC (t0) is calculated based on each measured open circuit voltage (OCV) reading using linear interpolation. SOC (t0) = f (OCV, T), and only when the dv/dt < 4 uV/s condition is satisfied are OCV readings taken; SOH is calculated using Formulas (6) and (7) according to [30]. In Formulas (6), SOC1 and SOC2 are the SOCs of the battery before and after discharging, respectively, and they are calculated only when the OCV is accurate enough.
S O C ( t ) = S O C ( t 0 ) 1 C M t 0 t I ( t ) d t
C M = P a s s e d C h a r g e ( S O C 2 S O C 1 ) × 100 %
S O H = C M C N × 100 %
where S O C ( t 0 ) is the SOC at the beginning of the discharge or charge; I ( t ) is the working current; C M is the current capacity of the battery; C N is the brand new capacity of the battery; P a s s e d C h a r g e is the total capacity flow out the battery; and S O C 1 and S O C 2 are the SOCs of the battery before and after discharging, respectively.
Many battery models in the current literature do not consider thermal influence. However, Huria et al. [21] added a thermal model to the equivalent circuit model and creatively progressed the Simscape model. As shown in Figure 4, the Simscape model contains three input terminals (environment temperature, positive, and negative) and three output terminals (battery temperature, SOC, and energy consumption power).
These outputs can be used to analyze the working state of the cell and manage energy flow in PCCPs. The Simscape model is suitable for Matlab simulation and analysis. The parameters of the equivalent circuit model can be estimated through the least square method with experimental data, which can be obtained by pulse discharge process under different temperatures and SOCs. Then, the parameter results are incorporated into lookup tables that are related to SOC and temperature (T). The computer determines the parameters of the model via the look-up tables. This method is very practical. Moreover, the Simscape model has beentested by Wang and Huria et al. [14,21]. Their results indicated that the model responds accurately in a given battery voltage fluctuation.

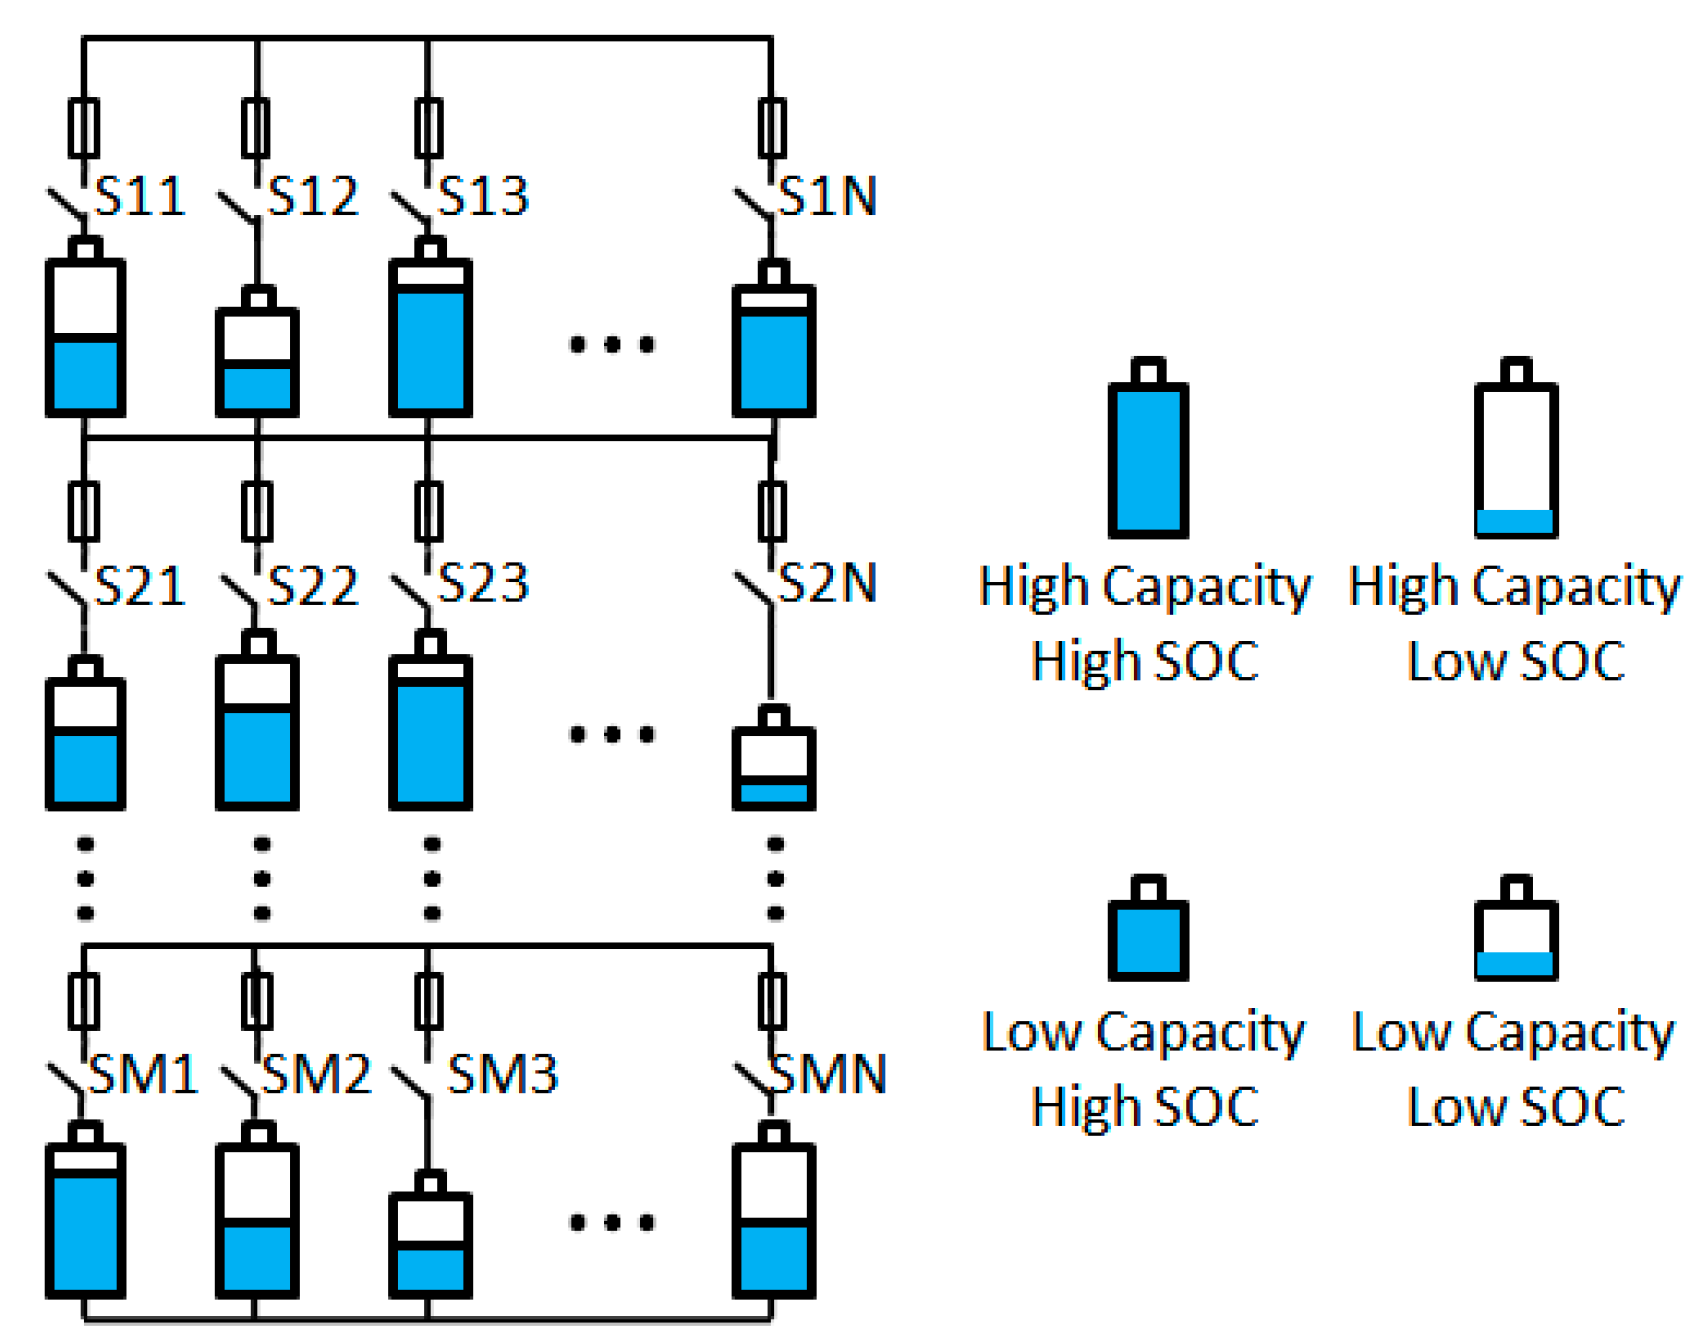
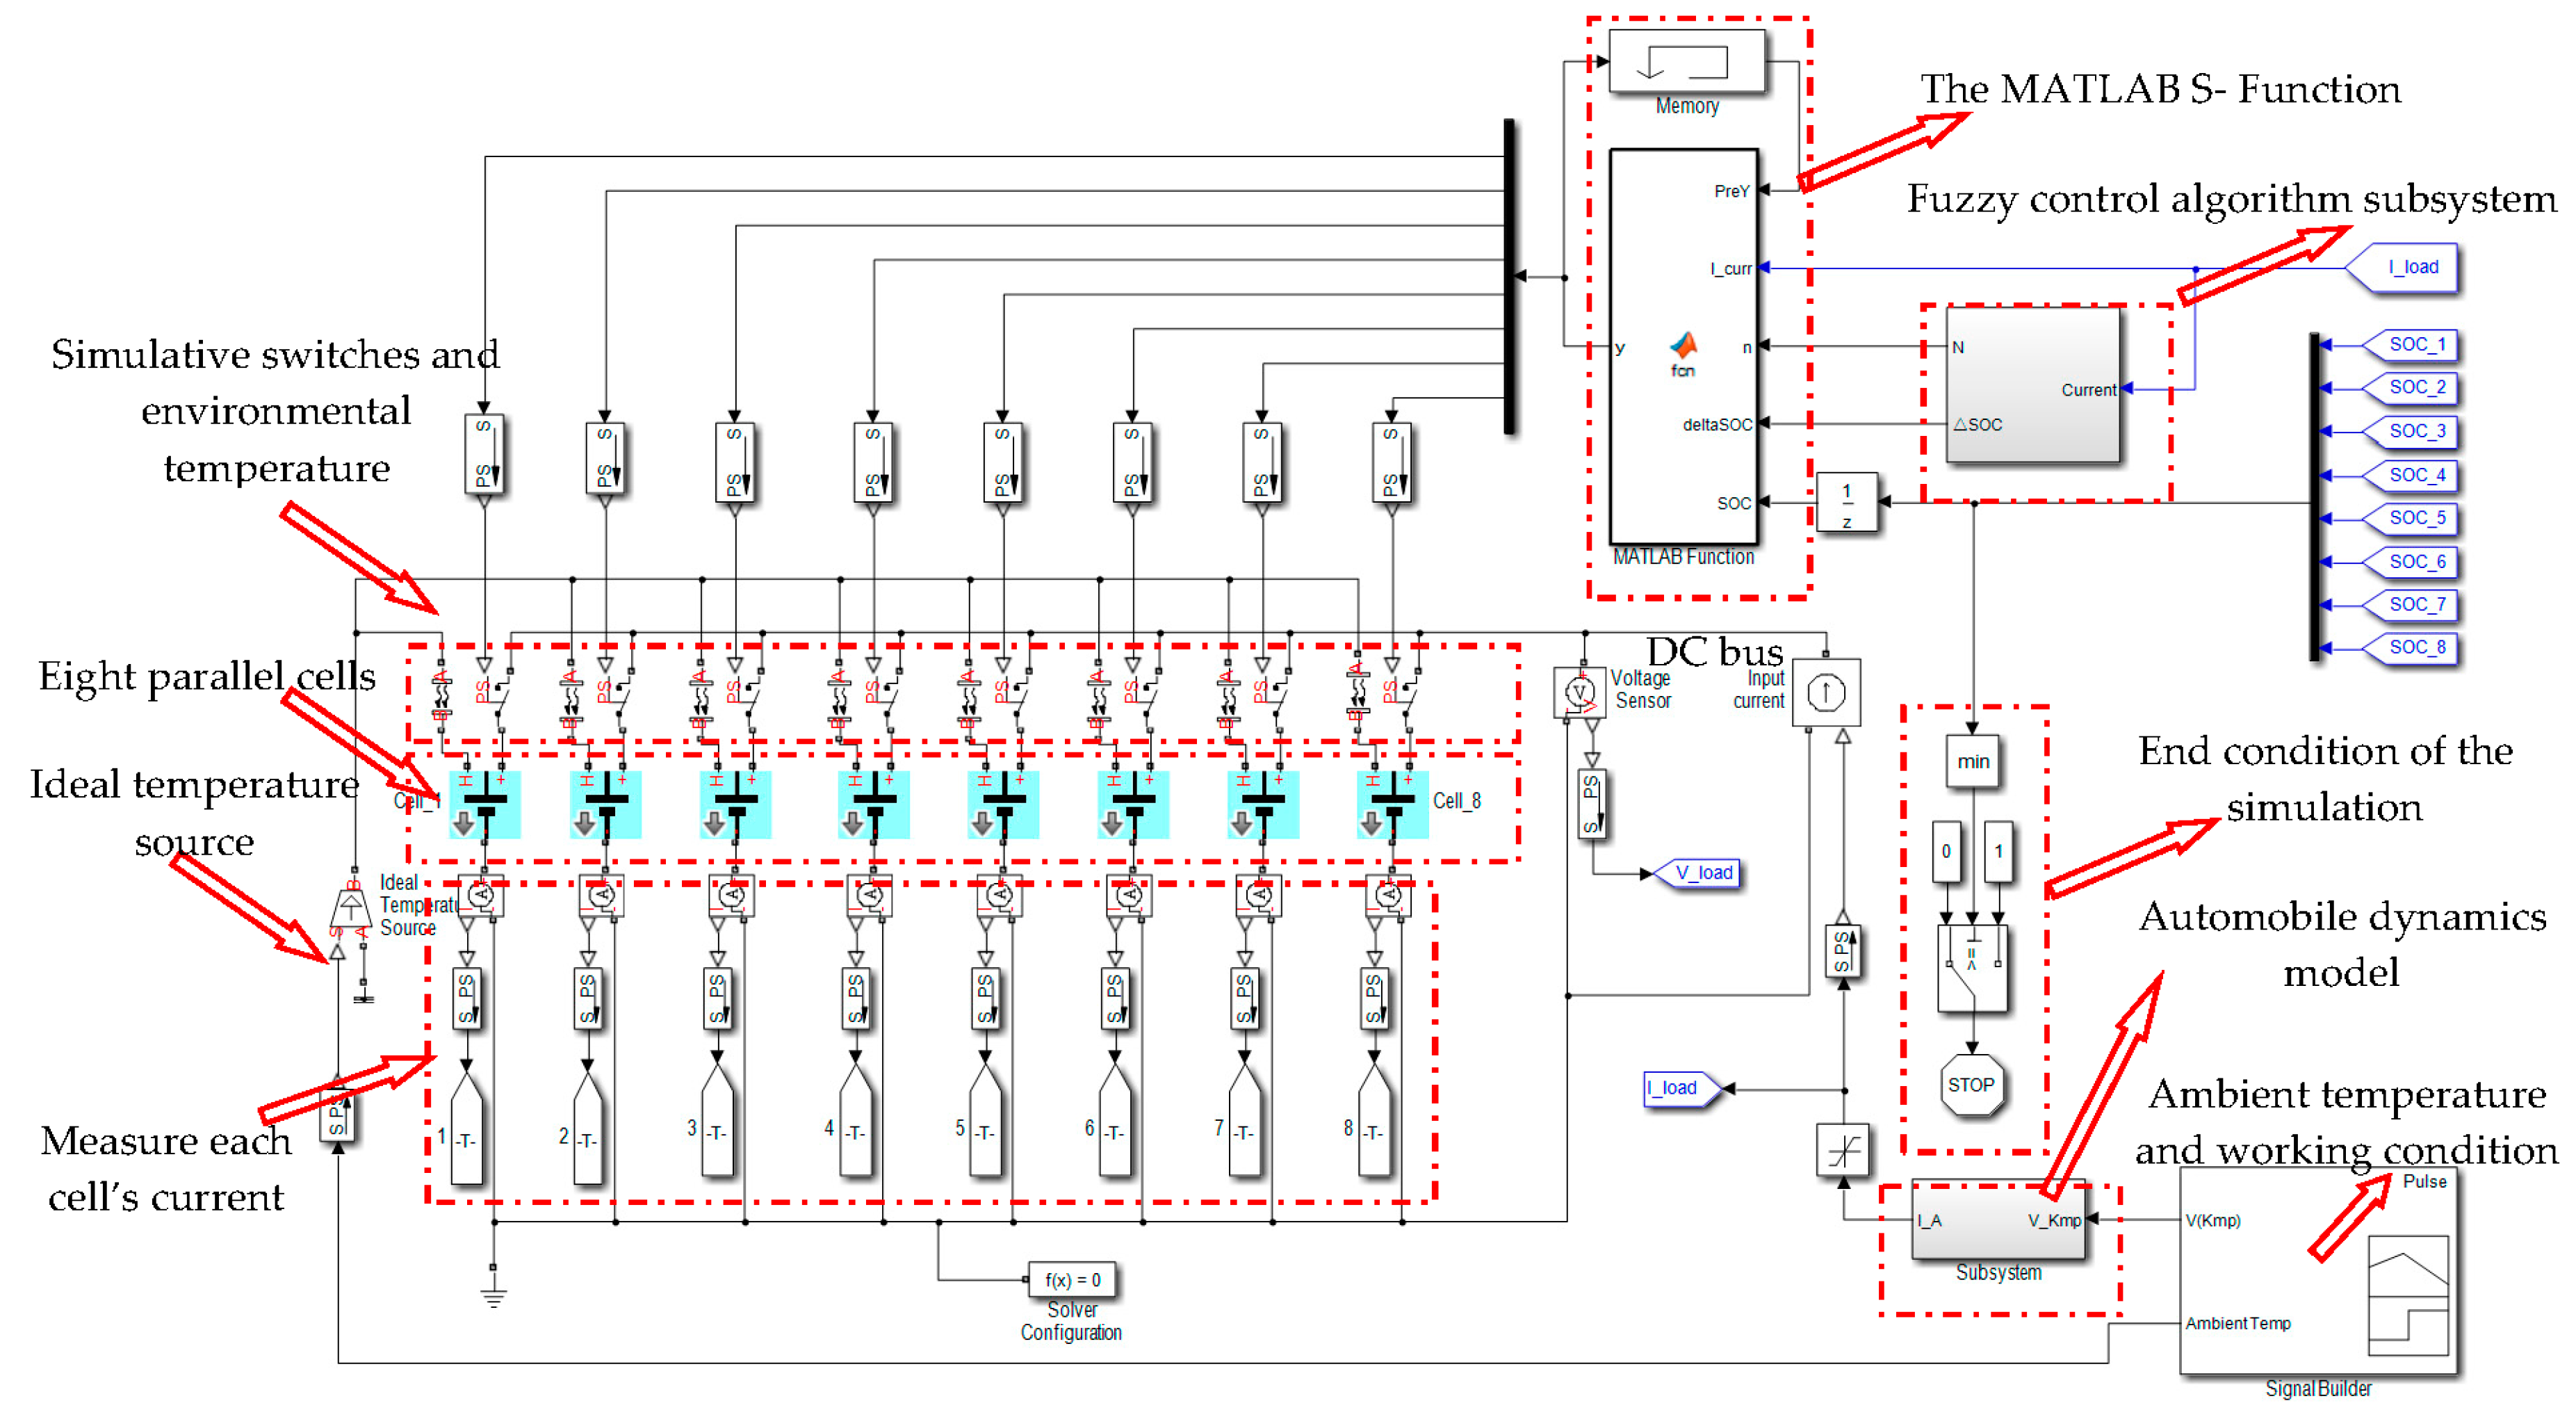
2.2. The Simulink Model for Parallel-Cell Pack

Given the electrical connection of traditional PCCP cells, controlling the current distribution among the cells is difficult.Moreover, monitoring the current of every cell is impractical. Thus, some of the cellsare likely to exceed the current threshold, although the average current is in a reasonable range. Therefore, it is necessary to establish a PCCP model to investigate PCCP management. Some researchers [15,31] proposed a parallel-connected cell pack model on the assumption that all the batteries are the same, which is obviously impractical. Currently, most PCCP models donot consider thermal influence, thus making most models imprecise.This study utilized the first-order RC equivalent model to build a model of eight parallel-connected cell packs. Cell parameterswere estimated from eight different aging conditions of LiNixMnyCozO2 (NMC) cells. Thermal influence was considered in the estimation process [21].
As shown in Figure 5, the PCCP model contains eight cells that are connected to the switch and direct current (DC) bus. There is no loop current among the cells with different SOCs when the switches are turned off. MATLAB S-function is used to calculate the number of cells to be connected in the circuit on the basis of power demand. Then, the cells are sorted by SOC value from high to low. The first N cells are then connected to the circuit. All the cells will be in the disconnected state under no-load conditions to completely avoid loop current. Hsu et al. [16] also recommended that all cells should be disconnected. The automobile dynamics model calculates the required current at theworking condition. The fuzzy control algorithm subsystem and MATLAB S-function sort the SOCs and select which switches to close. With the PCCP model, we can conduct the vehicle dynamic driving cycle test, simulate the depth discharge of cells, and analyze the resistance of the isolated cell, as well as its influence on the pack.

3. PCCEM Strategy Based on Fuzzy Control Logic

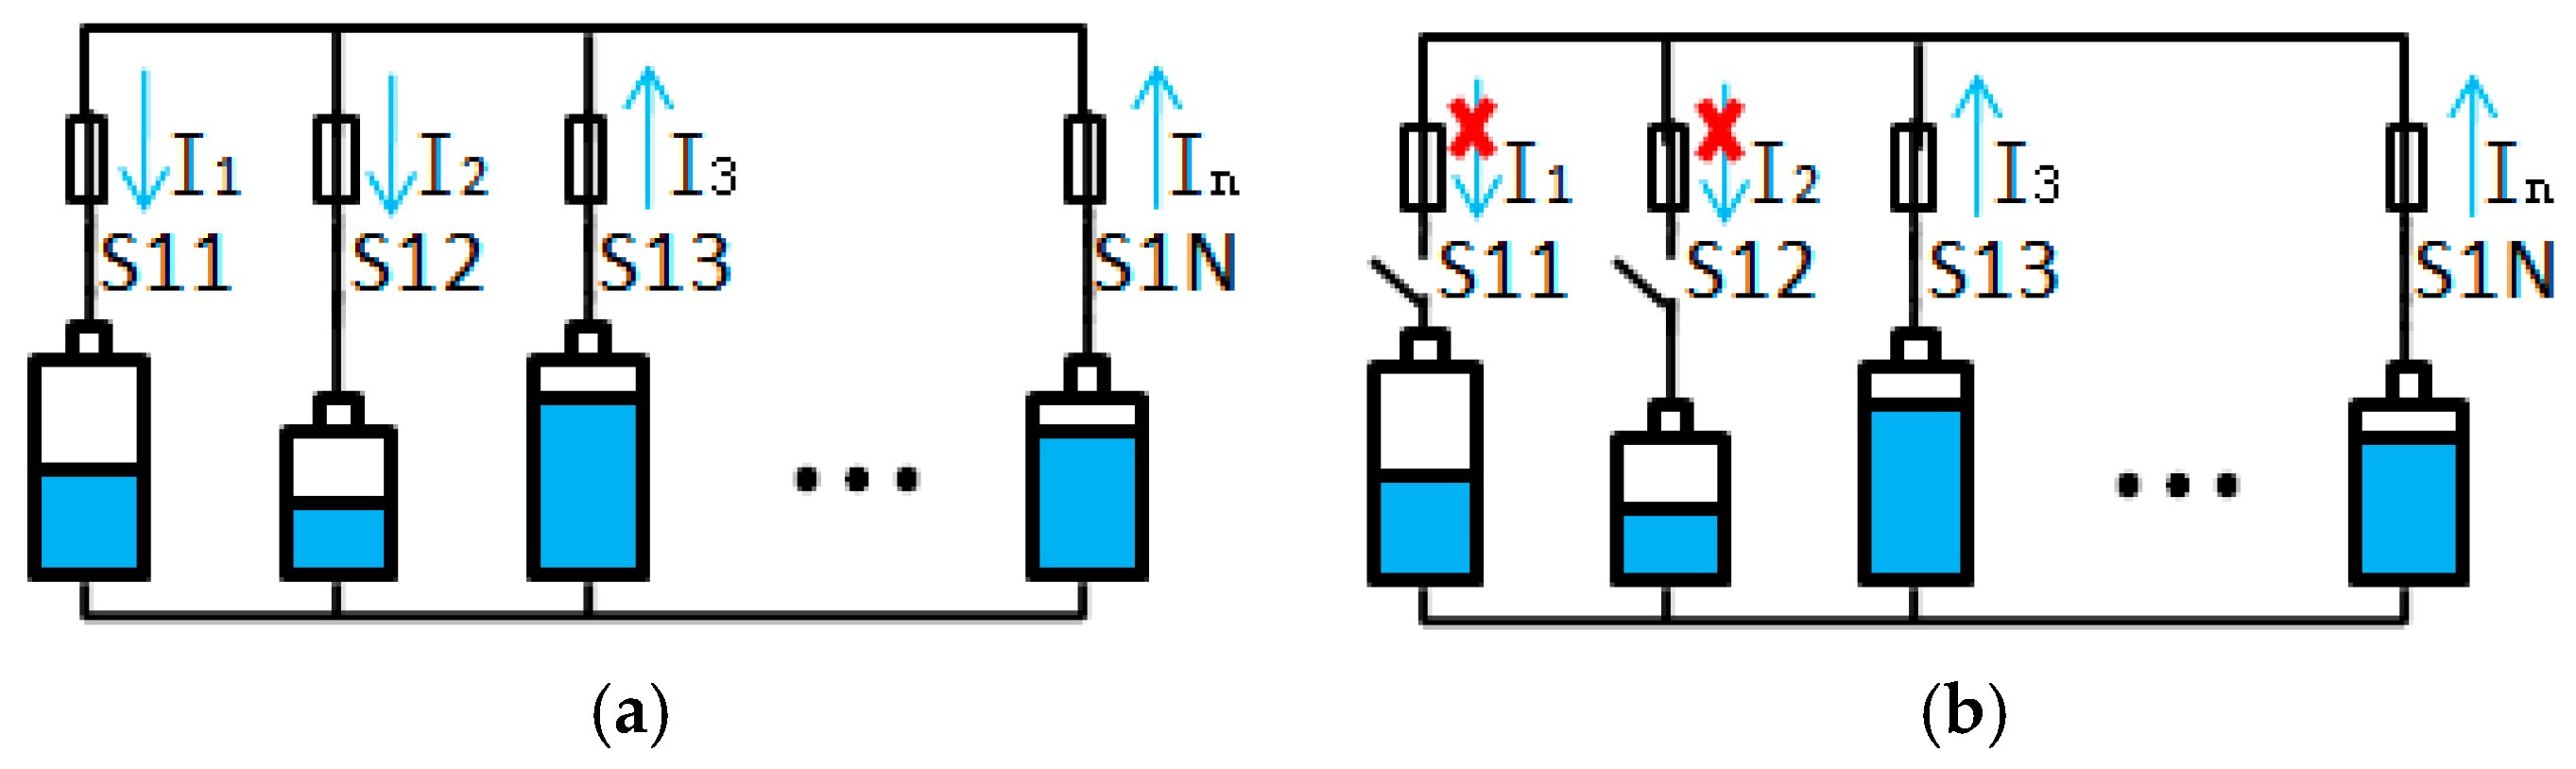
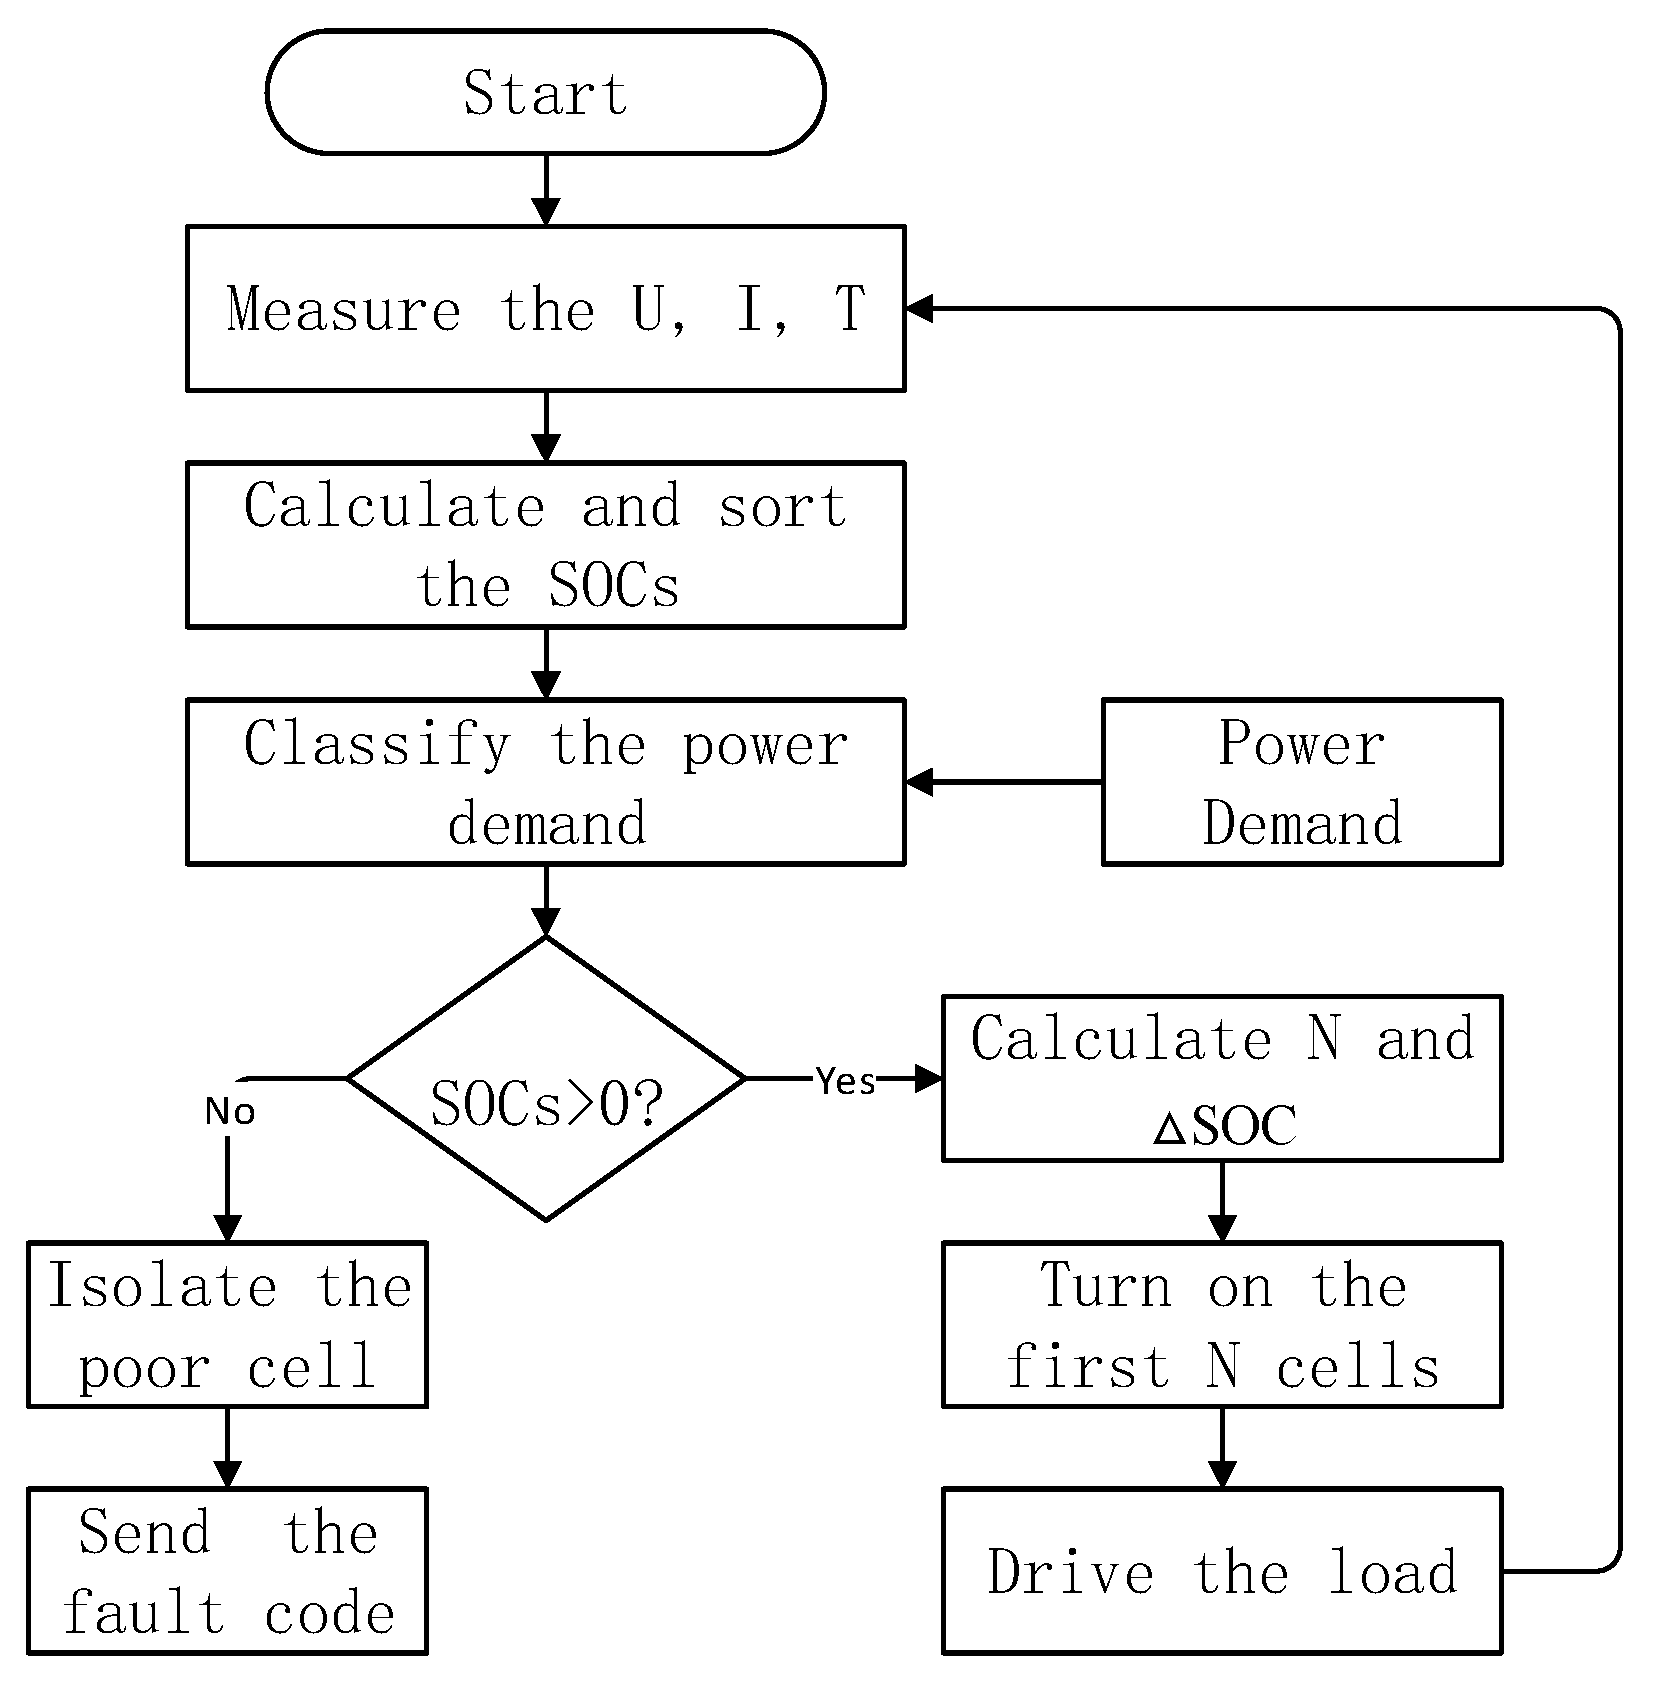
3.1. Principle and Process of PCCEM Strategy

The basic principles of selecting cells for battery packs are to reduce the circulating current; only the cell with the highest SOC should be selected to discharge when power demand is small; when the demand increases, the cell is successively connected with the highest SOC among the rest cells. The PCCEM flow chart in Figure 6 introduces methods to control the current discharge of each cell. First, the BMS measures the voltage, current, and temperature of batteries. SOCs are then calculated and sorted, and power demand is classified into different levels. The PCCEM algorithm determines the number (N) of cells to be connected into the circuit and ΔSOC in accordance with cell load level and SOC. After this step, the algorithm will turn on the first N cell and turn off others to drive the load and loop infinitely. When the load is small, only cells with higher SOC are connected into the circuit. At this time, cells with lower SOC have no electrical connection with cells with higher SOC. Hence, no loop current exists between the cells and the BMS estimates the cell SOC and SOH accurately under open loop conditions. As the load increases, more cells gradually access the circuit in SOC sequence. When the power demand is relatively high, the discharge current will also increase. We should connect all the cells in the circuit to reduce energy loss because energy dissipation is proportional to the square of the current (Q = I2 × R), and connecting all the cells into the circuit will reduce overall internal resistance. When the pack SOC (generally, the minimum value of cell SOC is considered as the pack SOC) is low, we should appropriately increase the number of cells in the circuit even in light load to reduce internal resistance and prevent voltage drop to reach the cut-off voltage early. Conversely, the ideal situation in the charging mode is to charge cells with lower SOC first, followed by cells with higher SOC, and finally, cells with the highest SOC. This order will increase the energy utilization rate. Thus, the cell’s status and load determines the accessibility of the cell to the circuit. The PCCEM system also can isolate poorly performing cells by turning off the corresponding switches. Then, the system will send a message to the owner.
As mentioned above, the control switches of several cells will quickly turn on or off to control the discharging current of corresponding cells when cell load and SOC change. However, a problem arises when the SOC order changes during the discharge process: any tiny changes in the SOC order will make the control frequently unit turn on or off the switches that have corresponding cells with similar SOCs.
To avoid this issue, the frequency of SOC sorting should be controlled within a reasonable range. A variable ΔSOC is introduced, which is a threshold value. Only when the SOC of any of the cell changes beyond the ΔSOC will the PCCEM reorder the SOCs. As the discharge current increases, the SOC changes more quickly. Thus, increasing ΔSOC is advantageous because this will reduce the on-off frequency of the switches, specifically the ΔSOC changes with the discharge current. Under heavy load, all cells will be connected to the bus. Controlling the current distribution is unnecessary at this time.

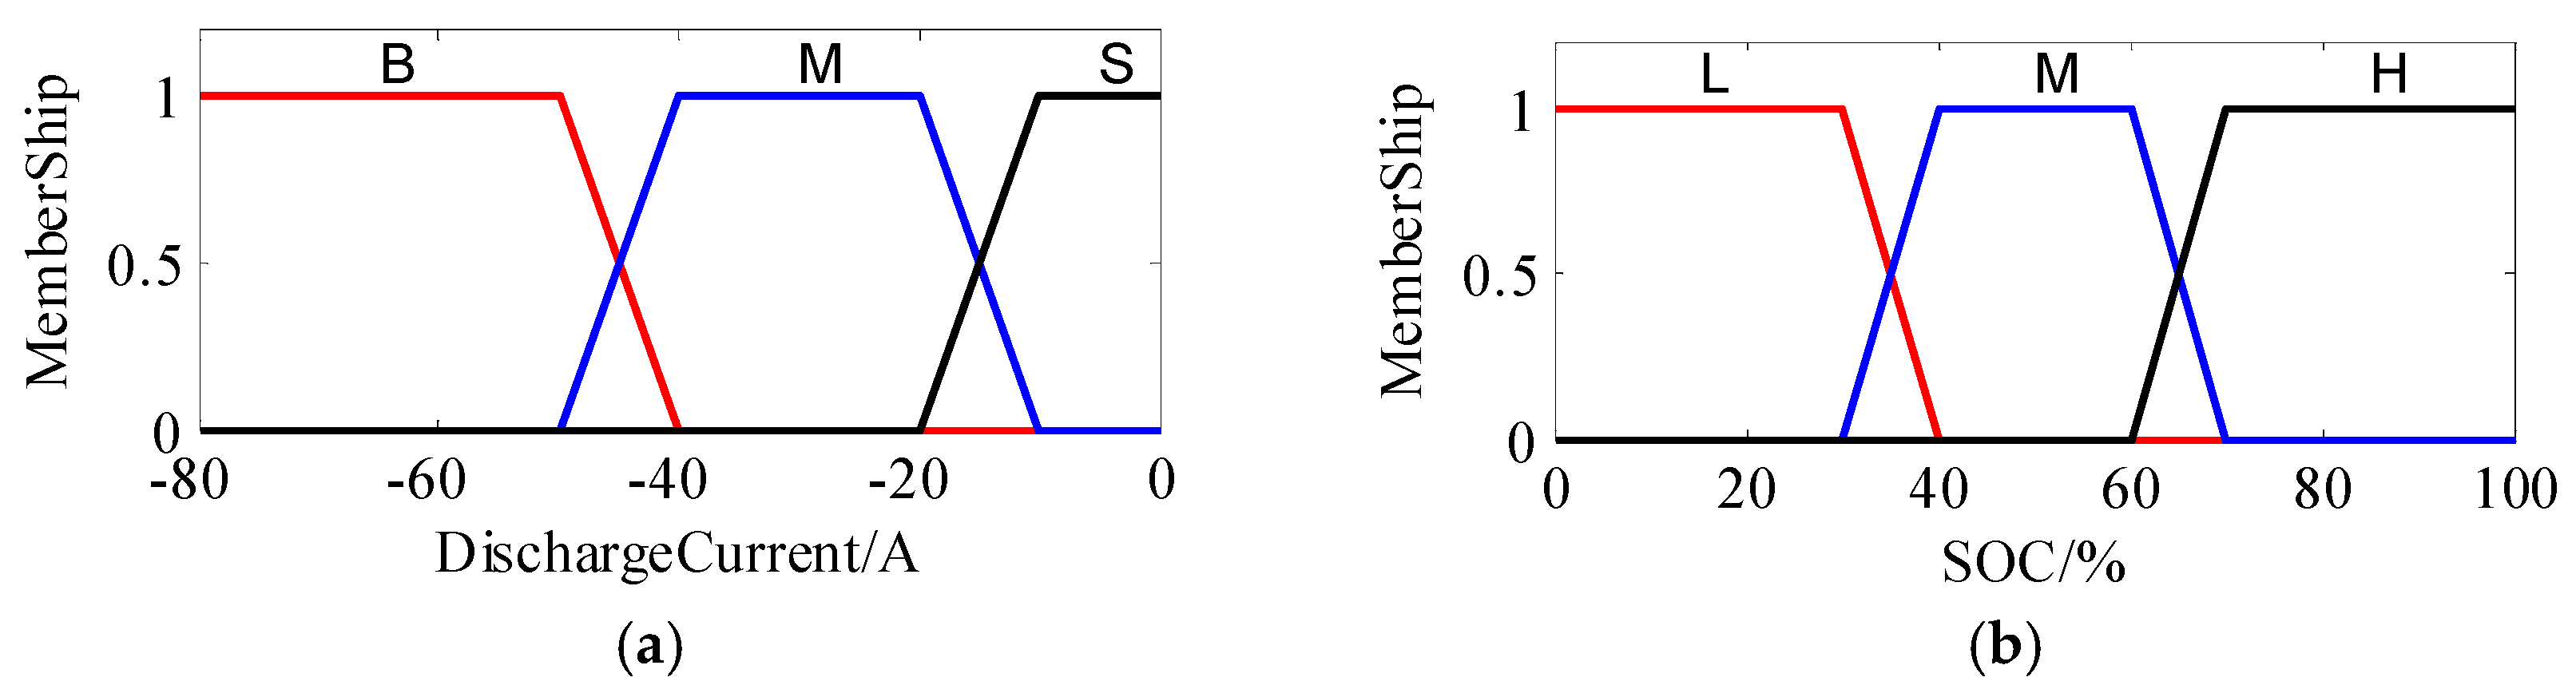
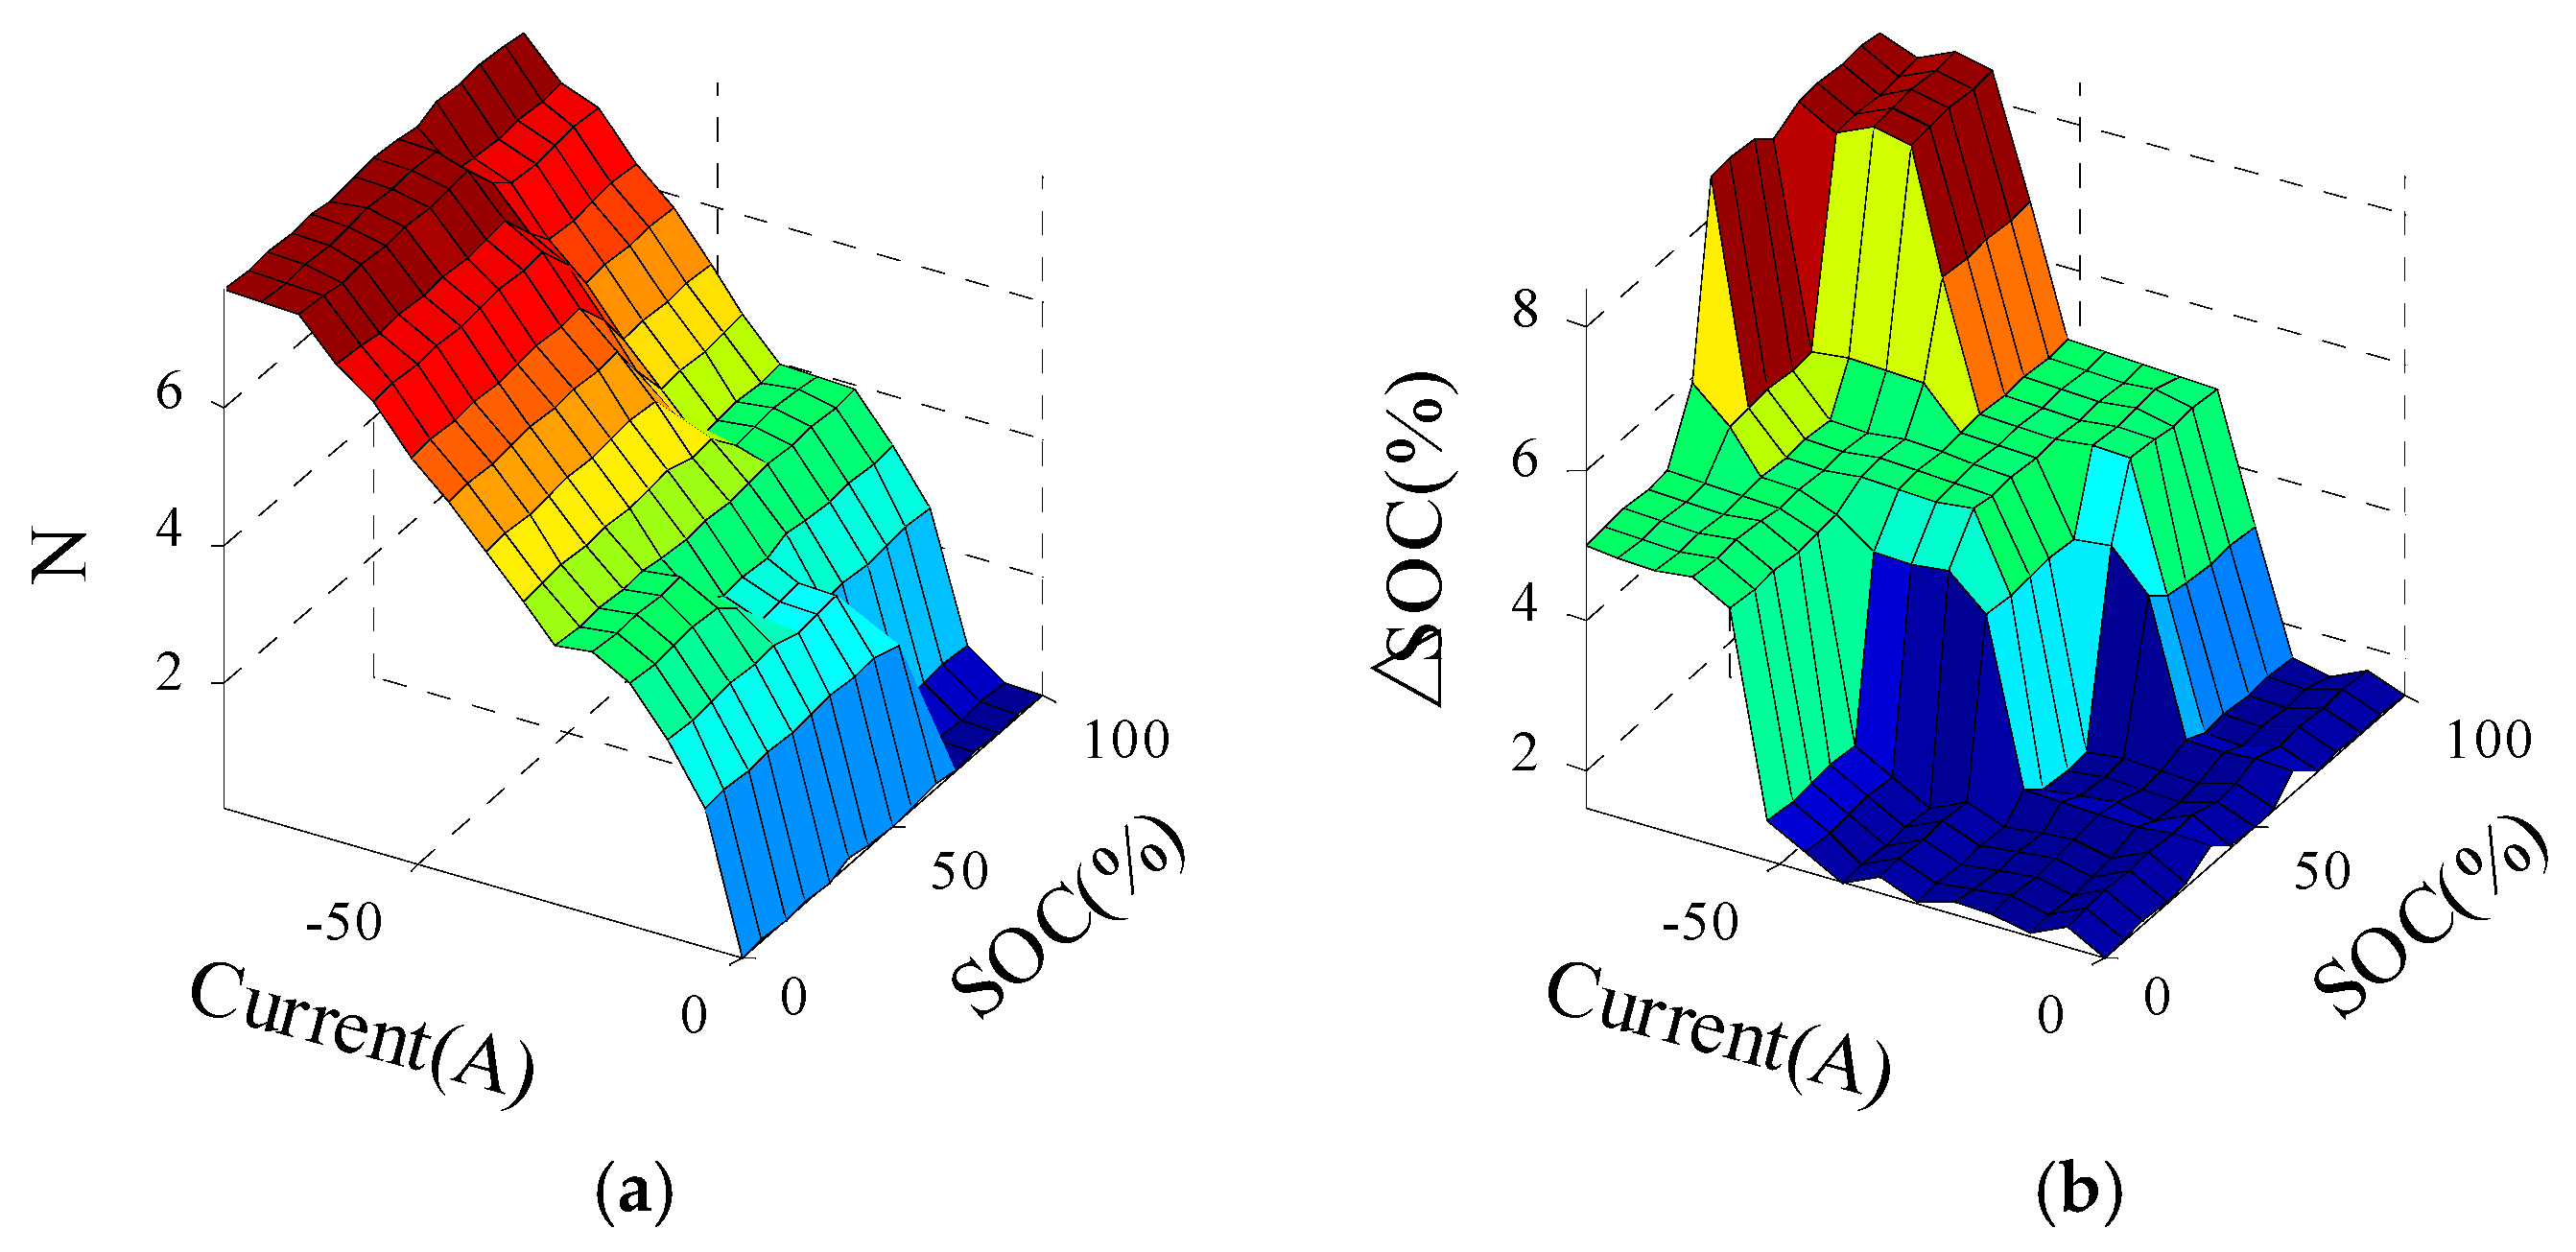
3.2. Fuzzy Logic Control Strategy

Traditional control theory is powerful in a linear system, but is difficult to control in a lithium battery, which is a nonlinear system [32,33]. FLC can simulate human knowledge and reasoning and is robust even when measurements are imprecise or when input characteristics change [34,35,36]. To explore the influence of different factors, such as power demand and discharge current, this study uses fuzzy control strategy in the PCCEM strategy. FLC calculates the optimal number of cells connected in the circuit and the value of ΔSOC.
The two FLC inputs are cell SOC and demand current. These inputs can be quantified into different grades and expressed with linguistic variables, such as small and medium. The membership functions of discharge current and battery SOC, which are based on extensive experimental data and theoretical analysis, are indicated in Figure 7. Figure 7a shows the membership function of demand current. The fuzzy subset L, M, H signifies that the current demand is low, medium, or high, respectively. Figure 7b shows the membership functions of pack SOC, whereas the fuzzy subset L, M, and H shows the battery pack SOC as insufficient, medium, and enough, respectively.
The objective of managing the discharge current is to make every cell work with high efficiency and safety. The rules for management, which are based on experience and experimental results, are summarized in Figure 8. Figure 8a shows that the number (N) of cells connected to the circuit increases with increasing discharge current, but decreases with increasing SOC. Figure 8b shows that ΔSOC, which is the interval to reorder SOCs, increases with increasing discharge current and with increasing SOC.

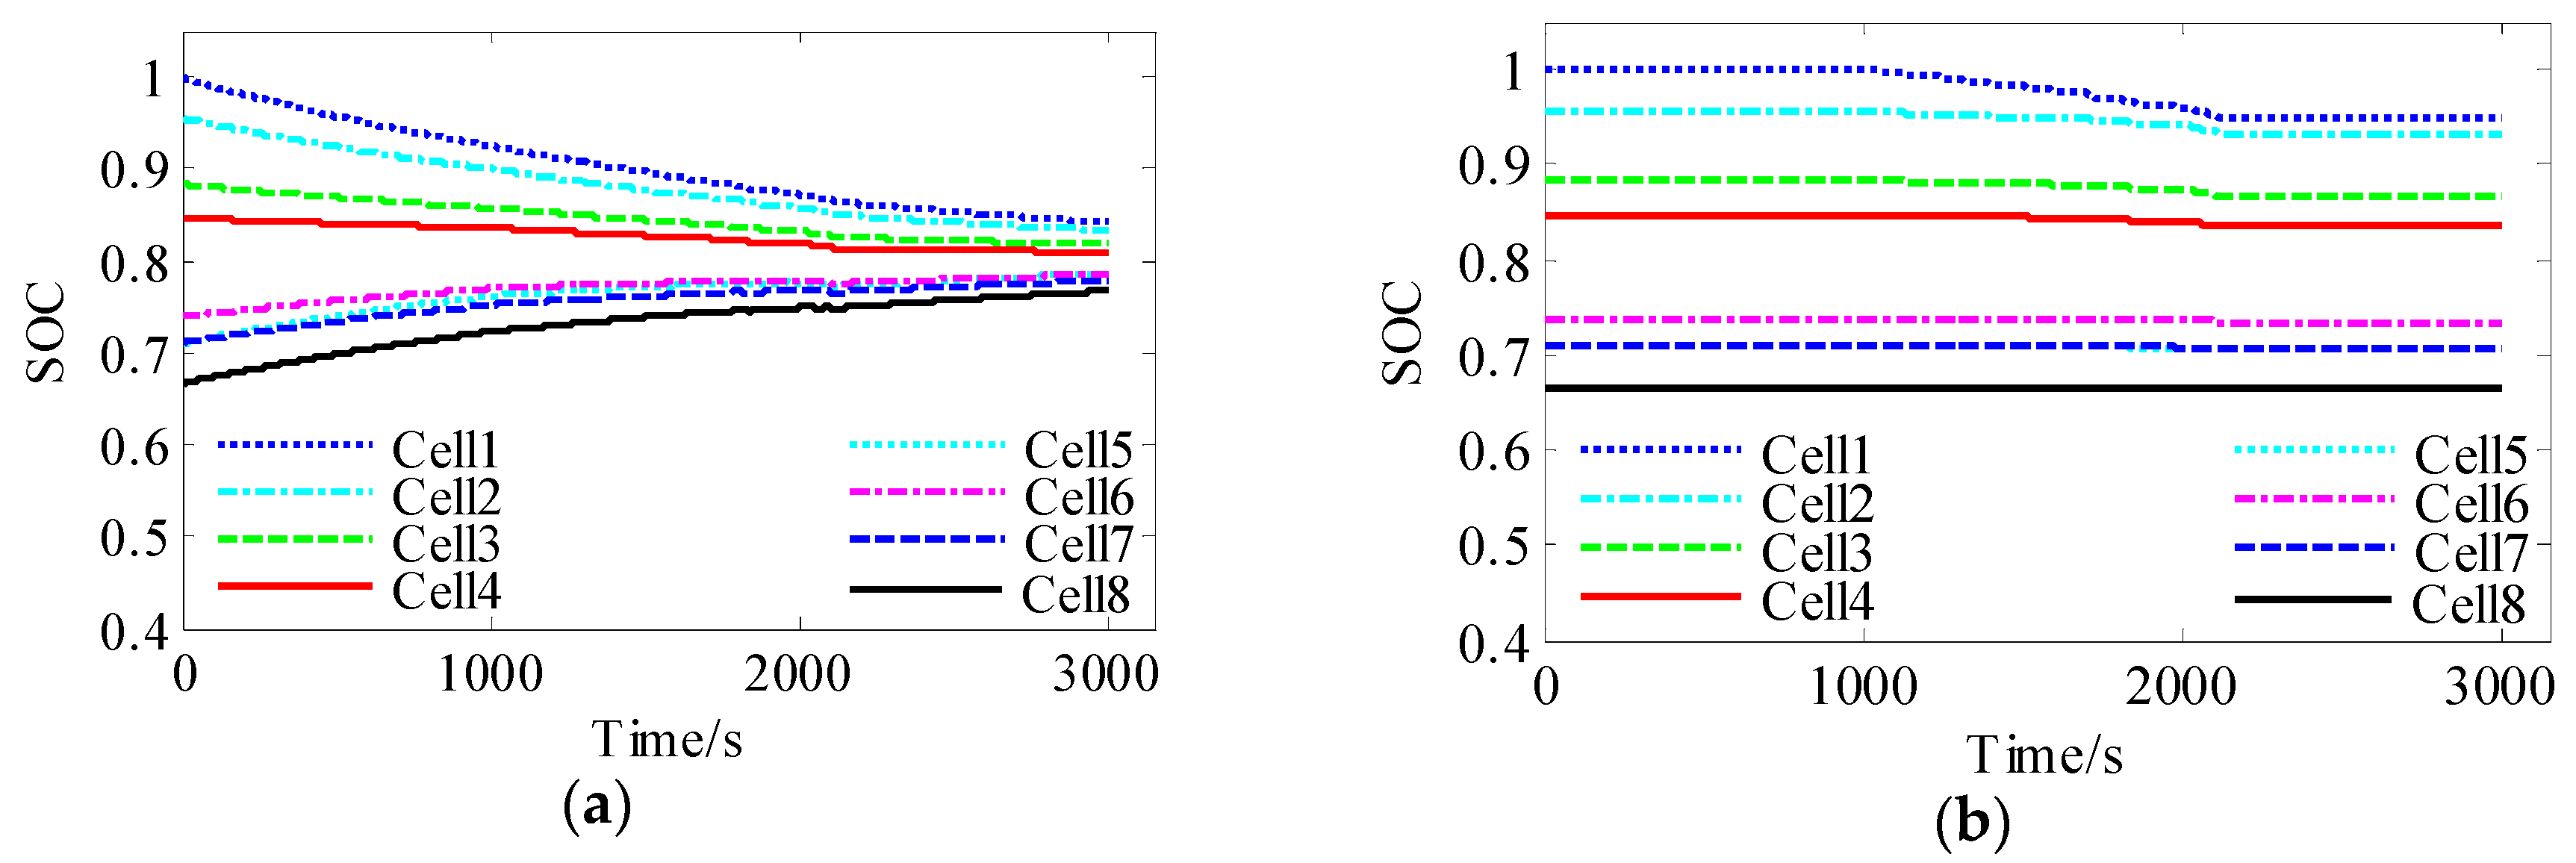
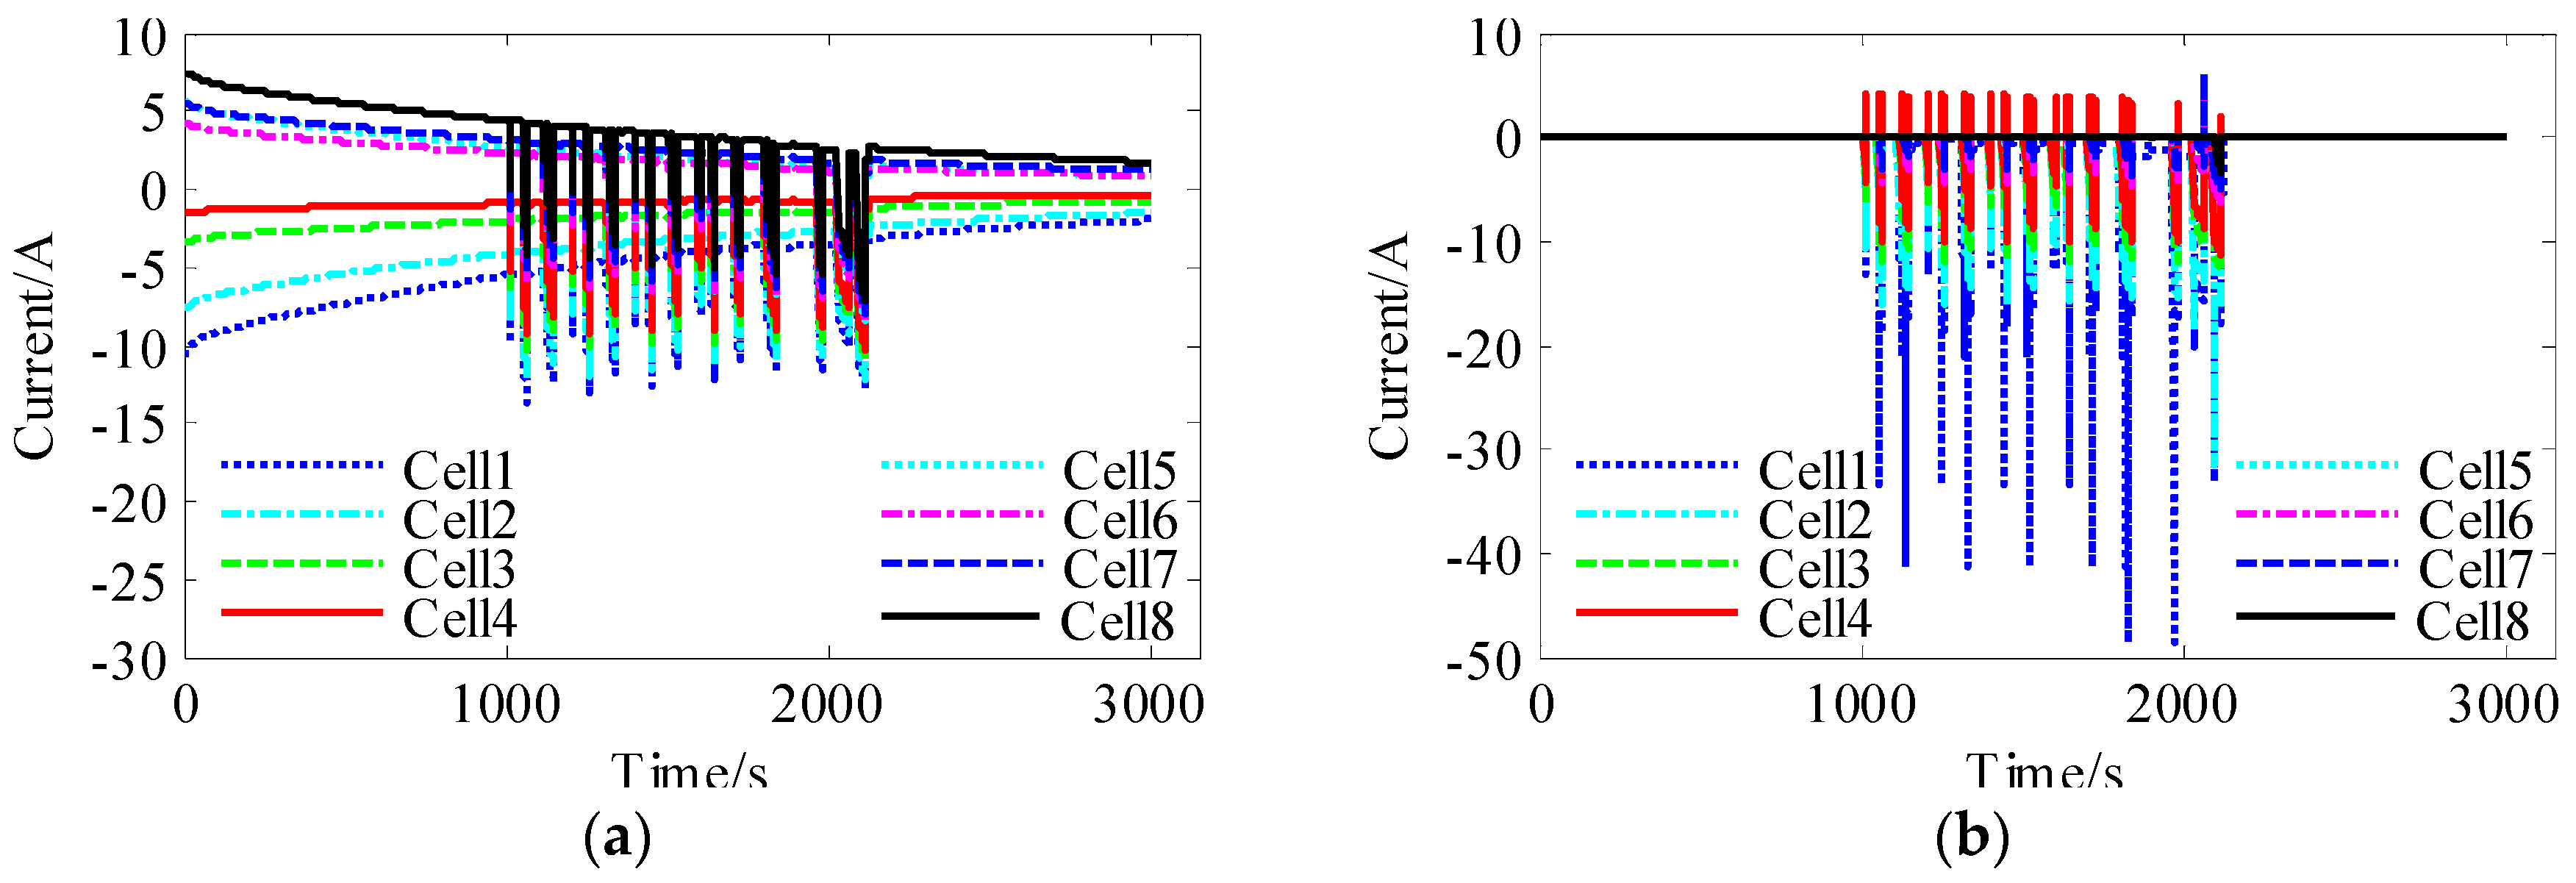
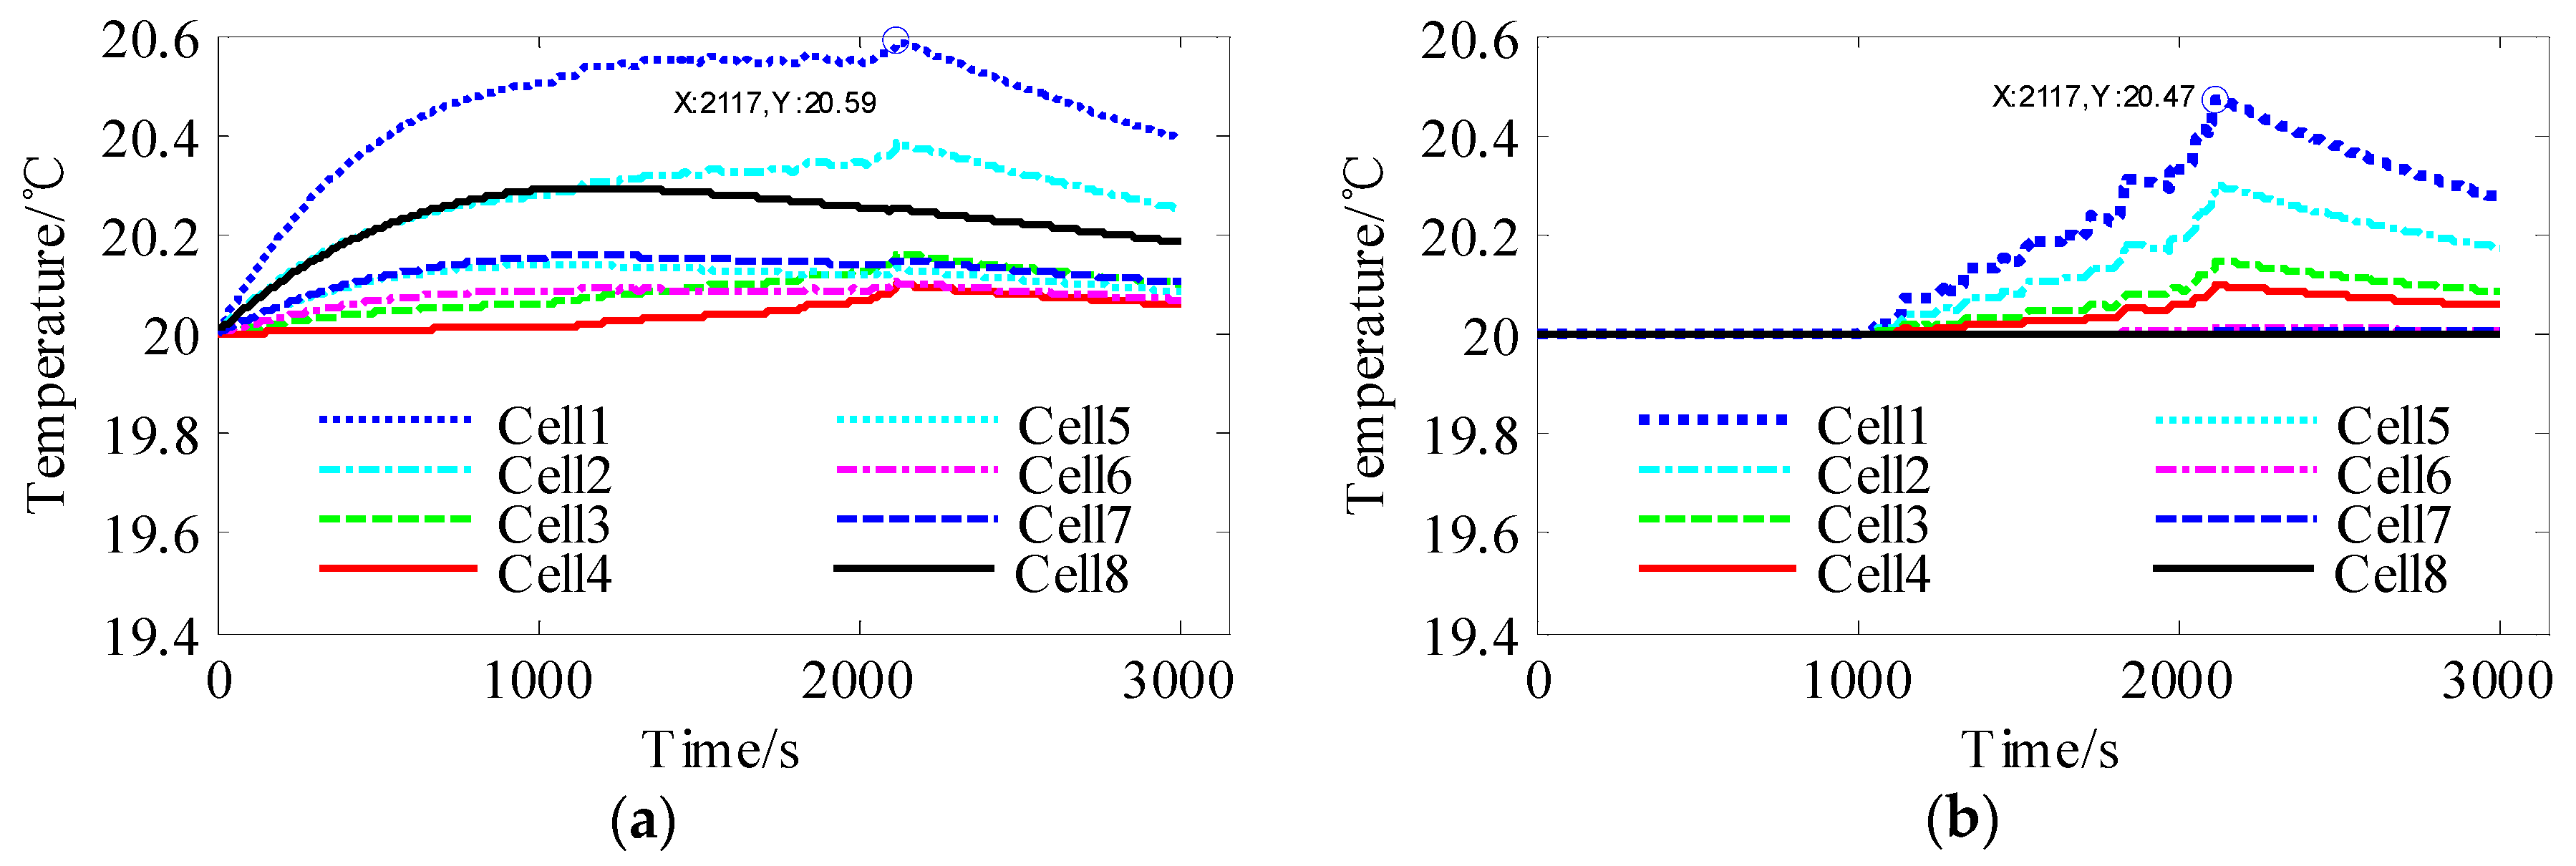
4. Discussion of Simulation Results

To verify the control effect of PCCEM, a NEDC simulation experiment is conducted with the PCCP model presented in Figure 5. The parameters of the batteries in the PCCP were obtained from eight different aged batteries (power-oriented, max voltage 4.2 V, 31 Ah lithium ion cells of the LiNixMnyCozO2 chemistry) using the parameter identification method in [21].The initial distributions in SOH and capacity among cells in the PCCP are listed as Table 1.
The load of the NEDC cycle is a vehicle simulation model, in which mass M = 3000 kg, road dragging coefficient Ψ = 0.0076 + 0.000056 × uv, correction coefficient of rotating mass δ = 1.2, coefficient of air resistance CD = 0.3, and windward area A = 2.1 m2.
Figure 9a shows the profiles of vehicle speed and pack discharge current. The idle condition during 0–1000 s and 2117–3000 s highlights the performance of PCCEM.
Figure 10a shows the SOCs without PCCEM strategy. Figure 10b shows the SOCs with PCCEM. During the driving cycles, the SOC of the eight cells changed in different ways. During 0–1000 s and 2117–3000 s, cells with higher SOC (Cells 1–4) are discharged, whereas the others (Cells 5–8) are charged. Loop current is shown in Figure 11a. All SOCs remain unchanged while the PCCEM strategy is on. Loop current is close to zero in Figure 11b. During 1000–2117 s, cells with a high SOC simultaneously supply the current for the load and charge cells with a low SOC, as shown in Figure 10a. In Figure 10b, the cells discharge in the SOC order and only cells with a higher SOC supply power when in light load. Then, cells with a low SOC are disconnected from the circuit. Therefore, loop current decreases significantly.
Figure 11a shows the cell current without PCCEM strategy. Figure 11b shows the cell current with PCCEM. During 0–1000 s and 2117–3000 s, the demand power is zero and the pack does not need to discharge, as shown in Figure 9b. However, Figure 11a shows that loop current exists if a discrepancy in the SOC occurs in the parallel cells. Figure 11b clearly shows that with the PCCEM strategy, all the cells are disconnected from the bus when the power demand is zero. Hence, the current of each cell is zero, and no loop current will occur.
Figure 12a shows the cell temperature without PCCEM strategy, and Figure 12b shows the cell temperature with PCCEM. The power dissipated inside the cell (Ps) can be calculated as:
Ps = I2 × R0 + I12 × R1
where I and I1 are the current through the resistors R and R1, respectively. The meaning of R0 and R1 are presented in Figure 3.
Cell temperature is computed by solving the heat equation of a homogeneous body that is exchanging heat with its environment [19]. Comparing Figure 12a,b reveals that the temperature of each cell is different from each other even in idle mode, given loop current. When PCCEM is on at the end of NEDC, the highest temperature is 20.47 °C, which is lower than 20.59 °C in Figure 12a. Thus, the temperature difference decreases.
The consumed energy during the NEDC cycle can be calculated by
E = m = 1 8 u m ( t ) i m ( t ) d t
where um(t) is the voltage of the cell and im(t) is the current flow through the cell.
The dissipated energy per cell can be calculated via the time integration of Ps. Then, adding the values yields dissipated energy.
Our calculations show that the energy consumed by the NEDC cycle is 24.75 kJ. As shown in Figure 13, the dissipated energy is 2.145 kJ, which accounts for 8.66% of the consumed energy. The distinction of dissipated energy is very clear at the beginning of the discharge circle. When PCCEM is on, the circuit current almost disappears, especially at 0–1000 s, where the dissipated energy is zero and the PCCEM of the experiment is approximately 1.171 kJ. At the end of this working condition, the PCCEM strategy reduces the dissipated energy from 2.145 to 0.571 kJ, which indicates that 73.3% is cut off. Namely, during the NEDC cycle, 6.36% of the consumed energy is avoided by the PCCEM.
In the simulation, the closed resistance of each switch is 0.01 Ohm, and the open conductance is 10−8 1/Ohm. The switching frequency was restricted to very small scales; thus, we calculated for the power consumed by the switches closed resistance and the current flow through it. The formula is:
E s = n = 1 8 i n 2 ( t ) R s w i t c h d t
The result is shown in Figure 14. When t = 3000 s, Es = 0.597 kJ when the power consumed by the switches is taken into account. The PCCEM strategy reduces the dissipated energy from 2.145 to 1.168 kJ, which indicates that 45.5% is the cut off, rather than 73.3%. Therefore, the power consumed by the switches is not negligible in the experiment.
The experimental results verify that the PCCEM algorithm can isolate poorly performing cells and arrange the discharge order of cells to effectively reduce loop current. Hence, the algorithm simultaneously reduces the pack-dissipated energy and improves the utilization rate of battery power.

5. Conclusions and Prospects

This study built a Simscape PCCP model that considers thermal effect. The PCCEM strategy is proposed on the basis of the PCCP model and fuzzy control logic. The PCCEM strategy automatically adjusts the number of cells in the circuit in accordance with load demand and turns on the first N switches in the corresponding SOC order. This method can be easily utilized in a single parallel string.
For a pack with many parallel strings, for example, 64 cells, PCCEM can treat every eight cells as a group. Thus, eight groups were obtained. If we parallel eight groups and manage these groups with PCCEM, then we are managing a big group with 64 cells using PCCEM. The PCCP model is designed especially for aging cells, and the reuse of Li-ion EV batteries for energy storage systems in stationary settings is a promising technology to support improved management of the demand and supply of electricity [37]. Reused batteries from electric vehicles, hybrid electric vehicles, and plug-in hybrid electric vehicles present an excellent, cost-effective option for energy storage applications that can help build ‘smart grid’ technologies, such as computer-based remote control, automation, and information management, to improve the reliability, efficiency and economics of electricity generation and distribution (U.S. Department of Energy, 2014). The PCCP model can be used to control the discharge current of reused batteries to reduce loop current among them. However, the model has many limitations; for example, each cell needs a control switch and a current sensor, which will increase the cost. In addition, control in large-scale applications will become extremely complicated. This study is only a preliminary study. We believe that more work can be done with the PCCP model to manage the measurement of PCCP energy in the future.

Acknowledgments

This research is funded by the Key Tackling Item in Science and Technology Department of Jilin Province (Grant No. 20150204017GX).

Author Contributions

Chuanxue Song and Yulong Shao conceived and designed the experiments; Shixin Song and Silun Peng performed the experiments; Cheng Chang and Fang Zhou analyzed the data; Chuanxue Song and Feng Xiao contributed reagents/materials/analysis tools; Yulong Shao and Feng Xiao wrote the paper.

Conflicts of Interest

The authors declare no conflict of interest. The founding sponsors had no role in the design of the study; in the collection, analyses, or interpretation of data; in the writing of the manuscript, and in the decision to publish the results.

References

  1. Yang, N.X.; Zhang, X.W.; Shang, B.B.; Li, G.J. Unbalanced discharging and aging due to temperature differences among the cells in a lithium-ion battery pack with parallel combination. J. Power Sources 2016, 306, 733–741. [Google Scholar] [CrossRef]
  2. Dong, G.Z.; Wei, J.W.; Zhang, C.B.; Chen, Z.H. Online state of charge estimation and open circuit voltage hysteresis modeling of LiFePO4 battery using invariant imbedding method. Appl. Energy 2016, 162, 163–171. [Google Scholar] [CrossRef]
  3. Ganesan, N.; Basu, S.; Hariharan, K.S.; Kolake, S.M.; Song, T.; Yeo, T.; Sohn, D.K.; Doo, S. Physics based modeling of a series parallel battery pack for asymmetry analysis, predictive control and life extension. J. Power Sources 2016, 322, 57–67. [Google Scholar] [CrossRef]
  4. Gong, X.; Xiong, R.; Mi, C.C. Study of the characteristics of battery packs in electric vehicles with parallel-connected lithium-ion battery cells. IEEE Trans. Ind. Appl. 2015, 51, 1872–1879. [Google Scholar] [CrossRef]
  5. Wang, Y.J.; Yang, D.; Zhang, X.; Chen, Z.H. Probability based remaining capacity estimation using data-driven and neural network model. J. Power Sources 2016, 315, 199–208. [Google Scholar] [CrossRef]
  6. Wang, S.L.; Shang, L.P.; Li, Z.F.; Deng, H.; Li, J.C. Online dynamic equalization adjustment of high-power lithium-ion battery packs based on the state of balance estimation. Appl. Energy 2016, 166, 44–58. [Google Scholar] [CrossRef]
  7. Kim, J.; Kim, S.; Jin, Y.; Park, J.-K.; Yoon, Y. Optimal coordinated management of a plug-in electric vehicle charging station under a flexible penalty contract for voltage security. Energies 2016, 9, 538. [Google Scholar] [CrossRef]
  8. Moo, C.S.; Ng, K.S.; Hsieh, Y.C. Parallel operation of battery power modules. In Proceedings of the Sixth International Conference on Power Electronics and Drive Systems(PEDS 2005), Kualu Lumpur, Malaysia, 28 November–1 December 2005; pp. 983–988.
  9. Tang, X.P.; Wang, Y.J.; Chen, Z.H. A method for state-of-charge estimation of LiFePO4 batteries based on a dual-circuit state observer. J. Power Sources 2015, 296, 23–29. [Google Scholar] [CrossRef]
  10. Shi, W.; Hu, X.S.; Jin, C.; Jiang, J.C.; Zhang, Y.R.; Yip, T. Effects of imbalanced currents on large-format LiFePO4/graphite batteries systems connected in parallel. J. Power Sources 2016, 313, 198–204. [Google Scholar] [CrossRef]
  11. Xu, J.; Li, S.; Mi, C.; Chen, Z.; Cao, B. SOC based battery cell balancing with a novel topology and reduced component count. Energies 2013, 6, 2726. [Google Scholar] [CrossRef]
  12. Ye, Y.M.; Cheng, K.W.E. Modeling and analysis of series-parallel switched-capacitor voltage equalizer for battery/supercapacitor strings. IEEE J. Emerg. Sel. Top. Power Electron. 2015, 3, 977–983. [Google Scholar] [CrossRef]
  13. Chatzakis, J.; Kalaitzakis, K.; Voulgaris, N.C.; Manias, S.N. Designing a new generalized battery management system. IEEE Trans. Ind. Electron. 2003, 50, 990–999. [Google Scholar] [CrossRef]
  14. Wang, L.M.; Cheng, Y.; Zhao, X.L. A LiFePO4 battery pack capacity estimation approach considering in-parallel cell safety in electric vehicles. Appl. Energy 2015, 142, 293–302. [Google Scholar] [CrossRef]
  15. Bruen, T.; Marco, J.; Gama, M. Current variation in parallelized energy storage systems. In Proceedings of the 2014 IEEE Vehicle Power and Propulsion Conference (VPPC 2014), Coimbra, Portugal, 27–30 October 2014.
  16. Hsu, C.T.; Sheng, S.; Sun, Q.; Li, P.; Lehman, B. Increased energy delivery for parallel battery packs with no regulated bus. In Proceedings of the 2012 IEEE 34th International Telecommunications Energy Conference, Scottsdale, AZ, USA, 30 September–4 October 2012.
  17. Barre, A.; Deguilhem, B.; Grolleau, S.; Gerard, M.; Suard, F.; Riu, D. A review on lithium-ion battery ageing mechanisms and estimations for automotive applications. J. Power Sources 2013, 241, 680–689. [Google Scholar] [CrossRef]
  18. Maher, K.; Yazami, R. A study of lithium ion batteries cycle aging by thermodynamics techniques. J. Power Sources 2014, 247, 527–533. [Google Scholar] [CrossRef]
  19. Offer, G.J.; Yufit, V.; Howey, D.A.; Wu, B.; Brandon, N.P. Module design and fault diagnosis in electric vehicle batteries. J. Power Sources 2012, 206, 383–392. [Google Scholar] [CrossRef] [Green Version]
  20. Bruen, T.; Marco, J. Modelling and experimental evaluation of parallel connected lithium ion cells for an electric vehicle battery system. J. Power Sources 2016, 310, 91–101. [Google Scholar] [CrossRef]
  21. Huria, T.; Ceraolo, M.; Gazzarri, J.; Jackey, R. High fidelity electrical model with thermal dependence for characterization and simulation of high power lithium battery cells. In Proceedings of the 2012 IEEE International Electric Vehicle Conference(IEVC 2012), Greenville, SC, USA, 4–8 March 2012; IEEE Computer Society: Greenville, SC, USA, 2012. [Google Scholar]
  22. Tang, X.; Liu, B.; Gao, F.; Lv, Z. State-of-Charge Estimation for Li-Ion Power Batteries Based on a Tuning Free Observer. Energies 2016, 9, 675. [Google Scholar] [CrossRef]
  23. Nejad, S.; Gladwin, D.T.; Stone, D.A. A systematic review of lumped-parameter equivalent circuit models for real-time estimation of lithium-ion battery states. J. Power Sources 2016, 316, 183–196. [Google Scholar] [CrossRef]
  24. Nikolian, A.; Firouz, Y.; Gopalakrishnan, R.; Timmermans, J.-M.; Omar, N.; van den Bossche, P.; van Mierlo, J. Lithium ion batteries—Development of advanced electrical equivalent circuit models for nickel manganese cobalt lithium-ion. Energies 2016, 9, 360. [Google Scholar] [CrossRef]
  25. Guo, X.; Kang, L.; Yao, Y.; Huang, Z.; Li, W. Joint estimation of the electric vehicle power battery state of charge based on the least squares method and the kalman filter algorithm. Energies 2016, 9, 100. [Google Scholar] [CrossRef]
  26. Hu, X.S.; Li, S.B.; Peng, H. A comparative study of equivalent circuit models for Li-ion batteries. J. Power Sources 2012, 198, 359–367. [Google Scholar] [CrossRef]
  27. Seaman, A.; Dao, T.-S.; McPhee, J. A survey of mathematics-based equivalent-circuit and electrochemical battery models for hybrid and electric vehicle simulation. J. Power Sources 2014, 256, 410–423. [Google Scholar] [CrossRef]
  28. Wang, Y.J.; Zhang, C.B.; Chen, Z.H. An adaptive remaining energy prediction approach for lithium-ion batteries in electric vehicles. J. Power Sources 2016, 305, 80–88. [Google Scholar] [CrossRef]
  29. Farmann, A.; Waag, W.; Sauer, D.U. Adaptive approach for on-board impedance parameters and voltage estimation of lithium-ion batteries in electric vehicles. J. Power Sources 2015, 299, 176–188. [Google Scholar] [CrossRef]
  30. MingYu, Y.B.; Vega, M. Theory and Implementation of Impedance Track™ Battery Fuel-Gauging Algorithm in bq2750x Family; Texas Instruments Application Note(SLUA450); Texas Instruments: Dallas, TX, USA, 2008. [Google Scholar]
  31. Kim, J.; Cho, B.H. Screening process-based modeling of the multi-cell battery string in series and parallel connections for high accuracy state-of-charge estimation. Energy 2013, 57, 581–599. [Google Scholar] [CrossRef]
  32. He, H.W.; Xiong, R.; Zhao, K.; Liu, Z.T. Energy management strategy research on a hybrid power system by hardware-in-loop experiments. Appl. Energy 2013, 112, 1311–1317. [Google Scholar] [CrossRef]
  33. Liu, D.; Wang, Y.; Shen, Y. Electric vehicle charging and discharging coordination on distribution network using multi-objective particle swarm optimization and fuzzy decision making. Energies 2016, 9, 186. [Google Scholar] [CrossRef]
  34. Yan, J.Y.; Cheng, Z.; Xu, G.Q.; Qian, H.H.; Xu, Y.S. Fuzzy control for battery equalization based on state of charge. In Proceedings of the 2010 IEEE 72nd Vehicular Technology Conference Fall, Ottawa, ON, USA, 6–9 September 2010.
  35. Eltamaly, A.M.; Farh, H.M. Maximum power extraction from wind energy system based on fuzzy logic control. Electr. Power Syst. Res. 2013, 97, 144–150. [Google Scholar] [CrossRef]
  36. Lee, Y.S.; Cheng, M.W. Intelligent control battery equalization for series connected lithium-ion battery strings. IEEE Trans. Ind. Electron. 2005, 52, 1297–1307. [Google Scholar] [CrossRef]
  37. Heymans, C.; Walker, S.B.; Young, S.B.; Fowler, M. Economic analysis of second use electric vehicle batteries for residential energy storage and load-levelling. Energy Policy 2014, 71, 22–30. [Google Scholar] [CrossRef]
Figure 1. Inconsistency in cells’ capacities and states of change (SOCs).
Energies 10 00404 g001
Figure 2. Operating principle of parallel-connected cell energy management (PCCEM): (a) without PCCEM; and (b) with PCCEM.
Energies 10 00404 g002
Figure 3. First-order RC equivalent circuit model.
Energies 10 00404 g003
Figure 4. Simscape model of the first-order RC equivalent circuit.
Energies 10 00404 g004
Figure 5. Simulink model of the eight parallel-cell pack.
Energies 10 00404 g005
Figure 6. The PCCEM control flow chart.
Energies 10 00404 g006
Figure 7. Membership functions of inputs. (a) Membership of discharge current; and (b) membership of battery SOC.
Energies 10 00404 g007
Figure 8. Decision surface of fuzzy logic controller. (a) The membership of N; and (b) the membership of SOC.
Energies 10 00404 g008
Figure 9. The profiles of speed and discharge current. (a) Speed profile for the experiment; and (b) discharge current profile of the packs.
Energies 10 00404 g009
Figure 10. Comparison of the SOCs. (a) SOC of each cell without PCCEM; and (b) SOC of each cell with PCCEM.
Energies 10 00404 g010
Figure 11. Comparison of loop currents. (a) Current of each cell without PCCEM; and (b) current of each cell with PCCEM.
Energies 10 00404 g011
Figure 12. Comparison of cell temperatures. (a) Temperature of each cell without PCCEM; and (b) temperature of each cell with PCCEM.
Energies 10 00404 g012
Figure 13. Comparison of dissipated energy.
Energies 10 00404 g013
Figure 14. The switches consumed power.
Energies 10 00404 g014
Table 1. Initial distributions in SOH and capacity among cells.
No.Cell 1Cell 2Cell 3Cell 4Cell 5Cell 6Cell 7Cell 8
Parameters
Capacity/Ah28.008127.625027.639225.862226.848724.773525.065324.1322
SOH/(%)90.3489.1189.1583.4286.6079.9180.8577.84
SOC/(%)10095.5788.3384.7170.9173.8571.0466.61

