3. Results and Discussion
See
Figure 1,
Figure 2,
Figure 3 and
Figure 4 for the experimentally determined maximum concentrations of hazardous emissions when burning the fuel compositions under study.
The data reported in
Figure 1,
Figure 2,
Figure 3 and
Figure 4 characterize a number of key aspects. For instance, CWS based on filter cakes do not make much difference in maximum concentrations of the main hazardous emissions (CO and CO
2) vs. CWS produced by high quality initial coals (
Figure 1 and
Figure 2). However, if we take into account the cost of coals and their processing waste (filter cakes) as well as their combustion heat (
Table 1), the advantages of using filter cakes become obvious, especially given the extremely large quantities of filter cake stocks and annual production (tens of millions of tons). Many countries would not need to mine for coal for a long time until all the filter cakes from waste disposal areas are utilized.
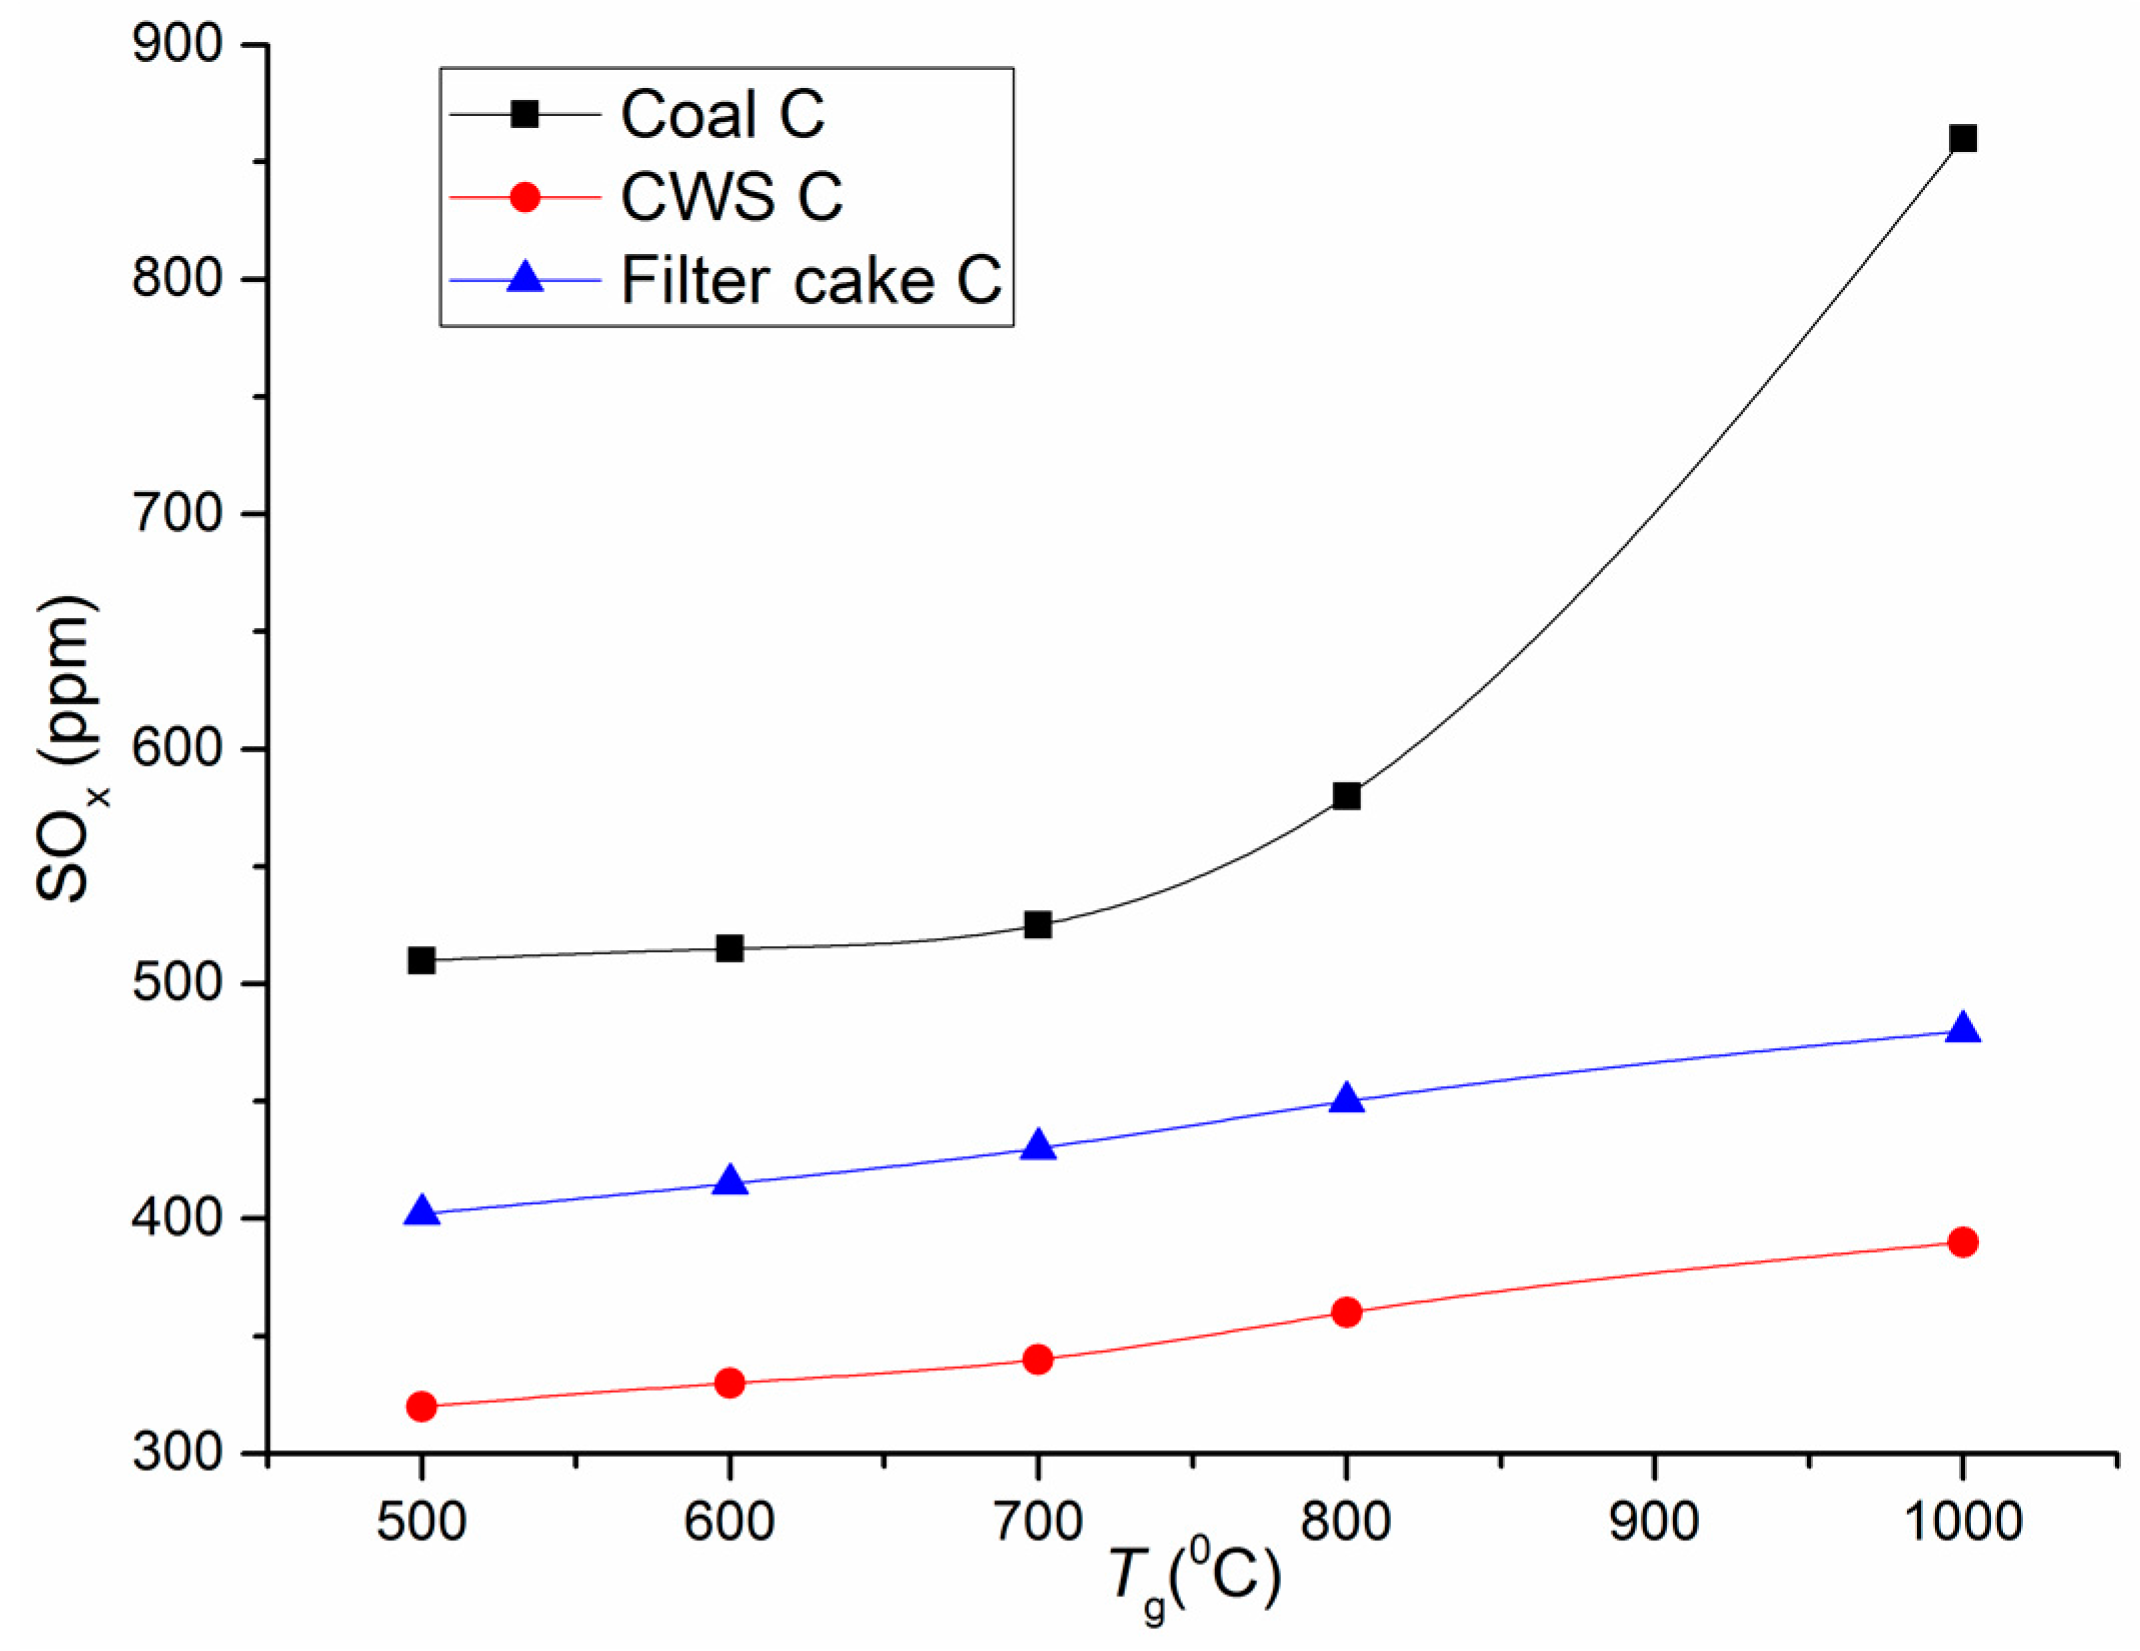
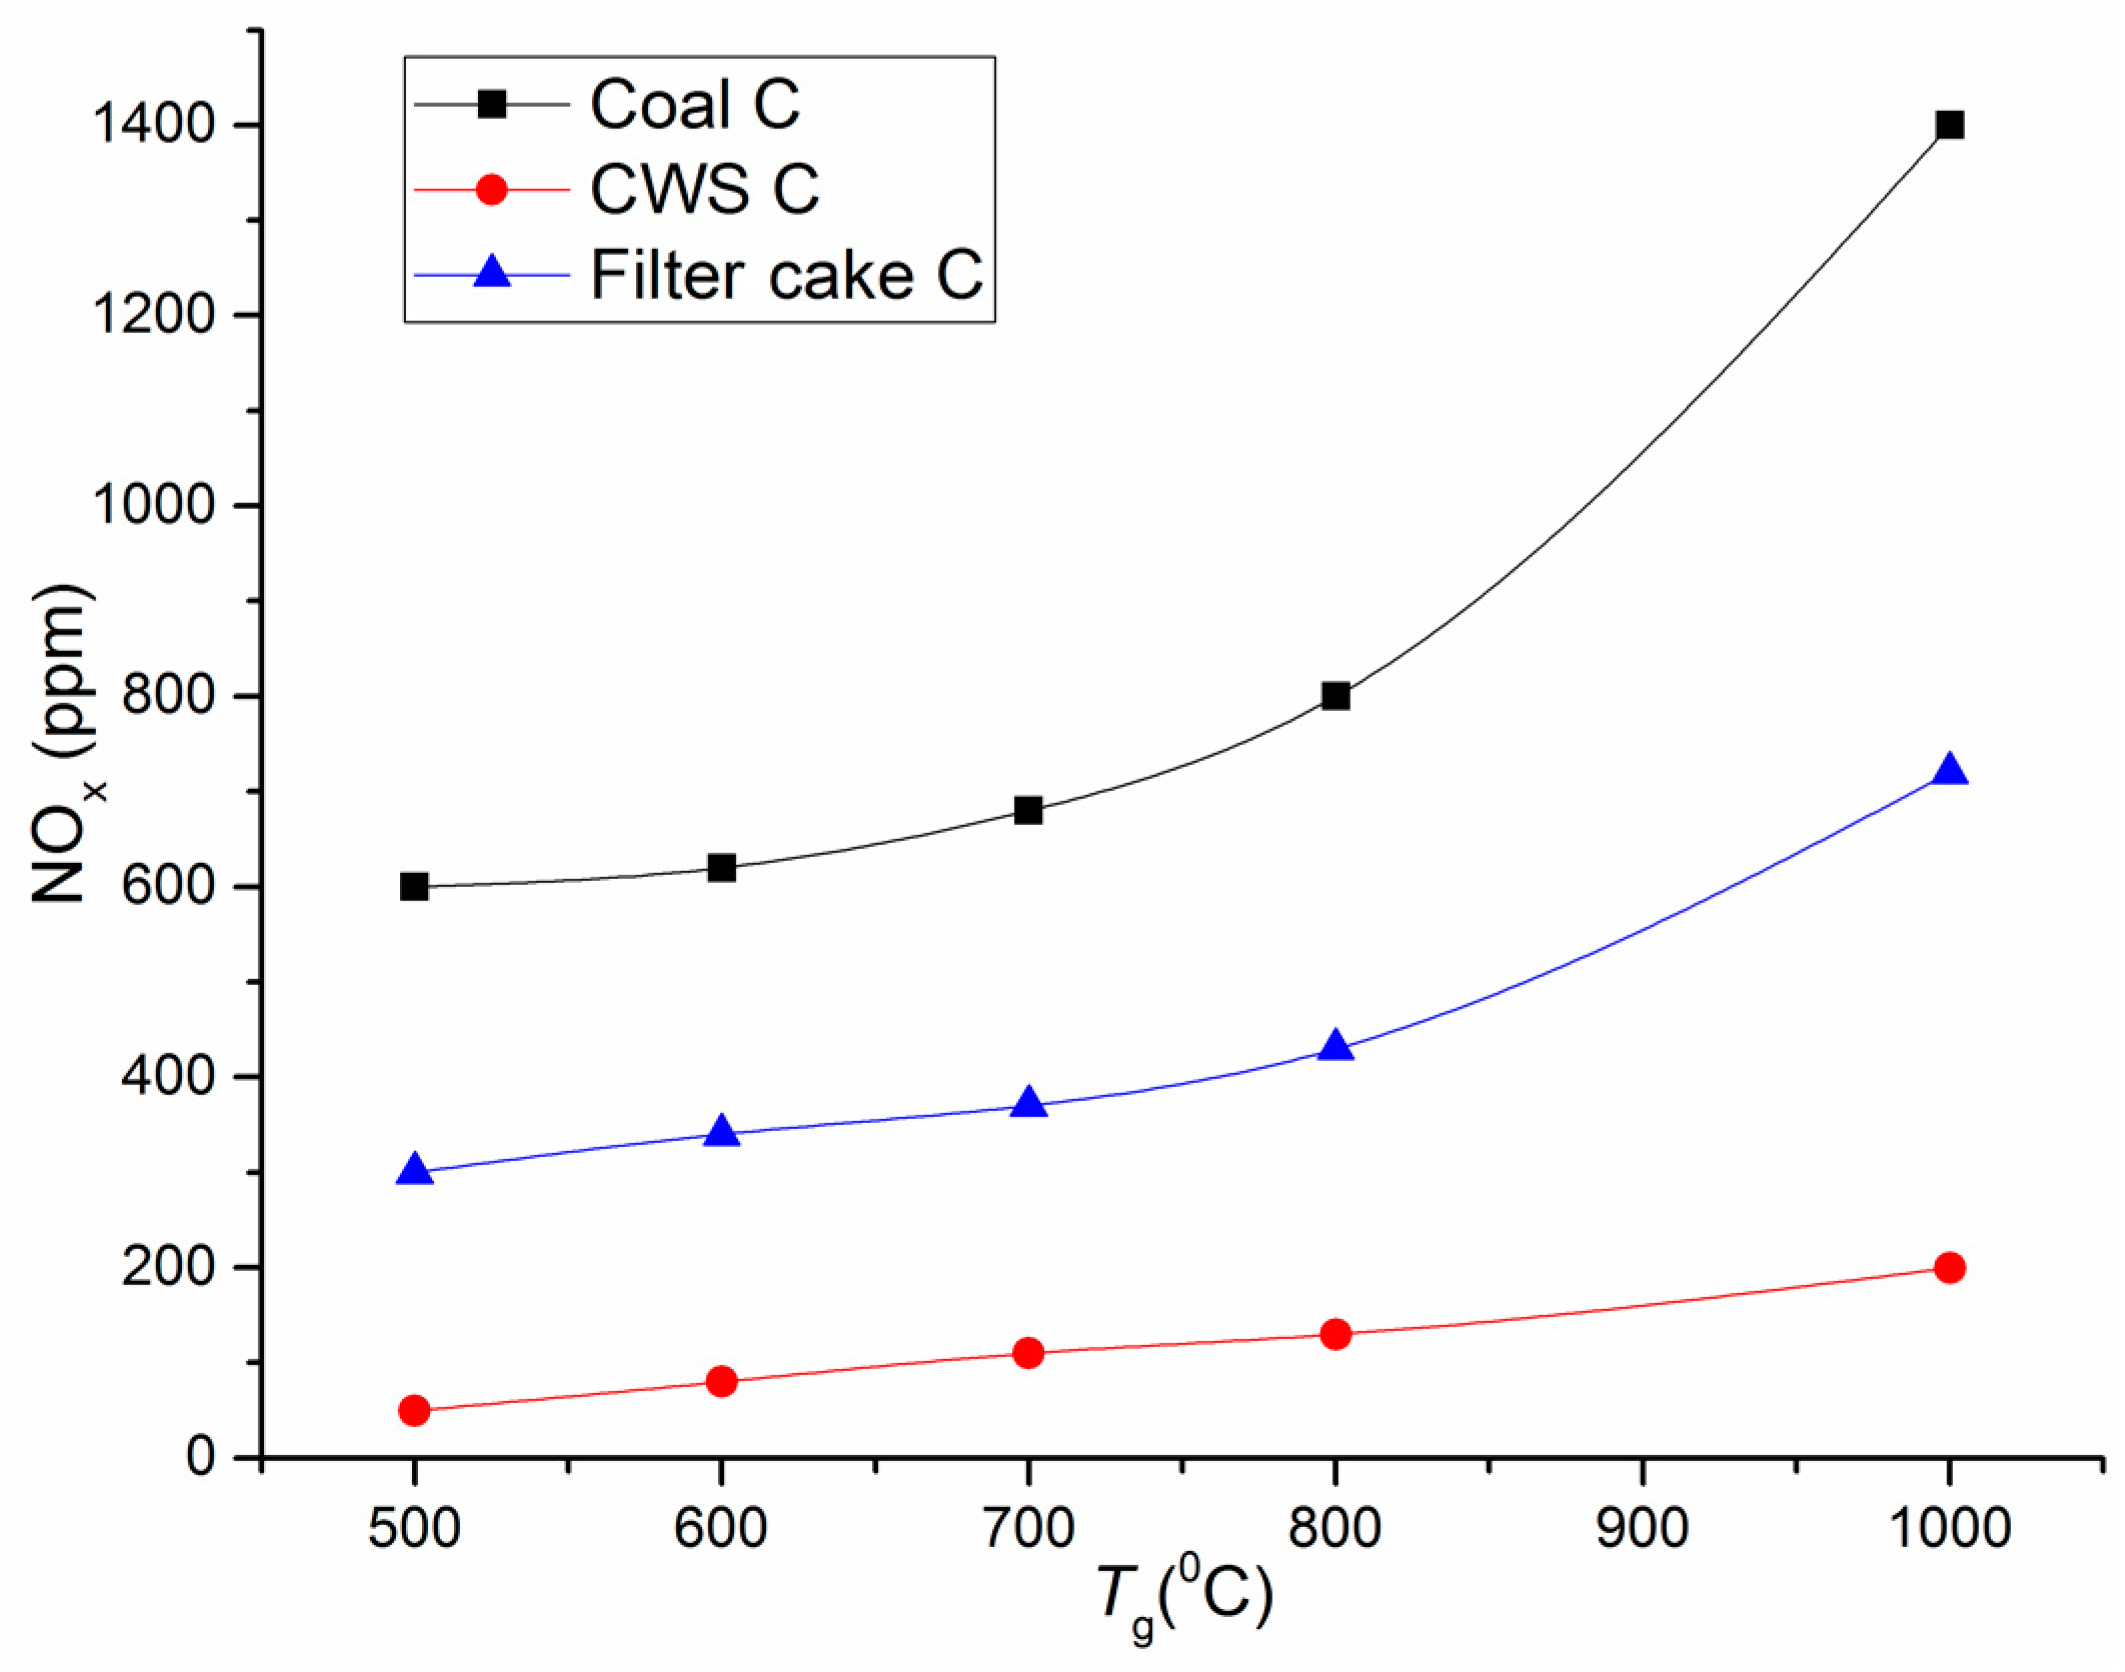
As shown by the curves illustrating how temperature affects the concentrations of the main anthropogenic emissions, the content of carbon and sulfur oxides (
Figure 3 and
Figure 4) in combustion products drops several-fold when using CWS technologies instead of pulverized coal combustion. As part of additional experiments that we performed with coals used for preparing CWS, coal dust was blown into the combustion chamber in the same way as CWS. If we compare the concentrations of the main greenhouse gases (e.g., CO
2), CWS technologies do not provide significant reduction of these emissions, but for NO
x and SO
x the benefits are obvious (
Figure 3 and
Figure 4).
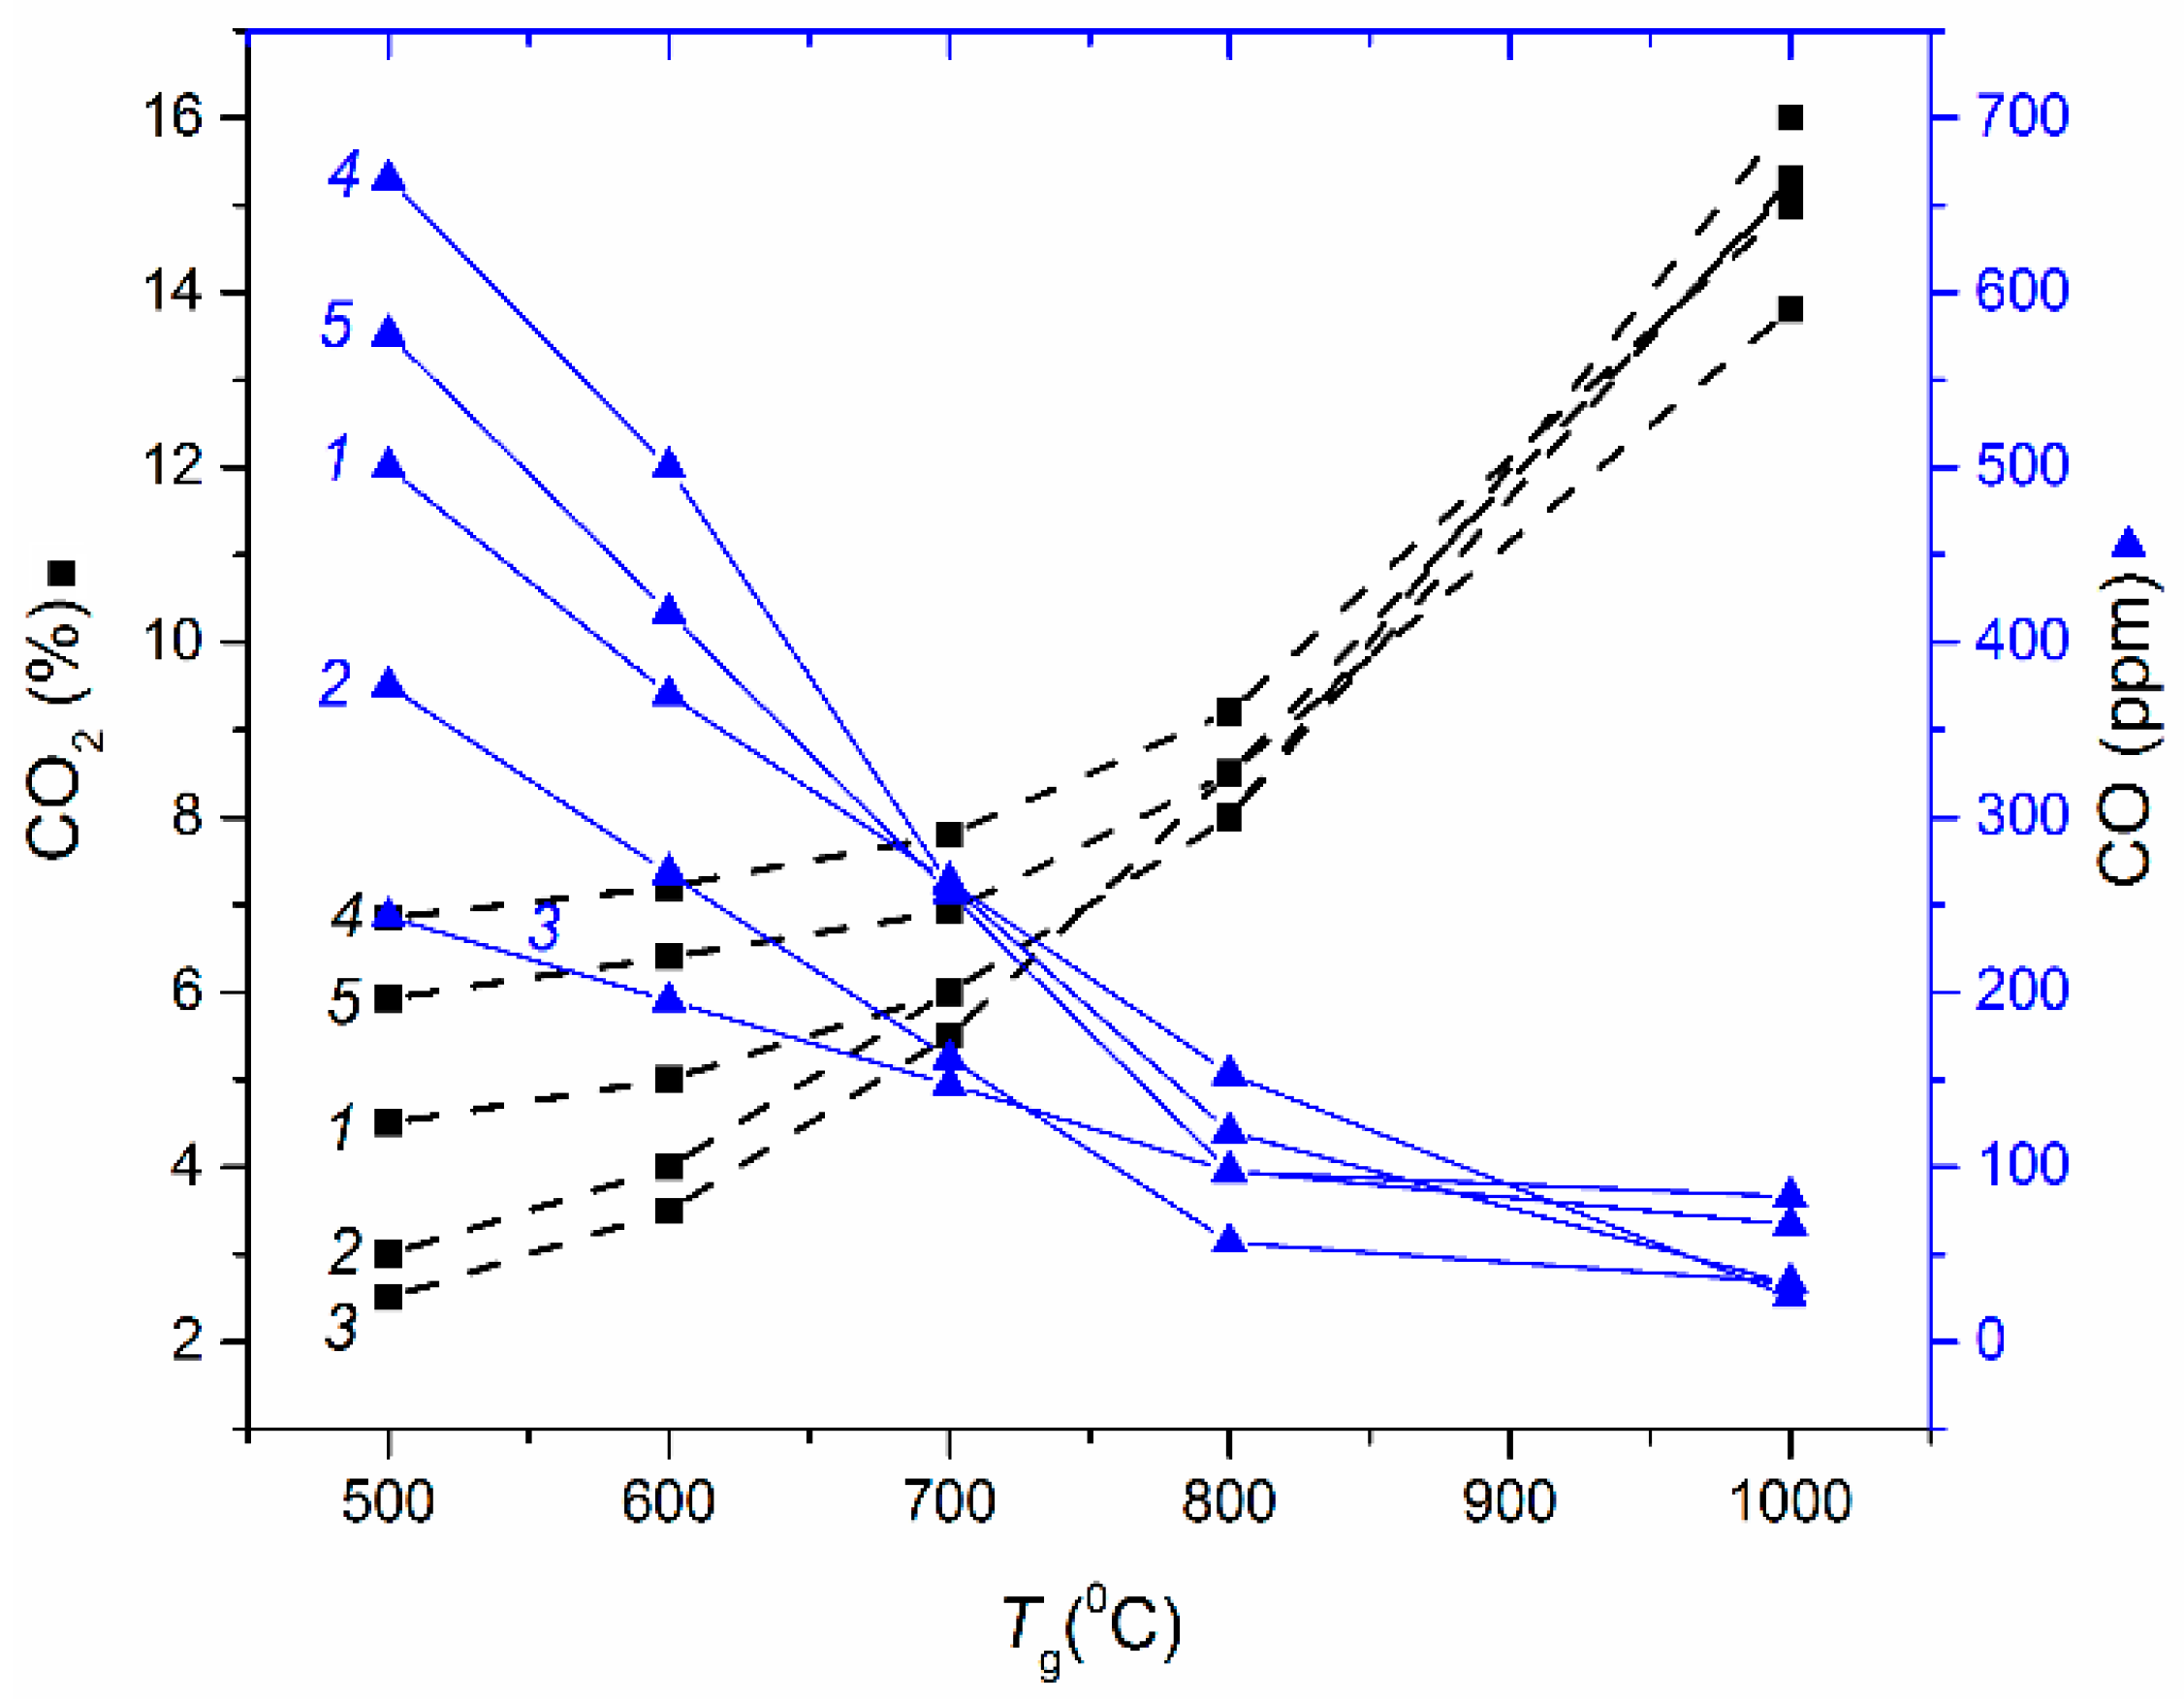
At the same time, the dependencies of CO
2 on temperature allow the conlusion that lowering temperatures substantially reduces the concentration of this greenhouse gas. Based on
Table 3, we can infer that lowering the combustion temperature of filter cakes from 850 °C down to 650 °C will lead to an insignificant decrease in underburning. The experimental results (
Figure 1 and
Figure 2) also show that this reduction may affect carbon monoxide and dioxide emissions more significantly (their concentrations may decrease by 30%–40%).
Another reason to switch to lower temperatures of fuel combustion is that, with many coal processing wastes, mixing them with water helps to reduce the limit (minimum) ignition temperatures (due to micro explosions [
11]). In particular, the works [
11,
12] show that CWS compositions based on coal filter cakes are ignited sustainably at temperatures within the range of 500 °C to 700 °C. Since sustainable ignition is possible at low temperatures, the concentrations of hazardous emissions in this case will be minimal and the underburning will change negligibly. With such prospects, these temperatures may become a standard in the power industry.
The work of [
13] studies the maximum temperatures and heat release in a laboratory combustion chamber when burning different filter cakes and coals as well as CWS and CWSP on their basis. The authors have established that the temperature in a combustion chamber moderately (insignificantly) depends on the oxidizer temperature when burning composite fuels (after exceeding the minimum oxidizer temperature necessary for the ignition of fuel slurry). This result does not seem obvious at first glance, but after the analysis of video frames and temperature distributions [
13], we can infer that it is quite logical. When enough energy is supplied to the fuel surface for sustainable ignition, the oxidation of volatiles (gas-phase reaction) and carbon (heterogeneous reaction) accelerates. Heat release from such reaction zones is several times higher than heat inflow from the oxidizer flow. Therefore, raising its temperature even by several hundred degrees above the minimum (sufficient for ignition) has little effect on the temperature in a combustion chamber. Such findings are given for all the filter cakes and CWSPs on their basis studied in this work [
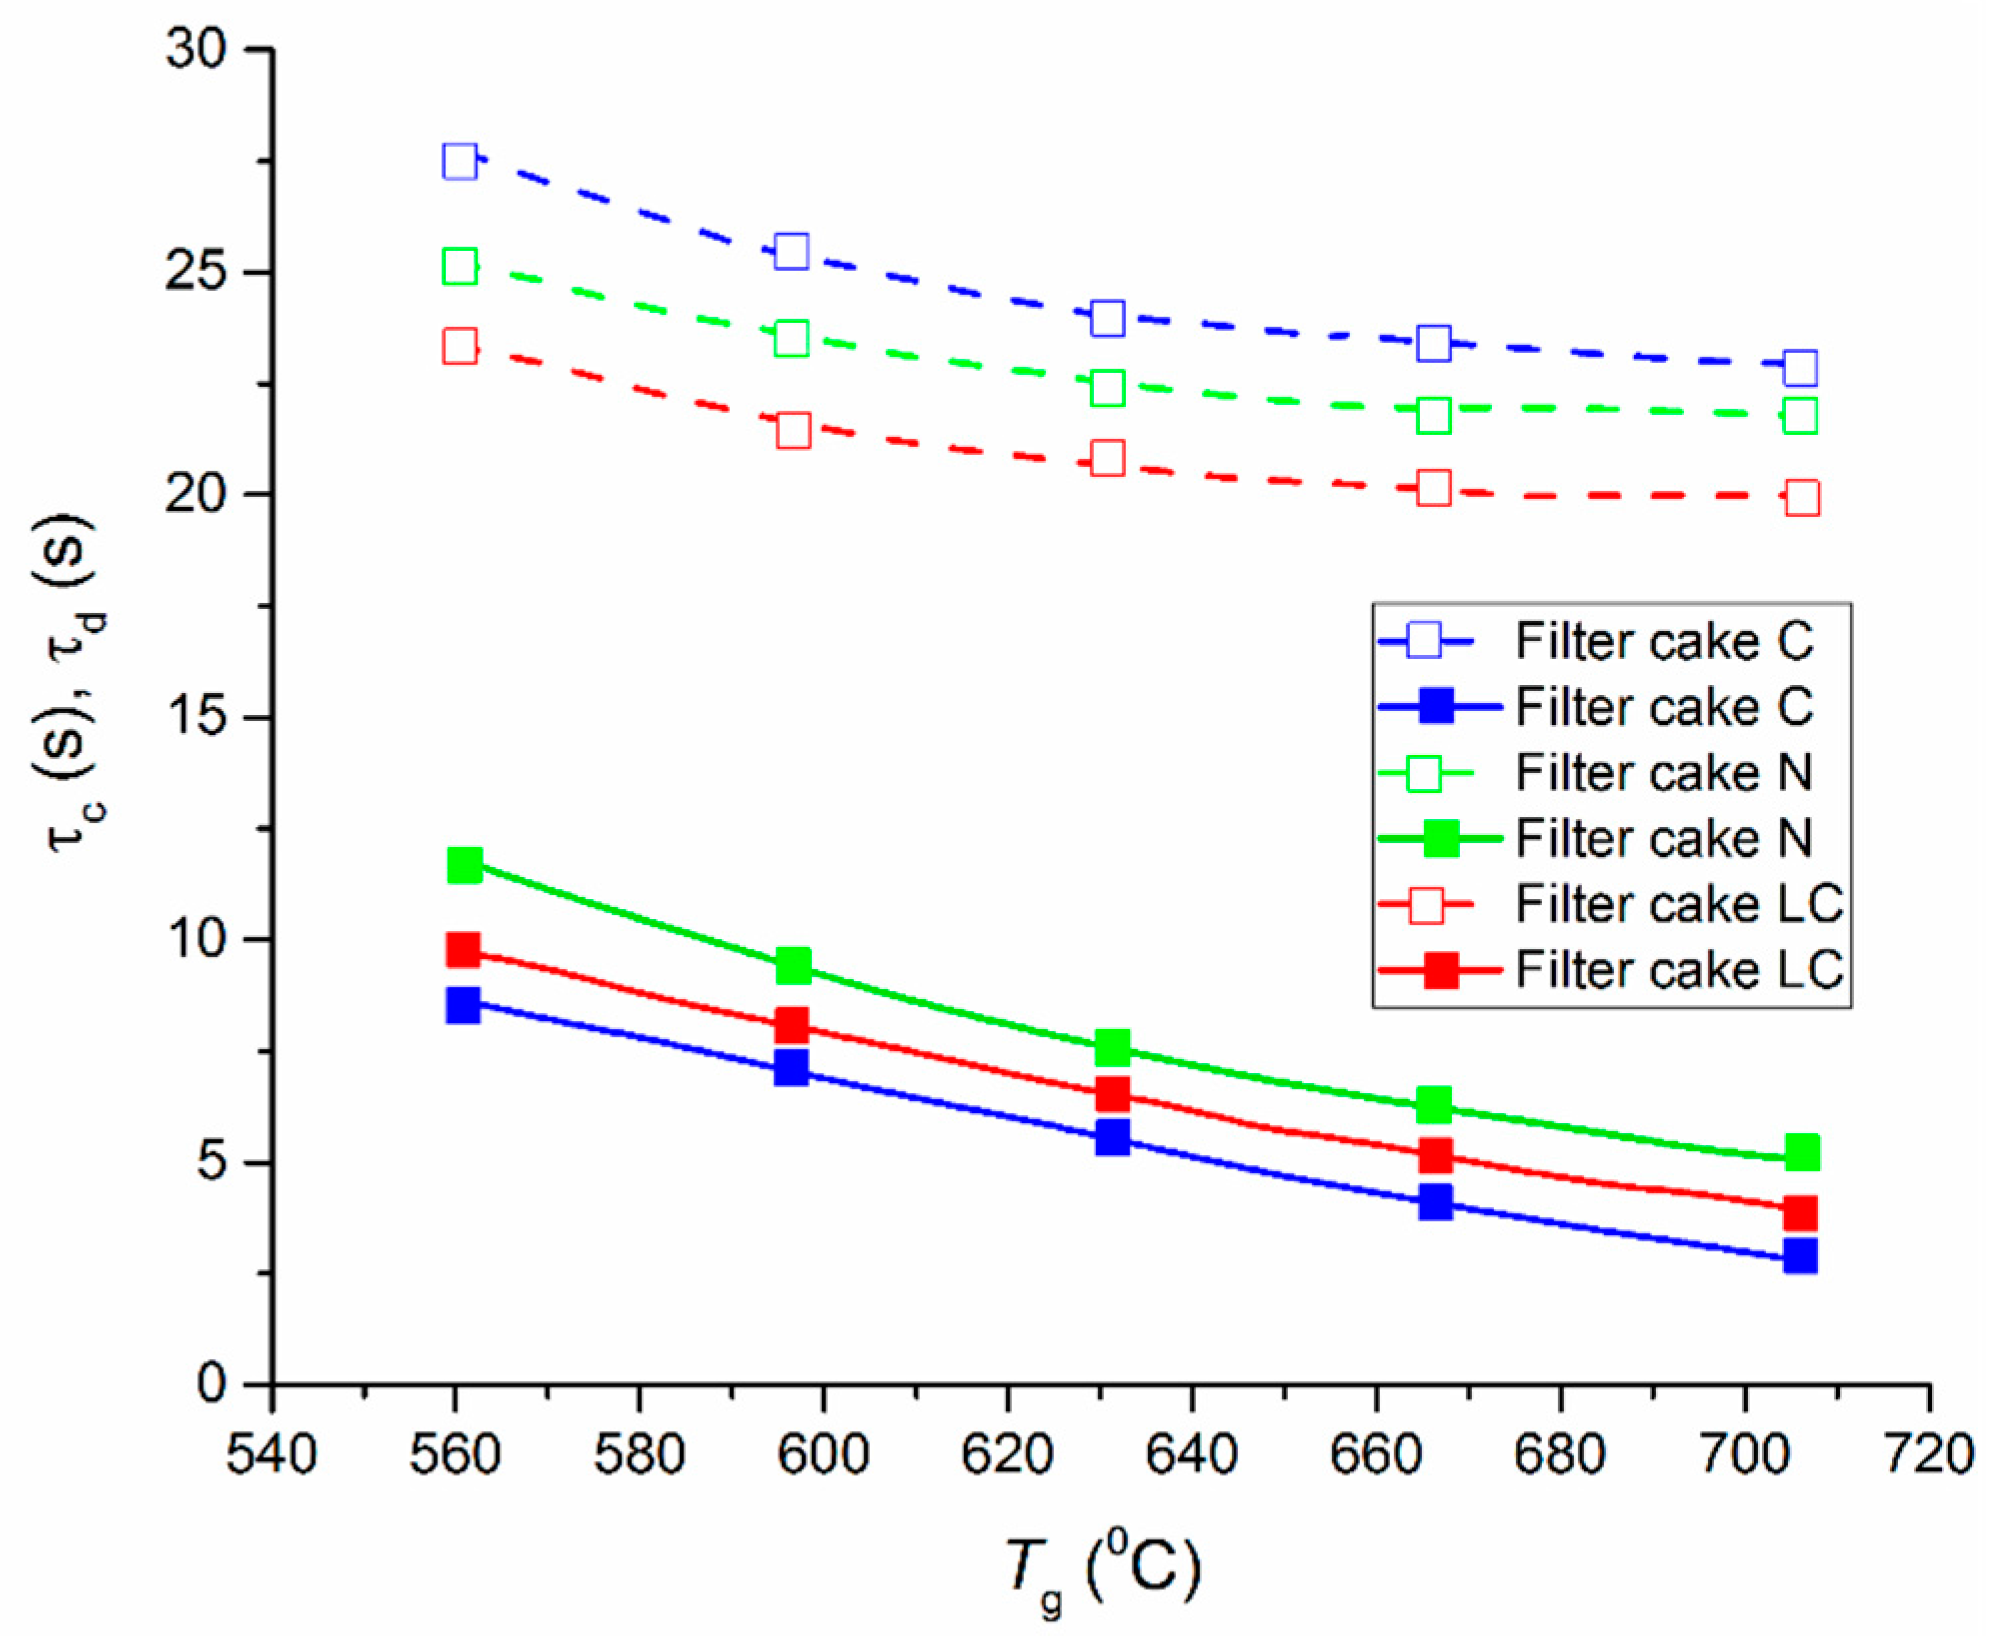
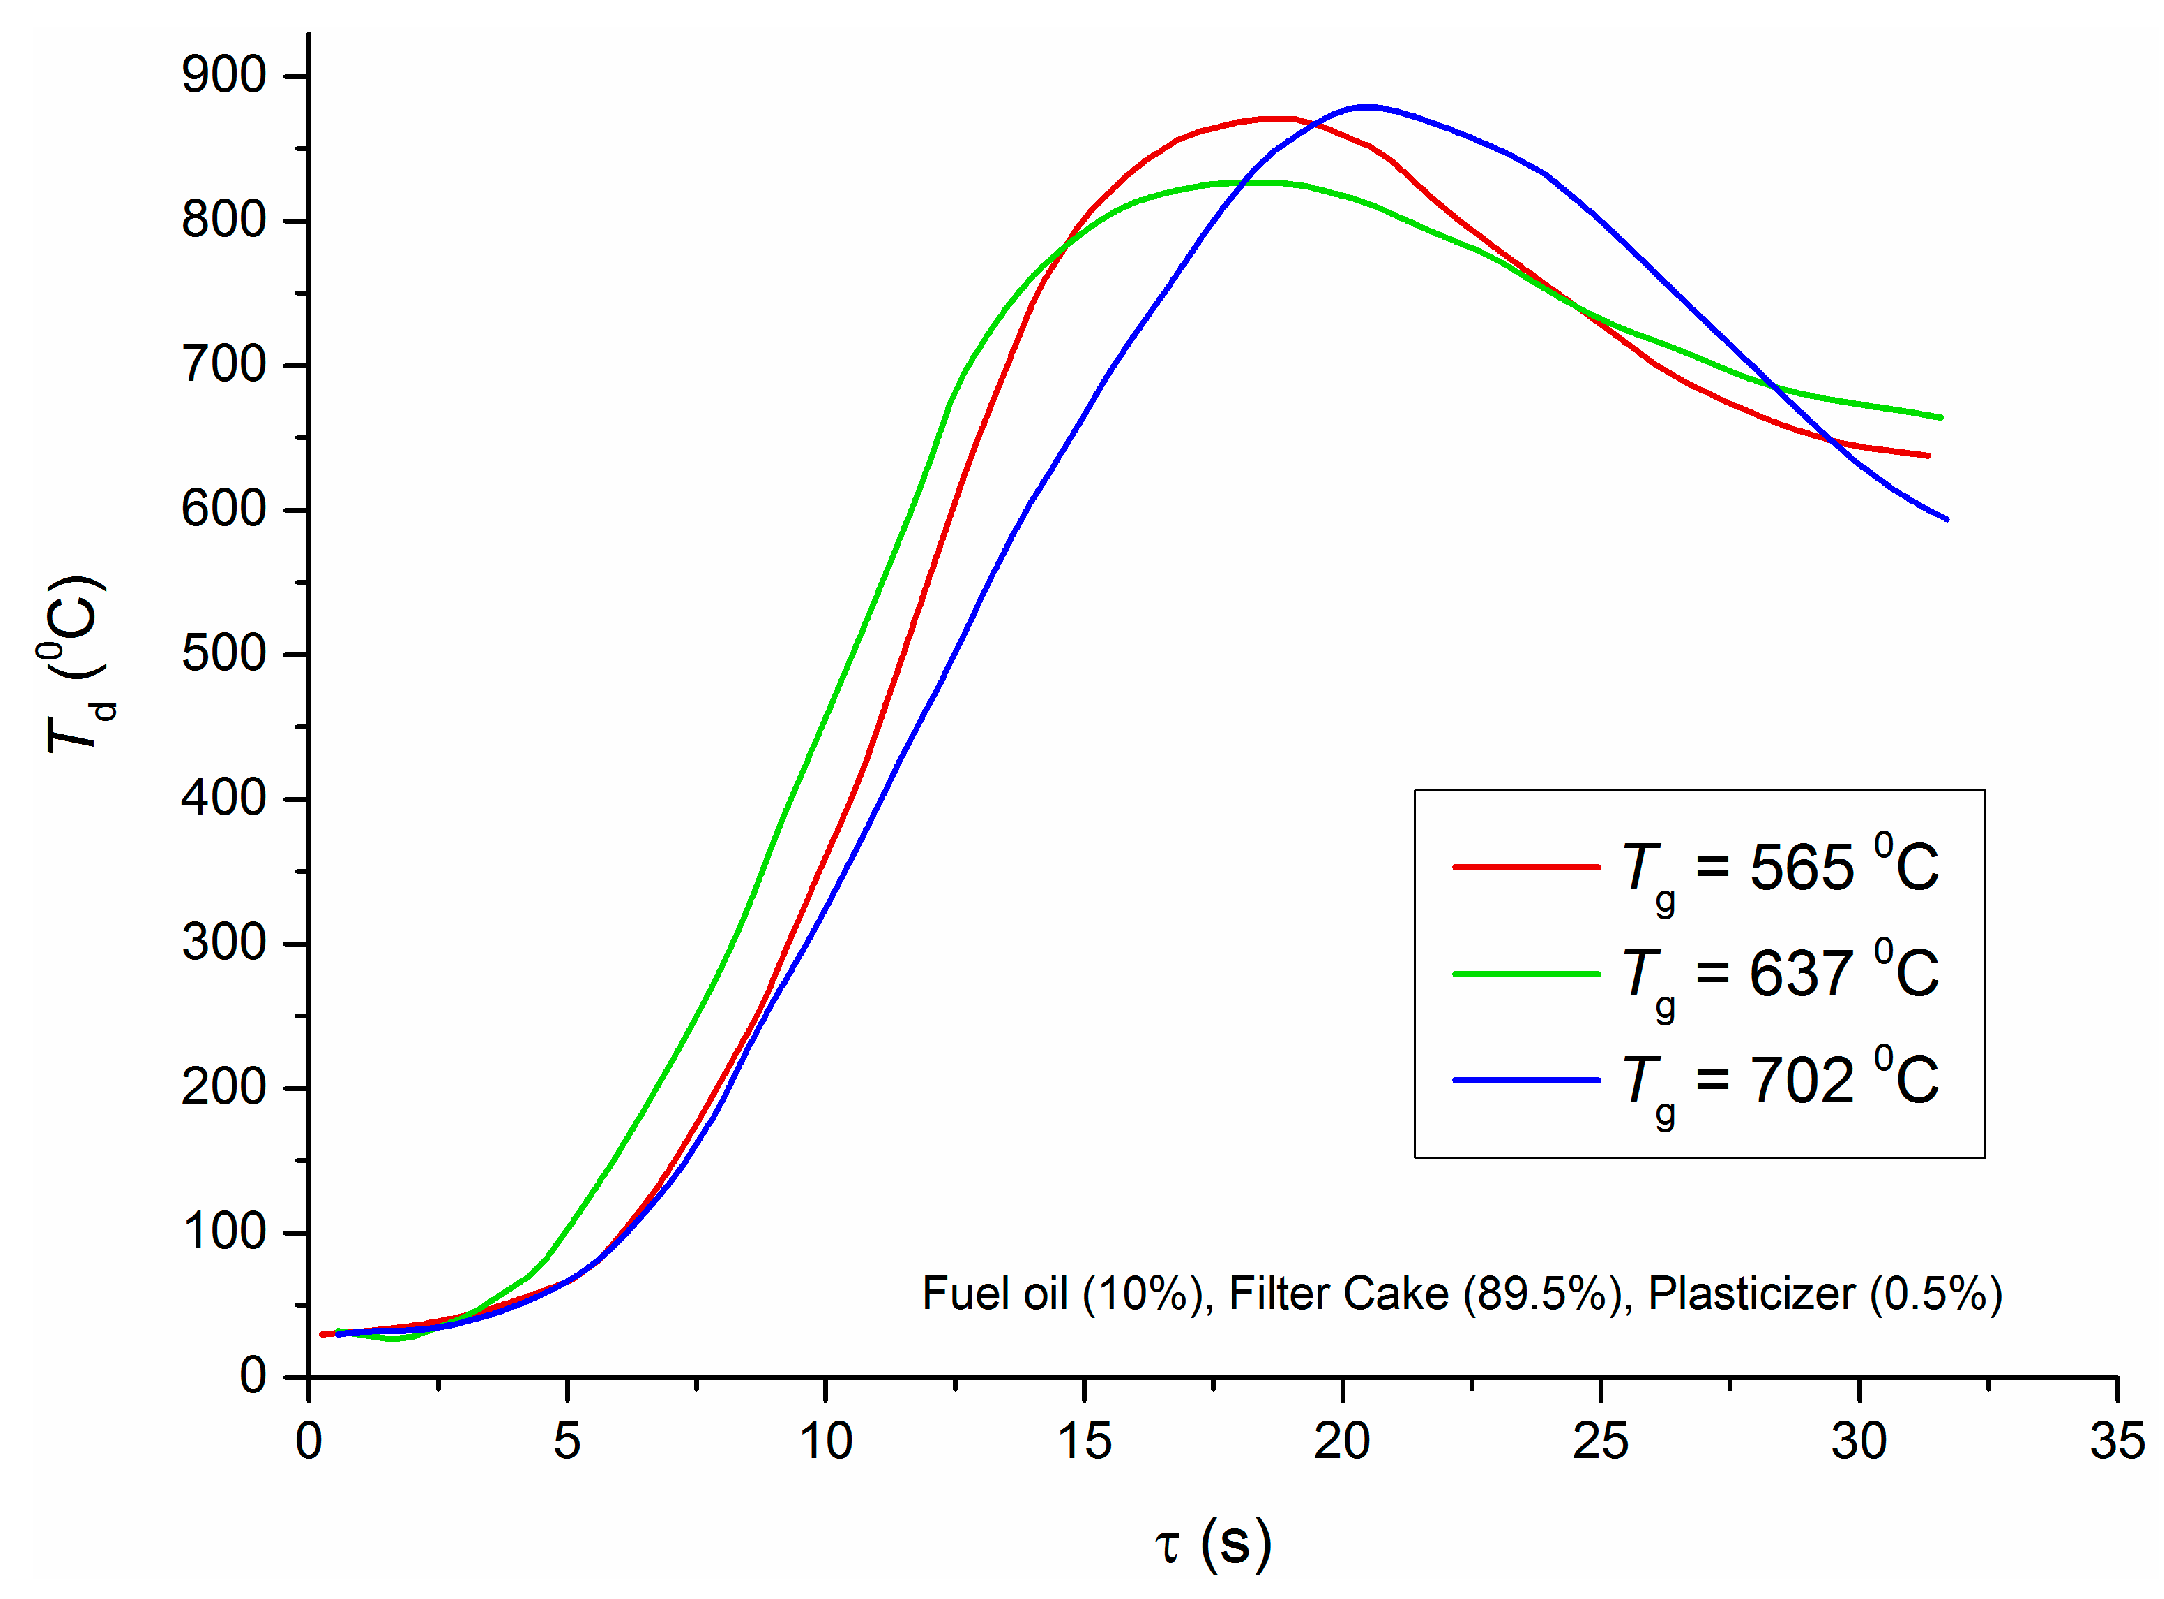
13]. For instance,
Figure 5 presents trends of temperature at the center of a CWSP (with cake C) droplet (
Td) when the oxidizer temperature changes from 565 °C to 702 °C.
The data reported in
Figure 5 show that the combustion temperatures in the chamber are close for the three trends despite the change in the oxidizer temperature by almost 150 °C. At the same time, the content of a liquid fuel component in the CWSP (in this case, fuel oil), may make the combustion process unstable (due to different rates of liquid fuel evaporation and solid fuel thermal decomposition). Filter cakes without the liquid fuel component (such compositions were studied in this work) did not undergo such changes, but the differences of maximum combustion temperatures were also negligible. Thus, it is advisable to reduce the oxidizer temperature for the ignition of fuel compositions (even those based on industrial wastes—e.g., filter cakes). Such temperatures are enough for the ignition and further combustion: all the key energy indicators remain high. The allowable range of the injected oxidizer temperature reduction corresponds to the one discussed before (500–700 °C) for
Figure 1,
Figure 2,
Figure 3 and
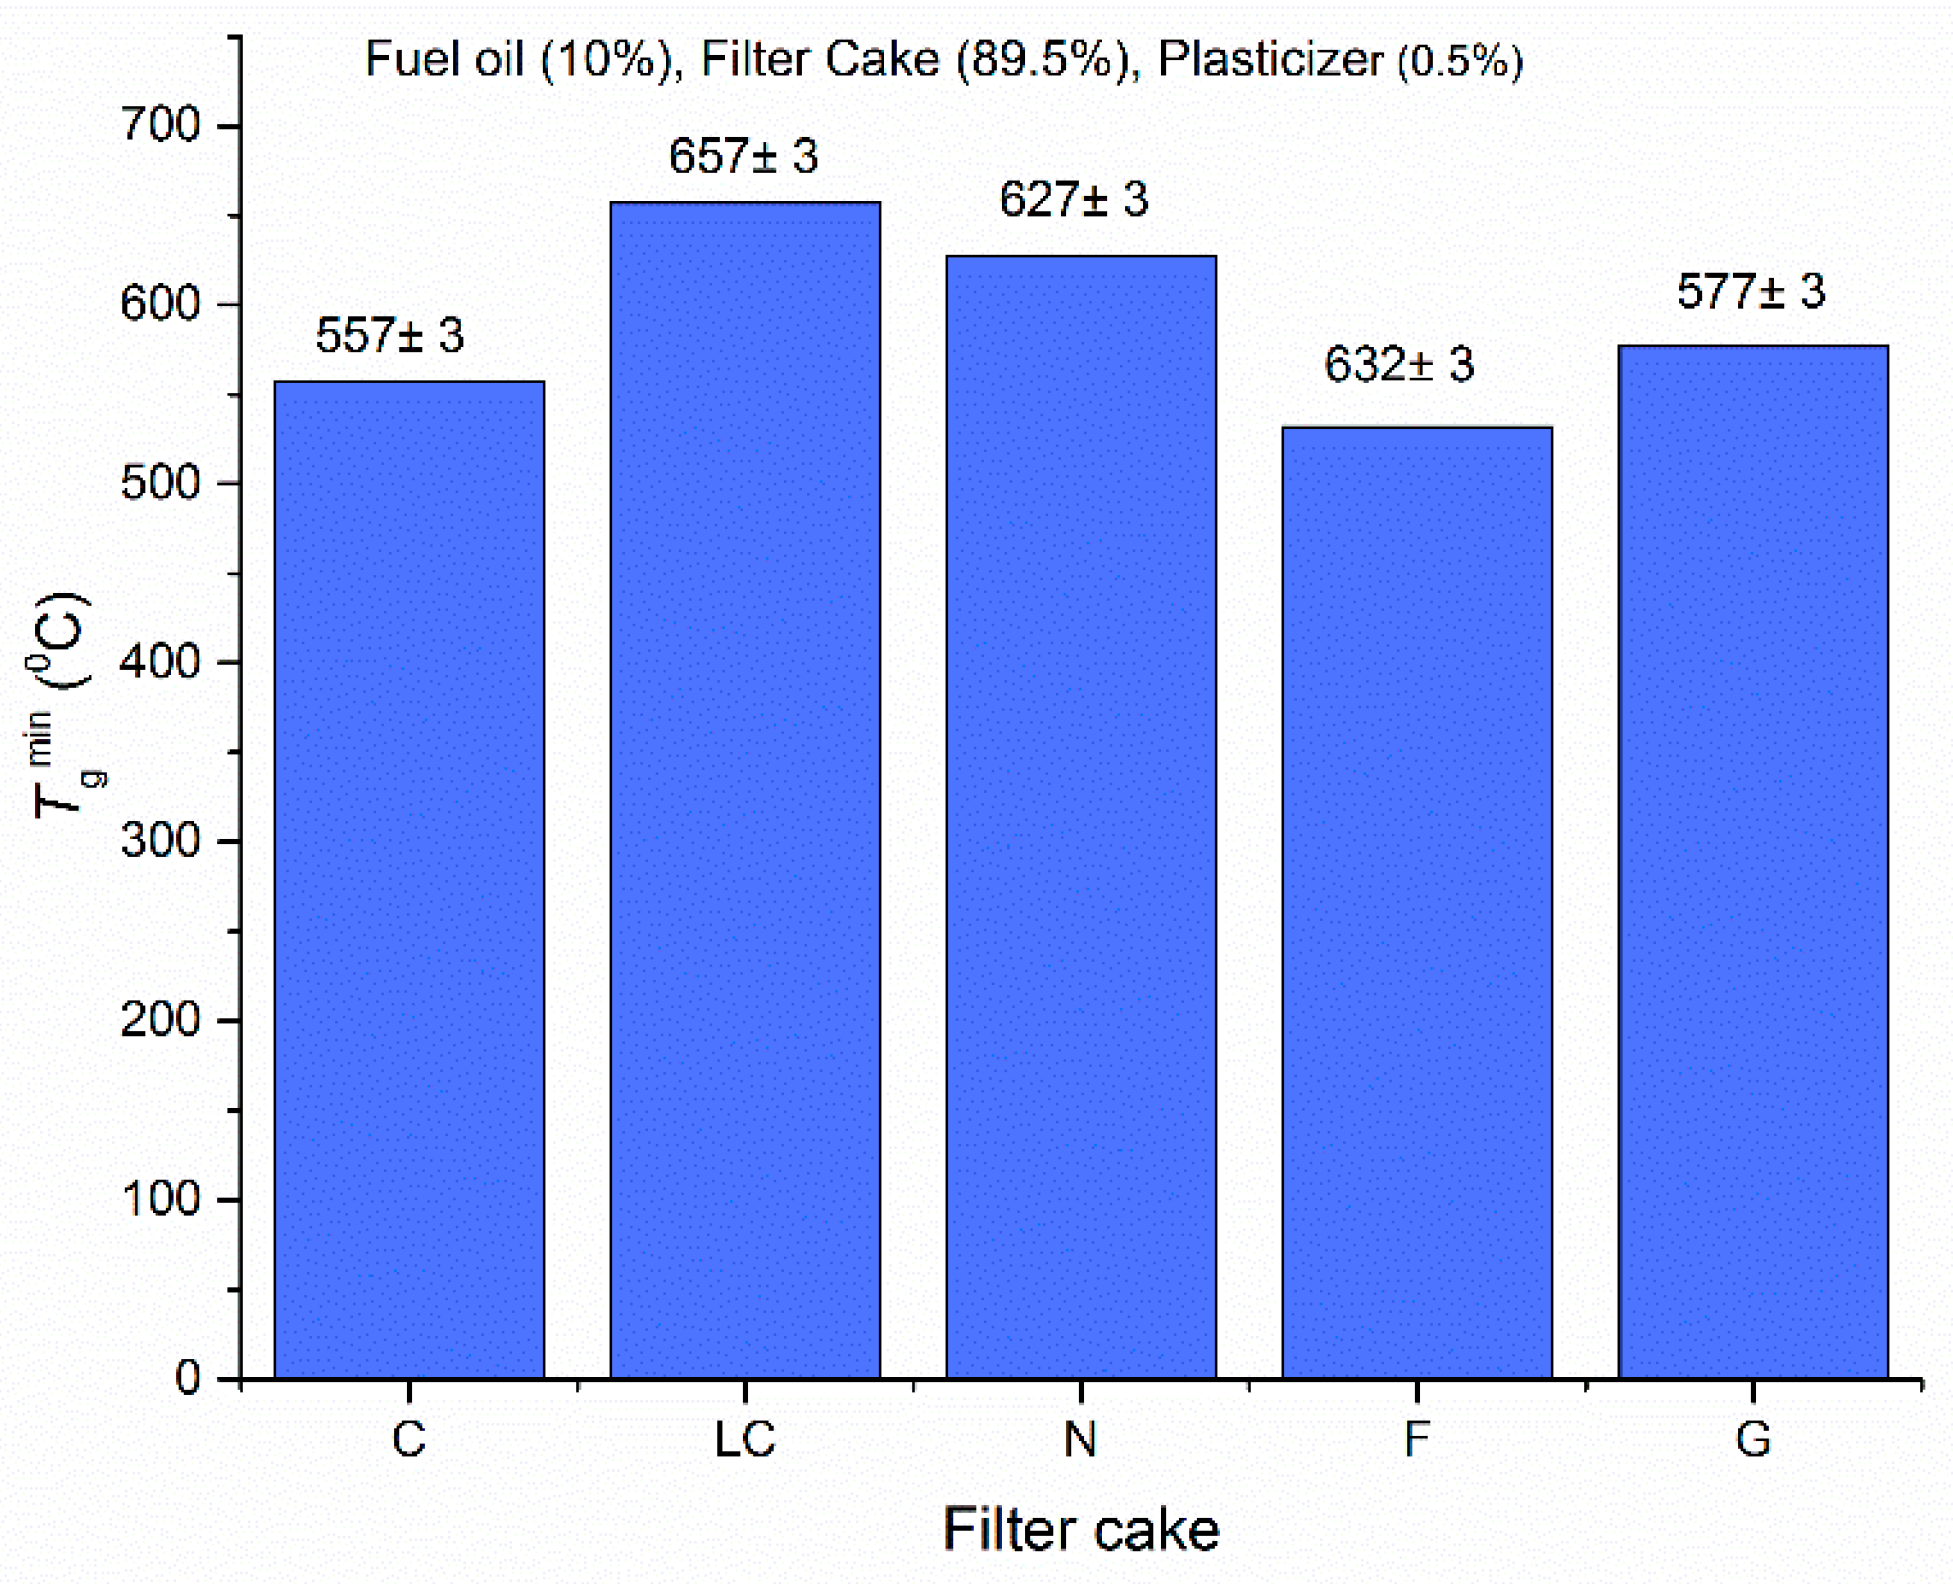
Figure 4. This range provides the conditions necessary for the sustainable ignition of filter cakes, which are solid fuel components of CWSP (
Figure 6).
For this range, the parameters of CWSP ignition delay times change negligibly (if we estimate the total duration of the fuel combustion processes at boiler plants) (see
Figure 7).
Thus, by varying the temperature in the combustion chamber, we can not only significantly change the concentrations of anthropogenic emissions but also provide acceptable energy performance. At the same time, the lower the content of volatiles in filter cakes, the more stable the energy performance. Judging by the experimental research findings, this approach is preferable for rank C and N filter cakes in order to improve the environmental situation around boiler plants.
The key advantages of lowering the temperature in the combustion chamber to improve the environmental situation are as follows. Firstly, a decrease in Tg significantly reduces the heat release rate of all the structural elements of the boiler, hence a longer service life.
Secondly, when using filter cakes as well as CWS and CWSP, the temperature in the combustion chamber is lower than that of burning coal dust, since slurries contain water (its evaporation consumes energy). As a result, the temperature in the combustion chamber changes smoothly and steadily throughout the fuel burning process. There are no temperature jumps, which also leads to a longer fleet life (and service life) of thermally-loaded equipment at boiler plants.
Thirdly, many researchers believe that a temperature reduction in a boiler may result in a significant drop in the electric and thermal energy generation. The analysis has shown, however, that the technologies based on CWS and CWSP allow minimizing this problem. The power generation does decrease somewhat but this decrease becomes negligible over time, since coal dust boilers experience the same reduction (water contained in CWS and CWSP does not worsen the conditions and characteristics of heat and mass transfer). In particular, according to the measured concentrations of anthropogenic emissions, CWS and CWSP combustion produces several times lower emissions of fly ash and oxides than coal combustion (1.5–4 times for fly ash and 3–10 times for oxides). Fly ash and oxides form buffer layers on all the heat exchange surfaces inside combustion chambers (ash sticks to metal surfaces and oxides severely damage them). Such buffer layers significantly reduce heat transfer, since ash deposits have a very low thermal conductivity. As a result, the heat flux decreases several times (sometimes dozens of times) vs. the initial conditions, when the buffer layer had not formed yet). The longer the boiler is in service, the sharper this decrease [
14,
15]. As soon as after several days of boiler operation, the heat absorption of wall tubes declines by 50–70% due to ash sticking to their surface [
14,
15].
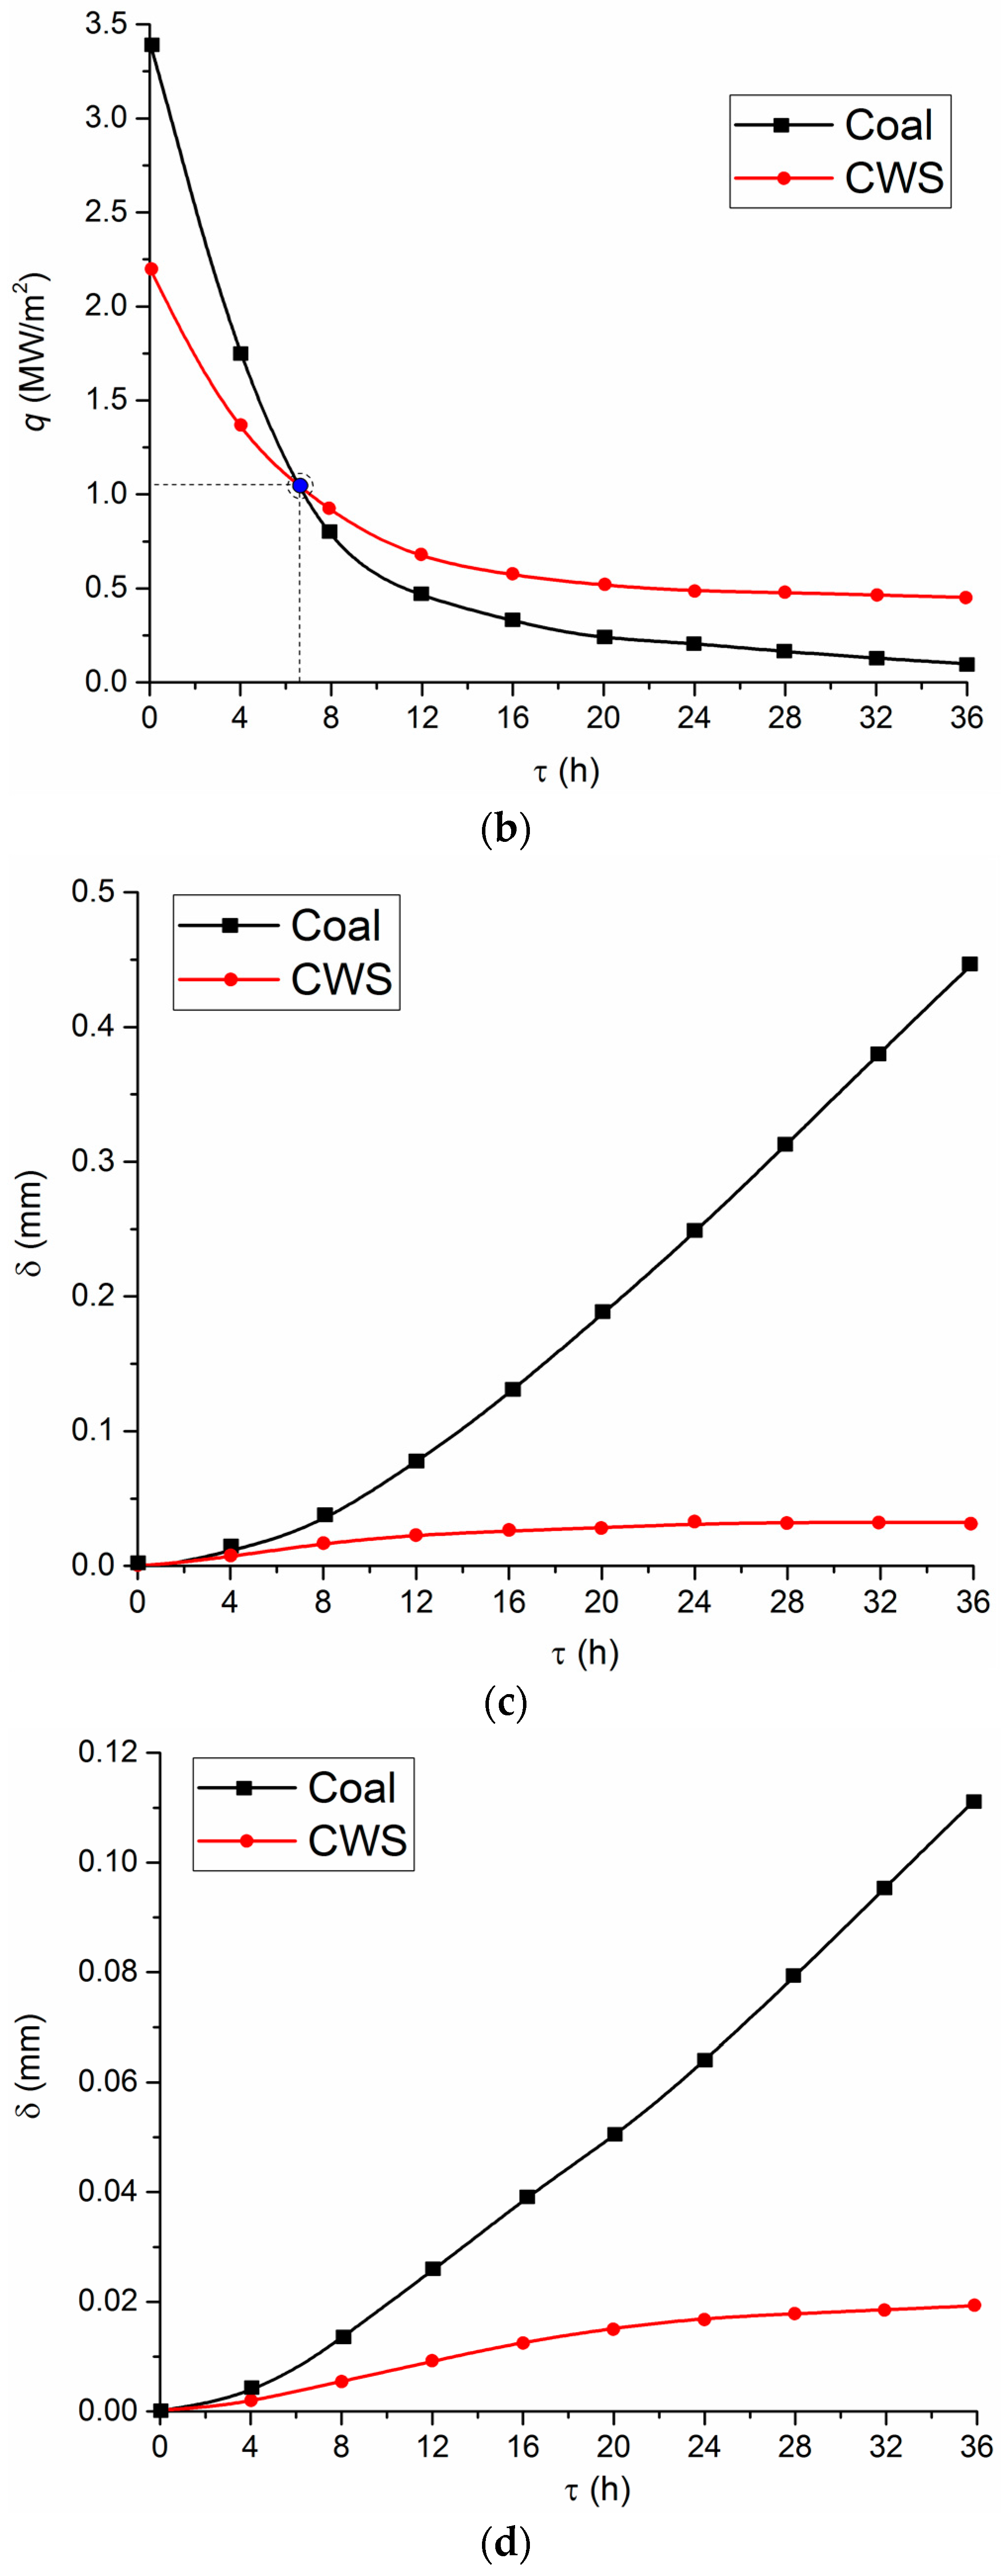
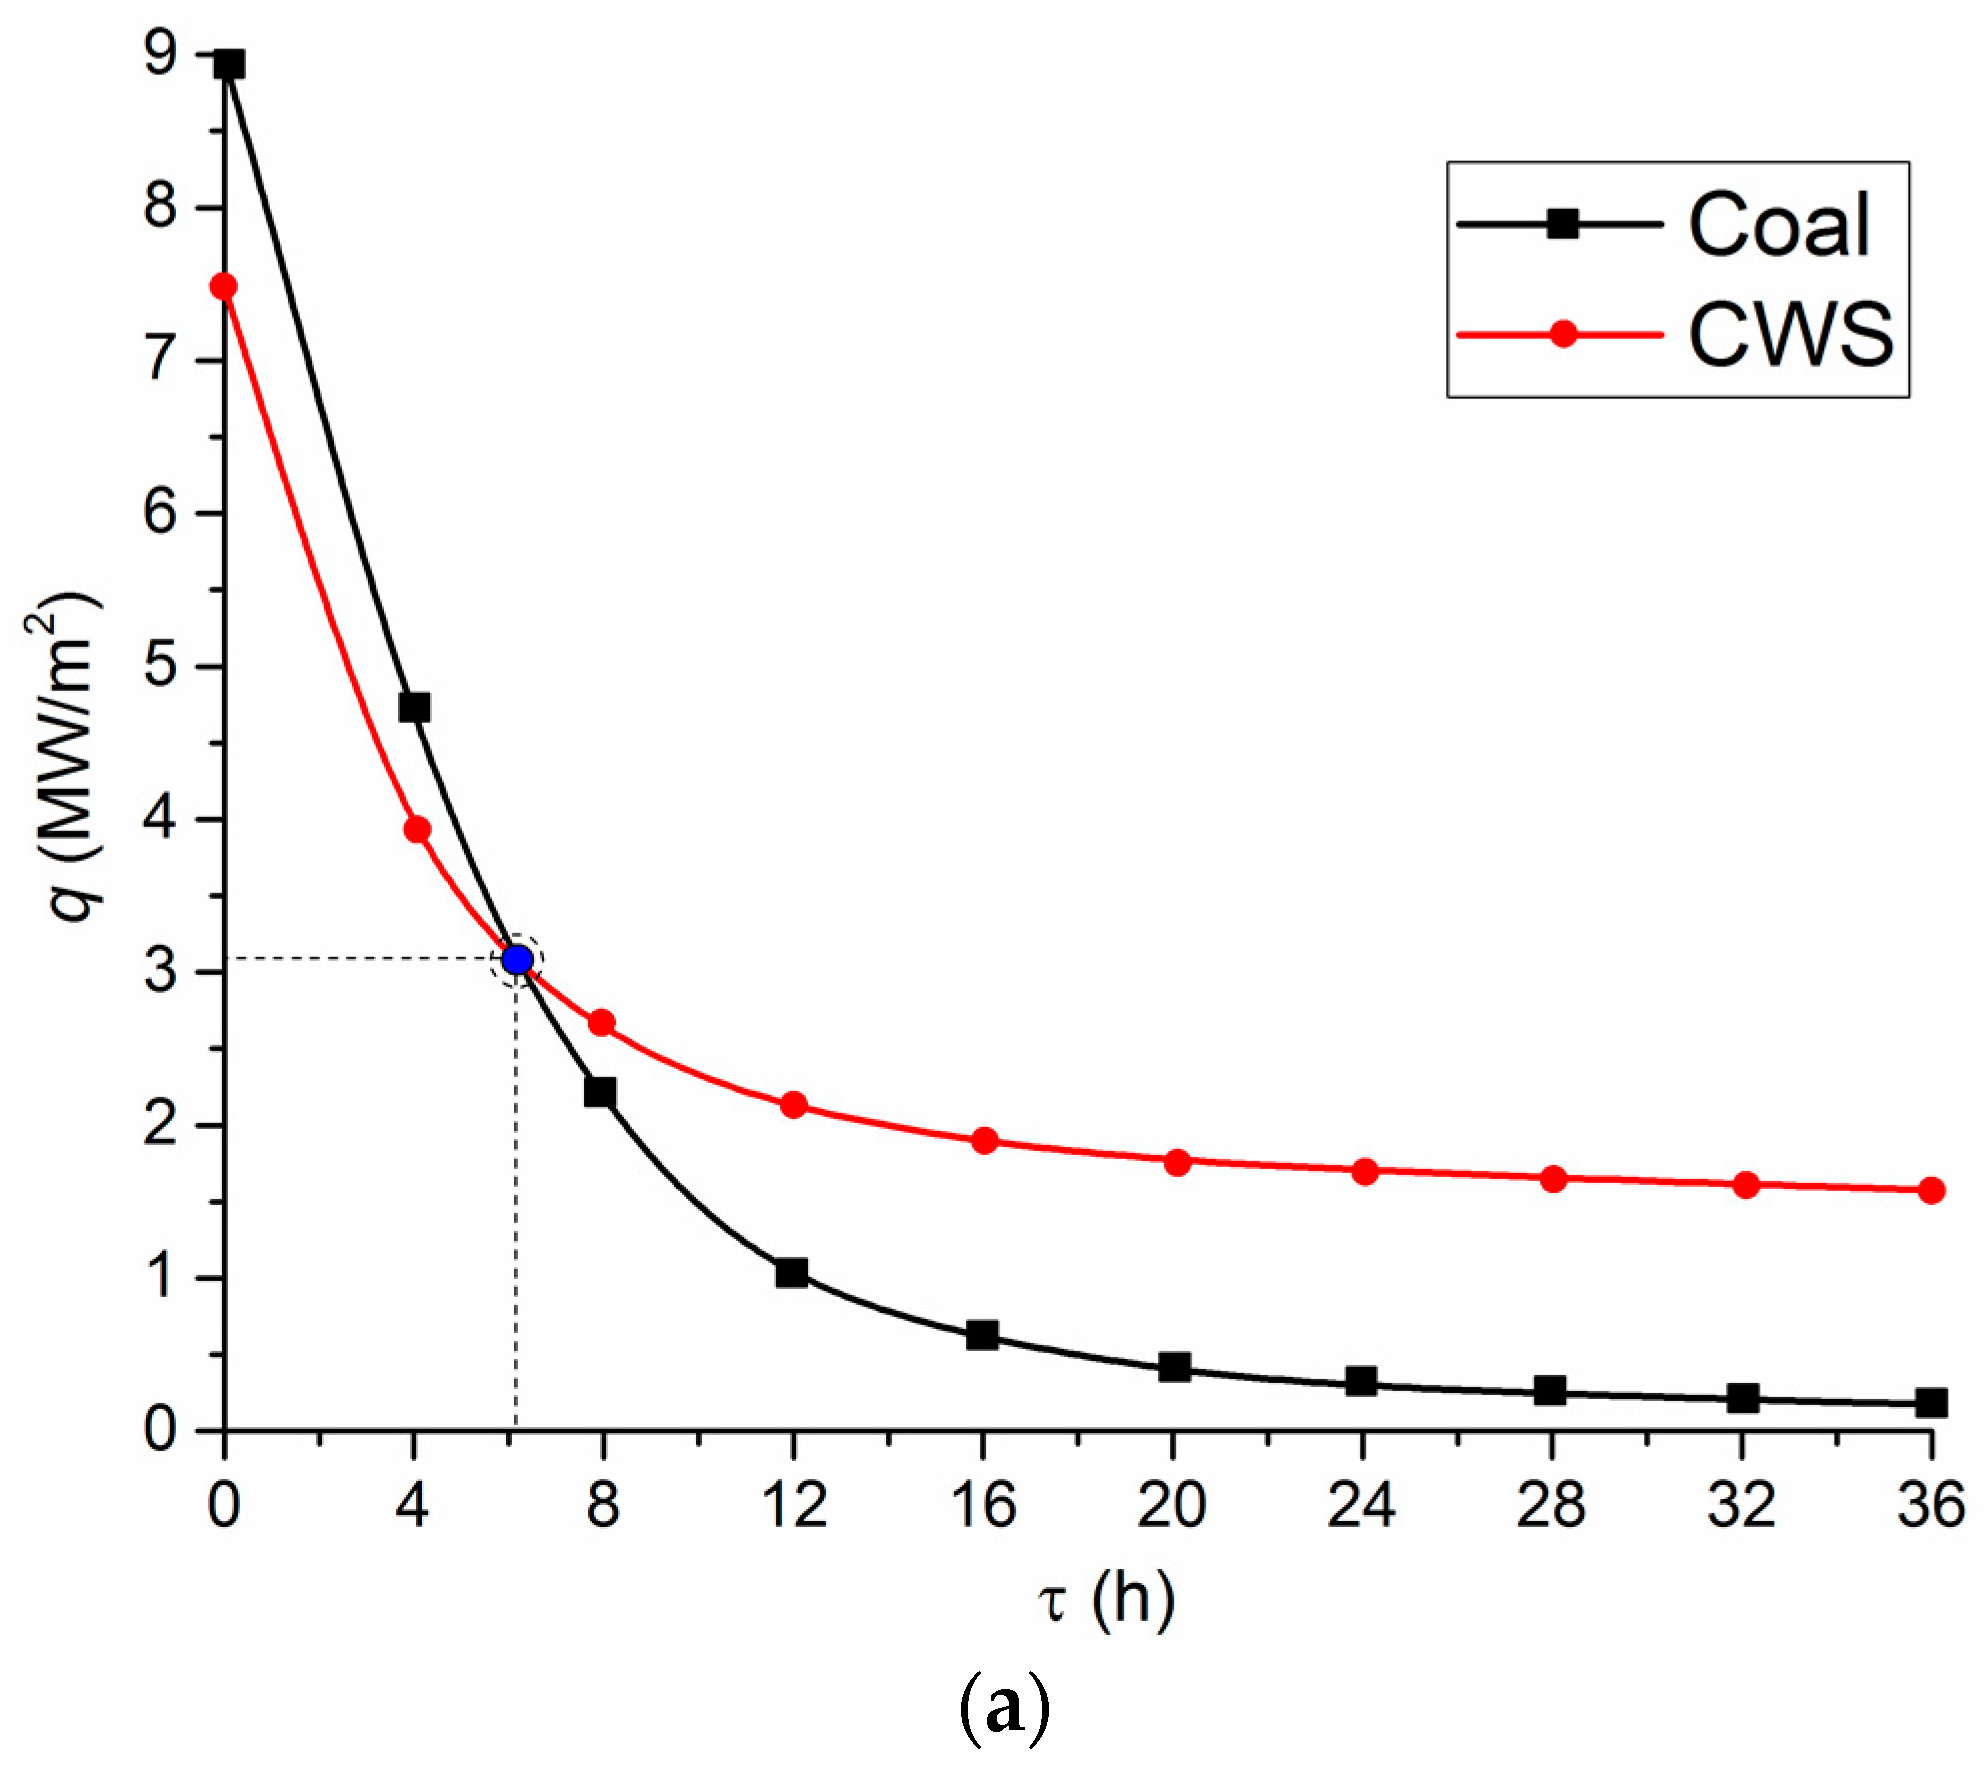
For instance,
Figure 8 presents the estimates of heat fluxes as illustrated by wall tubes of a combustion chamber and economizer tubes, when burning coal in its traditional pulverized state and when using CWS. The heat flux through the tube wall was calculated using Fourier’s law:
where δ
b is the wall thickness (2 mm),
Tg is the temperature of flue gases (taken as equal to 700 °C for coal in the combustion chamber, 280 °C in the economizer and 600 °C/200 °C for CWS in the combustion chamber and in the economizer, respectively, in order to consider the decrease in the temperature due to water evaporation),
Tw is the temperature of steam water mixture in the wall tubes (taken as average and amounting to 100 °C) and in the tubes of water economizer (taken as equal to 50 °C), λ
b is the coefficient of heat conductivity 30 W/(m·K) for steel wall and 0.14 W/(m·K) for ash deposits. The initial parameters and thermal properties of the elements were taken in accordance with [
14,
15,
16,
17].
In
Figure 8, the values of
q at the initial time reflect the heat fluxes under the perfect conditions—i.e., without taking into account fly ash sticking to the tube walls.
The analysis of modern periodicals on the main in-service problems of boiler units (e.g., [
14,
15]) shows that the thickness of the layer of sticking ash may not only be comparable to the thickness of pipe walls of superheaters and economizers but also exceed it several-fold. Let us assume that the thickness of the ash layer formed after boiler operation during 36 h is equal to (tube wall thickness) 0.45 mm on wall tubes and 0.04 mm on economizer tubes [
14,
15]. Under the real operating conditions, the thickness of these layers may reach several millimeters [
14,
15]. The buffer layer on the tube wall has a significant effect on the conditions and characteristics of heat transfer. In this case, the heat flux from the flame and flue gases to the water inside (economizer tube) tubes can be calculated by the following formula:
where δ
a and λ
a are the thickness and coefficient of heat conductivity of the buffer layer (made of fly ash).
Judging by
Figure 8, the difference between heat fluxes at the initial instant when burning coal and CWS is considerable. However, this difference fades over time. Consequently, the key energy characteristics become comparable. The time required for these indicators to approach each other depends on a group of factors. Primarily, it is the ash content in the coal fuel. The second factor is the intensity of water heating in the tubes. This effect will change the pattern of curves in
Figure 8 and reduce the time of their crossing (with
Tw = const). The third factor is, undoubtedly, the properties of the material and the thickness of tube walls located in combustion chambers and flue gas ducts. The benefits of using CWS and CWSP over coal become noticeable after several days (
Figure 8a,b).
There are two ways of dealing with fly ash sticking and hazardous chemical reactions of oxides. One involves stopping boiler units to clean the surfaces of the tubes (there are a lot of mechanical and chemical methods for it). The other way is to apply specialized technologies based on the injection of various chemicals into the combustion chamber, either as part of fuels or during dedicated gas blowing. The use of conventional chemicals does not always provide a positive result, since thermally-loaded surfaces are quite fragile (walls become thinner, especially at high temperatures in combustion chambers), and quickly go out of order when exposed to chemicals. If CWS and CWSP are used and the temperature is lower in the combustion chamber due to the minimum content of fly ash and hazardous oxides, the buffer layer does not form on the water screen surface. The heat flux does not decline and remains quite high throughout the long-term service life. Furthermore, pipes are not subjected to high thermal loads. As a result, they remain operational for a longer time and do not require cleaning and stopping the boiler unit.
After some time, the heat fluxes from the combustion chamber to water economizers become comparable for coal, CWS, and CWSP burning (
Figure 8a,b). Therefore, all the key energy performance indicators become almost identical. However, CWS and CWSP reduce the negative environmental impact (see
Figure 1,
Figure 2,
Figure 3 and
Figure 4) and extend the service life of the equipment. An integrated assessment shows that they are a more rational choice than fly ash handling systems. The latter are only effective when it comes to emissions in flue gases but they do not prolong the service life of the equipment or minimize the impact of ash and oxides on the work of thermal equipment.
Moreover, lowering the temperature in the combustion chamber will reduce the production costs of thermally-loaded equipment (in particular, superheater tubes, economizers, screens, etc., located in the combustion chamber and high-temperature flue gas ducts). This is because thinner-walled pipes (e.g., economizer screens or thermally-loaded superheater sections) are enough to provide the required reliability and energy performance indicators. For example, to provide the identical heat flux from the flue gases to water in the economizer tube at a temperature of 500 °C or 700 °C, we need the walls of these tubes to be almost half the standard thickness (e.g., a reduction from 6–8 mm to 4–5 mm is possible). If we consider the extent of such pipes in boiler units, the production economy becomes considerable. Given the batch production of key elements, blocks, and units of boiler plants, the cost advantages will be even more substantial.


