
A Solar Energy Solution for Sustainable Third Generation Mobile Networks


Department of Electrical Engineering, College of Electronics and Information Engineering, Sejong University, 209 Neungdong-ro, Gwangjin-gu, Seoul 05006, Korea
Energies 2017, 10(4), 429; https://doi.org/10.3390/en10040429
Submission received: 14 February 2017
/
Revised: 20 March 2017
/
Accepted: 21 March 2017
/
Published: 24 March 2017
(This article belongs to the Special Issue Contemporary Environmental Paradigms and the Renewable Energy in Rural Economies)
Abstract
:The energy consumption of cellular networks has become increasingly important to cellular network operators, due to the significant economic and ecological influence of these networks in the future. The development of alternative energy technologies has resulted in the consideration of a solar powered base station (BS) as a long-term solution for the mobile cellular network industry, to reduce the operational expenditures and CO2 footprints of cellular networks. This study addresses the deployment and operational issues of a solar powered universal mobile telecommunications system (UMTS; a third generation mobile cellular system) BS (i.e., Node B) that is currently deployed (i.e., UMTS Node B 2/2/2 and UMTS Node B 4/4/4). In addition, this study employs a hybrid optimization model for an electric renewable software simulator developed by the American National Renewable Energy Laboratory. Four key aspects are discussed in this study: optimal solar system architecture, energy production, the cash flow of the solar powered UMTS Node B project, and the economic feasibility of a solar powered system compared with traditional sources. Simulation results show that the proposed solution ensures 100% energy autonomy and long-term energy balance for the UMTS Node B, with cost effectiveness.
1. Introduction
The provision of high data traffic capacity and high data rates has been a longstanding focus in cellular networks. However, many operators in this industry now realize that a high-energy performance is equally important. The telecommunication sector’s worldwide consumption of electricity per year has increased from 219 TWh in 2007, to 354 TWh in 2012. Such a consumption rate will eventually increase at an additional annual rate of 10%, from 2013 to 2018 [1]. Consequently, the operational expenditures (OPEX) of cellular network operators have significantly increased, given that a significant percentage is allocated for the payment of electricity bills [2,3]. In 2014, over $22 billion of the global OPEX of cellular networks was allotted for electricity consumption [4]. Cellular network operators actively expand their network coverage, establish new markets, and provide services to prospective clients in rural areas around the world [5]. Unfortunately, the gradual pace of electrification in rural areas, which can be attributed to geographical limitations and economic issues, has prompted operators to use diesel generators (DGs) to power their base stations (BSs). BSs are a key source of energy consumption in cellular networks. Accordingly, the OPEX of BSs increases tenfold [1,6]. Energy efficiency in cellular networks is also an emerging issue, highlighting the need for the operators of these networks to sustain profitability and decrease the overall effects on the environment. The amount of carbon dioxide (CO2) emitted by the mobile sector will increase to 179 MtCO2 by 2020, thereby accounting for 51% of the total carbon footprint of the information and communications technology sector [7]. Thus, cellular network operators consider the issue of energy efficiency as a main pillar of sustainability in these networks, due to the significant economic and ecological influence of such an issue in the future.
A popular method for enhancing a cellular network’s energy efficiency is to design and optimize the power saving communication protocols. These protocols adjust the transceivers’ transmission power based on the network’s intensity of data traffic. Radio access networks are designed for data traffic during peak hours; thus, the use of BSs may be inefficient during off-peak hours. The ideal scenario is to switch off BSs when the load of the data traffic is below a particular threshold for a certain time period [8]. When several BSs are deactivated, the devices that remain actively handle the radio coverage and service provisioning [9]. The issue of BS switching can be treated as an optimization problem that reduces the number of active BSs, while addressing the access network’s data traffic load. Various methods used to switch off a precise number of Node Bs in a universal mobile telecommunications system’s (UMTS) cellular network during low data traffic periods, were discussed in [10,11,12,13]. The possibility of switching off several cells and Node Bs during low-traffic periods, while ensuring the quality of service constraints in terms of blocking probability and electromagnetic exposure limits, was discussed in [10]. Moreover, [11] proposed a dynamic network planning scheme for the off/on switching of Node Bs, and considered a uniform and hierarchical scenario. The results were extended in [12], which proposed a set of realistic regular cell topologies. Each configuration had a precise energy saving ratio by turning off three out of four, or eight out of nine, Node Bs. A novel optimization model that can be employed to save energy in a UMTS cellular access network was presented in [13]. This optimization model considers the gradual temporal variations in traffic through the dynamic switching on and off of entire BS sites.
Evidently, these methods are effective when cellular networks experience a low demand in data traffic. However, only a few BSs can be switched off during intense data traffic demand periods; thus, “sleep mode”-based algorithms may be ineffective. High data traffic in cellular networks is common during daytime hours, when sunlight is considered a significant power generation source. The critical characteristics of power source requirements for Node Bs, including cost effectiveness, efficiency, sustainability, and reliability, can be addressed through the use of technological advancements in the field of solar energy [1,14]. Moreover, a solar powered UMTS Node B offers an ideal long-term solution for the mobile cellular network industry in off-the-grid areas without a mature electric network, as well as in developed countries that suffer from continued power cuts and unreliable electrical grids (EGs) [8,15]. In particular, an optimal design will enable the reliability of renewable energy systems to reach 99.99% [16]. A point-to-point communication link, in which the transmitter has a hybrid supply of energy, is explored in [17]. In particular, a constant energy source and energy harvester supply the hybrid energy. That is, energy is harvested from its surrounding environment and stored in a battery that suffers from energy leakage. Reference [18] proposed a model to reduce the cellular networks’ on-grid energy consumption with hybrid energy supplies, and decomposed a green energy optimization problem into two sub-problems, namely, multi-stage energy allocation and multi-BS energy balancing problems. Reference [19] investigated the optimal dimensioning of the PV panel and energy storage of a hybrid BS powering system that can maximize solar and power grid energies. The result shows that this powering system can reduce the total energy cost with respect to a pure solar system and the traditional connection to the power grid, by 20%–40%. Reference [20] analyzed the feasibility of cellular access networks that exclusively rely on renewable energy sources (e.g., PV panels, wind turbines (in several cases), and energy storage). The results show that integrating renewable energy sources with BS sleep modes can result in significant energy savings, as well as a reduction of the solar system size. Moreover, [21] provided a summary of the components of solar powered BSs, their current deployment status, and a case study for two locations in India.
The current study assesses solar energy technology and a case of sustainable energy in UMTS that is presently deployed (i.e., UMTS Node B 2/2/2 and UMTS Node B 4/4/4) in urban and remote areas in South Korea. The main research questions of this study are as follows.
- What is the optimal solar system architecture?
- Will the solar powered system address the energy requirements of Node B?
- During which part of the year are the maximum and minimum power outputs of the photovoltaic (PV) array reached?
- During which part of the year are the maximum and minimum power outputs of the battery reached?
- What are the autonomy hours of a battery that will support Node B in case the PV array malfunctions?
- Is there a probable loss of load (LOL)?
- What are the expected costs?
- What is the economic feasibility of the solar powered system compared with the traditional source?
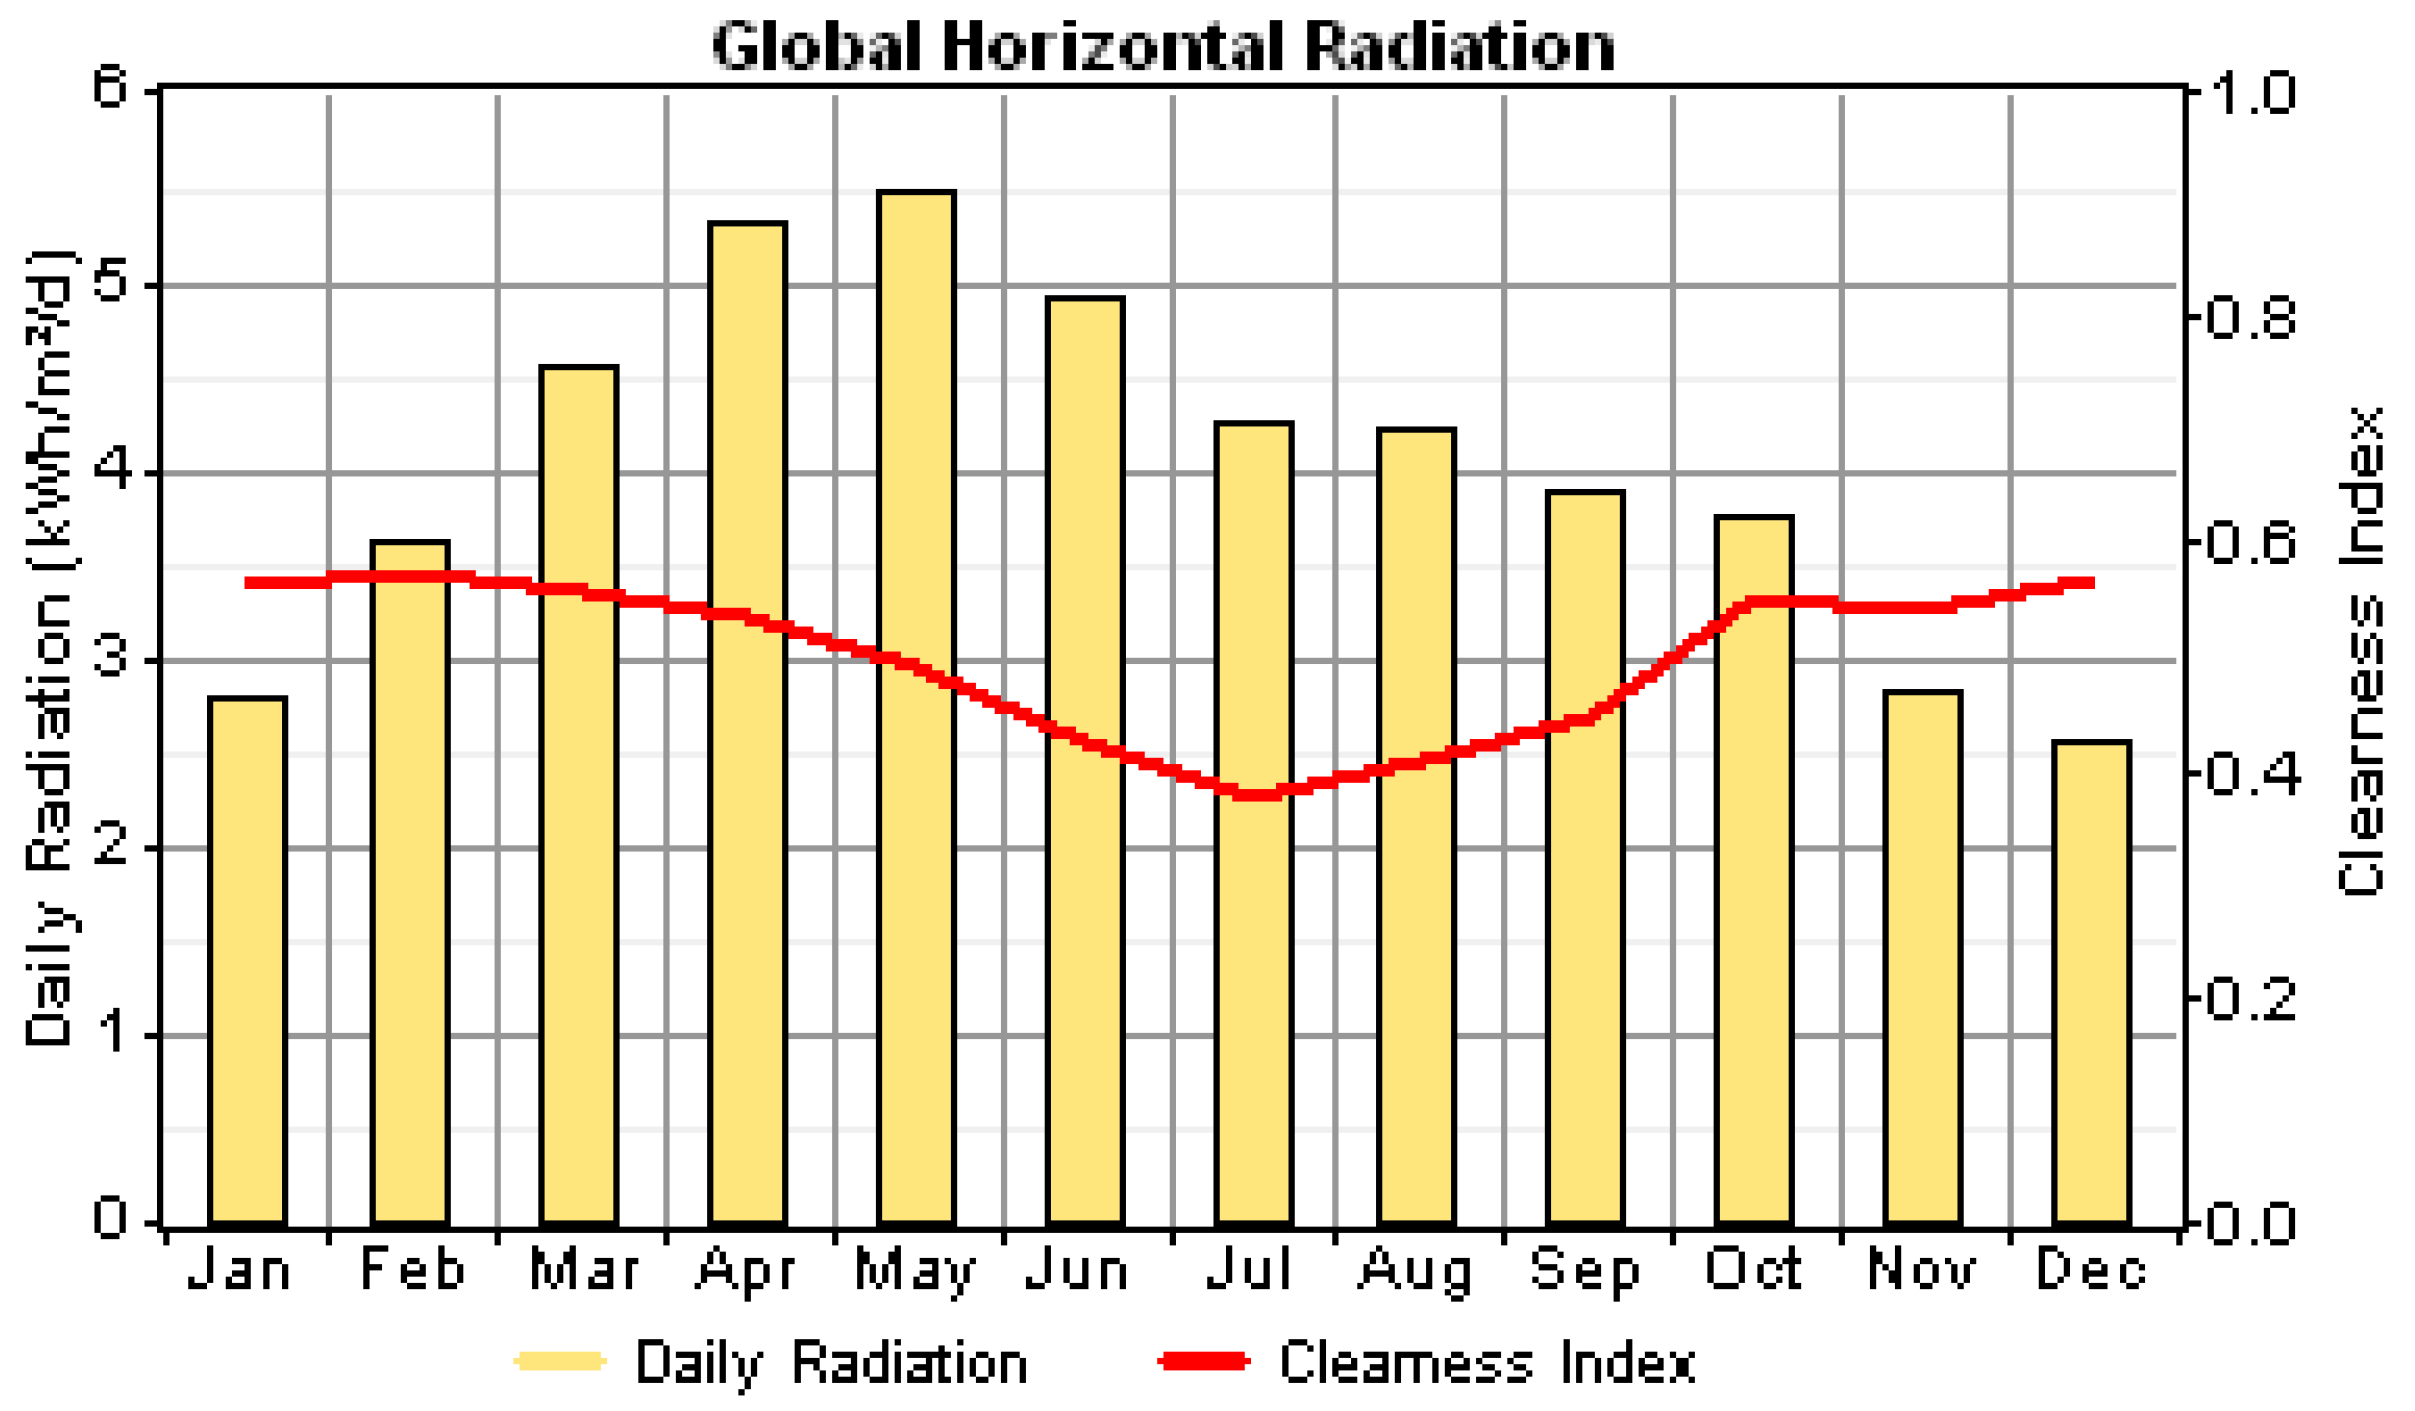
The generation of solar energy depends on numerous factors, including solar radiation, sunlight intensity, and the geolocation of solar panels. The current study considers South Korea as a case study due to the following aspects: (1) it is located at a latitude between 34° N and 38° N; and (2) exhibits excellent potential to use solar energy, particularly because its average daily solar radiation ranges from 2.474 kWh/m2 in December, to 5.622 kWh/m2 in May [22,23]. However, the analysis can be generalized to other cases with a slight difference in the daily peak solar hours and solar radiation per case. The current study adopts a hybrid optimization model for electric renewables (HOMER), to perform a techno-economic feasibility analysis of the solar powered UMTS Node B.
2. System Model
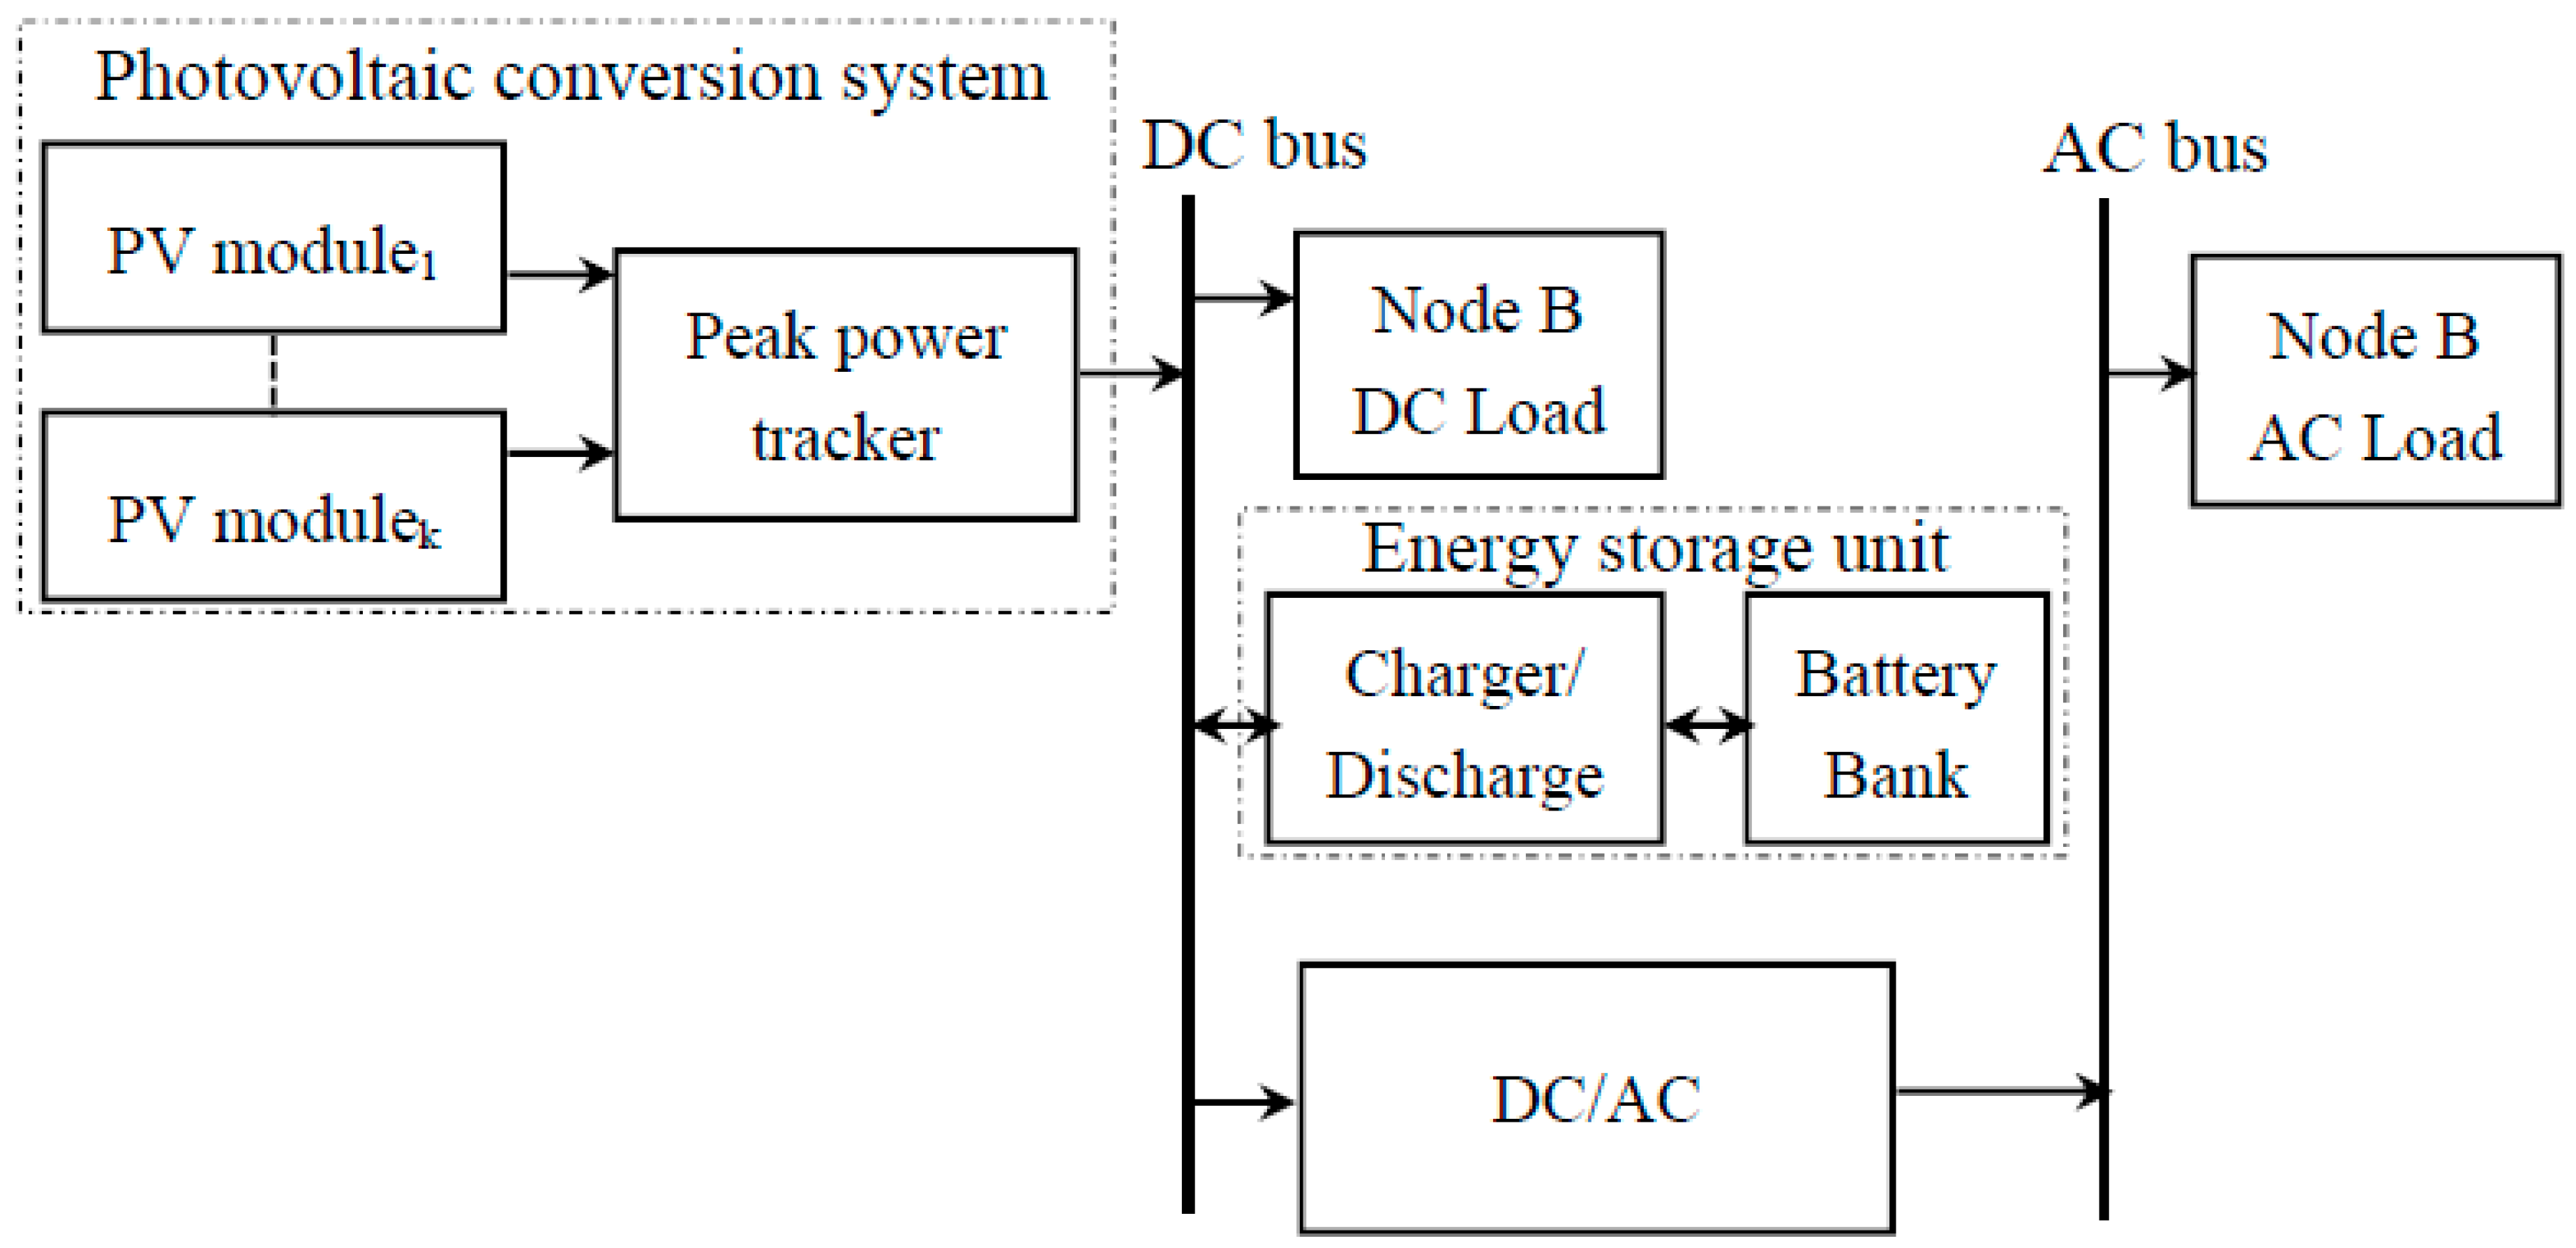
Node B is typically a direct current (DC) load [24]; however, the BS commonly includes alternating current (AC) load auxiliary equipment, such as a cooling system (i.e., air-conditioner) and lamps. The PV array directly feeds the required energy to the DC load of the UMTS Node B, whereas the AC load (i.e., cooling and lamps) is fed through a DC/AC inverter. Excess energy is stored in the battery bank and used when the PV array malfunctions or at night during load-shedding hours. Figure 1 presents the block diagram for the solar powered UMTS Node B.
2.1. Mathematical Model for the Key Components of the Solar Powered System
The solar powered UMTS Node B typically comprises various elements. This subsection describes these components and the corresponding mathematical models.
2.1.1. PV Panel
Several solar cells are combined to form a solar module that is interconnected in series/parallel to form a PV array. These cells absorb shortwave irradiance and convert it to DC electricity. The mathematical modeling in HOMER that computes the total annual energy contribution of the solar array (EPV), is based on the following equation [25]:
where YPV is the peak capacity of the PV array in kW; PSH is the peak solar hour, which is the equivalent average daily solar radiation; and fPV is the PV derating factor, which expresses the effects of dust, wire losses, temperature, and other factors that can affect the solar array’s output energy. The derating factor (or PV efficiency) refers to the relationship between the actual and target yields.
EPV = YPV × PSH × fPV × 365 day/year,
The most significant factors that affect the energy produced by a PV panel include the site’s geographic location or solar irradiation profile, and the PV panel’s tilt. The current cost of a PV panel with a DC rating of 1 kW is approximately $1000. At present, mono- and poly-crystalline silicon-based PV cells are common in large-scale applications [21].
2.1.2. Battery
A battery bank’s nominal capacity is the maximum state of charge of such a battery. Moreover, a battery’s minimum state of charge is the lower limit that does not discharge below the minimum state of charge. The depth of discharge (DOD) is the maximum energy that can be delivered from the battery and is computed based on the following equation [25]:
where is the minimum state of charge of the battery in (%). Complete battery draining (DOD) and the use of an overvoltage as a charge controller are recommended, to protect the battery from factors that lower its performance or lifespan, and pose safety risks (e.g., overcharging) [26,27].
The battery bank feeds the required energy load if the PV array malfunctions. Thus, battery bank autonomy (Baut) is a crucial feature that denotes the potential number of days that the battery bank can provide the necessary energy load for, even with a lack of contribution from the PV array. This value is expressed in the following equation, as the ratio of the battery bank size to the BS load [25]:
where Nbat is the battery number in the battery bank, BV is the nominal voltage of a single battery in V, BQ is the nominal capacity of a single battery in Ah, and LBS is the average daily BS load in kWh.
The battery lifecycle (Lbat) can reduce the total replacement cost during the project lifecycle. The main factors that affect the battery lifecycle are the throughput and battery float life. HOMER is used to calculate the battery lifecycle, based on the following equation [25]:
where Qlifetime is the lifetime throughput of a single battery in kWh, Qthrpt is the annual battery throughput in kWh, and Rbatt,f is the battery float life in years.
The number of batteries in series is equal to the DC bus-bar voltage (Vb-b) divided by the voltage rating (BV) of one of the batteries selected. This relationship is expressed as follows:
The number of parallel paths is obtained by dividing the total number of batteries by the number of batteries connected in series.
2.1.3. Inverter
An inverter is a device that changes a low DC voltage into a usable 220 V AC voltage, with the desired frequency of the load (air-conditioning). An inverter is one of the main elements of the proposed system. Inverters differ in terms of output wave format, output power, and installation type. The inverter capacity (Cinv) is computed based on the following equation [28]:
where LAC is the maximum AC load in kW, is the inverter efficiency in %, and σsf is the safety factor.
2.2. Cost Model and Optimization Formula
HOMER [25] is an optimization software package that is used to optimize the size of the components of a renewable energy system and scale them on the basis of the net present cost (NPC). Included in the NPC are the costs and revenues within the project lifetime, with future cash flows discounted to the present using the discount rate. The NPC particularly comprises the system components’ initial capital cost, the cost of any component replacements within the project lifetime, and the maintenance cost, among others. The revenue (i.e., salvage value) collected at the end of the project lifetime is considered and reduces the total NPC. In addition, HOMER is used to calculate the NPC, based on the following objective function [25]:
where TAC is the total annualized cost, CRF is the capital recovery factor, N is the project lifetime, and i is the annual real interest rate.
TAC is the total annualized cost value, if it occurred each year of the project lifetime, that would generate an NPC equal to the actual NPC. Accordingly, TAC is described as follows [25]:
where, TACIC, TACRep, and TACO&M are the annualized initial capital, replacement, and operation and maintenance (O&M) costs, respectively.
TAC = TACIC + TACRep + TACO&M,
CRF converts the present value into a flow of equal annual payments over a specified time. Hence, CRF is provided by the following equation [25]:
The calculation of the salvage value, which is the value that remains in each component at the end of the project lifetime, is based on the following equation [25]:
where Crep is the replacement cost of the component, Rrem is the remaining lifetime of the component, and Rcomp is the lifetime of the component.
The optimization formulation is described as follows:
thereby ensuring 100% energy autonomy and long-term power balance for the solar powered Node B. The objective function Equation (11) is subject to several technical constraints.
- System power balance:where PBattery is the power supplied Pdis or absorbed Pchar from the battery (kW), PPV is the power output from the PV (kW), and PLosses is the power losses (kW) of the system. The battery’s charging Pchar and discharging Pdis limits depend on the power rating.PBattery + PPV = PNode B + PLosses,
- The power output of each PV must be constantly positive:0 < PPV,
- The annual energy production from the PVs must be at least 10% of the total annual demand.
3. HOMER Methodology
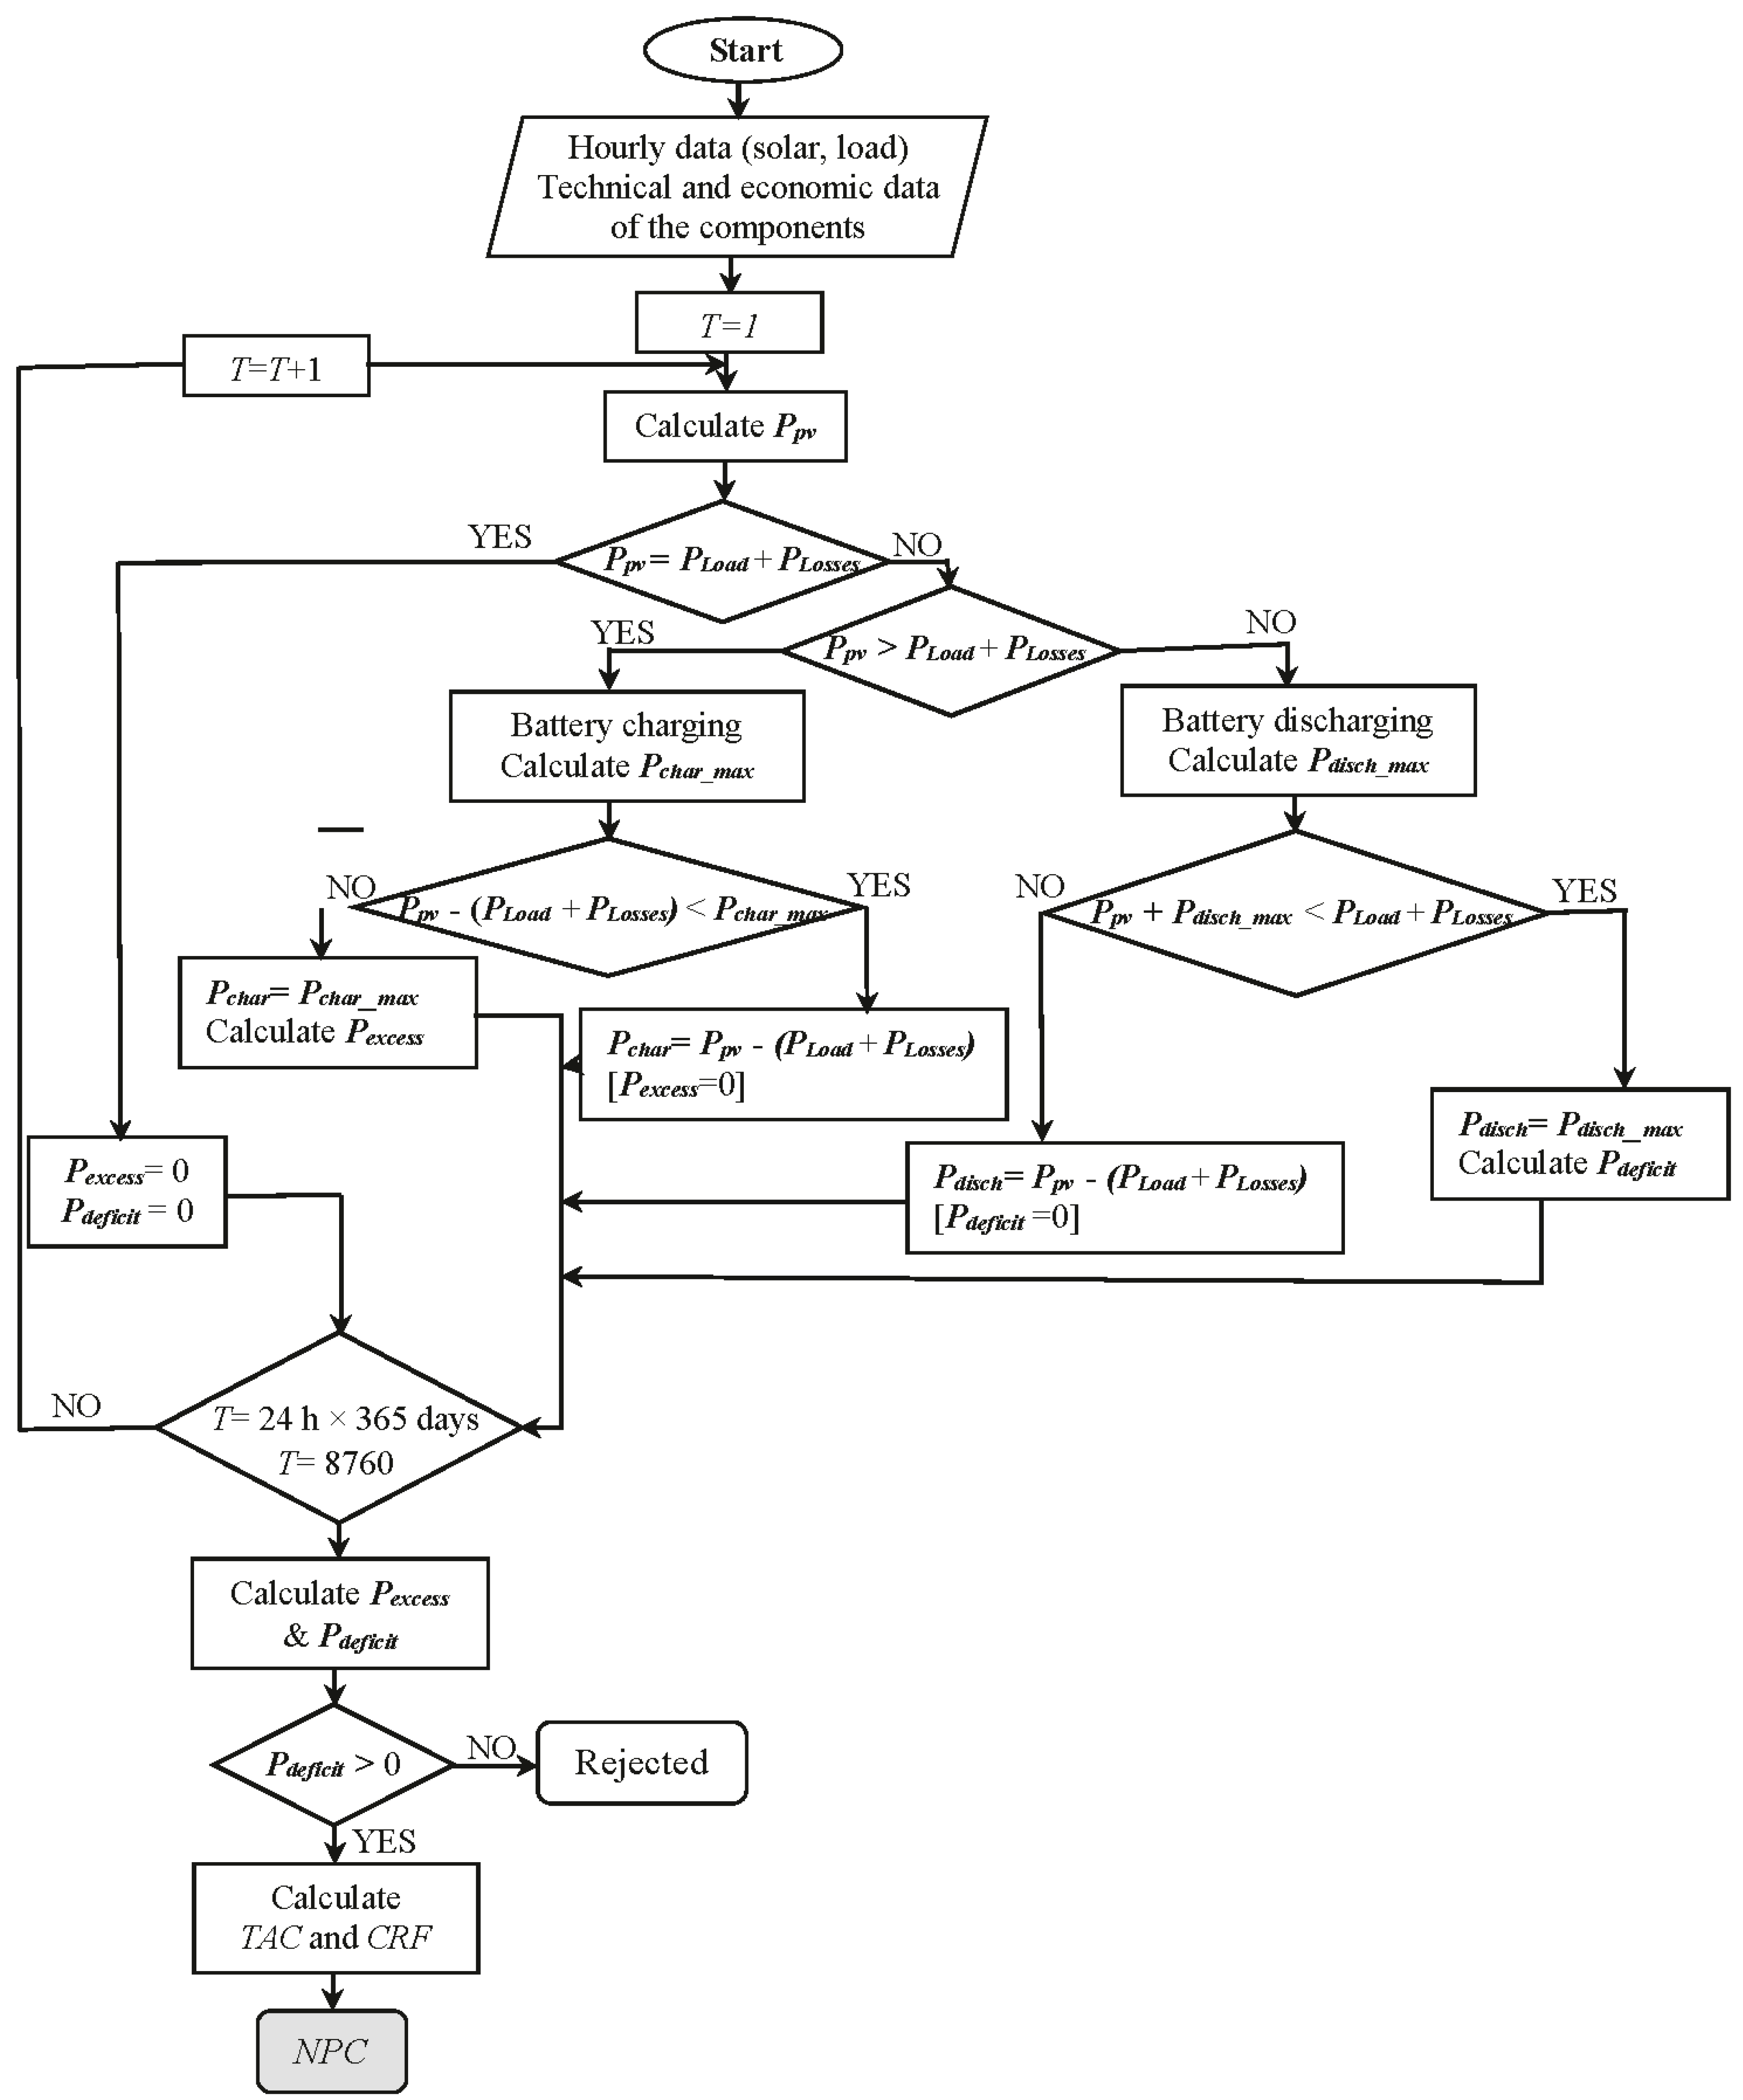
Figure 2 summarizes the methodology of the HOMER model used to determine the optimal solar system architecture with the lowest NPC cost. The main components of the HOMER methodology are the inputs, optimization, and outputs [25].
- Inputs:
- -
- Load profile in average monthly values.
- -
- Monthly average solar radiation values.
- -
- Economics and system control, such as the project lifetime and annual real interest rates.
- -
- The range of sizes for the components (i.e., PV, battery, and inverter) is set, and the cost data for each component, such as capital, replacement, and the O&M cost for the components, are inputted. Several technical restraints, such as lifetime and efficiency, are also inputted.
- Optimization:
- HOMER starts an hourly simulation of every possible configuration, computes the available power from the PV array (PPV), compares it with the electric load (PLoad) and losses (PLosses), and decides how to manage the surplus renewable power in times of excess (battery charging), or how to generate additional power in times of deficit (battery discharging). HOMER’s one-hour time step is considerably limited, to determine the most significant statistical aspects of the load and intermittent solar resource. Eventually, HOMER sorts the feasible combinations into increasing NPC, thereby representing the lifecycle cost of the system.
- Outputs:
- The annualized cost of each component is calculated using the capital, maintenance, replacement costs, and salvage value. The system’s total annualized cost is derived from the summation of each component’s annualized costs. In addition, the system’s total annualized cost is a significant economic index given that it is used to compute the system’s two principal economic figures, namely, the total NPC and cost of electricity (COE). Accordingly, the COE is the average cost per kWh of useful electrical energy that is produced by the solar powered system [25].
4. HOMER Configurations
This section presents the data used as the input parameters for the HOMER simulation of the solar powered system. The capacity range of the solar powered system components was considered in relation to the UMTS Node B power and energy demands. Table 1 presents the summary of the techno-economic HOMER configurations.
4.1. Load
The common UMTS Node Bs that are currently being deployed are UMTS Node B 2/2/2 and UMTS Node B 4/4/4 [29,30]. The nomenclature n/n/n represents a three-sector site with n antennas per sector. For example, 2/2/2 means that a BS comprises three sectors, with each sector having two antennas. The power consumptions of a typical UMTS Node B 2/2/2 and UMTS Node B 4/4/4 are 1 kW and 1.7 kW, respectively [29,30]. The power consumption of the air-conditioning unit depends on the internal and ambient temperature of the BS cabinet. An internal and ambient temperature of 25 °C is commonly assumed, thereby resulting in a constant power consumption for the air-conditioning unit. However, the power consumption of an air-conditioning unit scaled linearly with the total power consumption of Node B, is approximately 10% and 40 W lamps (7 p.m.–6 a.m.) [24]. The average annual DC energy demand of the UMTS Node B 2/2/2 is 7519 kWh (88%), whereas its AC energy demand is 1036 kWh (12%). The DC and AC energy demands of the UMTS Node B 4/4/4 are 13,057 kWh (89%) and 1649 kWh (11%), respectively.
4.2. Solar Irradiation Annual Time Series Input Data
Given the location of South Korea (i.e., latitude 37°53′ and longitude 127°02′), HOMER accesses an online database that provides data from either NREL’s climatological solar radiation or NASA’s surface meteorology and solar energy data set [25]. The annual average solar irradiation is 4.01 kWh/m2/day. Figure 3 illustrates the solar resource profile for a one-year period.
4.3. Economics and System Control
The project lifetime is a crucial issue because it affects the total project cost, which is reflected in the economic feasibility of the project. The project lifetime is set to 10 years, because that of the UMTS Node B is 10 years [31]. The annual interest rate is another crucial issue because of its effect on the discount factor for each year of the project’s lifetime. Thus, the interest rate affects the total project cost. The annual interest rate that is used in this study is 1.25%, which was the interest rate in South Korea in 2016 [32].
4.4. Photovoltaic Panels
The capital and replacement costs of the PV panels is $1000/kW [21]. The O&M cost is $10. The derating factor is set to 85%, based on the guarantee of most PV producers [33,34]. Moreover, the ground reflectance is assumed to be 20%. The panels are modeled on a two-axis tracking mode, thereby increasing the total annual energy contribution of the PV array, as well as enabling wind, rain, and gravity to naturally remove most of the debris and dust [35].
4.5. Batteries
This study includes conventional generic batteries to store and supply surplus energy in cases of high demand. A commercial type battery contained in the HOMER library (i.e., Trojan L16P) is considered for the simulations. The capital and replacement costs per battery are approximately $300, whereas the O&M cost is $10. The nominal voltage is 6 V, the capacity is 360 Ah, and the DOD is 70% [36].
4.6. Inverter
A power electronic DC/AC inverter is required to maintain the energy flow between the DC side (i.e., PV and batteries) and AC side (i.e., air-conditioner and auxiliary equipment). The capacity level is selected to provide full power supply from the AC side, even during peak demand periods. The typical capital and replacement cost for 1 kW is approximately $400, whereas the O&M cost is $10. The lifetime is estimated at 15 years and the efficiency is 95%.
5. Results and Discussion
This section discusses the optimum size, energy output, and economic analysis of the proposed solar powered system for the 3G UMTS Node B 2/2/2 and 3G UMTS Node B 4/4/4. The daily solar radiation of South Korea (4 kWh/m2) is used as the basis for the case study.
5.1. 3G UMTS Node B 2/2/2
Table 2 summarizes the optimal system architecture of the solar powered UMTS Node B, which comprises three sectors, with each sector having two antennas.
The PV array’s annual energy contribution is 13,086 kWh. The total annual energy needed by the Node B 2/2/2 is 8555 kWh. The difference between the energy production of the PV array and the consumption by the Node B 2/2/2 is equal to an energy excess of 3618 kWh/year (27.6%), battery losses of 858 kWh/year plus inverter, and losses of 55 kWh/year. Figure 4 shows the time series in the average hourly values of the power output from the PV array and battery bank state-of-charge (SOC). Evidently, the battery bank is used in instances of a small power output from the PV array, which is demonstrated by the low SOC during these times. The maximum depletion of the battery bank occurred at the end of July. Figure 5 shows that the depletion of the energy stored in the battery bank for six consecutive days (i.e., 30 July to 4 August) reached the lowest level on 4 August, without LOL.
Excess electricity is stored in the battery bank for the future consumption of BS at night, during load-shedding hours, or when the available solar energy is insufficient to feed the BS load. Figure 6 summarizes the battery bank’s optimum size, design criteria, energy yield, SOC, lifetime, and autonomy hours. The optimal number of batteries that was determined by the HOMER simulation is 64, which will be connected as eight in series and eight in parallel, to be compatible with the 48 V DC bus-bar. The annual energy-in of the battery is 5856 kWh, whereas the annual energy-out is 4999 kWh, with a roundtrip efficiency of 85%. The battery bank can supply the Node B 2/2/2 load with autonomy for 99.1 h; thus, the battery bank can supply the load without the support of the PV array for 4 days and 3 h. This time span is sufficient to fix any malfunctions in the PV array. The cost of the batteries forms a significant component of the overall cost of a solar powered BS. Hence, the lifetime of these batteries is generally significant. Accordingly, the expected battery life is 10 years. The low battery bank SOC occurred on the first of August (black scale), because the lowest output power of the PV array occurred during this period (Figure 4). The frequency histogram demonstrates that the battery bank is in a minimal SOC for approximately 1% of the year and high SOC for approximately 33% of the year. These results suggest that additional batteries can potentially be used. Other critical considerations are the intermittency of power from the PV array, potential variations in the annual solar power output, and the battery capacity decrease over the years.
The required inverter must be capable of handling 0.16 kW. Figure 7 shows the monthly output power of the inverter, thereby demonstrating that the output power of the inverter is 0.10 kW from period 6:00 to 19:00. This range covers the air-conditioned energy required because the lamps are turned off during this period (daytime). In contrast, the output power of the inverter is 0.14 kW from period 19:00 to 6:00, which cover the air-conditioned and lamp loads. The annual energy-in of the inverter is 1091 kWh, whereas the annual energy-out is 1036 kWh, with 95% efficiency and 8759 h/year operation.
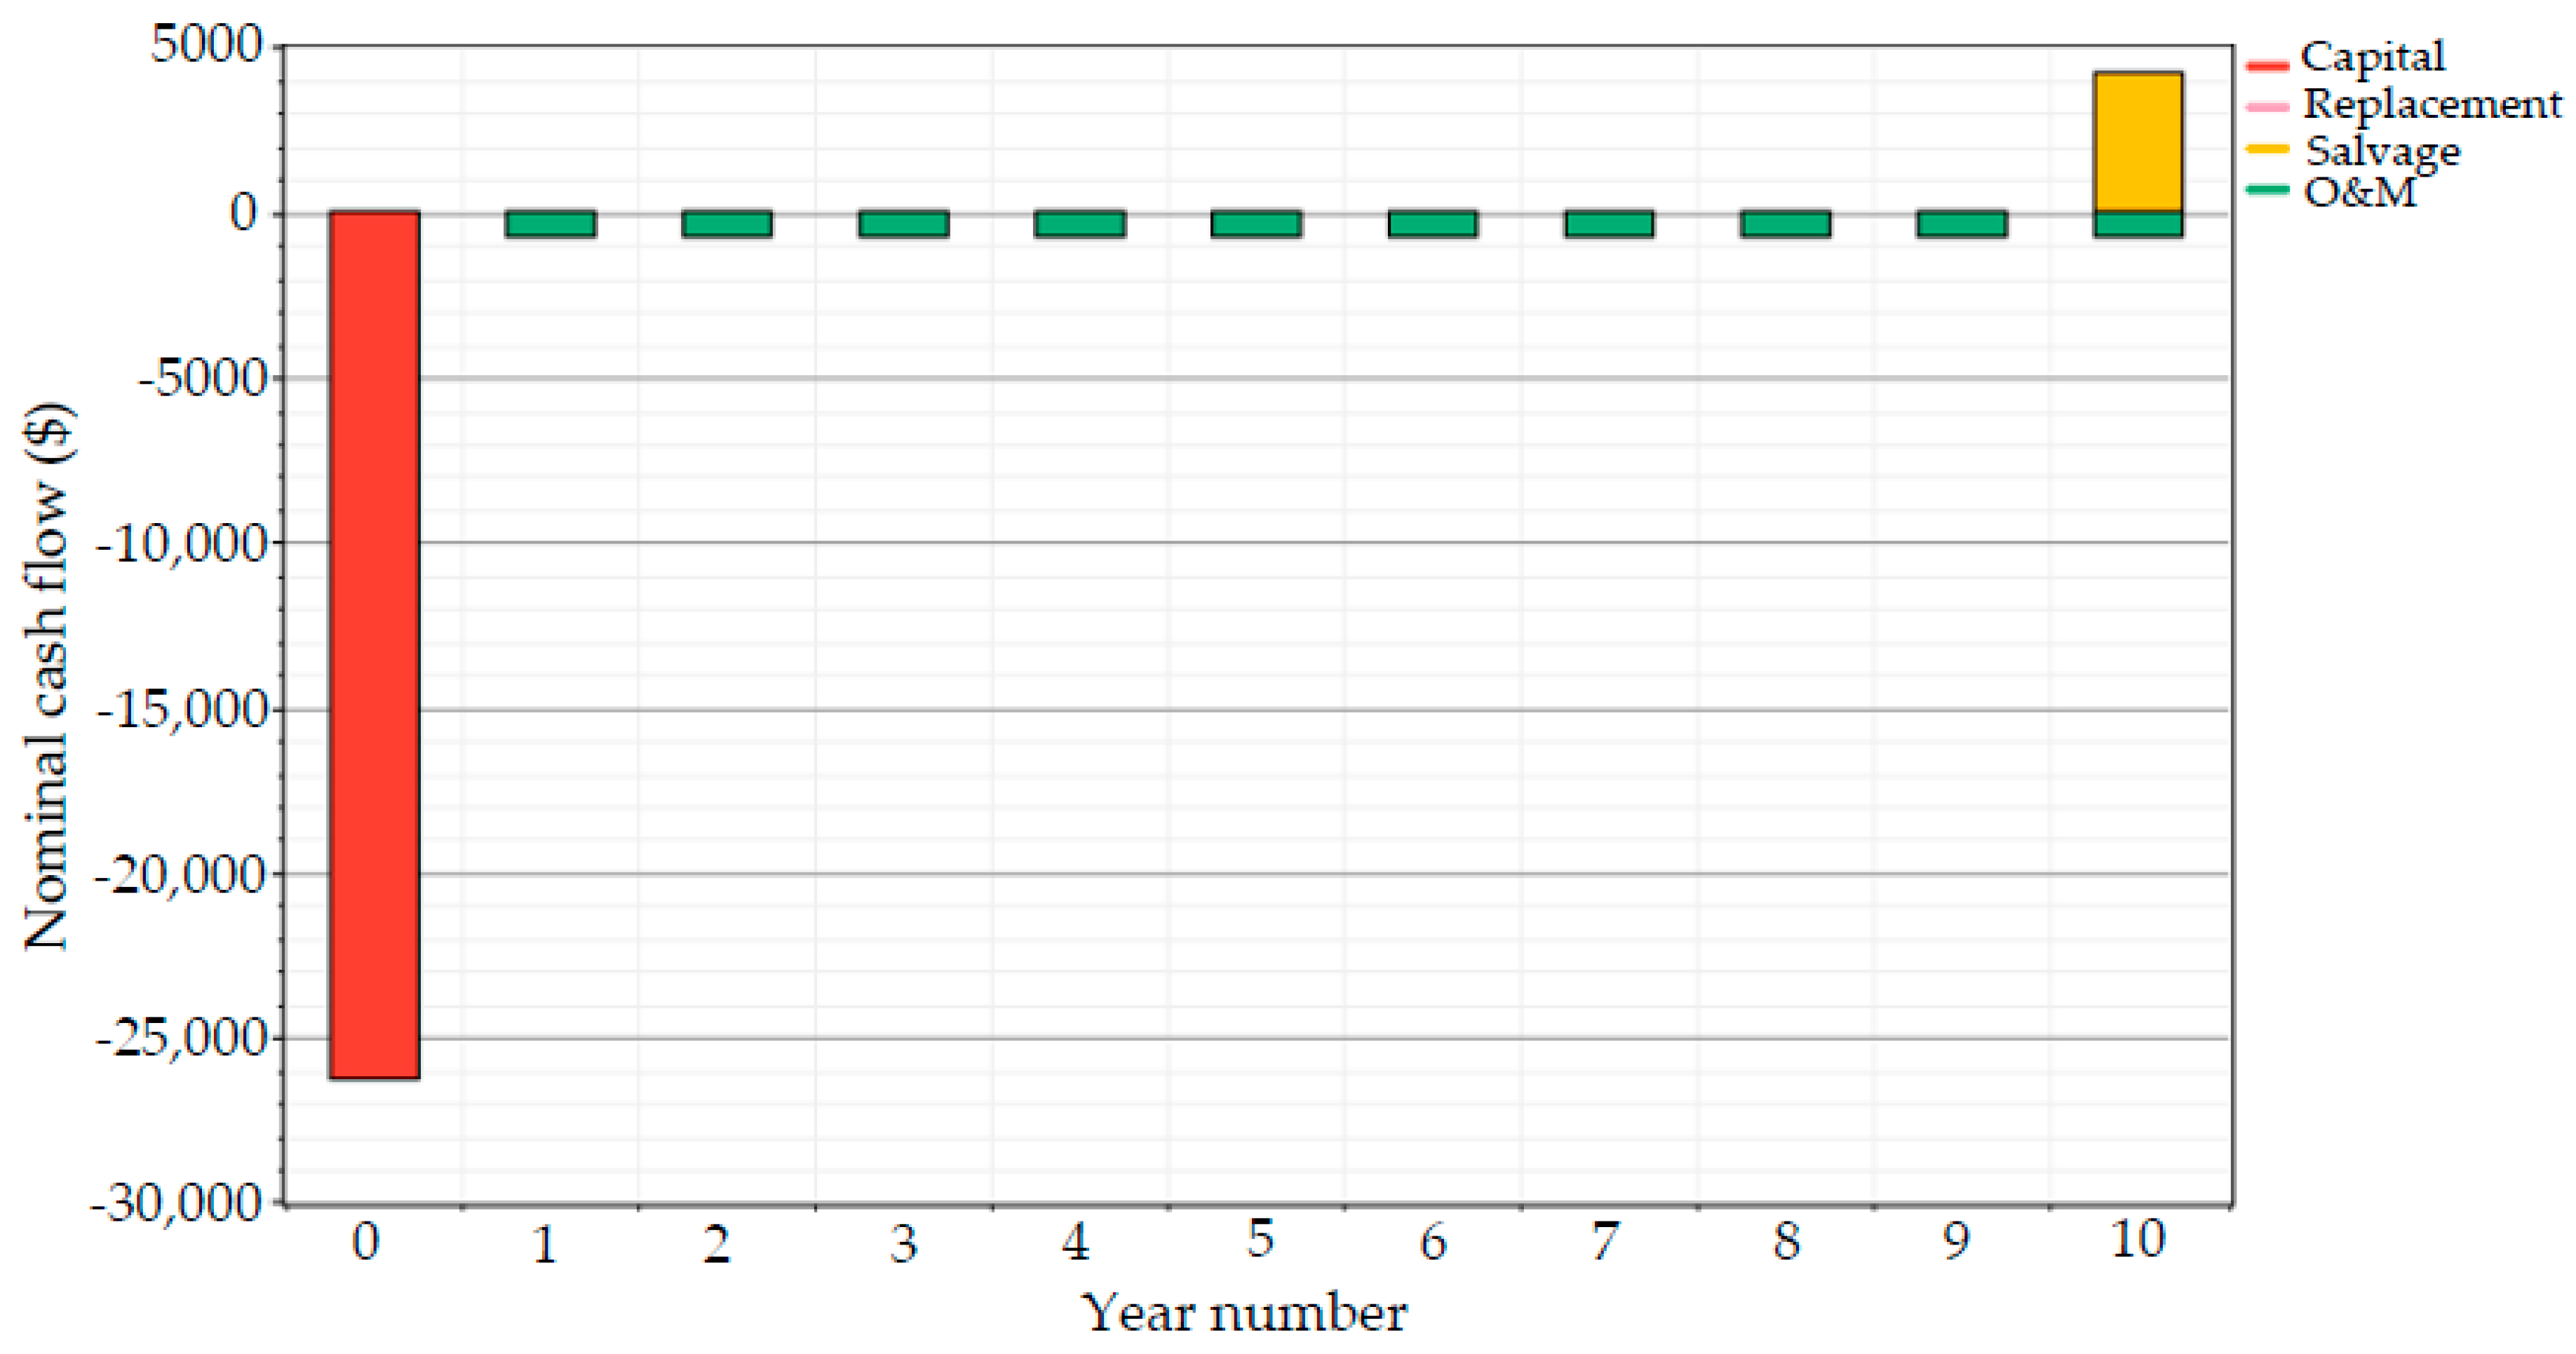
Figure 8 summarizes the annual costs of the proposed solar powered system. The initial capital cost is $26,264 (PV array $7000 + battery bank $19,200 + inverter $64), the O&M cost is $711.6 (PV array $70 + battery bank $640 + inverter $1.6), and the salvage value is $4221 (PV array $4200 + inverter $21). The battery bank has a lifetime of 10 years, which is the same as the project lifetime. Thus, the inverter and PV array have lifetimes of 15 and 25 years, respectively. Therefore, neither component requires replacement.
The battery bank evidently represents the highest cost in the proposed system. However, this cost depends on the number of batteries in the system. HOMER determined that the optimal number of batteries is 64. Accordingly, decreasing the number of batteries provides significant economic benefits, such as an increase in the annual operating savings cost and a decrease in the initial capital cost and NPC. Moreover, decreasing the battery number decreases the battery autonomy, which is considered an important issue in the solar powered UMTS Node B 2/2/2 that operates 24/7. Hence, this option is not recommended.
A system’s NPC is the total cost that it incurs over its lifetime, minus the total revenue that it earns over its lifetime (salvage value). Moreover, the NPC is calculated by obtaining the sum of the total discounted cash flows in each year of the project’s lifetime: initial capital cost ($26,264) + O&M cost ($6650) − salvage value ($3728) = $29,186.
From the perspective of mobile operators, increasing the profitability and reducing the OPEX in the cellular network are the main targets of the green communication initiative. A summary of the economic feasibility of deploying the solar powered UMTS Node B 2/2/2 in urban and remote areas is provided as follows:
- Urban areas: EG is typically used to power the UMTS Node B 2/2/2. The cost of the energy consumed by Node B 2/2/2 over the project lifetime is approximately South Korean Won (KRW) 60.698 million (the annual Node B 2/2/2 energy consumed at 8555 kWh × energy price in KRW709.5/kWh × project lifetime of 10 years [37]). KRW60.698 million equals $52,767 at a foreign exchange rate of 1 USD = 1150.05 KRW, as of 10 February 2017. Thus, applying the proposed solar powered UMTS Node B 2/2/2 in urban areas will result in total OPEX savings of 44.69% ($23,581).
- Remote areas: DG is typically used to power the UMTS Node B 2/2/2. The DG requires approximately 3.5 kW, which is computed as (the maximum Node B 2/2/2 load of 1 kW) divided by (DG efficiency 30% [38] × converter efficiency 95%). The annual cost of the maintenance and operation of DG amounts to $4150 (excluding the cost of fuel transport, thereby further adding to this amount). The cost breakdown is presented as follows: (1) $438 for DG maintenance per year based on a DG maintenance cost of $0.05/h × annual DG operating hours of 8760 h; and (2) fuel cost of $3712 based on the diesel price of $1.04/L [39], multiplied by the total diesel consumption of 3569 L/year, which is computed based on a specific fuel consumption of 0.388 L/kWh × annual electrical production of the DG of 9198 kWh/year (DG capacity size 3.5 kW × DG efficiency 0.3 × 24 h × 365 days/year). Hence, the total O&M costs over the project’s lifetime is $41,496. Mobile operators may need to change the DG every three years. Accordingly, the total DG replacement cost is 3 × (size 3.5 kW × cost $660/kW), which is equal to $6930. The NPC for the Node B 2/2/2 powered by DG is $50,736 (initial capital cost $2310 + O&M cost $41,496 + replacement cost $6930). Therefore, applying the proposed solar powered UMTS Node B 2/2/2 in remote areas will result in a total OPEX saving of 42.48% ($21,550).
5.2. 3G UMTS Node B 4/4/4
Table 3 summarizes the optimal system architecture of the solar powered UMTS Node B, which comprises three sectors, with each sector having four antennas.
The PV array’s annual energy contribution is 22,350 kWh. The total annual energy that Node B 4/4/4 needs is 14,706 kWh. The difference between the energy production of the PV array and the consumption by Node B 4/4/4, is equal to an energy excess of 6089 kWh/year (27.24%), battery losses of 1478 kWh/year, and inverter losses of 87 kWh/year. Figure 9 shows the average hourly values of the power output from the PV array and SOC at these times. The maximum depletion for the battery bank occurred on the first of August, September, and December, due to the lowest output power of the PV array that occurred during these time periods.
Figure 10 presents a summary of the optimal battery bank for the solar powered UMTS Node B 4/4/4. The HOMER simulation determined that the optimal number of batteries is 128, which will be connected as eight in series and 16 in parallel, to be compatible with the 48 V DC bus–bar. The annual energy-in of the battery is 10,024 kWh, whereas the annual energy-out is 8556 kWh. The battery bank can supply the Node B 4/4/4 load with autonomy for 115 h (4 days and 19 h). The expected battery life is 10 years. The low battery bank SOC occurred on the first of August, September, and December (black scale). The frequency histogram demonstrates that the battery bank is in a minimal SOC for approximately 1% of the year and high SOC for approximately 35% of the year. These results suggest that additional batteries can potentially be used.
The required inverter should be able to handle 0.23 kW. Figure 11 demonstrates that the output power of the inverter is 0.17 kW from period 6:00 to 19:00, which covers the air-conditioned energy required; the lamps are turned off during this period. By contrast, the output power of the inverter is 0.21 kW from period 19:00 to 6:00, which covers the air-conditioned and lamp loads. The annual energy-in of the inverter is 1735 kWh, whereas the annual energy-out is 1649 kWh, with 95% efficiency and 8759 h/year operation.
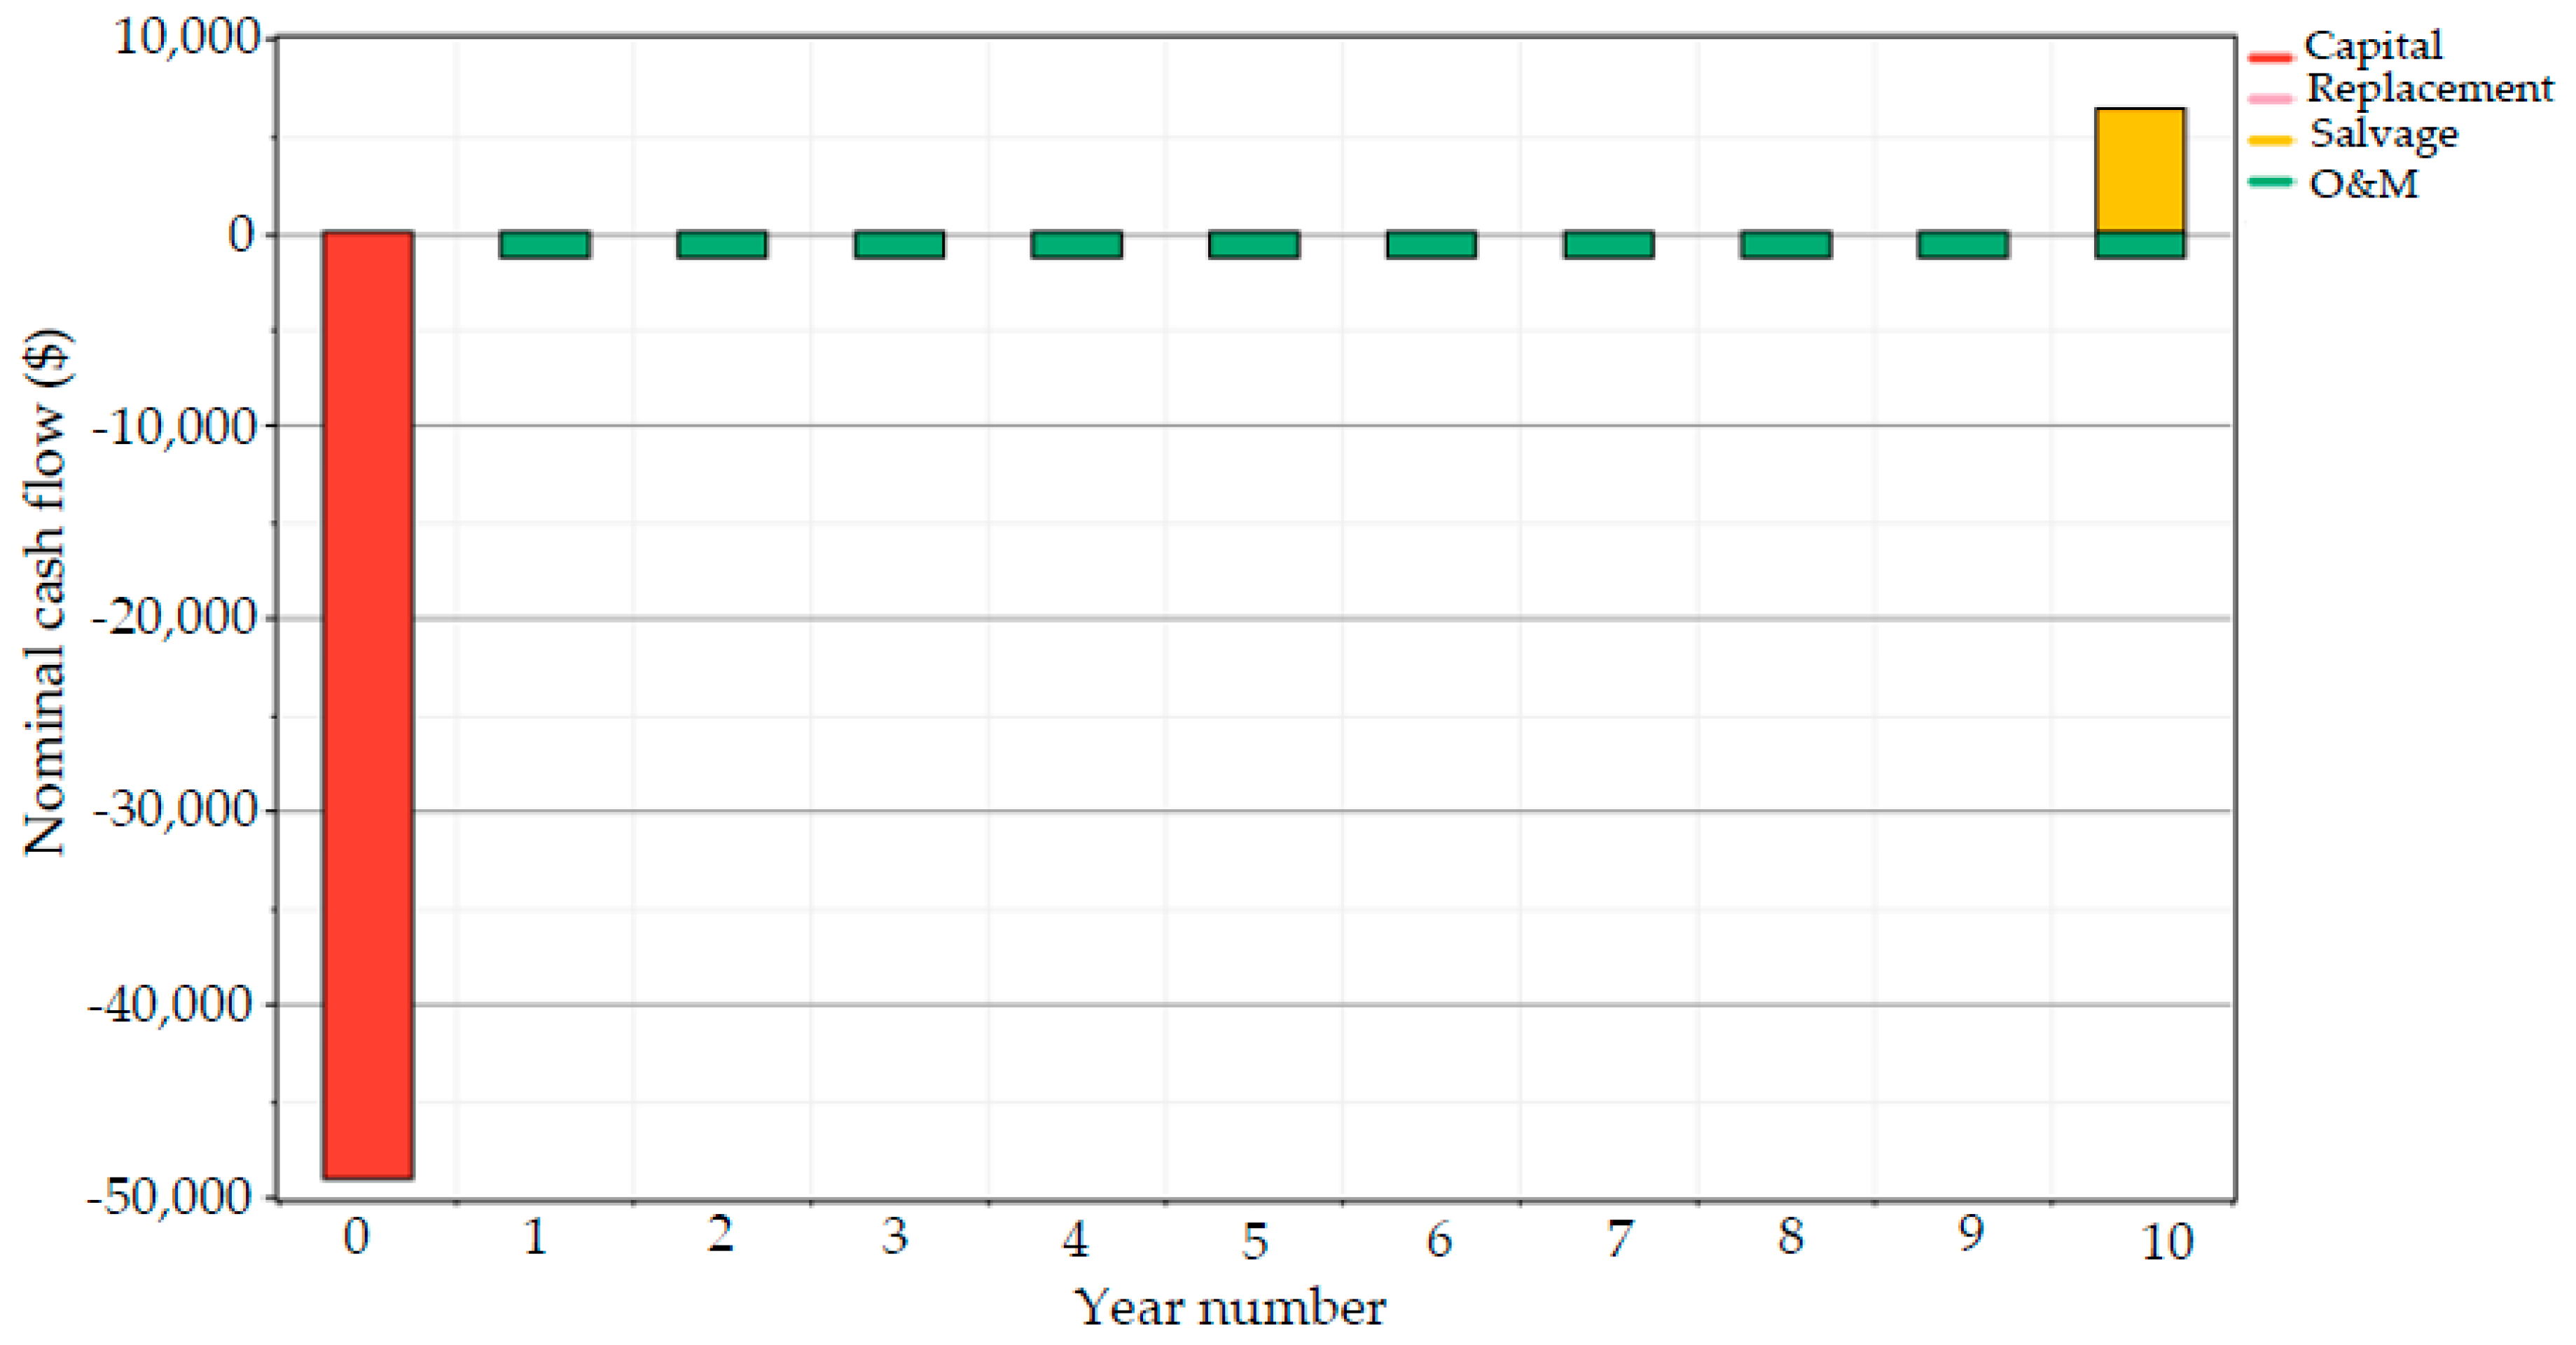
Figure 12 summarizes the annual costs of the proposed solar powered system. The initial capital cost is $49,992 (PV array $11,500 + battery bank $38,400 + inverter $92), the O&M cost is $1397 (PV array $115 + battery bank $1280 + inverter $2.3), and the salvage value is $6931 (PV array $6900 + inverter $31). No replacement cost is recorded.
The total discounted NPC is $56,931, which is computed as follows: initial capital cost $49,992 + O&M cost $13,059 − salvage value $6120. The economic feasibility of deploying the solar powered UMTS Node B 4/4/4 in the urban and remote areas is as follows:
- Urban areas: The cost of the energy consumed by the Node B 4/4/4 over the project lifetime is approximately KRW104.339 million [37], which is equal to $90,703. Hence, applying the proposed solar powered UMTS Node B 2/2/2 in urban areas will result in total OPEX savings of 37.23% ($33,772).
- Remote areas: The DG needed approximately 6 kW. The annual cost of the maintenance and operation of the DG amounts to $6801. The breakdown of this cost is presented as follows: (1) $438 for the DG maintenance per year based on the DG maintenance cost of $0.05/h × annual DG operating hours of 8760 h; and (2) fuel cost of $6363 based on the diesel price of $1.04/L [39], multiplied by the total diesel consumption of 6118 L/year, which is computed based on a specific fuel consumption of 0.388 L/kWh × annual electrical production of the DG of 15,768 kWh/year (DG capacity size 6 kW × DG efficiency 0.3 × 24 h × 365 days/year). Hence, the total O&M costs over the project’s lifetime is $68,007. The total DG replacement cost is 3 × (size of 6 kW × cost $660/kW), which is equal to $11,880. The NPC for the Node B 4/4/4 powered by DG is $83,847. Therefore, applying the proposed solar powered UMTS Node B 4/4/4 in remote areas will result in a total OPEX saving of 32.10% ($26,916).
6. Conclusions
This study addresses the energy consumption of UMTS with hybrid PV/energy storage. The optimum criteria, including the economic and technical feasibility parameters, have been evaluated using the HOMER software package. The results of the extensive simulation show that the proposed solar system can cover the UMTS Node B load, without LOL and with cost effectiveness. In addition, the battery bank can supply the UMTS Node B load with autonomy for a sufficient time to repair any malfunction in the solar array. The results also show that the proposed solar powered system is more economically feasible for mobile operators than using EG (urban areas) or DG (remote areas). The solar powered UMTS Node B 2/2/2 has achieved OPEX savings of up to 44.69% and 42.48% compared to those of EG and DG, respectively. Furthermore, the solar powered UMTS Node B 4/4/4 has achieved an OPEX saving of up to 37.23% compared to EG, and up to 32.10% compared to DG.
Acknowledgments
This study was supported by the faculty research fund of Sejong University in 2016. The author would like to thank Rosdiadee Nordin from the Universiti Kebangsaan Malaysia (UKM), Malaysia for his beneficial advice and recommendations.
Conflicts of Interest
The author declares no conflict of interest.
References
- Aris, A.M.; Shabani, B. Sustainable power supply solutions for off-grid base stations. Energies 2015, 8, 10904–10941. [Google Scholar] [CrossRef]
- Feng, D.; Jiang, C.; Lim, G.; Cimini, L.J.; Feng, G.; Li, G.Y. A survey of energy-efficient wireless communications. IEEE Commun. Surv. Tutor. 2013, 15, 167–178. [Google Scholar] [CrossRef]
- Oh, E.; Krishnamachari, B.; Liu, X.; Niu, Z. Toward dynamic energy-efficient operation of cellular network infrastructure. IEEE Commun. Mag. 2011, 49, 56–61. [Google Scholar] [CrossRef]
- Oh, E.; Son, K.; Krishnamachari, B. Dynamic base station switching-on/off strategies for green cellular networks. IEEE Trans. Wirel. Commun. 2013, 12, 2126–2136. [Google Scholar] [CrossRef]
- Alsharif, M.H.; Nordin, R.; Ismail, M. Energy optimisation of hybrid off-grid system for remote telecommunication base station deployment in Malaysia. EURASIP J. Wirel. Commun. Netw. 2015, 2015, 64. [Google Scholar] [CrossRef]
- Hasan, Z.; Boostanimehr, H.; Bhargava, V.K. Green Cellular Networks: A Survey, Some Research Issues and Challenges. IEEE Commun. Surv. Tutor. 2011, 13, 524–540. [Google Scholar] [CrossRef]
- Suarez, L.; Nuaymi, L.; Bonnin, J.-M. An overview and classification of research approaches in green wireless networks. EURASIP J. Wirel. Commun. Netw. 2012, 2012, 142. [Google Scholar] [CrossRef]
- Wu, J.; Zhang, Y.; Zukerman, M.; Yung, E. Energy-Efficient Base Stations Sleep Mode Techniques in Green Cellular Networks: A Survey. IEEE Commun. Surv. Tutor. 2015, 17, 803–826. [Google Scholar] [CrossRef]
- Alsharif, M.H.; Nordin, R.; Ismail, M. Survey of Green Radio Communications Networks: Techniques and Recent Advances. J. Comput. Netw. Commun. 2013, 2013, 453893. [Google Scholar] [CrossRef]
- Chiaraviglio, L.; Ciullo, D.; Meo, M.; Marsan, M.A.; Torino, I. Energy-aware UMTS access networks. In Proceedings of the IEEE W-GREEN, Lapland, Finland, 8 September 2008; pp. 1–8. [Google Scholar]
- Chiaraviglio, L.; Ciullo, D.; Meo, M.; Marsan, M.A. Energy-efficient management of UMTS access networks. In Proceedings of the 21st International conference in Teletraffic Congress, Paris, France, 15–17 September 2009; pp. 1–8. [Google Scholar]
- Marsan, M.A.; Chiaraviglio, L.; Ciullo, D.; Meo, M. Optimal energy savings in cellular access networks. In Proceedings of the IEEE International Conference on in Communications (ICC) Workshops, Dresden, Germany, 14–18 June 2009; pp. 1–5. [Google Scholar]
- Lorincz, J.; Capone, A.; Begusic, D. Impact of service rates and base station switching granularity on energy consumption of cellular networks. EURASIP J. Wirel. Commun. Netw. 2012, 2012, 342. [Google Scholar] [CrossRef]
- Amutha, W.M.; Rajini, V. Techno-economic evaluation of various hybrid power systems for rural telecom. Renew. Sustain. Energy Rev. 2015, 43, 553–561. [Google Scholar] [CrossRef]
- GSMA. Green Power for Mobile Interactive Replication Guide. London, UK, June 2012. Available online: http://www.gsma.com/mobilefordevelopment/wp-content/uploads/2012/06/Indian_ReplicationGuide_300512_Final.pdf (accessed on 10 February 2017).
- Paudel, S.; Shrestha, J.N.; Neto, F.J.; Ferreira, J.A.; Adhikari, M. Optimization of hybrid PV/Wind power system for remote telecom station. In Proceedings of the 2011 International Conference on Power and Energy Systems (ICPS), Chennai, India, 22–24 December 2011; pp. 1–6. [Google Scholar]
- Ahmed, I.; Ikhlef, A.; Ng, D.W.K.; Schober, R. Power allocation for an energy harvesting transmitter with hybrid energy sources. IEEE Trans. Wirel. Commun. 2013, 12, 6255–6267. [Google Scholar] [CrossRef]
- Han, T.; Ansari, N. On optimizing green energy utilization for cellular networks with hybrid energy supplies. IEEE Trans. Wirel. Commun. 2013, 12, 3872–3882. [Google Scholar] [CrossRef]
- Marsan, M.A.; Gerboni, R.; Iglesias, J.G.; Meo, M.; Zhang, Y. Optimizing the Power Supply of a Macro BS Connected to a PV Panel and the Power Grid. In Proceedings of the GTTI Meeting (Gruppo Telecommunicazioni e Tecnologie dell’Informazione), Palermo, Italy, 18–20 June 2014. [Google Scholar]
- Marsan, M.A.; Bucalo, G.; di Caro, A.; Meo, M.; Zhang, Y. Towards zero grid electricity networking: Powering BSs with renewable energy sources. In Proceedings of the 2013 IEEE International Conference on Communications Workshops (ICC), Budapest, Hungary, 9–13 June 2013; pp. 596–601. [Google Scholar]
- Chamola, V.; Sikdar, B. Solar powered cellular base stations: Current scenario, issues and proposed solutions. IEEE Commun. Mag. 2016, 54, 108–114. [Google Scholar] [CrossRef]
- Alsharif, M.H.; Kim, J. Optimal Solar Power System for Remote Telecommunication Base Stations: A Case Study Based on the Characteristics of South Korea’s Solar Radiation Exposure. Sustainability 2016, 8, 942. [Google Scholar] [CrossRef]
- KMA. Annual Climatological Report 2013, Korea Meteorological Administration. Available online: http://www.kma.go.kr/weather/observation/data_monthly.jsp (accessed on 10 February 2017).
- Imran, M.; Katranaras, E.; Auer, G.; Blume, O.; Giannini, V.; Godor, I.; Jading, Y.; Olsson, M.; Sabella, D.; Skillermark, P. Energy Efficiency Analysis of the Reference Systems, Areas of Improvements and Target Breakdown; Tech. Rep. ICT-EARTH Deliverable D2.3; EC-IST Office: Brussels, Belgium, 2010. [Google Scholar]
- Lambert, T.; Gilman, P.; Lilienthal, P. Micropower System Modeling with HOMER, 2006. Available online: http://homerenergy.com/documents/MicropowerSystemModelingWithHOMER.pdf (accessed on 10 February 2017).
- Riffonneau, Y.; Bacha, S.; Barruel, F.; Ploix, S. Optimal power flow management for grid connected PV systems with batteries. IEEE Trans. Sustain. Energy 2011, 2, 309–320. [Google Scholar] [CrossRef]
- Schmitt, G. The Green Base Station. In Proceedings of the 4th International Conference on Telecommunication-Energy Special Conference (TELESCON), Frankfurt, Germany, 10–13 May 2009; pp. 1–6. [Google Scholar]
- Rehman, S.; Al-Hadhrami, L.M. Study of a solar PV–diesel–battery hybrid power system for a remotely located population near Rafha, Saudi Arabia. Energy 2010, 35, 4986–4995. [Google Scholar] [CrossRef]
- Motorola Reach. Alternative Power for Mobile Telephony Base Stations. Solution Paper. 2007. Available online: http://content.motorolasolutions.com/web/Business/Solutions/Technologies/WiMax/Access%20Services%20Network/_Documents/_Static%20Files/6682_MotDoc.pdf (accessed on 10 February 2017).
- Infinite Focus Group. Alternative and Sustainable Power for Nigerian GSM/Mobile Base Stations. Ireland. Available online: http://infinitefocus-group.com/yahoo_site_admin/assets/docs/WHITE_Paper_Globacom.16865153.pdf (accessed on 10 February 2017).
- Ge, X.; Cheng, H.; Guizani, M.; Han, T. 5G wireless backhaul networks: Challenges and research advances. IEEE Netw. 2014, 28, 6–11. [Google Scholar] [CrossRef]
- The Bank of Korea Monetary Policy. Available online: http://www.bok.or.kr/baserate/baserateList.action?%20menuNaviId=33 (accessed on 10 February 2017).
- Vázquez, M.J.V.; Marquez, J.M.A.; Manzano, F.S. A methodology for optimizing stand-alone PV-system size using parallel-connected DC/DC converters. IEEE Trans. Ind. Electron. 2008, 55, 2664–2673. [Google Scholar] [CrossRef]
- Marion, B.; Adelstein, J.; Boyle, K.; Hayden, H.; Hammond, B.; Fletcher, T. Performance parameters for grid-connected PV systems. In Proceedings of the IEEE Conference on Photovoltaic Specialists, Lake Buena Vista, FL, USA, 3–7 January 2005; pp. 1601–1606. [Google Scholar]
- Lee, J.F.; Rahim, N.A.; Al-Turki, Y.A. Performance of dual-axis solar tracker versus static solar system by segmented clearness index in Malaysia. Int. J. Photoenergy 2013, 2013, 820714. [Google Scholar] [CrossRef]
- Trojan Battery Incorporation. Available online: http://www.trojanbattery.com/ (accessed on 10 February 2017).
- Korean Energy Corporation. Available online: https://home.kepco.co.kr/kepco/EN/F/B/ENFBPP002.do?menuCd=EN060202 (accessed on 10 February 2017).
- Kusakana, K.; Vermaak, H.J. Hybrid Renewable Power Systems for Mobile Telephony Base Stations in Developing Countries. Renew. Energy 2013, 51, 419–425. [Google Scholar] [CrossRef]
- Global Petrol Prices. Available online: http://www.globalpetrolprices.com/South-Korea/diesel_prices/ (accessed on 10 February 2017).
Figure 1.
Solar powered UMTS Node B architecture.

Figure 2.
Optimization flowchart of the solar powered system using the HOMER model.

Figure 3.
Annual profile of solar irradiation.

Figure 4.
Average hourly values of the PV array power output and SOC for the solar powered UMTS Node B 2/2/2.
Figure 4.
Average hourly values of the PV array power output and SOC for the solar powered UMTS Node B 2/2/2.
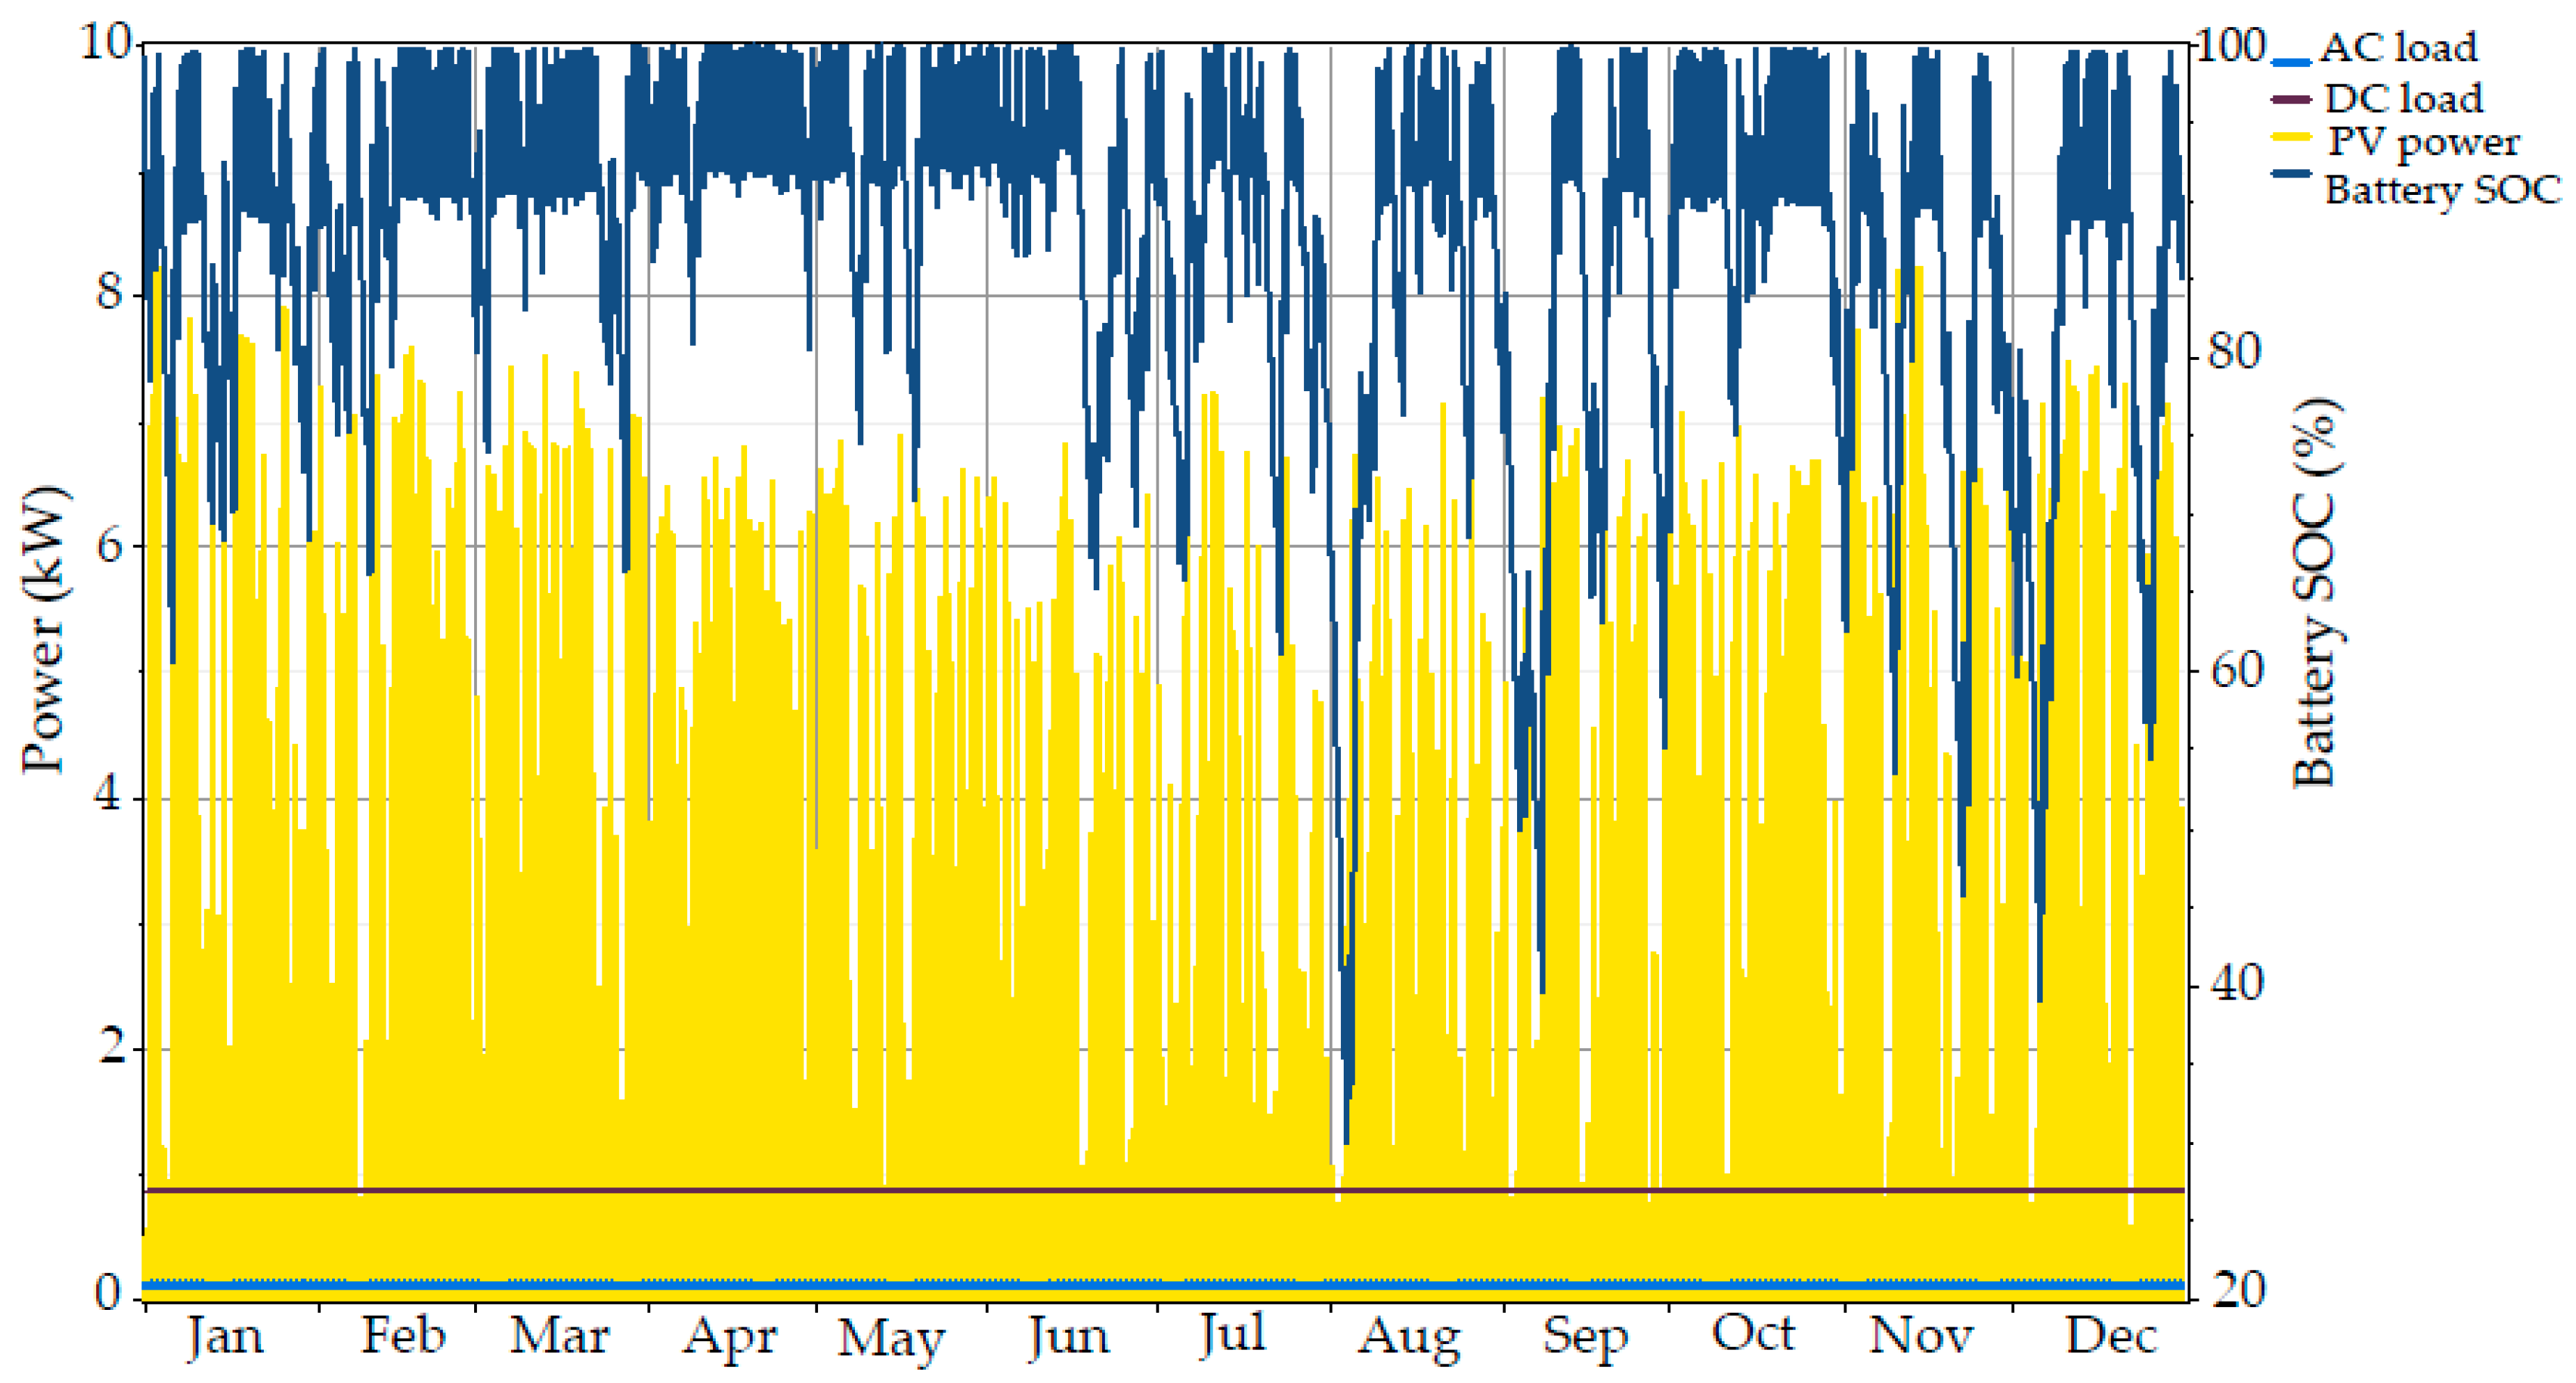
Figure 5.
Battery bank depletion of the solar powered UMTS Node B 2/2/2 between the end of July and the first of August.
Figure 5.
Battery bank depletion of the solar powered UMTS Node B 2/2/2 between the end of July and the first of August.
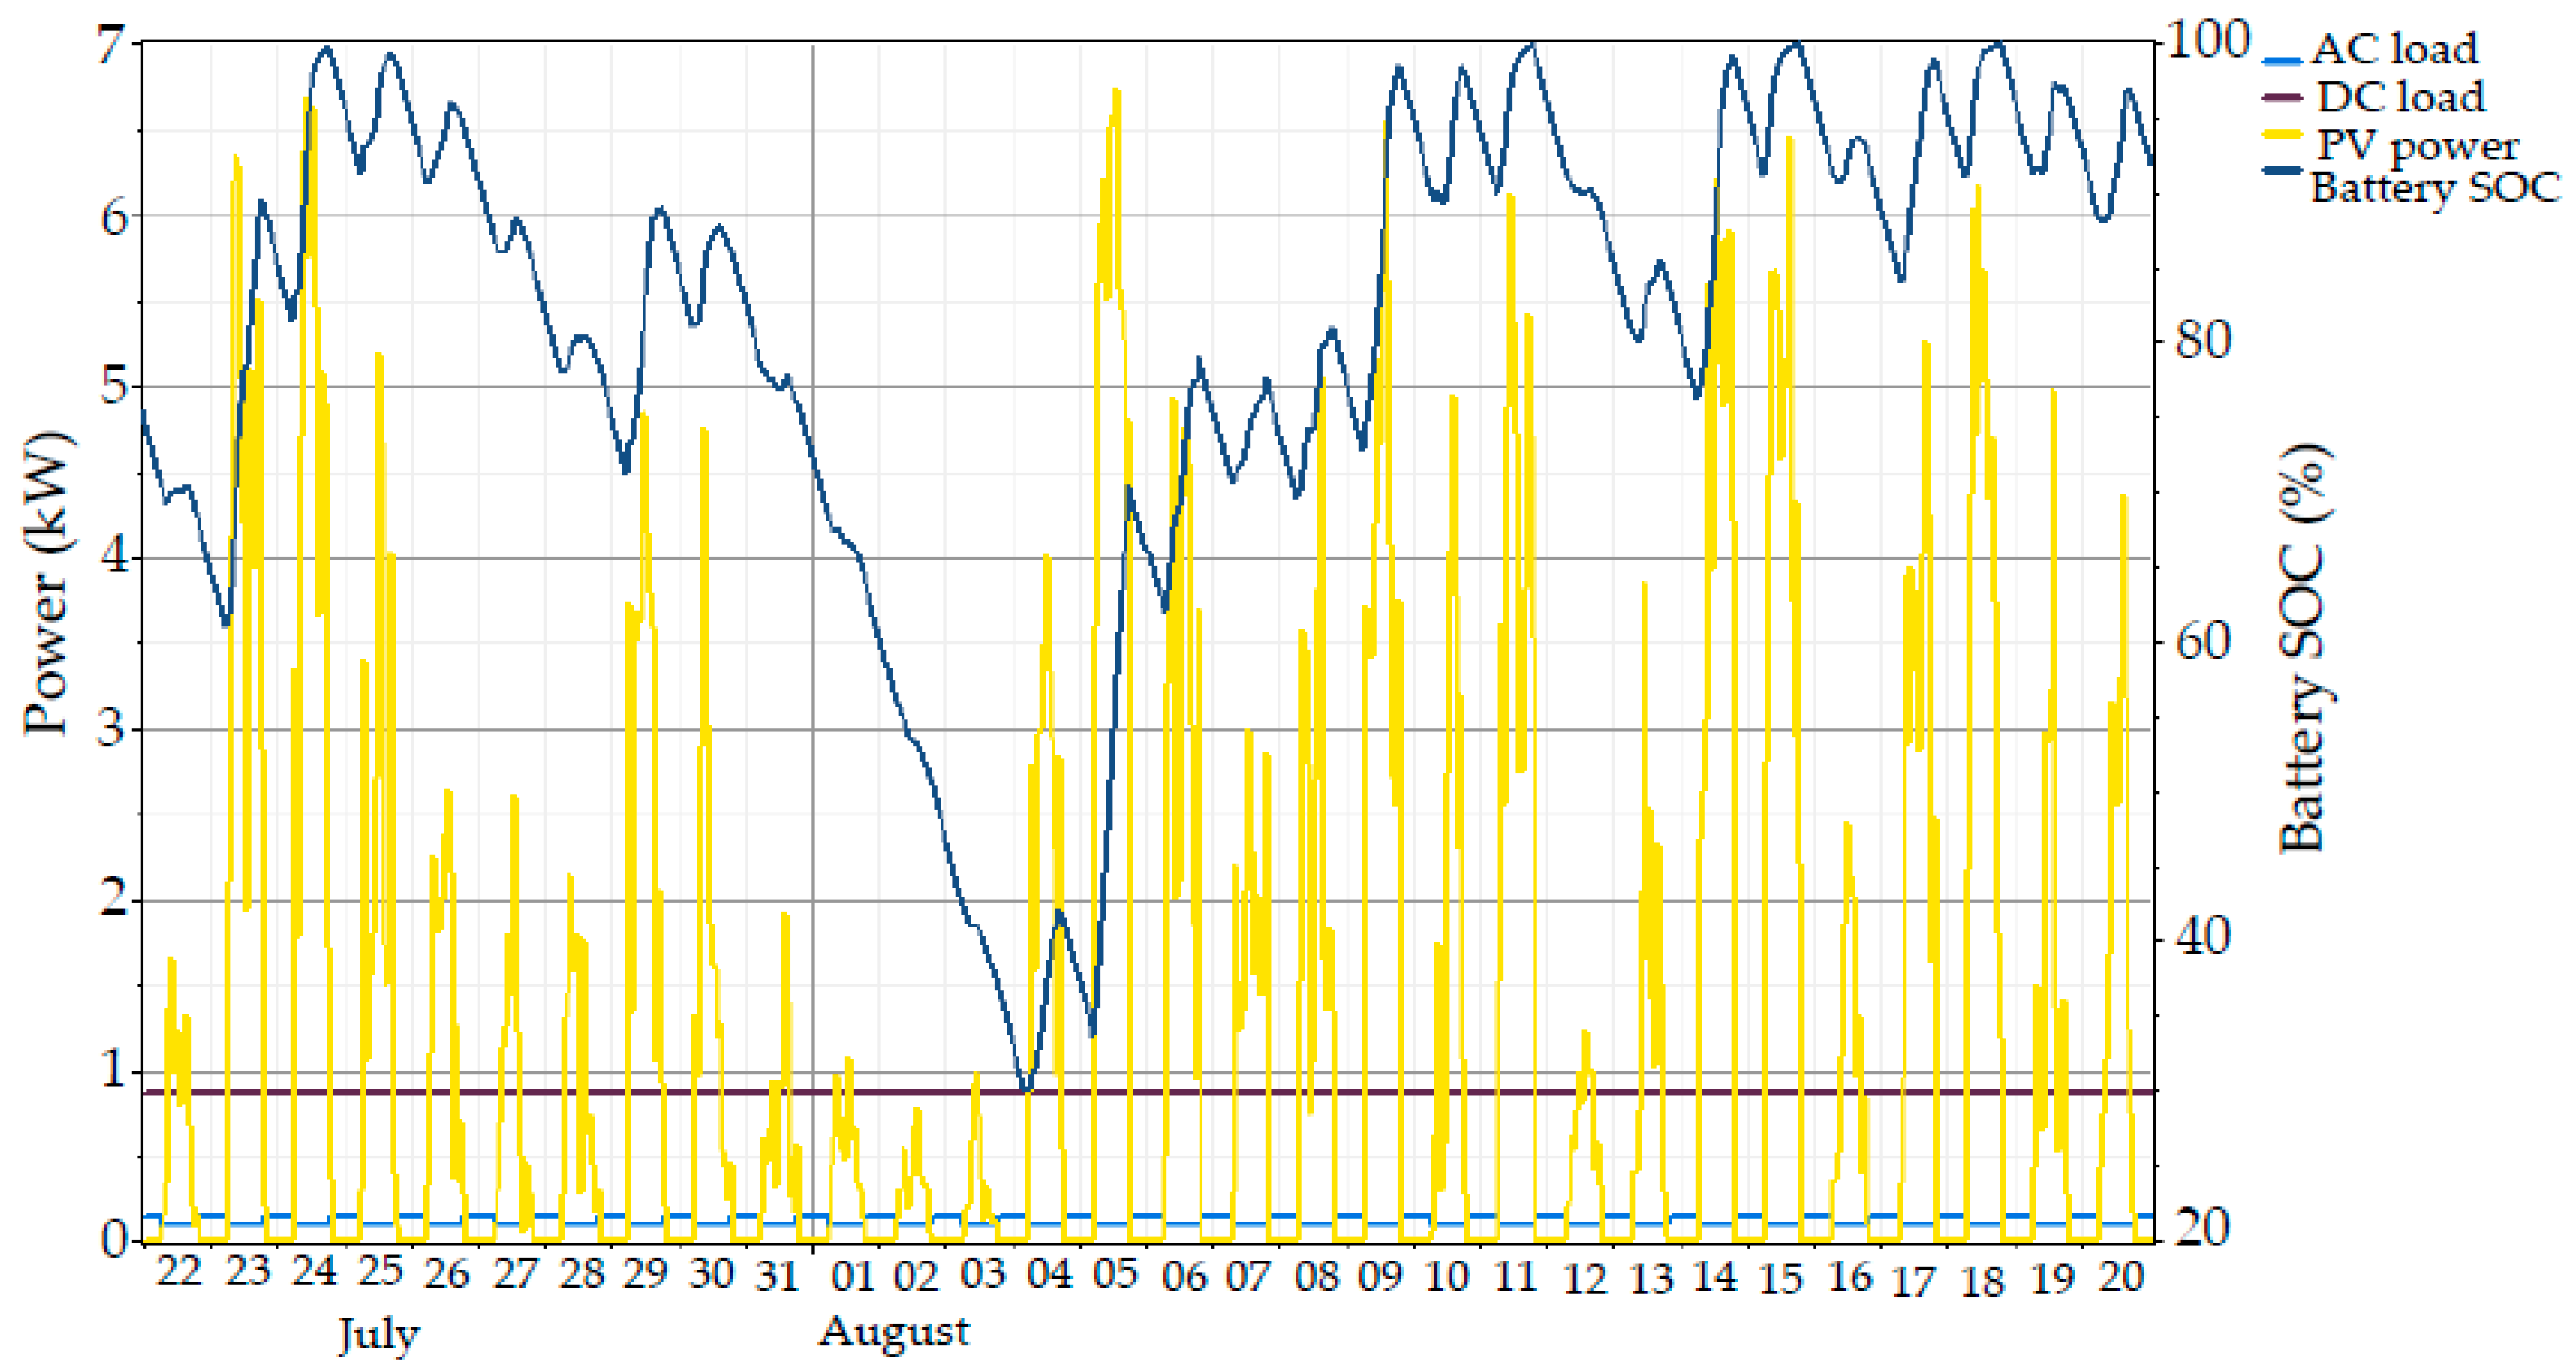
Figure 6.
Optimal battery bank for the solar powered UMTS Node B 2/2/2.
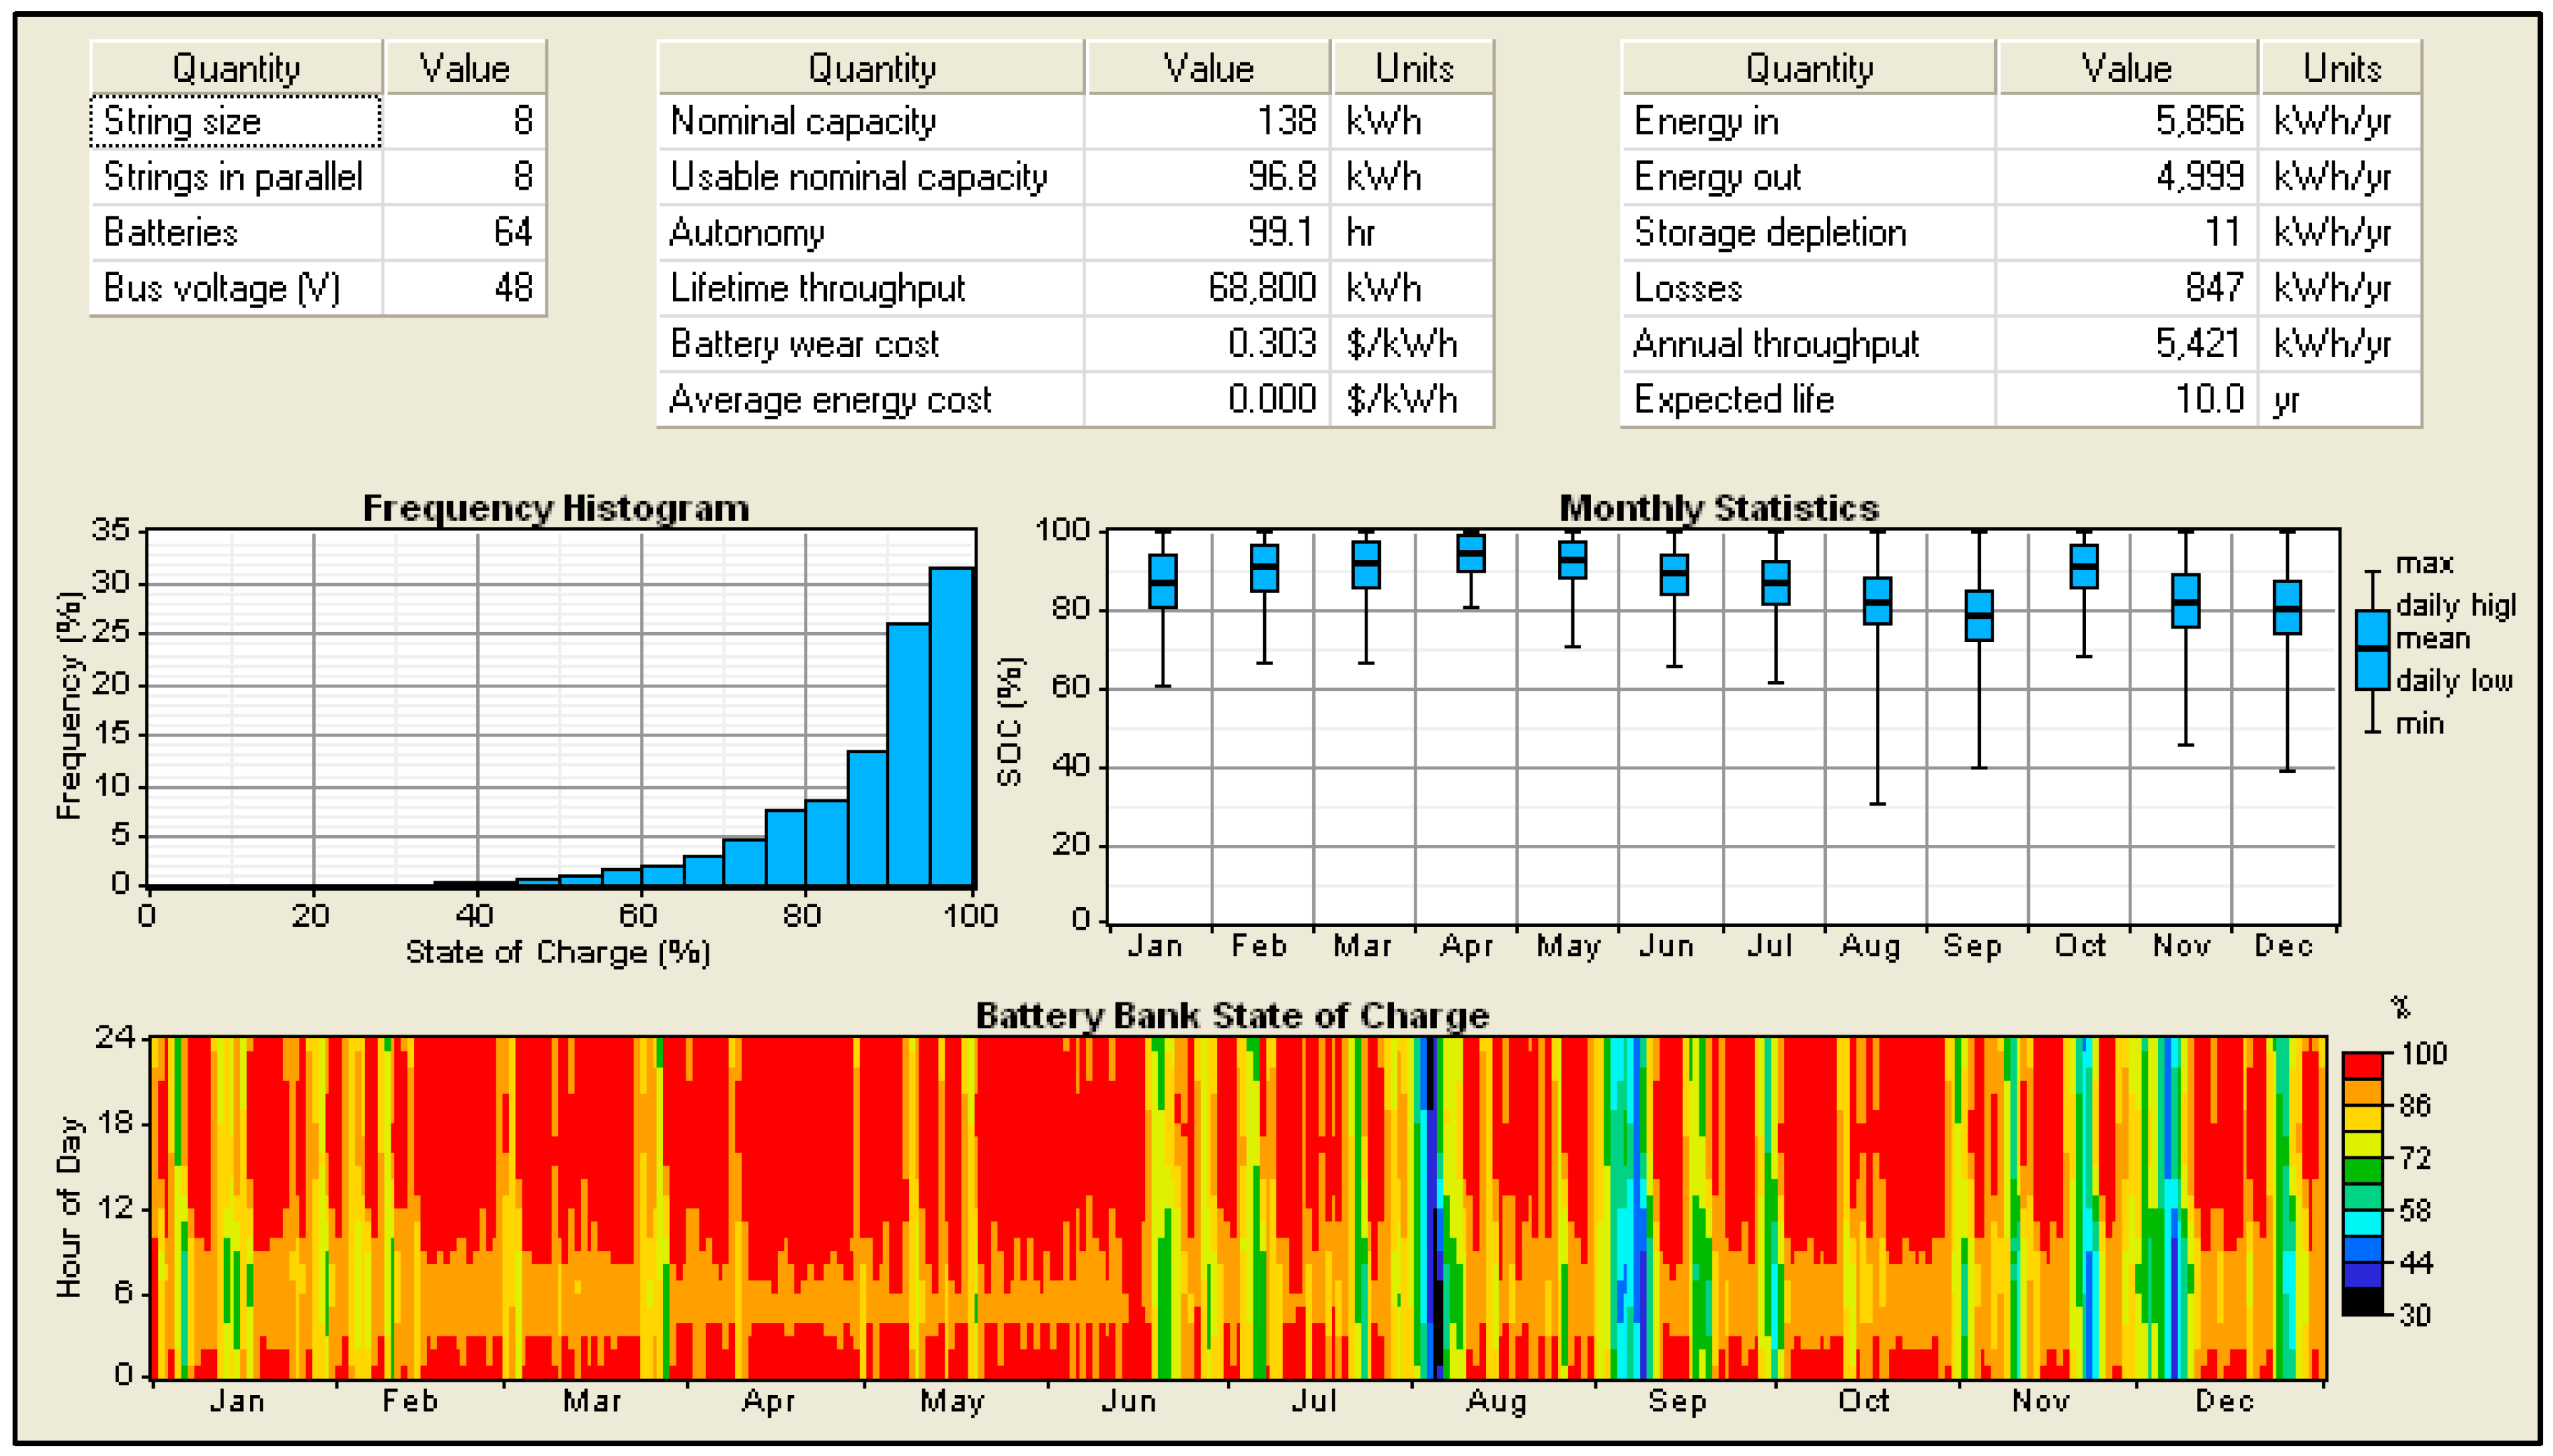
Figure 7.
Average hourly values of the inverter power output over a 12-month period for the solar powered UMTS Node B 2/2/2.
Figure 7.
Average hourly values of the inverter power output over a 12-month period for the solar powered UMTS Node B 2/2/2.
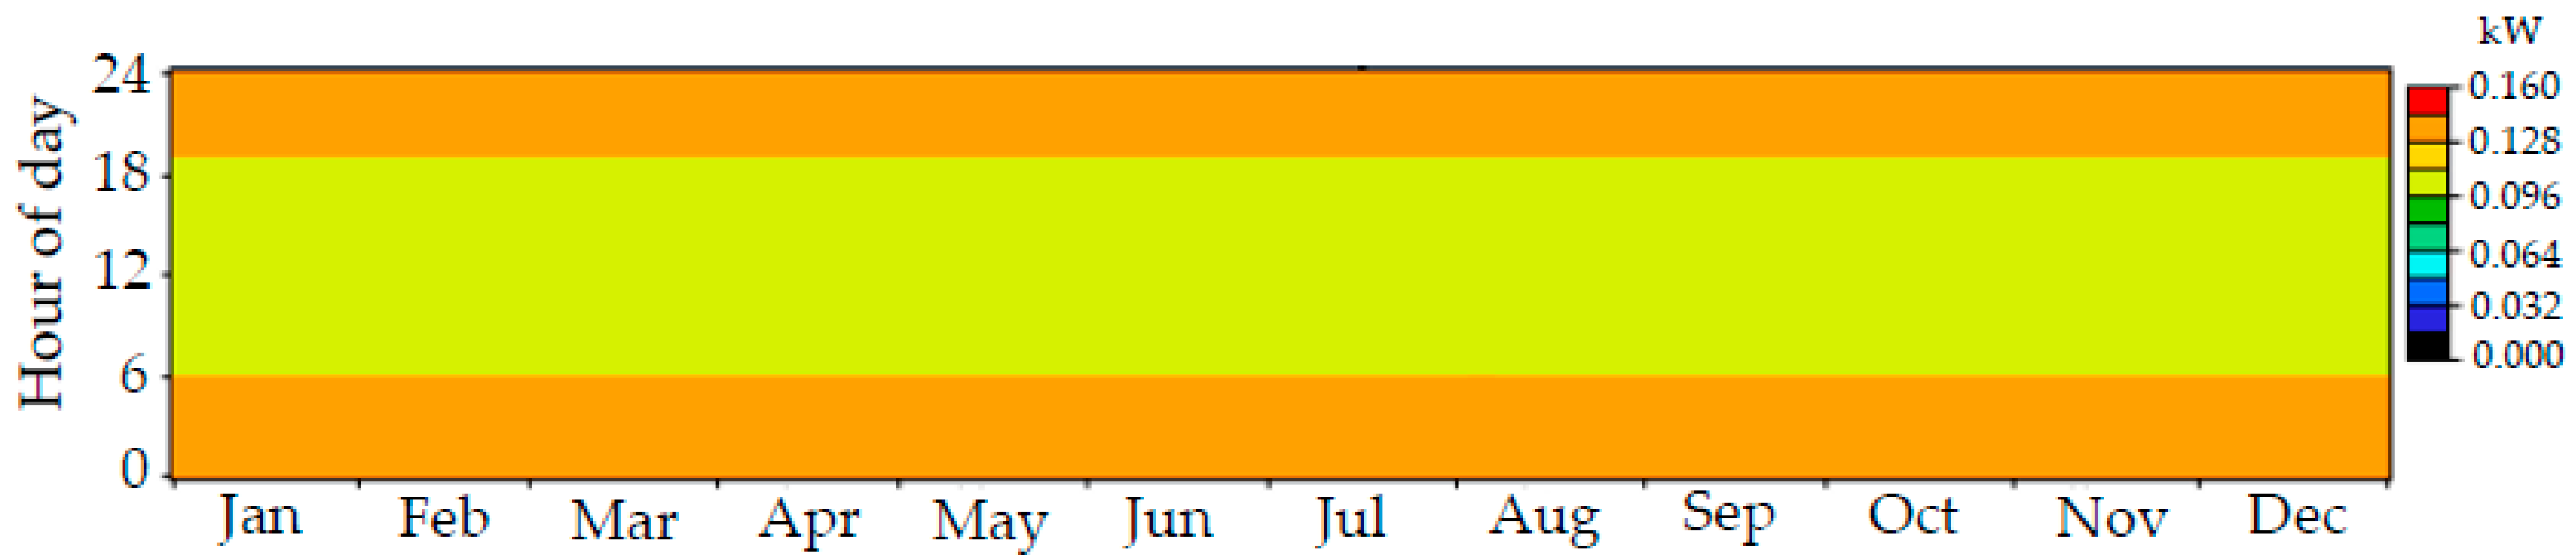
Figure 8.
Cash flow for the solar powered UMTS Node B 2/2/2.

Figure 9.
Average hourly values of the PV array power output and SOC for the solar powered UMTS Node B 4/4/4.
Figure 9.
Average hourly values of the PV array power output and SOC for the solar powered UMTS Node B 4/4/4.
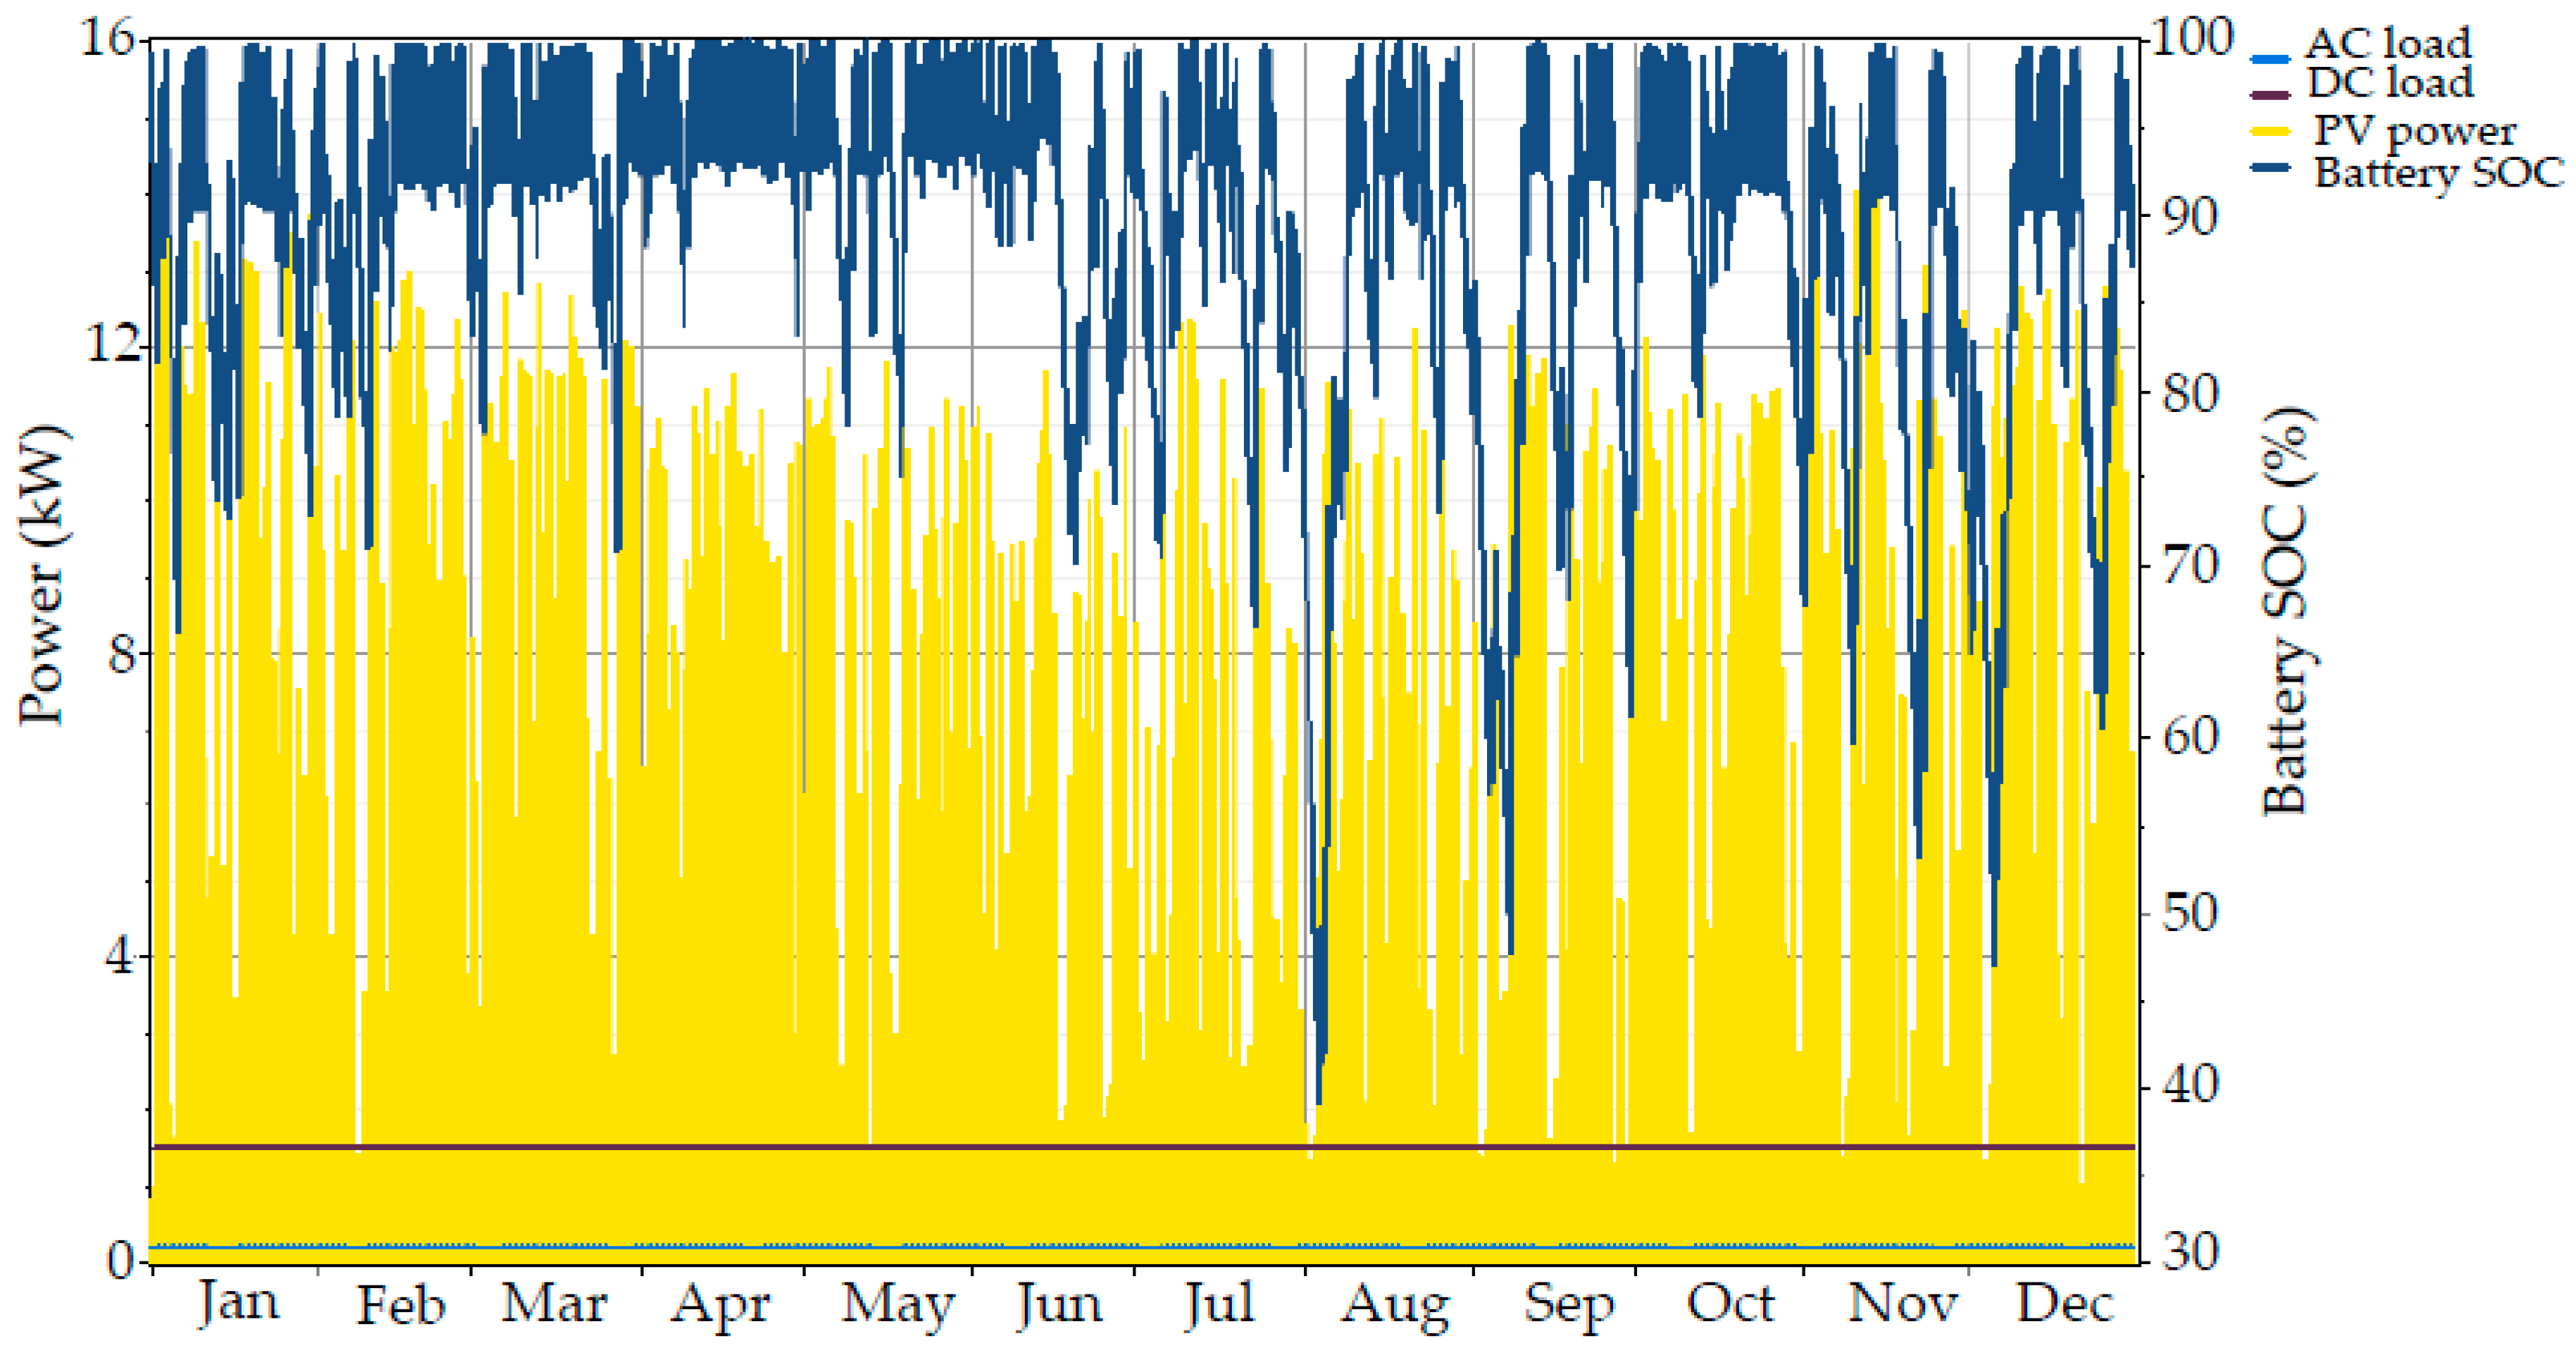
Figure 10.
Optimal battery bank for the solar powered UMTS Node B 4/4/4.
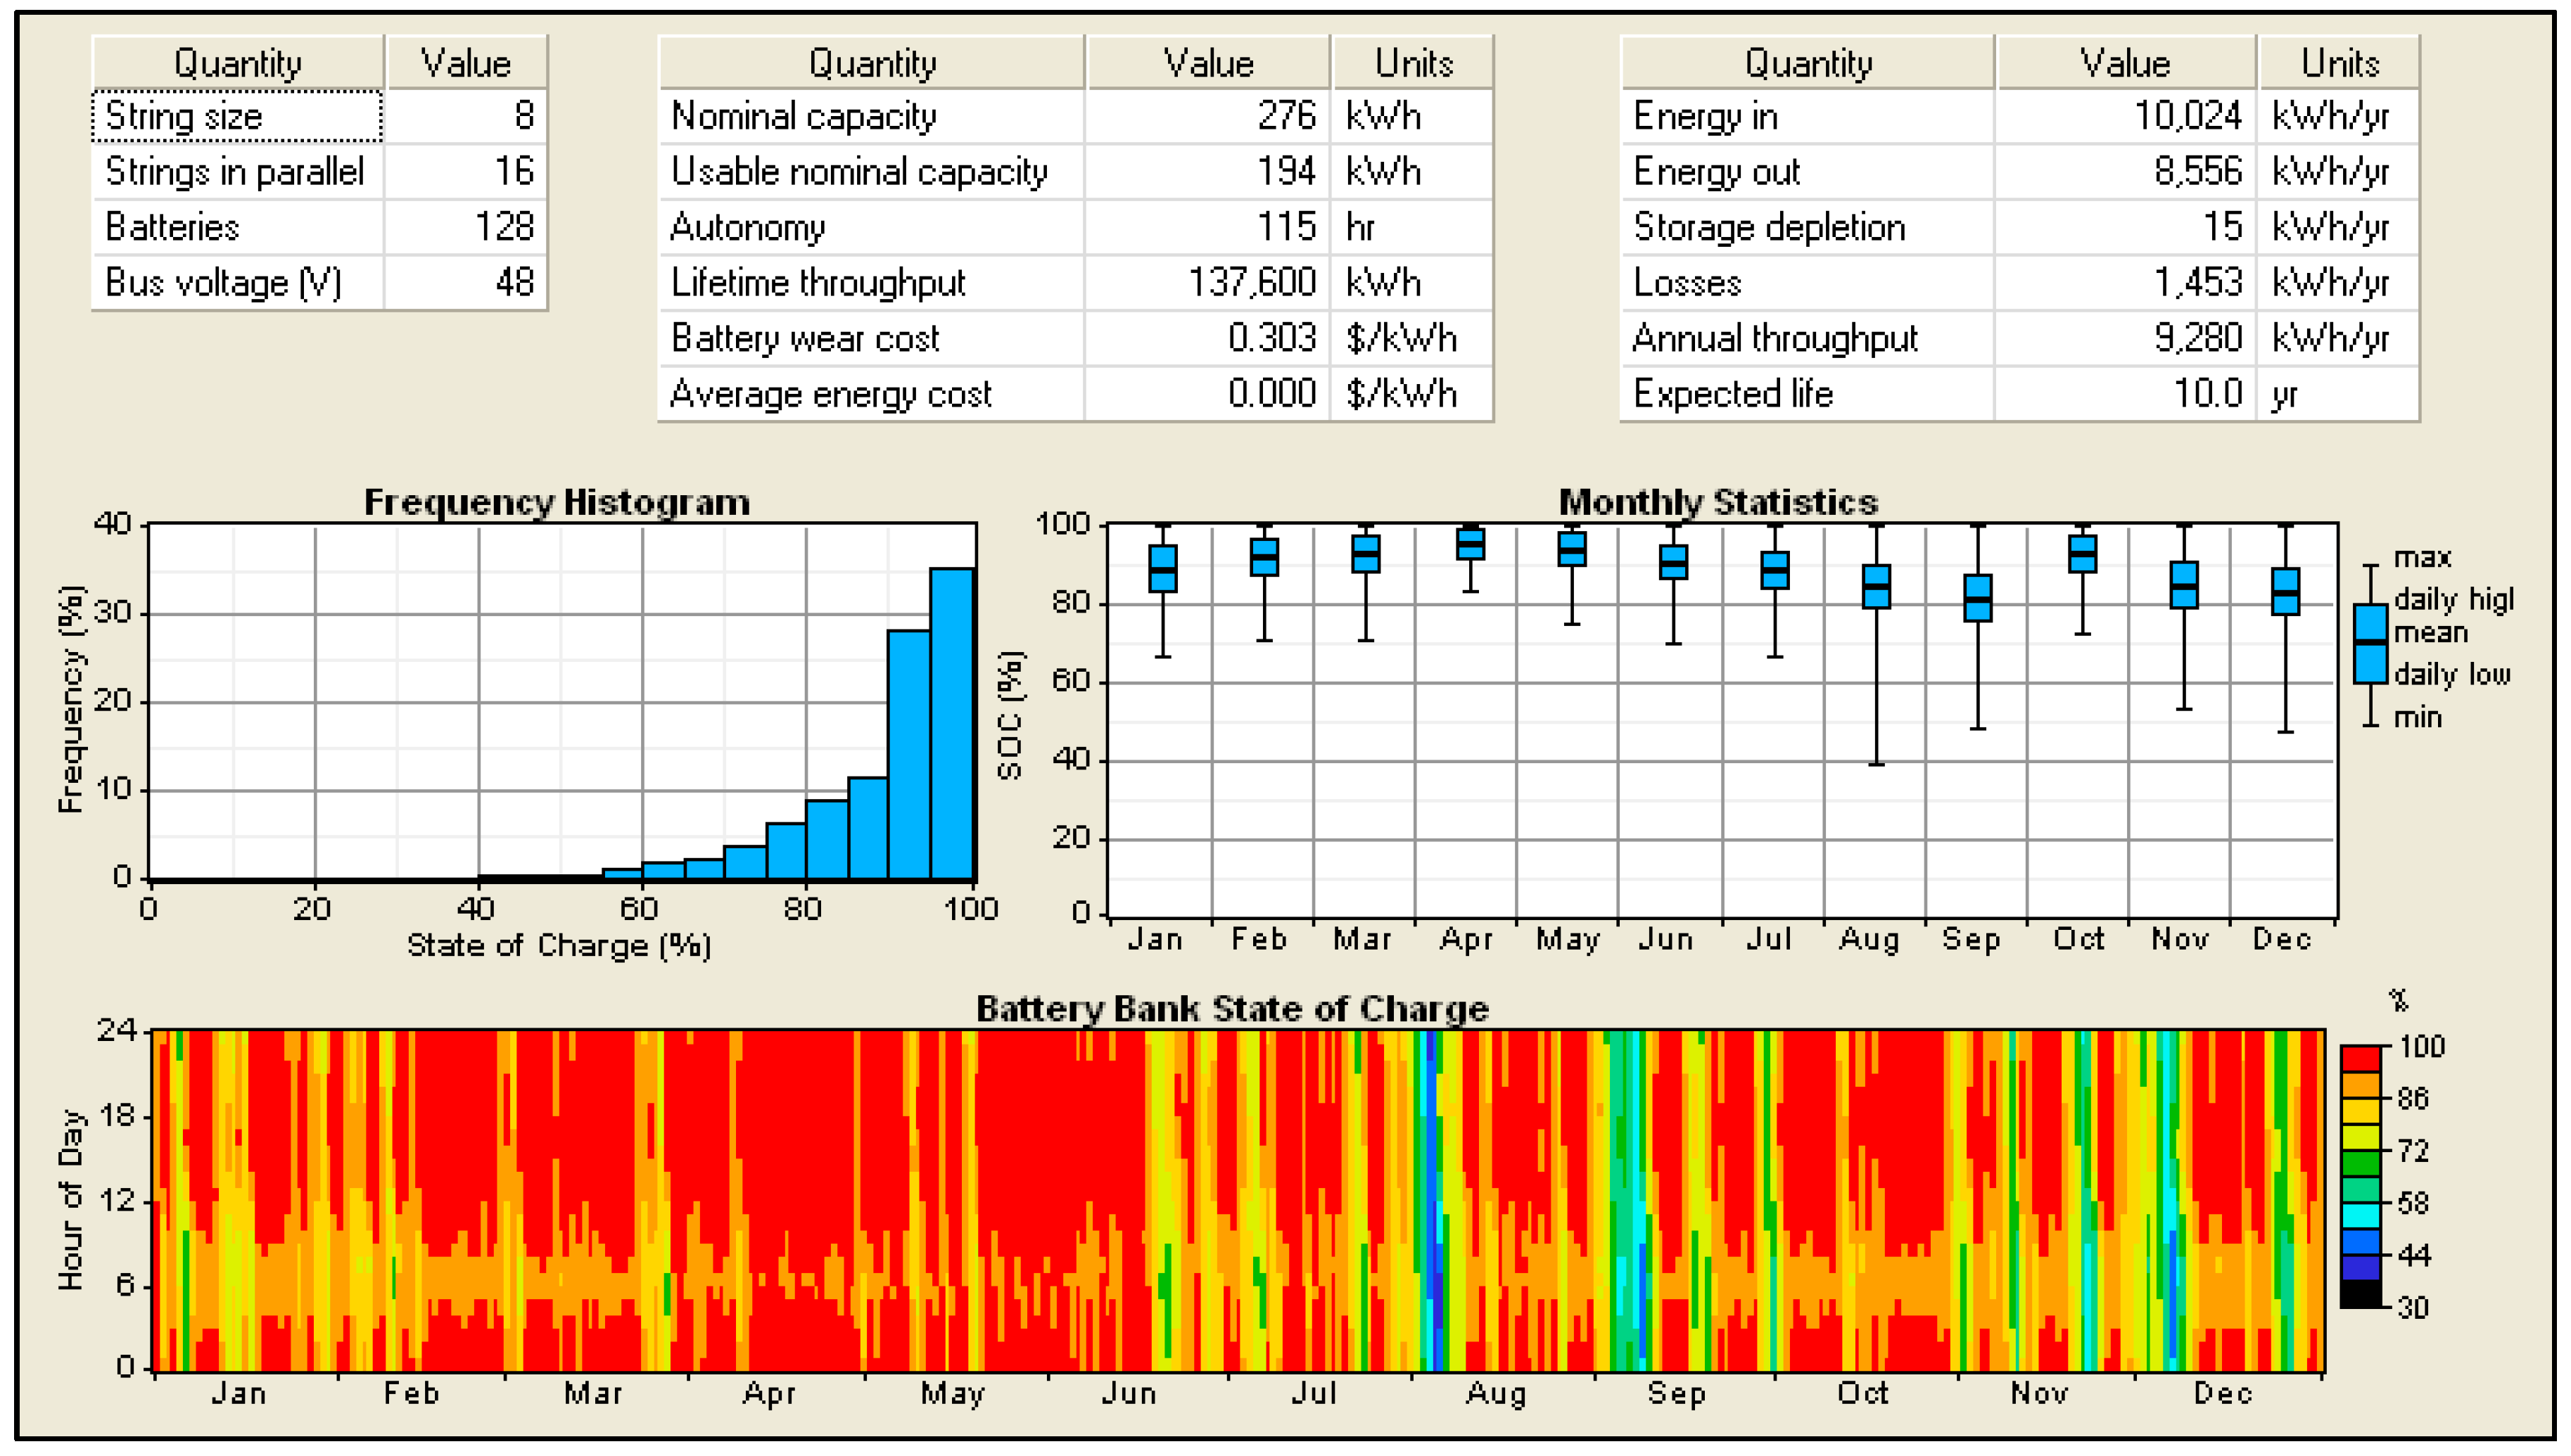
Figure 11.
Average hourly values of the inverter power output over a 12-month period for the solar powered UMTS Node B 4/4/4.
Figure 11.
Average hourly values of the inverter power output over a 12-month period for the solar powered UMTS Node B 4/4/4.
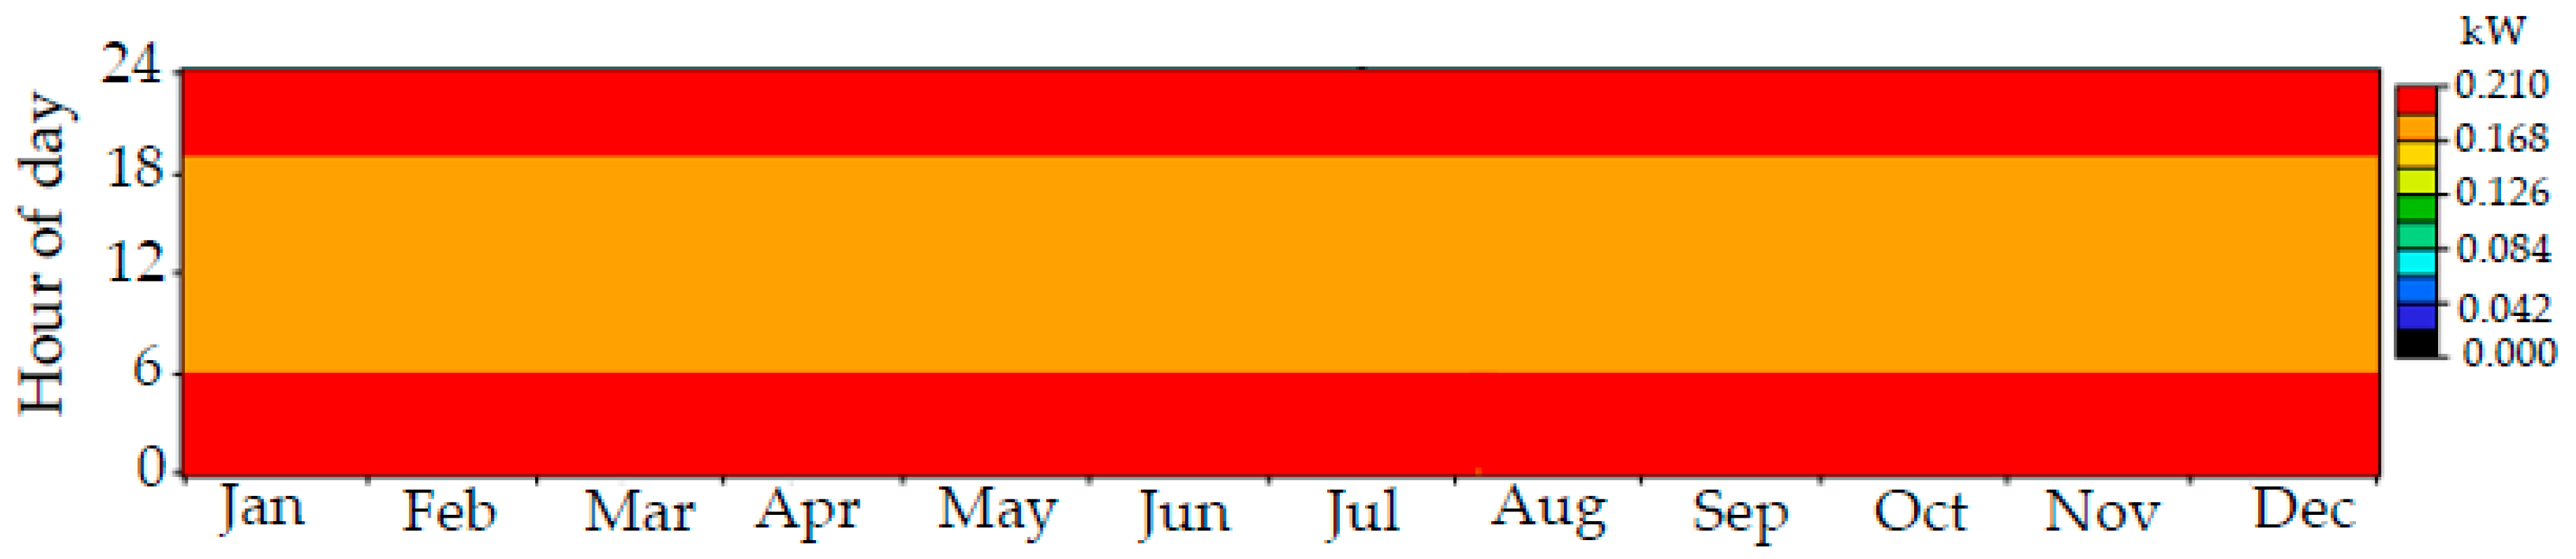
Figure 12.
Cash flow for the solar powered UMTS Node B 4/4/4.

Table 1.
Techno-economic configurations of HOMER.
| Techno-Economic Configurations | |||||
| Component | Capital Cost ($) | Replacement Cost ($) | O&M Cost ($) | Lifetime (Years) | Efficiency (%) |
| PV | 1000 | 1000 | 10 | 25 | Derating factor 85% |
| Battery | 300 | 300 | 10 | 5 | 85% (DOD 70%) |
| Inverter | 400 | 400 | 10 | 15 | 95% |
| Economics and System Control Configurations | |||||
| Economics | System Control | Additional Data | |||
| Annual real interest rate | 1.25% | Operating reserve as % of load | 10% | Load | Node B 2/2/2 1 kW Node B 4/4/4 1.7 kW |
| Project lifetime | 10 years | Annual capacity shortage | 0% | Solar radiation | 4.01 kWh/m2/day |
Table 2.
Optimal system architecture of the solar powered UMTS Node B 2/2/2.
| Component | Optimal Sizing |
|---|---|
| PV (kW) | 7 |
| Battery (Units) | 64 |
| Inverter (kW) | 0.16 |
Table 3.
Optimal system architecture of the solar powered UMTS Node B 4/4/4.
| Component | Optimal Sizing |
|---|---|
| PV (kW) | 11.5 |
| Battery (Units) | 128 |
| Inverter (kW) | 0.23 |
© 2017 by the author. Licensee MDPI, Basel, Switzerland. This article is an open access article distributed under the terms and conditions of the Creative Commons Attribution (CC BY) license (http://creativecommons.org/licenses/by/4.0/).
Share and Cite
MDPI and ACS Style
Alsharif, M.H. A Solar Energy Solution for Sustainable Third Generation Mobile Networks. Energies 2017, 10, 429. https://doi.org/10.3390/en10040429
AMA Style
Alsharif MH. A Solar Energy Solution for Sustainable Third Generation Mobile Networks. Energies. 2017; 10(4):429. https://doi.org/10.3390/en10040429
Chicago/Turabian StyleAlsharif, Mohammed H. 2017. "A Solar Energy Solution for Sustainable Third Generation Mobile Networks" Energies 10, no. 4: 429. https://doi.org/10.3390/en10040429
Note that from the first issue of 2016, this journal uses article numbers instead of page numbers. See further details here.