
An Online SOC and SOH Estimation Model for Lithium-Ion Batteries
by
Shyh-Chin Huang
1,2,*, 
Kuo-Hsin Tseng
1, 
Jin-Wei Liang
1,
Chung-Liang Chang
3 and
Michael G. Pecht
4 
1
Department of Mechanical Engineering, Ming Chi University of Technology, New Taipei City 24301, Taiwan
2
College of Engineering, Chang Gung University, Taoyuan 33302, Taiwan
3
Center for Reliability Engineering, Ming Chi University of Technology, New Taipei City 24301, Taiwan
4
Center for Advanced Life Cycle Engineering, University of Maryland, College Park, MD 20742, USA
*
Author to whom correspondence should be addressed.
Energies 2017, 10(4), 512; https://doi.org/10.3390/en10040512
Submission received: 16 January 2017
/
Revised: 26 March 2017
/
Accepted: 1 April 2017
/
Published: 10 April 2017
Abstract
:The monitoring and prognosis of cell degradation in lithium-ion (Li-ion) batteries are essential for assuring the reliability and safety of electric and hybrid vehicles. This paper aims to develop a reliable and accurate model for online, simultaneous state-of-charge (SOC) and state-of-health (SOH) estimations of Li-ion batteries. Through the analysis of battery cycle-life test data, the instantaneous discharging voltage (V) and its unit time voltage drop, V′, are proposed as the model parameters for the SOC equation. The SOH equation is found to have a linear relationship with 1/V′ times the modification factor, which is a function of SOC. Four batteries are tested in the laboratory, and the data are regressed for the model coefficients. The results show that the model built upon the data from one single cell is able to estimate the SOC and SOH of the three other cells within a 5% error bound. The derived model is also proven to be robust. A random sampling test to simulate the online real-time SOC and SOH estimation proves that this model is accurate and can be potentially used in an electric vehicle battery management system (BMS).
1. Introduction
For the past two decades, global climate change and the greenhouse effect have caused huge impacts on the Earth’s environment, which has motivated and pushed the research and development of energy sources and storage systems worldwide. Among the various energy storage devices, the Li-ion battery has been accepted and widely implemented in electronic products and is considered as the main power source for electric vehicles (EVs). Compared to conventional batteries such as lead-acid and Ni-H batteries, the Li-ion battery is the most attractive energy storage device due to its higher energy density, higher power density, longer cycle life, and lower self-discharge rate [1]. The Li-ion battery is the fastest growing and most widely used battery in consumer low-power products in the field of electronics, such as cell phones and laptops, and in high-power applications such as electric vehicles, trams, bicycles, etc. [2,3].
Although the electrical performance of Li-ion batteries, such as the energy density and c-rate, has improved significantly, the non-uniformity of their capacity and the retention ratio with aging has been a big problem in terms of a battery pack with a large amount of cells in series. A battery management system (BMS) protects the overall system and provides optimal performance management of the energy storage. In addition to on-line monitoring of the terminal voltage of each single cell, a BMS is required to predict and provide each cell’s SOC and SOH, which are the most important indicators for adapting each cell’s optimized loading timely for extending the whole pack life. For example, in EVs applications, the battery SOC can be employed in the figurative sense as a replacement for the fuel gauge used in conventional vehicles. Similarly, the SOH can be likened to the odometer. A BMS with accurate estimation of SOC and SOH can prevent each cell in a battery pack from overcharging or over-discharging, and can extend the whole pack’s life [4,5,6,7,8,9]. Online estimation of a battery’s SOC and SOH is also essential for safe and reliable EVs. However, it is not possible to perform a direct measurement of these states by any electrical gauge. Instead, it is estimated by the measured battery variables, such as the time-varying voltage and the charging/discharging current. There have been various SOC and SOH estimation methods, and each has its own merits and limitations [10,11].
The existing SOC estimation methods are usually divided into three classifications, including data-driven, adaptive, and hybrid methods [12,13]. Data-driven methods can be divided into the direct measurement and the model-based methods. Direct measurement methods include the Coulomb counting method (CCM) [14], open circuit voltage (OCV) method [15,16], and impedance method [17]. The CCM is performed through measuring the discharging current over time and then making an I-t integration to obtain an estimated SOC value [14]. The disadvantages of CCM are that it relies on the accuracy of the current sensor and it can accumulate errors due to its open-loop nature. The OCV method is relatively accurate but needs a sufficient rest time, and it becomes less accurate if a battery has a flat OCV-SOC curve [15]. In the model-based approach, one measures the battery’s online data and applies these signals as model inputs to calculate the SOC (output). Two types of battery models have been widely employed: electrical and electrochemical models. However, all SOC estimation methods based on electrical models have a common disadvantage that the model parameters can only be applied on fresh cells, but are invalid on aged cells.
Adaptive methods provide an improved solution for a battery’s SOC estimation with a non-linear SOC caused by chemical factors [12]. The adaptive approaches consider the self-designing effect and can automatically adapt to discharging conditions. Various new adaptive methods for SOC estimation have been developed, including Kalman filter (KF), fuzzy logic methods, support vector machine (SVM), neural network, etc. The most widely used adaptive filter technique is the KF [18,19]. The application of the KF method on estimations of SOC is proven to be verifiable through the real-time state estimation [20]. Singh et al. developed a fuzzy logic-based SOC estimation method for Li-ion batteries which proved its potential in portable defibrillators [21], in which the AC impedance and voltage recovery measurements were made and used as the input parameters for this fuzzy logic model.
The hybrid models benefit from the advantages of each of the data-driven and adaptive SOC estimation methods and allow a globally optimal estimation performance [11]. A multiscale framework with extended Kalman filter (EKF) was proposed to estimate SOC and capacity [6]. Simulation results with synthetic data based on a valid cell dynamic model suggest that the proposed framework, as a hybrid of CCM and adaptive filtering techniques, achieves higher accuracy and efficiency than the joint/dual EKF.
The SOH of a battery is usually described as the battery performance at the present time compared with the performance at ideal conditions and the battery’s fresh state. The estimation of the battery’s SOH has to take into consideration both the battery capacity fade and the impedance increase. The determination of the SOH can be done by two different approaches including data-driven and adaptive systems. In the data-driven part, with the cycling data and the main parameters affecting the battery lifetime, an estimation of the SOH can be performed. A deep understanding of the correlation between the operation and degradation through physical analysis or the evaluation of large data sets is needed for this approach.
The SOH can be determined by monitoring the internal resistance of a battery [22,23,24]. However, the measurement of real-time battery internal resistance is difficult. Adaptive systems determine the SOH through calculations from parameters that are sensitive to the degradation of the battery. These parameter data must be measurable or should be examined throughout the operation of the battery. There are several ways the SOH can be estimated, e.g., KF, EKF [16,17,18], genetic algorithm (GA) [25], particle filter [26], fuzzy logic [21], artificial neural networks (ANNs) [27], and the least-squares method (LSM) [28]. The EKF method is easy to implement and commonly used in battery prognosis. He et al. [17] proposed an electromotive force (EMF) method combined with recursive least-squares (RLS) for online estimation of OCV and SOC of Li-ion batteries. Nuhic et al. [29] used SVM to estimate the SOH by using load collectives as the training and test data. Chen et al. [25] used GA to estimate the battery model parameters, including the diffusion capacitance in real time, and then determined the battery SOH using the identified diffusion capacitance. However, adaptive systems also operate with the drawback of having a high computational load, which complicates the online running of the model on a real application [30].
Capacity decrease and power fading do not originate from one single cause. Most of these processes cannot be studied independently. Because a battery’s maximum capacity decreases with age, accurate SOC estimation relies on a battery degradation model. Similarly, an inaccurate SOC estimation may mislead a battery’s SOH calibration. Simultaneous estimation of SOC and SOH appears to be necessary and beneficial for battery management systems [10,31,32]. Kim and Cho [18] proposed a method based on EKF to identify suitable SOC and SOH model parameters for Li-ion batteries. Hung et al. [31] proposed a dynamic impedance method to estimate the SOC and a projection method to estimate the SOH of Li-ion batteries. The dynamic impedance is defined as the changes in voltage over the changes in current during charging/discharging. The rate of change in dynamic impedance with respect to SOC was then projected to determine SOH. Experimental data verified that the SOC estimations were bounded within a 5% error but the detail of SOH accuracy was not described in that paper.
The capacity quantifies the available energy stored in a battery. After continuous operation, the active materials in both the cathode and anode are reduced or blocked, which leads to the battery capacity decline. The laboratory measurements and off-line analysis are essential to evaluate the effect of capacity fading [33,34]. The most common method of determining the degree of battery aging is based on the OCV–SOC curve [34]. However, it requires fully charging or discharging the battery at a low rate (e.g., 1/25 C). These methods need time-consuming tests so they cannot meet the online real-time requirements for BMSs. An alternative approach to estimate capacity loss is the so-called incremental capacity analysis (ICA). The concept of ICA originates from the study of the lithium intercalation process [35,36]. ICA is more sensitive to gradual change with battery aging compared to those methods based on conventional charging or discharging curves [37,38]. ICA was shown to be an effective tool for analyzing battery capacity fading. Wang et al. proved that their incremental capacity analysis with the SVM model can reduce the computation load, and the model built from one single cell was able to predict the SOH of the other cells within a 1% error bound [38]. However, this methodology still needs to collect a wide range of charging data typically from 3 to 3.6 V during a charging process.
To overcome these issues described above, this paper defines a new variable V′, which is the unit time voltage drop in the discharging process due to its timely responsive and on-line measureable features, and proposes a novel model that employs V and 1/V′ as the main variables. The SOC is expressed as a linear relation of the two variables with three undetermined coefficients. Data regression from test cells yielded the values of the coefficients. The SOH was found to be linear with 1/V′ by a modification factor that is a function of the SOC. The derived model, which can simultaneously estimate the battery’s instantaneous SOC and SOH, is promising for online real-time applications. The robustness of the model is checked as well. Most important is that it was demonstrated that this model, which was fitted by the data from one battery of a batch, can be applied to the other batteries of the same batch without any need of sophisticated model-updating algorithms, such as EKF or SVM. Random samplings from the tested data to simulate the online SOC and SOH estimations are performed, and satisfactory results are obtained.
2. Experimental Data Analysis
Four lithium cobalt oxide (LiCoO2) batteries (numbered A–D) of nominal capacity 1.10 Ah were tested at 25 °C. The charging process follows the standard CCCV protocol, i.e., constant current (CC) at 0.5 C until the voltage reaches its designated value of 4.2 V, then constant voltage (CV) charging takes over until the current falls below 50 mA. The discharging current is kept at a 1 C rate and terminated at a cut-off voltage of 2.7 V. The voltages of the tested cells were logged at 30-s intervals. The battery’s latest maximum capacity, denoted Qm, was evaluated by CCM at the end of every discharging process. With the evaluated Qm, the SOC at any previous time instant was calculated backwards. SOH was evaluated by dividing the latest Qm by the nominal one (Qnom) at the end of every discharging cycle.
Figure 1 illustrates the typical curve of voltage versus capacity for the tested cell A at certain test cycles. The left-shifting of the discharging curves implies the capacity fade and is an indicator of the battery’s health (SOH). The voltage declining with the discharging time can be used as an indicator for the battery SOC. Nonetheless, every instantaneous voltage could reflect multiple SOC values unless the cycle number N is known. The present research is aimed at a battery’s online real-time SOC and SOH estimation model without fully conducting a charging/discharge cycle, i.e., without N as a parameter. It is necessary to look for extra parameters for SOC and SOH modeling in addition to instantaneous voltage. Therefore, a new variable, V′, which is the unit time voltage drop in the discharging process, was defined and used to derive the model for SOC and SOH prediction.
2.1. Battery States
The definitions of SOC, SOH, and some terminologies are briefly described as follows:
is defined as the ratio of the remaining capacity over the maximum capacity, and SOC can provide a timely charge warning. Figure 1 shows that a battery’s Qm gradually decreases with battery aging. According to the degradation of Qm, SOH is defined as:
A battery’s SOH normally ranges within 0–100%, but when it is new, the SOH can be slightly larger than 100% due to product variations. The end of life of a Li-ion battery is commonly defined by the maximum cycles when the SOH drops to 80%. SOH is a key indicator of safe operation because it provides a timely warning that replacement is required.
2.2. New Parameter for SOC and SOH Model
OCV has been proven as a proper indicator for SOC and SOH evaluation, but the measurement of OCV requires a long relaxation time to reach a steady state under thermodynamic equilibrium, which is called EMF and is more suitable for off-line evaluation. Our previous study [39] adopted the fully discharged voltage as a replacement for OCV, and combined it with the resistance for the SOH model construction. That model predicted a battery’s remaining useful life (RUL) within reasonable accuracy, but the voltage and resistance at a fully discharged state are apparently inappropriate aging parameters for an on-line, real-time model. The present study is intended to develop a suitable model for the real-time, on-line monitoring of a battery in use, and thus any parameter associated with the fully discharged state is hazardous and should be avoided. The most convenient and direct outputs from a battery in use are voltage, current, and time. A single voltage value, as shown in Figure 1, is never enough to identify a battery’s SOC because the voltage shifts with battery aging. Therefore, this paper proposes a new parameter called the unit time voltage drop, V′ for SOC and SOH modeling, i.e.,
Note that in Equation (3), ΔV is the voltage drop in the discharging process, i.e., ΔV = V1 − V2.
2.3. SOC and SOH Regression Model
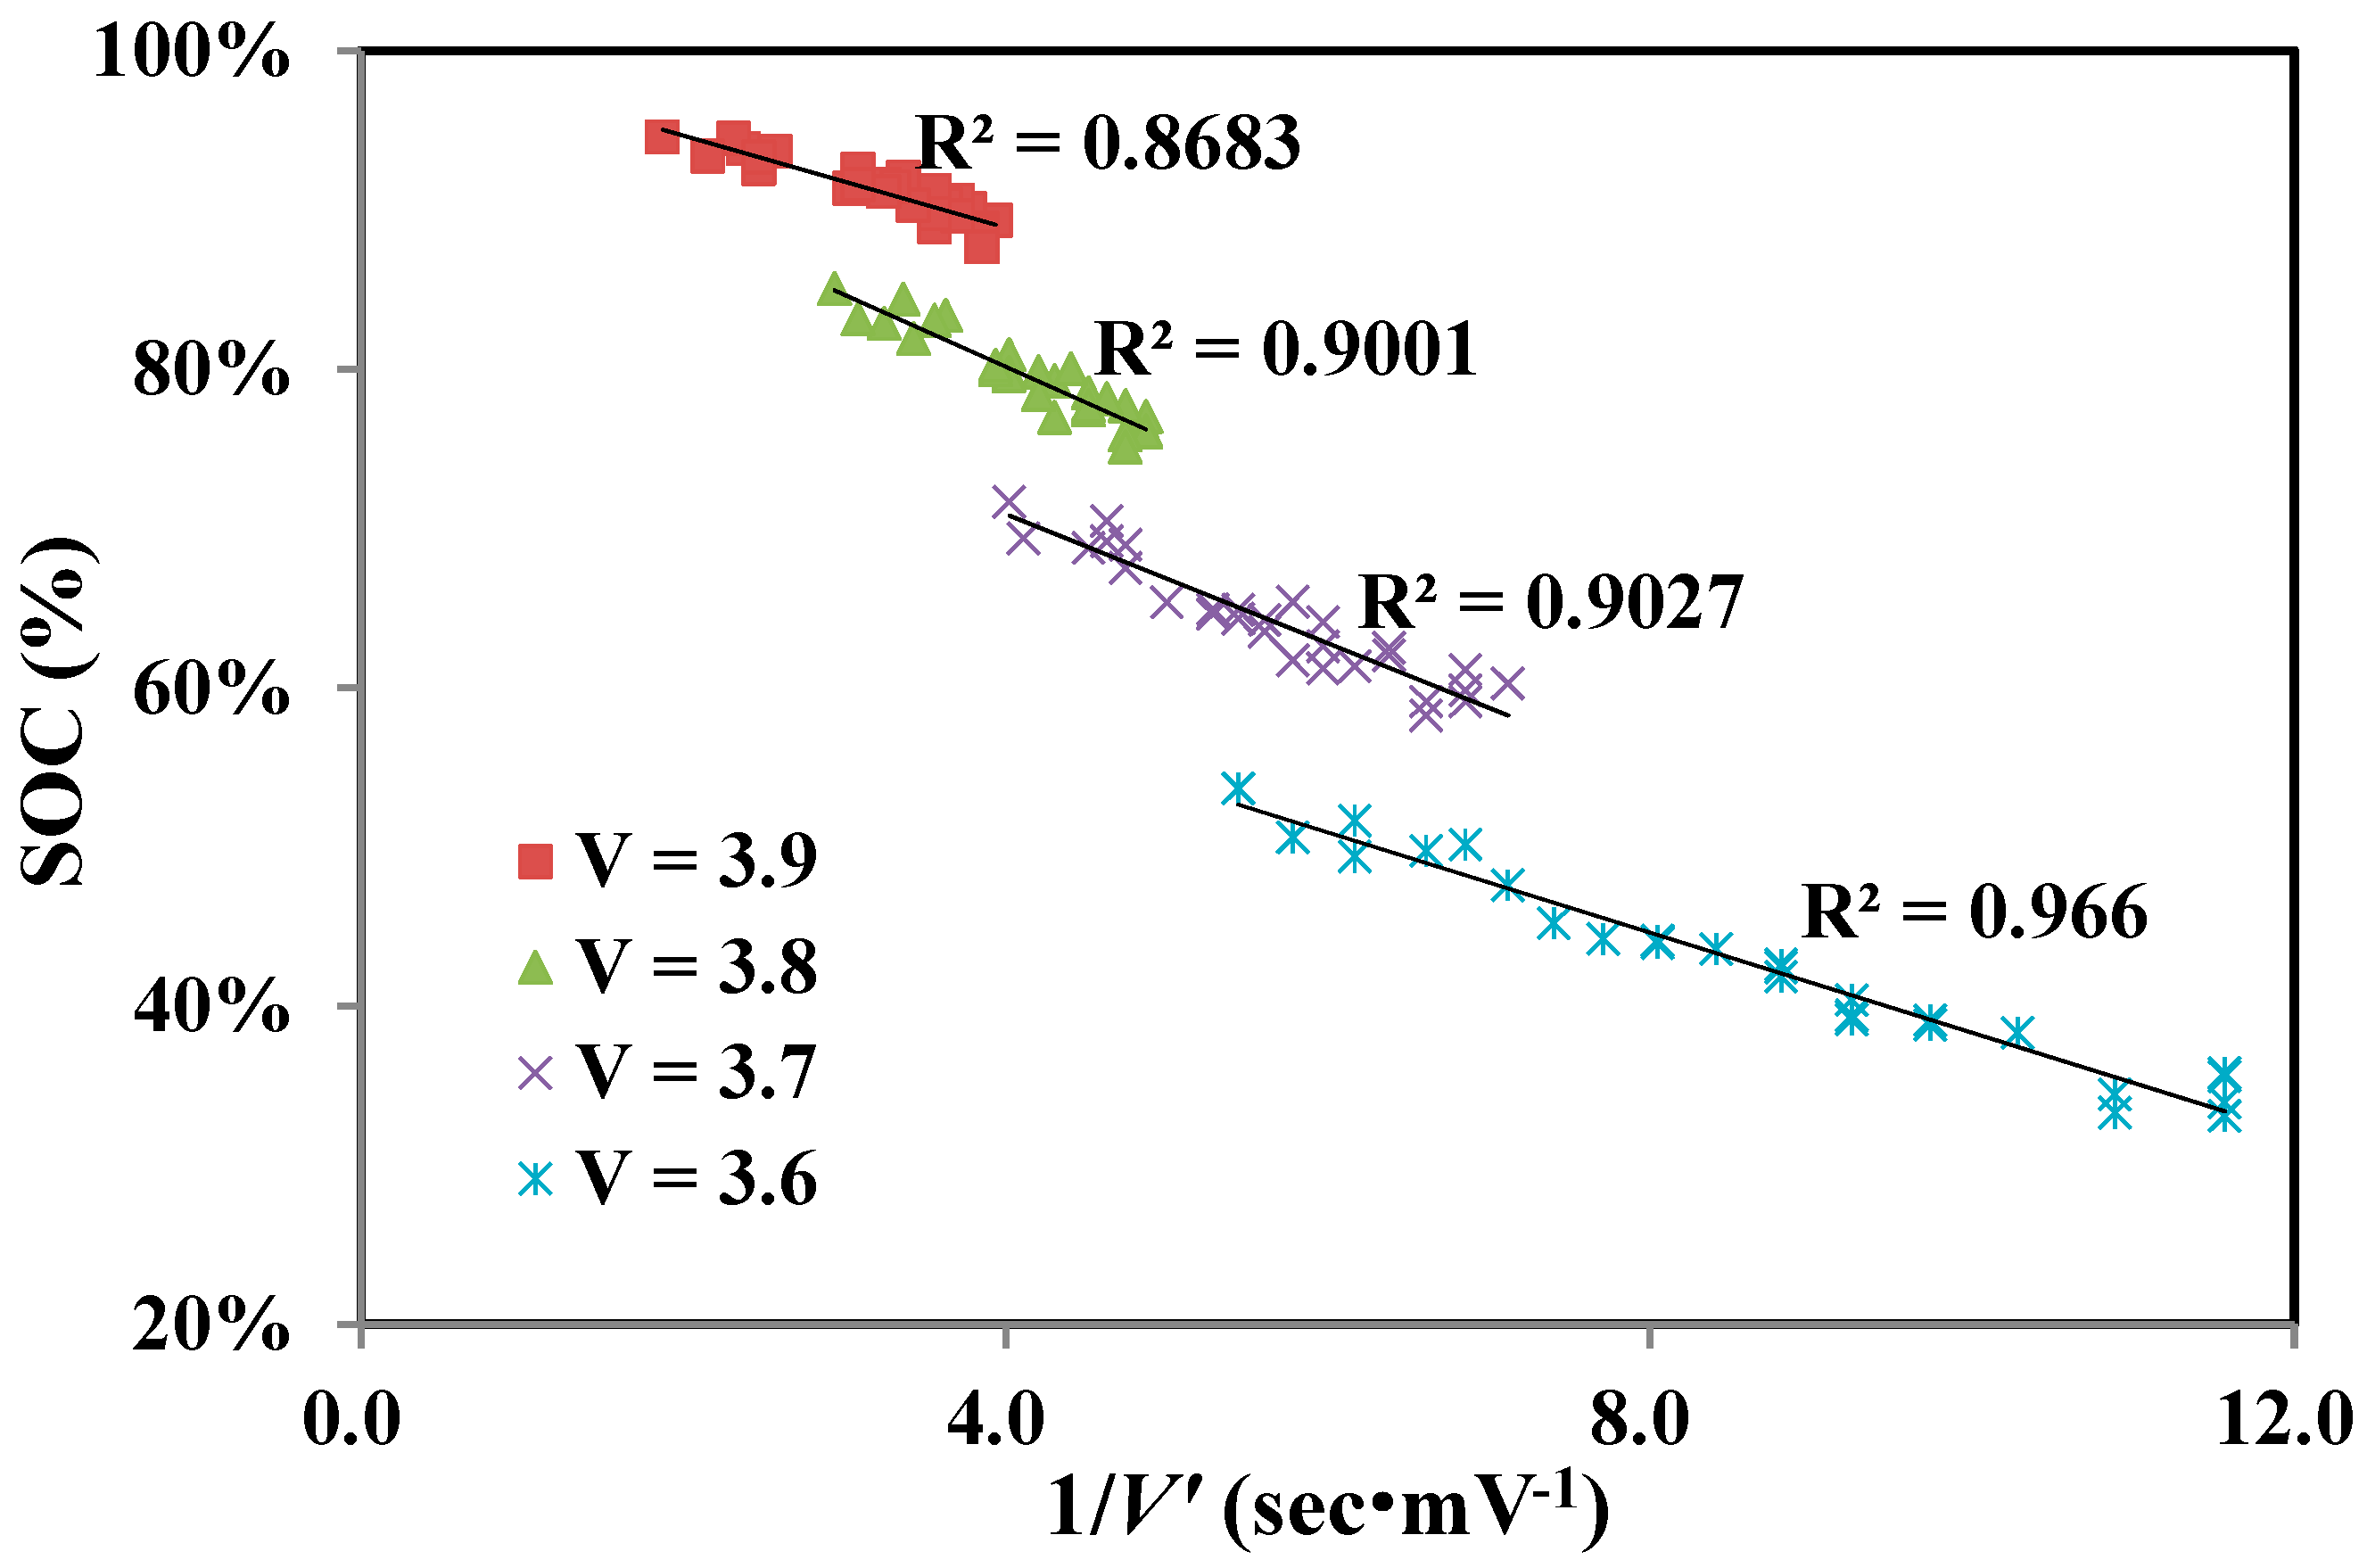
The correlation of SOC with V and V′ is first checked from the test data so as to judge its appropriateness for model construction. The average correlation of SOC vs. V is 0.988, and that of SOC vs. 1/V′ is 0.984. The relations of SOC vs. V and 1/V′ are also found to be approximately linear. As depicted previously, both variables of V and 1/V′ are needed to estimate the SOC because there are multiple SOCs for a given V or a given V′. Figure 2 illustrates the correlations of SOC vs. 1/V′ at different fixed voltages, and the values appear high enough except for V = 3.9. Figure 2 also shows that when modeling by employing both parameters V and 1/V′, only a single correspondent SOC is obtained for a specific V′ under a given voltage, V.
To further explore the physical meaning of the parameter V′, we tried to correlate V′ to the internal resistance of the battery by the following equation
If the change of Veq in a short discharge time duration is negligible, it can be assumed that ΔV is approximate to Δη.
where η is the overpotential which includes two parts, the reversible and the irreversible, representing the degree of deviation from the equilibrium voltage, Veq (the value of Voc).
V(terminal) = Veq + η
ΔV(terminal) ≈ Δη
If Equation (6) is divided by the current I, it can be rewritten as:
where R is the equivalent resistance of the battery and V′ is proportional to ΔR under a short discharge time duration and a discharging current I. That means for a given V and fixed Δt, a lower V′ has a lower ΔR. V′ is related to the increasing rate of internal resistance caused by battery discharging and aging. Therefore, for a given cell voltage, V′ is sensitive to battery aging and changes with different charge-discharge cycles. Equation (9) uses V′ to correlate SOC with battery aging so that the cycle number N can be removed. Accordingly, the SOC equation is assumed to be
where a, b, and c are undetermined coefficients to be fitted from test data regression.
Accurate SOC estimation relies on the precise evaluation of Qm, which diminishes with battery age. Provided Qm is not instantly updated, the estimated SOC would misguide the BMS operation. Therefore, SOC cannot be separately evaluated without considering SOH at the same time. Fortunately, it was seen that the battery’s aging information is, in fact, imbedded in the new parameter V′. To see how the newly defined parameter V′ related to SOH, their correlations at several SOC levels are illustrated in Figure 3. The results show a surprisingly good correlation (>0.99) for all fixed SOCs ranging from 40% to 90%. Figure 3 also shows that SOH-(1/V′) has an approximately linear relationship for all different SOC levels. Therefore, the SOH regression model for a specific SOC level can be assumed to be
Similarly, A and B are regression coefficients to be determined. Take SOC = 70% as a typical example and solve for the coefficients A = 0.5192 and B = 0.0405 from cell A’s test data. Substitute Equation (10) for the estimated SOH vs. N, and compare it against the real values in Figure 4. The coefficient of determination (R2) is as high as 0.9907. This result enhances the adequacy of the SOH model, shown by Equation (10). Nonetheless, this is valid only for the case of SOC = 70%, and new coefficients for A and B need to be derived if SOC is other than 70%. It is impractical to have numerous sets of coefficients for different SOC levels. Therefore, an alternative approach to account for SOC variation is necessary.
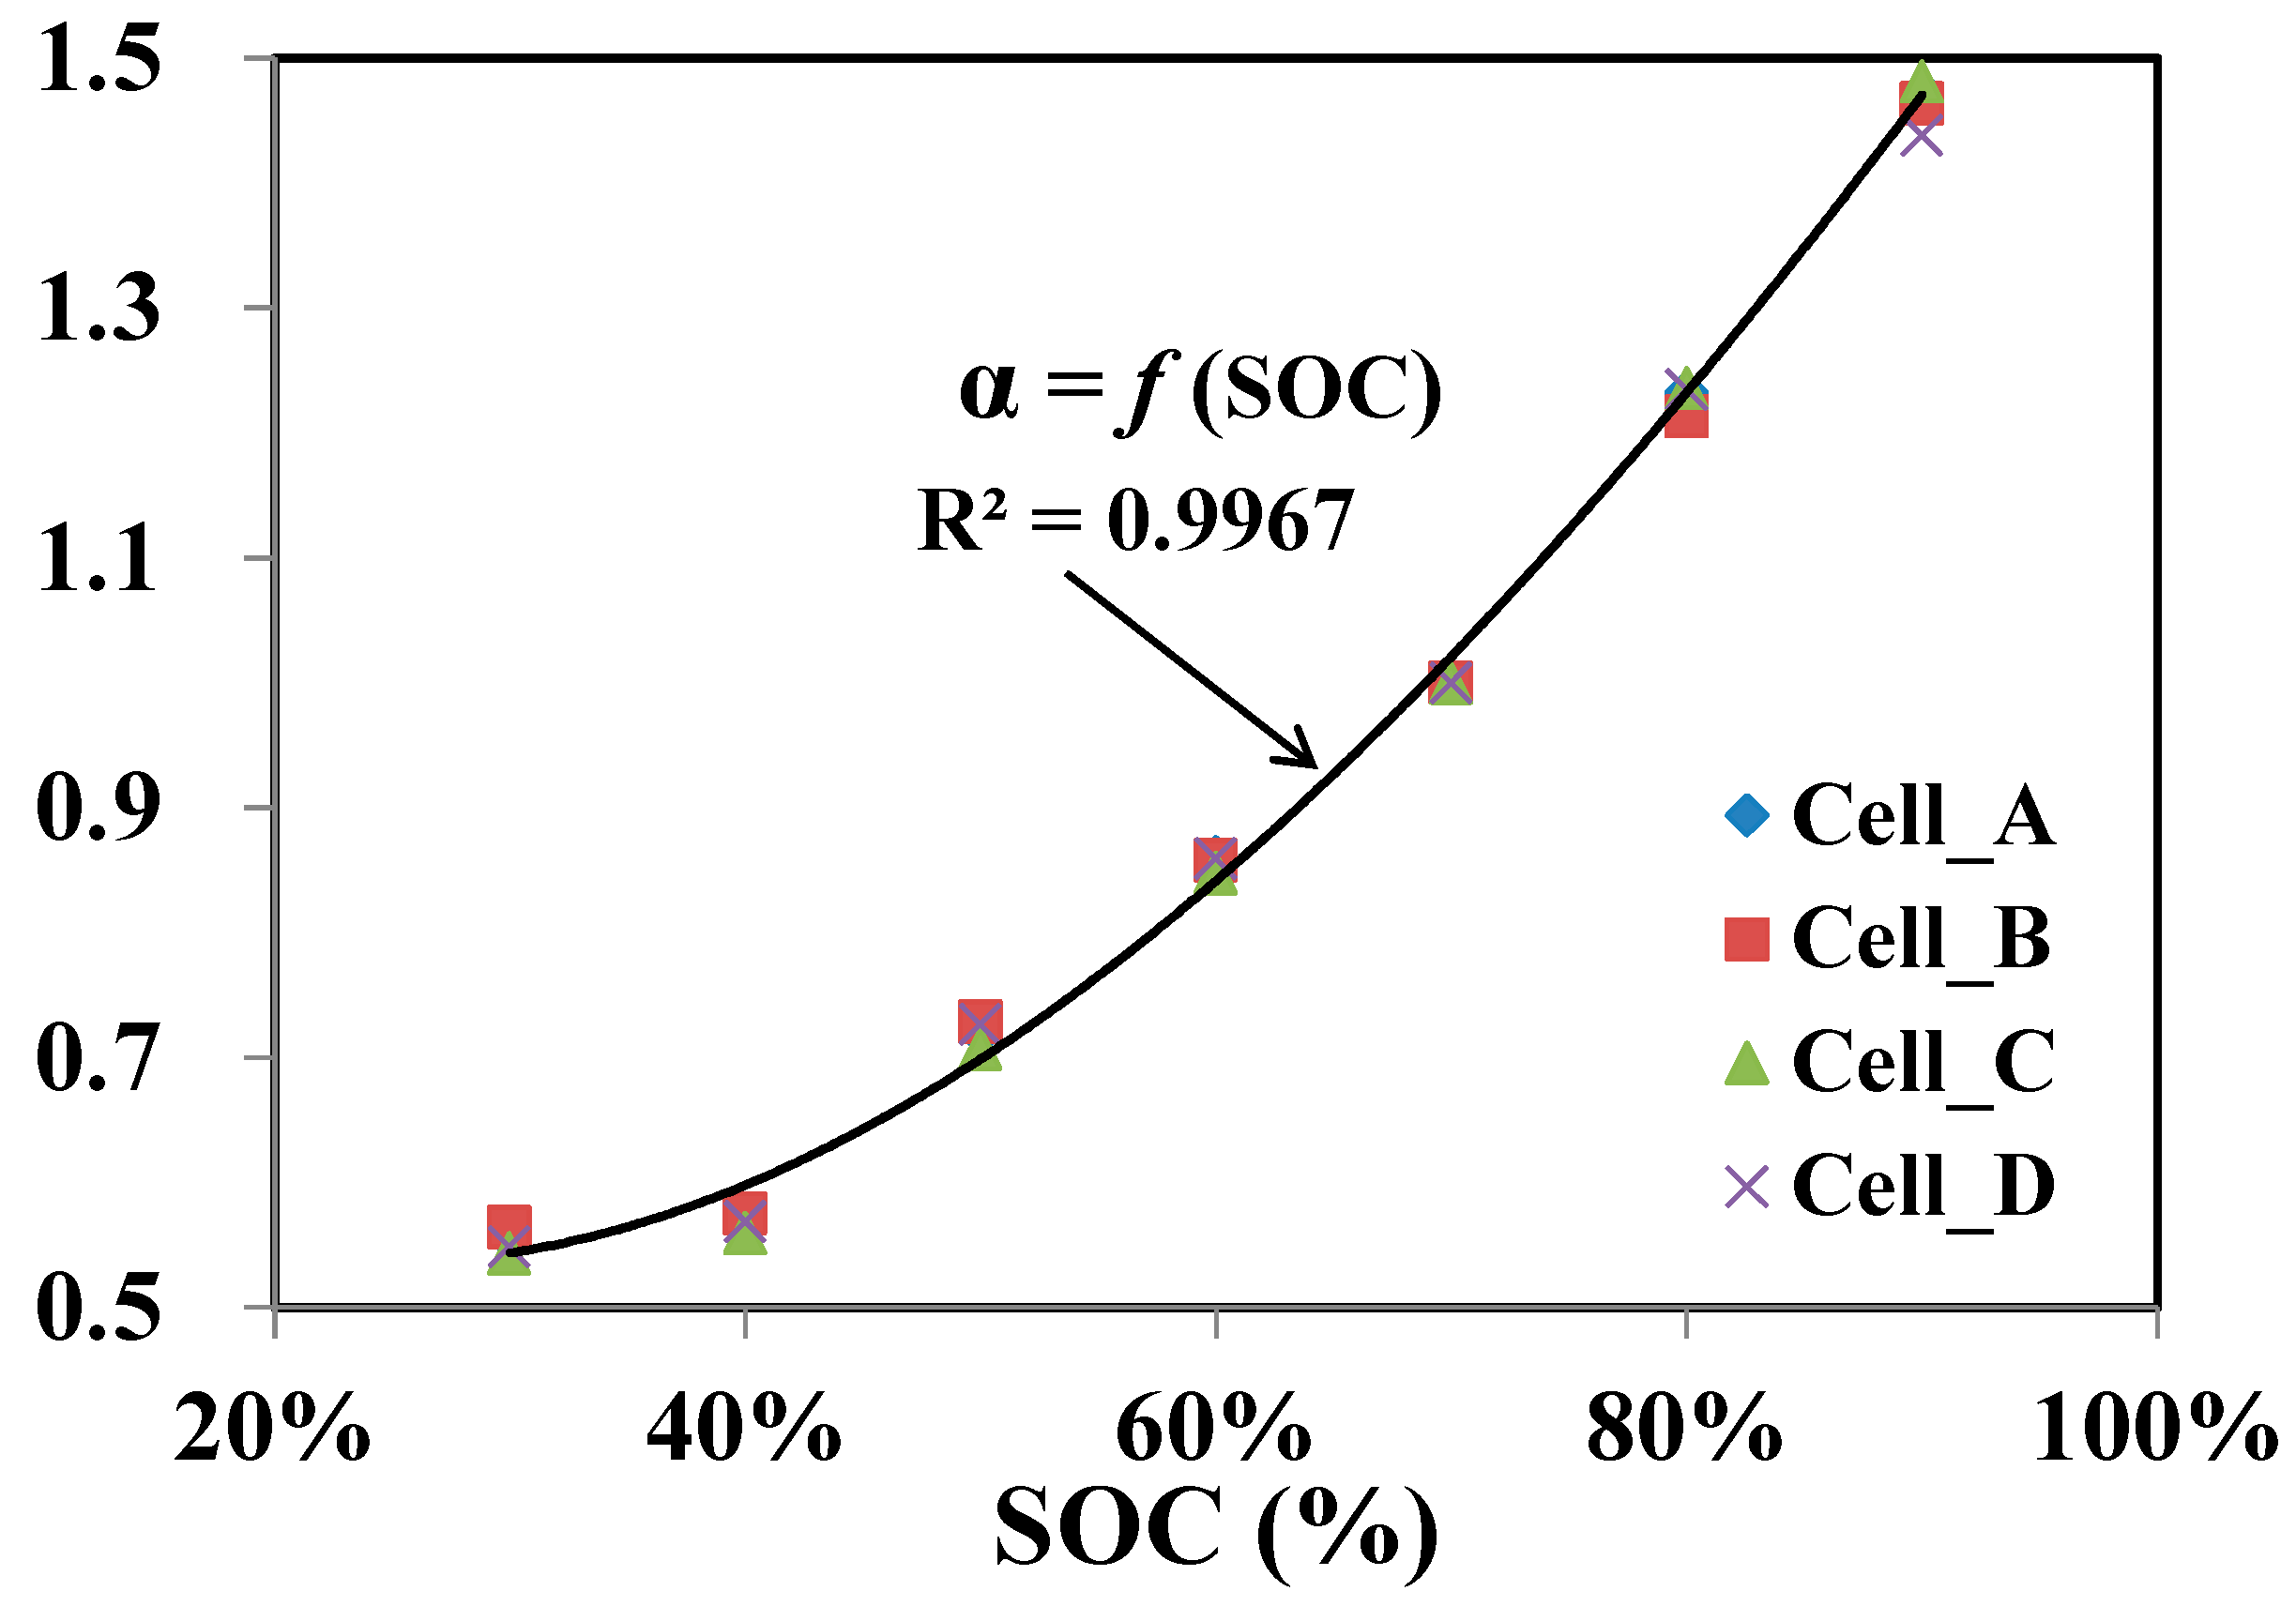
After thorough inspection of the test data, we multiplied a modification factor α onto Equation (10) without recalculating the regression coefficients A and B. Equation (10) is hence modified to become
where α(SOC) is the newly defined modification factor as a function of SOC. Since α does not monotonically change with SOC, interpolation is required and a third degree of polynomials is found to be accurate enough, as follows:
The fitted curve of Equation (12) derived from cell A with SOC, ranging from 40% to 90%, shows excellent agreement with the other three tested cells, as seen in Figure 5. The reason for choosing SOC = 70% as the basis (α = 1) is because that state seems to be the most prevalent state of an in-use battery. The authors have used other SOCs or other cell as the basis, and the estimation error level remained the same, although the regression coefficients of the model and modification factor were different. This consistency partially proves the robustness of the derived model.
2.4. Model Construction and Verification
This study aimed to employ battery outputs such as voltage and current to build up a new model suitable for SOC and SOH online estimation. The newly developed SOC and SOH models (Equations (9), (11), and (12)) do not use the cycle number N as the aging parameter. The batteries were undergoing the common cycle life test in the study so as to have N as a reference to do a comparison within the models. The process of model construction is shown in Figure 6, in which the test data of the instantaneous voltage, discharging current (constant), time, and resistance in each cycle were logged at 30-s intervals. 1/V′ is calculated from every two adjacent outputs. Qm is evaluated at the end of every discharging process, and SOH is calculated from Equation (2) accordingly. The SOC for each data point is obtained by back-substituting Qm into Equation (1).
The coefficients of the SOC and SOH models, based on the four tested cells in this study, were calculated from data regression. The equations were then applied back to the four cells to estimate the SOC and SOH values and to compare against the real data for verification. The accuracy of the models was defined by R2 and root mean square error (RMSE). The SOC and SOH were estimated from the battery’s random sampling of discharging voltages to simulate an in-use situation.
3. Results
With no preference, one of the four tested cells, called A, was first chosen for the SOC and SOH model construction. The derived model was then applied to estimate the SOC and SOH of all cells. To show the model’s robustness, the model construction process was repeated using different cell or cells as training data. The differences of the model coefficients and estimation errors between using different sets of training data were compared as well.
3.1. SOC Estimation
The first row of Table 1 shows the SOC estimations of cell A at four different aging conditions—100, 300, 500, and 700 cycles with V ranging from 3.55–3.95 volt. The average correlation (R2) is high, and the error (RMSE) is small. One may doubt that this excellent fitness was due to the same training and test data sets. To clarify this doubt, the SOC equation derived from cell A was applied to estimate the other three cells as well, and the corresponding R2 and RMSE are compared in rows 2–4 of Table 1. For the majority of points, R2 > 0.995 and RMSE < 0.024 except cell D’s 100-cycle case, which was probably caused by the abnormal external circuit connection that happened during the cycle test because extremely high resistance values contrasting with the other three were recorded. This anomaly was recovered after 150 cycles. Table 1 shows that the SOC accuracy holds even when the SOH is far below 80% (N = 700). The same process was repeated with the data of cells B, C, and D instead of A for the model construction, and the accuracy remained at the same level, which also proves the robustness of Equation (9).
3.2. SOH Estimation
The most significant improvement of the new SOH model established in this study is that there is no need to use the cycle number N. The SOH of a battery is evaluated from the on-line measured voltage. Most of the existing SOH models employed N as the aging parameter and displayed the SOH in terms of available cycles as the RUL. The cycle number is usually unavailable in real-time online applications. Therefore, the usage of RUL was abandoned and the SOH was displayed in terms of the capacity percentage in this study. For every discharging cycle, there are up to 100 data points for SOH calculations, therefore an averaged SOH estimation for each cycle is taken and compared against the real data as shown in Figure 7. The estimations (red) fit the real ones (black) well, except in the early stage of cell D. R2 and RMSE are shown in Table 2. High correlations (R2 > 0.983) and small errors (RMSE < 0.04) are observed in cells A–C. Cell D exhibits larger error (R2 = 0.947, RMSE = 0.0458), which is due to the anomaly of resistance below the first 150 cycles, similar to the SOC estimation.
3.3. Robustness of the Proposed Model
The results depicted in Section 3.1 and Section 3.2, based on cell A as the training data, prove that the model well predicts both the SOC and SOH status. Whether the estimation accuracy remains when using a different set of training data is important for determining how robust the model is. Therefore, the model equation using all of the four cells’ data, single, or multiples was constructed as well. The obtained SOC and SOH model coefficients using the four different cells are shown in Table 3 and Table 4, respectively. These coefficients vary only slightly, whichimplies that the model is relatively robust.
Table 5 further shows the estimation accuracy when different model equations are applied for the SOC estimation. The test data for every 25 cycles, i.e., N = 25 up to N = 700, were calculated. The first column of Table 5 denotes the cell used for the model construction, and the remaining columns show the estimation accuracy of all of the cells. As seen, R2 for each cell is high (>0.98), and RMSE is very small. The results infer that instantaneous V and 1/V′ are appropriate parameters for reflecting a battery’s SOC. Similarly, the results of SOH estimations are shown in Table 6 for RMSE, where the left column indicates the cell(s) used for modeling and the right columns show the corresponding RMSE. All of the errors fall below 0.047 except for cell D, but is still within 0.054. No significant difference in accuracy level appears by selecting one or multiple, or different cells, for the model construction. These results provide enough proof of the model’s robustness.
3.4. Simulations of Online Real-Time SOC and SOH Estimation
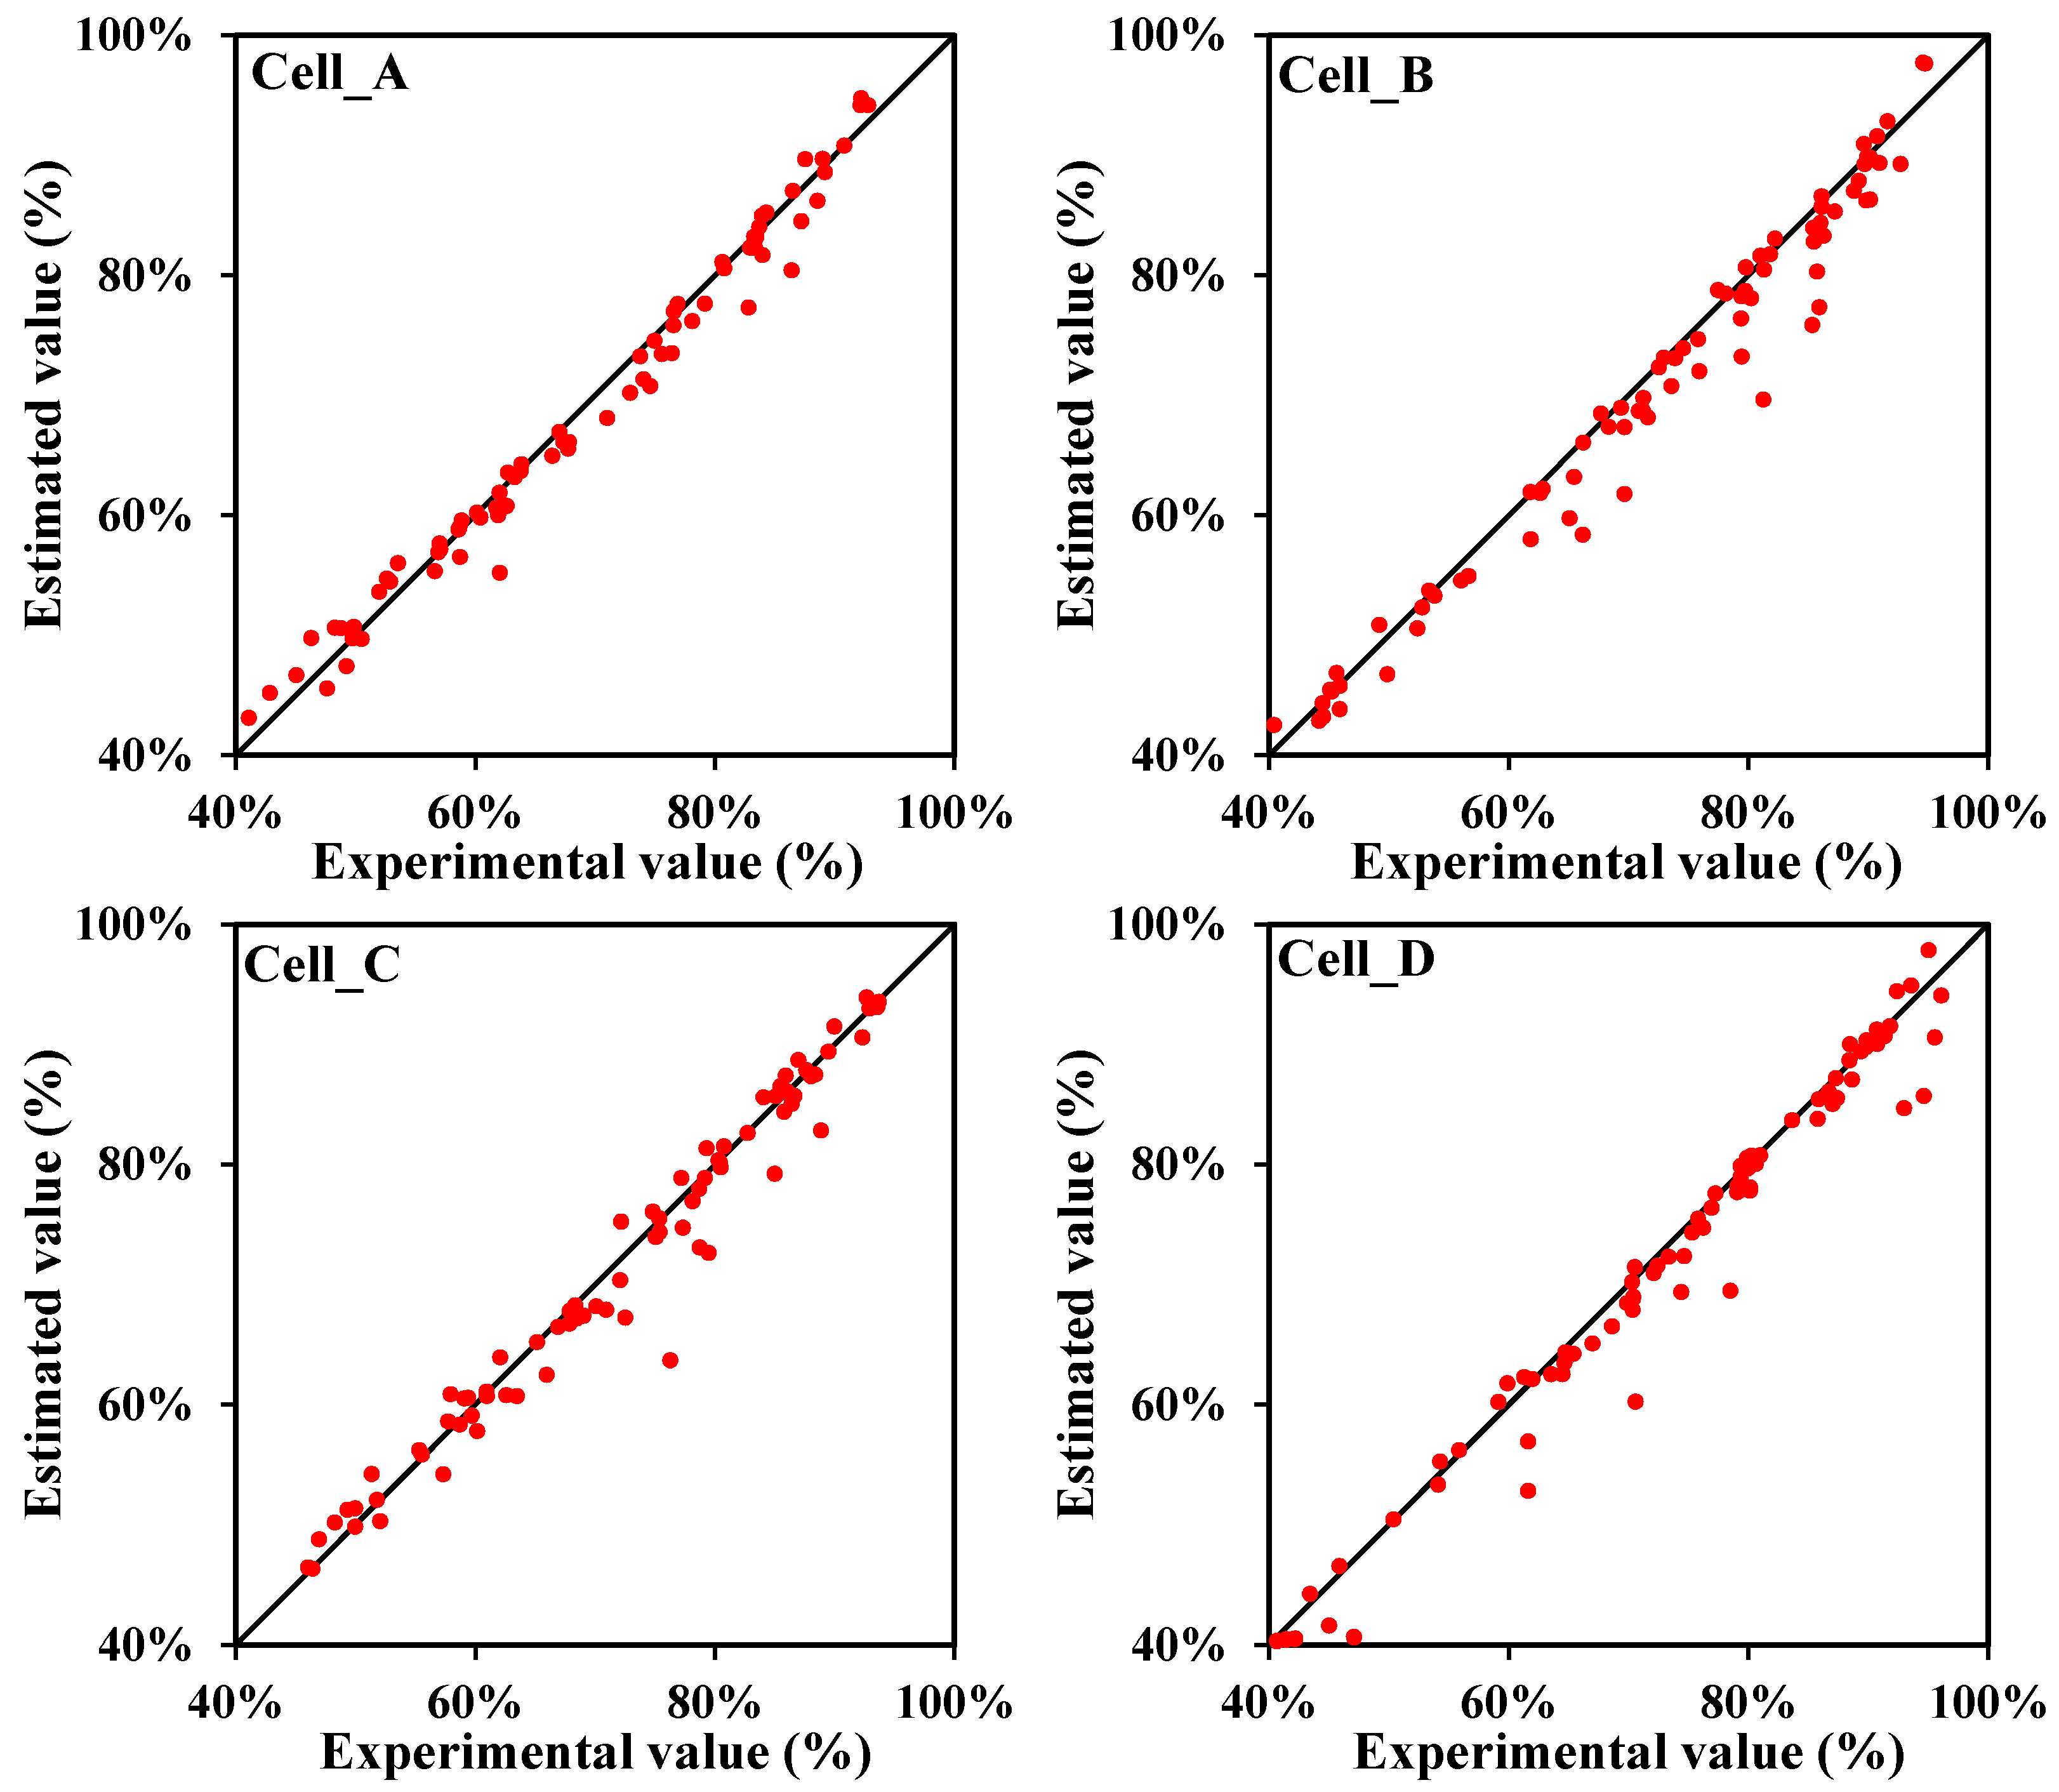
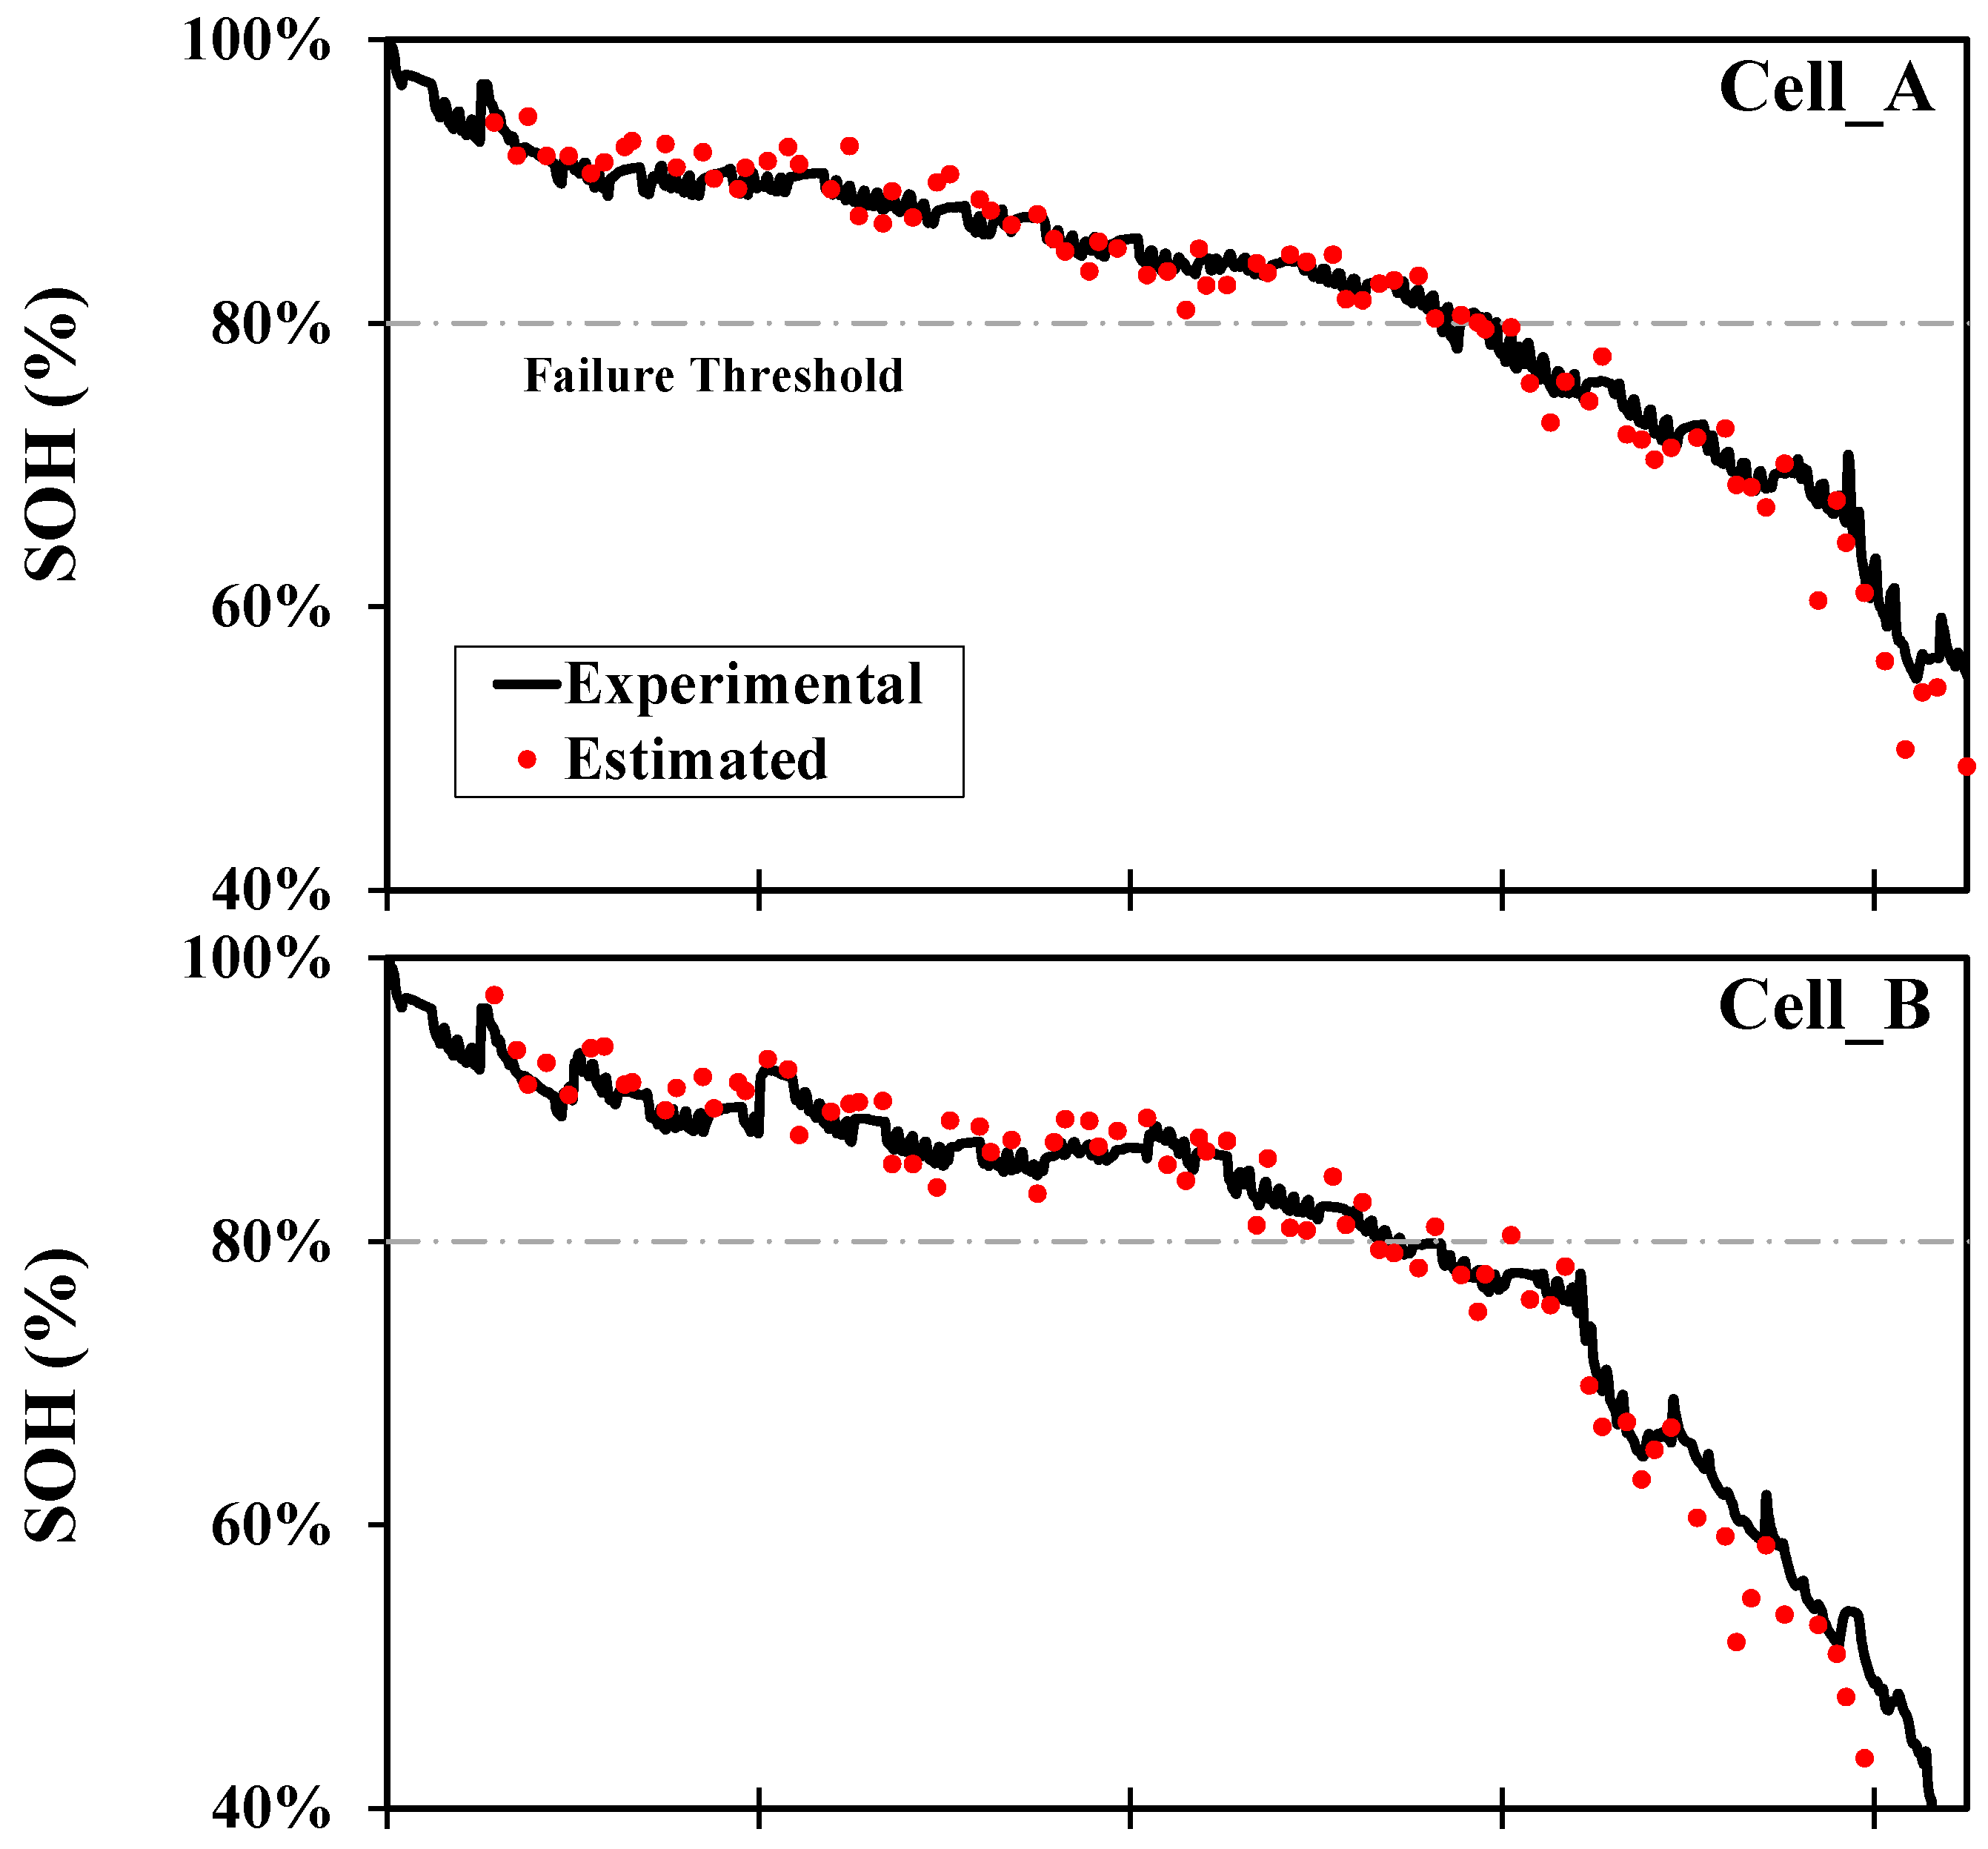
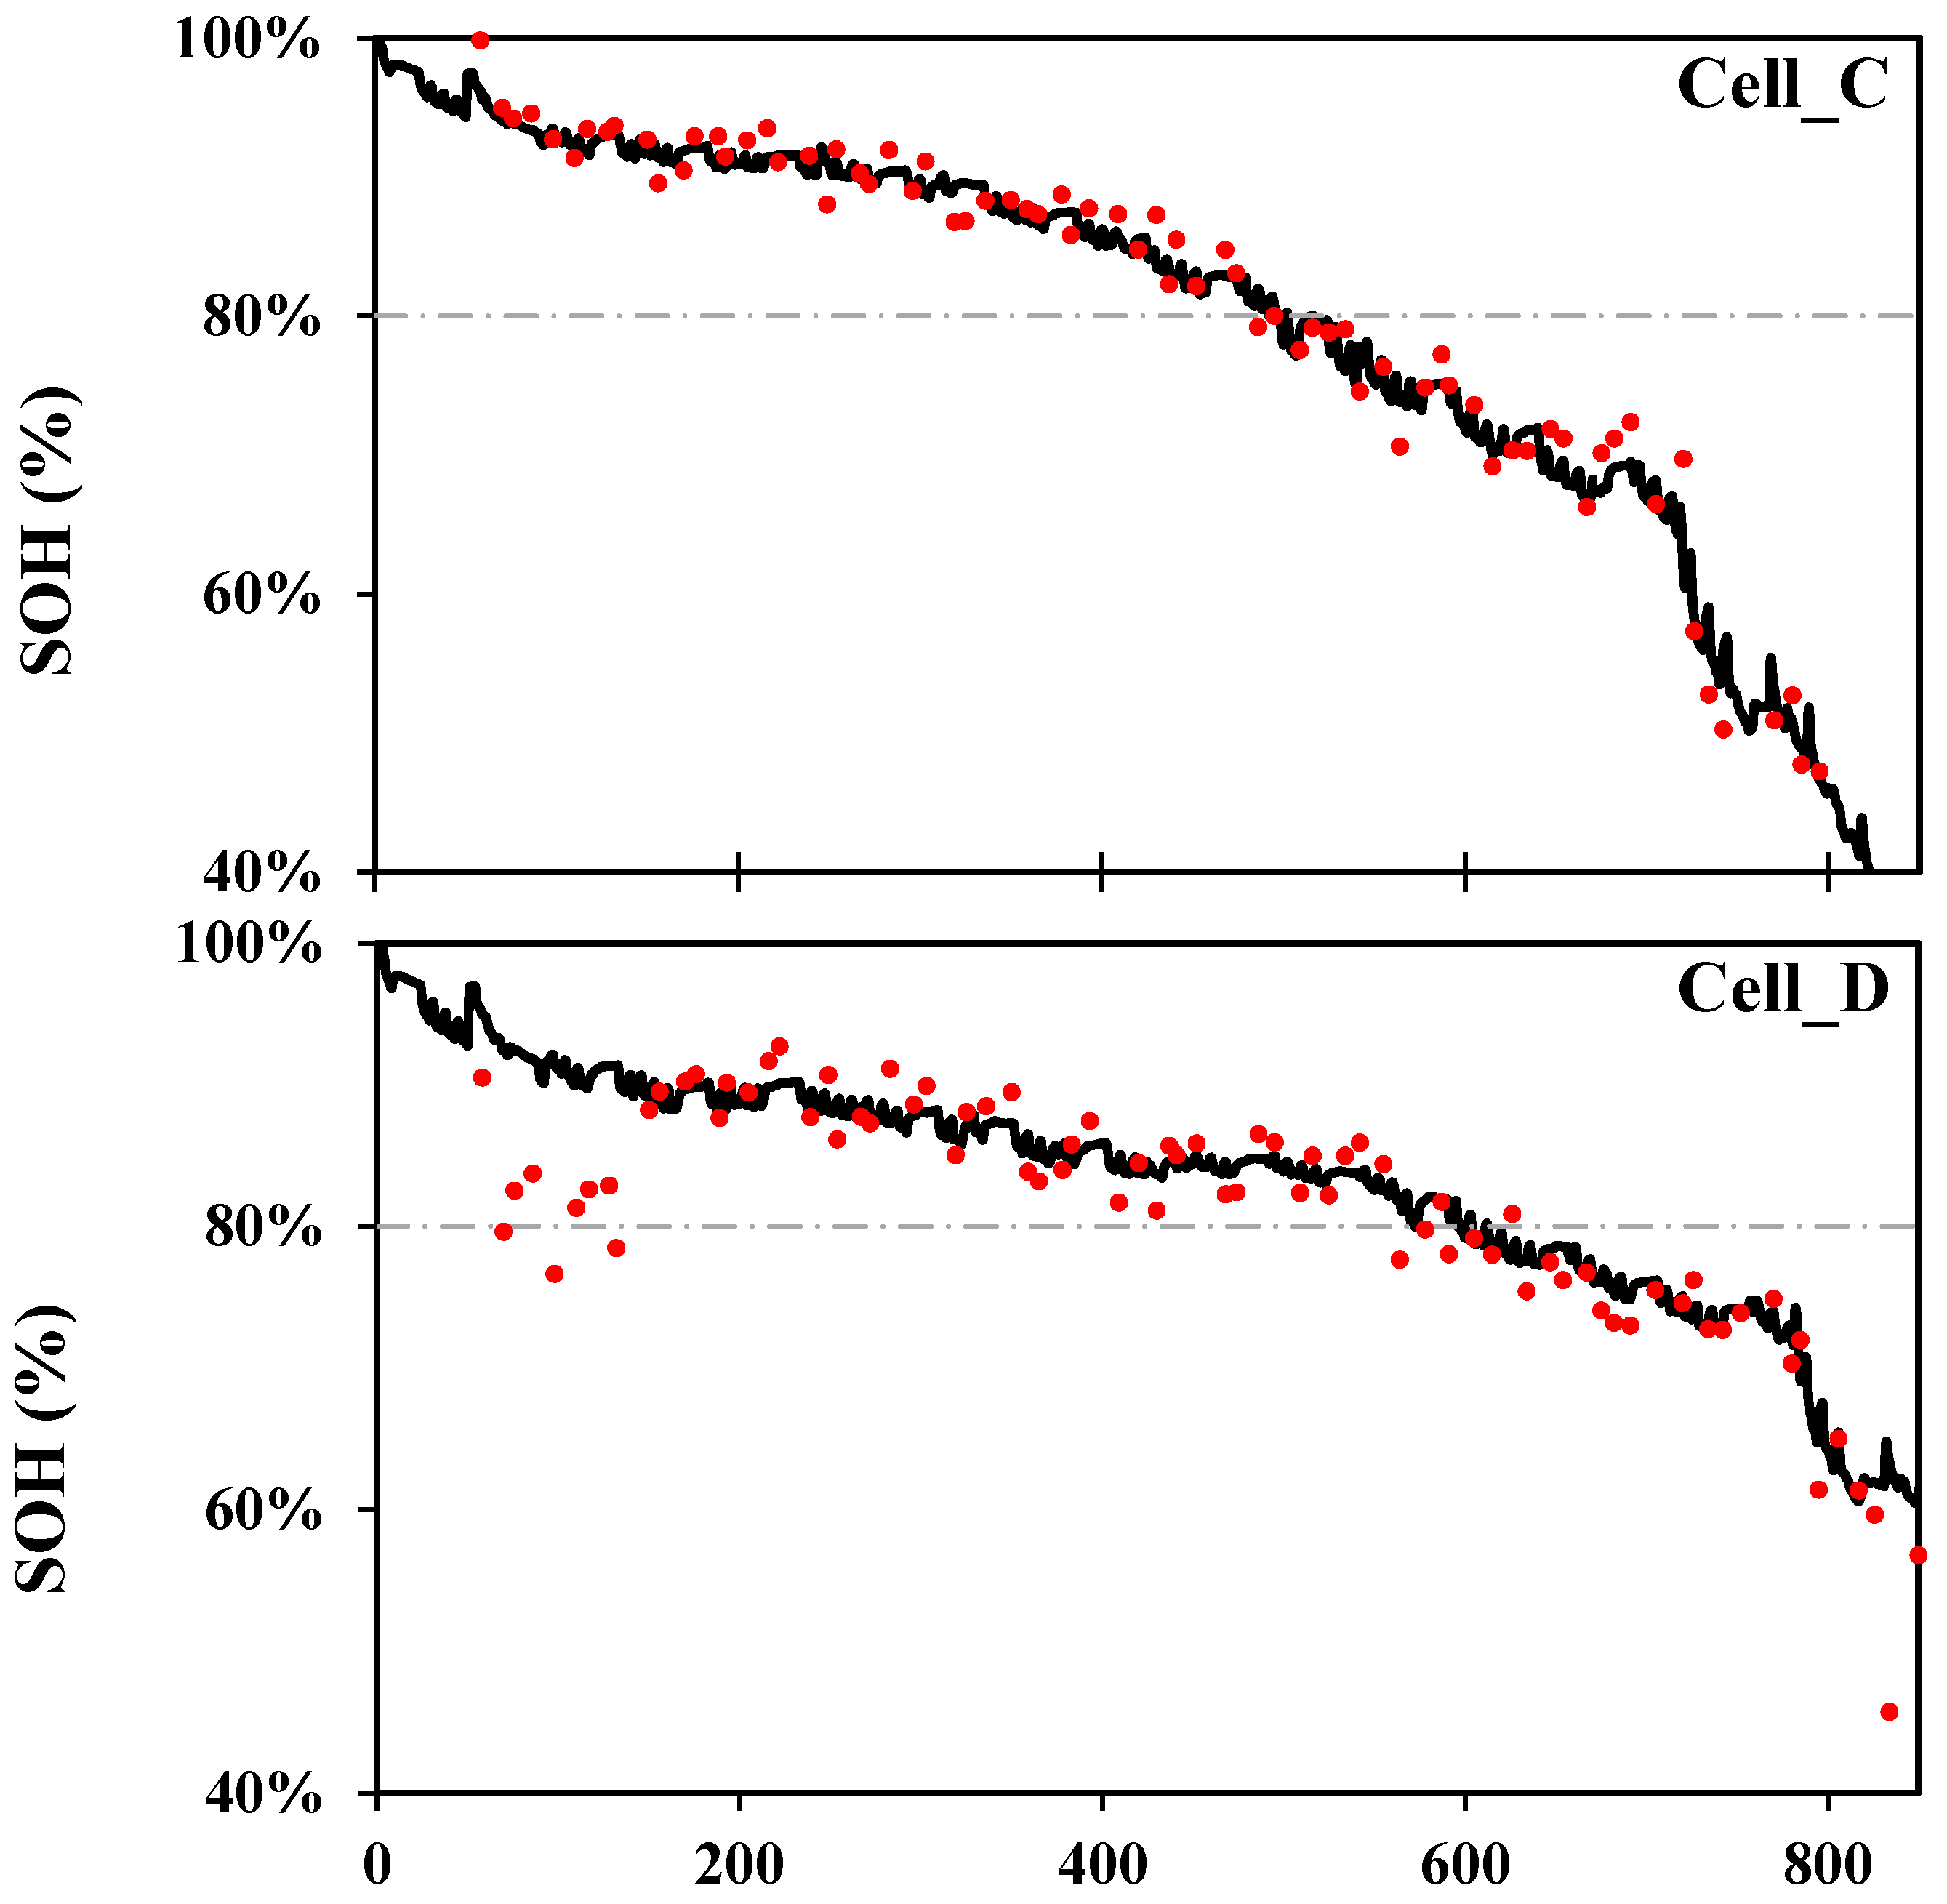
The derived SOC and SOH model is now applied to simulate an online, real-time estimation in this section. The model was constructed from cell A and embedded as the inherent equations of this type of battery and applied to all four batteries for SOC/SOH estimation in a random sampling test. Eighty data points with N from 50 to 850 and V from 3.55–3.95 volt were randomly sampled. Equation (10) yields the SOC evaluation, and Equations (11) and (12) follow the SOH evaluation. Figure 8 and Figure 9, respectively, compare the simulated real-time SOC and SOH results (red dots) to the actual values (black lines). It is seen from Figure 8 that the estimated SOCs scatter around the diagonals. The occurrence of larger errors, after inspection, happened at low SOH < 75%. The average errors of random SOC estimation of the four cells are given in the first row of Table 7. The labeled “normal range” denotes that only the data points of SOH > 75% are used and the average errors significantly decrease. As for Figure 9, the estimated SOHs are very close to the actual values. The average errors of the random SOH estimations of the four cells are given in the second row of Table 7. The results show that the model built upon the data of one single cell is able to predict all batteries’ SOC within a 2.23% error and SOH within a 3.35% error for all data ranges. The accuracy is even improved if the sampling points were limited to the battery’s life span of SOH > 75%.
4. Discussion
From the analysis of four tested batteries, the proposed model yields accurate SOC/SOH estimation independent of the selection of the training set and requires no model coefficient updating algorithms for the same batch of batteries. The estimation errors, however, show discrepancies between the different SOC levels, and among individual batteries. The suitable range of the proposed model and possible cause of error discrepancies are discussed in this section.
4.1. Suitable Range of the Proposed SOC Model
The SOC model has a linear relationship with both V and 1/V′. This assumption can generate larger errors as the SOC falls near two extremes, i.e., very low or very high because it is obviously becoming nonlinear in these regions. The SOC vs. V curve and estimation errors in discrete voltage regions are calculated and shown in Figure 10 for cell A. The suitable range (error < 3%) of the SOC estimation appears in the voltage region of 3.55 V to 3.95 V, corresponding to the SOC in 40%–90%. Significant errors due to nonlinearity appear at very low voltages, i.e., batteries are draining off, which can reach up to 20% error as the voltage drops to 3.5 V. This suitable range seems acceptable because an in-time charge warning to users would be more urgent than an accurate SOC estimation at drain-off stage. Similarly, the nonlinearity also causes larger error at full capacity. Therefore, this study suggests that this derived SOC model be used for online SOC estimation in the region of voltage within 3.55 to 3.95 volt for the best accuracy.
4.2. Comparison with the Existing SOH Models
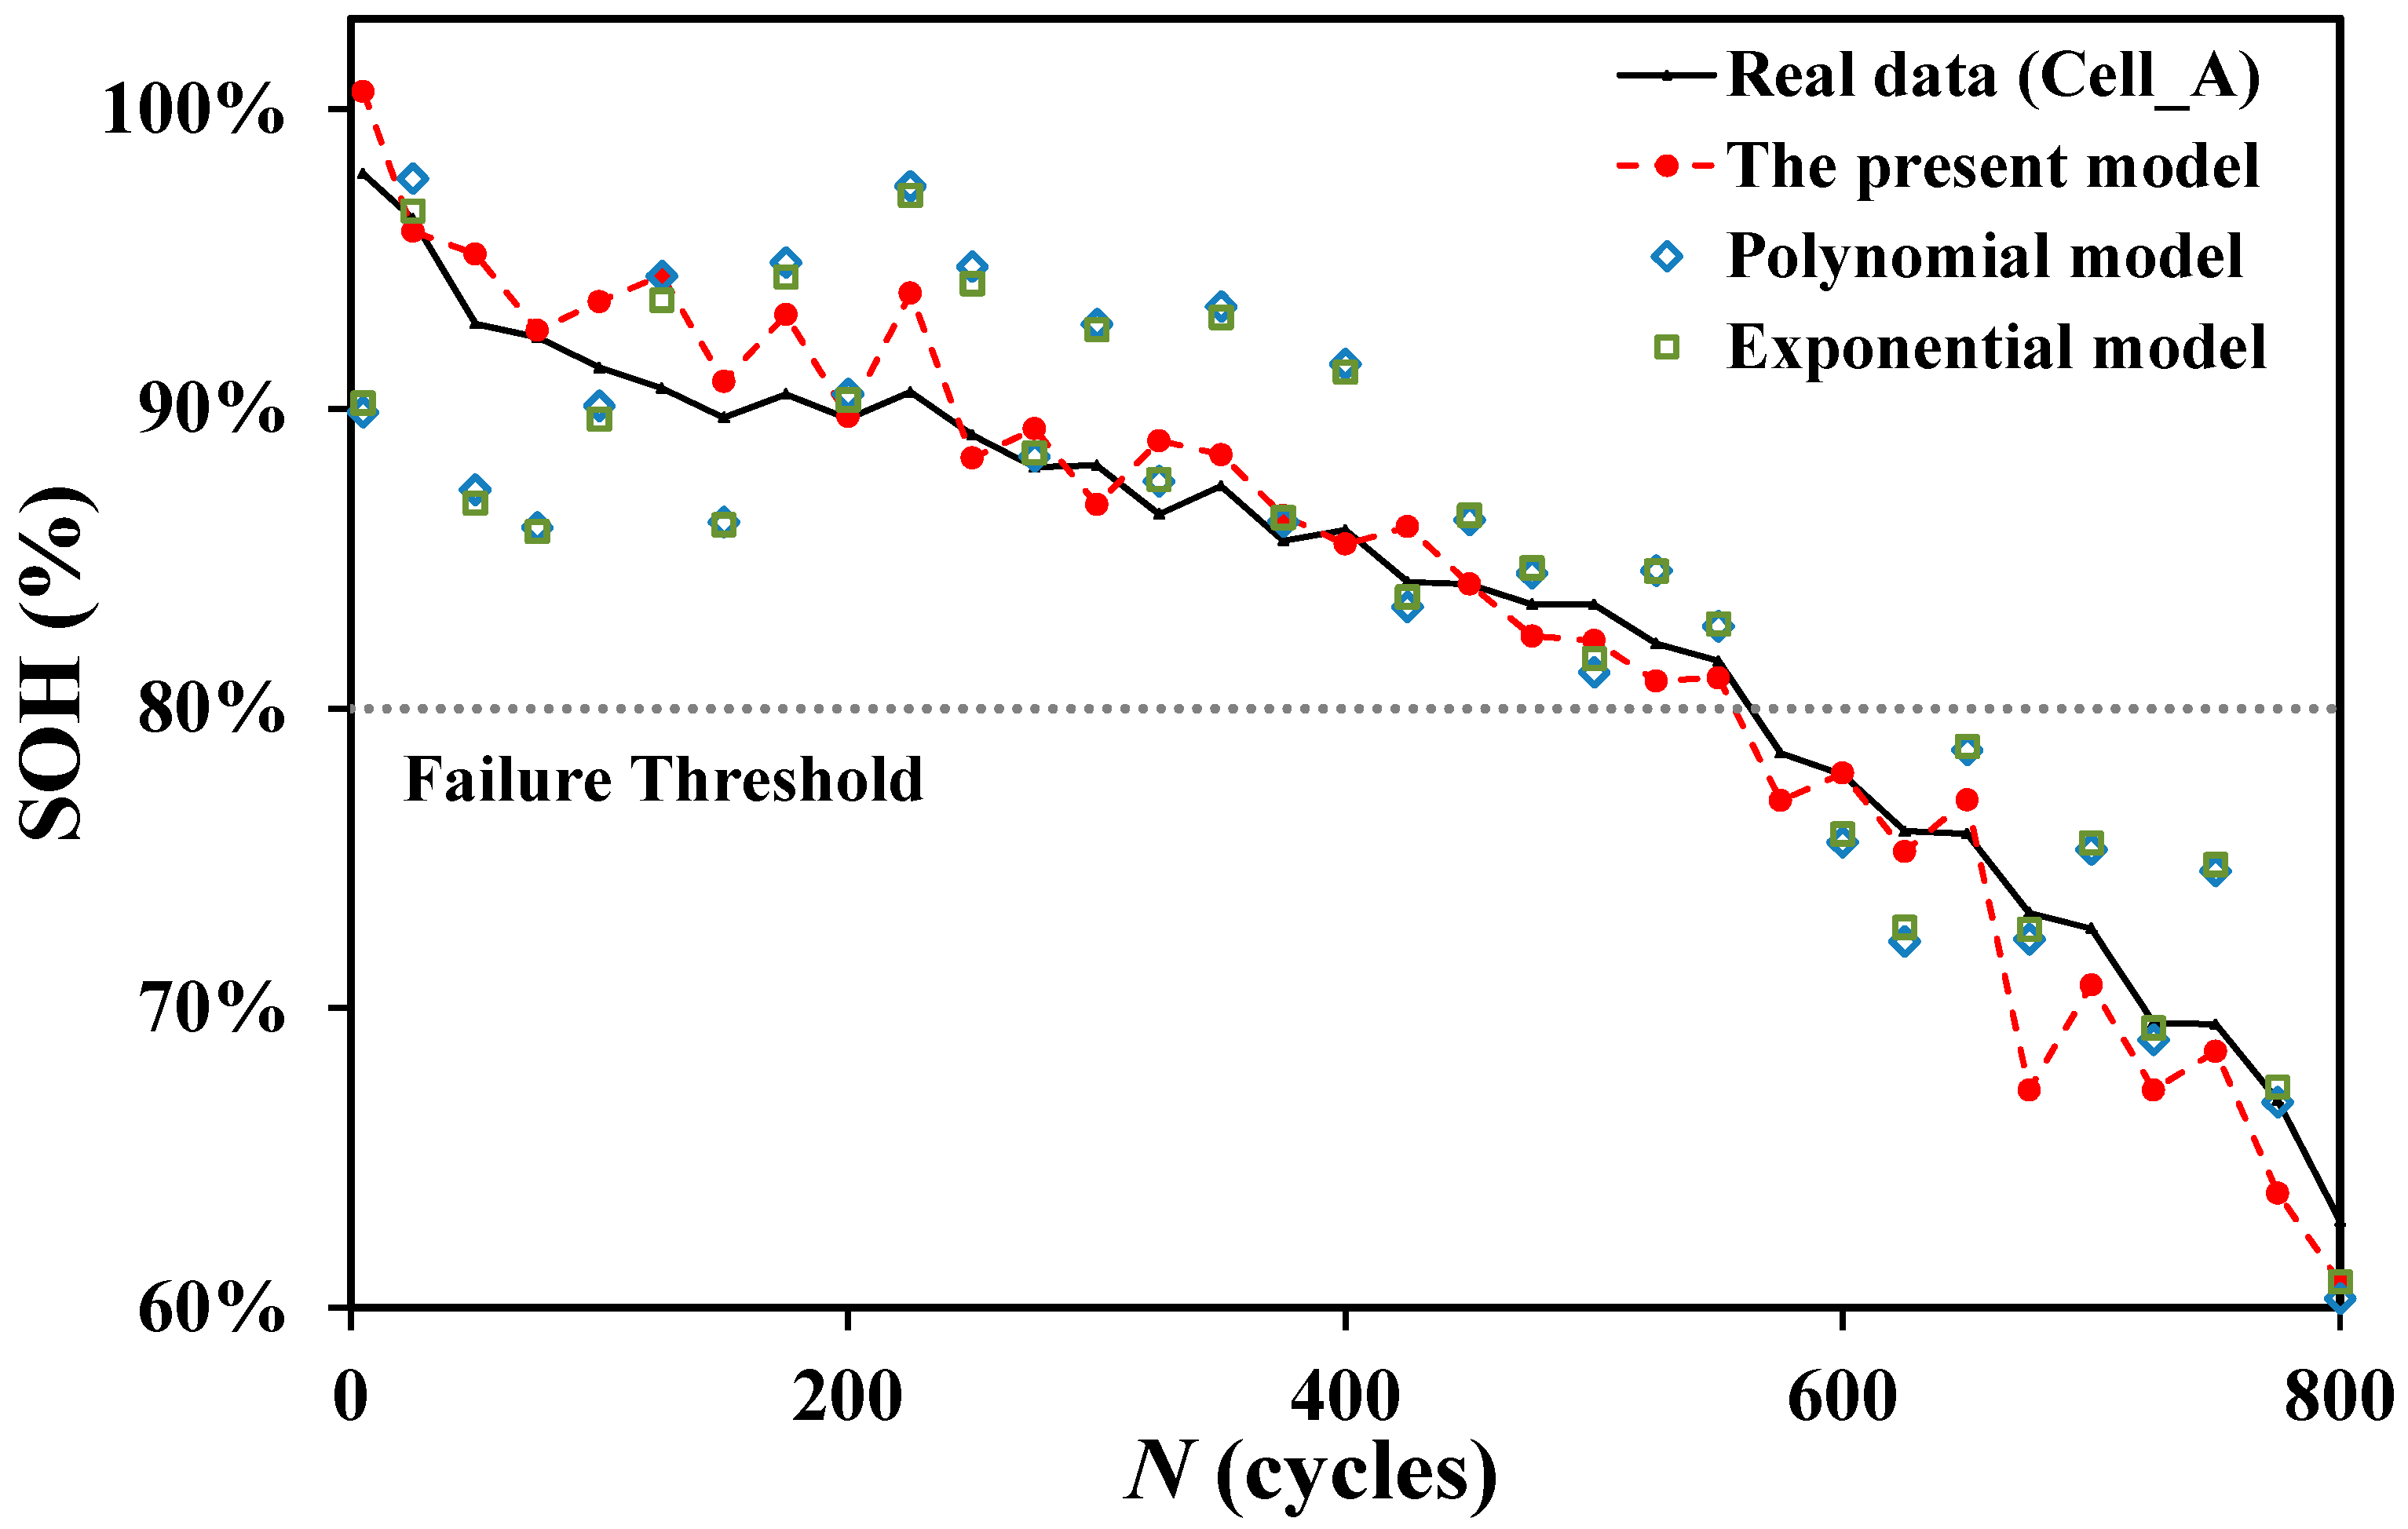
The SOH model derived in this paper is herein compared with the existing models. Our previous study [39] used two aging variables, the voltage (Vdis) and internal resistance (R) at the full discharge state, and derived two types of SOH models, polynomial and exponential. The present approach employed two variables, 1/V′ and V, for online SOC and SOH evaluation. Figure 11 overlapped the experimental data of cell A (black solid line) and the estimated values from three different models—the present (red dots), the polynomial (blue diamonds), and the exponential models (green squares). This comparison proves that the present model outperforms the other two models. Most importantly, the present model can estimate SOC/SOH in the sense of an online application without undergoing the full cycle test, which the previous models were unable to do. Comparisons were applied to the other three cells B–D, and a similar conclusion was found. Table 8 shows the values of R2 and RMSE of these three models, and the present one apparently has the highest correlation and the smallest error among all three models.
5. Conclusions
The research regarding battery SOC and SOH has gained much attention during the last decade. Numerous models have been derived from physical, statistical, and empirical approaches. Most of the existing models express SOH in terms of the cycle life (N) as the primary aging parameter. However, the cycle life is hard to trace because a battery in operation rarely undergoes a full charge/discharge process. This study developed suitable parameters and a new model for in-situ SOC and SOH estimation. Thorough exploration of the test data revealed that a new variable, the unit time voltage drop in a discharging process, is appropriate for SOC and SOH modeling. The newly derived SOC equation is linear with the instantaneous voltage V and 1/V′, and the SOH equation is linear with 1/V′, but has a modification factor as a function of the SOC. The proposed SOC and SOH models showed excellent accuracy when used to estimate the same batch of four tested batteries. Simulations of online SOC and SOH monitoring via random sampling were conducted and showed satisfactory results. The robustness of the model was checked as well, and the results indicated that using any one of the same batch of batteries for the model construction yielded similar accuracy for all four cells.
Acknowledgments
The authors would like to thank Michael G. Pecht and the Center for Advanced Life Cycle Engineering (CALCE) of the University of Maryland, for providing the reliability testing data of the Lithium-ion batteries. This research was supported by Taiwan’s Ministry of Science and Technology under the Grant Numbers NSC 102-2632-E-131-001-MY3.
Author Contributions
Shyh-Chin Huang conceived the model and wrote the main portion of the paper; Kuo-Hsin Tseng performed the data regression and calculations; Jin-Wei Liang and Chung-Liang Chang surveyed the literature, wrote part of paper and interpreted the model in an electrochemical sense; Michael G. Pecht supervised this research and provided the cells test data. He also provided many constructive suggestions and polished the English.
Conflicts of Interest
The authors declare no conflict of interest.
References
- Nishi, Y. Lithium ion secondary batteries; past 10 years and future. J. Power Sources 2001, 100, 101–106. [Google Scholar] [CrossRef]
- Burke, A.; Miller, M. Performance characteristics of lithium-ion batteries of various chemistries for plug-in hybrid vehicles. In Proceedings of the EVS24 International Battery, Hybrid and Fuel Cell Electric Vehicle Symposium, Stavanger, Norway, 13–16 May 2009. [Google Scholar]
- Silva, C.; Ross, M.; Farias, T. Evaluation of energy consumption, emissions and cost of plug-in hybrid vehicles. Energy Convers. Manag. 2009, 50, 1635–1643. [Google Scholar] [CrossRef]
- Meissner, E.; Richter, G. Battery monitoring and electrical energy management precondition for future vehicle electric power systems. J. Power Sources 2003, 116, 79–98. [Google Scholar] [CrossRef]
- Waag, W.; Fleischer, C.; Sauer, D.U. Critical review of the methods for monitoring of lithium-ion batteries in electric and hybrid vehicles. J. Power Sources 2014, 258, 321–339. [Google Scholar] [CrossRef]
- Hua, H.; Youn, B.D.; Chung, J. A multiscale framework with extended Kalman filter for lithium-ion battery SOC and capacity estimation. Appl. Energy 2012, 92, 694–704. [Google Scholar] [CrossRef]
- Chang, W.Y. The state of charge estimating methods for battery: A review. ISRN Appl. Math. 2013, 2013, 953792. [Google Scholar] [CrossRef]
- Zhang, J.; Lee, J. A review on prognostics and health monitoring of Li-ion battery. J. Power Sources 2011, 196, 6007–6014. [Google Scholar] [CrossRef]
- Zhang, Y.; Zhang, C.; Zhang, X. State-of-charge estimation of the lithium-ion battery system with time-varying parameter for hybrid electric vehicles. IET Control Theory Appl. 2014, 8, 160–167. [Google Scholar] [CrossRef]
- Zou, Y.; Hu, X.; Ma, H.; Li, S.E. Combined state of charge and state of health estimation over lithium-ion battery cell cycle lifespan for electric vehicles. J. Power Sources 2015, 273, 793–803. [Google Scholar] [CrossRef]
- Cuma, M.U.; Koroglu, T. A comprehensive review on estimation strategies used in hybrid and battery electric vehicles. Renew. Sustain. Energy Rev. 2015, 42, 517–531. [Google Scholar] [CrossRef]
- Watrin, N.; Blunier, B.; Miraoui, A. Review of adaptive systems for lithium batteries state-of-charge and state-of-health estimation. In Proceedings of the IEEE Transportation Electrification Conference and Expo, Dearborn, MI, USA, 18–20 June 2012. [Google Scholar]
- Prajapati, V.; Hess, H.; William, E.J.; Gupta, V.; Huff, M.; Manic, M.; Rufus, F.; Thakker, A.; Grover, J. A literature review of state of-charge estimation techniques applicable to lithium poly-carbon monoflouride (LI/CFx) battery. In Proceedings of the India International Conference on Power Electronics (IICPE ’10), New Delhi, India, 28–30 January 2011. [Google Scholar]
- Ng, K.S.; Moo, C.S.; Chen, Y.P.; Hsieh, Y.C. Enhanced Coulomb counting method for estimating state-of-charge and state-of-health of lithium-ion batteries. Appl. Energy 2009, 86, 1506–1511. [Google Scholar] [CrossRef]
- Roscher, M.A.; Sauer, D.U. Dynamic electric behavior and open-circuit-voltage modeling of LiFePO4-based lithium ion secondary batteries. J. Power Sources 2001, 196, 331–336. [Google Scholar] [CrossRef]
- Pop, V.; Bergveld, H.J.; Notten, P.H.L.; Op het Veld, J.H.G.; Regtien, P.P.L. Accuracy analysis of the state-of-charge and remaining run-time determination for lithium-ion batteries. Measurement 2009, 42, 1131–1138. [Google Scholar] [CrossRef]
- He, H.; Zhang, X.; Xiong, R.; Xu, Y.; Guo, H. Online model-based estimation of state-of-charge and open-circuit voltage of lithium-ion batteries in electric vehicles. Energy 2012, 39, 310–318. [Google Scholar] [CrossRef]
- Kim, J.; Cho, B.C. State-of-charge estimation and state-of-health prediction of a Li-ion degraded battery based on an EKF combined with a per-unit system. IEEE Trans. Veh. Technol. 2011, 60, 4249–4260. [Google Scholar] [CrossRef]
- Andre, D.; Appel, C.; Soczka-Guth, T.; Sauer, D.U. Advanced mathematical methods of SOC and SOH estimation for lithium-ion batteries. J. Power Sources 2013, 224, 20–27. [Google Scholar] [CrossRef]
- Xu, L.; Wang, J.; Chen, Q. Kalman filtering state of charge estimation for battery management system based on a stochastic fuzzy neural network battery model. Energy Convers. Manag. 2012, 53, 33–39. [Google Scholar] [CrossRef]
- Singh, P.; Vinjamuri, R.; Wang, X.; Reisner, D. Design and implementation of a fuzzy logic-based state-of-chargemeter for Li-ion batteries used in portable defibrillators. J. Power Sources 2006, 162, 829–836. [Google Scholar] [CrossRef]
- Remmlinger, J.; Buchholz, M.; Meiler, M.; Bernreuter, P.; Dietmayer, K. State-of-health monitoring of lithium-ion batteries in electric vehicles by on-board internal resistance estimation. J. Power Sources 2011, 196, 5357–5363. [Google Scholar] [CrossRef]
- Chiang, Y.H.; Sean, W.Y.; Ke, J.C. Online estimation of internal resistance and open-circuit voltage of lithium-ion batteries in electric vehicles. J. Power Sources 2011, 196, 3921–3932. [Google Scholar] [CrossRef]
- Williard, N.; He, W.; Osterman, M.; Pecht, M. Comparative analysis of features for determining state of health in lithium-ion batteries. Int. J. Progn. Health Manag. 2013, 4, 1–7. [Google Scholar]
- Chen, Z.; Mi, C.C.; Fu, Y.; Xu, J.; Gong, X. Online battery state of health estimation based on genetic algorithm for electric and hybrid vehicle applications. J. Power Sources 2013, 240, 184–192. [Google Scholar] [CrossRef]
- Miao, Q.; Xi, L.; Cui, H.; Liang, W.; Pecht, M. Remaining useful life prediction of lithium-ion battery with unscented particle filter technique. Microelectron. Reliab. 2013, 53, 805–810. [Google Scholar] [CrossRef]
- Eddahech, A.; Briat, O.; Vinassa, J.M. Adaptive voltage estimation for EV Li-ion cell based on artificial neural networks state-of-charge meter. In Proceedings of the IEEE International Symposium on Industrial Electronics (ISIE), Hangzhou, China, 28–31 May 2012; pp. 1318–1324. [Google Scholar]
- Zahid, T.; Li, W. A comparative study based on the least square parameter identification method for state of charge estimation of a LiFePO4 battery pack using three model-based algorithms for electric vehicle. Energies 2016, 9, 720. [Google Scholar] [CrossRef]
- Nuhic, A.; Terzimehic, T.; Soczka-Guth, T.; Buchholz, M.; Dietmayer, K. Health diagnosis and remaining useful life prognostics of lithium-ion batteries using data-driven methods. J. Power Sources 2013, 239, 680–688. [Google Scholar] [CrossRef]
- Lu, L.; Han, X.; Li, J.; Hua, J.; Ouyang, M. A review on the key issues for lithium-ion battery management in electric vehicles. J. Power Sources 2013, 226, 272–288. [Google Scholar] [CrossRef]
- Hung, M.H.; Lin, C.H.; Lee, L.C.; Wang, C.M. State-of-charge and state-of-health estimation for lithium-ion batteries based on dynamic impedance technique. J. Power Sources 2014, 68, 861–873. [Google Scholar] [CrossRef]
- Tong, S.; Klein, M.P.; Park, J.W. On-line optimization of battery open circuit voltage for improved state-of-charge and state-of-health estimation. J. Power Sources 2015, 293, 416–428. [Google Scholar] [CrossRef]
- Groot, J. State-of-Health Estimation of Li-ion Batteries: Cycle Life Test Methods. Master’s Thesis, Chalmers University of Technology, Gothenburg, Sweden, 2012. [Google Scholar]
- Roscher, M.A.; Assfalg, J.; Bohlen, O.S. Detection of utilizable capacity deterioration in battery systems. IEEE Trans. Veh. Technol. 2011, 60, 98–103. [Google Scholar] [CrossRef]
- Yazami, R.; Touzain, P.H. A reversible graphite-lithium negative electrode for electrochemical generators. J. Power Sources 1983, 9, 365–371. [Google Scholar] [CrossRef]
- Yazami, R.; Reynier, Y. Thermodynamics and crystal structure anomalies in lithium-intercalated graphite. J. Power Sources 2006, 153, 312–318. [Google Scholar] [CrossRef]
- Dubarry, M.; Liaw, B.Y. Identify capacity fading mechanism in a commercial LiFePO4 cell. J. Power Sources 2009, 194, 541–549. [Google Scholar] [CrossRef]
- Weng, C.; Cui, Y.; Sun, J.; Peng, H. On-board state of health monitoring of lithium-ion batteries using incremental capacity analysis with support vector regression. J. Power Sources 2013, 235, 36–44. [Google Scholar] [CrossRef]
- Tseng, K.H.; Liang, J.W.; Chang, W.; Huang, S.C. Regression models using fully discharge voltage and internal resistance for state of health estimation of lithium-ion battery. Energies 2015, 8, 2889–2907. [Google Scholar] [CrossRef]
Figure 1.
Variations of the voltage vs. capacity of cell A at various cycles.
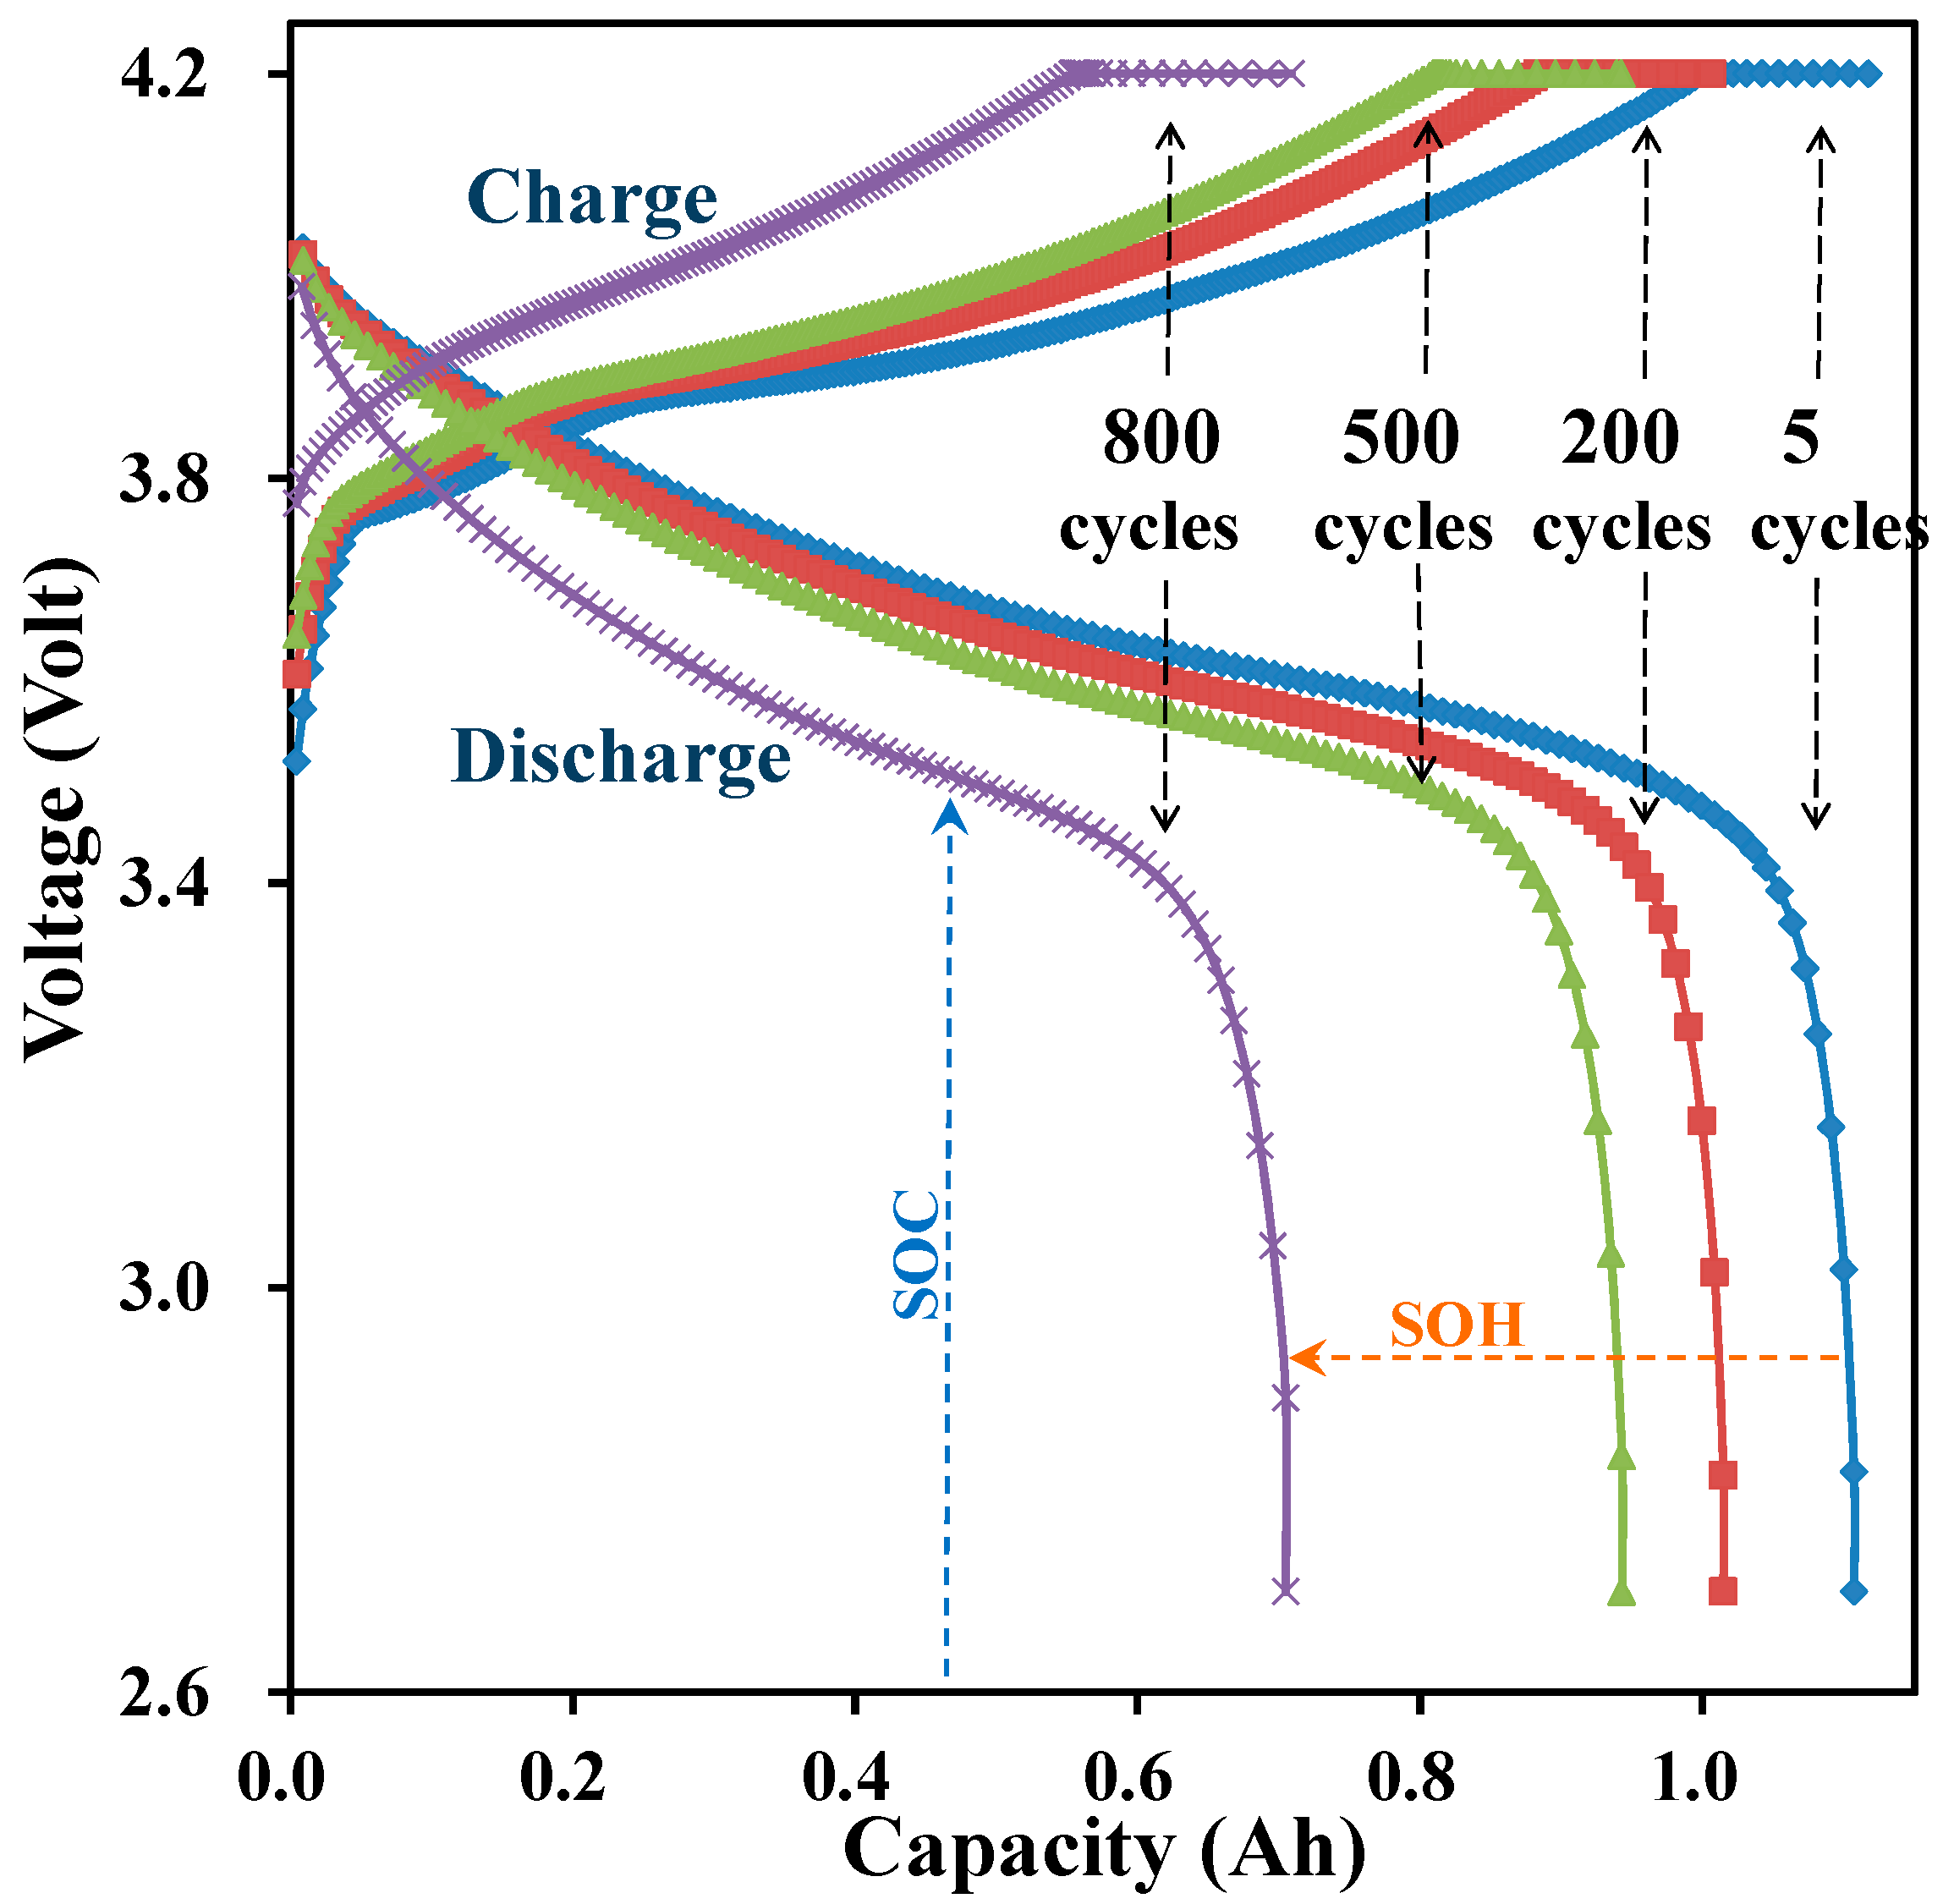
Figure 2.
Correlation of SOC to 1/V′ under an instantaneous discharge voltage from 3.6 to 3.9 volt.

Figure 3.
Correlations of SOH to 1/V′ at various SOC levels.
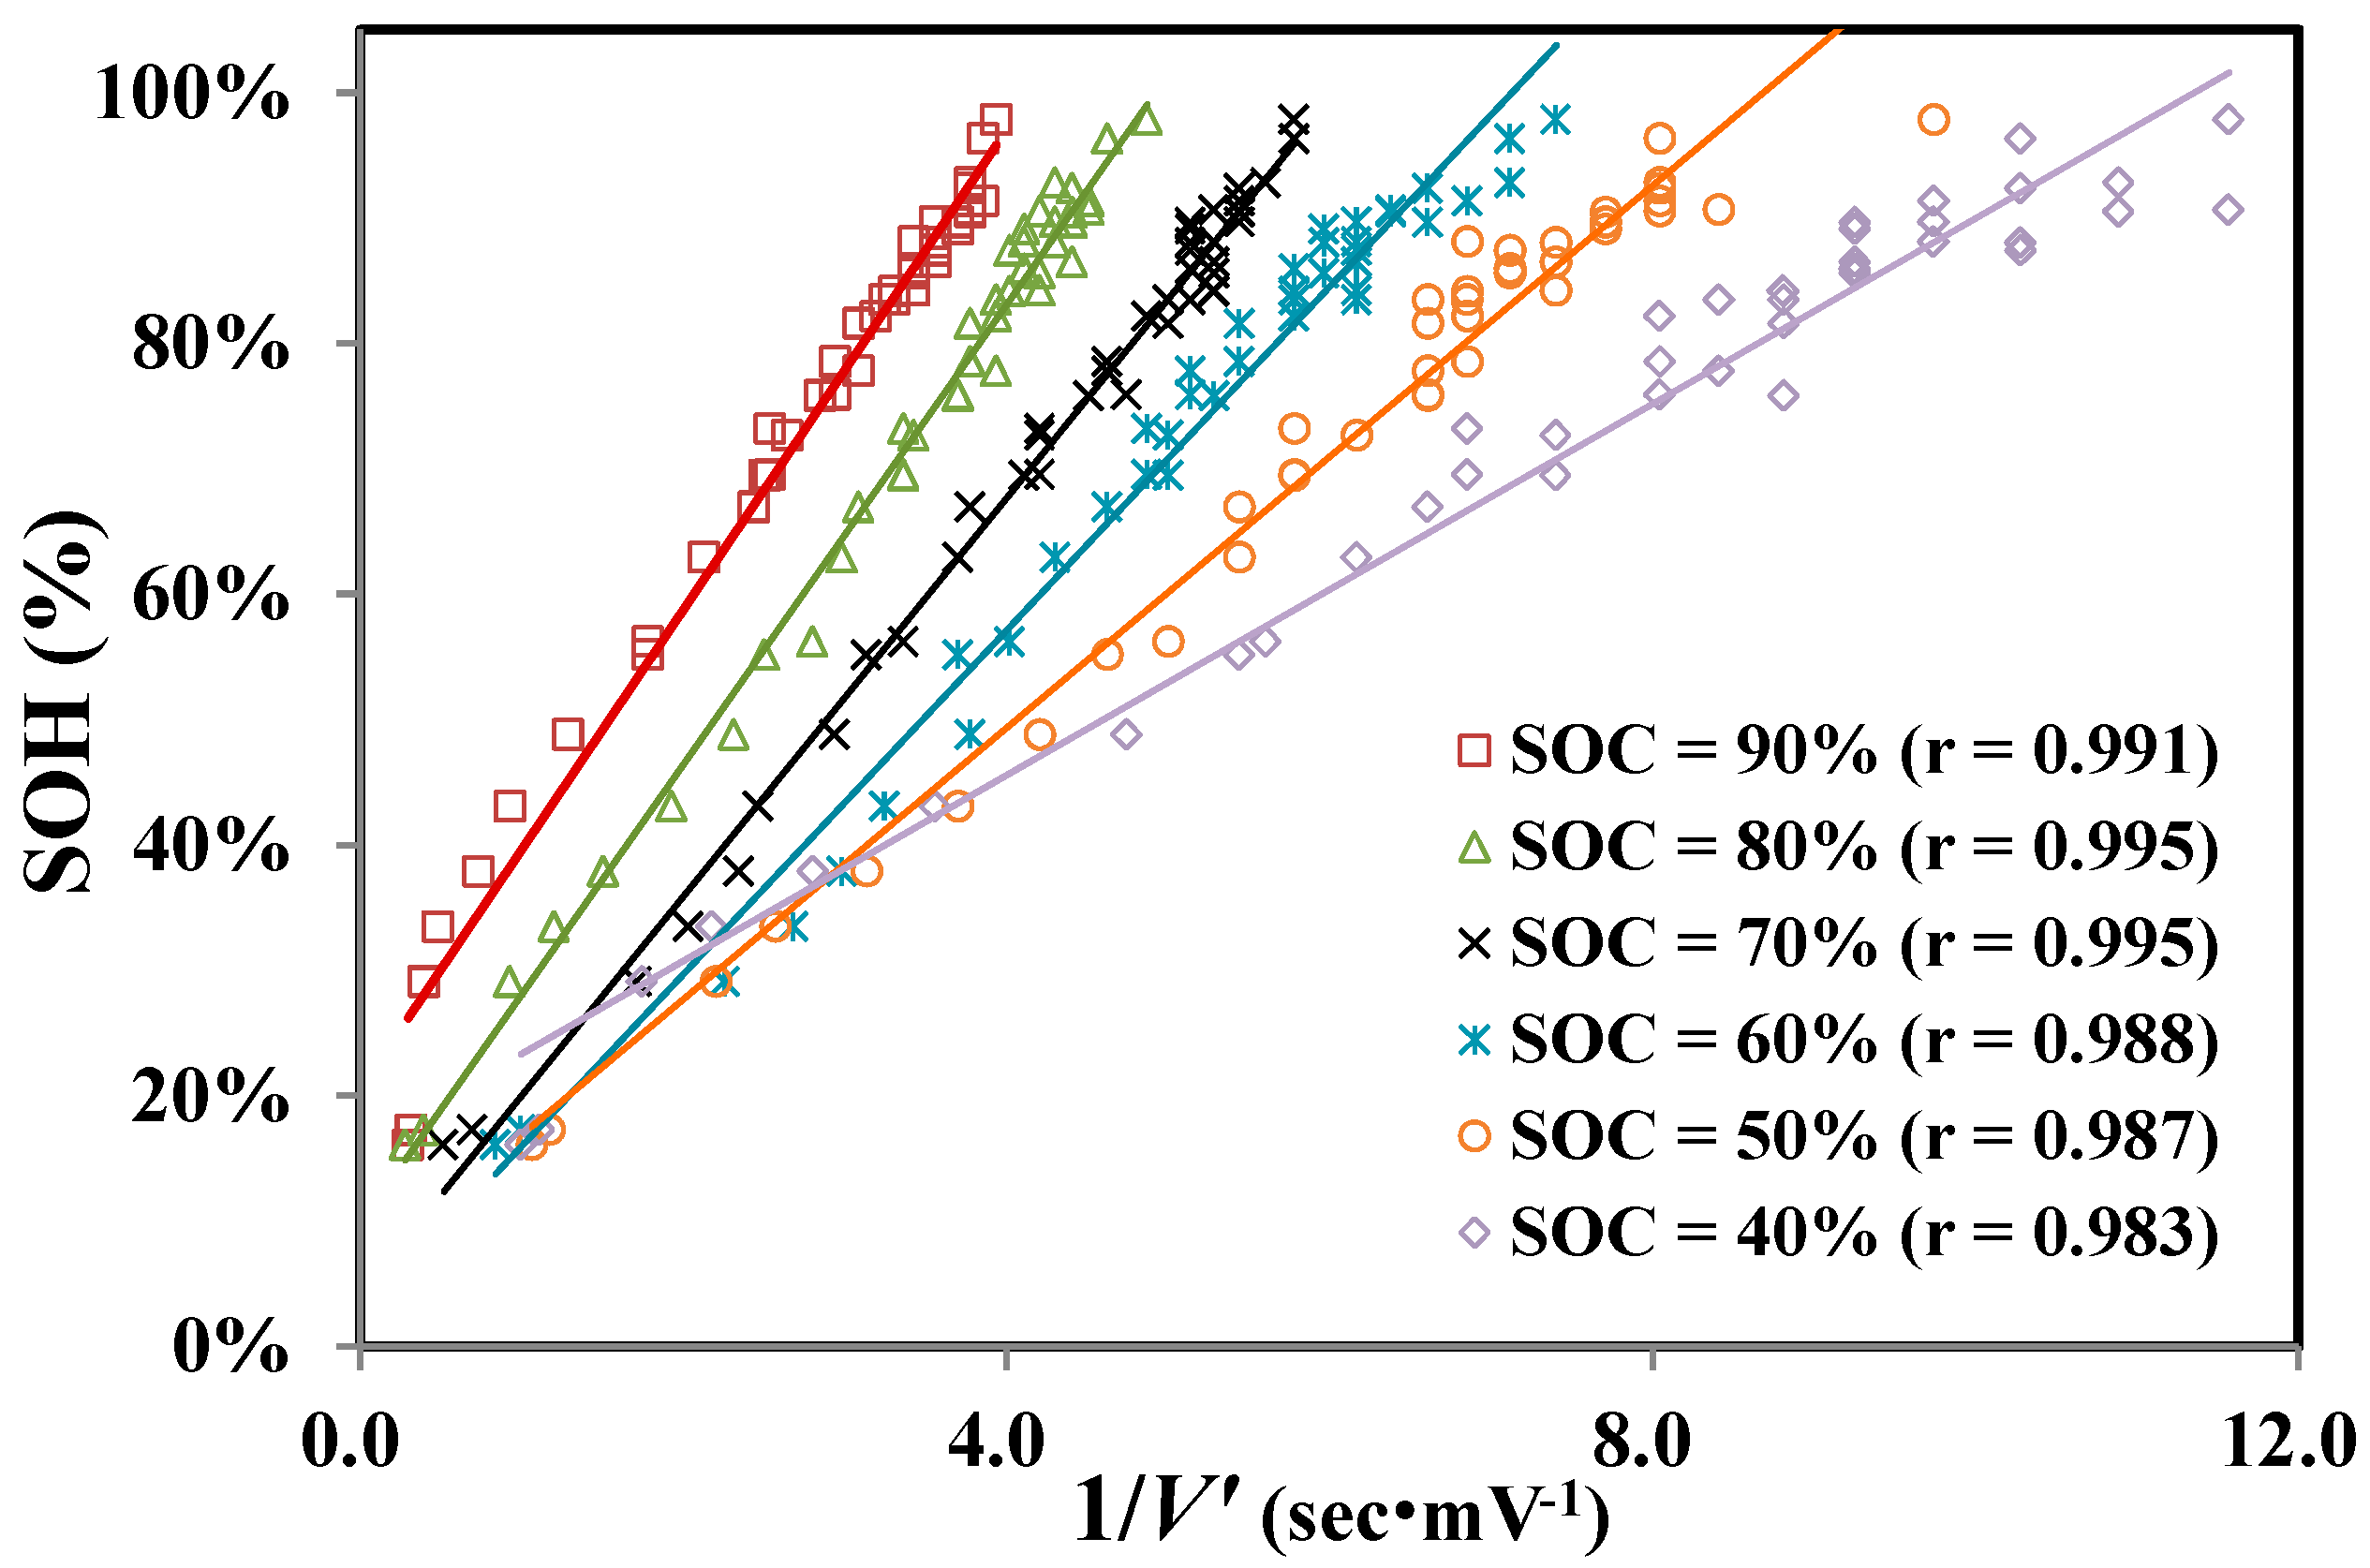
Figure 4.
Comparison of the estimated vs. real SOH for cell A at SOC = 70%.
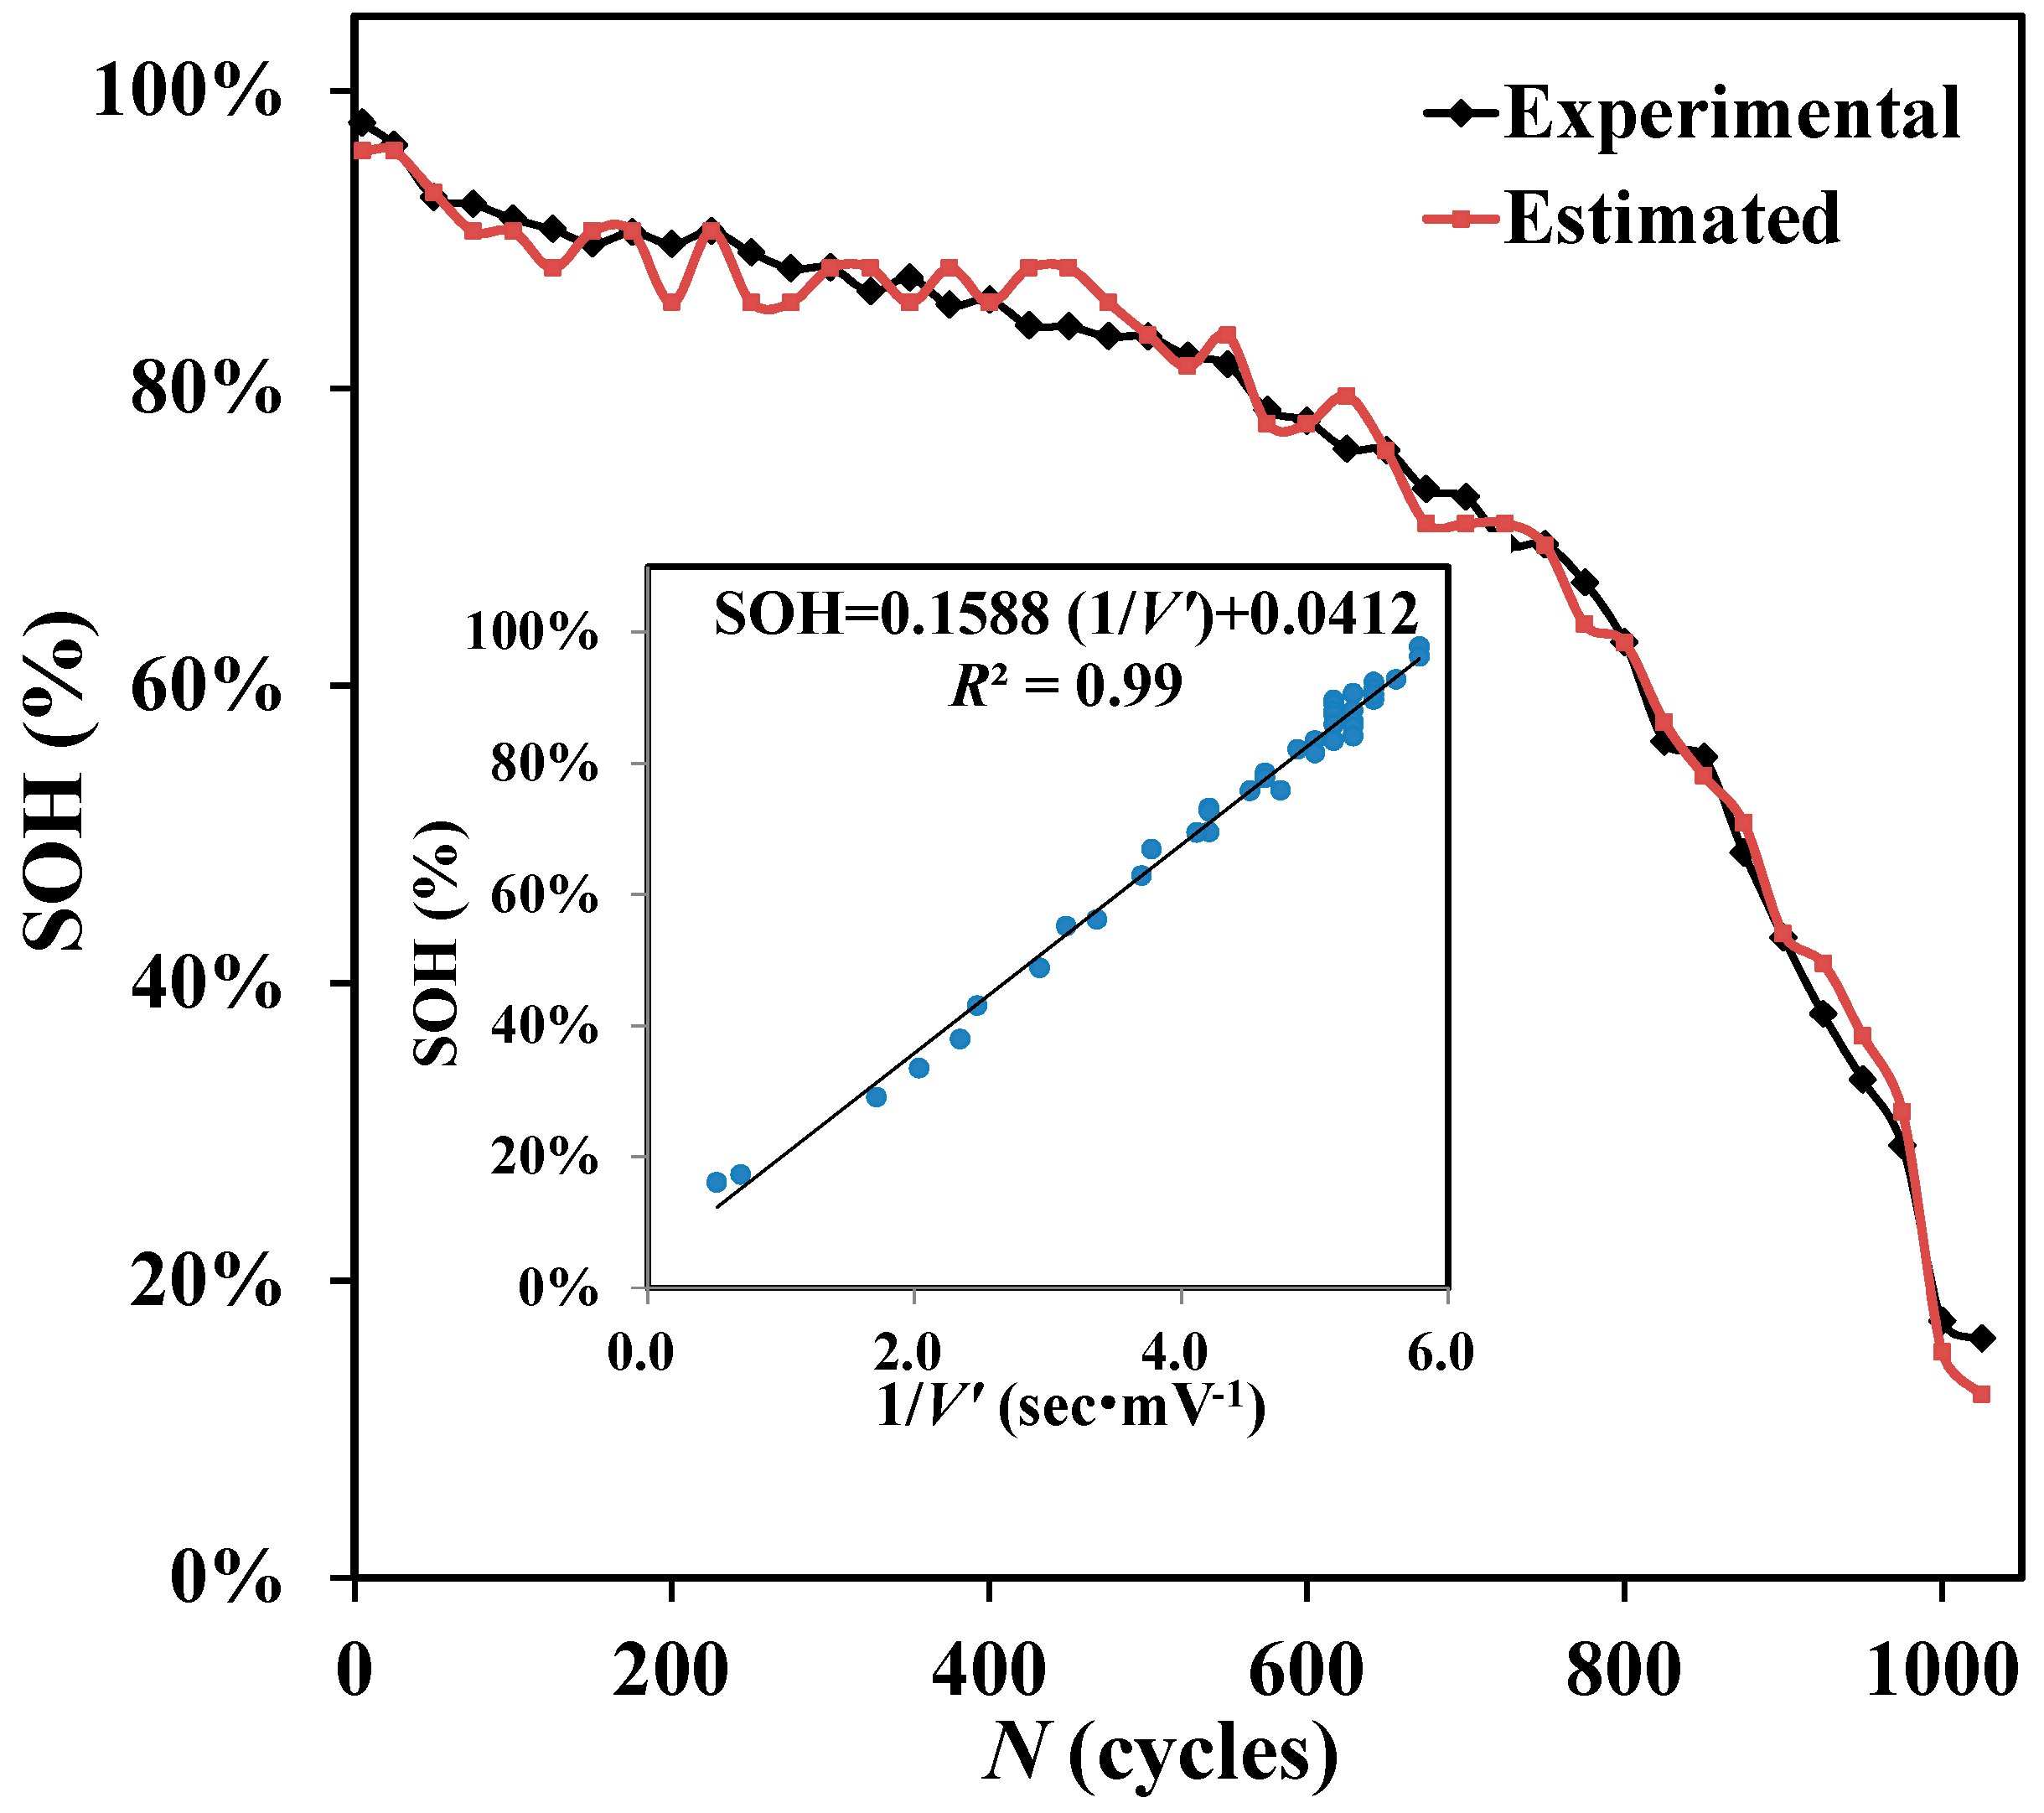
Figure 5.
Correlations of factor α with SOC for the four tested cells.

Figure 6.
SOC and SOH model construction and verification process.

Figure 7.
Estimated and experimental SOHs of cells A-D using cell A for model construction.
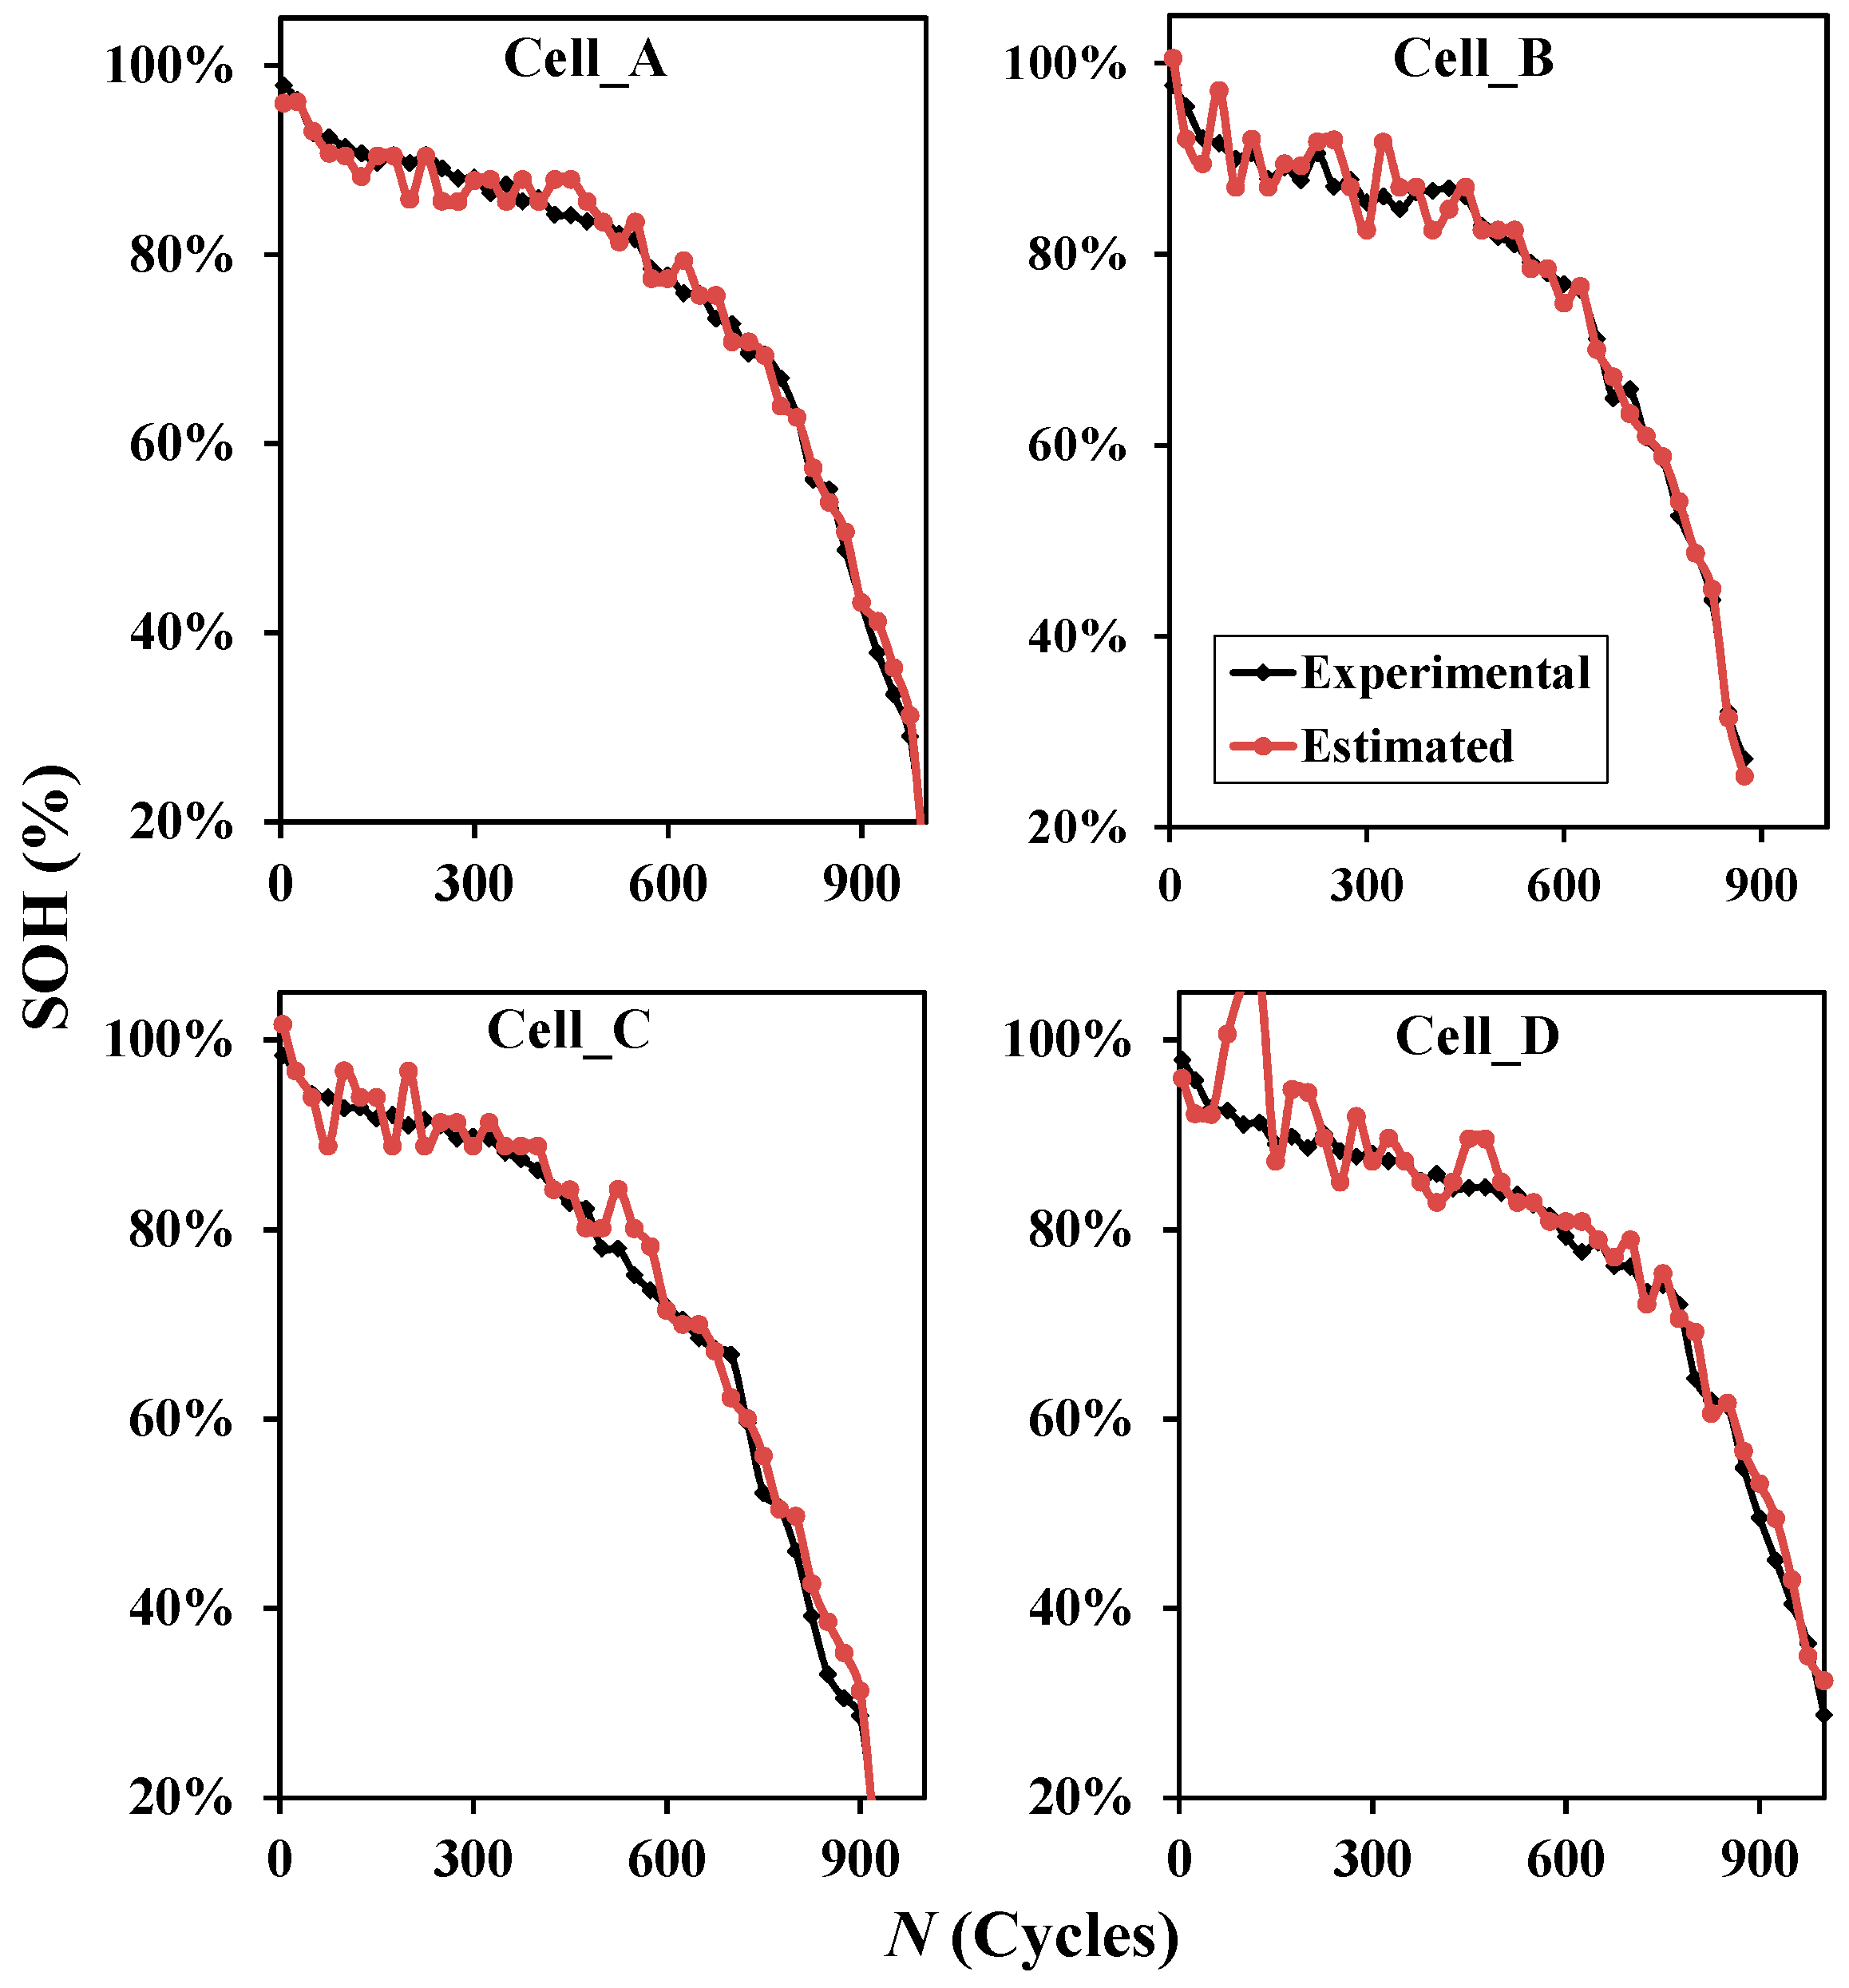
Figure 8.
SOC estimations (dots) and deviations from correct values (diagonals) from random samplings of cells A–D using cell A for model construction.
Figure 8.
SOC estimations (dots) and deviations from correct values (diagonals) from random samplings of cells A–D using cell A for model construction.

Figure 9.
Estimations and actual data of SOH from random samplings of cells A–D using cell A for model construction.
Figure 9.
Estimations and actual data of SOH from random samplings of cells A–D using cell A for model construction.


Figure 10.
SOC vs. V and estimation error in the different voltage range.
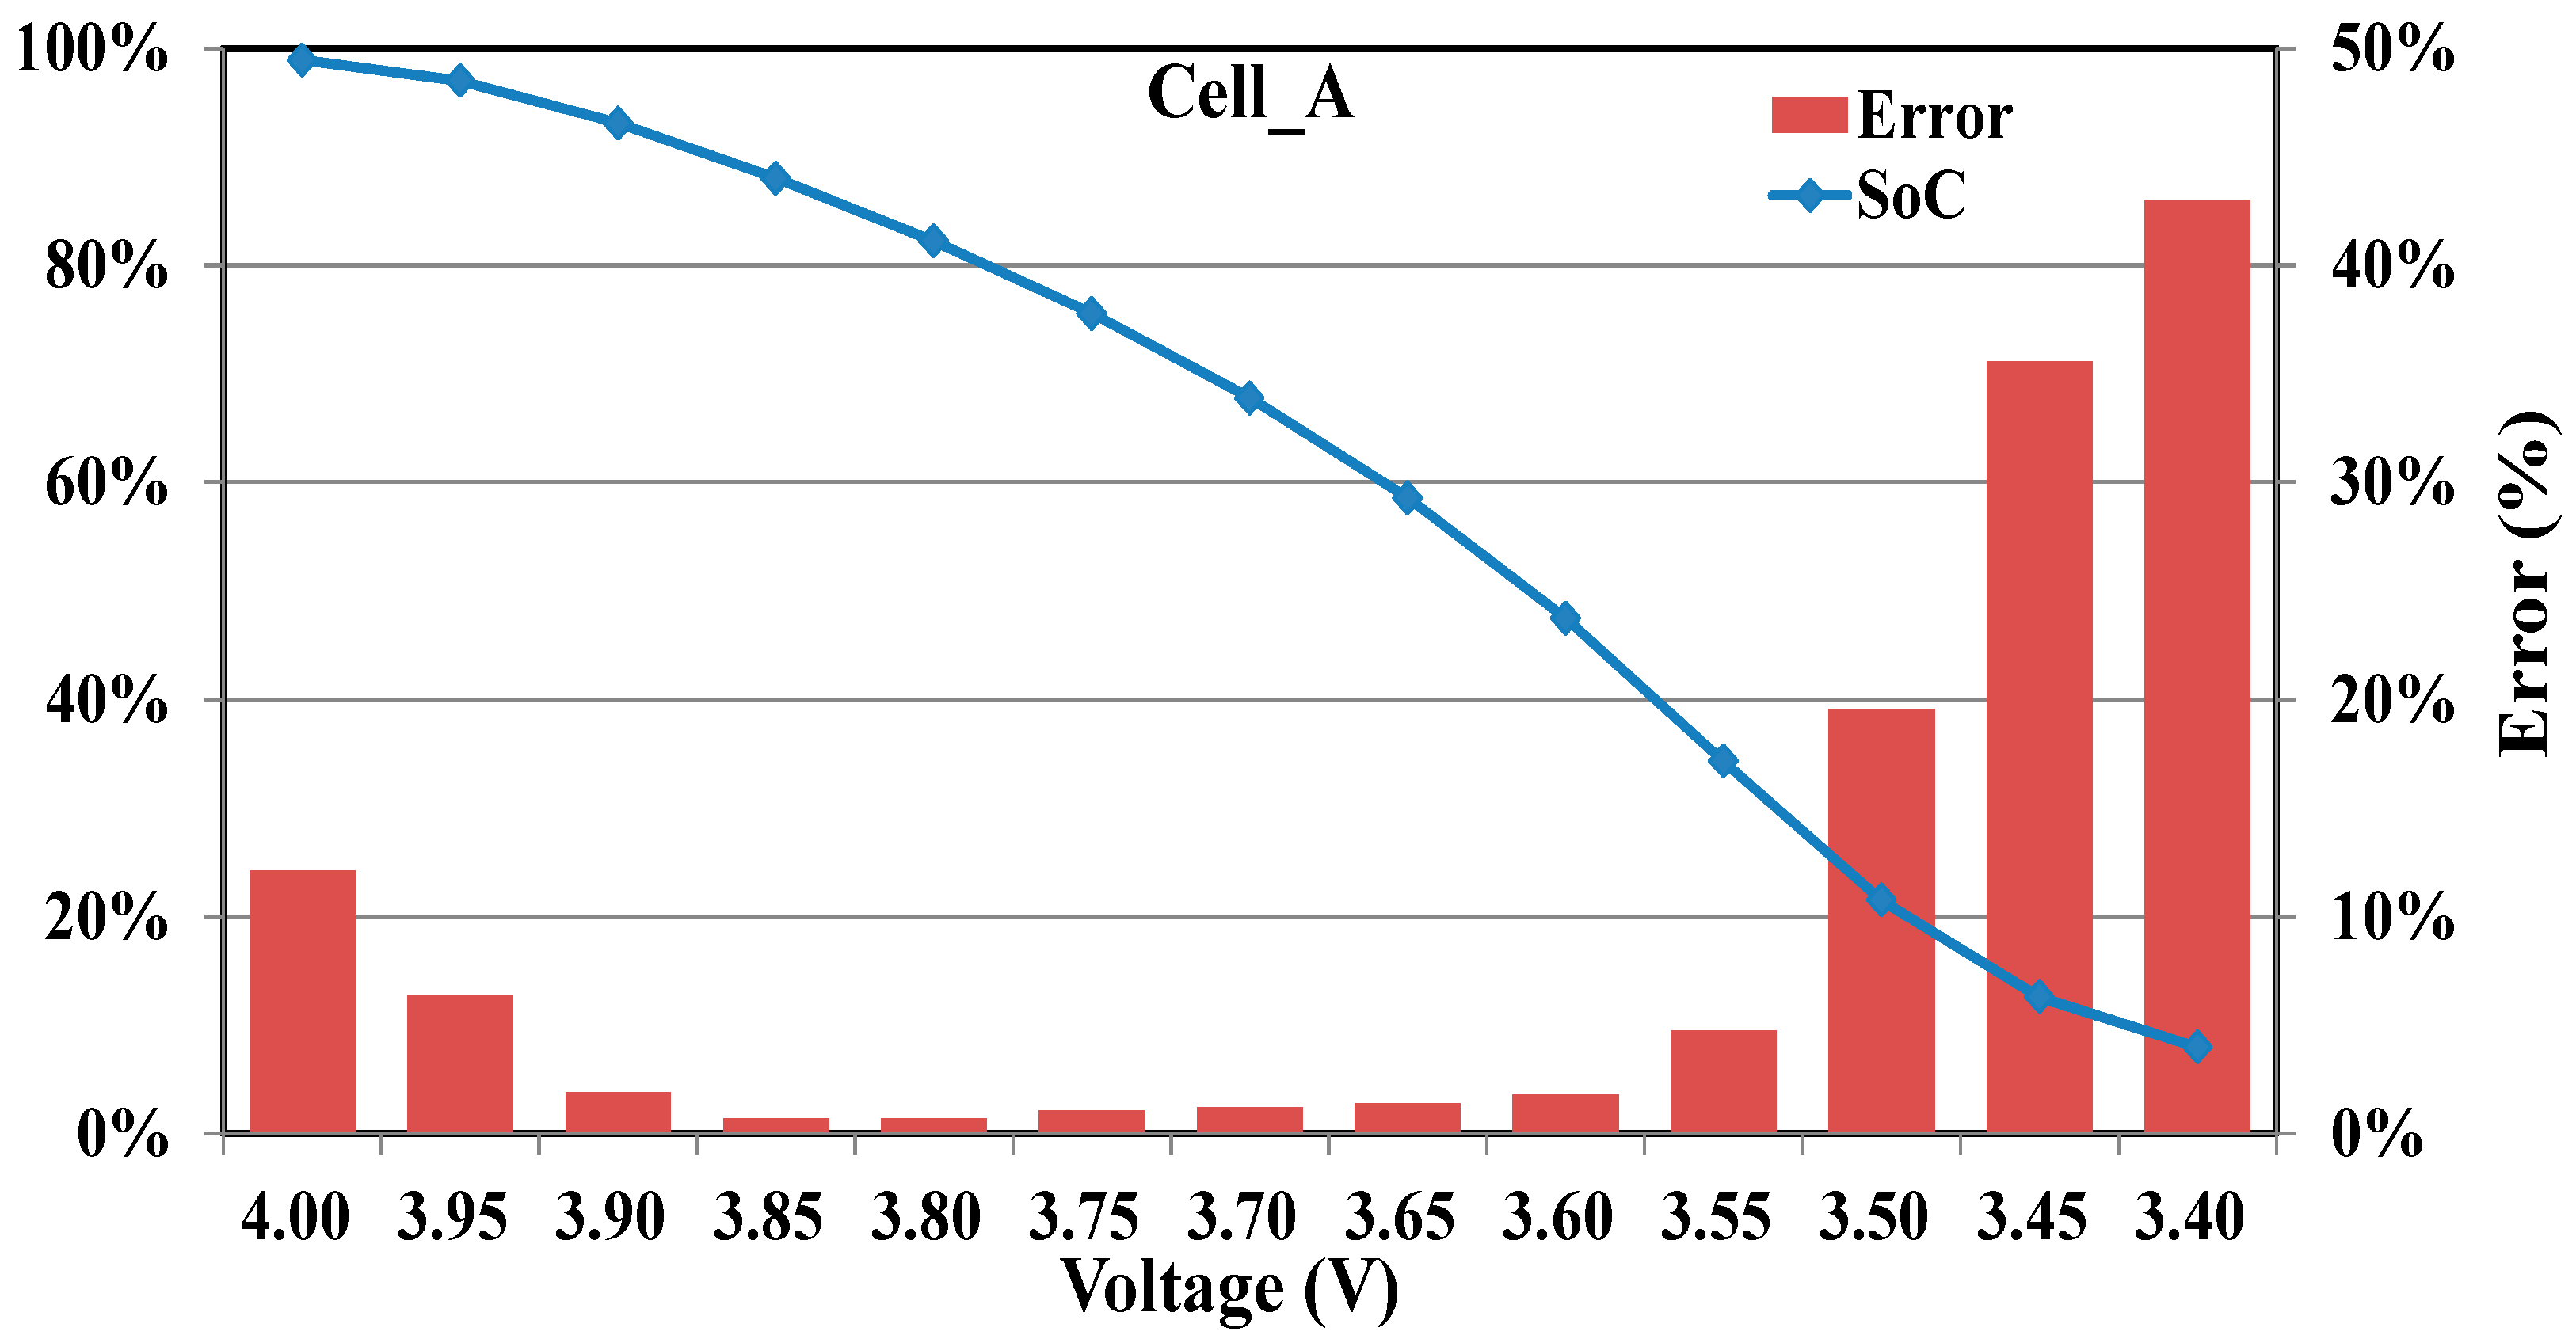
Figure 11.
Comparisons of the present and two existing models.

Table 1.
Average R2 and RMSE of the SOC estimations of all cells using cell A for model construction.
Table 1.
Average R2 and RMSE of the SOC estimations of all cells using cell A for model construction.
| Cell Name | Correlation and Error | 100 Cycles | 300 Cycles | 500 Cycles | 700 Cycles |
|---|---|---|---|---|---|
| Cell_A | R2 | 0.996 | 0.997 | 0.996 | 0.995 |
| RMSE | 0.0120 | 0.0114 | 0.0116 | 0.0168 | |
| Cell_B | R2 | 0.997 | 0.996 | 0.996 | 0.994 |
| RMSE | 0.0152 | 0.0237 | 0.0158 | 0.0208 | |
| Cell_C | R2 | 0.995 | 0.996 | 0.995 | 0.995 |
| RMSE | 0.0195 | 0.0120 | 0.0170 | 0.0222 | |
| Cell_D | R2 | 0.963 | 0.997 | 0.997 | 0.996 |
| RMSE | 0.1222 | 0.0099 | 0.0101 | 0.0128 |
Table 2.
R2 and RMSE of the SOH estimations of all cells using cell A for the model construction.
| Statistical Parameters | Cell_A | Cell_B | Cell_C | Cell_D |
|---|---|---|---|---|
| Data points | 42 | 36 | 39 | 41 |
| R2 | 0.991 | 0.982 | 0.985 | 0.947 |
| RMSE | 0.0262 | 0.0394 | 0.0361 | 0.0458 |
Table 3.
SOC model coefficients using different cells as training data.
| Cell Name | Data Points | R2 | a | b | c |
|---|---|---|---|---|---|
| Cell_A | 1808 | 0.99 | 0.99 | −0.036 | −2.82 |
| Cell_B | 1730 | 0.99 | 0.87 | −0.043 | −2.31 |
| Cell_C | 1737 | 0.99 | 0.92 | −0.039 | −2.53 |
| Cell_D * | 1588 | 0.99 | 0.97 | −0.038 | −2.73 |
* Data for the first 150 cycles were removed due to an anomaly.
Table 4.
SOH model and α’s coefficients using different cell(s) as training data.
| Model Construction | A | B | C1 | C2 | C3 | C0 | |
|---|---|---|---|---|---|---|---|
| Single cell | A | 0.16 | 0.04 | −0.82 | 3.32 | −1.48 | 0.71 |
| B | 0.15 | 0.06 | −0.30 | 2.35 | −0.96 | 0.64 | |
| C | 0.16 | 0.03 | −0.88 | 3.50 | −1.60 | 0.72 | |
| D | 0.15 | 0.06 | −1.38 | 4.05 | −1.75 | 0.74 | |
| Two cells | A, B | 0.16 | 0.05 | −0.55 | 2.83 | −1.22 | 0.67 |
| A, C | 0.16 | 0.02 | −0.77 | 3.33 | −1.51 | 0.71 | |
| A, D | 0.16 | 0.03 | −0.98 | 3.56 | −1.56 | 0.71 | |
| B, C | 0.16 | 0.03 | −0.44 | 2.75 | −1.20 | 0.66 | |
| B, D | 0.15 | 0.08 | −0.95 | 3.31 | −1.39 | 0.69 | |
| C, D | 0.16 | 0.04 | −1.08 | 3.73 | −1.66 | 0.72 | |
| Three cells | A, B, C | 0.16 | 0.03 | −0.57 | 2.95 | −1.30 | 0.68 |
| A, C, D | 0.16 | 0.03 | −0.94 | 3.54 | −1.58 | 0.71 | |
| B, C, D | 0.16 | 0.04 | −0.76 | 3.20 | −1.39 | 0.69 | |
| Four cells | A, B, C, D | 0.16 | 0.03 | −0.74 | 3.19 | −1.40 | 0.69 |
Table 5.
R2 and RMSE of SOC estimations using different cells for model construction.
| Model Construction | Correlation and Error | Cell_A | Cell_B | Cell_C | Cell_D |
|---|---|---|---|---|---|
| Cell_A | R2 | 0.99 | 0.98 | 0.99 | 0.99 |
| RMSE | 0.015 | 0.024 | 0.019 | 0.014 | |
| Cell_B | R2 | 0.99 | 0.99 | 0.99 | 0.99 |
| RMSE | 0.020 | 0.019 | 0.021 | 0.019 | |
| Cell_C | R2 | 0.99 | 0.99 | 0.99 | 0.99 |
| RMSE | 0.016 | 0.022 | 0.018 | 0.015 | |
| Cell_D | R2 | 0.99 | 0.99 | 0.99 | 0.99 |
| RMSE | 0.016 | 0.024 | 0.019 | 0.014 |
Table 6.
RMSE of the SOH estimations using different cell(s) for the model construction.
| Model Construction | RMSE | ||||
|---|---|---|---|---|---|
| Cell_A | Cell_B | Cell_C | Cell_D | ||
| Single cell | A | 0.044 | 0.047 | 0.043 | 0.054 |
| B | 0.045 | 0.043 | 0.041 | 0.051 | |
| C | 0.044 | 0.044 | 0.041 | 0.051 | |
| D | 0.043 | 0.042 | 0.038 | 0.049 | |
| Two cells | A-B | 0.044 | 0.045 | 0.042 | 0.052 |
| A-C | 0.044 | 0.047 | 0.043 | 0.054 | |
| A-D | 0.044 | 0.046 | 0.042 | 0.052 | |
| B-C | 0.045 | 0.045 | 0.042 | 0.052 | |
| B-D | 0.043 | 0.042 | 0.038 | 0.048 | |
| C-D | 0.044 | 0.044 | 0.040 | 0.051 | |
| Three cells | A-B-C | 0.044 | 0.045 | 0.042 | 0.053 |
| A-C-D | 0.044 | 0.045 | 0.041 | 0.052 | |
| B-C-D | 0.044 | 0.044 | 0.041 | 0.051 | |
| Four cells | A-B-C-D | 0.044 | 0.045 | 0.041 | 0.052 |
Table 7.
Online SOC and SOH estimation errors of the four cells in the random sampling test.
| Parameters | Sampling Data | Cell_A | Cell_B | Cell_C | Cell_D |
|---|---|---|---|---|---|
| SOC | all | 1.52% | 2.23% | 1.93% | 1.30% |
| normal range | 1.24% | 1.17% | 1.28% | 1.10% | |
| SOH | all | 2.13% | 3.35% | 2.65% | 1.69% |
| normal range | 1.53% | 1.58% | 1.72% | 1.43% |
Note: Normal range included on SOH > 75% sampling points.
Table 8.
Comparisons of the present SOH model with the bi-variable SOH model [39].
Table 8.
Comparisons of the present SOH model with the bi-variable SOH model [39].
| Statistical Parameters | Bi-Variable Polynomial | Bi-Variable Exponential | The Present |
|---|---|---|---|
| Model variables | Vdis, R | Vdis, R | V, 1/V′ |
| Correlation | −0.98/−0.98 | −0.98/−0.98 | 0.99 |
| Data points | 40 | 40 | 42 |
| R2 | 0.967 | 0.971 | 0.996 |
| RMSE | 0.0399 | 0.0375 | 0.0264 |
© 2017 by the authors. Licensee MDPI, Basel, Switzerland. This article is an open access article distributed under the terms and conditions of the Creative Commons Attribution (CC BY) license (http://creativecommons.org/licenses/by/4.0/).
Share and Cite
MDPI and ACS Style
Huang, S.-C.; Tseng, K.-H.; Liang, J.-W.; Chang, C.-L.; Pecht, M.G. An Online SOC and SOH Estimation Model for Lithium-Ion Batteries. Energies 2017, 10, 512. https://doi.org/10.3390/en10040512
AMA Style
Huang S-C, Tseng K-H, Liang J-W, Chang C-L, Pecht MG. An Online SOC and SOH Estimation Model for Lithium-Ion Batteries. Energies. 2017; 10(4):512. https://doi.org/10.3390/en10040512
Chicago/Turabian StyleHuang, Shyh-Chin, Kuo-Hsin Tseng, Jin-Wei Liang, Chung-Liang Chang, and Michael G. Pecht. 2017. "An Online SOC and SOH Estimation Model for Lithium-Ion Batteries" Energies 10, no. 4: 512. https://doi.org/10.3390/en10040512
Note that from the first issue of 2016, this journal uses article numbers instead of page numbers. See further details here.