Article

Supercapacitor State Based Control and Optimization for Multiple Energy Storage Devices Considering Current Balance in Urban Rail Transit

School of Electrical Engineering, Beijing Jiaotong University, No. 3 Shangyuancun, Beijing 100044, China
*
Author to whom correspondence should be addressed.
Energies 2017, 10(4), 520; https://doi.org/10.3390/en10040520
Submission received: 17 February 2017 / Revised: 6 April 2017 / Accepted: 7 April 2017 / Published: 12 April 2017

Abstract

:
The use of supercapacitors (SCs) to store regenerative braking energy from urban rail trains is able to achieve a good energy saving effect. This paper analyzes the current balance method of stationary energy storage devices (ESDs). At the beginning of the paper, the mathematical model of the DC traction power system, which includes trains, ESDs and traction substations, is established. Next, based on this, the SC state-based control strategy (SCSCS) is proposed, which can adjust the charging voltage of the ESD according to the SC voltage and current, then the charging current of the ESD can be reasonably distributed under the voltage difference of ESDs, and the SC voltage and current stress can be reduced. In order to determine the optimal controlling parameters, the optimization model is proposed and solved by the genetic algorithm. The analysis of the case study also shows the effectiveness of the proposed control strategy and optimization algorithm. Finally, the rationality of the proposed strategy is verified by experiments.

1. Introduction

Recently, more and more urban rail transit systems are adopting energy storage devices (ESDs) to recover the regenerative braking energy, or to stabilize the traction network voltage. Batteries, flywheels, supercapacitors (SCs), etc., are typically used as the energy storage elements for the ESDs [1,2,3,4]. Battery storage with the advantage of high energy density for the situations where a large amount of energy must be reserved is widely used [5]; however, this relatively restricted the development with a small power density and short service life, and maybe, new material components can be used in the future [6]. The action mechanism of the flywheel is similar to SC, but stored as kinetic energy. The supercapacitor with the advantages of high power density, long cycle life period and wide temperature range has become the most suitable storage component matched with the operation characteristics of urban rail transit.
The performance of supercapacitors varies due to the different electrode or electrolyte materials. Carbon electrodes are widely used with the advantages of low cost and high surface area. The metal oxide electrode material has high capacitance and low internal resistance, but the cost and the rated voltage are not high. The high voltage of SC can be achieved by using organic electrolyte, but it has a large internal resistance, which limits the maximum available power of the SC. Compared with the organic electrolyte, the rated voltage of aqueous electrolyte SC is not high, but the price is low [5,7,8].
As the supercapacitor’s (SC) production technology is quite mature, ESD based on SC has been applied in a number of urban rail lines all over the world. Bombardier developed the MITRAC (Modular Integrated TRACtion) [2,9] energy saver using SC with a capacity of 1 kWh and a maximum power of 300 kW. Siemens uses SC with a capacity of 2.5 kWh and peak power of 700 kW for SITRAS-SES (Static Energy Storage System) [2,10], which has already been in operation in Bochum, Cologne, Dresden, Madrid and Beijing.
There have been many related research works on the application of ESD and the problems of the energy management strategy, and the capacity configuration of ESD have been studied by [11,12,13,14,15,16]; and in [17,18,19,20,21,22,23,24], the control strategy of ESD has been studied. In [17,18], a control strategy considering acceleration and state of charge (SOC) of SC was proposed to reduce the impact of regenerative braking energy on the traction network voltage; however, this paper only considered a single ESD wherever in modeling, simulation or experiment. In [19], the method of determining the basic characteristic parameters of the stationary ESD using nonlinear programming was proposed, and the randomization of the train operation was considered in the design, but the specific optimization procedure was not given in the paper. In [20], the proposed control strategy could predict the maximum kinetic energy of the ESD based on the traction force and acceleration of the train, but the author did not give the correlation coefficients’ calculation method of the SC voltage command. The power flow controller in [21] was designed based on the traction network voltage and SOC of SC, and the operating range of the ESD was divided according to the traction network voltage; however, this algorithm would cause oscillation for the reason that it ignored the matching between the ESD’s charging power and the train’s braking power. In [22], a small signal model of the ESD was established, and the three closed-loop control strategy based on the traction network voltage, SC voltage and current was presented. However, Due to the large time constant of the supercapacitor, the bandwidth of the bus voltage loop is pulled down, and the low value of the bus voltage loop bandwidth does not have a fast response to the dynamic changes of the DC bus voltage.
In fact, none of the above discussed papers take the current balance of ESDs into account. Additionally, in the process of analyzing and designing control strategies, it is not only necessary to consider the control of a single ESD, but also to take the current balance of the storage devices into account, which the papers above have neglected. In this paper, the current balancing problem of distributed SC-ESD is discussed. When the train is running under the traction network, the position and time distribution of the train is not uniform for the reason that the train’s movement is influenced by the line slope, operating diagram and so on. If the control strategy of the ESD is designed without considering the current balance strategy, some ESDs need to bear a relatively large amount of work load, while others just bear a little, so the devices with large working load will prematurely age, and this situation is what we do not want to see. Therefore, we propose the SC state-based control strategy (SCSCS) aiming at solving the current balance problem to make the charging current of the devices tend to be the same, namely the working load of the supercapacitors tend to be the same.
The remainder of this paper is organized as follows. In Section 2, the ESD’s operating model is established, and the operating characteristics of the proposed SCSCS are analyzed, then the effects of the controlling parameters on the system are studied, as well. In addition, in order to achieve the optimal effect of the balanced flow, the optimized controlling parameters of the SCSCS are proposed in Section 3. Finally, in Section 4 the effectiveness of the proposed control strategy is proven via experiments, and the concluding remarks are given in final.

2. The Model and Control of ESD

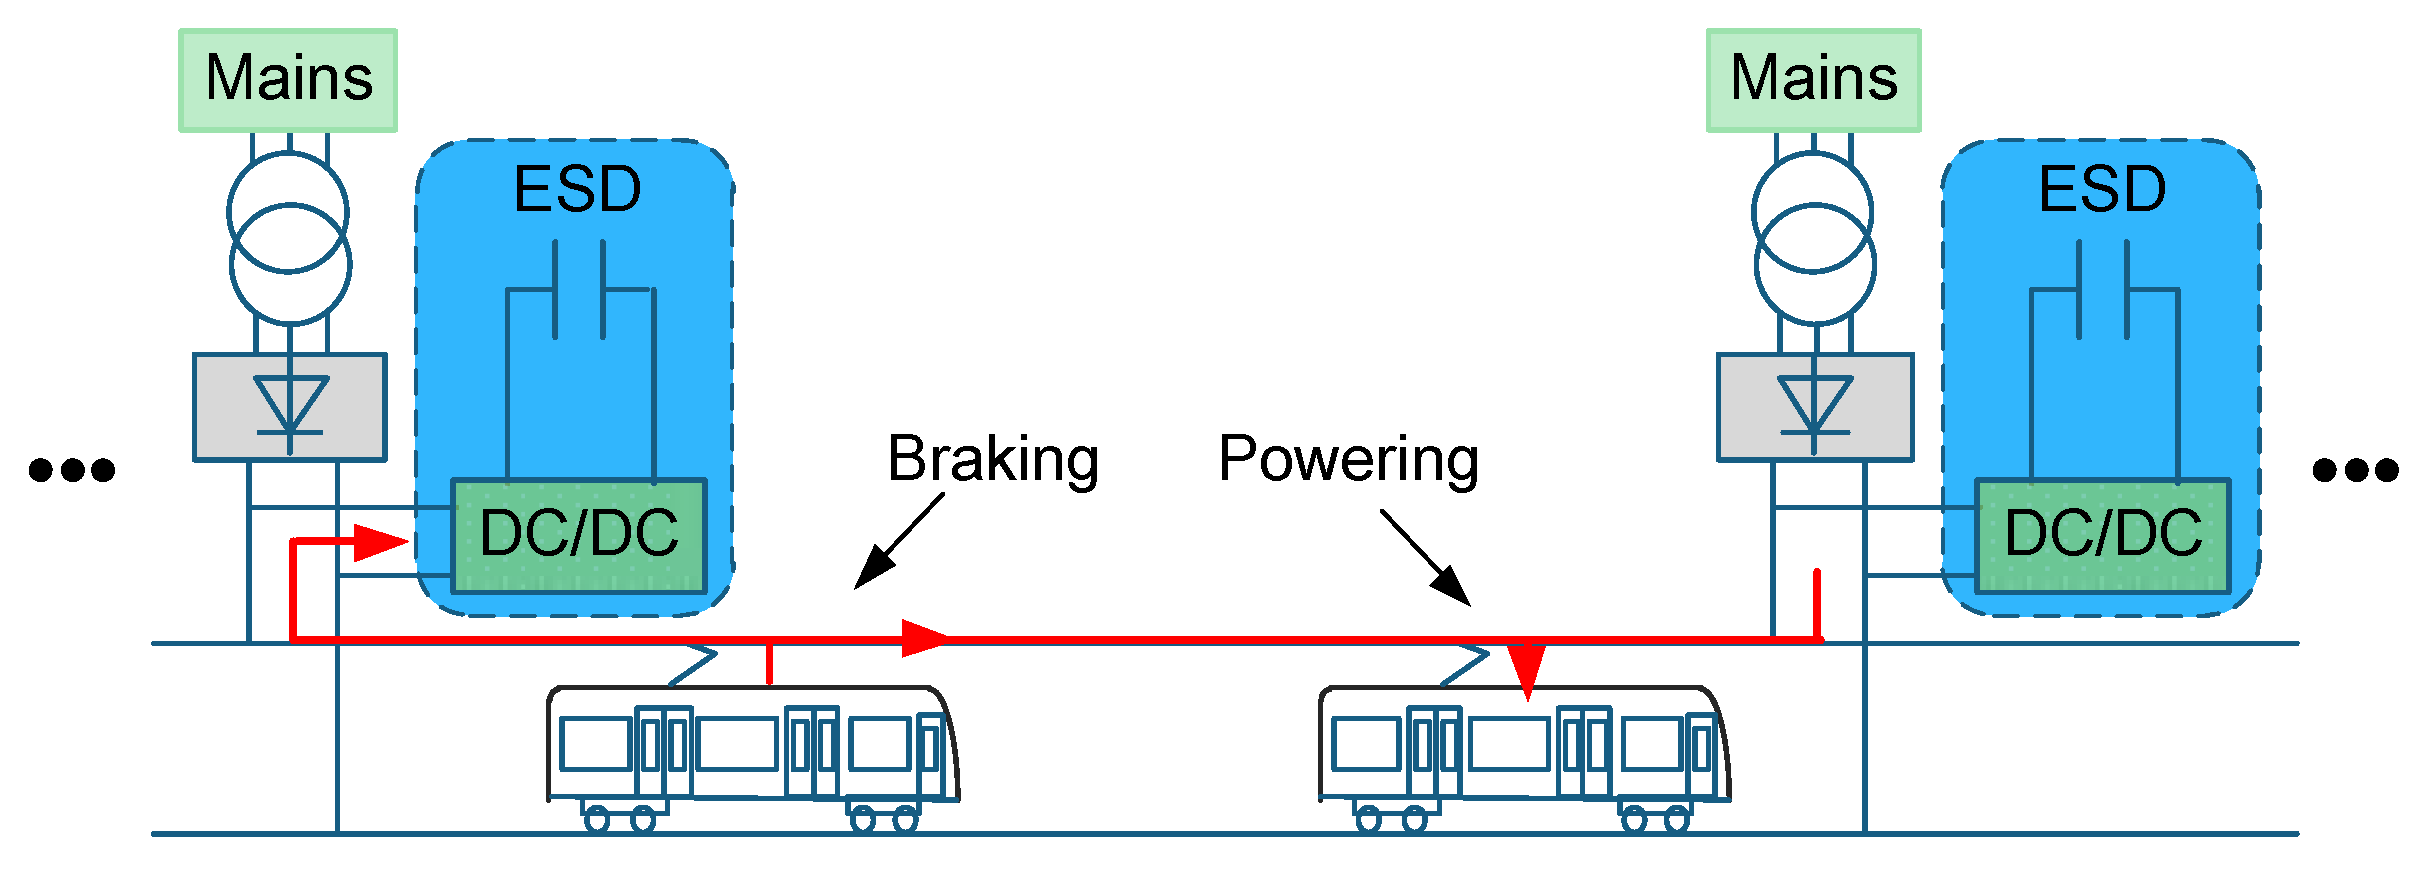
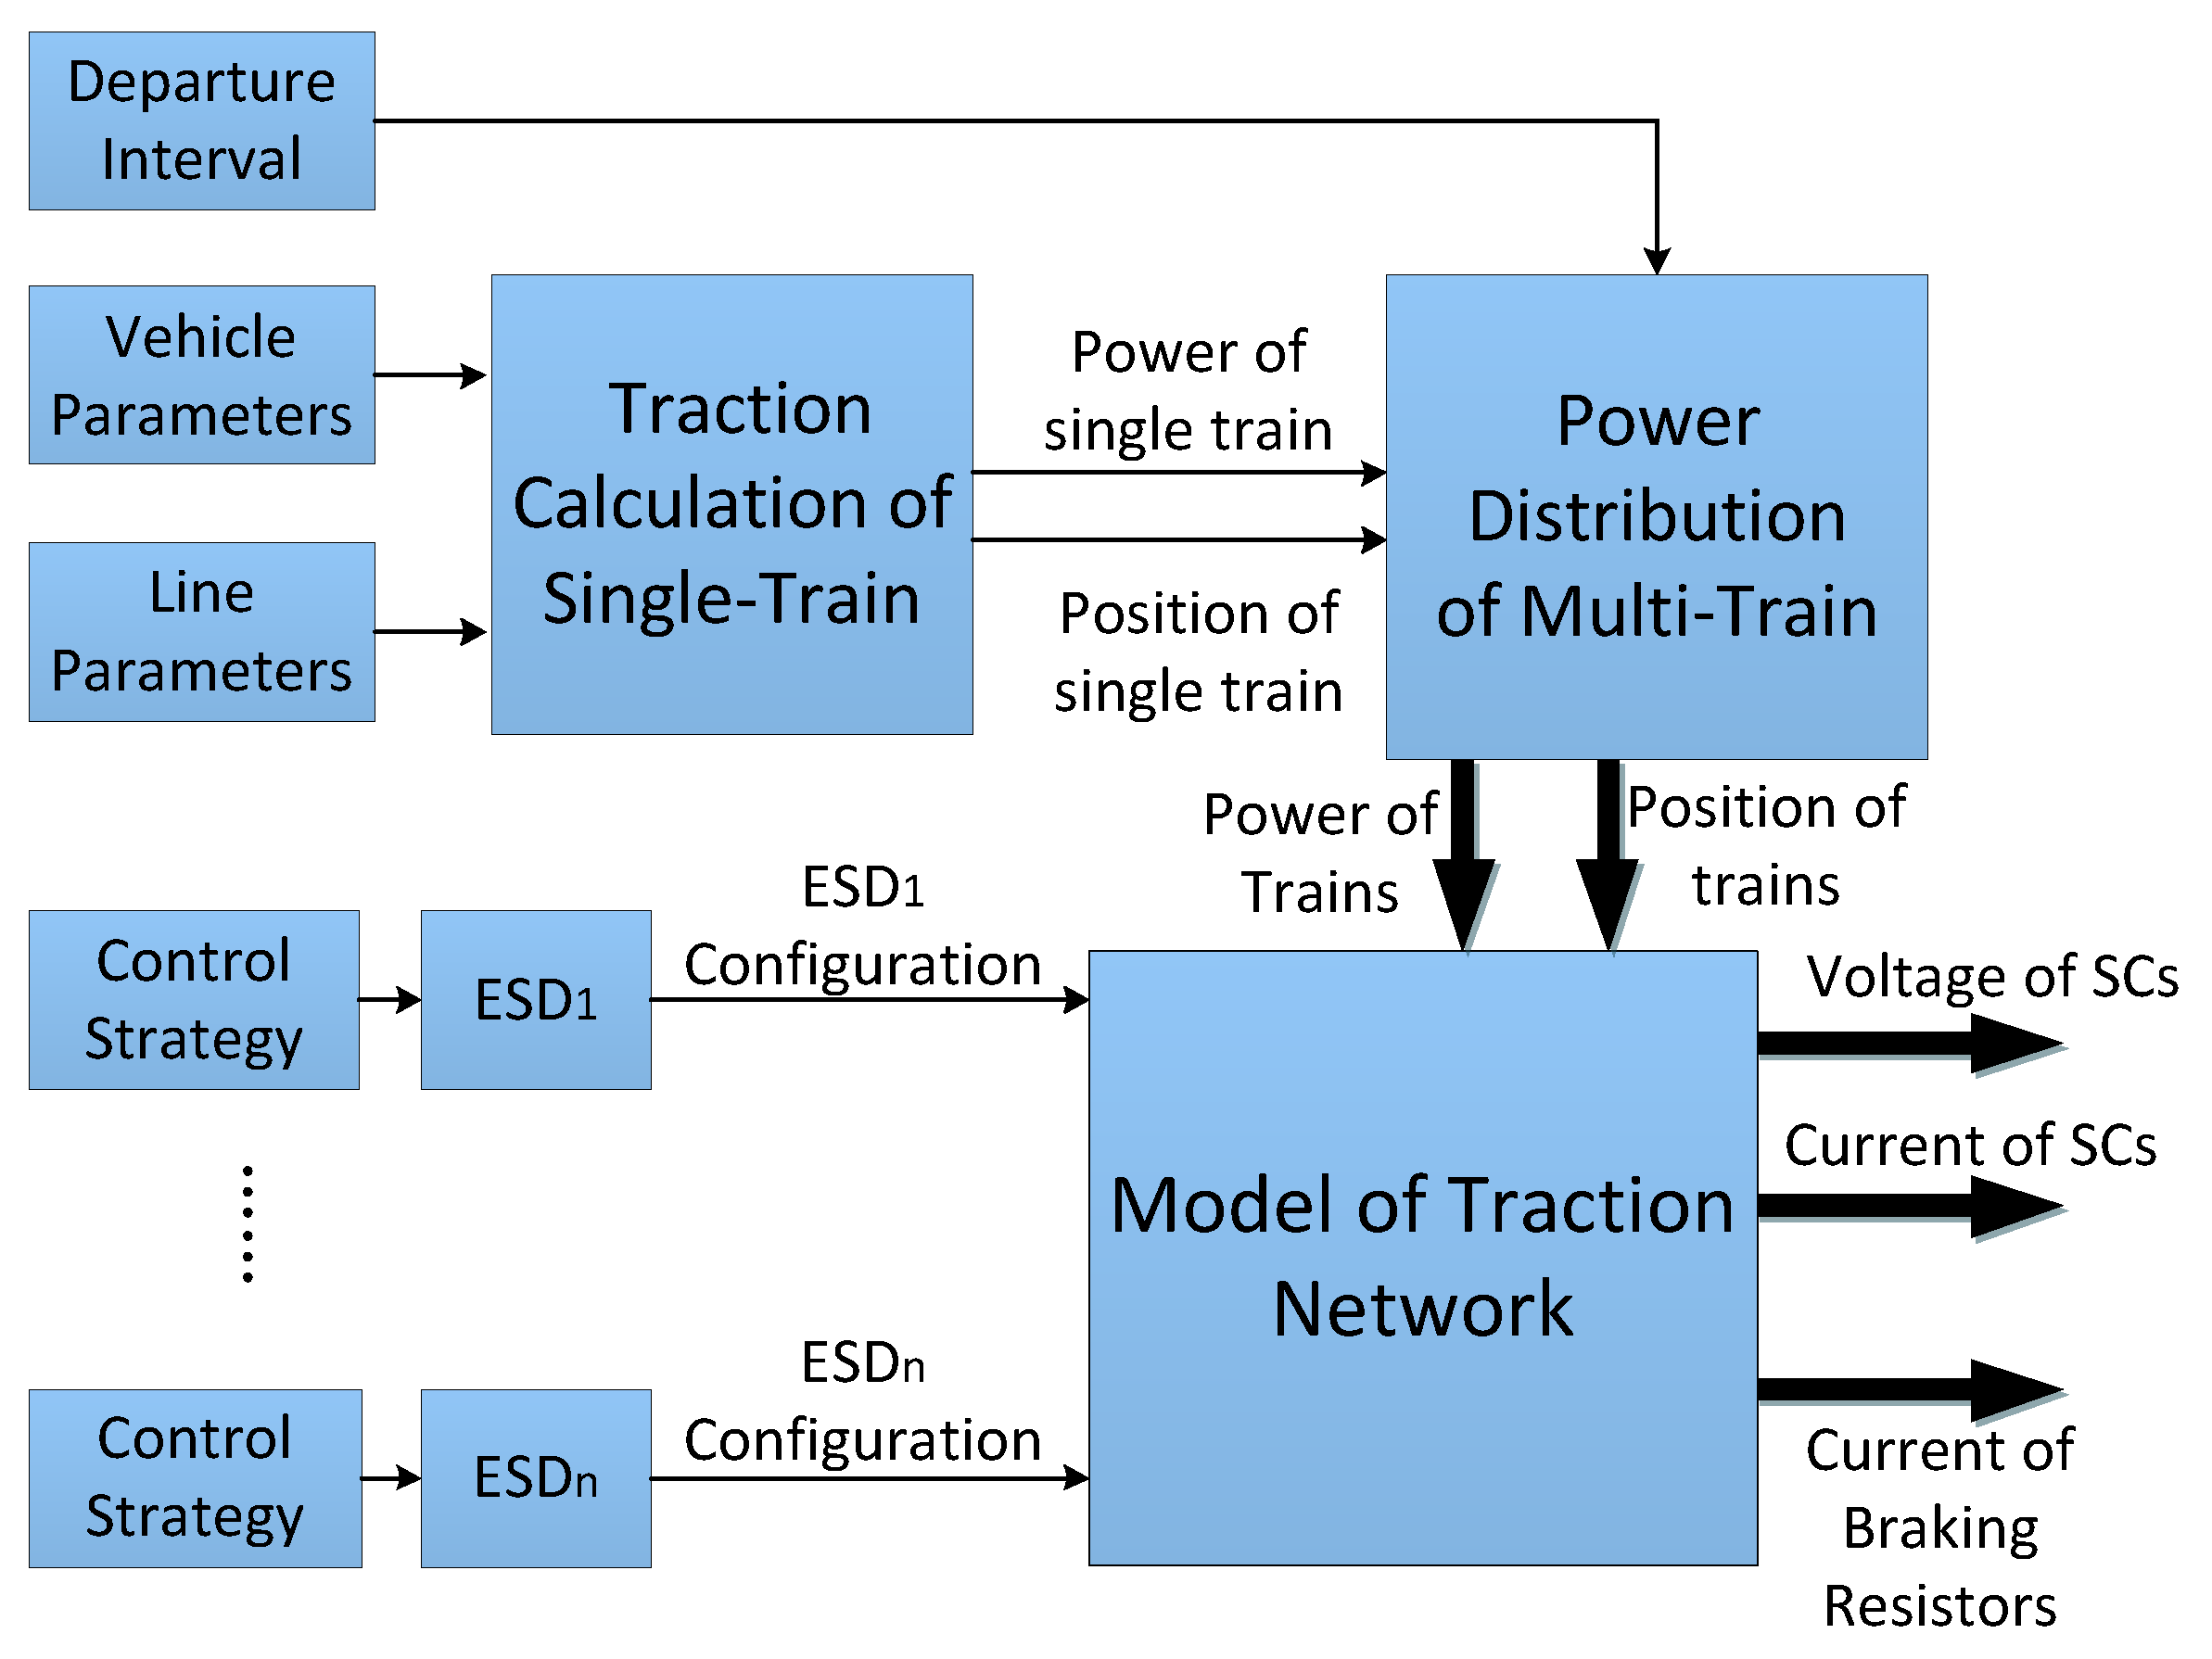
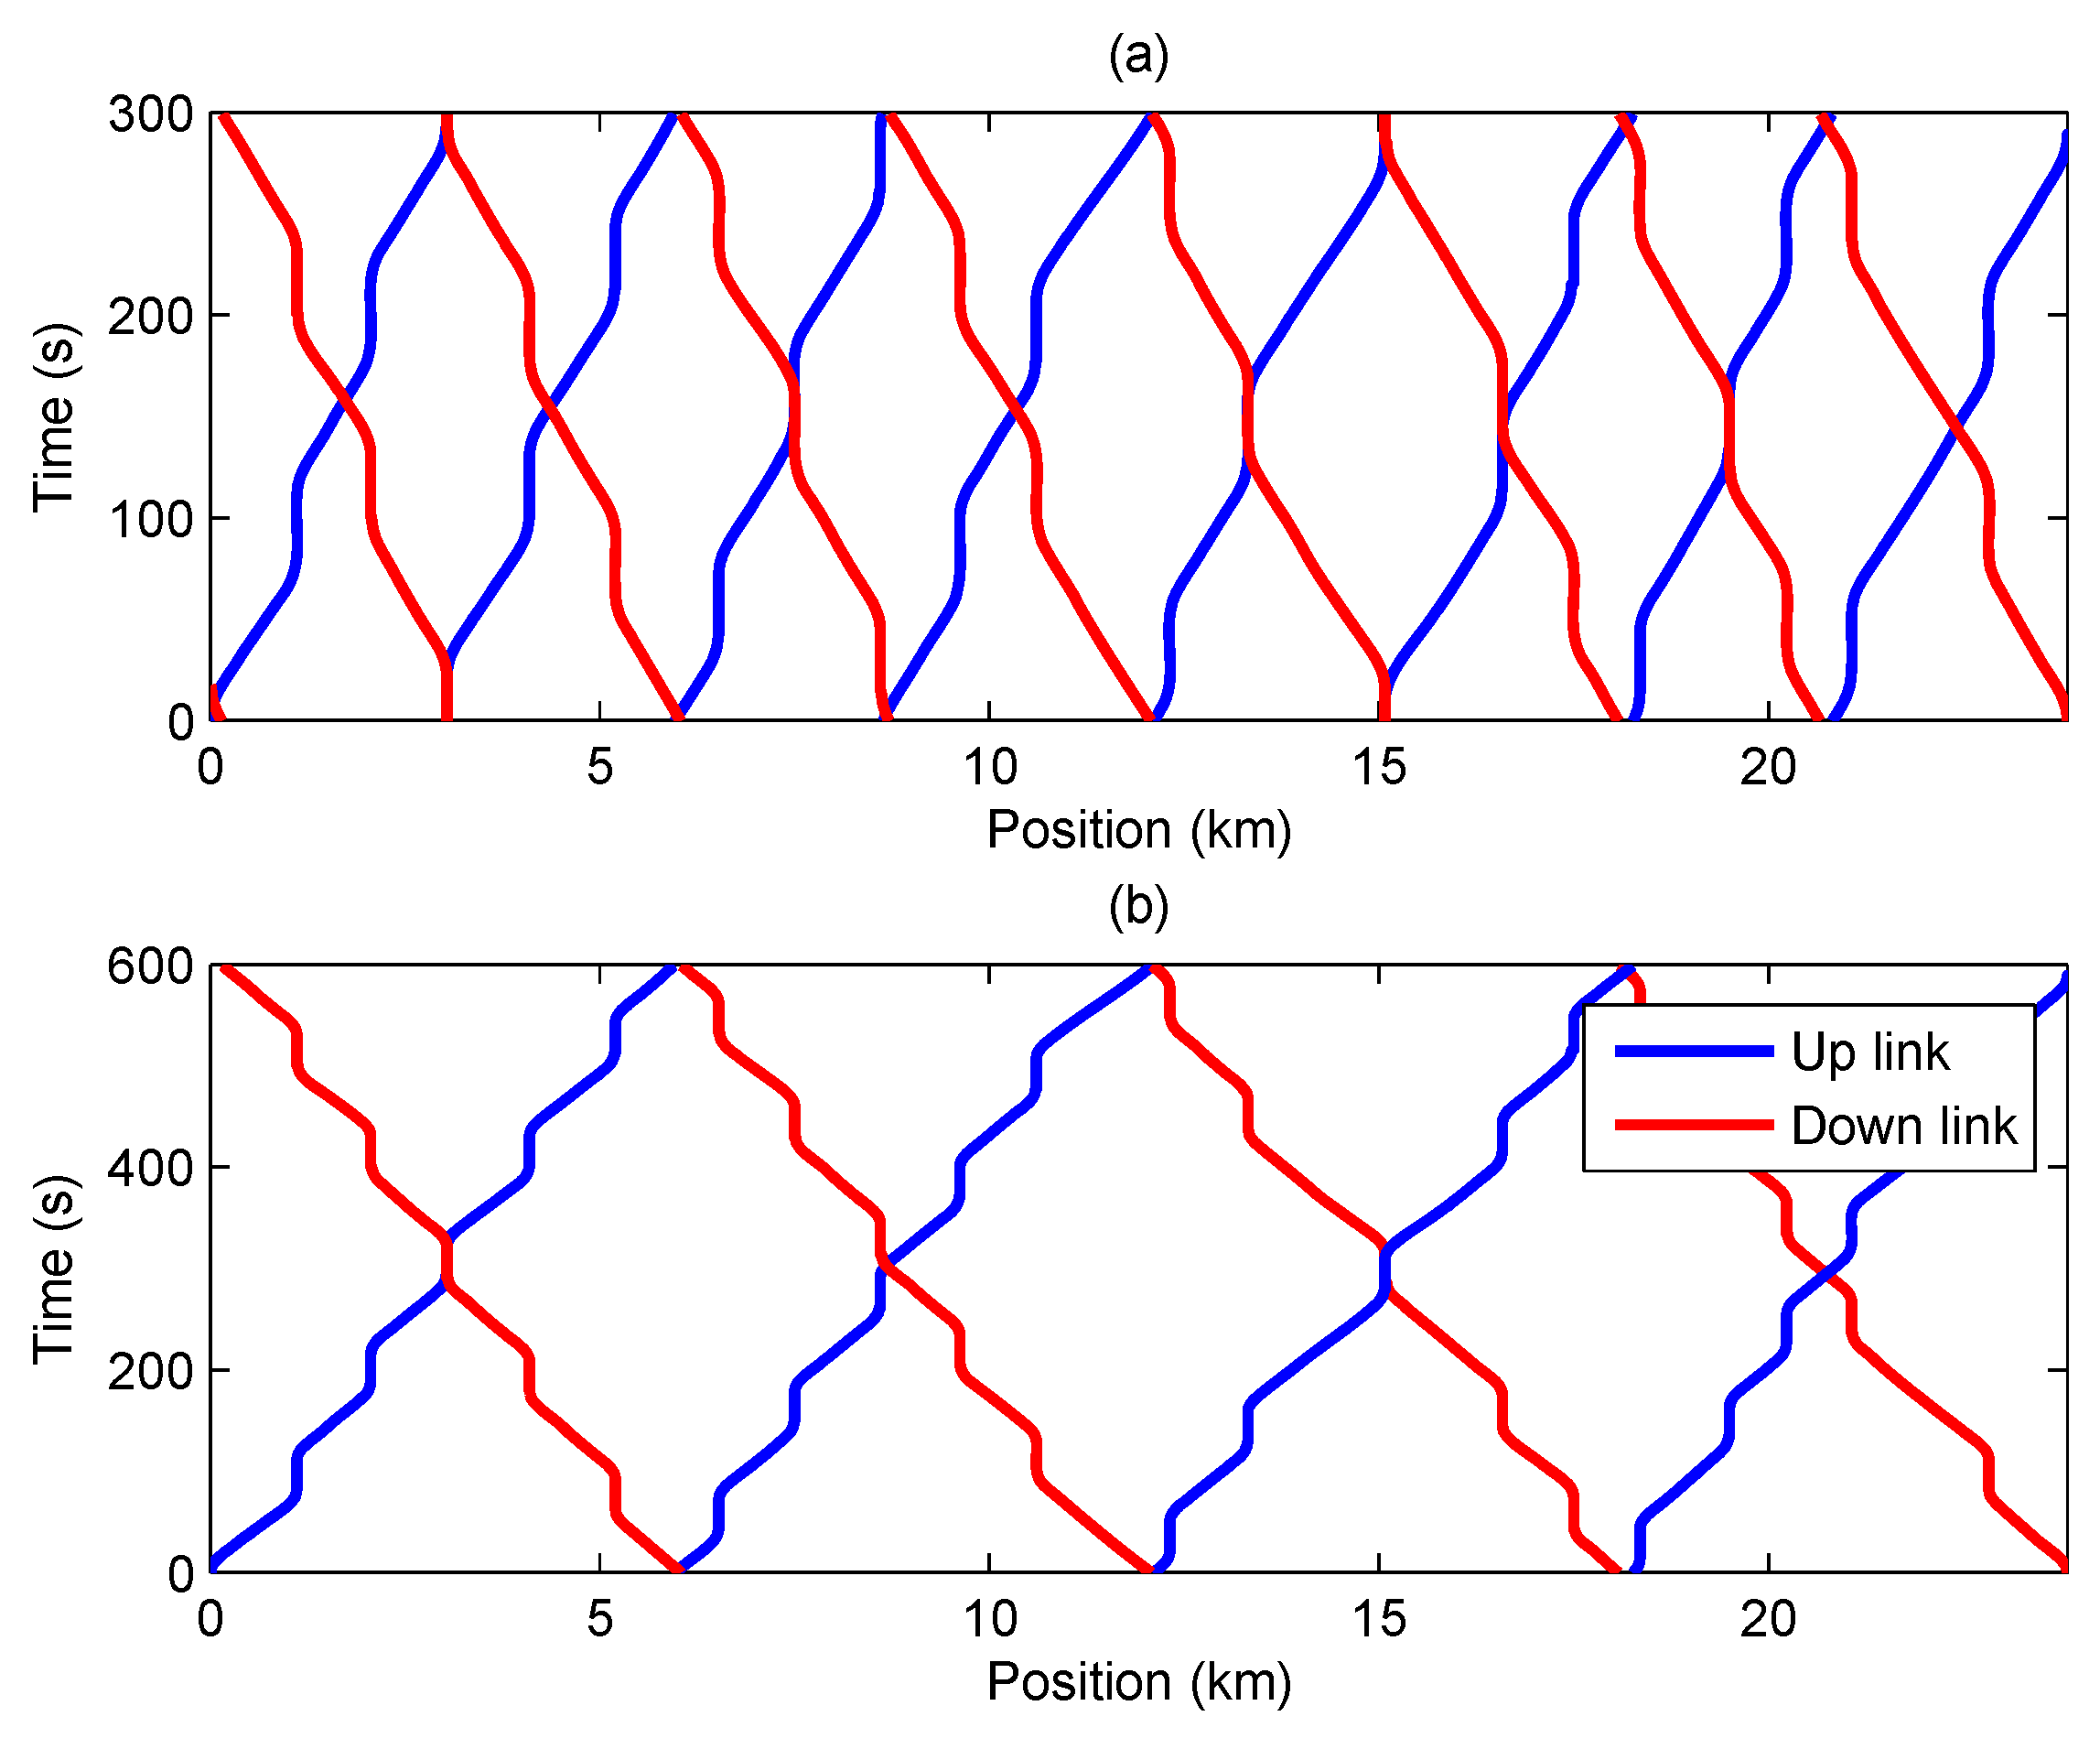
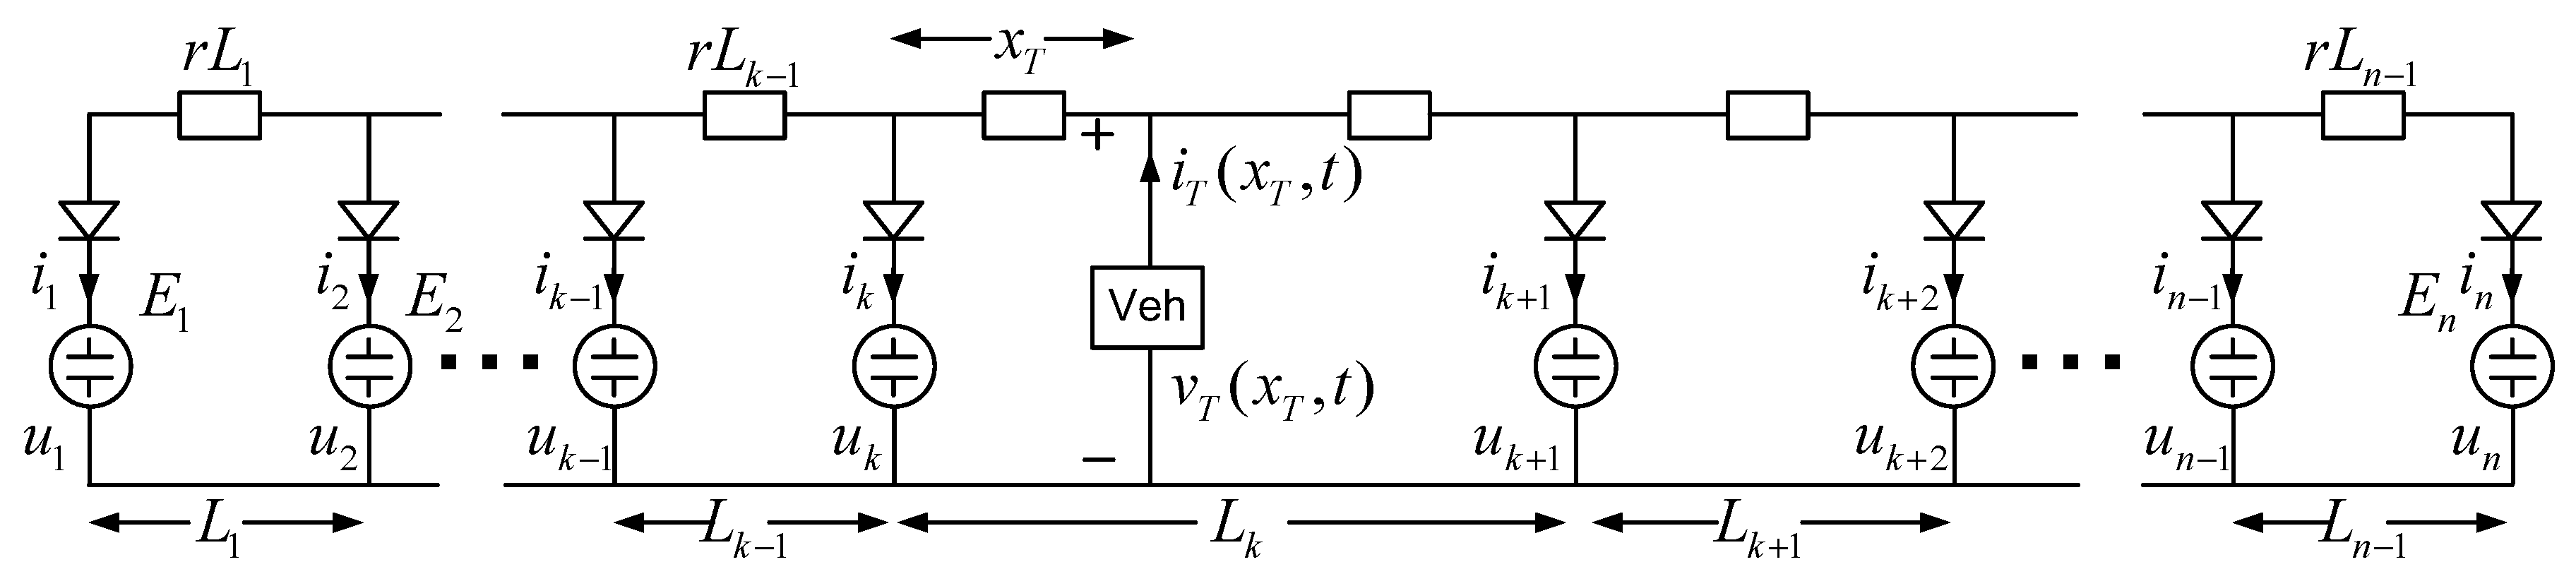
2.1. The Traction Power Supply System Model of Urban Rail Transit

The structure diagram of the urban rail DC traction power system to which SC-ESD is applied is shown in Figure 1. The system includes the traction substations, trains and SC-ESDs. The ESD and traction substation are in parallel and are connected with trains through the traction power network. The traction substation is only able to change the AC power into DC power with the use of the diode rectifier, which does not have the characteristic of reversibility. The ESD and traction substation supply energy to traction trains at the same time. When the trains are braking, the surplus regenerative braking energy is recycled by the ESDs and stored in the SCs.
In order to analyze the operating characteristics, the mathematical model of the DC traction power system is required. Therefore, this paper integrates the model of the SC-ESD, the train and the traction substation into the DC traction power system model, after which, further research can be carried out. Meanwhile, in order to reveal the nature of the system, this paper makes the following simplifications and assumptions for the DC traction power system:
1. The charging voltage threshold of ESD is higher than the no-load voltage of the traction substation, and when the train is braking, the ESD is charged, at which time the traction network voltage is higher than the no-load voltage of the traction substation and, at the same time, the traction substation is out of operation; due to the reverse cut-off characteristic of the rectifier unit, the model does not include the traction substation.
2. The power of the ESD and capacity of the SC are sufficiently large, which will not cause the failure of the train’s regenerative braking. Thus, the brake resistor does not work.
3. The response time of the ESD is short enough, so that there is no deviation between the charging voltage instruction value and the actual value.
4. The ESD is installed in each traction substation.
According to the above simplifications and hypothesis, the model can be obtained as shown in Figure 2. E 1 E n display the ESDs, where n is the number of traction substations, i j and u j show the charging current and charging threshold voltage of j-th ESD, j ranges from one to n, VEH is the train, r is the unit resistance of the railway, L j shows the distance between j-th station and j + 1 -th station, x T is the distance from the train to the k-th station and i T ( x T , t ) and v T ( x T , t ) are the current and the voltage of the train. In the model, the train is braking between the k-th station and k + 1 -th station. This operation will lead to the voltage of the traction power network increasing and trigger the ESD to change into the charging mode, while at the same time, the regenerative braking current flows to the ESD through the traction network.
On the basis of Figure 2, the line’s current equation and voltage equation at the left and right side of the train are expressed as (1), and (2) will be obtained from it.
v T ( x T , t ) = r x T j = 1 k i j + u k v T ( x T , t ) = r ( L k x T ) j = k + 1 n i j + u k + 1 i T ( x T , t ) = j = 1 n i j
v T ( x T , t ) = i T ( x T , t ) r x T ( 1 x T L k ) + u k ( 1 x T L k ) + u k + 1 x T L k i k = i T ( x T , t ) ( 1 x T L k ) + u k + 1 u k r L k j = 1 k i j i k + 1 = i T ( x T , t ) x T L k + u k u k + 1 r L k j = k + 1 n i j
Based on (2), it is known that i k and i k + 1 are influenced by the distance x T from the train to k-th substation; meanwhile, i k + 1 is larger and i k is smaller, while x T is larger, for the reason that the larger x T means the greater impedance between the train and the k-th substation; and the train’s braking current absorbed by the k-th substation is small, while the braking current absorbed by the k + 1 -th is large.
The charging current of other ESDs can be found in Figure 2 and is able to be expressed as (3) and (4). The two equations respectively stand for the charging current at the left and the right side of train, and it is obvious that the expressions of the charging current of the ESD on the left and right sides of the train are symmetrical. The train’s terminal voltage v T can be obtained from (2). v T is influenced by a large number of factors, including the train braking current i T , the point of the train x t , impedance per unit line r, charging voltage u k and u k + 1 for adjacent ESDs, while the regenerative braking voltage is not affected by other ESDs.
i 1 = u 2 u 1 r L 1 i 2 = u 3 u 2 r L 2 + u 1 u 2 r L 1 i k 1 = u k u k 1 r L k 1 + u k 2 u k 1 r L k 2 i k = i T ( x T , t ) ( 1 x T L k ) + u k + 1 u k r L k + u k 1 u k r L k 1
i k + 1 = i T ( x T , t ) x T L k + u k u k + 1 r L k + u k + 2 u k + 1 r L k + 1 i k + 2 = u k + 1 u k + 2 r L k + 1 + u k + 3 u k + 2 r L k + 2 i n 1 = u n 2 u n 1 r L n 2 + u n u n 1 r L n 1 i n = u n 1 u n r L n 1
In fact, in order to set up (3) and (4), the charging threshold voltage of the ESD must also satisfy (5) and (6), which shows that the diode, which is in series with the voltage source, is guaranteed to be connected.
u p 1 u p u p + 1 u p L p u p 1 u p L p 1 p [ 2 , k ]
u q 1 u q u q 1 u q r L q 1 u q + 1 u q r L q q [ k + 2 , n ]
For the constant threshold control strategy (CTCS), multiple ESDs use the same charging voltage threshold, which can be expressed as (7):
u 1 = u n = u c h a r = u c h a r . b
where u c h a r . b is the static charge threshold for ESD, and this value is fixed after ESD is debugged.
Substituting (7) into (3) and (4), the charging current under the CTCS for ESD is obtained, as shown in (8):
i 1 = 0 , , i k 1 = 0 i k = i T ( x T , t ) ( 1 x T L k ) i k + 1 = i T ( x T , t ) x T L k i k + 2 = 0 , , i n = 0
From (8), the regenerative braking energy of the train can be recovered only by the ESDs adjacent to the train, the charging current changes with the varying regenerative braking current and the location of the train and the charging current of the remaining ESDs is zero, which means that the others are in standby mode when this train is braking. This control method will lead to the ESDs on line not being able to be put into operation when the train is braking and cannot share the regenerative braking energy. The SC in the working state must bear a large voltage and current stress.

2.2. The SC State-Based Control Strategy

Taking (3) as an example to analyze the charging current characteristics of the ESD, it is obvious to see that the braking current i T of the train only affects the charging current i k of the nearest ESD E k , and the i k decreases with the increase of the distance between the train and the ESD E k . The charging currents of all of the ESDs are influenced by the charging voltage, line impedance and spacing of the ESDs. As the line impedance, the distances between the ESDs, braking current and position of the train are not controllable, the charging current can be adjusted by controlling the charging voltage of the ESD.
In (3) and (4), the charging current of the ESD is affected by changing the charging threshold value of the devices. In addition, if changing the charging threshold according to the SCs’ stress, the ESDs with large stress can share a part of the charging current; therefore, SCSCS is investigated in this paper. The main concept of this control strategy is to establish the corresponding relationship between the voltage and current of the SC and the charging threshold voltage of the ESD. The various charging threshold values are formed based on the different voltage and current of the SCs, which can control the charging current of each ESD. The SCSCS diagram is shown in Figure 3, and the strategy is given by the following equation:
u 1 = u c h a r . b + λ ( u u c . 1 u u c . l o w ) + γ i u c . 1 u 2 = u c h a r . b + λ ( u u c . 2 u u c . l o w ) + γ i u c . 2 u n = u c h a r . b + λ ( u u c . n u u c . l o w ) + γ i u c . n
u c h a r is the dynamic charging threshold value, and λ and γ are coefficients. u u c . l o w displays the lowest voltage value of SCs. When the ESD is charging, we firstly use (9) to simulate the charging threshold value at this time, then output the SC’s charging power instruction, which is generated by the controller G u c ; finally, we output the control instruction based on the SC current controller G I . The controller would dominate the system according to the update value u c h a r , which varies with the voltage and current of the SC.
In order to better illustrate the effects of the SCSCS on the charging current of the ESD, we will combine (9) with (3) and (4), and the charging currents of each of the devices on the line under the SCSCS will be gained and expressed in (10) and (11).
i 1 = λ ( u u c . 2 u u c . 1 ) + γ ( i u c . 2 i u c . 1 ) r L 1 i 2 = λ ( u u c . 3 u u c . 2 ) + γ ( i u c . 3 i u c . 2 ) r L 2 + λ ( u u c . 1 u u c . 2 ) + γ ( i u c . 1 i u c . 2 ) r L 1 i k 1 = λ ( u u c . k u u c . k 1 ) + γ ( i u c . k i u c . k 1 ) r L k 1 + λ ( u u c . k 2 u u c . k 1 ) + γ ( i u c . k 2 i u c . k 1 ) r L k 2 i k = i T ( x T , t ) ( 1 x T L k ) + λ ( u u c . k + 1 u u c . k ) + γ ( i u c . k + 1 i u c . k ) L k r + λ ( u u c . k 1 u u c . k ) + γ ( i u c . k 1 i u c . k ) r L k 1
i k + 1 = i T ( x T , t ) x T L k + λ ( u u c . k u u c . k + 1 ) + γ ( i u c . k i u c . k + 1 ) L k r + λ ( u u c . k + 2 u u c . k + 1 ) + γ ( i u c . k + 2 i u c . k + 1 ) r L k + 1 i k + 2 = λ ( u u c . k + 1 u u c . k + 2 ) + γ ( i u c . k + 1 i u c . k + 2 ) r L k + 1 + λ ( u u c . k + 3 u u c . k + 2 ) + γ ( i u c . k + 3 i u c . k + 2 ) r L k + 3 i n 1 = λ ( u u c . n 2 u u c . n 1 ) + γ ( i u c . n 2 i u c . n 1 ) r L n 2 + λ ( u u c . n u u c . n 1 ) + γ ( i u c . n i u c . n 1 ) r L n i n = λ ( u u c . n 1 u u c . n ) + γ ( i u c . n 1 i u c . n ) r L n 1
i T ( x T , t ) > 0 i k , i k + 1 > 0 i u c . k , i u c . k + 1 > 0 u u c . k , u u c . k + 1 i u c . k i u c . k 1 > 0 u u c . k u u c . k 1 > 0 i u c . k + 1 i u c . k + 2 > 0 u u c . k + 1 u u c . k + 2 > 0 i k 1 , i k + 2 > 0 i u c . k 1 , i u c . k + 2 > 0 u u c . k 1 , u u c . k + 2 i u c . k 1 i u c . k 2 > 0 u u c . k 1 u u c . k 2 > 0 i u c . k + 2 i u c . k + 3 > 0 u u c . k + 2 u u c . k + 3 > 0
In order to better analyze the influence of (9) on the ESD current distribution, we give the changing trend of each ESD’s working state when the train is braking, which is displayed as (12). When the train is braking, the voltages of SCs are the same, and the currents are zero; the ESD charging currents corresponding to (10) and (11) are the same as (8); that means only the k-th and k + 1 -th stations generate charging current, and i u c . k , i u c . k + 1 > 0 ; in the process of charging, the SC voltages of the k-th and k + 1 -th stations are increasing; thus i u c . k i u c . k 1 > 0 ,   u u c . k u u c . k 1 > 0 ,   i u c . k + 1 i u c . k + 2 > 0 , u u c . k + 1 u u c . k + 2 > 0 . From (10) and (11), i k 1 , i k + 2 > 0 , so the train’s braking current is distributed to different ESDs, instead of only focusing on the two ESDs, like the situation under the CTCS strategy.
It is obvious that all of the ESDs on the line could recycle the regenerative braking energy after using the SCSCS with the SCs’ voltage and current differences between the station and the adjacent station when the train is in braking mode. When λ and γ are larger, the ESD is more sensitive to the SC voltage and current; thus, the effect of the auto-shared current is better, as well.

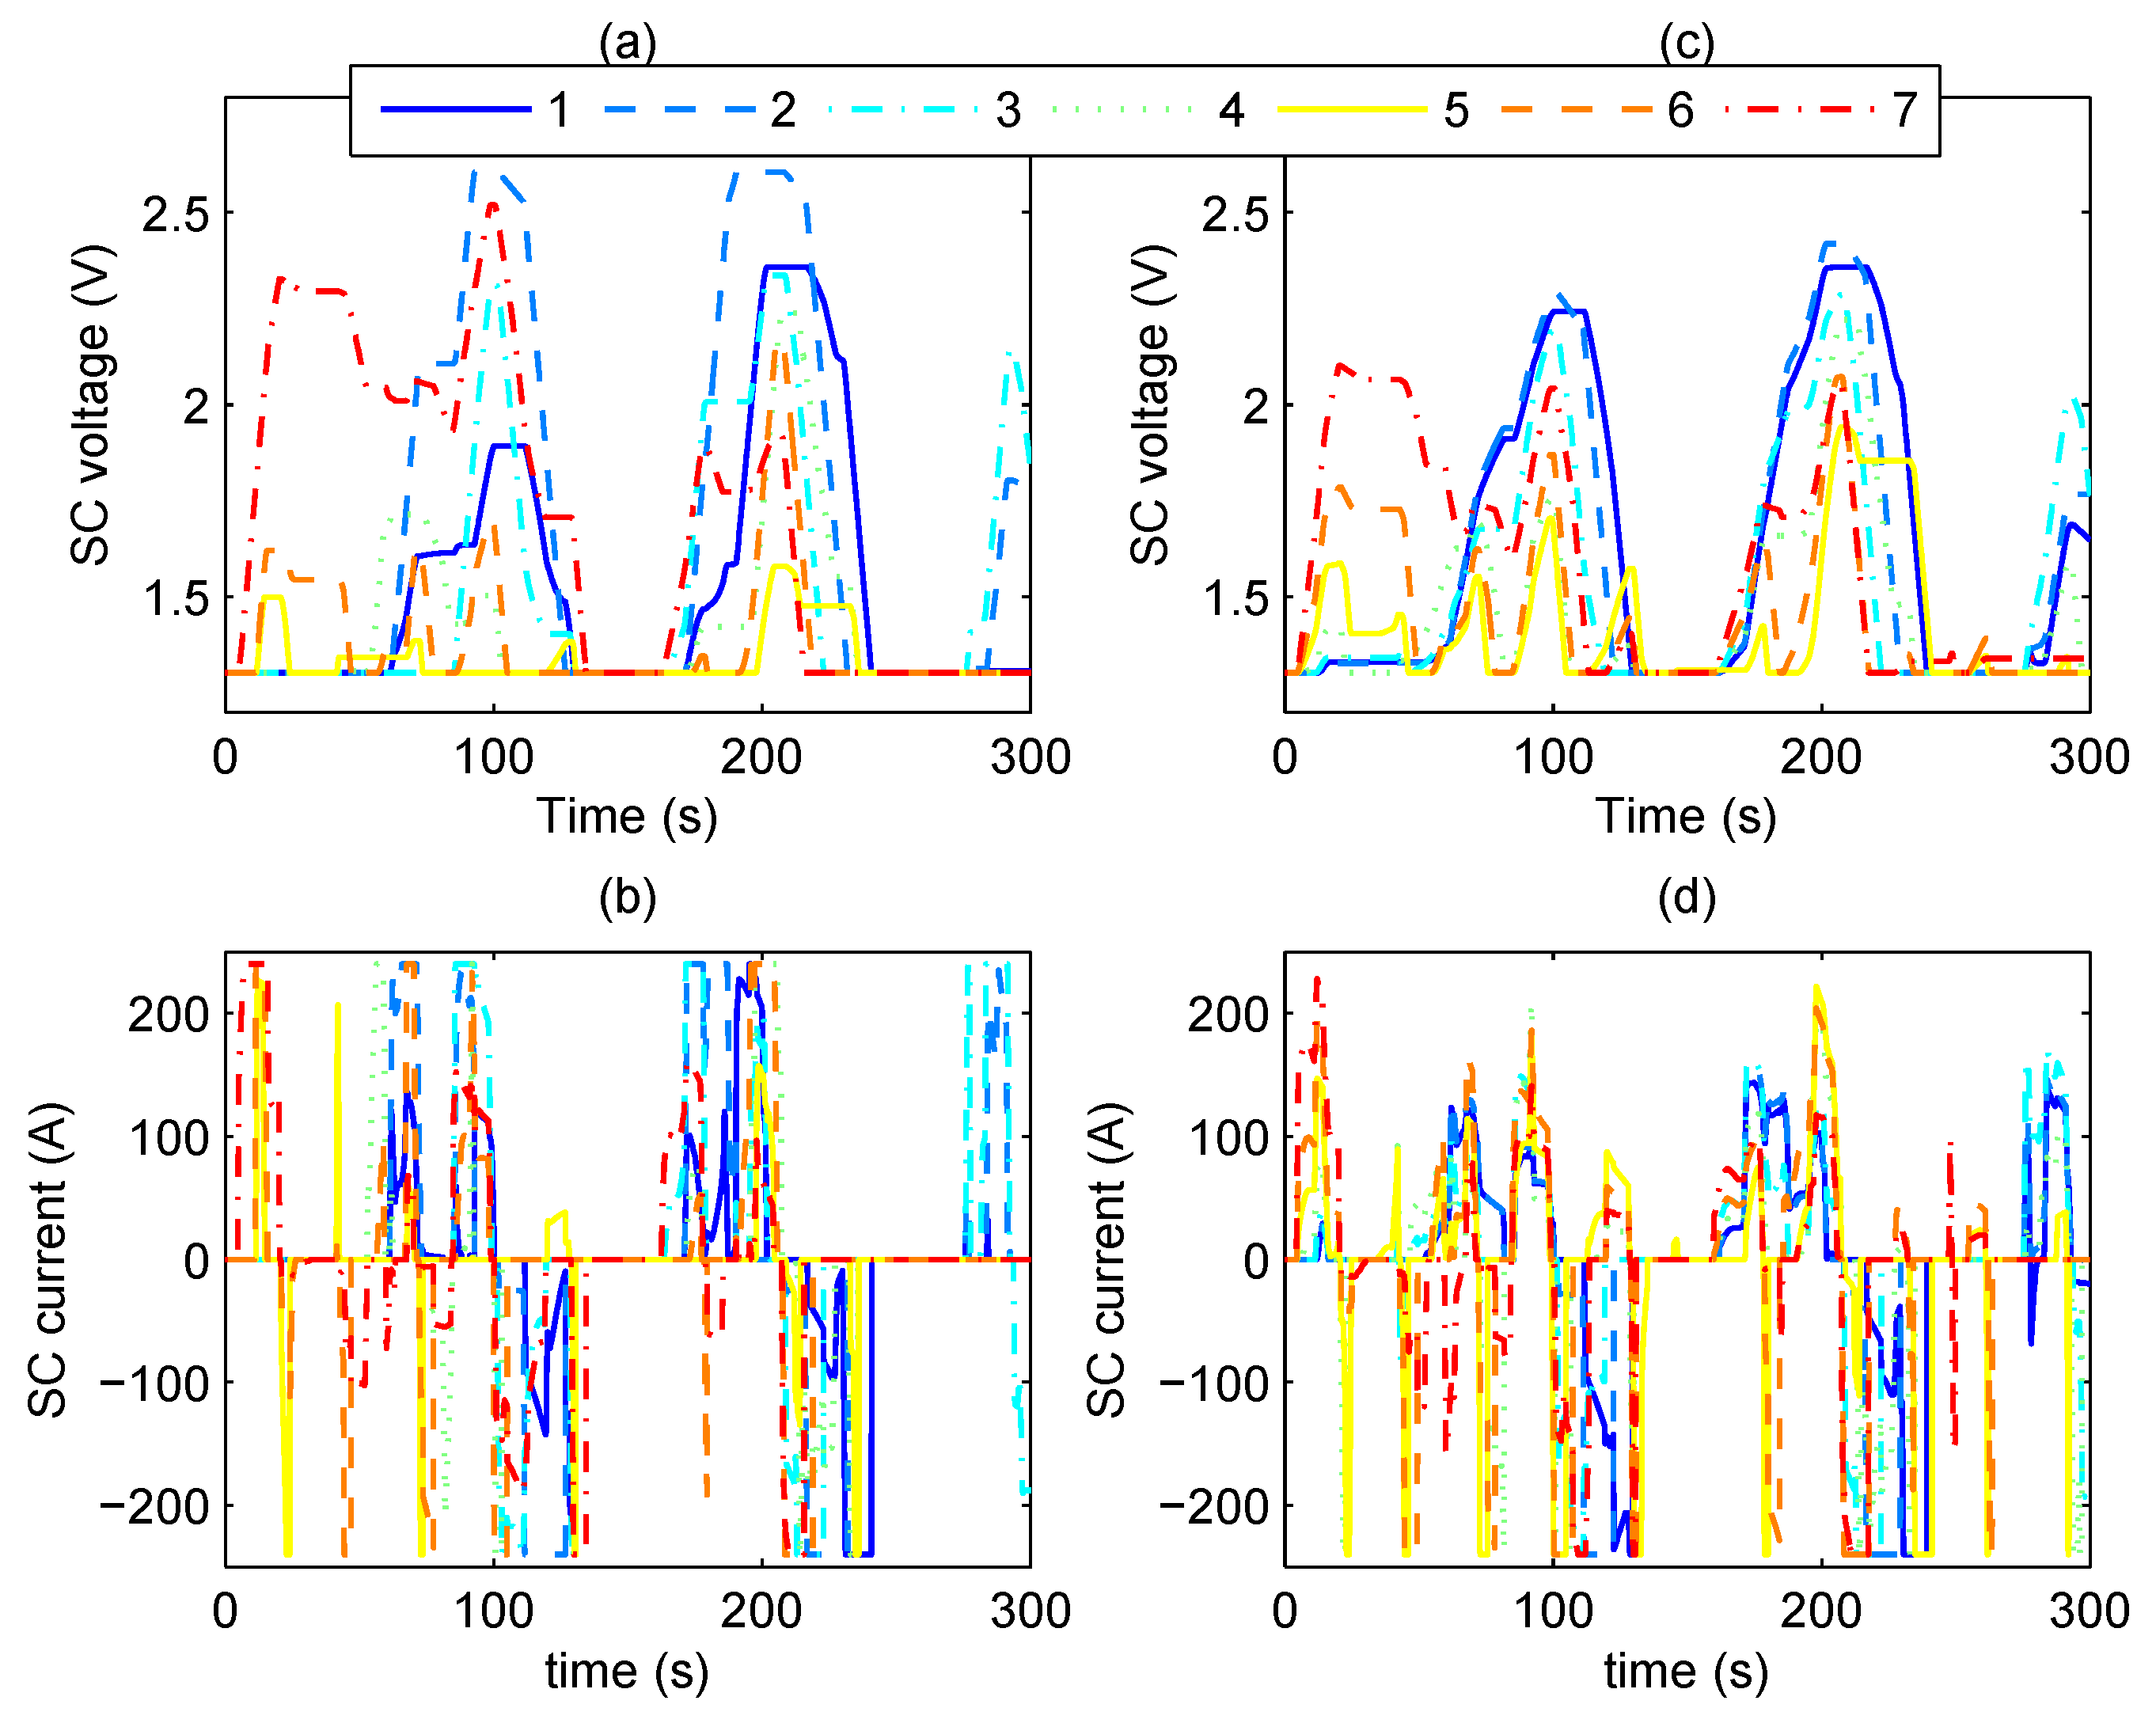
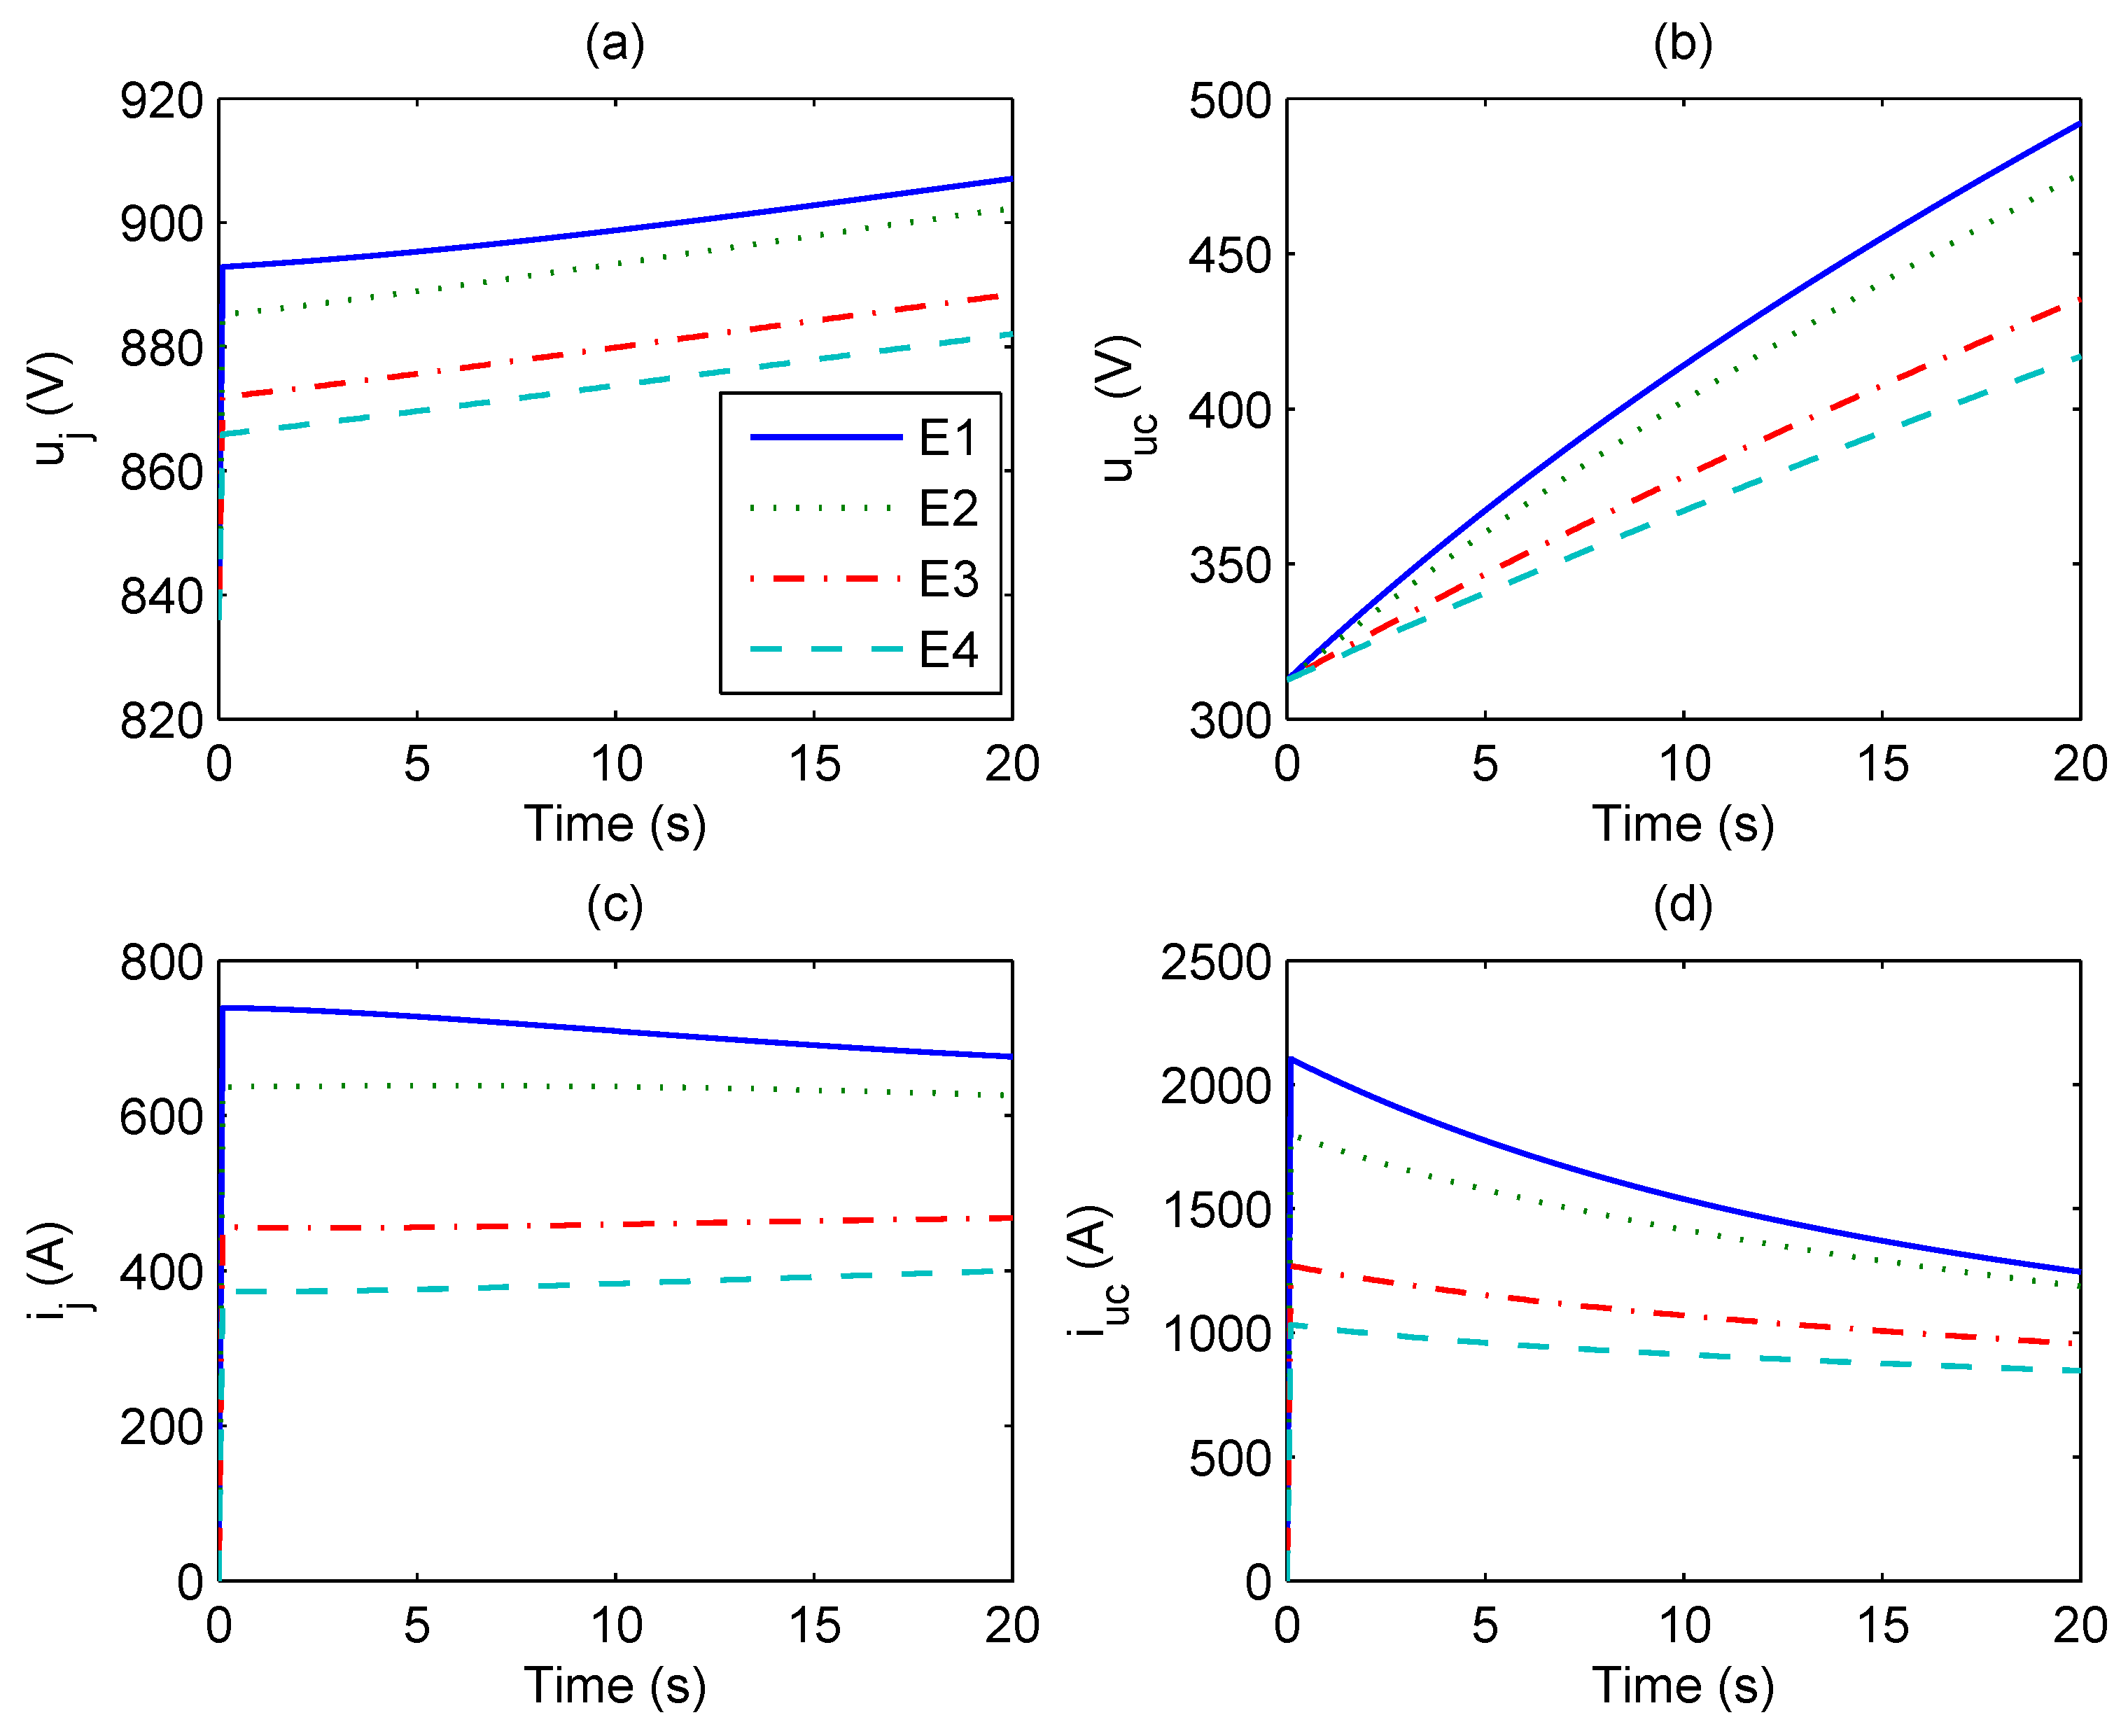
2.3. Simulation Comparison

In this paper, we perform the simulation and obtain the quantitative interpretation of the characteristics with the proposed strategy. Taking the traction power network shown in Figure 2 as an example, we obtain the simulation model, with the hypotheses that k = 1 , n = 4 , x T = 1 km, L j = 2 km, the power of regenerative braking train is 2 MW, braking time is 20 s, the distance between E 1 , the starting braking point is 0.892 km and the braking stop position is 1.104 km. The maximum voltage of the SC is 625 V; the initial voltage is 312.5 V; and the static charging threshold of the ESD is 840 V.
The simulation results with the CTCS are displayed in Figure 4. When the train is braking, the voltage of the traction power network rises, which has a maximum value of 840 V, and E 1 and E 2 will change into the charging mode. Because the charging threshold values of all of the ESDs are same, the braking current of the train cannot be transmitted to the E 3 and E 4 by the traction power network. In addition, the train is running closely to E 1 when the train begins to brake, so at this time, E 1 ’s charging current is slightly larger than E 2 ’s, and E 1 ’s charging current decreases as E 2 ’s charging current rises during the whole process of braking. E 3 and E 4 are both in standby mode, and the curve is coincident. The braking current is invariant when the train is braking, while in the charging mode of SC, the voltage of SC increases, and the current gradually decreases from the maximum value. At the beginning of the braking mode, there is a lower voltage, and the maximum current value is 3360 A for SC; and at the time of 20 s, the SC’s voltage rises up to 570.6 V.
The simulation results using the SCSCS with the controlling parameters λ = 0 . 2 and γ = 0 . 025 are shown in Figure 5. when the train begins to brake, the ESD will generate different charging threshold voltages due to the fact that the current inertia of the SC is much lower than its voltage inertia. In fact, it can be seen that the inertia of the SC current is determined by the filter inductance, and the time constant of the filter inductance is much smaller than the time constant of the SC. Therefore, four storage devices will be charged at the same time, and the charging current of the storage device gradually decreases with the increase of the distance between the device and the train. The change of the SC voltage is a cumulative process during the period of charging. Later on, the current of each SC tends to be consistent, and the train’s braking current is almost divided equally. As can be seen, the current curve of the ESD is combined with the characteristics of the above two controlling parameters; the parameter γ plays a major role at the beginning of braking, and each of the devices could rapidly auto-share the current. This shows that the combination of the parameters λ and γ can reduce the current and the voltage stress of the SC through the whole braking process.
Table 1 shows the data of the simulation results for the two sets of controlling parameters. The computation period of SC’s Root Mean Square (RMS) current is 20 s, and the SC’s voltage is the value at the end of the charging process. E 1 and E 2 are in the same operation states, while E 3 and E 4 are not charged with the original control strategy. After applying the proposed strategy, the SC currents of E 1 and E 2 decrease, and the currents of E 3 and E 4 increase, all of which play a certain role in the current balance.

3. Controlling Parameters Optimization

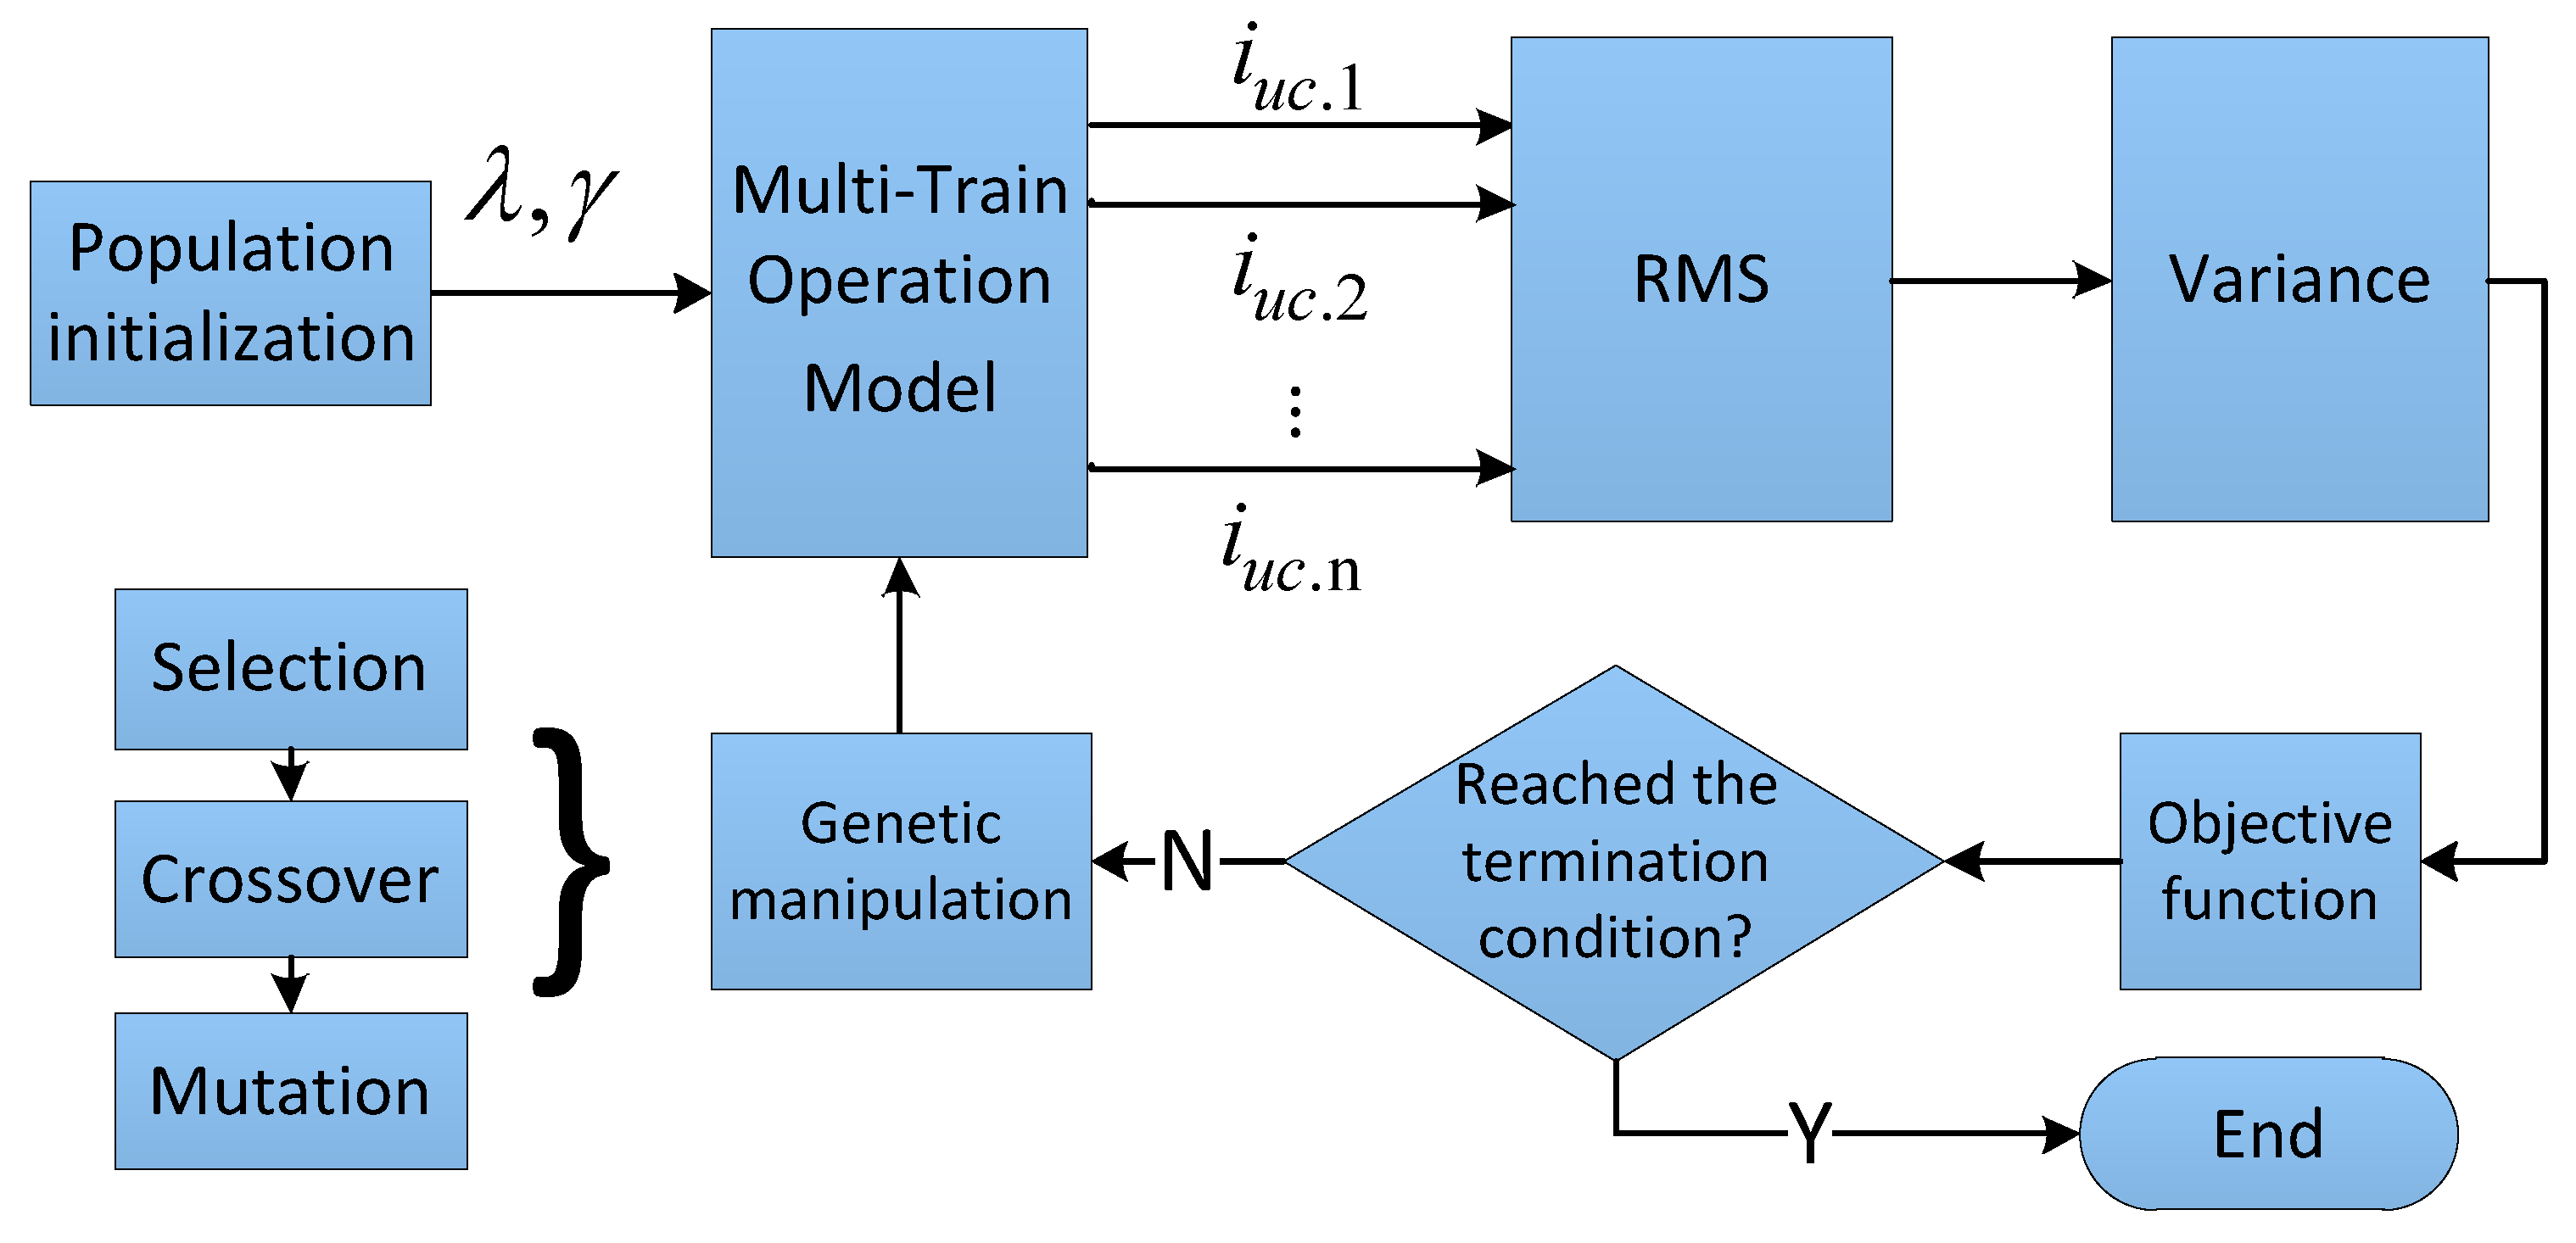
3.1. Optimization Algorithm
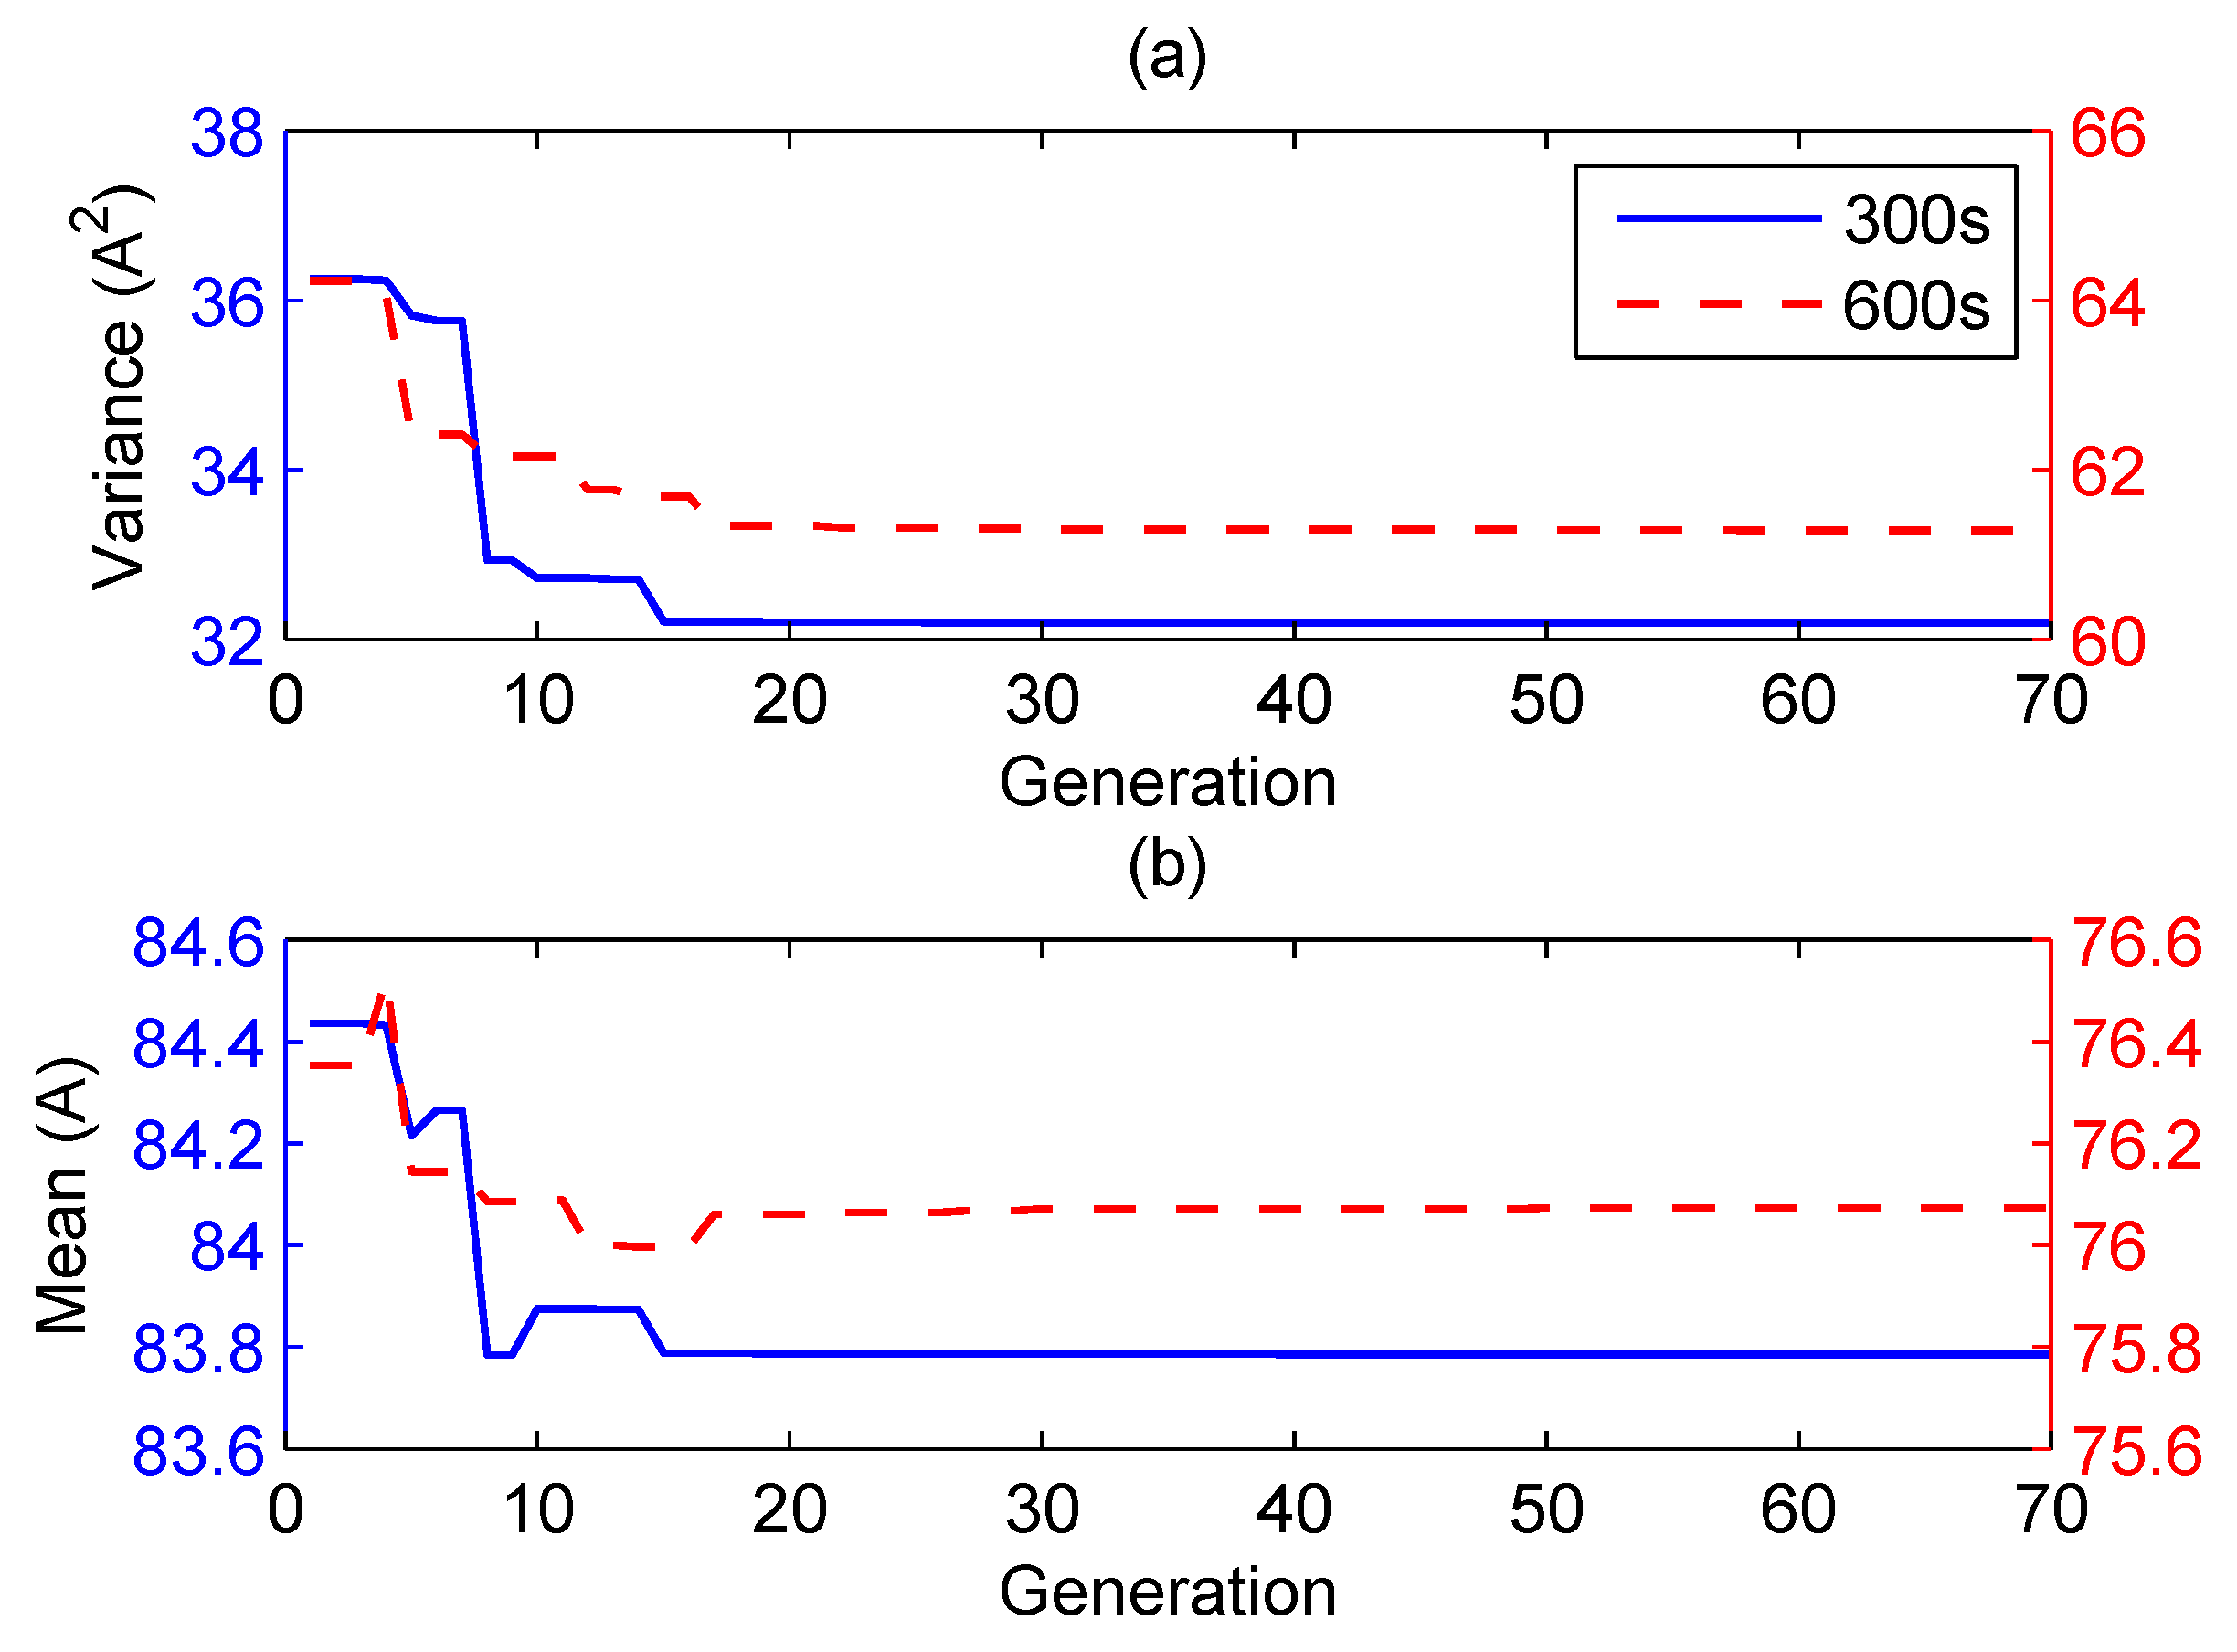
Based on the simulation in Section 2.3, it is clear that the current-sharing characteristic for SCSCS is affected by the controlling parameters, and appropriate controlling parameters can have better effects on the system. Therefore, a series of optimization methods is analyzed in the following to determine the optimal controlling parameters with the SCSCS.
The SC current is positive in charging mode and negative in discharging mode. In order to evaluate the current of the SC, the RMS value of the current is used in this paper, and the RMS current value of the SC is calculated by (13):
I u c . j = 1 T 0 T i u c . j 2 d t
I u c . j is the RMS current value of the j-th SC; T is the operating cycle time for the system; and i u c . j displays the instantaneous current of j-th SC.
In mathematics, the sample variance is generally used to evaluate the discrete degree of a set of data. The greater the sample variance is, the greater the discrete degree of the data will be. Therefore, this paper considers using the sample variance of the SC current RMS value to evaluate the current balance effect of the control strategy, in which the sample variance is smaller and the current balance effect of the control strategy is better. The objective function is represented in (14), and optimization variables are also shown as (15):
M i n i m i z e F ( X ) = 1 n 1 j = 1 n ( I u c . j I ¯ u c ) 2
X = [ λ , γ ]
I ¯ u c is the mean current for the SCs (16):
I ¯ u c = 1 n j = 1 n I u c . j
It is necessary to determine the constraint conditions for the voltage and current of the SC to ensure the normal operation; these conditions are expressed as (17):
S u b j e c t t o 1 2 u u c . max u u c u u c . max i u c . max i u c i u c . max
where u u c . max and i u c . m a x respectively display the maximum voltage and maximum current of SC; the lower limit of the voltage is the half of the maximum value. Such an arrangement not only ensures the full utilization of the SC’s configuration capacity, but also allows the converter duty cycle to work in a reasonable range.
In order to maximize the energy saving effect of the SC-ESD, the energy consumption on the braking resistor should be as small as possible, so the constraint condition for braking resistors is defined as (18):
E b r e = j = 1 m 0 T u b . j i b . j d t = 0
where m is the number of trains, and u b . j and i b . j are the braking resistors’ voltage and current for j-th train.
Metro trains are different from passenger cars, as their operation is not random, but has a fixed operating profile. The power flow of the traction power network and the ESDs is fixed as well, which will lead to the operation conditions being confirmed, and a set of controlling parameters would be found with the results of the optimal current balance effect for the ESDs.
In this paper, a simulation model of multi-train operation is developed and shown as Figure 6 to simulate the the power flow of the traction power network and the ESDs’ working states. At the beginning, we enter the line conditions and train parameters into the model to calculate the power and displacement data of single-train operation. Then, we combine the single-train operation data and the headway into the multiple train profile distribution module to calculate the power and displacement of each train on the line. To calculate the state of SC-ESD, the control algorithm and capacity configuration information are required. In the end, all of these data are simulated in the traction power supply network model to get the voltage and current of each ESD, the current of braking resistors, and so on.
The optimization problem is very complex due to the nonlinearity of models, so intelligent algorithms are applied here. The commonly-used intelligent algorithms include the partial swarm optimization (PSO), the simulated annealing algorithm (SA), the genetic algorithm (GA), etc. PSO has a fast convergence speed, but easily falls into the local optimum. SA has strong robustness, but requires a long computation time. The genetic algorithm emulates Darwin’s theory of evolution. During the process of reproduction, crossover and mutation, the population gets evolved, which helps jump out of local convergence effectively. It has a strong global search ability and deals well with constraints. Therefore, in this paper, a genetic algorithm-based [25,26,27] optimization method is proposed to optimize the controlling parameters of the SCSCS, which combines the genetic algorithm and multi-train operation model. Figure 7 represents the optimization process: at the beginning, a series of random variables will be gained and added into multi-train operation model. Under the determinate train diagram, the multi-train operation model can be used to calculate the corresponding voltage and current of SC-ESD and to calculate the variance current of SC. In the end, the individual of the population is selected, and the crossover and mutation operation is also carried out by calculating the degree of adaptation. On the basis of the calculation for multiple cycles, the genetic algorithm will converge to the global optimization and determine the optimal solution.

3.2. Case Study

This paper analyzes the influence of current balance effects with SCSCS in the real operation system, by using the data of Beijing subway Line 10. There are seven traction substations in the simulation. The SCs of each traction substation are connected by five modules in series and 14 modules in parallel. The module is Maxwell 125 V/63 F, and the total energy storage is up to 9.57 kWh. The discharging threshold of the storage device u d i s is equal to 835 V. The maximum power consumed by the train is up to 3.26 MW in the traction mode and is 2.64 MW for the braking mode, and the start threshold of the braking resistor is 970 V. Figure 8 shows the train operation diagram of the headway in 300 s and 600 s, and from the diagram, it is clear that with the increasing of the headway, the number of trains at the same time will decrease, which will lead to the change of the working state of the traction substation and ESD.
Based on Figure 8, it is obvious to know that there are eight pairs of trains in the opposite direction on the whole line under the 300-s interval, but the trains will reduce to four pairs with the 600-s interval; thus, this will lead to the working state variety of the traction substation and ESD. The greater the value of headway is, the lower the utilization rate of the regenerative braking energy is; therefore, in this condition, the introduction of the supercapacitor to recycle braking energy can reflect the vital role of SC in energy saving.
Figure 9 shows each index’s simulation result of the traction power supply system with the variation of the ESD’s charging threshold, in the situation where the headways of trains are 300 s and 600 s, the calculation period of the data is a headway and λ = γ = 0 . When the charging voltage range is 840 V to 940 V, the SC is charged with the lower charging threshold; the terminal voltage of train cannot reach the start threshold value of braking resistor, and nearly all of the regenerative braking energy is stored in the SC; thus, at this period of time, the charging voltage threshold has little effect on the output energy of traction substation and the consumption on the braking resistors. Current variances will reach the minimum value 441 . 4 A 2 and 106 . 3 A 2 , respectively, when the charging voltage thresholds are u c h a r = 848 V and u c h a r = 840 V .
When the charging voltage is 840 V, the current mean value achieves the peak, respectively at 111.8 A and 97.58 A. This is because the lower charging voltage affects the regenerative braking energy transmission between the trains: the regenerative braking energy that should have been absorbed by the adjacent vehicle is now stored in the SC. As the charging voltage rises from 840 V to 940 V, the average current value of the SC decreases with the increase of the charging voltage, while the current variance is in a rising state. When the charging voltage is higher than 940 V, with the increase of the charging voltage, the probability of the train terminal voltage reaching the braking resistor’s threshold increases, and the energy consumption of the braking system is increased, as well, while the energy efficiency of the system is reduced. When the charging voltage reaches 970 V, the SC quits, the brake system completely depends on train’s braking resistor, the energy consumptions are 65.97 kWh and 118.5 kWh and the output energy of substations also reaches their respective maximum values of 281.7 kWh and 333.7 kWh.
This paper uses the optimization method proposed in Section 3.1 to optimize the controlling parameters with the analysis of the SCSCS. Table 2 lists the parameter settings of the genetic algorithm. The hardware used is Intel(R) Xeon(R) CPU E5649 @2.53 GHz *2, with 64 GB RAM. The optimization program was compiled by MATLAB/Simulink, and the optimization speed was improved by using MATLAB parallel computing. The simulation speed is very slow limited by the complexity of the traction power supply system and the time-varying characteristic of the train position. Therefore, before the application of SCSCS, in accordance with the different headways, the optimization results in the actual line will be obtained and stored. Then, the optimization parameters can be invoked directly when the ESD is running.
The curves in Figure 10a are the optimal values of the objective function for each generation, and Figure 10b is the corresponding mean current curve of SCs. It follows that the current variance is almost unchanged from 15 and 17 generations, and the corresponding controlling parameter is the optimal solution. The specific optimization data are shown in Table 3. As shown by the analysis of data in Table 3, no matter whether under the condition of 300-s or 600-s headway, the current variance of SCSCS is smaller than the minimum value of CTCS; the good current balance effect under the SCSCS has been improved.
In order to make a more intuitive study, this paper presents the change of the SC voltage and current with time; Figure 11 is the comparison in the 300-s headway; Figure 11a,b shows the SC voltages and currents using CTCS, and the charging threshold is 920.69 V, corresponding to the mean current of 83.79 A in optimization results. Figure 11c,d is the SC voltages and currents using SCSCS. Accordingly, Figure 12 is the comparison in the 600-s headway; Figure 12a,b shows the the SC voltages and currents using CTCS, and the charging threshold is 945.34 V, corresponding to the a mean value of 76.07 A in the optimization results. Figure 12c,d shows the SC voltages and currents using SCSCS.
Figure 11 shows that the CTCS cannot coordinate the charging current of ESD, and the ESD can only be charged with the regenerative braking energy from the adjacent train. The work loads of every ESD are different, and the current variance value is large. From the voltage curve, the charging voltage curve is relatively dispersed, the SC voltage is higher at the end of charging and the maximum value can reach the limit of 2.6 V. In addition, the charging current of the SC is large, and the maximum value can persistently reach the limit of 240 A. After applying the optimized SCSCS, the single train’s braking energy can be shared by multiple ESDs. In the curve, the charging actions of the ESD approach consistently, and with the effect of the current balance, the SC voltage at the end of the charging operation is decreased compared with the result under the CTCS. At the same time, the current of SC also decreases; the wave form is like a spike and is not saturated anymore; and the maximum values of voltage and current are only 2.419 V and 228.2 A.
Comparing Figure 11 with Figure 12, we can get a similar conclusion. The number of trains on the line reduces due to the increase of train headway; hence, the braking trains at the same time also decrease. However, the number of ESDs that could share the current increases; thus, the superiority of the SCSCS method becomes more prominent, and the charging operation of the SC is more consistent with the train braking situation. The maximum value of the SC voltage and current can reach up to 2.6 V and 240 A before the SCSCS is employed. After using this method, the maximum voltage value is reduced to 2.339 V. The maximum current can also reach the limit of 240 A at the time point of 276 s; and the reason why this condition occurs is that the train is possibly too close to Station 3, and the SCSCS is temporarily unavailable. Comprehensively analyzing the results in Figure 11 and Figure 12, it is shown that, compared with the CTCS, the SCSCS can better balance the charging current of the ESD under the same mean current and reduce the voltage and current stress of the SC.

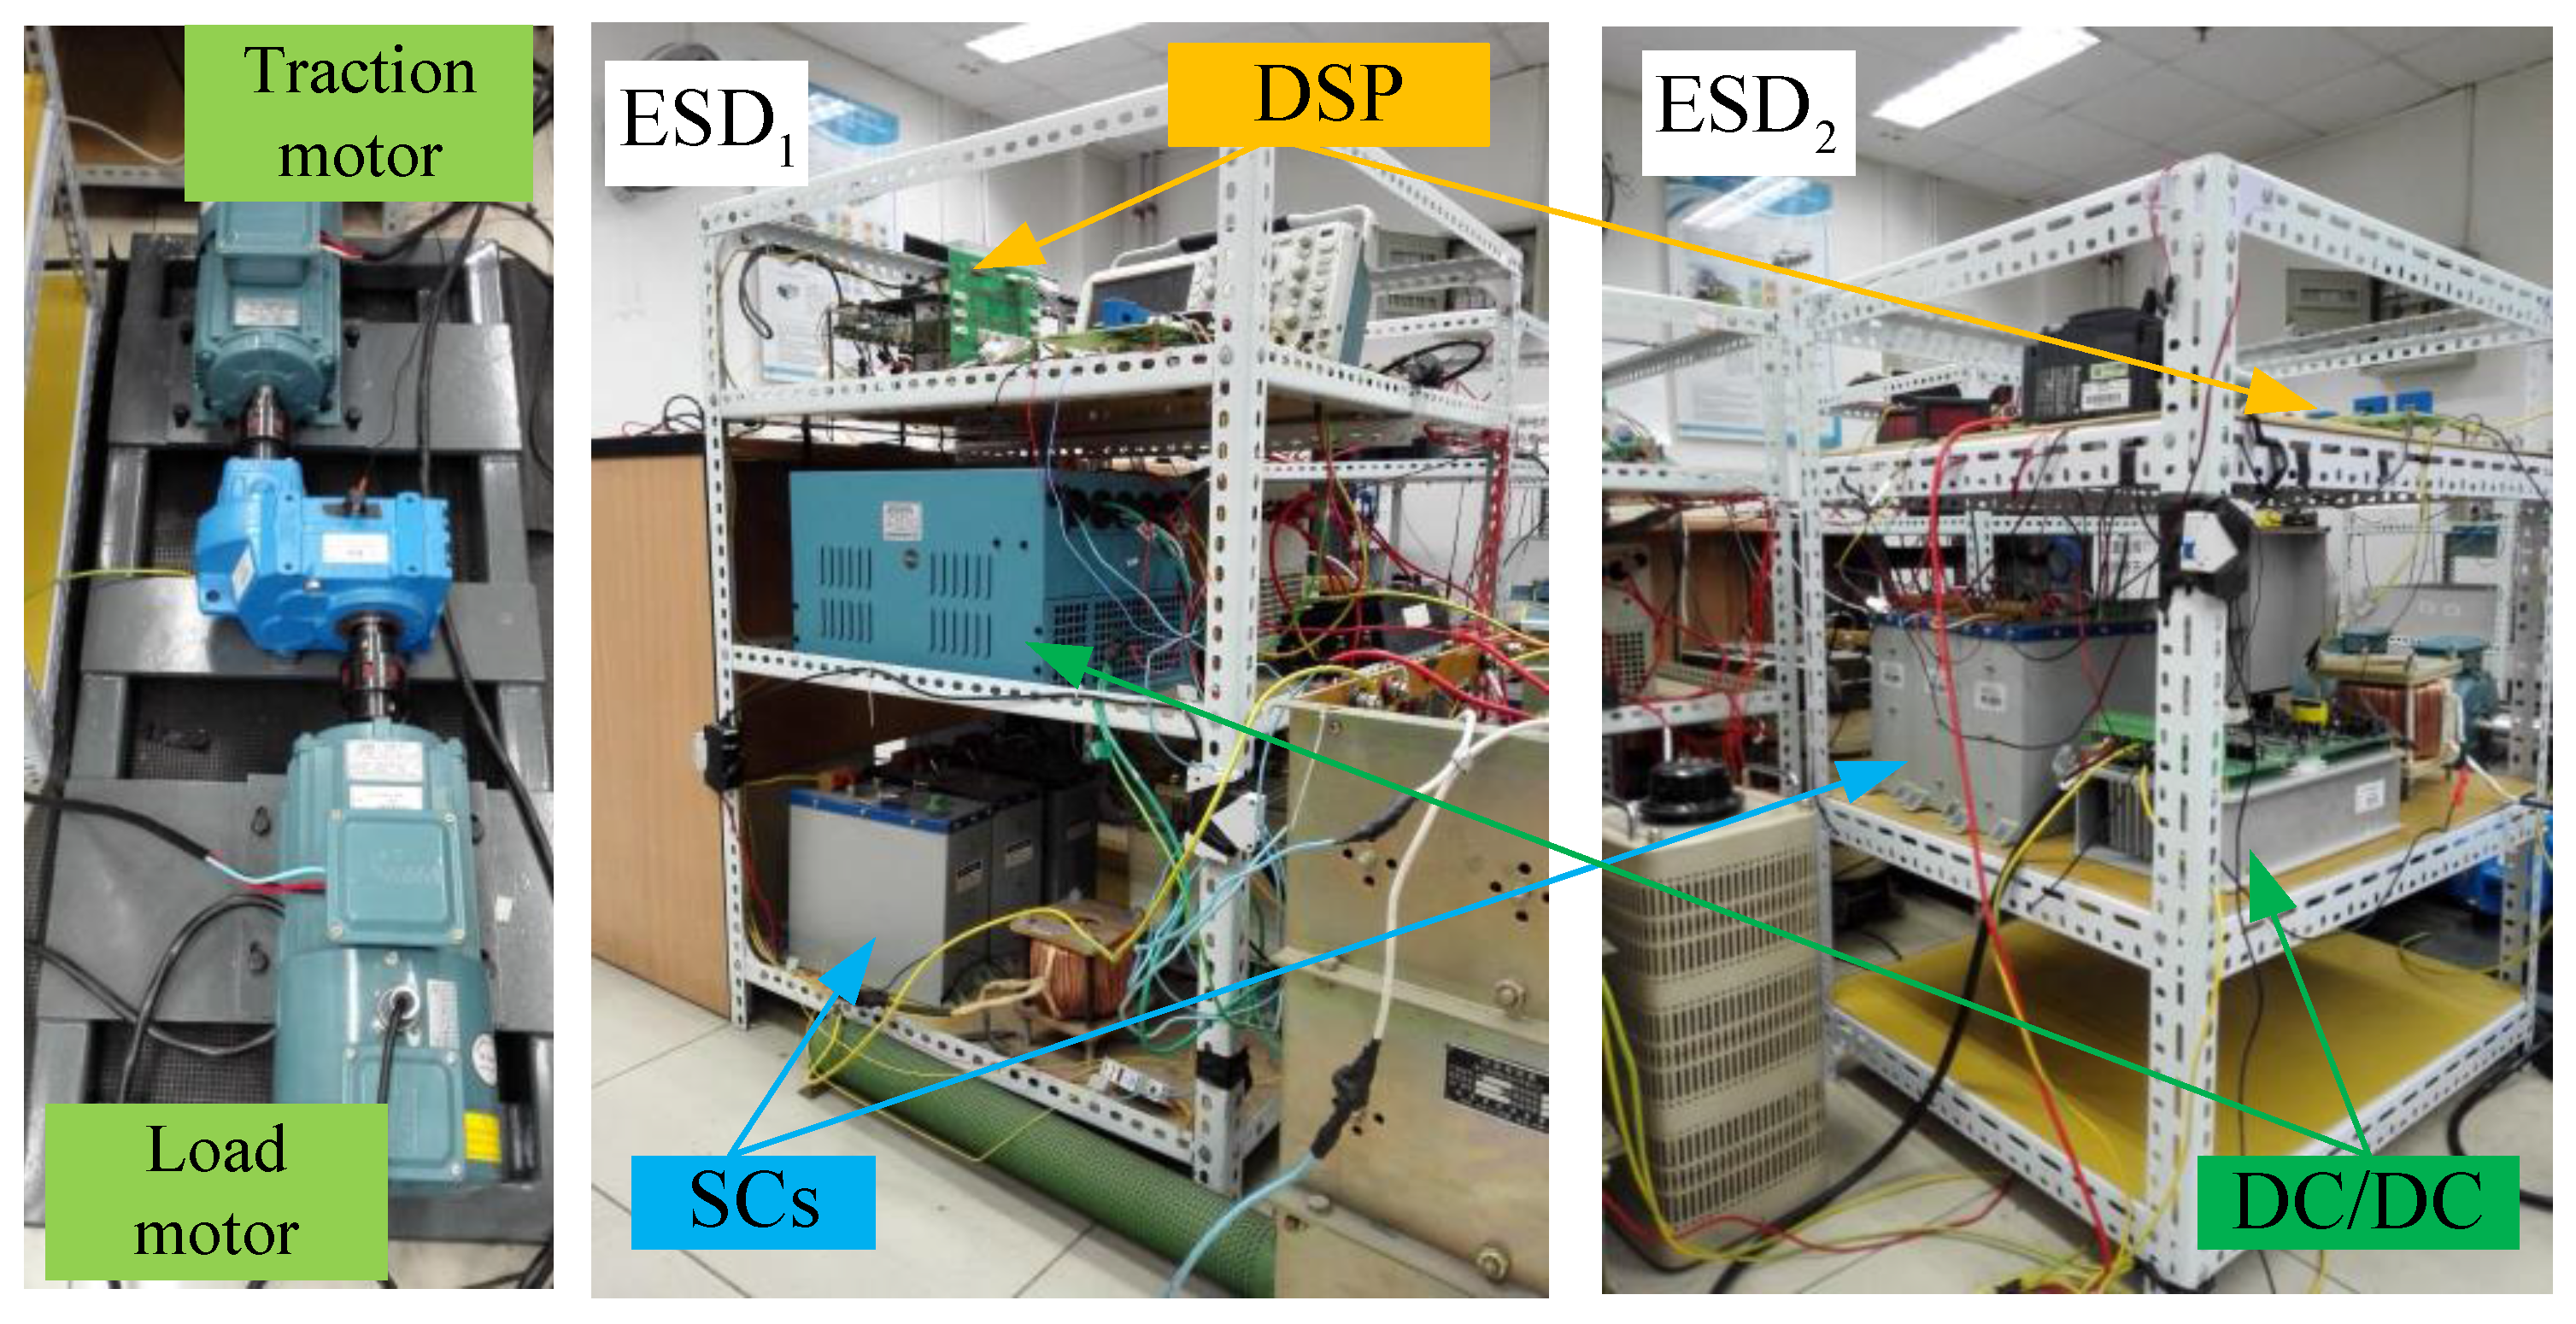
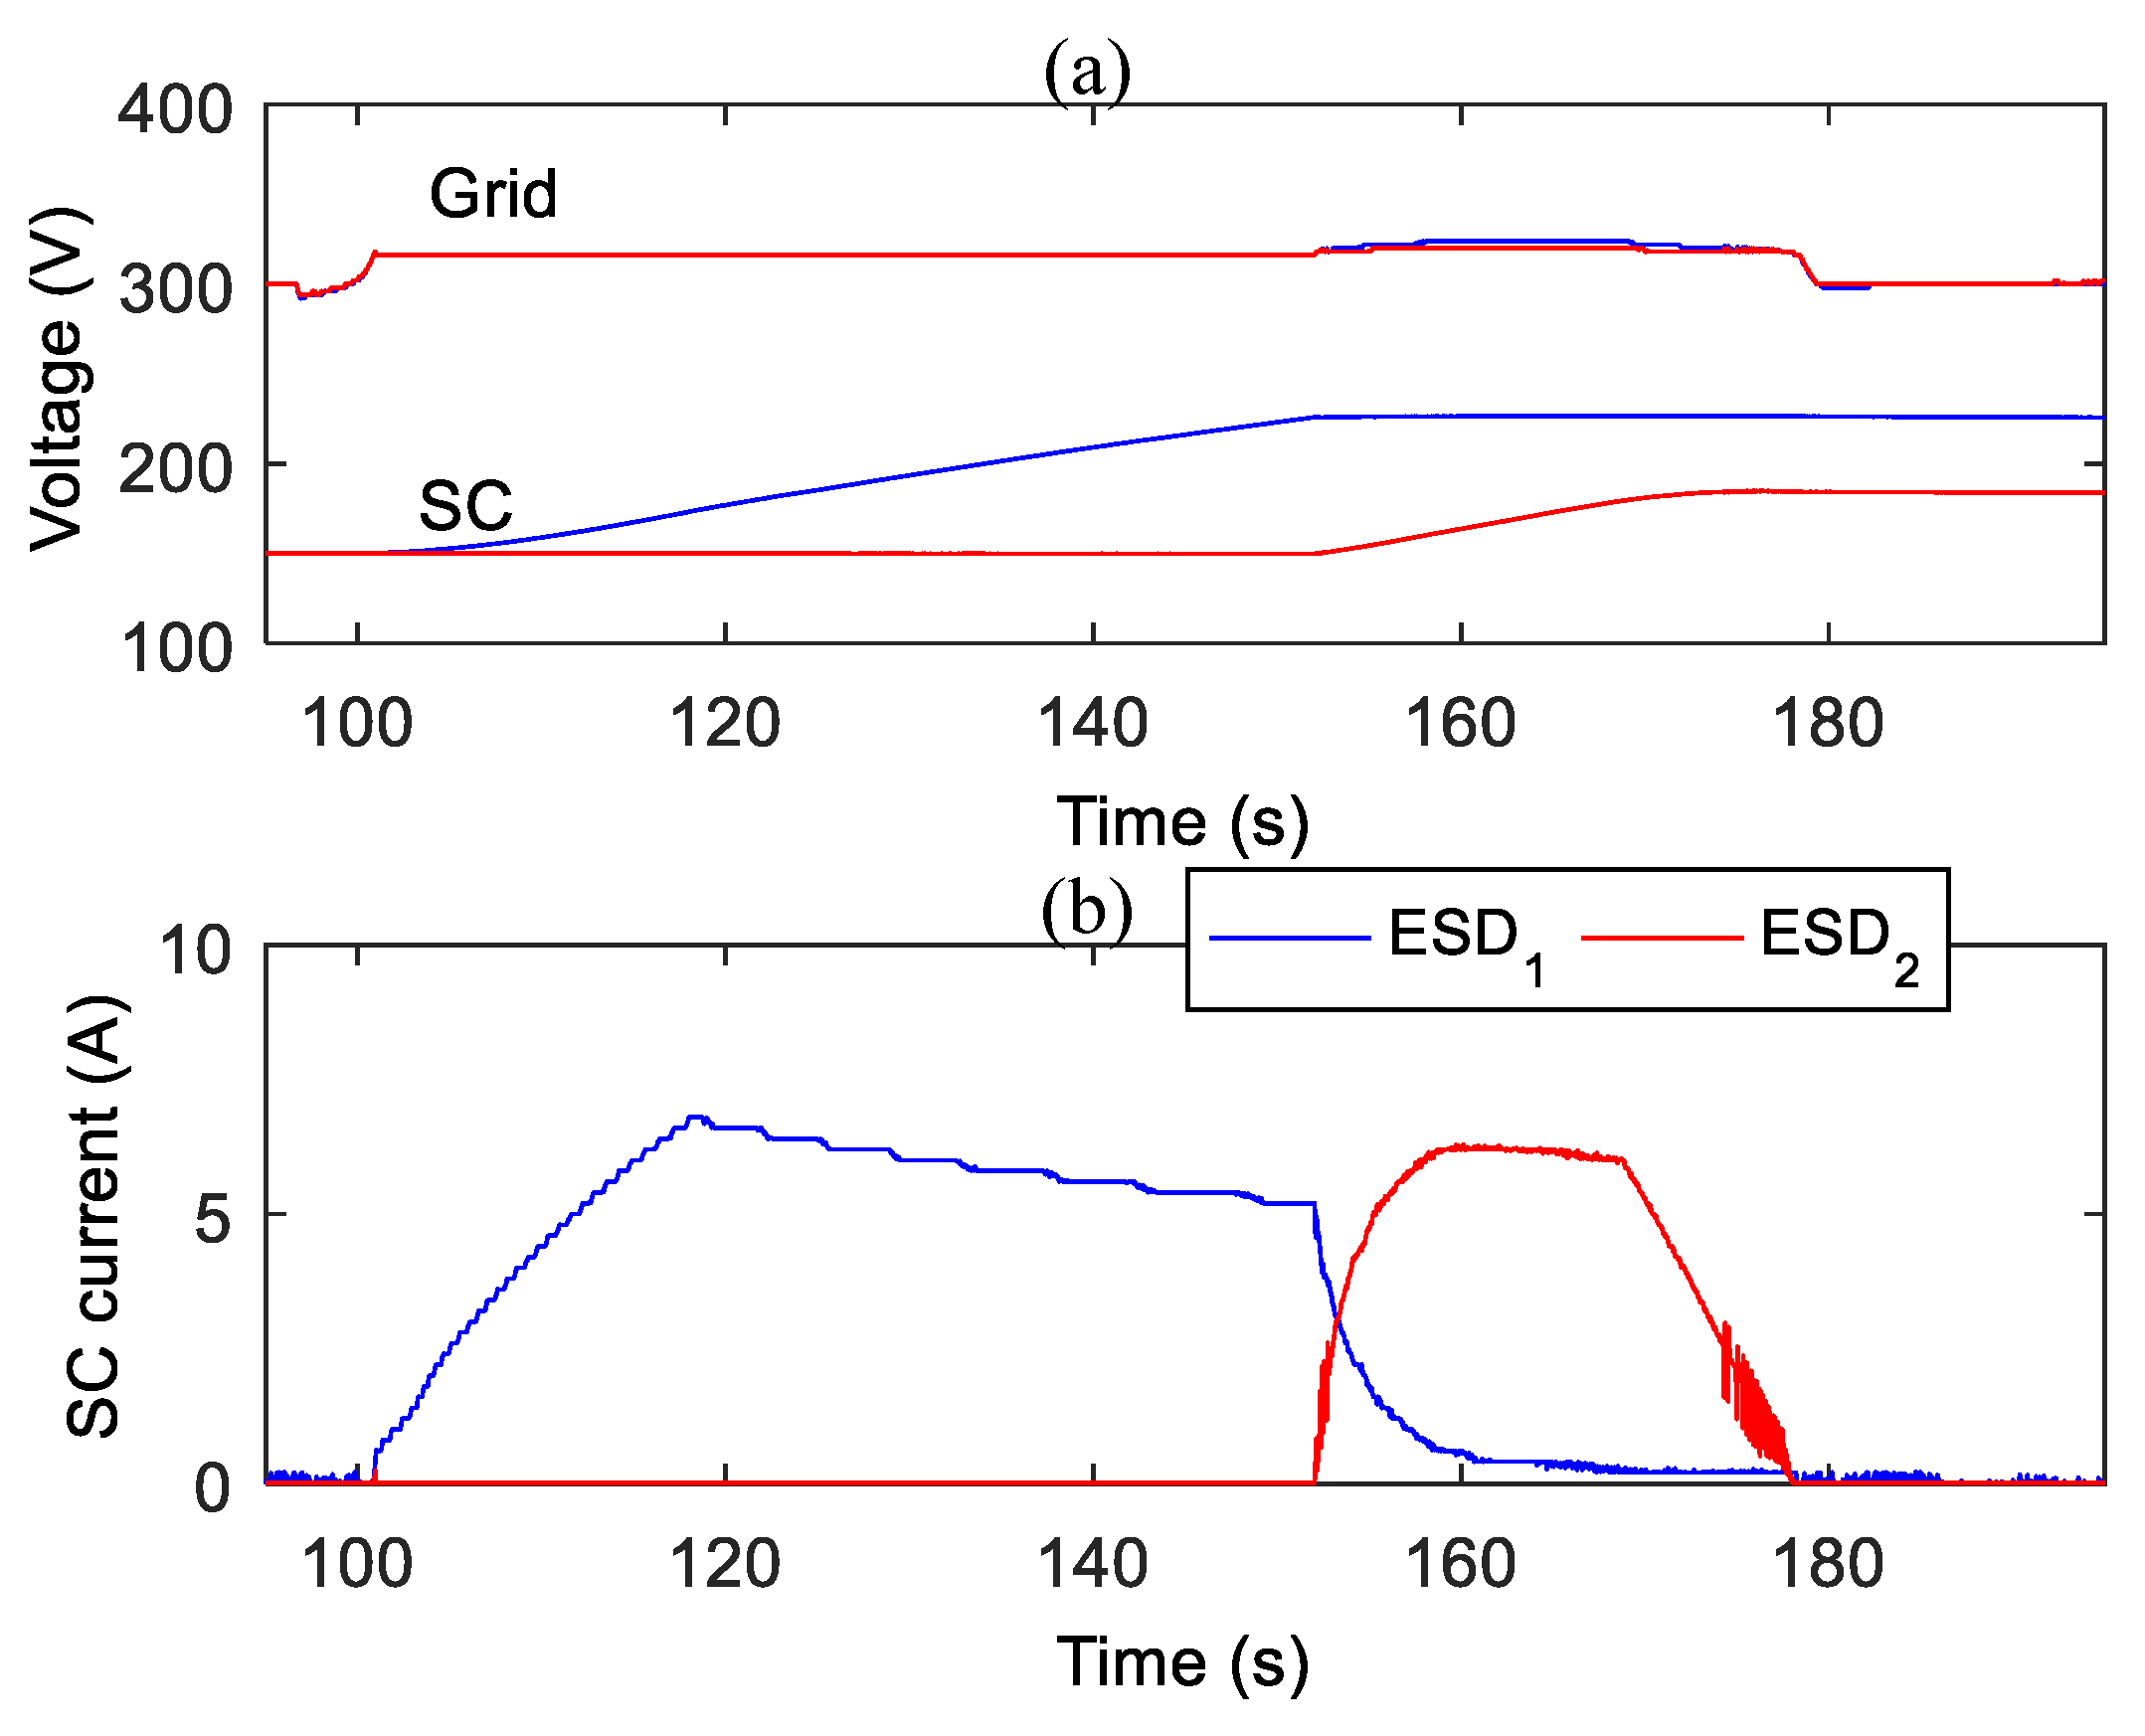
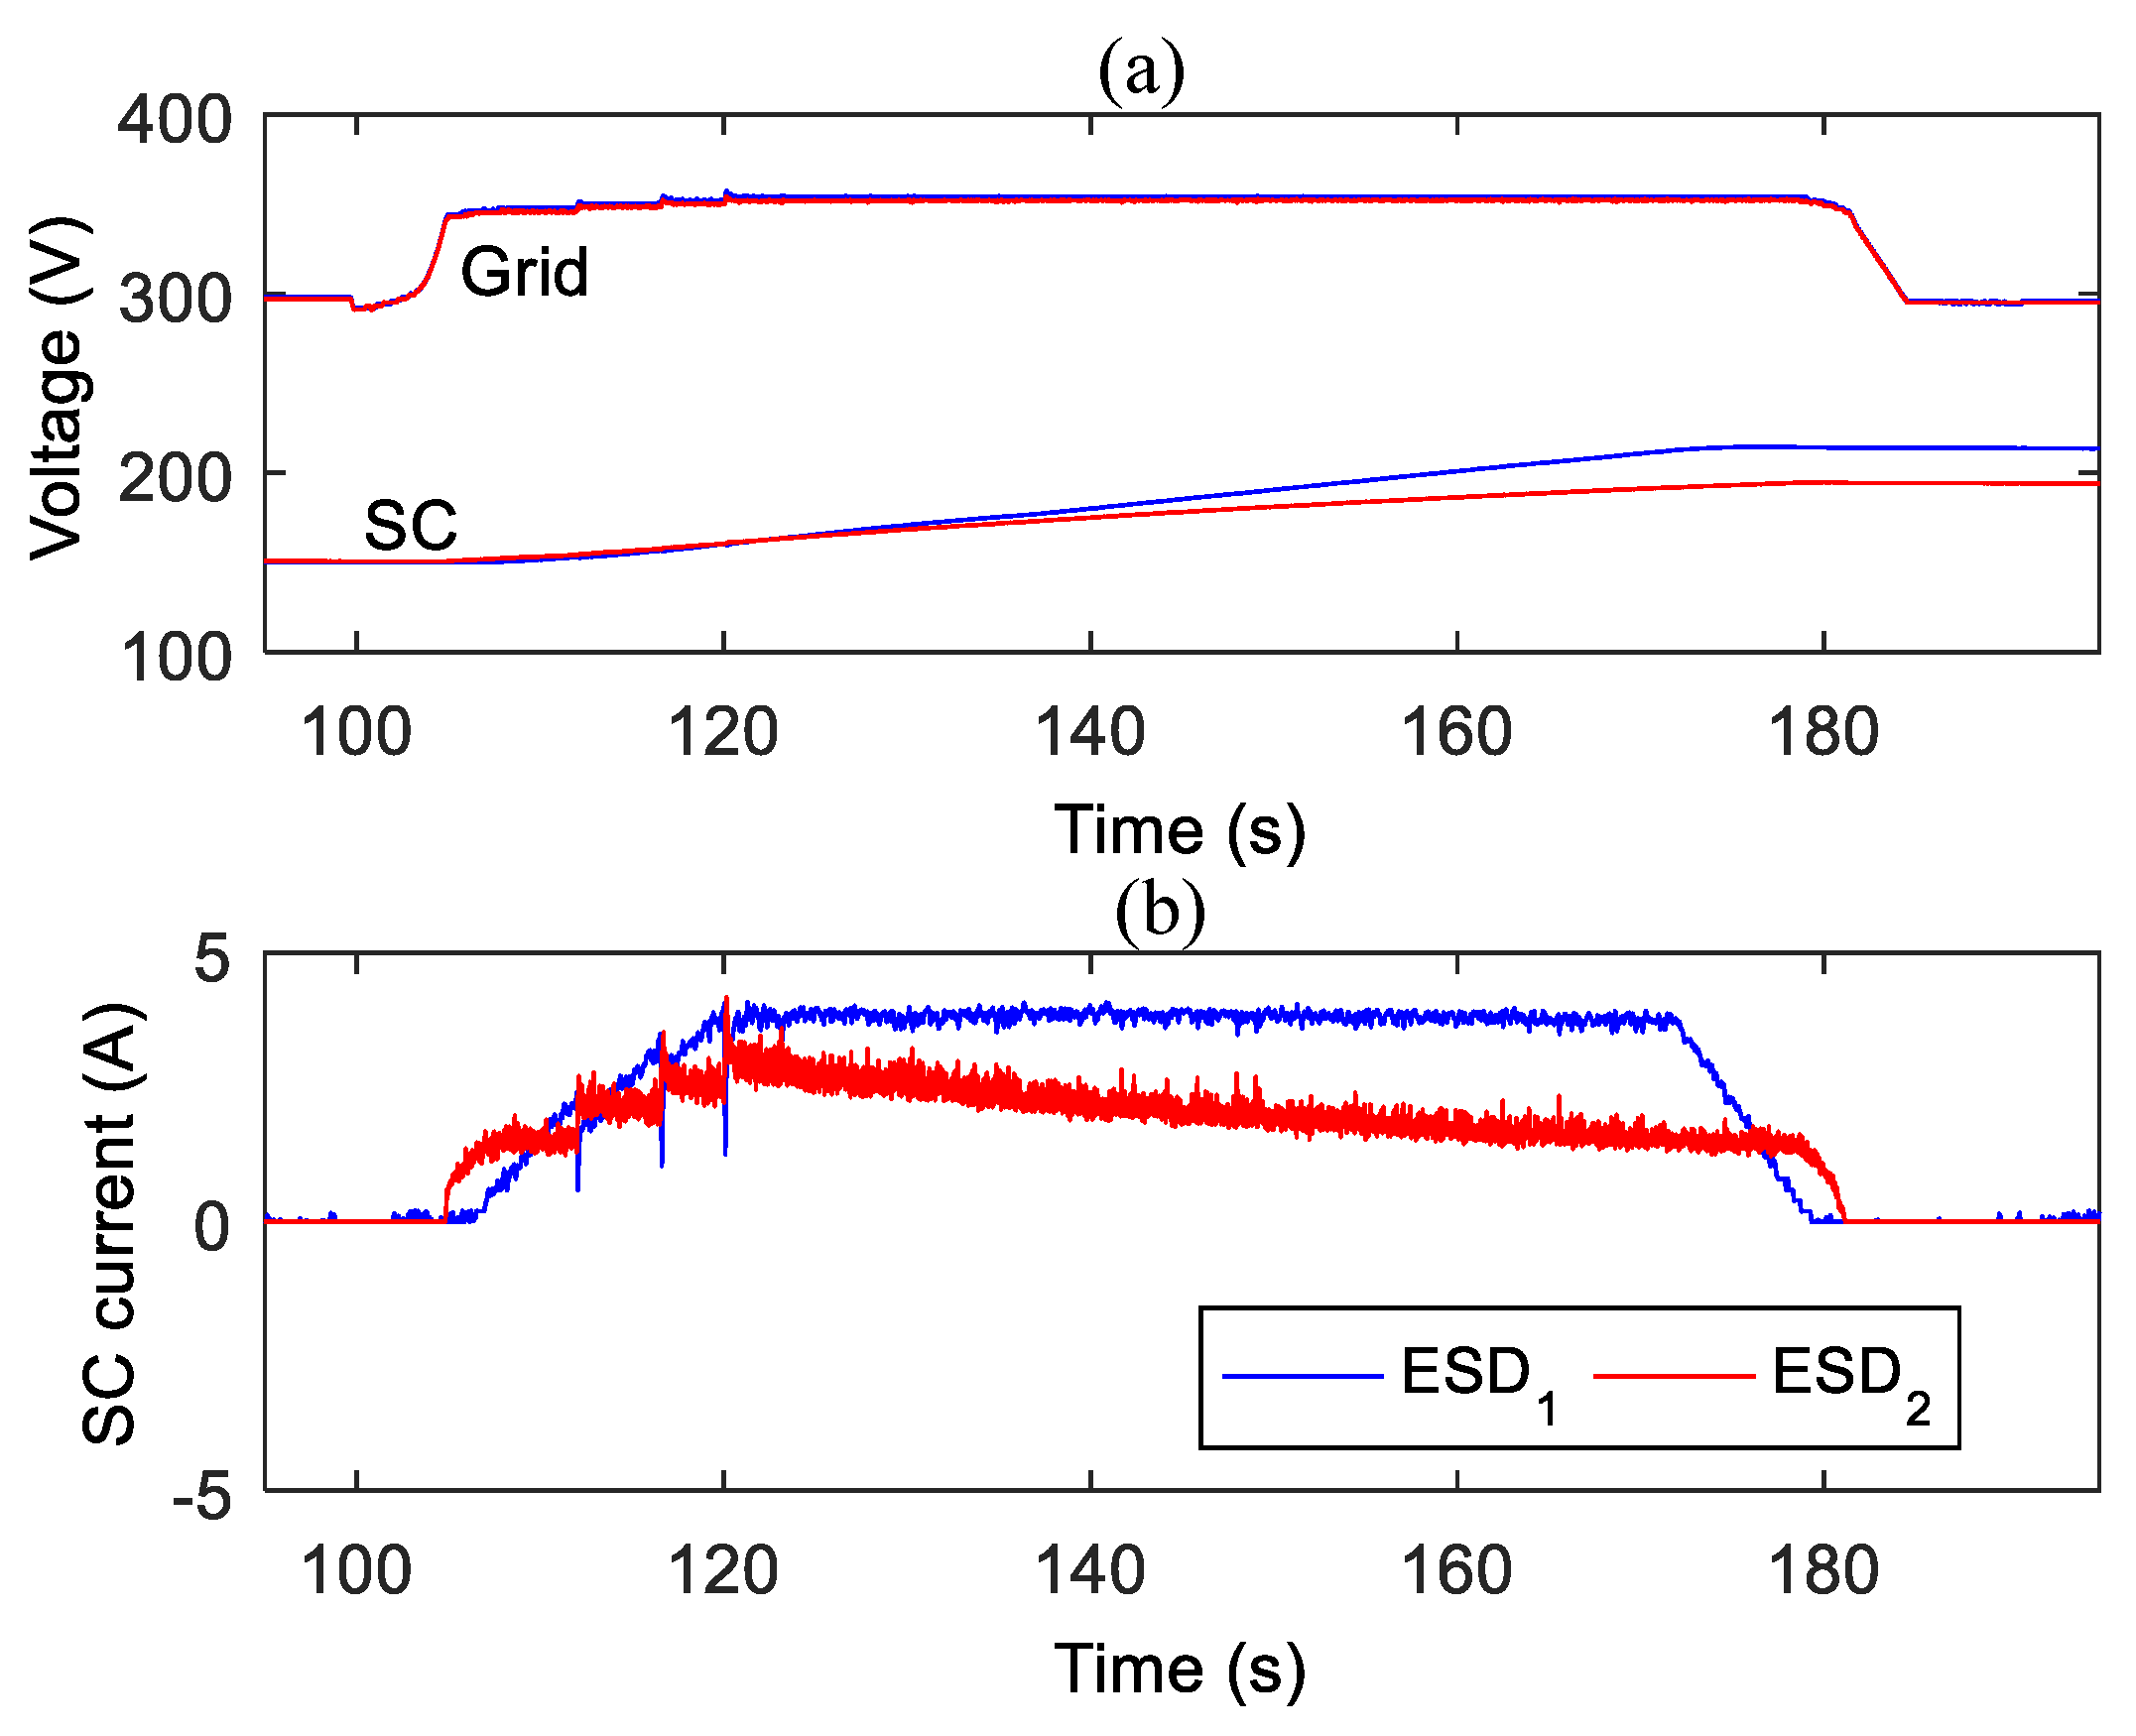
4. Experimental Verification

In order to verify the rationality of SCSCS proposed in this paper, a low-power SC-ESD platform is built in the laboratory. The experimental platform picture is shown as Figure 13, and the circuit topology is displayed as Figure 3; there is a simulated train using two motors and two ESDs E 1 and E 2 , which are from left to right, and the parameters of ESDs are the same. The parameters of the experimental platform are shown in Table 4. The charging voltage thresholds of E 1 and E 2 are both 320 V.
Figure 14 shows the waveforms of ESDs when the train is braking under the CTCS. From the figure, we can know that with the train braking, the traction network voltage rises, and E 1 starts charging to stabilize the traction network voltage at 320 V. At this time, the voltage of E 2 is also 320 V. There is no voltage difference between E 1 and E 2 ; therefore, the regenerative braking current of the train cannot flow through E 1 and E 2 . All of the current flows to E 1 , and the maximum current of S C 1 , i.e., the SC of E 1 , reaches up to 7 A, causing the voltage of S C 1 to rise rapidly. As the capacitance of SC in the laboratory is small, S C 1 reaches saturation and exits charging after a period of time. Then, E 2 starts charging in replacement of E 1 , and the maximum charging current is also 7 A. It can be seen that the stresses of the SCs of E 1 and E 2 are large.
After applying the SCSCS, the charging waveform of the ESD is shown in Figure 15, with the controlling parameters λ = 0 . 2 and γ = 2 . When the train starts braking, the voltages of the traction network at E 1 and E 2 rise, but there is still a small voltage difference, so that E 1 and E 2 can charge at the same time. The current waveform shows that the maximum charging currents of S C 1 and S C 2 are less than 4 A, which is lower than the currents under the CTCS. Compared with the current waveforms of SCs in Figure 14, the current ripples of SCs under SCSCS are larger, which is because the SCSCS takes the current of SCs as a feedback signal. Table 5 compares the mean value and variance of the SC currents under two control strategies, from the table, we can see after applying SCSCS that the current variance of the SCs is substantially reduced. In short, compared with the CTCS, the SCSCS shows a better current balance effect when recycling the regenerative energy.

5. Conclusions

In this paper, the characteristics of the traction power supply network are analyzed through the model of an urban train transit system, which includes the ESDs. The analysis shows that the charging threshold can affect the distribution of regenerative braking energy in the ESDs for different current; thus, the SCSCS of the SC is proposed based on adjusting the voltage and current, and the simulation results show that the proposed control strategy can achieve a good energy-sharing effect. Due to the fact that controlling parameters will be influenced by the SCSCS, a new optimization method using the genetic algorithm to optimize the controlling parameters is investigated in this paper, and with this proposed optimization method, the optimal solution can be obtained via an example. From the experiments, the SC current can be effectively balanced based on the controlling of the SCSCS compared with the CTCS; thus, this can also lead to the decrease of the voltage and current stress of SCs, which can help reduce the aging speed in practical applications, as well as reduce the application cost of the ESDs.
In the future, the design and optimization of high-power ESDs can be explored, in particular including high power DC/DC converter design, temperature simulation and thermal design of the SC and the field test with SCSCS.

Acknowledgments

This work was supported by the National Key Research and Development Plan under Grant SQ2016YFGX080146-06, 2016YFB1200506-18.

Author Contributions

Zhongping Yang and Fei Lin contributed analysis tools. Zhihong Yang and Feiqin Zhu analyzed the data. Huan Xia wrote the paper.

Conflicts of Interest

The authors declare no conflict of interest. The founding sponsors had no role in the design of the study; in the collection, analyses or interpretation of data; in the writing of the manuscript; nor in the decision to publish the results.

References

  1. Ibrahim, H.; Ilinca, A.; Perron, J. Energy storage systems—Characteristics and comparisons. Renew. Sustain. Energy Rev. 2008, 12, 1221–1250. [Google Scholar] [CrossRef]
  2. Ratniyomchai, T.; Hillmansen, S.; Tricoli, P. Recent developments and applications of energy storage devices in electrified railways. IET Electr. Syst. Transp. 2014, 4, 9–20. [Google Scholar] [CrossRef]
  3. Khaligh, A.; Li, Z. Battery, ultracapacitor, fuel cell, and hybrid energy storage systems for electric, hybrid electric, fuel cell, and plug-in hybrid electric vehicles: State of the art. IEEE Trans. Veh. Technol. 2010, 59, 2806–2814. [Google Scholar] [CrossRef]
  4. Ye, C.; Miao, S.; Lei, Q.; Li, Y. Dynamic energy management of hybrid energy storage systems with a hierarchical structure. Energies 2016, 9, 395. [Google Scholar] [CrossRef]
  5. Minakshi, M.; Meyrick, D.; Appadoo, D. Maricite (NaMn1/3Ni1/3Co1/3PO4)/activated carbon: Hybrid capacitor. Energy Fuels 2013, 27, 3516–3522. [Google Scholar] [CrossRef]
  6. Manickam, M. Lithium-free transition metal phosphate cathode for Li secondary batteries. J. Power Sources 2003, 113, 179–183. [Google Scholar] [CrossRef]
  7. Zhu, Y.; Murali, S.; Stoller, M.D.; Ganesh, K.J.; Cai, W.; Ferreira, P.J.; Pirkle, A.; Wallace, R.M.; Cychosz, K.A.; Thommes, M.; et al. Carbon-based supercapacitors produced by activation of graphene. Science 2011, 332, 1537–1541. [Google Scholar] [CrossRef] [PubMed]
  8. Lang, X.; Hirata, A.; Fujita, T.; Chen, M. Nanoporous metal/oxide hybrid electrodes for electrochemical supercapacitors. Nat. Nanotechnol. 2011, 6, 232–236. [Google Scholar] [CrossRef] [PubMed]
  9. Steiner, M.; Scholten, J. Energy storage on board of railway vehicles. In Proceedings of the 2005 European Conference on Power Electronics and Applications, Dresden, Germany, 11–14 September 2005. [Google Scholar]
  10. Rufer, A.; Barrade, P.; Hotellier, D. Power-electronic interface for a supercapacitor-based energy-storage substation in DC-transportation networks. EPE J. 2004, 14, 43–49. [Google Scholar] [CrossRef]
  11. Iannuzzi, D.; Lauria, D.; Tricoli, P. Optimal design of stationary supercapacitors storage devices for light electrical transportation systems. Optim. Eng. 2012, 13, 689–704. [Google Scholar] [CrossRef]
  12. Iannuzzi, D.; Pagano, E.; Tricoli, P. The use of energy storage systems for supporting the voltage needs of urban and suburban railway contact lines. Energies 2013, 6, 1802–1820. [Google Scholar] [CrossRef]
  13. Barrero, R.; Tackoen, X.; Van Mierlo, J. Stationary or onboard energy storage systems for energy consumption reduction in a metro network. Proc. Inst. Mech. Eng. Part F J. Rail Rapid Transit 2010, 224, 207–225. [Google Scholar] [CrossRef]
  14. Ciccarelli, F.; Iannuzzi, D.; Spina, I. Comparison of energy management control strategy based on wayside ESS for LRV application. Proceedings of IECON 2013—39th Annual Conference of the IEEE Industrial Electronics Society, Vienna, Austria, 10–13 November 2013. [Google Scholar]
  15. Teymourfar, R.; Asaei, B.; Iman-Eini, H. Stationary super-capacitor energy storage system to save regenerative braking energy in a metro line. Energy Convers. Manag. 2012, 56, 206–214. [Google Scholar] [CrossRef]
  16. Serna-Garcés, S.I.; Gonzalez Montoya, D.; Ramos-Paja, C.A. Sliding-mode control of a charger/discharger DC/DC converter for DC-bus regulation in renewable power systems. Energies 2016, 9, 245. [Google Scholar] [CrossRef]
  17. Iannuzzi, D.; Tricoli, P. Speed-based state-of-charge tracking control for metro trains with onboard supercapacitors. IEEE Trans. Power Electron. 2012, 27, 2129–2140. [Google Scholar] [CrossRef]
  18. Ciccarelli, F.; Iannuzzi, D.; Tricoli, P. Control of metro-trains equipped with onboard supercapacitors for energy saving and reduction of power peak demand. Transp. Res. Part C Emerg. Technol. 2012, 24, 36–49. [Google Scholar] [CrossRef]
  19. Iannuzzi, D.; Ciccarelli, F.; Lauria, D. Stationary ultracapacitors storage device for improving energy saving and voltage profile of light transportation networks. Transp. Res. Part C Emerg. Technol. 2012, 21, 321–337. [Google Scholar] [CrossRef]
  20. Ciccarelli, F.; Del Pizzo, A.; Iannuzzi, D. Improvement of energy efficiency in light railway vehicles based on power management control of wayside lithium-ion capacitor storage. IEEE Trans. Power Electron. 2014, 29, 275–286. [Google Scholar] [CrossRef]
  21. Barrero, R.; Tackoen, X.; Van Mierlo, J. Improving energy efficiency in public transport: Stationary supercapacitor based energy storage systems for a metro network. In Proceedings of the Vehicle Power and Propulsion Conference (VPPC’08), Harbin, China, 3–5 September 2008. [Google Scholar]
  22. Grbović, P.J.; Delarue, P.; Le Moigne, P.; Bartholomeus, P. Modeling and control of the ultracapacitor-based regenerative controlled electric drives. IEEE Trans. Ind. Electron. 2011, 58, 3471–3484. [Google Scholar] [CrossRef]
  23. Lin, F.; Li, X.; Zhao, Y.; Yang, Z. Control strategies with dynamic threshold adjustment for supercapacitor energy storage system considering the train and substation characteristics in urban rail transit. Energies 2016, 9, 257. [Google Scholar] [CrossRef]
  24. Cao, J.; Emadi, A. A new battery/ultracapacitor hybrid energy storage system for electric, hybrid, and plug-in hybrid electric vehicles. IEEE Trans. Power Electron. 2012, 27, 122–132. [Google Scholar]
  25. Arabali, A.; Ghofrani, M.; Etezadi-Amoli, M.; Fadali, M.S.; Baghzouz, Y. Genetic-algorithm-based optimization approach for energy management. IEEE Trans. Power Deliv. 2013, 28, 162–170. [Google Scholar] [CrossRef]
  26. Carapellucci, R.; Giordano, L. Modeling and optimization of an energy generation island based on renewable technologies and hydrogen storage systems. Int. J. Hydrogen Energy 2012, 37, 2081–2093. [Google Scholar] [CrossRef]
  27. Ismail, M.; Moghavvemi, M.; Mahlia, T. Characterization of PV panel and global optimization of its model parameters using genetic algorithm. Energy Convers. Manag. 2013, 73, 10–25. [Google Scholar] [CrossRef]
Figure 1. Structural diagram of the DC traction power system. ESD, energy storage device.
Energies 10 00520 g001
Figure 2. Model of ESDs in train braking mode.
Energies 10 00520 g002
Figure 3. Structural diagram of ESDs using supercapacitor state-based control strategy (SCSCS).
Energies 10 00520 g003
Figure 4. Simulation result with the constant threshold control strategy (CTCS). (a) ESD voltage; (b) SC voltage; (c) ESD current; (d) SC current.
Energies 10 00520 g004
Figure 5. Simulation results under the SCSCS with the controlling parameters λ = 0 . 2 and γ = 0 . 025 . (a) ESD voltage; (b) SC voltage; (c) ESD current; (d) SC current.
Energies 10 00520 g005
Figure 6. Multi-train operation model.
Energies 10 00520 g006
Figure 7. Diagram of optimizing the controlling parameter method.
Energies 10 00520 g007
Figure 8. Train operation diagram of different headways. (a) Headway in 300 s; (b) Headway in 600 s.
Energies 10 00520 g008
Figure 9. Curves with the charging voltage. (a) Energy consumption of brake resistance; (b) The output energy of the traction substation; (c) Current variance of SC; (d) Mean current of SC.
Energies 10 00520 g009
Figure 10. Optimization process of objective function. (a) Current variance of SC; (b) Mean current of SC.
Energies 10 00520 g010
Figure 11. The comparison in the 300-s headway. (a) SC voltages under the CTCS; (b) SC currents under the CTCS; (c) SC voltages under the SCSCS; (d) SC currents under the SCSCS.
Energies 10 00520 g011
Figure 12. The comparison in the 600-s headway. (a) SC voltages under the CTCS; (b) SC currents under the CTCS; (c) SC voltages under the SCSCS; (d) SC currents under the SCSCS.
Energies 10 00520 g012
Figure 13. Photo of the experimental platform.
Energies 10 00520 g013
Figure 14. Waves of ESDs under the CTCS. (a) ESDs and grid voltages under the CTCS; (b) ESDs currents under the CTCS.
Energies 10 00520 g014
Figure 15. Waves of ESDs under the SCSCS. (a) ESDs and grid voltages under the SCSCS; (b) ESDs currents under the SCSCS.
Energies 10 00520 g015
Table 1. Simulation consequences for different controlling parameters.
ParametersValues
λ 00.02
γ 00.025
Voltage of SC (V) E 1 559.6492.1
E 2 570.6475.8
E 3 312.5435.3
E 4 312.5416.9
RMS current of SC (A) E 1 2230.31596.9
E 2 2282.71445.4
E 3 01083.5
E 4 0919.4
Table 2. Parameter settings of the optimization model.
ParametersValue
Population size24
Genetic algebra70
Individual length20
Generation gap0.95
Crossover probability0.7
Mutation probability0.01
λ 0 to 0.8
γ 0 to 0.08
Table 3. Optimization results of the genetic algorithm.
ParametersValue
Headway (s)300600
Minimum variance in CTCS (A 2 )441.4106.3
Optimal variance (A 2 )32.1961.29
Optimal mean value (A)83.7976.07
λ 0.33420.0236
γ 0.33530.0208
Table 4. Parameters of the experimental platform.
ParametersValueUnit
Capacitance of SC3.2F
Nominal voltage of SC270V
Series resistance of SC0.84 Ω
Initial voltage of SC150V
No load voltage300V
Switch frequency5kHz
Inductance of filter inductor7.5mH
Line impedance1 Ω
Table 5. Comparison of the charging current for the mean value and variance.
Control StrategyVariance (A 2 )Mean Value (A)
CTCS1.4022.043
SCSCS0.40751.963

