
Experimental Investigation of Stress Rate and Grain Size on Gas Seepage Characteristics of Granular Coal

1
School of Resources & Safety Engineering, Central South University, Changsha 410083, Hunan, China
2
State Key Laboratory for Geomechanics & Deep Underground Engineering, China University of Mining & Technology, Xuzhou 221116, Jiangsu, China
3
GeoEnergy Research Centre (GERC), University of Nottingham, Nottingham NG7 2RD, UK
4
British Geological Survey, Environmental Science Centre, Keyworth, Nottingham NG12 5GG, UK
*
Author to whom correspondence should be addressed.
Energies 2017, 10(4), 527; https://doi.org/10.3390/en10040527
Submission received: 19 February 2017
/
Revised: 6 April 2017
/
Accepted: 10 April 2017
/
Published: 13 April 2017
(This article belongs to the Special Issue Oil and Gas Engineering)
Abstract
:Coal seam gas, held within the inner pores of unmineable coal, is an important energy resource. Gas release largely depends on the gas seepage characteristics and their evolution within granular coal. To monitor this evolution, a series of experiments were conducted to study the effects of applied compressive stress and original grain size distribution (GSD) on the variations in the gas seepage characteristics of granular coal samples. Grain crushing under higher stress rates was observed to be more intense. Isolated fractures in the larger diameter fractions transformed from self–extending to inter-connecting pathways at a critical compressive stress. Grain crushing was mainly caused by compression and high-speed impact. Based on the test results of the original GSD effect, the overall process of porosity and permeability evolution during compression can be divided into three different phases: (1) rapid reduction in the void ratio; (2) continued reduction in the void ratio and large particle crushing; and (3) continued crushing of large particles. Void size reduction and particle crushing were mainly attributed to the porosity and permeability decreases that occurred. The performance of an empirical model, for porosity and permeability evolution, was also investigated. The predictive results indicate that grain crushing caused permeability increases during compression, and that this appeared to be the main cause for the predictive values being lower than those obtained from the experimental tests. The predictive accuracy would be the same for samples under different stress rates and the lowest for the sample with the highest proportion of large grain diameters.
1. Introduction
Coal seam gas, held within the inner pores in unmineable coal, is an important energy resource. However, as shown in Figure 1, longwall mining may commonly form four zones of disturbance after disturbing the overlying strata of a coal seam [1]; this makes the coal seam gas within the coal be rapidly released into the gob. Gas releases from coal during mining not only causes engineering accidents (gas outbursts, coal and gas outburst, etc.) [2,3], but also contributes to global warming by the greenhouse effect [4]. The permeability increased by up to three orders of magnitude in the fractured (caved) zone and is usually several orders of magnitude greater than that of the intact coal [5]. Such a high permeability in coal threatens the normal storage and transport of gas within the coal seam [6].
Significant experimental, numerical, or theoretical methods were conducted to understand the properties of granular coal, such as density, ash, and particle size effects on the fixed characteristics [7,8,9,10,11], coal particle moving [12], fragmentation behavior [13], coal combustion [14], etc. Adánez et al. [7] conducted a series of experiments and proposed an equation to evaluate the transport velocities of sand and coal particles. For coal blocks having larger particle diameters, the gas desorbs from its micropores, diffuses into macropores, and then seeps under a pressure gradient [15,16]. Hu et al. [17] experimentally and numerically investigated the scale effects and formation mechanism of gas releases from coal particles, and a bidisperse diffusion model was established to predict the experimental results; they found that the scale effects of gas releases from coal are controlled by the multi-scale pore structure of coal. In studies conducted using coal core samples as opposed to granular coal, it was found that under constant total stress conditions, the permeability for adsorbed gases increases when the pore pressure is reduced due to coal swelling [18,19,20], and decreases with increasing pore pressure due to matrix shrinkage [21].
Gas permeability is also influenced by fracture geometry [6,22], fracture geometry and water-content [23], and the presence of water [24]. The permeability evolution of granular coal was tested and the particle size [25] and temperature [26] were proven as affecting factors. According to the experimental studies of different rocks [27,28], altered permeability strongly relates to the original particle size distribution. It is clear that the seepage characteristics of granular coal are highly affected by the stress condition and granular size distribution. In order to understand the impact on seepage characteristics evolution, we first present the test coal samples and experimental equipment in Section 2. The details of the testing procedure and measurement principle for porosity and permeability evolution are given in Section 3. Section 4 analyses the test data for the compressive stress state and grain size mixture effect on the seepage characteristics and particle crushing during compression, and builds a model for porosity and permeability prediction.
2. Granular Coal Samples and Testing Equipment
2.1. Preparation of Granular Coal
Lightly weathered coal blocks were taken from the coal seam No. 2 of the Yuheng coal field in Yulin City of China. The dry density of the coal blocks was . The coal blocks were first hammered into particles of less than 20 mm diameter. The granular coal particles were then separated into seven size ranges: 20–15 mm, 15–12 mm, 12–10 mm, 10–8 mm, 8–5 mm, 5–2.5 mm, and <0.25 mm. These groups were mixed according to the well-known Fuller equation in Equation (1) [29] to produce several different particle gradings.
where j is the size range of the granular coal, and its maximum value is 7 according to the sample preparation; D is the largest grain diameter, and D = 20 in this test; dj is the largest grain diameter in the range of j sample; pj is the mass ratio of the size range of the j sample; and n is the control parameter of the grain size distribution (GSD) for the sample, and then the seven granular ranges are mixed by n = 0.4, 0.7, 1, 1.3, and 1.6, respectively. The GSD curve for the five mixtures is shown in Figure 2.
2.2. Sample Arrangement
The gas adsorbate used was N2, with a bulk gas density of ρg = 1.16 kg/m3 and kinetic viscosity of μg = 1.76 × 10⁻⁵ Pa·s under laboratory conditions (25 °C at 100 kPa). As shown in Figure 3 and Table 1, in Test 1, samples (a, b, and c) were used to monitor the effect of the compressive stress rate on the seepage characteristics; their size mixtures were the same, i.e., n = 1; the stress rate for paths OA, OB, and OC were 0.01 kN/s (sample a), 0.02 kN/s (sample b), and 0.04 kN/s (sample c), respectively, and the corresponding loading times were t1, t2 and t3. According to the in-situ conditions of the Yuheng coal field, the buried depth z of the coal seam is about 320 m, based on , where is the density of overburden strata. Therefore, the compressive stress was set as 8 MPa, where . In Test 2, samples (d, e, f, g, and h) were used to monitor the original GSD effect; their loading paths were the same, i.e., the stress rate was 0.02 kN/s; the original GSD for samples d, e, f, g, and h were n = 0.4, 0.7, 1, 1.3, and 1.6, respectively. The compressive stress of 8 MPa was achieved at .
2.3. Testing System Design
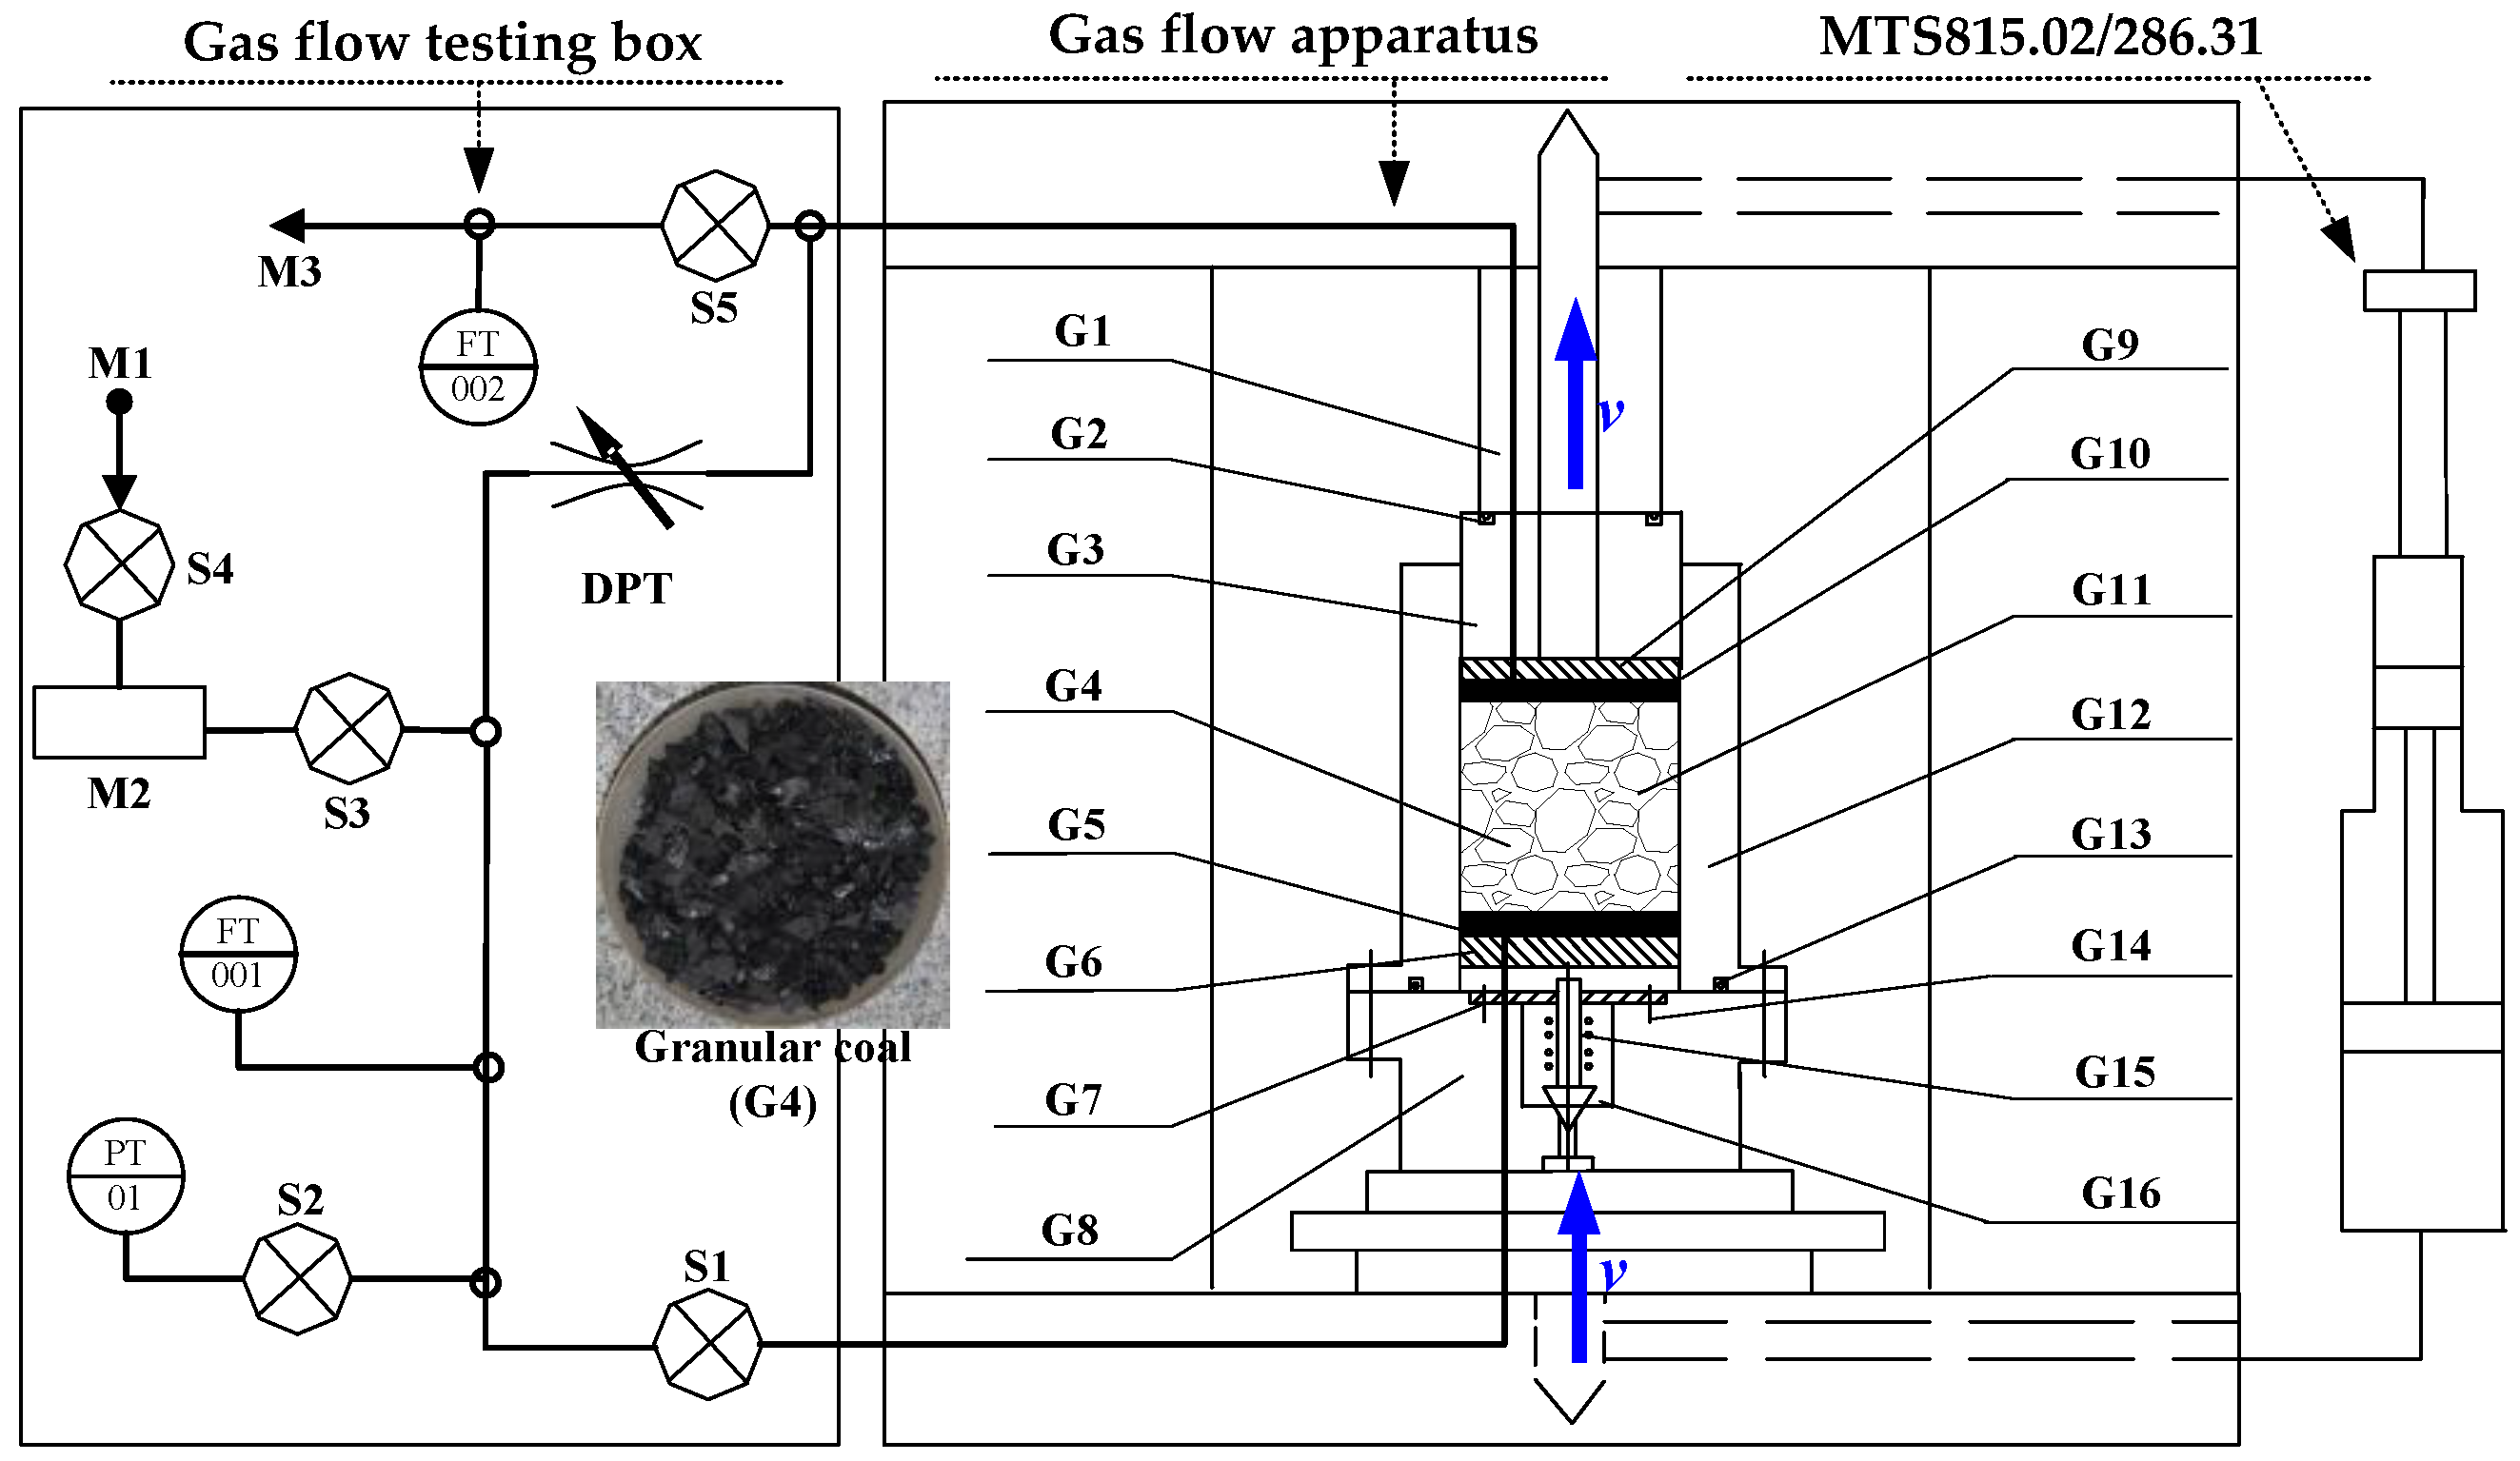
The in-house testing system principle of operation is illustrated in Figure 4. The gas seepage testing box produces only a 5% pressure drop for a 5 MPa gas per 10 min. MTS815.02/286.31 [30] was used to provide the compressive stress for controlling the height of the coal sample (G4). In the gas seepage apparatus, a loading plate (G1) was utilized to maintain the compressive stress. Porous disks (G6) and (G9) enable the gas to seep freely. An epoxy resin separation layer (G11) separates the coal specimen (G4) and the vessel (G12), and prevents annular gas seepage. The triaxial base of the system and cylinder tube are connected by a one–way valve, which includes the base plate (G7), valve chest (G8), mechanical bolt (G14), mechanical spring (G15), and valve core (G16). O–rings (G2) and (G13) were utilized to enclose the gaps between the piston (G3) and the vessel (G12), base plate (G7), and valve chest (G8).
3. Measurement Principle and Testing Procedure
3.1. Porosity Measurement
As shown in Figure 5, based on the vessel height (180 mm), the deviator height (110 mm), the porous disk thickness (9 mm), the felt pad thickness (2 mm), was the height of the deviator that exceeds the vessel at compressive stress .
The value at compressive stress can be measured by linear variable displacement transformer (LVDT) during loading. Therefore, the porosity at each sample height at compressive stress can be calculated by Equation (2):
where and are the mass and density of the granular coal sample, respectively, is the radius of the cylindrical tube, which in the test was . The porosity variation at compressive stress was calculated by Equation (3):
3.2. Permeability Measurement
For Darcy seepage, Equation (4) describes the relation between the pore pressure gradient and the gas seepage velocity :
where is the pore pressure, is the vertical axis going through the center of the sample, is the gas kinetic viscosity, and is the permeability of the granular coal. The Darcy equation (Equation (4)) can be used to model the gas flow in the granular coal sample, which is further verified by the Reynolds number () [31]:
where is the characteristic size, and for the non–consolidated granular coal sample, is the average diameter of the grains, while for the consolidated granular sample, is the average value of the capillary diameters. Darcy flow follows if is lower than 10 [32].
In this test, the gas flux and pore pressure are all measured for the calculation of the seepage characteristics. When gas compressibility was considered, we assume , , and were the pore pressure, gas density, and velocity at the intake boundary (gas in), respectively. The downstream end was connected to the outtake boundary , , and (gas out), respectively.
The gas equation of state is:
where, R is the universal gas constant and T is the temperature of the sample.
The continuity equation is:
where is the gas mass flow rate, is the gas density, A is the cross-sectional area of the sample, and in this test.
For simultaneous Equations (6) and (7), we have:
Substituting Equation (8) into Equation (4), we have:
Let , then integrate Equation (9), to obtain:
Substitute the boundary condition when into Equation (10), and we obtain . Then,
Therefore, the permeability at each sample height at compressive stress can be calculated by:
where and are the pore pressure and gas velocity at the intake boundary (gas in), and is the pore pressure at the outtake boundary (gas out) at the compressive stress . That means the permeability can be calculated by testing , , and at the compressive stress, .
3.3. Testing Procedure
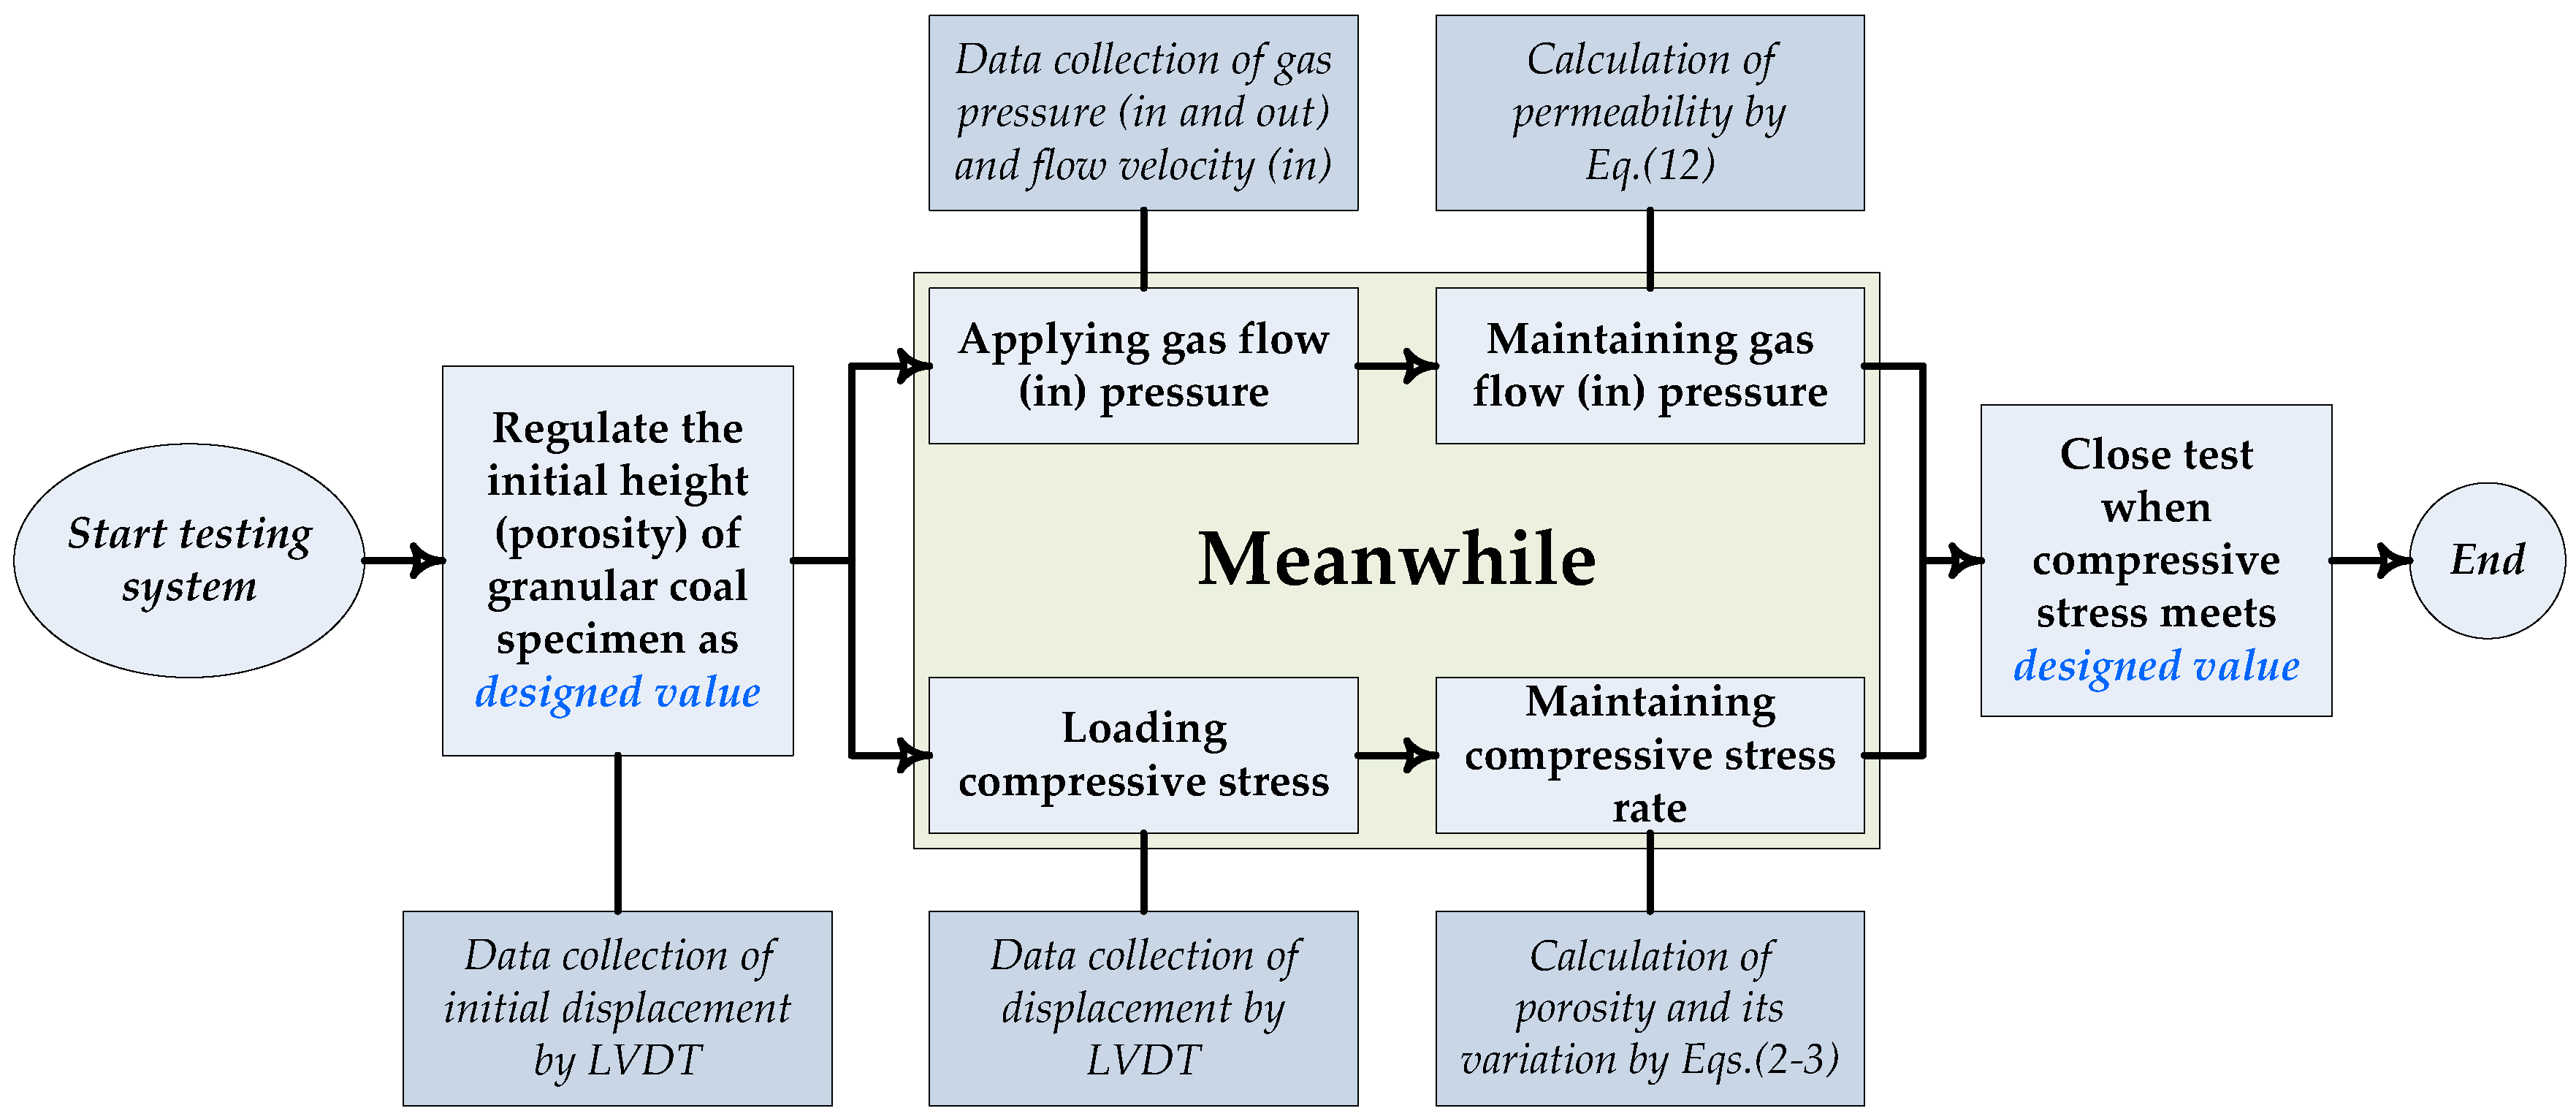
The experimental testing strictly observed the following procedural steps:
- (1)
- Regulate the initial height (porosity) of granular coal as a designed value before loading.
At the initial stage, the specimen height was set at 110 mm, which means the initial height . Therefore, the initial height was fixed as 82 mm. Based on Equation (2), the initial porosity of each sample was .
- (2)
- Apply and maintain the compressive stress and gas pressure to the sample.
As shown in Figure 3, in test 1, we applied the stress rate in paths OA, OB, and OC as 0.01 kN/s (sample a), 0.02 kN/s (sample b), and 0.04 kN/s (sample c), respectively, and the gas in pressure at the intake boundary was fixed at 0.600 MPa; in test 2, we applied the stress rate in path OB as 0.02 kN/s (samples d, e, f, g, and h), the gas in pressure at the intake boundary was also fixed as 0.600 MPa.
Meanwhile, the compressive stress and gas pressure were applied to the coal sample and kept steady until the completion of step 3. In this step, the displacement of the coal sample could be measured by the LVDT sensors. The porosity and its variation at each time interval could be calculated by Equations (2) and (3). Meanwhile, was fixed at 0.600 MPa, and the and measurement values were used to calculate the permeability based on Equation (12).
- (3)
- The test was ended when the compressive stress met the designed value.
The final compressive stress for each test was fixed as 8 MPa, based on Equation (13):
where, , and for the samples (a, b and c) were 0.01 kN/s, 0.02 kN/s, and 0.04 kN/s respectively, therefore the time to close the test was .
The entire test procedure is shown in Figure 6. To check the repeatability and maintain accuracy during the test, each coal sample was recorded as the mean average of three repeat tests.
4. Testing Results and Discussion
In Kong’s research [31], the upper limit of Re suitable for the Darcy law was 10 and for different porous media this limit is slightly different. We calculated the Re according to Equation (5) to prove that the Darcy equation (Equation (4)) can be used to model the gas flow in granular coal samples. Sample (a) was taken as an example; the average diameter was 10 mm at the initial stage and it will decrease during crushing. Therefore, Re can be calculated based on Equation (5) by considering mm. As shown in Table 2, the porosity, gas in flow rate, gas out pressure, Re, and permeability were calculated. The maximum Re for sample (a) is 8.095, which is lower than 10 and Darcy flow follows.
4.1. Effect of Stress Rate on the Seepage Characteristics Evolution
4.1.1. Effect of Compressive Stress Rate on the Porosity and Permeability Evolution
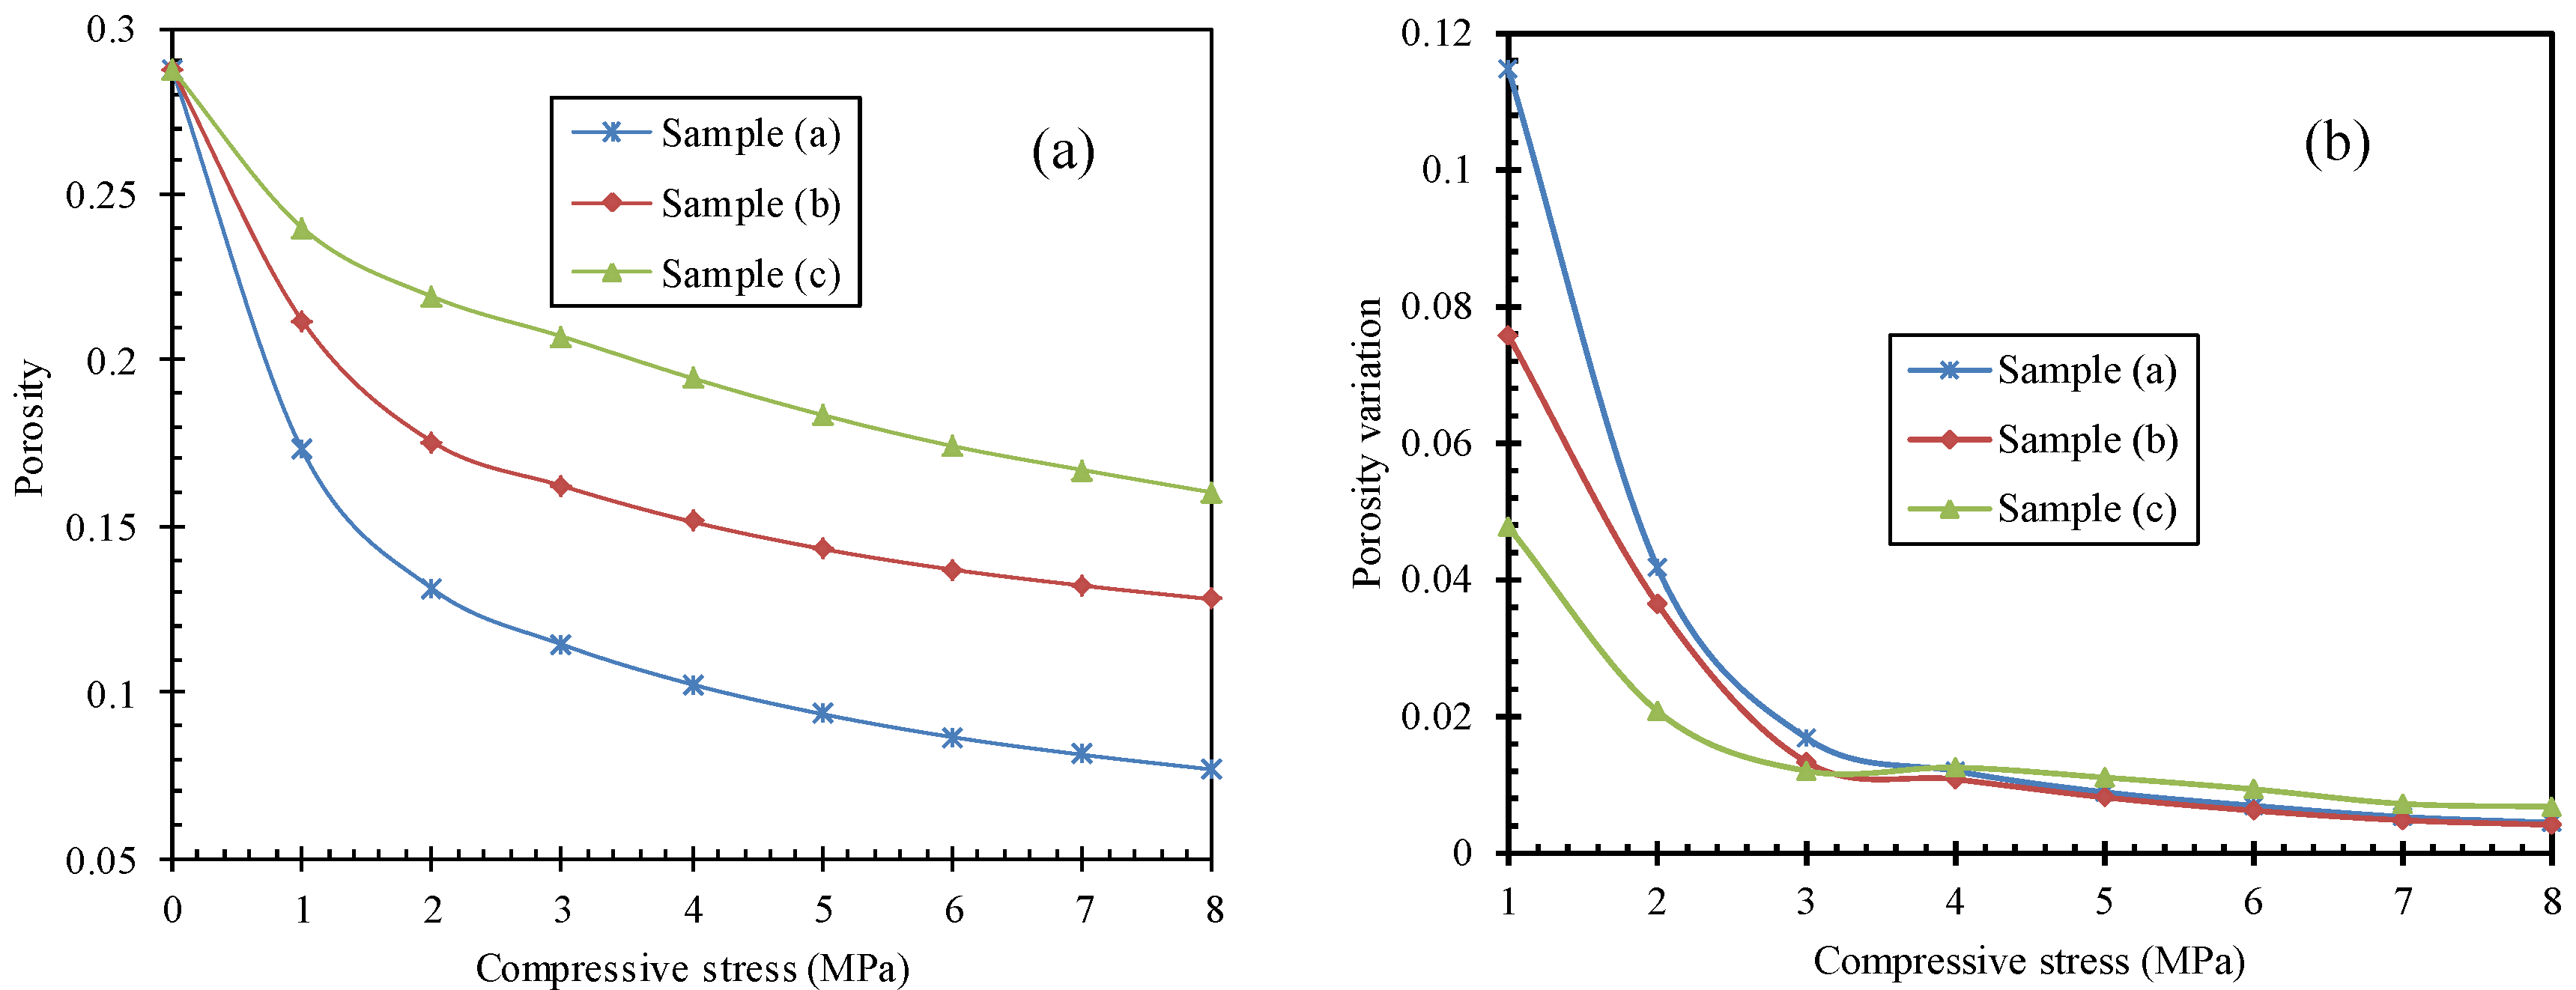
The porosity–compressive stress curve and porosity variation–compressive stress curve for samples (a, b and c) are presented in Figure 7, based on Equations (2) and (3), respectively. Figure 8 illustrates the relationship between the permeability evolutions of samples (a, b, and c). It can be seen from these figures that in general the porosity, permeability, and void space all decrease during compression. At the same compressive stress, the porosity and permeability of coal samples under higher stress rates appear larger, which means the porosity and permeability decrease to a lesser degree. Compared with the porosity and permeability at the beginning (compressive stress: 0 MPa), the final porosity (compressive stress: 8 MPa) of samples (a, b, and c) decrease by 73.37%, 55.54%, and 44.35%, respectively. The corresponding final permeability values were 0.021 μm2, 0.751 μm2, and 1.616 μm2, respectively, where the value of sample (c) is almost two orders of magnitude greater than that of sample (a).
Figure 7b shows that the porosity variation decreases during compression, due to a progressive reduction in void diameter. Four MPa appeared to be the critical compressive stress for porosity variation, and the porosity variation for sample (a) was larger than that for the other samples before the critical compressive stress, which means that the voids in sample (a) were wider than those in the other samples. The porosity variation as well as the void diameter in the three samples was almost the same at the critical compressive stress.
As shown in Figure 8, the permeability under the larger stress rate has higher values due to the sample being subjected to a larger stress rate. This most likely occurs because the compressive stress causes a greater degree of closure of the void space. However, there were some abnormal increases in permeability at the critical compressive stress. As seen in Figure 8, the critical compressive stress for samples (a, b, and c) was 2–3 MPa, 4–5 MPa, and 5–6 MPa, respectively, with a corresponding porosity of 0.13–0.11, 0.15–0.14, and 0.18–0.17. At the critical compressive stress, isolated fractures in the larger grain size sample achieved the transformation from self–extension to inter-connection, which increases the permeability rapidly.
4.1.2. Effect of Stress Rate on the Grain Size Distribution after Crushing
A re-distribution of particle sizes was observed after testing. Using sieve analysis, the GSD was determined as shown in Table 3, and the variation is shown in Figure 9, compared with the original GSD (Test 1) in Table 1. The mass of <5 mm diameter grains was increased due to attrition of the particles in the 5–20 mm range. The mass of the size fraction 20–8 mm decreased, but increased for the <5 mm size fraction, when at a lower stress rate. The fraction of particles in the 8–5 mm size range reduced for samples (a and b) but increased for sample (c); which indicates that particle crushing could be occurring by compression and fracture.
4.2. Effect of Original Grain Size Distribution on the Seepage Characteristics
4.2.1. Effect of Original Grain Size Distribution on the Porosity and Permeability Evolution
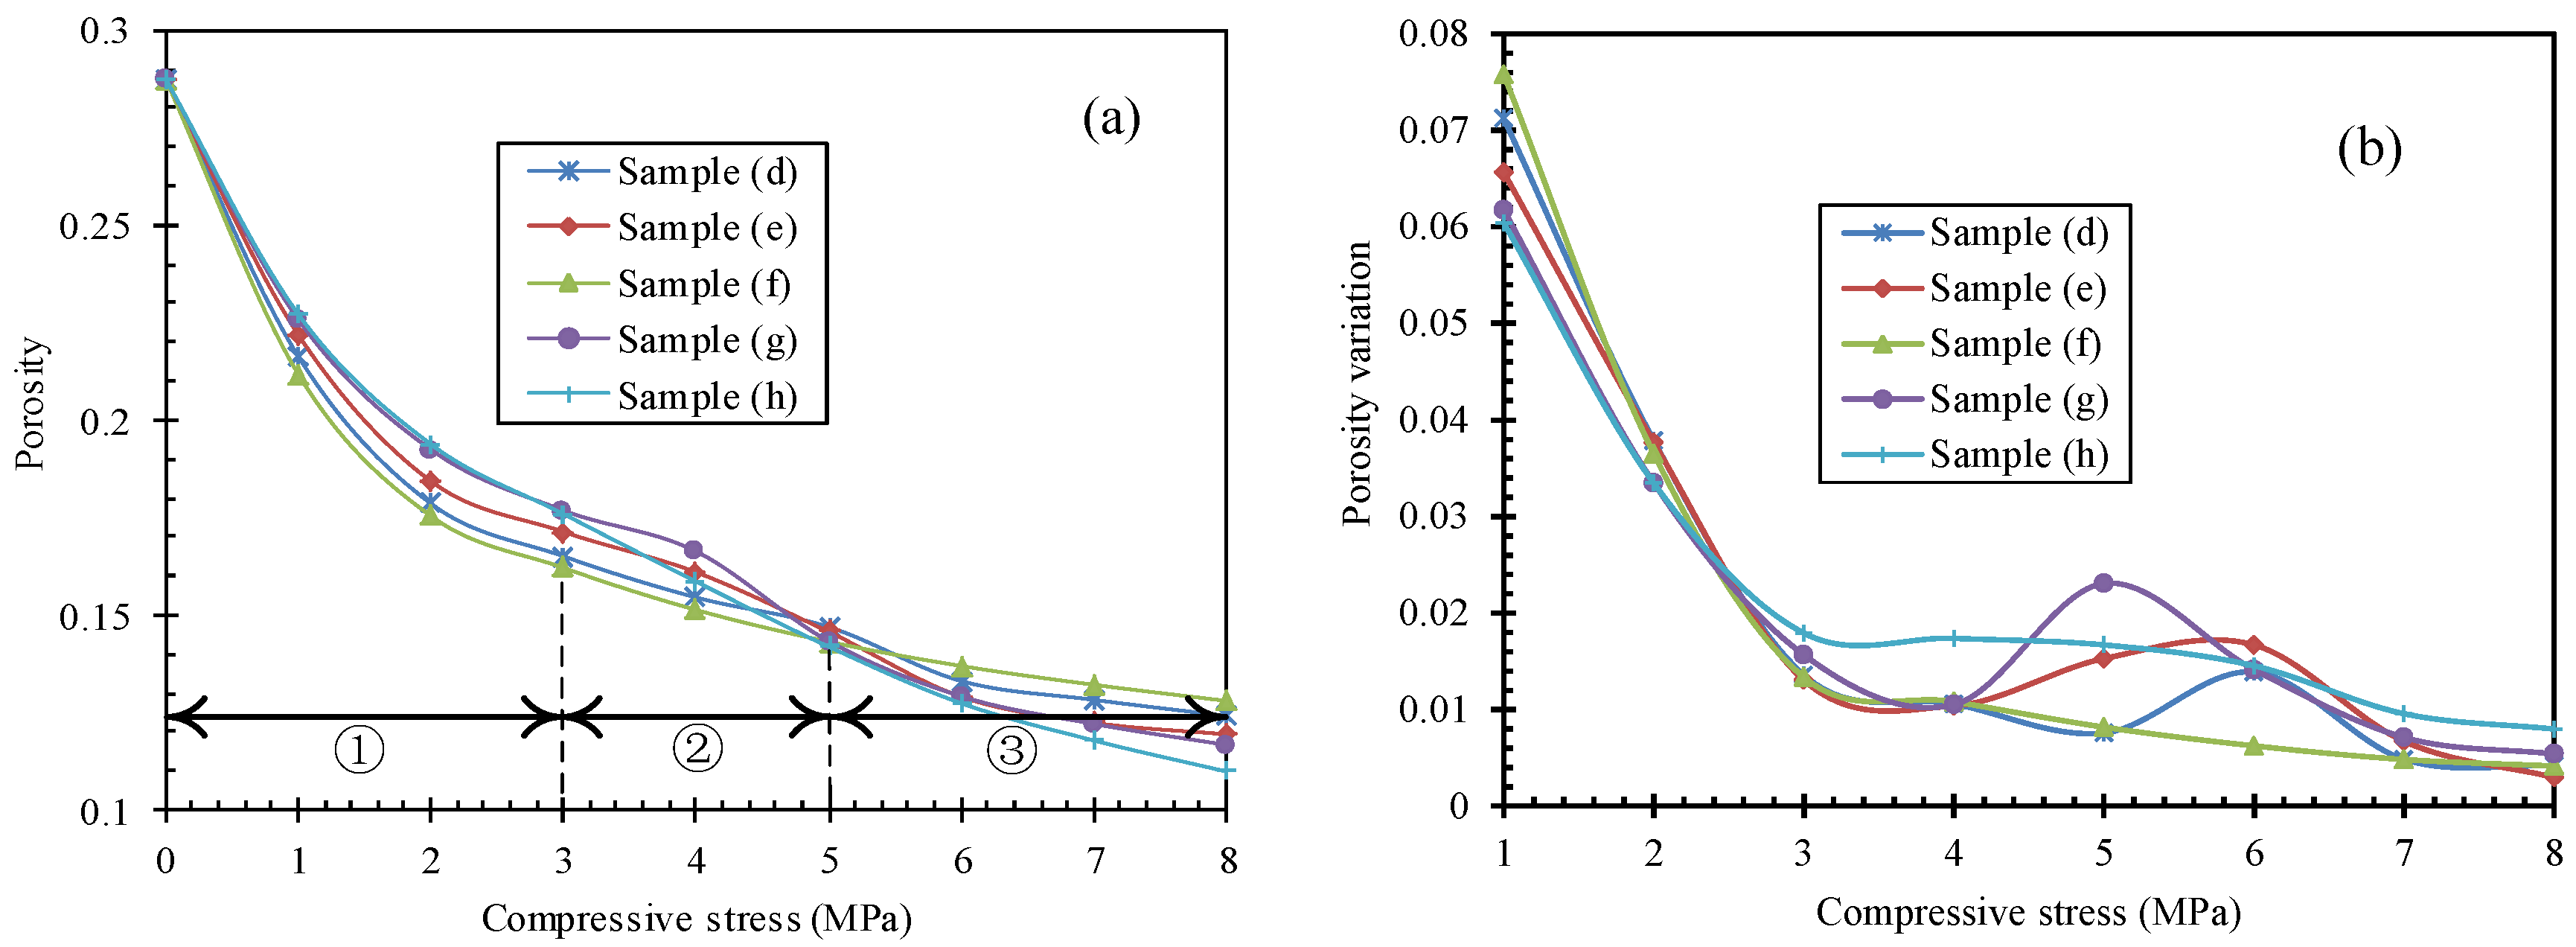
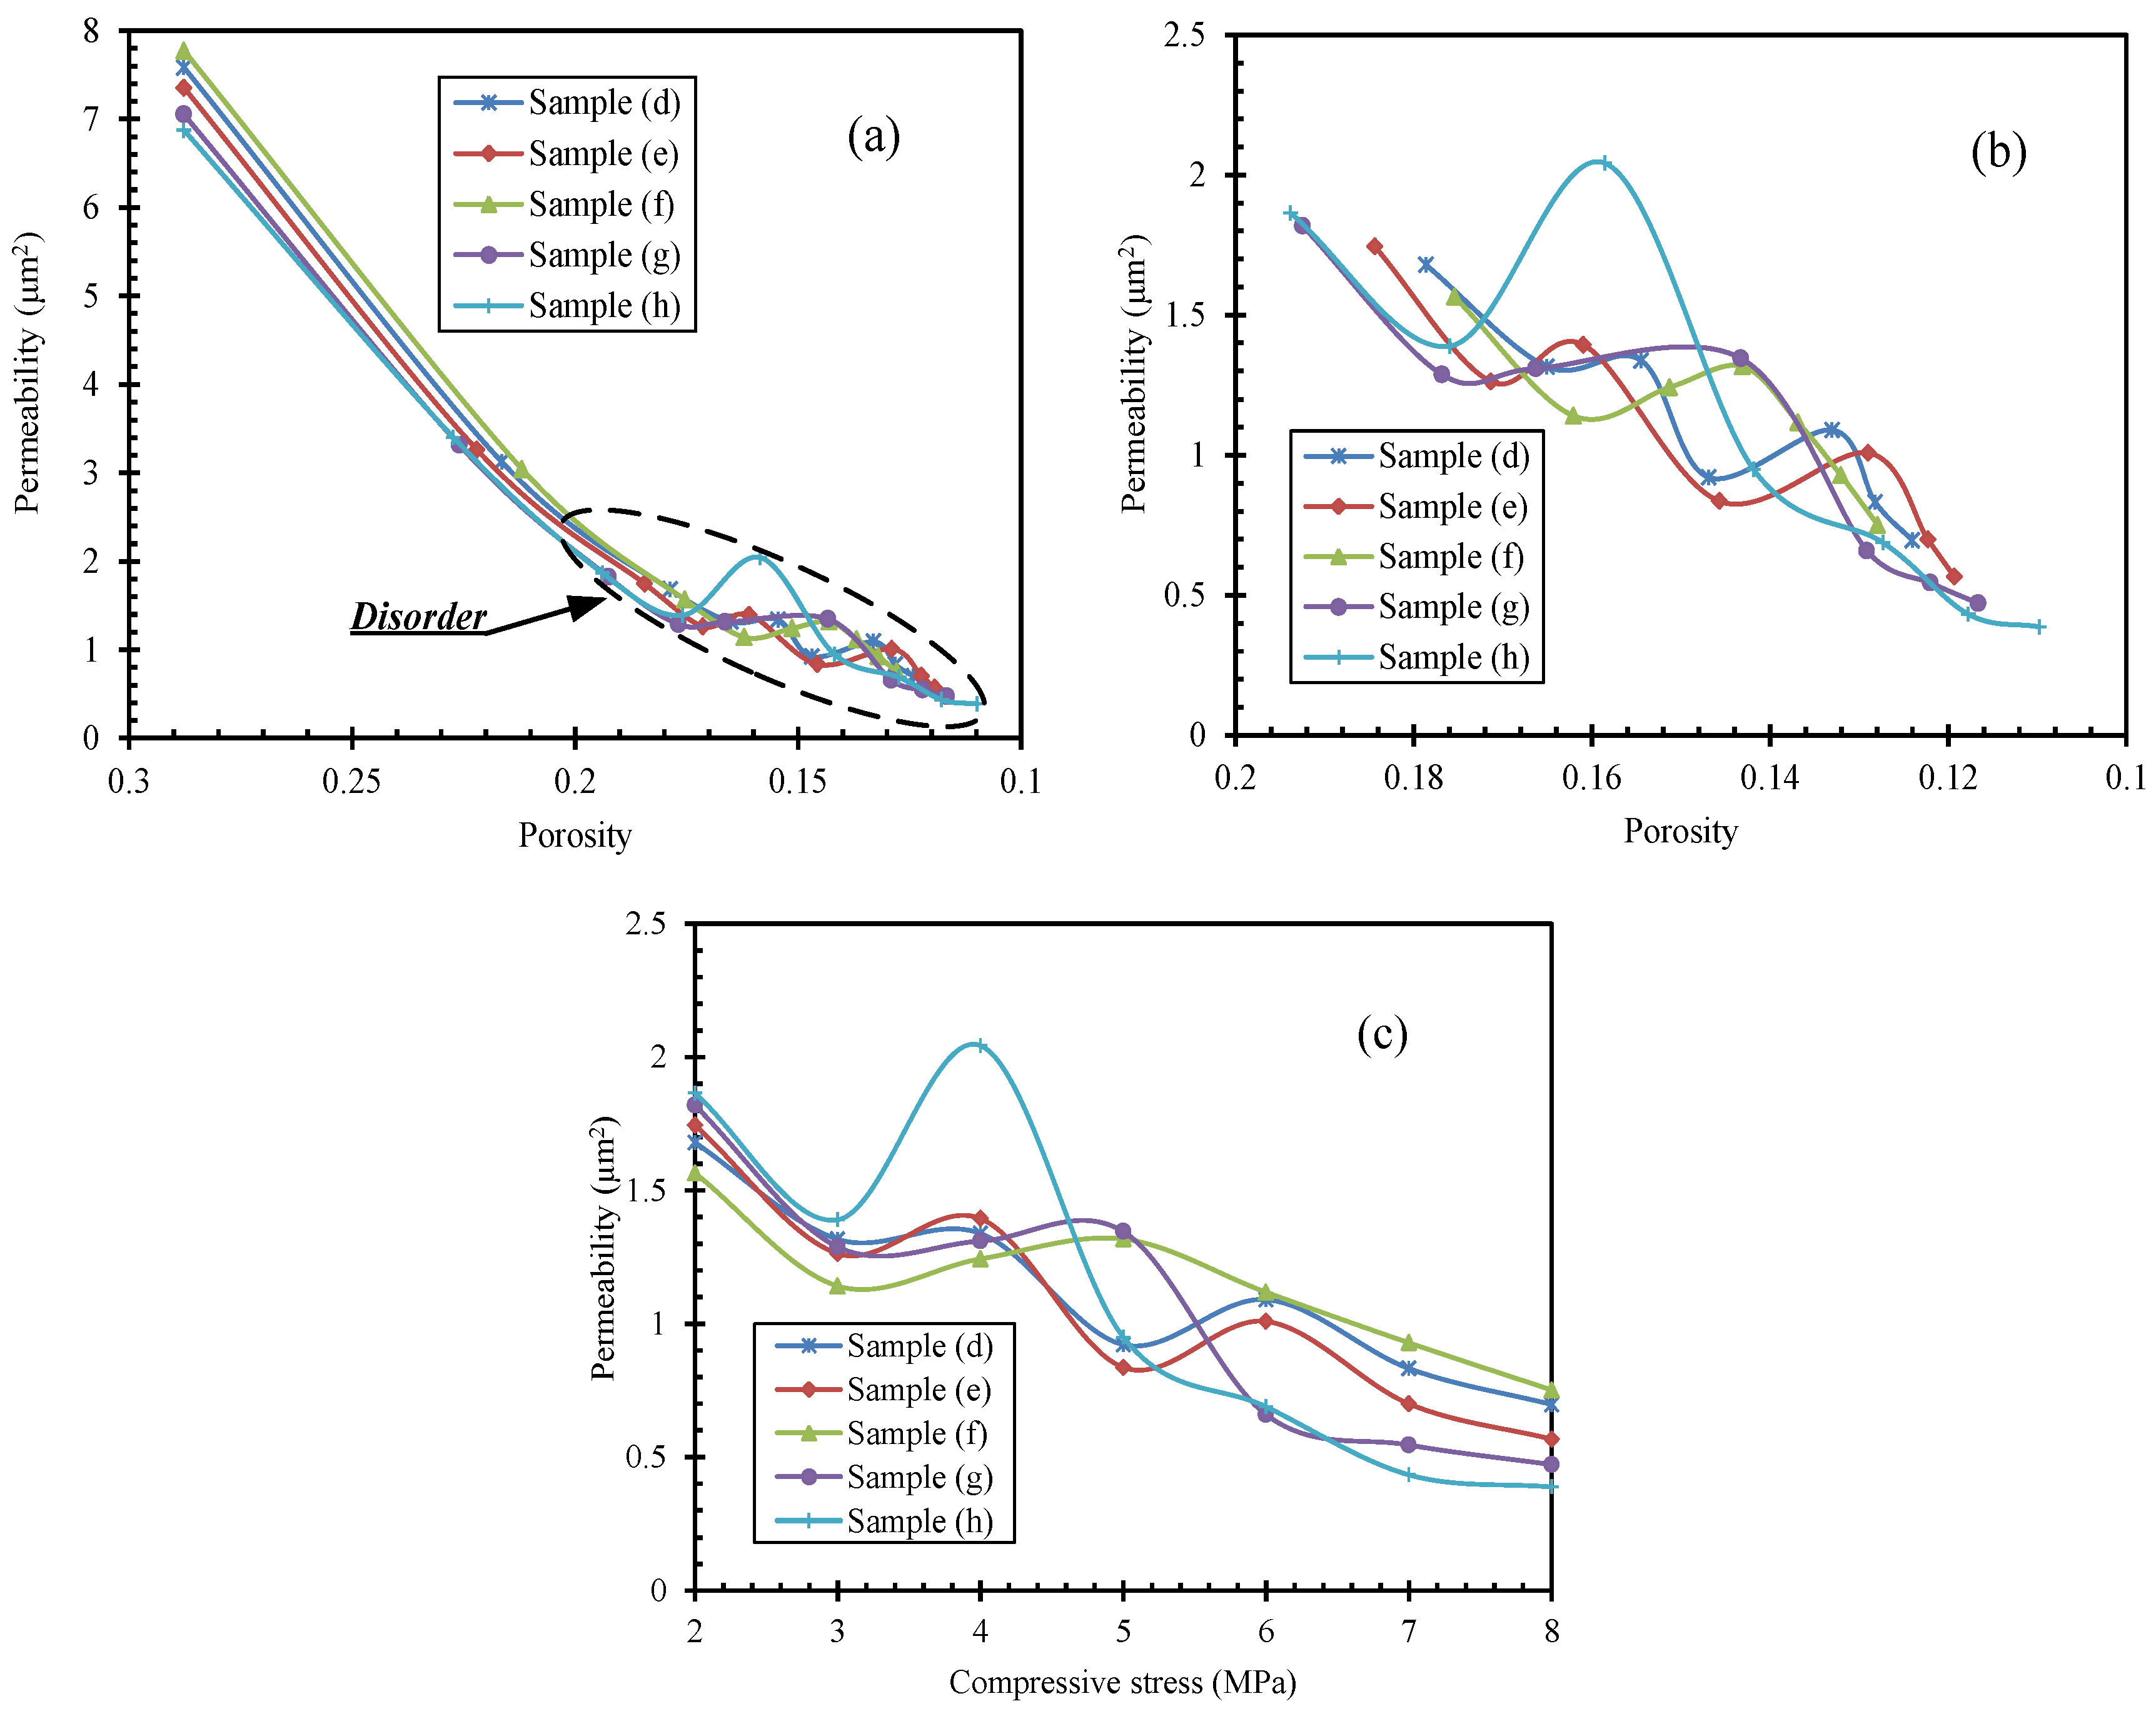
The porosity–compressive stress curve and porosity variation–compressive stress curves (for variable size mixtures) are presented in Figure 10. The overall permeability–compressive stress (through porosity) curves presented in Figure 11a–c show the permeability–porosity curves and the permeability–compressive stress curves after 2 MPa. The overall process of porosity and permeability evolution during compression can be divided into three different phases: rapid reduction in the void ratio, continued reduction in the void ratio and large particle crushing, and continued crushing of the large particles.
The first phase involves the rapid reduction in the void ratio during which the porosity and permeability decrease by up to 40% (Figure 10a). When the compressive stress is less than 3 MPa during compression, the porosity of the samples with a higher proportion of larger particles (e.g., 20–10 mm diameter) appears to be larger. This suggests that their porosity and permeability decrease by a smaller amount, which is most likely due to the lower efficiency in particle packing.
The second stage occurs when void shrinkage continues, and crushing of the larger particles begins during which the largest particles (e.g., 20–15 mm diameter) were crushed during compression. This occurred when the compressive stress was between 3 and 5 MPa. The porosity in sample (h) decreased rapidly (see Figure 10a) whilst its porosity variation was larger than that of the other samples (see Figure 10b). This indicates that the largest particles (e.g., 20–15 mm) in sample (h) were crushed at a faster rate.
The third stage of porosity evolution involves continuous crushing of the large particles. It can be seen from Figure 10b that the rate of change in porosity decreases during compression. The rate of porosity decrease was reduced with progressive compression due to the monotonous decrease in the void diameter. Five MPa was the critical compressive stress for alteration of both the porosity (Figure 10b) and permeability (Figure 11c). Porosity alteration for sample (f) was at a minimum after the critical compressive stress, which means that the inter-particle pore diameter was at its smallest value. Furthermore, the bulk porosity of each sample was almost the same as the critical compressive stress (5 MPa), when compared with the porosity at the critical compressive stress. The porosity at a compressive stress of 8 MPa was lower for samples having a higher fraction of large particle diameters. The porosity and permeability of sample (f) were at their maximum; this means that the porosity decrease is mainly contributed by particle crushing in the last phase.
To summarise, the original GSD was a key factor for determining both the porosity and permeability evolution during compression. The average reduction of porosity in the first two phases was 48%, but in the third phase was only 8%. It appears that the inter-particle porosity between smaller diameter particles was more prone to volume reduction than for the larger particles. Larger particles were more prone to crushing, which led to significant decreases in porosity in the third phase of compression.
4.2.2. Effect of Original Grain Size Distribution on the Post-Crushing Grain Size Distribution
Table 4 shows the typical GSD after testing and their variation is shown in Figure 12, compared with the original GSD (Test 2) in Table 1. The mass of the <5 mm size fraction was increased after compression for each sample. However, the mass of the 20–8 mm size fraction was reduced. During compression, larger grains (e.g., 20–8 mm) were broken into smaller sizes, which caused the mass of the <5 mm size fraction to increase. Furthermore, the 20–15 mm size fraction decreased the most and this was attributed to larger particles being more easily crushed during compression. This is why the critical compressive stress for sample (h) shows a minimum value in Figure 11c. Samples with a higher proportion of larger diameter particles showed a larger decrease in the mass of the 20–12 mm size fraction and an increase in the <5 mm size fraction. The fraction of particles in the 8–5 mm size range increased for samples (d and e), but reduced for samples (f, g, and h).
4.3. Porosity and Permeability Prediction during Testing
Due to the general lack of published data on the evolution of permeability and porosity for granular coals, it is common practice to predict the permeability and porosity using an empirical equation and some very limited experimental data. Chilingar [33] defined the relationship between porosity and permeability in porous media (sands and sandstones) as:
where, is the effective diameter of grain sizes. According to Equation (14), we obtain:
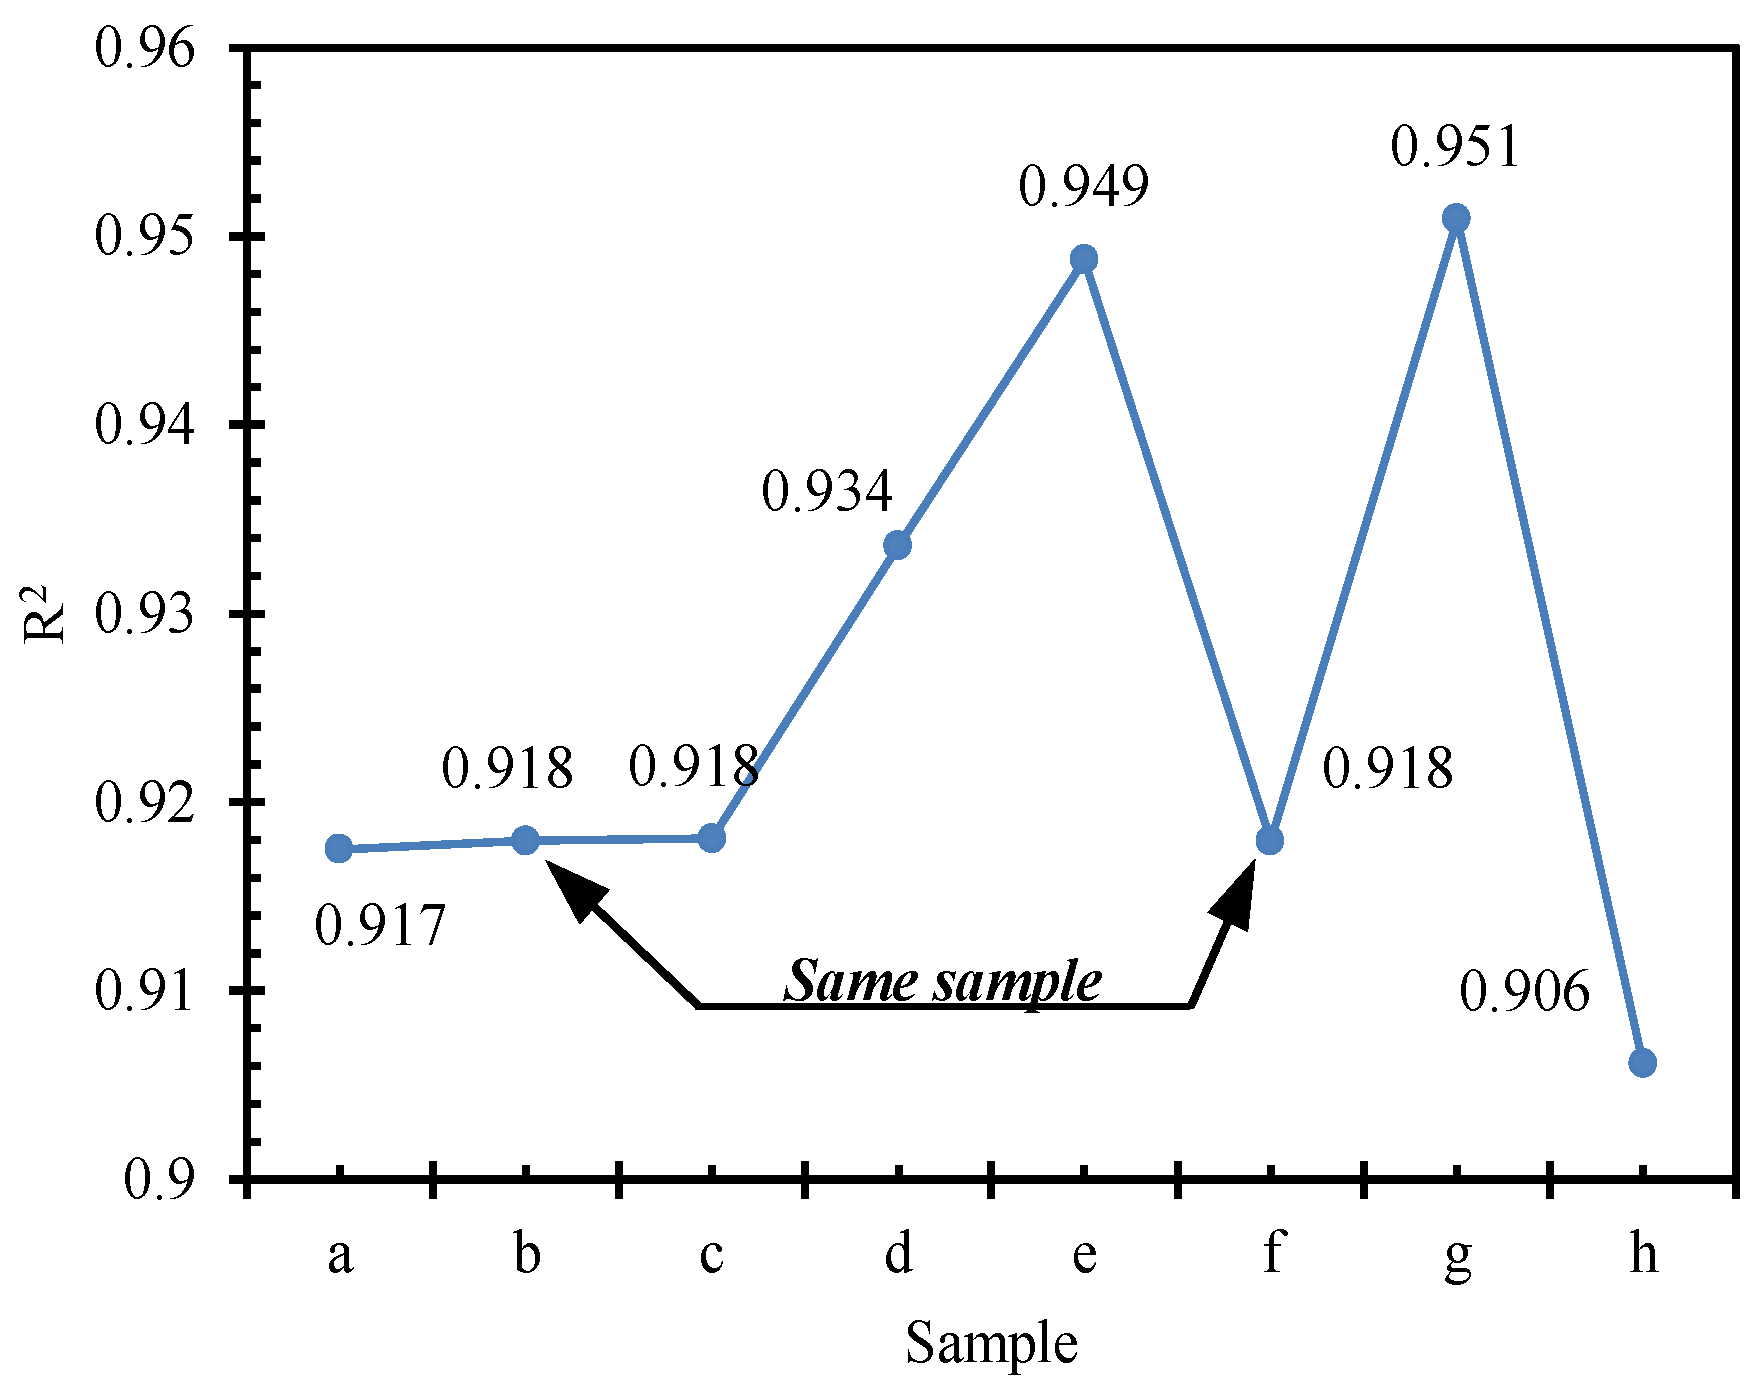
where, is the initial porosity and is the initial permeability. The test and predictive data of permeability were shown in Figure 13. A simple statistical efficiency criterion was used to analyze the model performance in Equation (15), based on the coefficient of determination factor R2:
where l is the total number of test data, l = 9; is the experimentally tested value, and is the model prediction associated with a test. The results of the R2 values for different test samples are shown in Figure 14.
It can be seen from Figure 13 that by using Chilingar’s empirical equation, the calculated permeability values are typically lower than those obtained from the experimental tests in this study. This could indicate that particle crushing caused a permeability increase during compression. However, as shown in Figure 14, the R2 values in all samples were higher than 0.90, which indicates a high degree of linear correlation. Therefore, the application of effective porosity (fracture) in seepage for the prediction of permeability variations can yield sufficiently accurate results. The R2 was almost the same for samples (a, b, and c). This is perhaps because the test time had no predictive error effect. Furthermore, a greater mass of larger diameter particles were crushed. A comparison of the predicted results corresponding to the experimental data for samples with variable GSD shows that the R2 value for sample (h) was the lowest (0.906), suggesting that a greater mass of larger diameter particles led to a higher proportion of crushed fines, giving greater pore volume reduction and altered permeability.
5. Conclusions
In a series of experiments, the effects of applied compressive stress rates and original GSD (Figure 3) on the variations of the seepage characteristics of granular coal were investigated through experimental measurements. From the experimental observations and corresponding analyses, the following main conclusions could be drawn:
In general, gas seepage characteristics (i.e., altered porosity and altered permeability) are strongly influenced by the variable stress rate of the sample. Both porosity and permeability of granular coal decrease during compression. As samples under a higher stress state require a shorter duration of compression before fracture, the porosity and permeability decrease is incrementally smaller. Further reductions in porosity are more difficult to achieve with monotonously increased compressive stress. Samples under high stress states experienced a greater degree of particle crushing. Samples under variable stress states had variable critical compressive stress for the occurrence of isolated fractures in the larger diameter particles, after which the fracturing behavior changed from self–extending to inter-connecting. Particle attrition resulted in a significant increase in the proportion of fines and smaller diameter particles (<5 mm).
According to the experimental observations of the original GSD effect on seepage characteristics, the overall process of porosity and permeability evolution during compression can be divided into three different stages. In the first stage, the porosity and permeability decrease was mainly attributed to the reduction in pore diameter. Both the porosity and permeability decrease occurred to a lesser extent in samples with a higher mass fraction of large diameter particles. Void filling that occurred following particle attrition appeared to be the main cause for the reduction in porosity and permeability. During the second stage, the porosity and permeability in samples (d, e, f, and g) continued to decrease, and sample (h) showed the largest reduction perhaps due to rapid particle crushing (high stress state). In the third stage, consolidation of the granular coal occurred very rapidly and the porosity and permeability decreased the most for samples with a higher mass fraction of large diameter particles. An empirical model was applied to analyse the permeability and porosity evolution for the seepage and crushing processes. The prediction indicated that particle crushing may have caused the permeability increases during compression. It was hypothesized that this was also the main cause for the predictive values being lower than those obtained from the experiments in most cases. For samples under different stress states, the predictive accuracy for the porosity and permeability evolution was the same. For samples within the highest mass fraction of large diameter particles, the predictive accuracy was the lowest.
Acknowledgments
This work was supported by the National Basic Research Program of China (2015CB060200), the National Natural Science Foundation of China (51322403 and 51674247) and the Fundamental Research Funds for the Central Universities (2015XKZD06). The authors would also like to acknowledge the editor and the anonymous reviewers for their valuable comments, which have greatly improved this paper.
Author Contributions
Dan Ma and Qiang Li conceived and designed the experiments; Dan Ma, Qiang Li, and Yu Wu performed the experiments; Dan Ma analyzed the data; Dan Ma and Matthew R. Hall wrote the paper.
Conflicts of Interest
The authors declare no conflict of interest.
Abbreviations
| Latin Letters | Greek Letters | ||
| vertical axis going through the left of sample (L) | gas viscosity (mL−1·T−1) | ||
| height of granular coal during compression (L) | compressive stress (mL−1·T−2) | ||
| cylindrical tube height (L) | coal density (mL−3) | ||
| plunger height (L) | gas density (mL−3) | ||
| porous disk thickness (L) | porosity (-) | ||
| felt pad thickness (L) | porosity during compression (-) | ||
| height of plunger head exceeds cylindrical tube during compression (L) | permeability of granular coal during compression (L2) | ||
| mass of granular coal (M) | Sub- and Superscripts | ||
| pore pressure (mL−1·T−2) | compressive stress state (-) | ||
| pore pressure at intake boundary (gas in) during compression (mL−1·T−2) | size range (-) | ||
| pore pressure at outtake boundary (gas out) during compression (mL−1·T−2) | Special Symbols | ||
| radius of the cylindrical tube (L) | partial differential operator (-) | ||
| gas seepage velocity at intake boundary (in) during compression (L·T−1) | Nabla operator (L−1) | ||
References
- Peng, S.S. Longwall Mining, 2nd ed.; Society for Mining Metallurgy, and Exploration: Englewood, CO, USA, 2006; p. 621. [Google Scholar]
- Aguado, M.B.D.; Nicieza, C.G. Control and prevention of gas outbursts in coal mines, Riosa–Olloniego coalfield, Spain. Int. J. Coal Geol. 2007, 69, 253–266. [Google Scholar] [CrossRef]
- Wold, M.B.; Connell, L.D.; Choi, S.K. The role of spatial variability in coal seam parameters on gas outburst behaviour during coal mining. Int. J. Coal Geol. 2008, 75, 1–14. [Google Scholar] [CrossRef]
- Cheng, Y.; Zhang, X.; Wang, L. Environmental impact of coal mine methane emissions and responding strategies in China. Int. J. Greenh. Gas Control 2011, 5, 157–166. [Google Scholar] [CrossRef]
- Karacan, C.Ö. Prediction of porosity and permeability of caved zone in longwall gobs. Transp. Porous Media 2010, 82, 413–439. [Google Scholar] [CrossRef]
- Cai, Y.; Liu, D.; Mathews, J.P.; Pan, Z.; Elsworth, D.; Yao, Y.; Li, J.; Guo, X. Permeability evolution in fractured coal—combining triaxial confinement with X-ray computed tomography, acoustic emission and ultrasonic techniques. Int. J. Coal Geol. 2014, 122, 91–104. [Google Scholar] [CrossRef]
- Adánez, J.; de Diego, L.F.; Gayán, P. Transport velocities of coal and sand particles. Powder Technol. 1993, 77, 61–68. [Google Scholar] [CrossRef]
- Tripathy, A.; Panda, L.; Sahoo, A.K.; Biswal, S.K.; Dwari, R.K.; Sahu, A.K. Statistical optimization study of jigging process on beneficiation of fine size high ash Indian non-coking coal. Adv. Powder Technol. 2016, 27, 1219–1224. [Google Scholar] [CrossRef]
- Slezak, A.; Kuhlman, J.M.; Shadle, L.J.; Spenik, J.; Shi, S.P. CFD simulation of entrained-flow coal gasification: Coal particle density/size fraction effects. Powder Technol. 2010, 203, 98–108. [Google Scholar] [CrossRef]
- Li, Y.F.; Zhao, W.D.; Xu, S.H.; Xia, W.C. Changes of size, ash and density of coal particles on the column axis of a liquid–solid fluidized bed. Powder Technol. 2013, 245, 251–254. [Google Scholar] [CrossRef]
- Muriithi, G.N.; Petrik, L.F.; Gitari, W.M.; Doucet, F.J. Synthesis and characterization of hydrotalcite from South African Coal fly ash. Powder Technol. 2017, 312, 299–309. [Google Scholar] [CrossRef]
- He, J.F.; Zhao, Y.M.; He, Y.Q.; Luo, Z.F.; Duan, C.L. Force characteristic of the large coal particle moving in a dense medium gas–solid fluidized bed. Powder Technol. 2014, 254, 548–555. [Google Scholar] [CrossRef]
- Friedemann, J.; Wagner, A.; Heinze, A.; Krzack, S.; Meyer, B. Direct optical observation of coal particle fragmentation behavior in a drop-tube reactor. Fuel 2016, 166, 382–391. [Google Scholar] [CrossRef]
- Adamczyk, W.P.; Szlęk, A.; Klimanek, A.; Białecki, R.A.; Węcel, G.; Katelbach-Wozniak, A.; Sładeka, S.; Ditarantob, M.; Haugen, N.E.L. Visualization system for the measurement of size and sphericity of char particles under combustion conditions. Powder Technol. 2016, 301, 141–152. [Google Scholar] [CrossRef]
- Busch, A.; Gensterblum, Y.; Krooss, B.M.; Littke, R. Methane and carbon dioxide adsorption diffusion experiments on coal: Upscaling and modeling. Int. J. Coal Geol. 2004, 60, 151–168. [Google Scholar] [CrossRef]
- Marcin, L.; Miguel, A. Characteristics of carbon dioxide sorption in coal and gas shale—The effect of particle size. J. Nat. Gas Sci. Eng. 2016, 28, 558–565. [Google Scholar]
- Hu, S.B.; Li, X.C.; Wang, E.Y. Experimental and numerical study on scale effects of gas emission from coal particles. Transp. Porous Media 2016, 114, 133–147. [Google Scholar] [CrossRef]
- Robertson, E.P.; Christiansen, R.L. Measurement of sorption induced strain. In Proceedings of the 2005 International Coalbed Methane Symposium, Tuscaloosa, AL, USA, 16–20 May 2005. [Google Scholar]
- Mazumder, S.; Wolf, K.H. Differential swelling and permeability change of coal in response to CO2 injection for ECBM. Int. J. Coal Geol. 2008, 74, 123–138. [Google Scholar] [CrossRef]
- Pan, Z.; Connell, L.D.; Camilleri, M. Laboratory characterisation of coal reservoir permeability for primary and enhanced coalbed methane recovery. Int. J. Coal Geol. 2010, 82, 252–261. [Google Scholar] [CrossRef]
- Cui, X.J.; Bustin, R.M. Volumetric strain associated with methane desorption and its impact on coalbed gas production from deep coal seams. AAPG Bull. 2005, 89, 1181–1202. [Google Scholar] [CrossRef]
- Vogler, D.; Amann, F.; Bayer, P.; Elsworth, D. Permeability evolution in natural fractures subject to cyclic loading and gouge formation. Rock Mech. Rock Eng. 2016, 49, 3463–3479. [Google Scholar] [CrossRef]
- Wang, S.; Elsworth, D.; Liu, J. Permeability evolution in fractured coal: The roles of fracture geometry and water-content. Int. J. Coal Geol. 2011, 87, 13–25. [Google Scholar] [CrossRef]
- Han, F.; Busch, A.; van Wageningen, N.; Yang, J.; Liu, Z.; Krooss, B.M. Experimental study of gas and water transport processes in the inter-cleat (matrix) system of coal: Anthracite from Qinshui Basin, China. Int. J. Coal Geol. 2010, 81, 128–138. [Google Scholar] [CrossRef]
- Ma, D.; Miao, X.X.; Wu, Y.; Bai, H.B.; Wang, J.G.; Rezania, M.; Huang, Y.H.; Qian, H.W. Seepage properties of crushed coal particles. J. Pet. Sci. Eng. 2016, 146, 297–307. [Google Scholar]
- Chu, T.X.; Yu, M.G.; Jiang, D.Y. Experimental investigation on the permeability evolution of compacted broken coal. Transp. Porous Media 2017, 116, 847–868. [Google Scholar] [CrossRef]
- Ma, D.; Bai, H.B.; Miao, X.X.; Pu, H.; Jiang, B.Y.; Chen, Z.Q. Compaction and seepage properties of crushed limestone particle mixture: An experimental investigation for Ordovician karst collapse pillar groundwater inrush. Environ. Earth Sci. 2016, 75, 11. [Google Scholar] [CrossRef]
- Ma, D.; Rezania, M.; Yu, H.S.; Bai, H.B. Variations of hydraulic properties of granular sandstones during water inrush: Effect of small particle migration. Eng. Geol. 2017, 217, 61–70. [Google Scholar] [CrossRef]
- Fuller, W.B.; Thompson, S.E. The laws of proportioning concrete. Trans. Am. Soc. Civ. Eng. 1907, 59, 67–143. [Google Scholar]
- MTS System Corporation. Teststar Materials Testing Workstation Installation Reference Manual; MTS System Corporation: Eden Prairie, MN, USA, 1993. [Google Scholar]
- O′Sullivan, C. Particulate Discrete Element Modelling; Taylor and Francis: Abingdon, UK, 2011; p. 215. [Google Scholar]
- Kong, X.Y. Advanced Mechanics of Fluid in Porous Media, 2nd ed.; Press of University of Science and Technology of China: Hefei, China, 2010. [Google Scholar]
- Chilingar, G.V. Relationship between porosity, permeability, and grain-size distribution of sands and sandstones. Dev. Sedimentol. 1964, 1, 71–75. [Google Scholar]
Figure 1.
Overburden strata and granular coal distribution above a longwall panel [1].
Figure 1.
Overburden strata and granular coal distribution above a longwall panel [1].
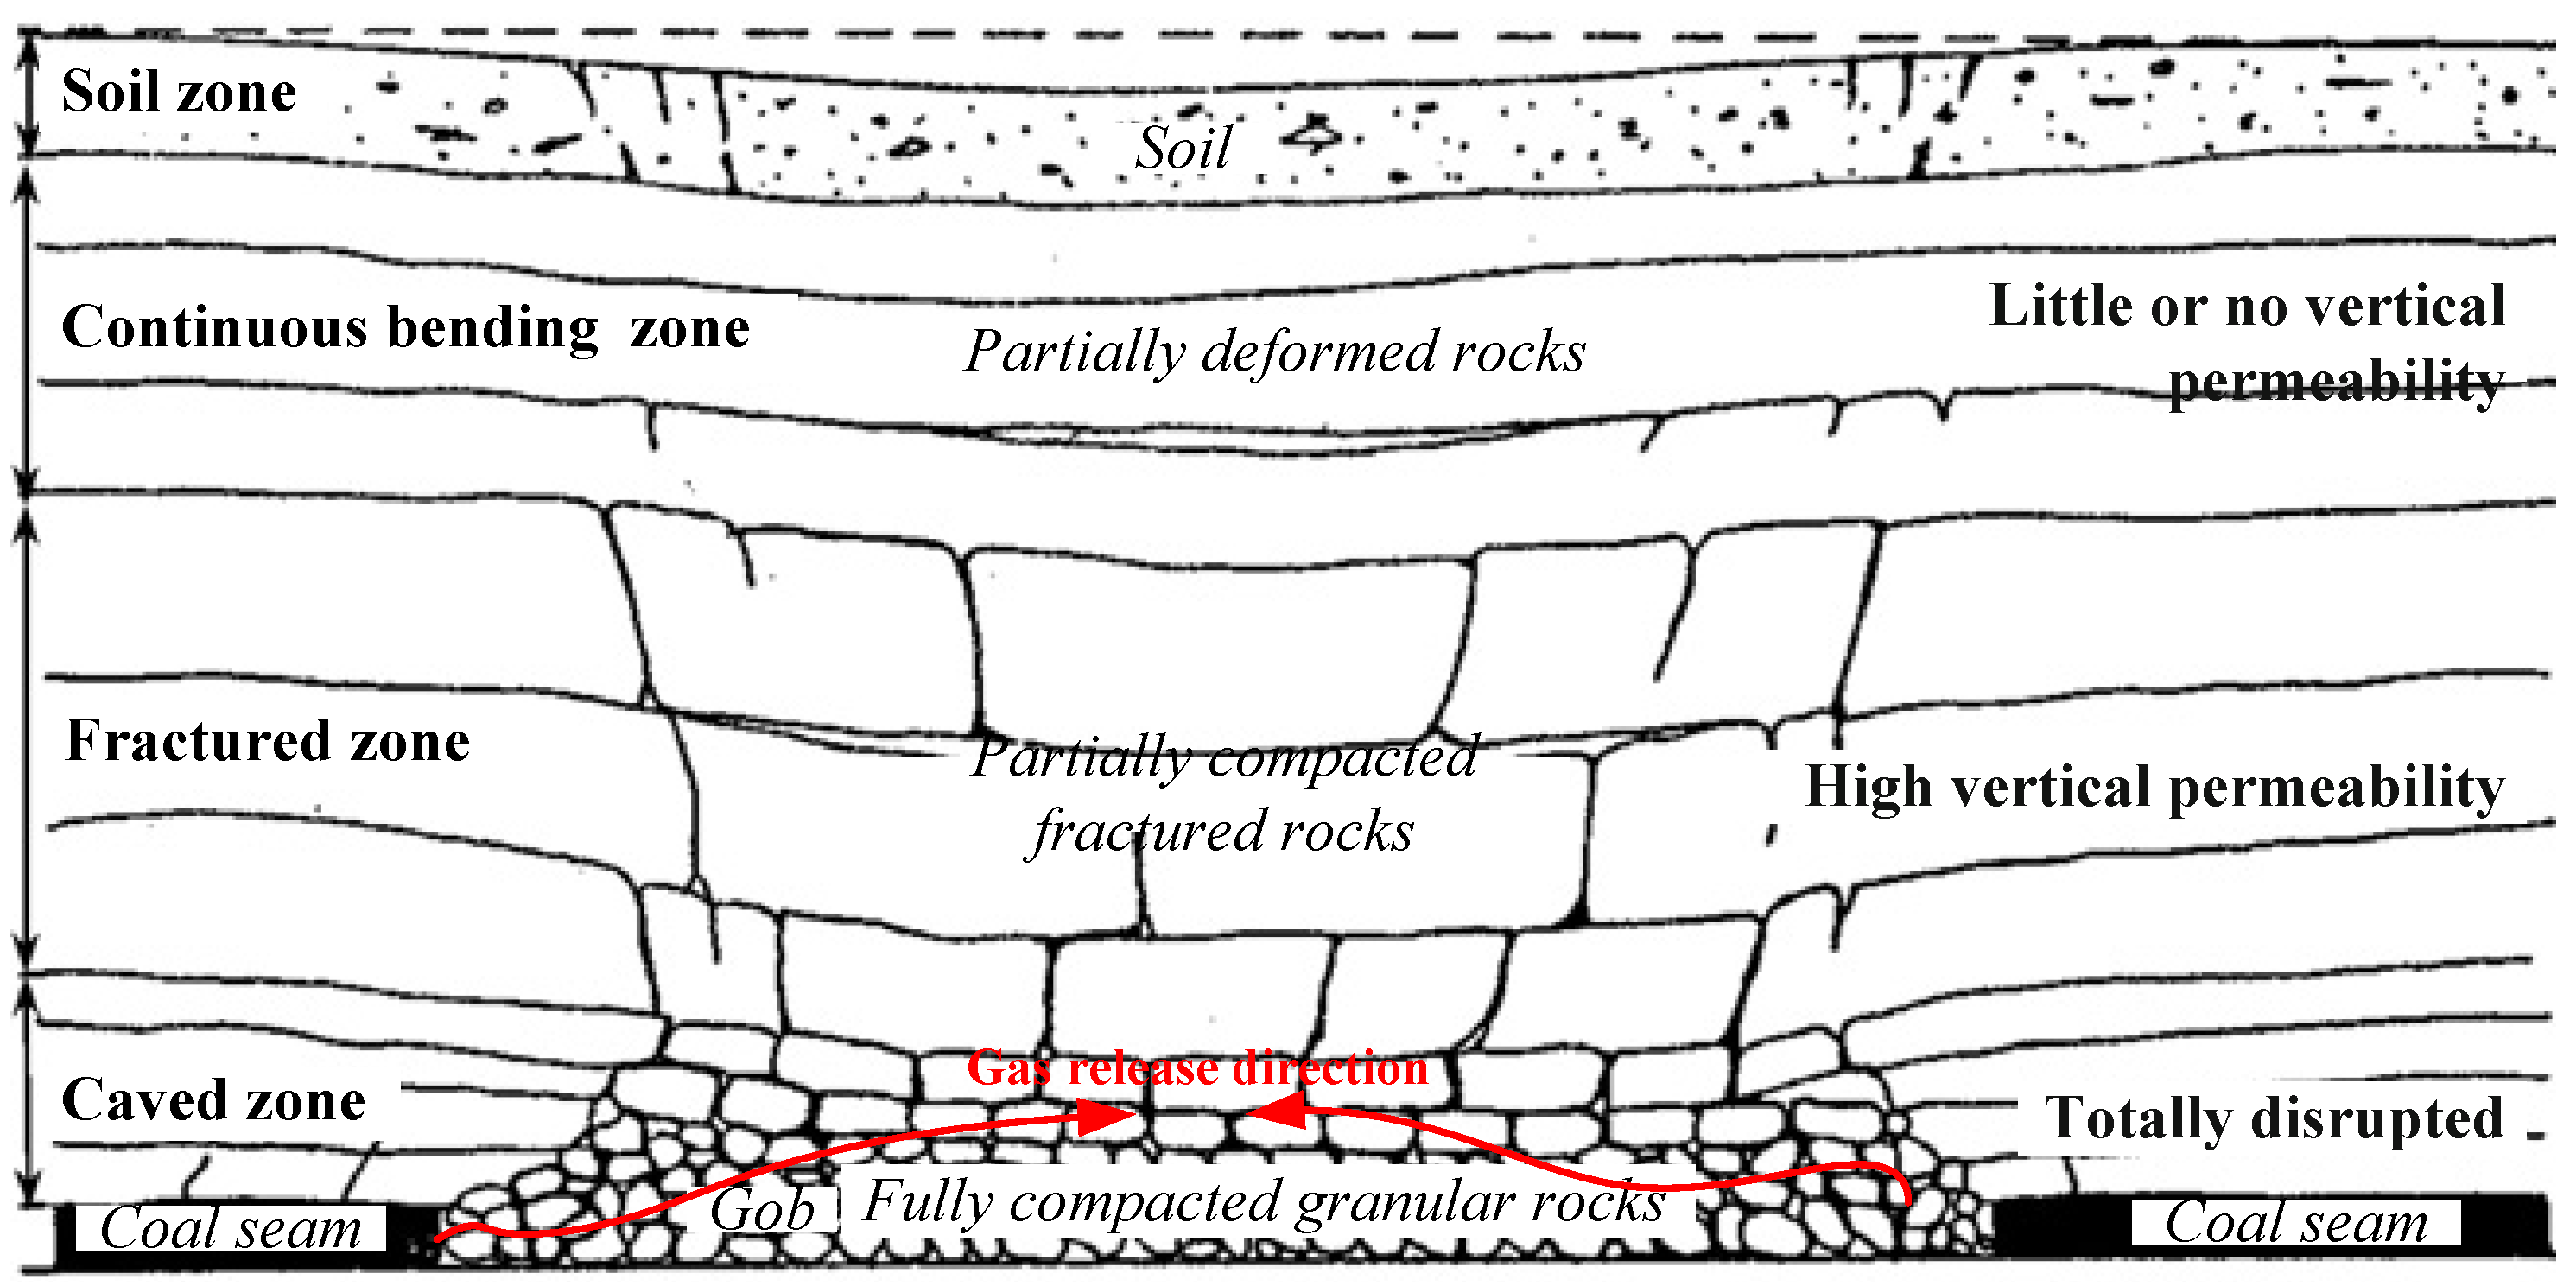
Figure 2.
Grain size distribution (GSD) curves of tested granular coal samples.
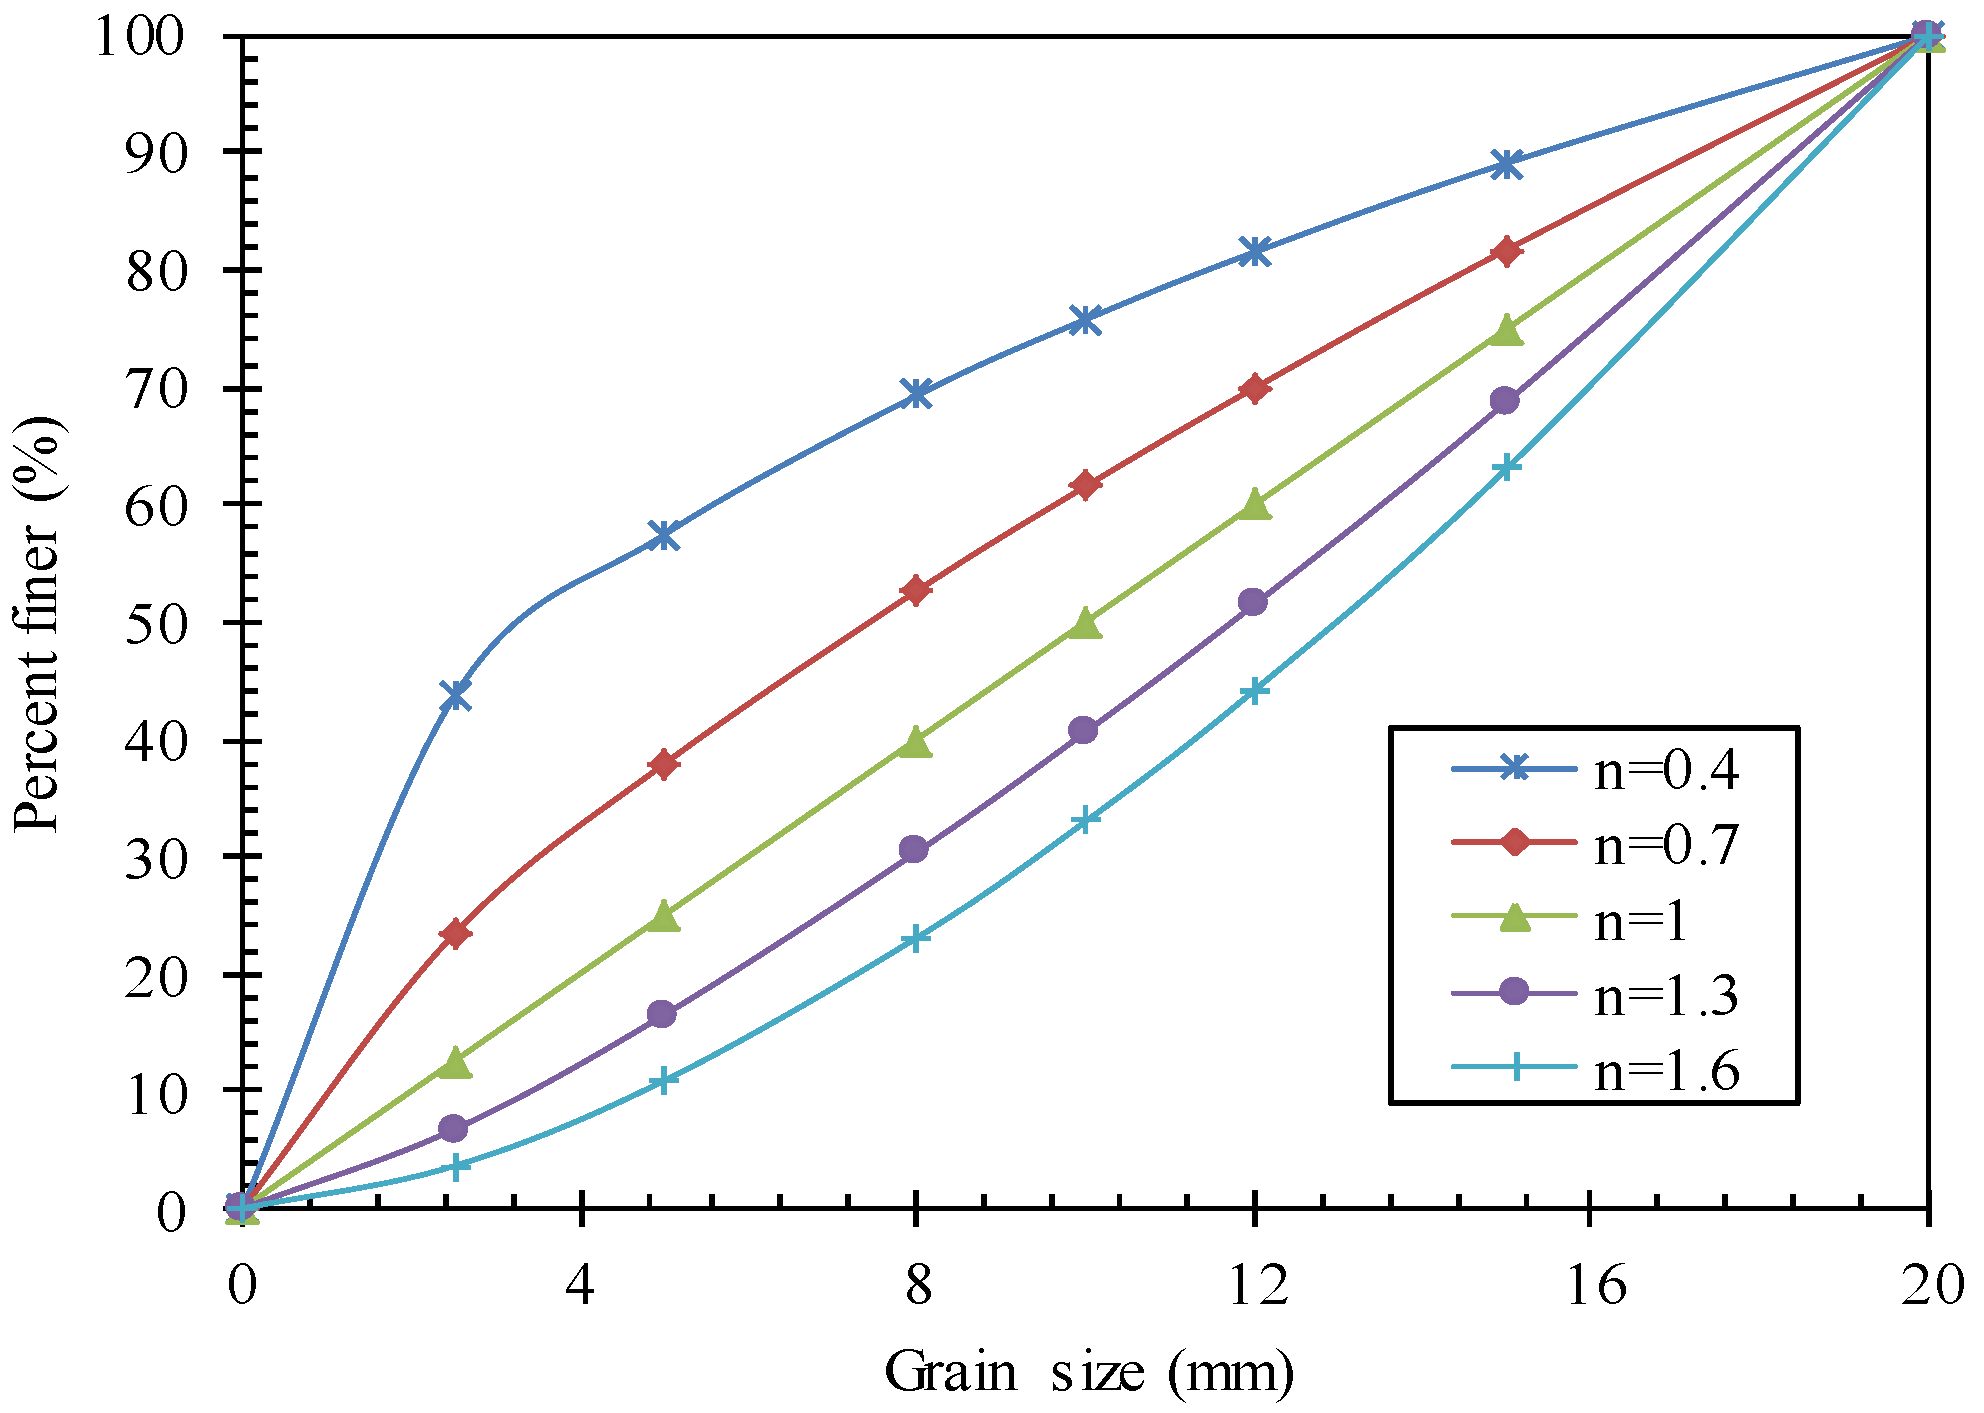
Figure 3.
Loading paths.
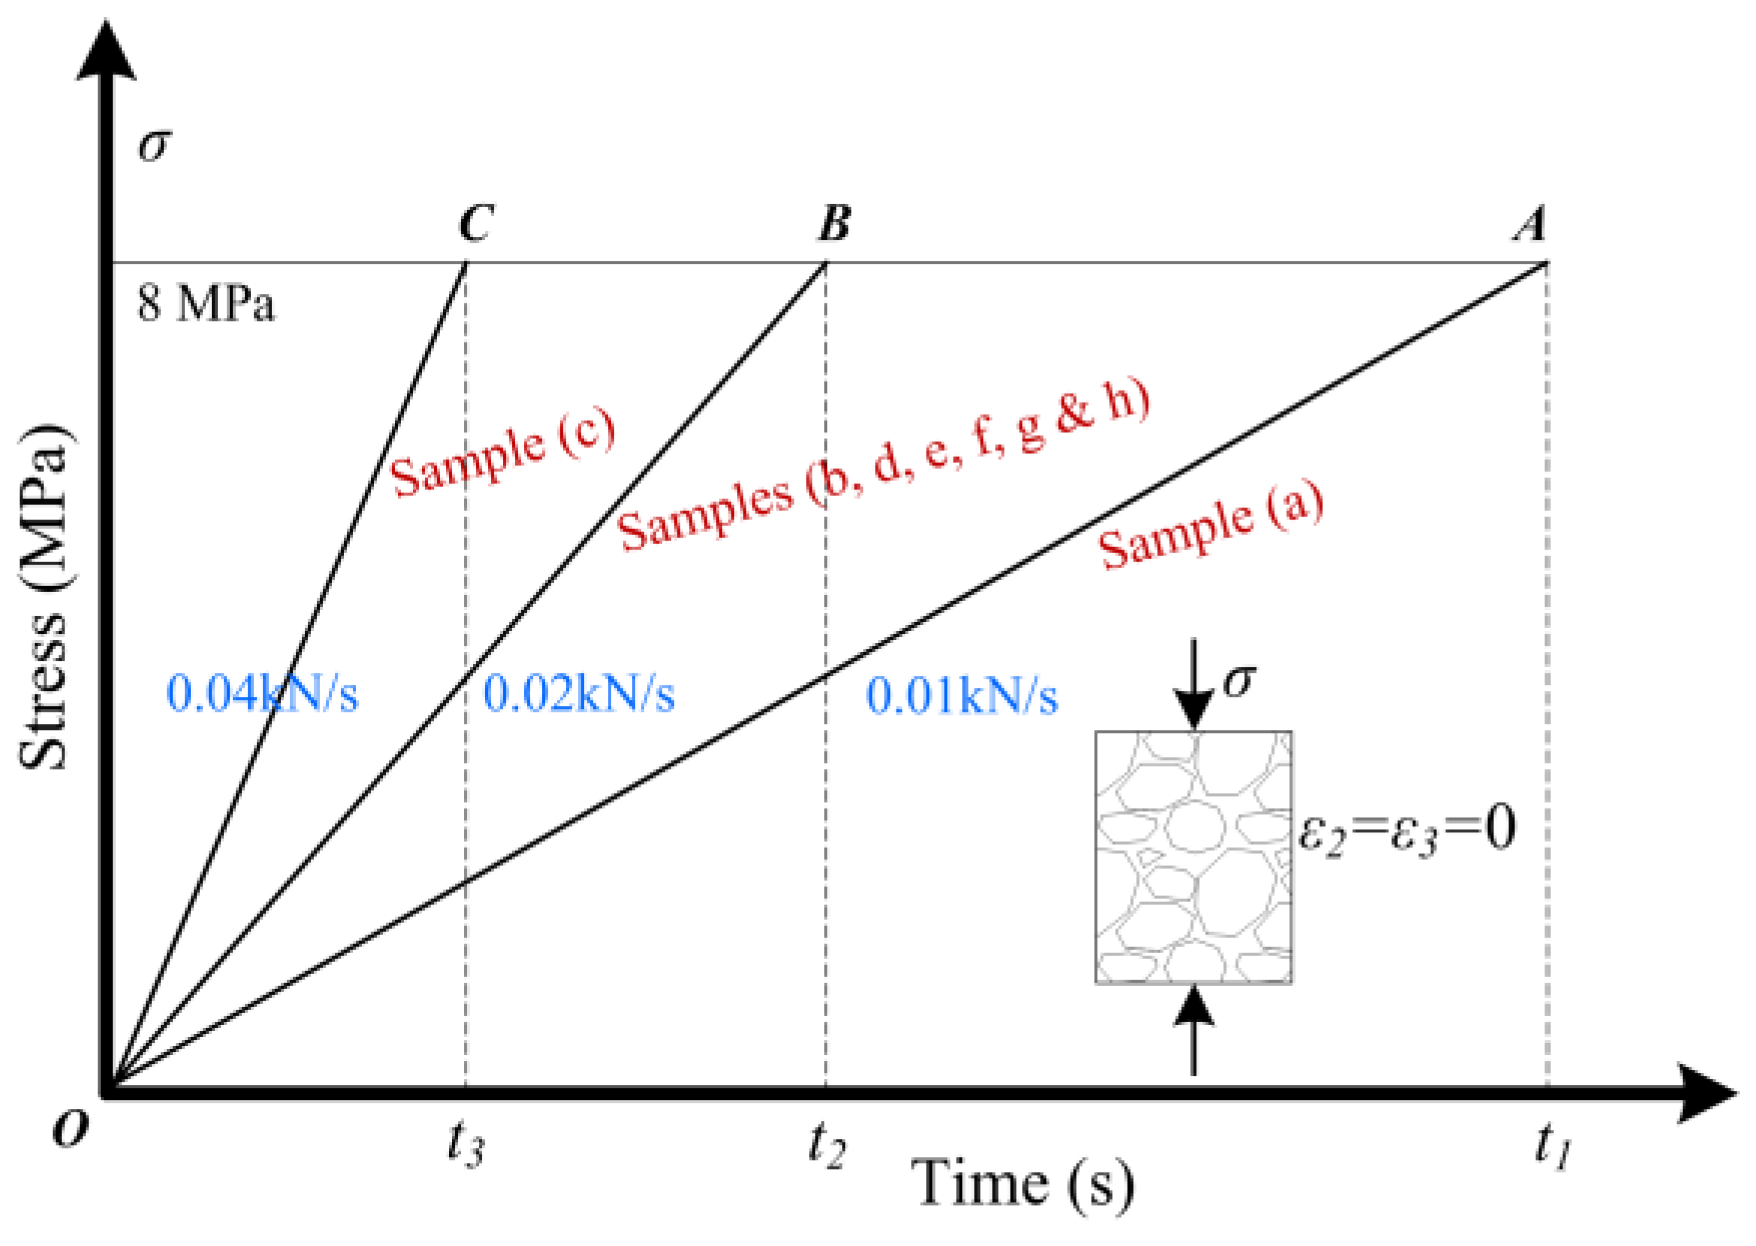
Figure 4.
Testing principle of gas permeability of the granular coal. Note: G1—loading plate; G2,G13—O–rings; G3—piston; G4—granular coal sample; G5,G10—felt pad; G6,G9—porous disk; G7—base plate; G8—valve chest; G11—epoxy resin separation layer; G12—vessel; G14—mechanical bolt; G15—mechanical spring; G16—valve core; M1—gas in; M2—accumulator; M3—gas out; and S1–S5—switch.

Figure 5.
Sketch calculating the height of the granular coal.
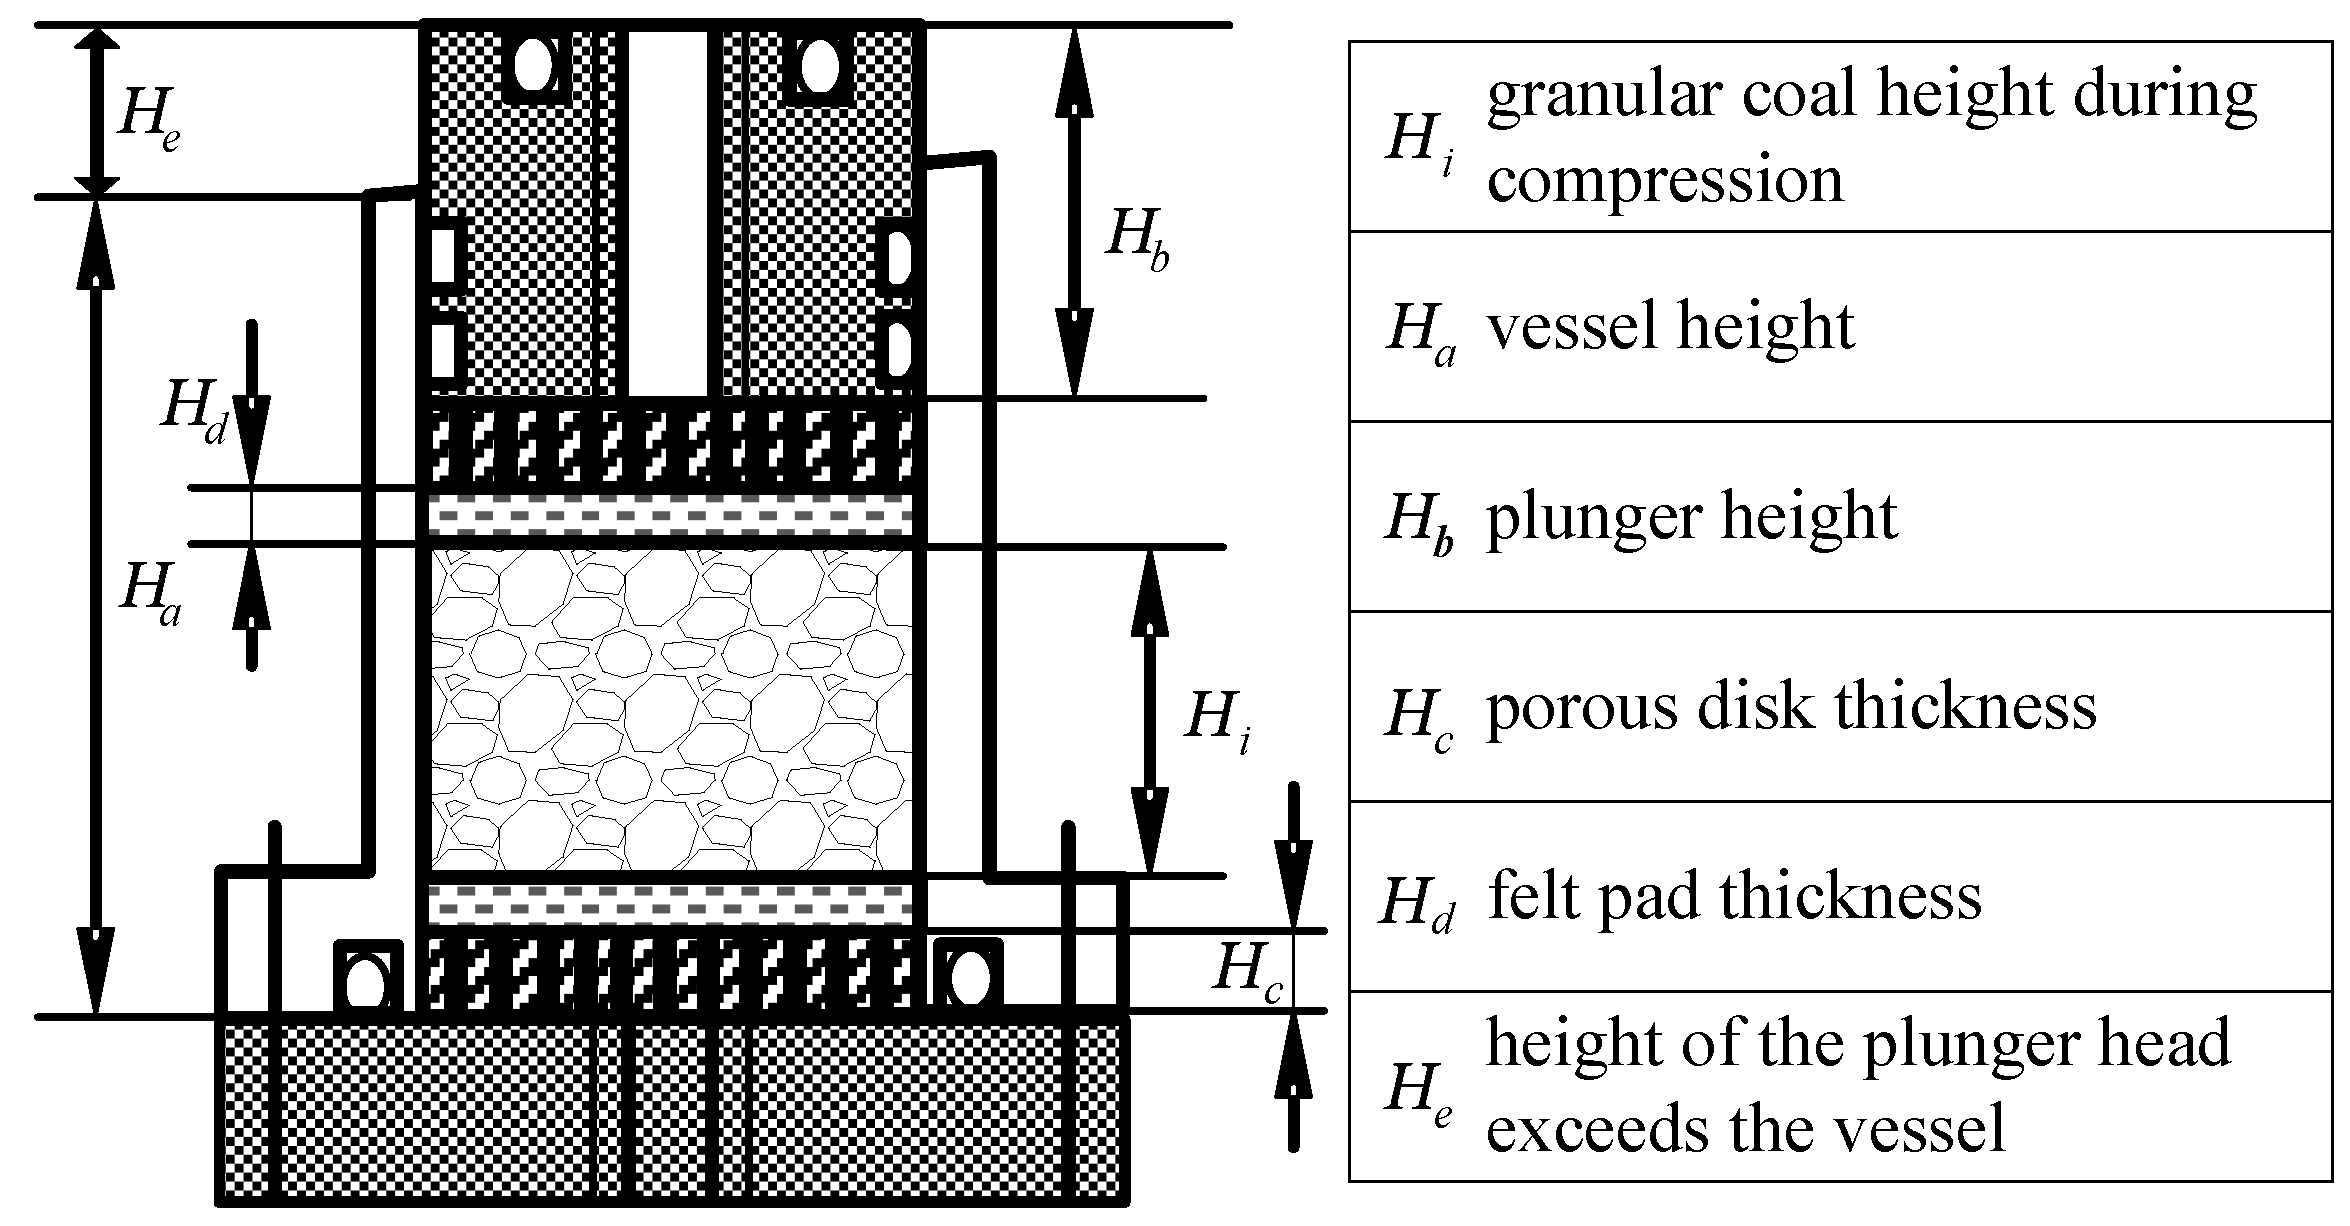
Figure 6.
Testing procedure.

Figure 7.
Porosity (a) and its variation (b) of samples (a, b, and c) during compression.

Figure 8.
Permeability evolutions for samples (a, b, and c). (a) Permeability–compressive stress curves; and (b) permeability–porosity curves.
Figure 8.
Permeability evolutions for samples (a, b, and c). (a) Permeability–compressive stress curves; and (b) permeability–porosity curves.
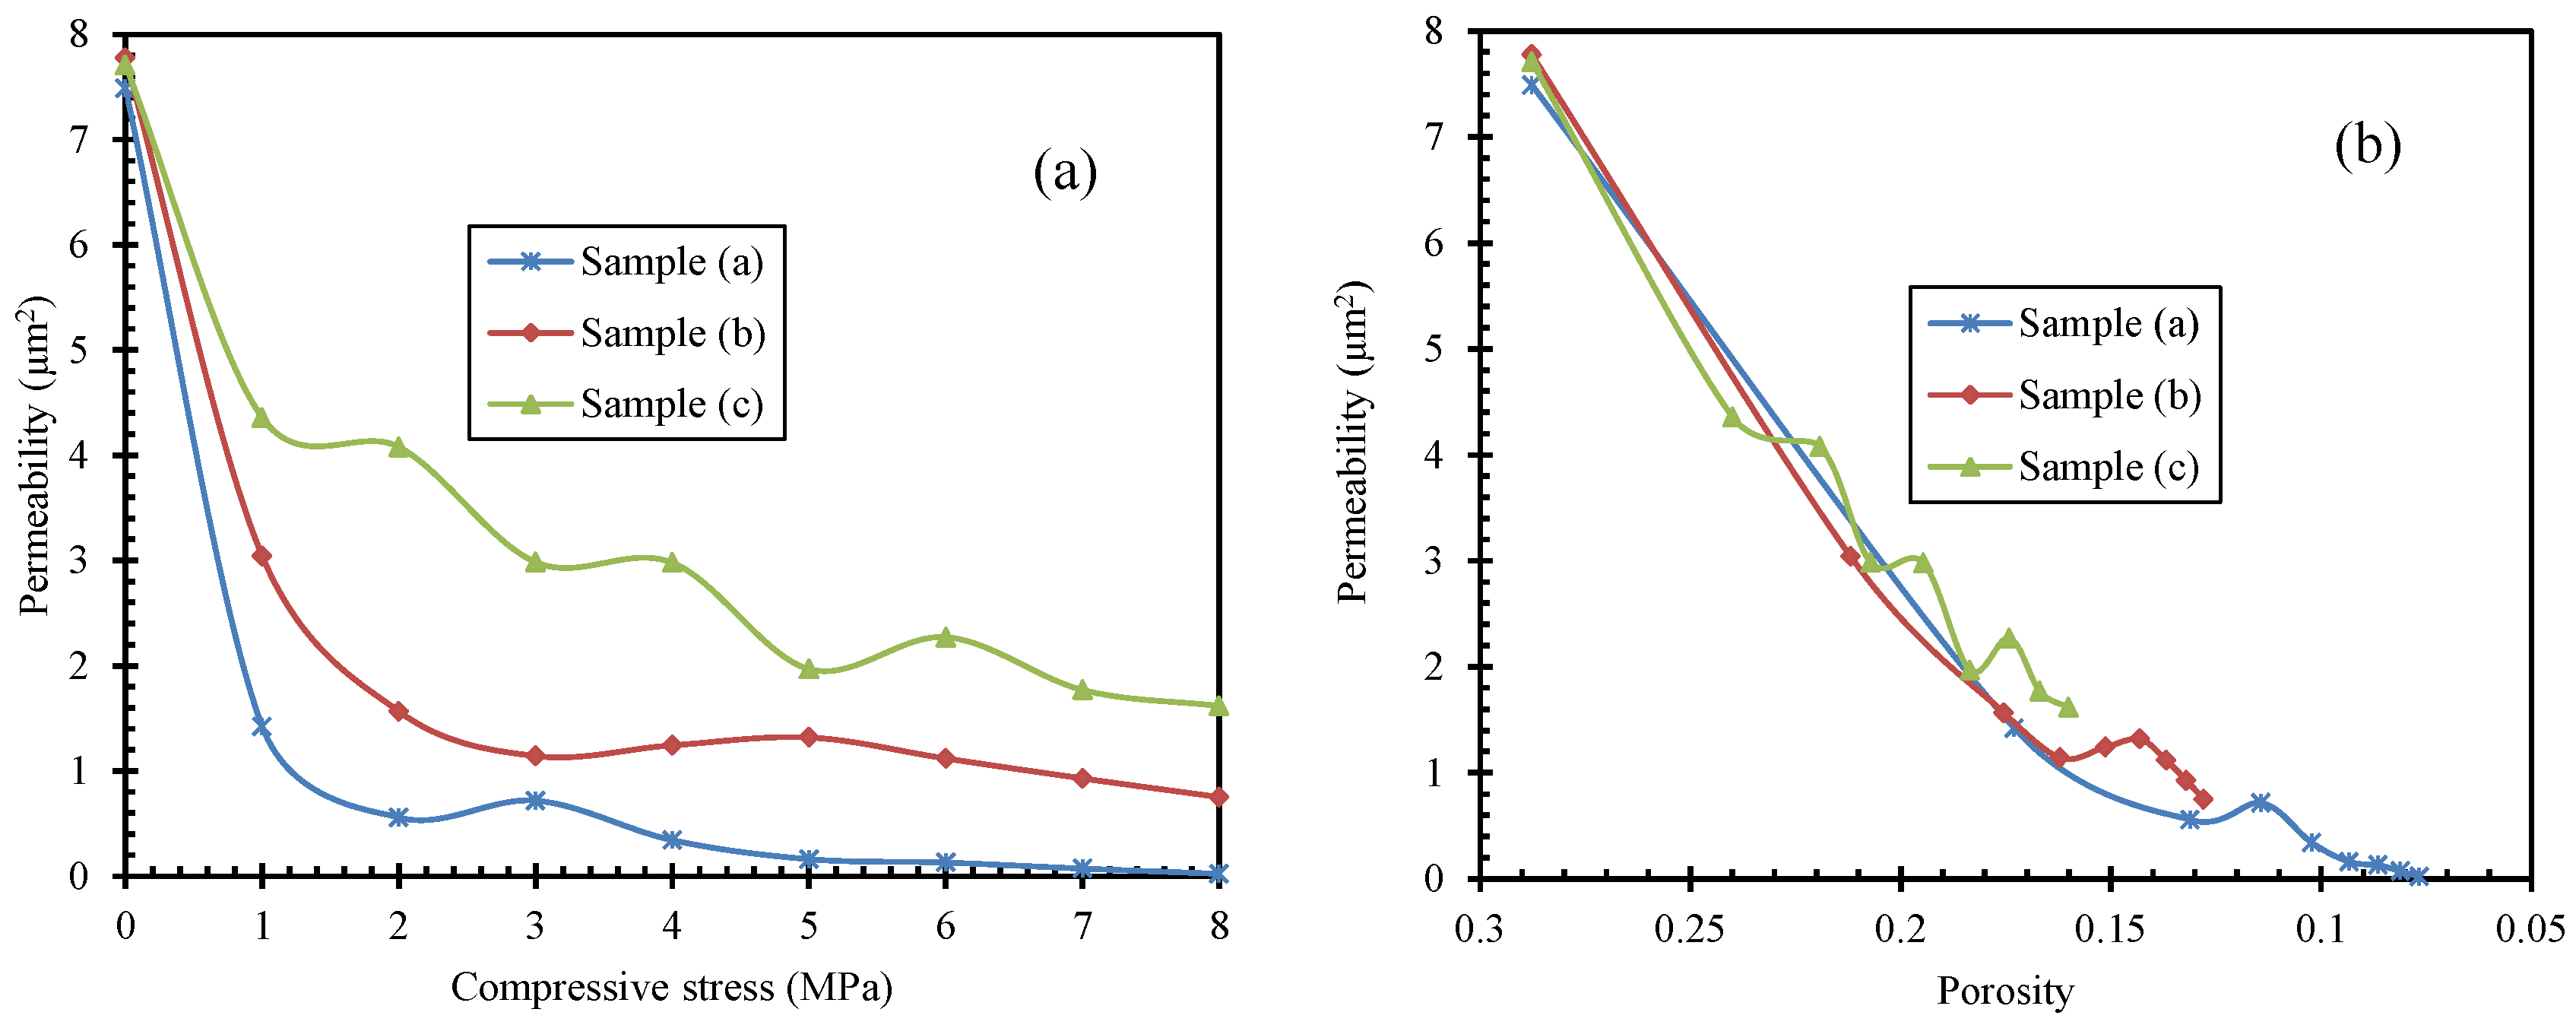
Figure 9.
Grain size distributions and weight variation for samples (a, b, and c). (a) Grain size distribution; and (b) weight variation after testing (+ means increased, – means decreased).
Figure 9.
Grain size distributions and weight variation for samples (a, b, and c). (a) Grain size distribution; and (b) weight variation after testing (+ means increased, – means decreased).
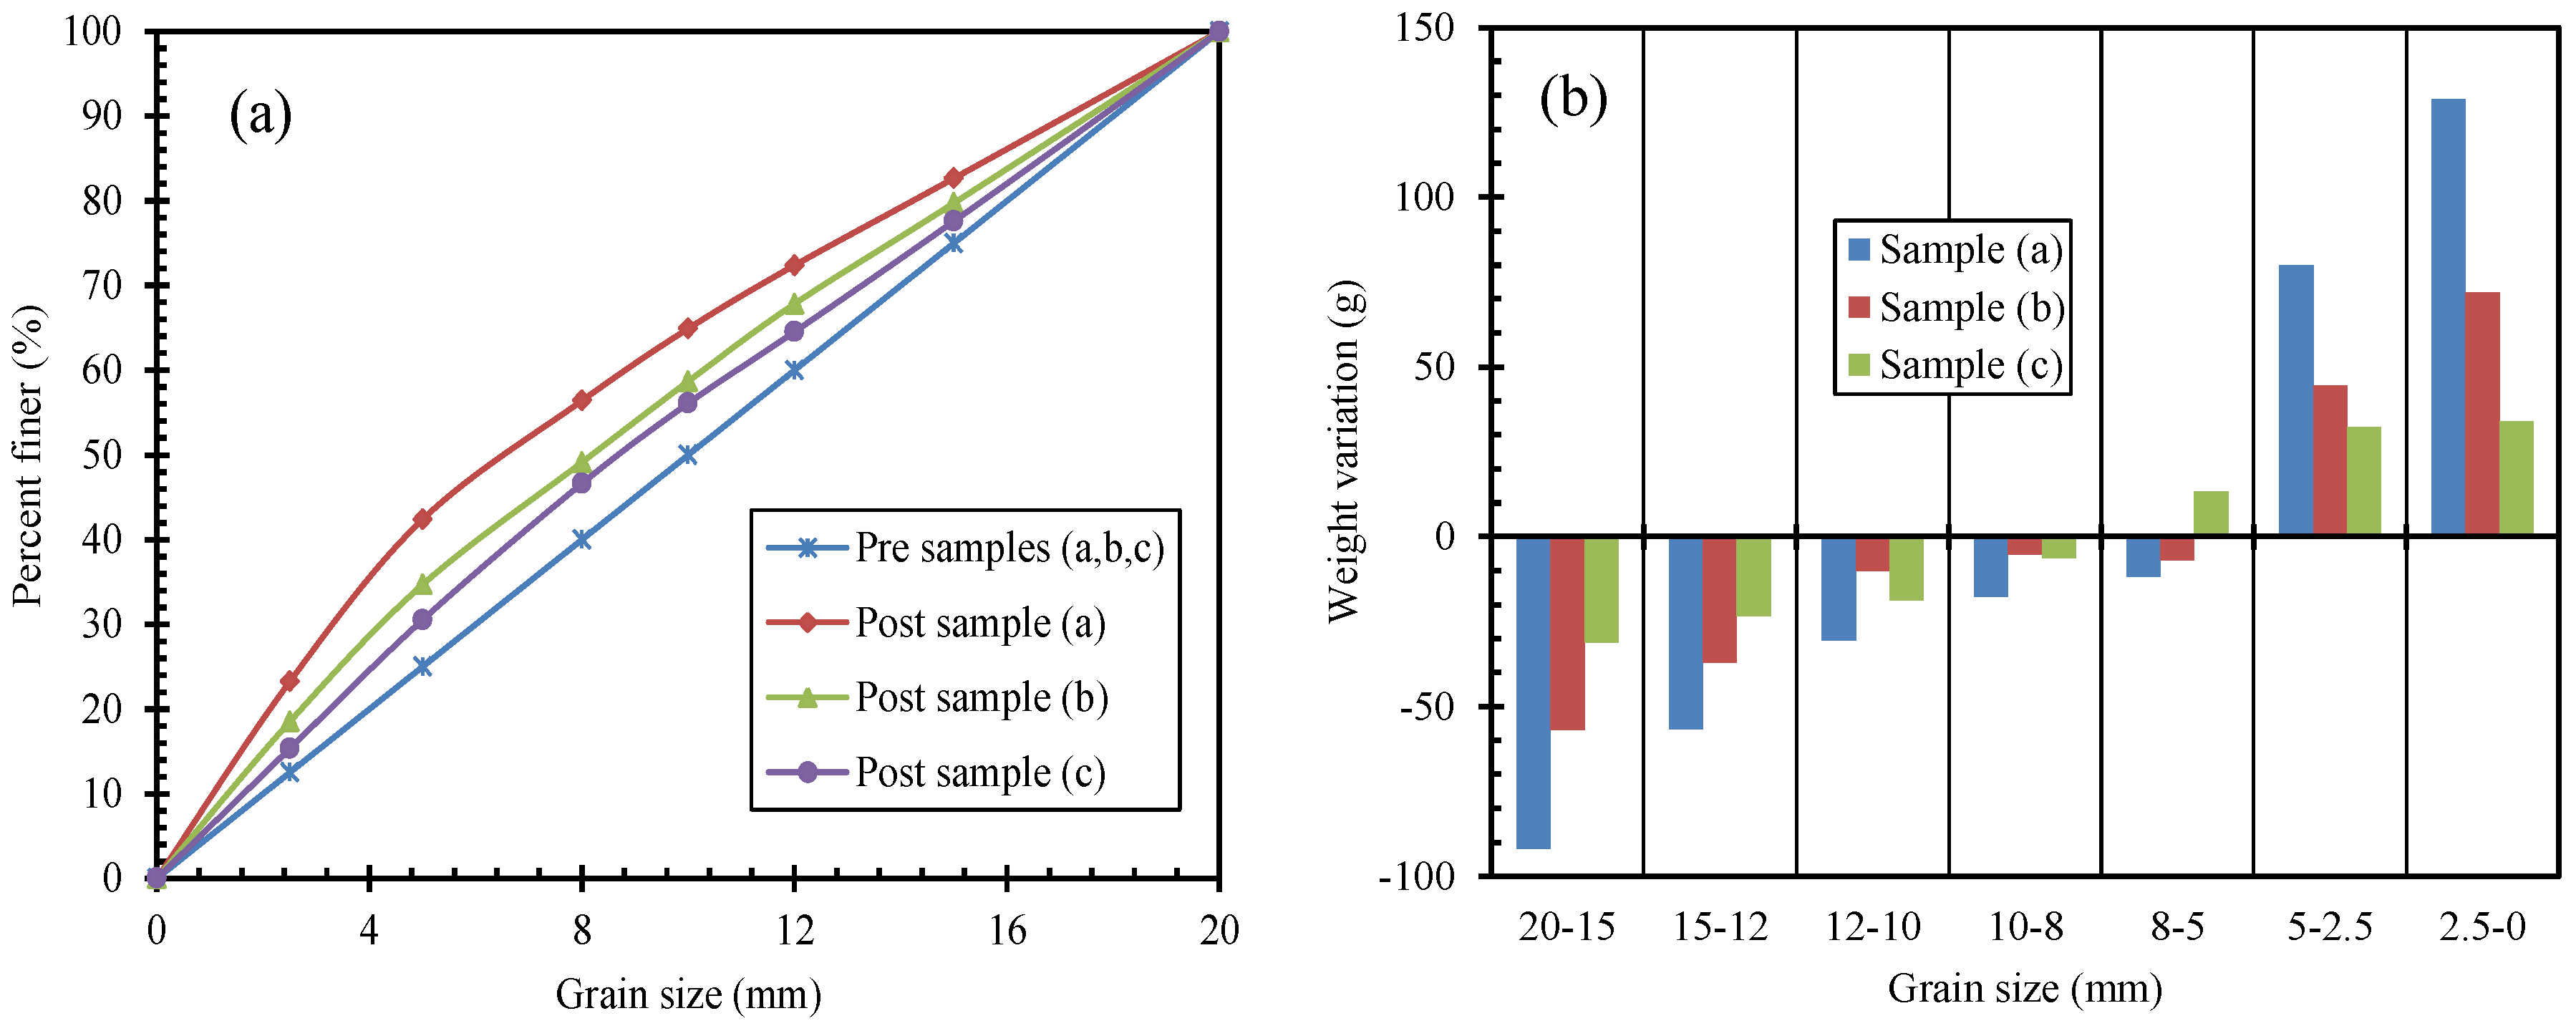
Figure 10.
Porosity (a) and its variation (b) of each sample within variable particle sizes.

Figure 11.
Permeability evolutions during compression. (a) Whole process; (b) permeability–porosity after 2 MPa; and (c) permeability–compressive stress after 2 MPa.
Figure 11.
Permeability evolutions during compression. (a) Whole process; (b) permeability–porosity after 2 MPa; and (c) permeability–compressive stress after 2 MPa.

Figure 12.
Grain size distributions and weight variation for samples within the variable original GSD. (a) Grain size distribution; and (b) weight variation after test (+ means increased, – means decreased).
Figure 12.
Grain size distributions and weight variation for samples within the variable original GSD. (a) Grain size distribution; and (b) weight variation after test (+ means increased, – means decreased).
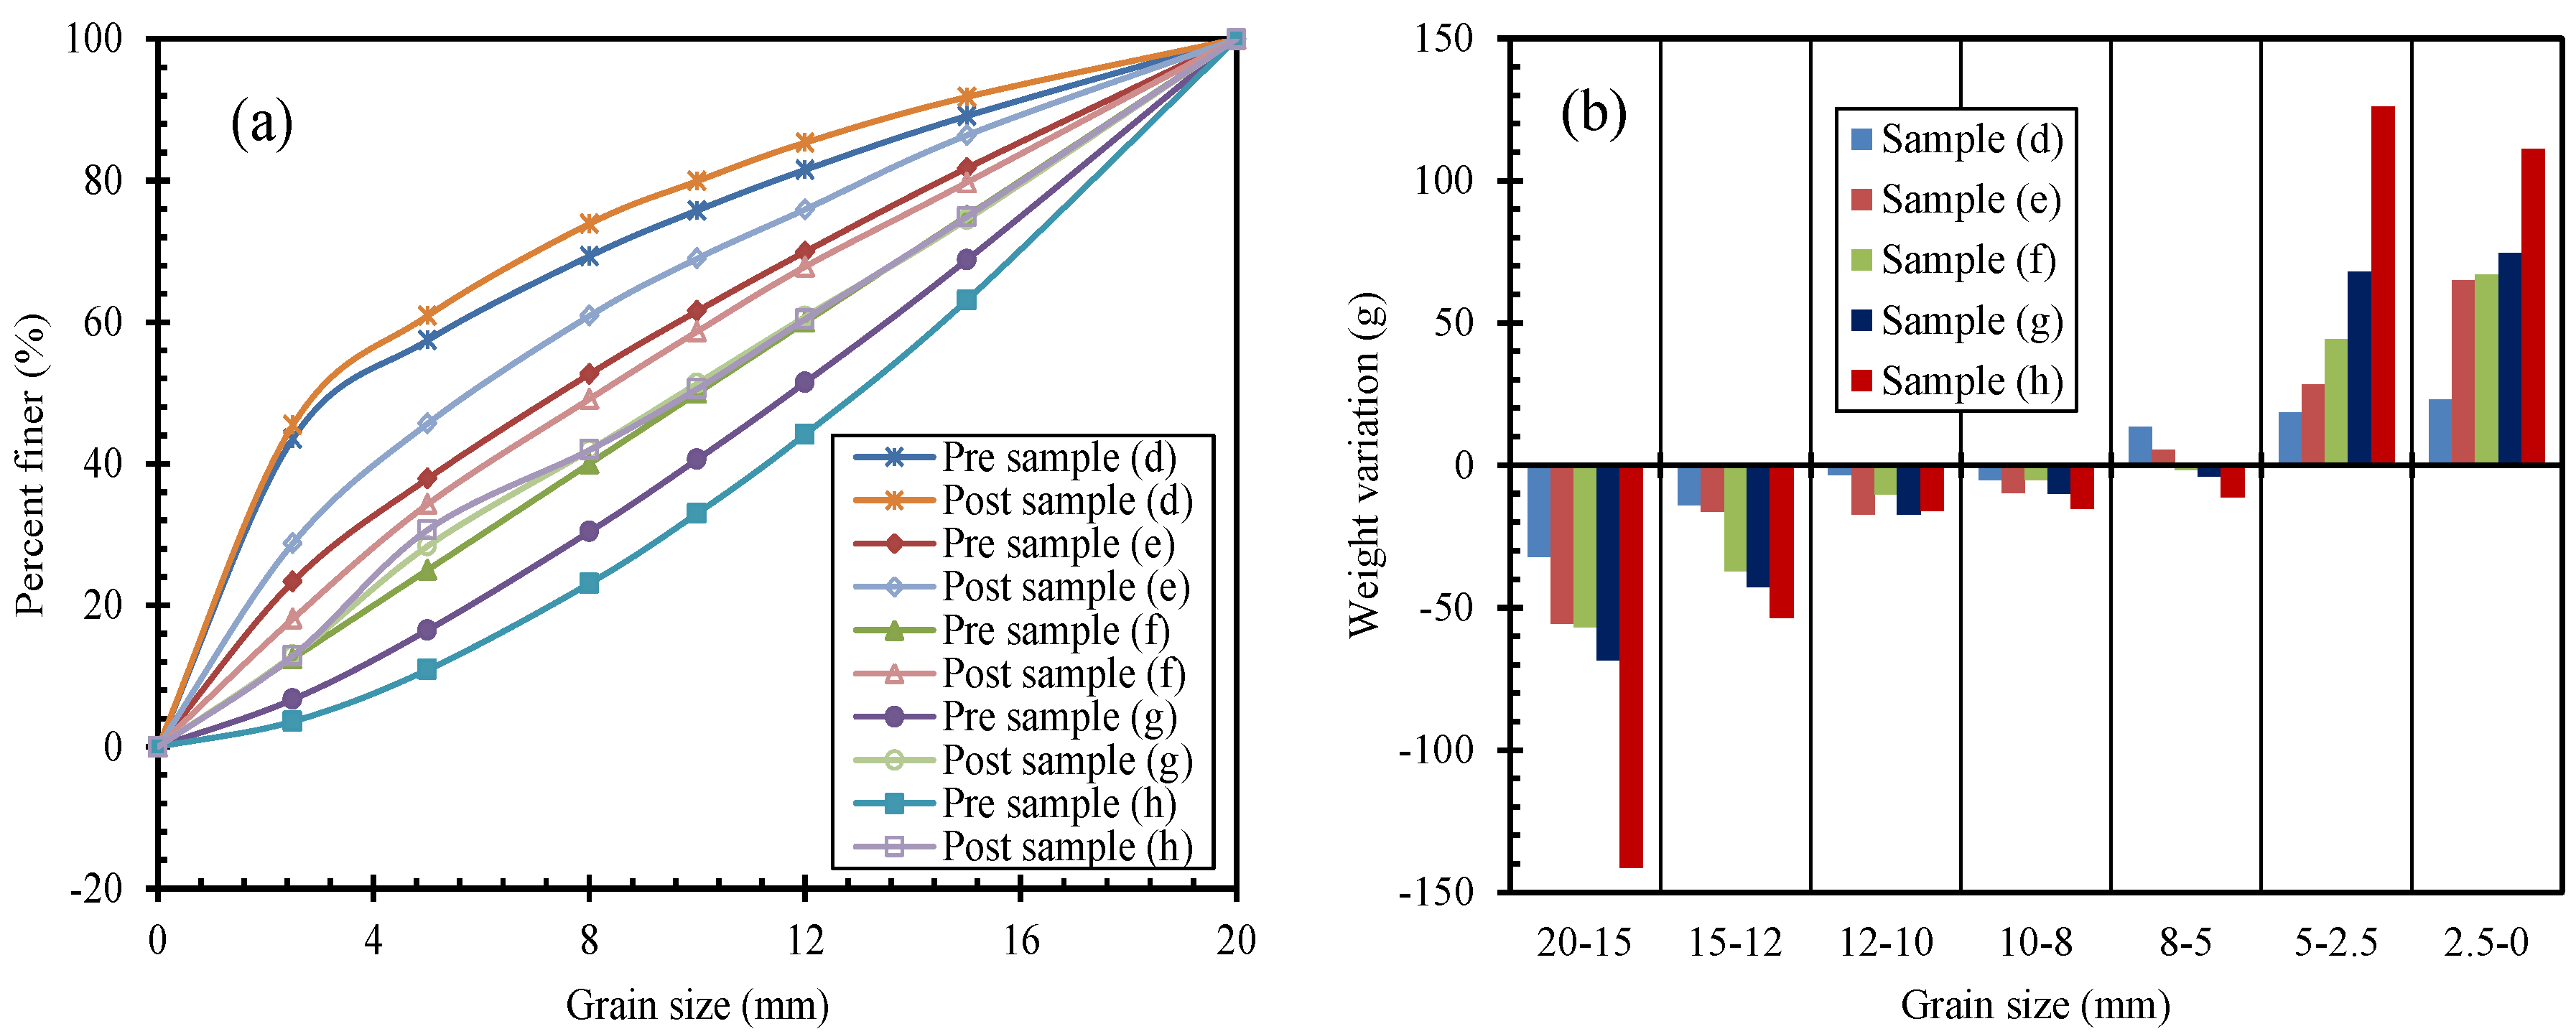
Figure 13.
Permeability–porosity curves for the sample under variable conditions: (a) stress rate; and (b) original GSD.
Figure 13.
Permeability–porosity curves for the sample under variable conditions: (a) stress rate; and (b) original GSD.
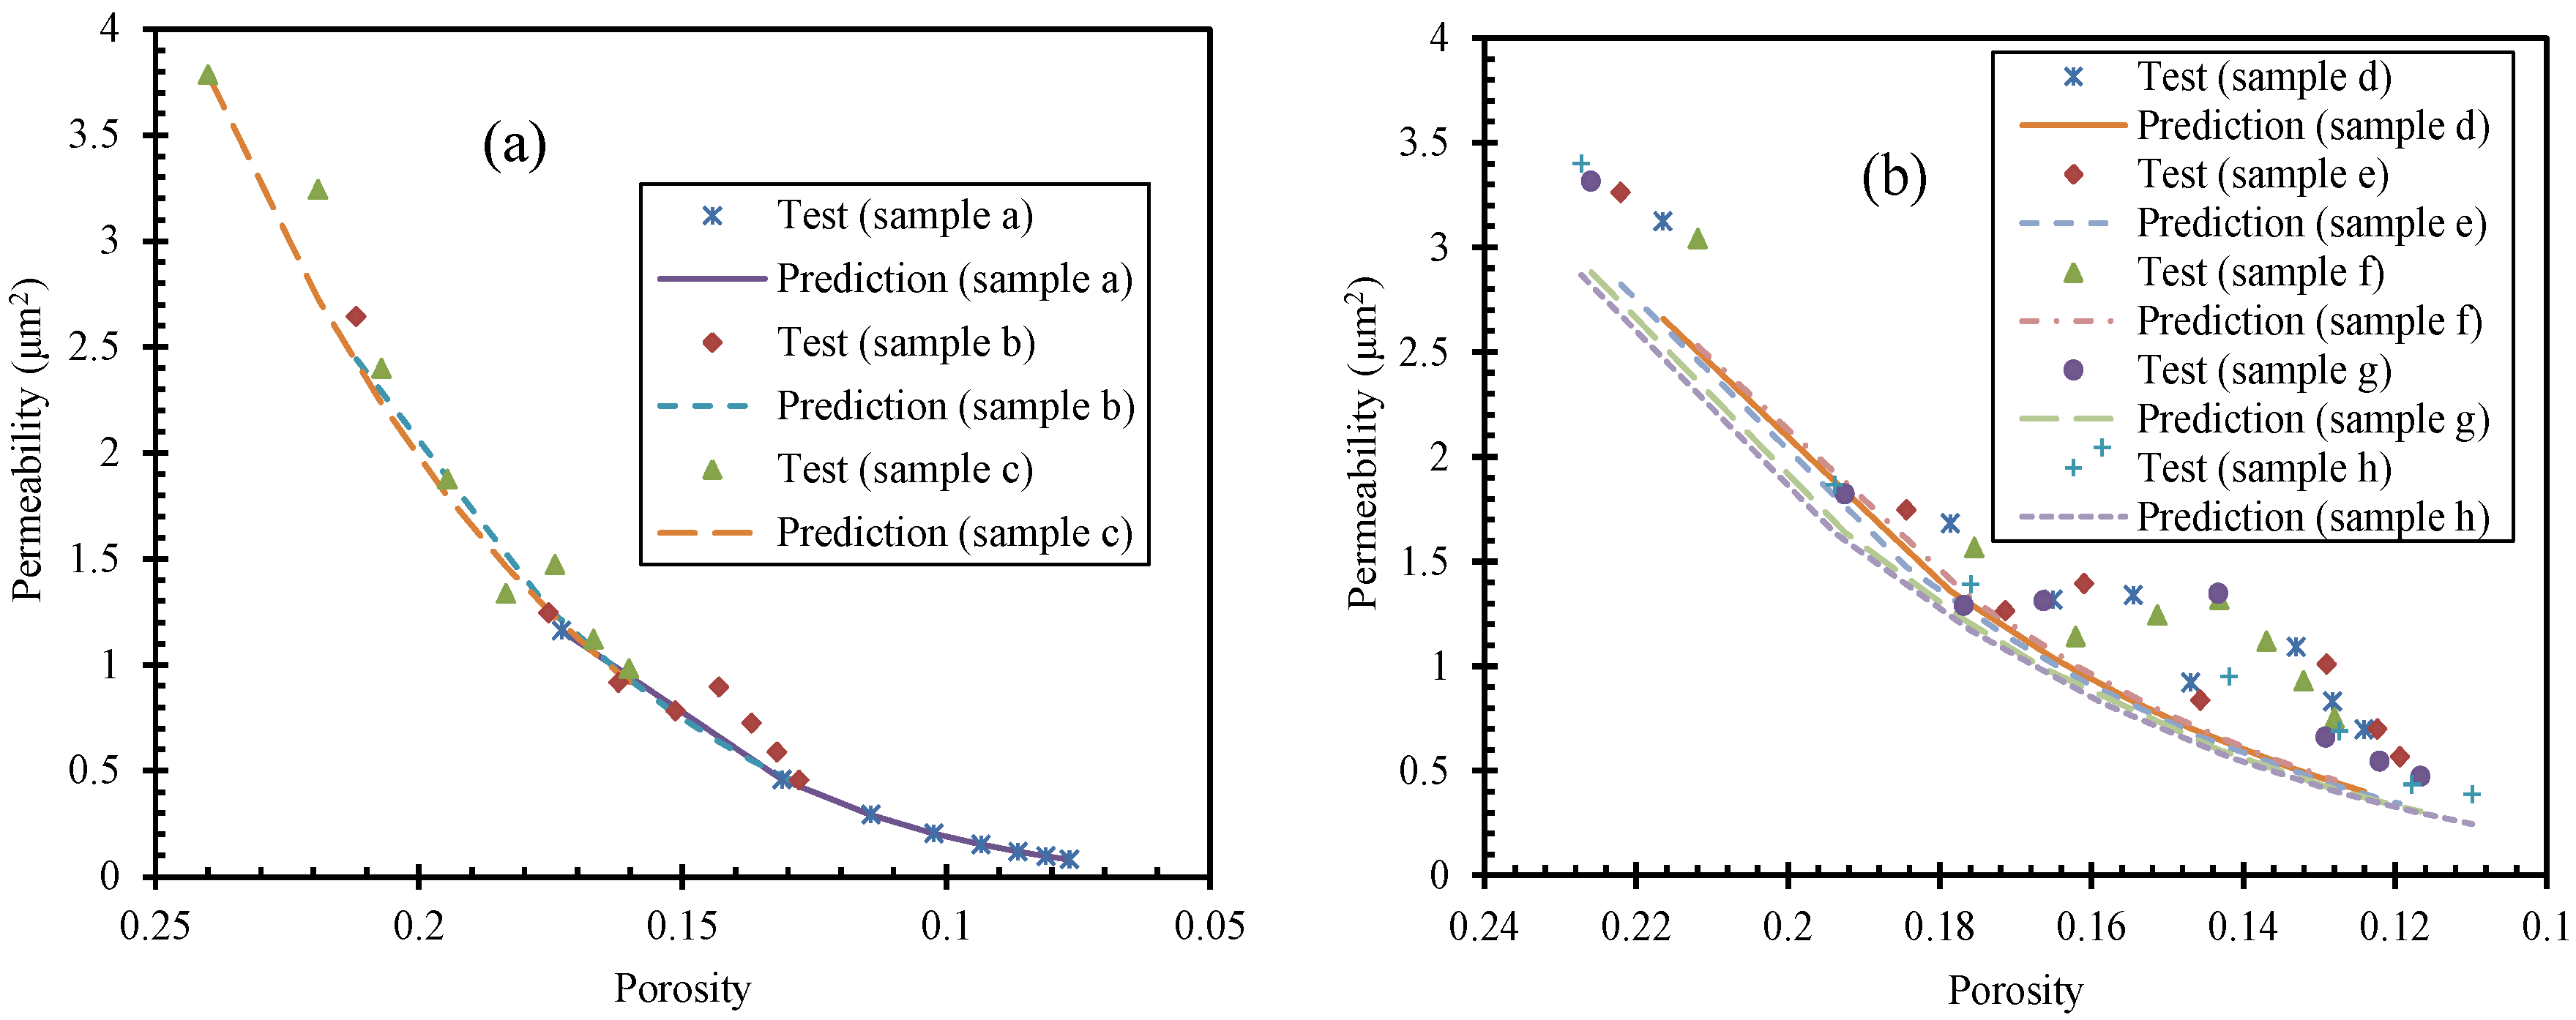
Figure 14.
R2 values for the model predictions of the permeability evolution for different samples.


Table 1.
Stress rate and mass distribution of the particle size arrangement of each sample.
| Test No. | Sample No. | Stress Rate (kN/s) | Particle Mixtures (n in Equation (1)) | Weight to Each Particle Size (g) | ||||||
|---|---|---|---|---|---|---|---|---|---|---|
| 20–15 mm | 15–12 mm | 12–10 mm | 10–8 mm | 8–5 mm | 5–2.5 mm | 2.5–0 mm | ||||
| 1 | a | 0.01 | 1 | 300 | 180 | 120 | 120 | 180 | 150 | 150 |
| b | 0.02 | |||||||||
| c | 0.04 | |||||||||
| 2 | d | 0.02 | 0.4 | 130.4 | 91.3 | 68.8 | 77.7 | 142.6 | 166.9 | 522.3 |
| e | 0.7 | 218.9 | 141.9 | 100.6 | 106.8 | 177.1 | 174.8 | 279.9 | ||
| f | 1 | 300 | 180 | 120 | 120 | 180 | 150 | 150 | ||
| g | 1.3 | 374.4 | 207.9 | 130.3 | 122.7 | 166.7 | 117.5 | 80.4 | ||
| h | 1.6 | 442.7 | 227.4 | 134.1 | 118.9 | 146.4 | 87.5 | 43.1 | ||
Table 2.
Re and permeability test results of sample (a).
| Compressive Stress (MPa) | Sample Height (mm) | Porosity | Gas in Flow Rate (mm·s−1) | Gas Out Pressure (MPa) | Re | Permeability (μm2) |
|---|---|---|---|---|---|---|
| 0 | 130 | 0.288 | 42.689 | 0.587 | 8.095 | 7.488 |
| 1 | 111.9 | 0.173 | 32.902 | 0.553 | 3.751 | 1.422 |
| 2 | 106.6 | 0.131 | 19.366 | 0.531 | 1.674 | 0.557 |
| 3 | 104.5 | 0.114 | 24.573 | 0.553 | 1.851 | 0.717 |
| 4 | 103.1 | 0.102 | 17.528 | 0.498 | 1.181 | 0.341 |
| 5 | 102.1 | 0.093 | 10.909 | 0.462 | 0.671 | 0.161 |
| 6 | 101.4 | 0.087 | 9.152 | 0.455 | 0.521 | 0.128 |
| 7 | 100.8 | 0.081 | 4.461 | 0.476 | 0.238 | 0.071 |
| 8 | 100.3 | 0.077 | 3.469 | 0.129 | 0.175 | 0.021 |
Table 3.
Mass distribution of particle size after testing under variable stress rate.
| Sample No. | Stress Rate (kN/s) | Weight to Each Particle Size (g) | ||||||
|---|---|---|---|---|---|---|---|---|
| 20–15 mm | 15–12 mm | 12–10 mm | 10–8 mm | 8–5 mm | 5–2.5 mm | 2.5–0 mm | ||
| a | 0.01 | 208.1 | 123.3 | 89.5 | 102.2 | 168.2 | 229.9 | 278.8 |
| b | 0.02 | 243.2 | 142.8 | 109.8 | 114.6 | 173.2 | 194.4 | 222.0 |
| c | 0.04 | 268.9 | 156.7 | 101.3 | 113.5 | 193.3 | 182.4 | 184.0 |
Table 4.
Mass distribution of the particle size after testing with the variable original GSD.
| Sample No. | Particle Mixtures (n in Equation (1)) | Weight to Each Particle Size (g) | ||||||
|---|---|---|---|---|---|---|---|---|
| 20–15 mm | 15–12 mm | 12–10 mm | 10–8 mm | 8–5 mm | 5–2.5 mm | 2.5–0 mm | ||
| d | 0.4 | 98.3 | 77.4 | 65.2 | 72.4 | 156.0 | 185.4 | 545.3 |
| e | 0.7 | 163.2 | 125.7 | 83.2 | 97.3 | 182.5 | 203.2 | 344.9 |
| f | 1 | 243.2 | 142.8 | 109.8 | 114.6 | 178.2 | 194.4 | 217.0 |
| g | 1.3 | 305.8 | 165.2 | 113.2 | 112.8 | 162.7 | 185.4 | 154.9 |
| h | 1.6 | 301.2 | 173.9 | 118.2 | 103.7 | 135.3 | 213.5 | 154.2 |
© 2017 by the authors. Licensee MDPI, Basel, Switzerland. This article is an open access article distributed under the terms and conditions of the Creative Commons Attribution (CC BY) license (http://creativecommons.org/licenses/by/4.0/).
Share and Cite
MDPI and ACS Style
Ma, D.; Li, Q.; Hall, M.R.; Wu, Y. Experimental Investigation of Stress Rate and Grain Size on Gas Seepage Characteristics of Granular Coal. Energies 2017, 10, 527. https://doi.org/10.3390/en10040527
AMA Style
Ma D, Li Q, Hall MR, Wu Y. Experimental Investigation of Stress Rate and Grain Size on Gas Seepage Characteristics of Granular Coal. Energies. 2017; 10(4):527. https://doi.org/10.3390/en10040527
Chicago/Turabian StyleMa, Dan, Qiang Li, Matthew R. Hall, and Yu Wu. 2017. "Experimental Investigation of Stress Rate and Grain Size on Gas Seepage Characteristics of Granular Coal" Energies 10, no. 4: 527. https://doi.org/10.3390/en10040527
Note that from the first issue of 2016, this journal uses article numbers instead of page numbers. See further details here.