
Validation of the Measurement Characteristics in an Instrument for Power Quality Estimation—A Case Study
†


Marine Electrical Engineering Faculty, Gdynia Maritime University, 81-225 Gdynia, Poland
†
This is an expanded version of a conference paper: Masnicki, R. Validation of the measurement algorithms in instrument for power quality estimation. In Proceedings of the IEEE 16th International Conference on Environment and Electrical Engineering (EEEIC), Florence, Italy, 7–10 June 2016.
Energies 2017, 10(4), 536; https://doi.org/10.3390/en10040536
Submission received: 15 February 2017
/
Revised: 3 April 2017
/
Accepted: 6 April 2017
/
Published: 15 April 2017
(This article belongs to the Special Issue Selected Papers from 16 IEEE International Conference on Environment and Electrical Engineering (EEEIC 2016))
Abstract
:An acceptable quality of electrical energy is seen today as an important component of ecology. Several instruments for estimating the quality of electrical power have been elaborated. Each supplier assures that the instrument meets the applicable standards and that the uncertainty of the measurement results obtained using the instrument does not exceed the established levels. The accuracy of the measurement results depends on a couple of things, e.g., the correctness of the measurement algorithms implemented in the instrument and the quality of its calibration. In this paper, the basic features of an “estimator/analyzer” (E/A) instrument, as well as the calibration methods of the instrument, the verification of its measurement algorithms, and also the obtained exemplary results, are shown. The proposal of the strategy of the reliable validation of embedded measurement algorithms for the identification of parameters characterizing electrical power quality in the power grid is discussed.
1. Introduction
Ecology is the study of environmental systems, and is not only interested in the individual components of nature, but also in how the parts interact. Industrial ecology is a discipline that has recently been developed, particularly in Europe. Industrial ecology is an interdisciplinary framework for designing and operating industrial systems as living systems interdependent from natural systems. Its aim, among others, is to follow the energy use throughout the industrial processes, in order to improve the efficiency of energy producing. Many ecological and environmental impacts are the side products of electrical power generation, delivery, and consumer systems [1].
The electrical power system can be regarded as a large network system consisting of electrical power generators, voltage transformers, connecting cables, and power consumers [2]. The environmental impact of the production and consumption of electrical energy is becoming more significant because modern society is using an increasing amount of electrical power [3]. This power is usually produced at power plants that convert some other kind of energy into electrical power: conventional, nuclear, and renewable energy sources (RES). Each system has pros and cons, but many of them may pose a threat to the environment. Additionally, the common use of electronic power converters affects the deterioration of electrical power quality. This lower quality of power places a greater burden on the environment [4].
The electrical power quality is a set of parameters describing the properties of the process of provision energy to the user under operating conditions, determining the continuity of the supply (power outage), and characterizing the supply voltage (its value and frequency, shape of waveform, and asymmetry in the multi-phase systems) [5]. The voltage waveforms in the electrical network, often thought of as composed of pure sinusoidal signals, can contain a wide variety of disturbances [6]. The main phenomena related to power quality include:
- Harmonic and other derogations from the expected frequency of the alternating voltage,
- Voltage fluctuations, particularly those causing flickering lights,
- Voltage dips and short interruptions,
- Asymmetry within the three-phase system,
- Surges, having the characteristics of high frequency.
A set of standards has been introduced to cover this field. They define the types and sizes of disturbance, and also the tolerance of various types of equipment to the possible disturbances that may be encountered. The principal standards in this field are the series of IEC 61000 [7], norms EN 50160 [8] and IEEE 1159 [9].
Electrical energy is a product, and like all other products, should meet the relevant quality requirements [10]. A proper operation of electrical equipment requires that the supply voltage only varies within a specified range around the nominal value [11,12]. The presence of disturbances in the electrical network (deterioration of the electrical power quality) is associated with a decrease in the energy production and conversion efficiency [13]. On the other hand, disturbances in the supply voltage mean that the components consuming electrical energy may reach an excessive usage level. It is important to note that the production technologies of the equipment for the generation of electrical energy from renewable sources are not fully “green”. The RES devices also introduce some disturbances to the electrical network.
To minimize the influence of these disturbances, some protectors or noise filters are used [4,14]. A proper choice of equipment can be achieved after the determination of parameters of electrical disturbances as a result of the assessment of the electrical power quality.
Commercially available instruments for electrical power quality estimations also measure other parameters characterizing the power quality. For example, the:
- Effective value of current and voltage,
- Active, reactive, and apparent power and energy,
- Frequency,
- Power factors: cosφ, tgφ, or λ,
- rms value of given harmonics for voltage and current,
- Total harmonic distortion (THD) coefficients for voltage and current.
In [15], the results of an interesting experiment relating to the designation of power quality parameters were shown. Ten instruments used in the experiment (Table 1), owned by various institutions, measured the same set of parameters describing the electrical power quality. “Own design” means the prototype instrument, developed in the scientific institution and taking part in the experiment. The measurements included the network frequency, voltage rms values, total harmonic distortion, rms values of the dominant harmonics, and also the voltage fluctuation parameters: short and long term flicker severity. The measurements were carried out at bus-bars of the medium voltage 6 kV, by means of voltage transformers.
A similar set of ten instruments was used for the following measurements [16]. A schematic diagram of the measurement site is shown in Figure 1. The measurement points were located on the secondary side of a supply transformer, at the substation denoted as GSTS-30 kV (phase-to-phase voltage level Urms = 30 kV). Ten measuring instruments were connected via the voltage transformers.
All instruments used in both experiments were declared as complying with the terms of the respective IEC 61000-4-15 standards [17], according to the statements of the designers and manufacturers. Each of the two measurements was carried out by independent experiments. They were held at the same point of the supply network at the same time, for each experiment. Although the instruments measured the same voltage signals at the same time, their indications differed significantly, independently for each experiment.
In [18], the analysis of possible reasons for the different indications of instruments observed in the aforementioned experiments is presented. As a source error, the authors of the paper indicate the human factor (erroneous set-up of the instrument’s parameters) or design drawbacks of the manufacturer’s equipment. After an estimation of the relations between the results obtained during the measurements, they formulate the simplified linear formulas showing the dependencies between the obtained results and bring the result sets from all of the instruments to a common course, within the accepted range of deviations. They concluded that the reason for the deviations in the measurements results could have originated in variable amplification and could be due to the constant offset of the measurement characteristics of the individual instruments.
The description of effects related to the deviations of the characteristics of the measurement channel (i.e., lost performance or improper calibration) of various devices, causing the deterioration of the operation performance, can be found, e.g., in [19,20].
The vital issue for millions of customers, connected with the calibration quality of energy meters, is presented in [21]. The paper concerns research focused on the accurate assessment of the commonly used static energy meters. In some specific load conditions, their indications can differ by more than 580% when compared to the conventional (electromechanical) energy meters. The research was performed in accordance with the relevant standards of test setups. The research included the energy meters equipped with a variety of current sensors. However, the question, “What is the cause of an error in the processing characteristics of the energy meters?”, remains unanswered. In the context of this investigation, the necessity to measure the quality of the electrical energy is becoming increasingly important, because the number of non-linear and variable-energy loads connected to the electrical network is constantly growing.
The descriptions of the methods and systems for electrical power quality assessment, in their various aspects, can be found, e.g., in [22,23,24,25,26,27].
In [28,29,30], issues concerning the configuration and operation of the measurement track of the “estimator/analyzer” (E/A) instrument for the designation of electrical power quality coefficients, especially for ship power network estimations, were considered. Additionally, considerations connected with investigating the characteristics of the E/A measurement tracks are described in [31,32,33]. Further detailed analyses are based on the case study concerning the designed and constructed instrument, in the area under consideration.
The author of the present paper uses the term “calibration”, which can be defined as: “a test during which known values of measures are applied to the device input and corresponding output readings are recorded under specified conditions”. A related notion of “validation”, which in engineering means confirming that a product or service meets the needs of its users, is used in this paper. An overview of the selected validation methods can be found in [34].
For the user of a specific instrument, it is difficult to assess the correctness of the instruments’ indications during the measurement operation. They can only relay on the declarations of the instrument manufacturer.
This work is focused on the method of reliable validation of the E/A instrument characteristics. The main goal of this paper is to show the solution used in the developed instrument. The paper deals with an additional configuration, necessary to implement the validation procedures of the algorithms applied in the E/A instrument.
In Section 2, the measurement functions, as well as the basic measurement algorithms, implemented in the instrument are in short given. Section 3 describes the calibration procedures applied during the examination of the instrument. The constraints of the procedures used are mentioned. Section 4 presents the proposal of a reliable method for the validation of measurement algorithms implemented in the instrument measurement functions as embedded processor software. This work is summarized in Section 5.
2. Measurement Functions of the E/A
In this section, the hardware configuration of the E/A and its measurement functions are in short presented. The configuration of the instrument is shown in Figure 2.
The voltages from the electrical network (3- or 4-wires) and phase currents from generating sets (up to three) are delivered to the input terminals of the signal conditioning units. The configuration of the signal conditioning units applied in the voltage channels is shown in Figure 3. The voltage dividers (VD) adapt the level of the network voltages to the value acceptable in the next parts of the measurement channels. The galvanic separation (GS) block ensures a safe operation for other circuits of the E/A. The low-pass filter is switched between 10 and 100 kHz, depending on the actual measurement function. The voltage follower (VF) provides the adequate output resistance of this part of the measurement channel. The output signal is fed to the input of the analog-to-digital converter (ADC). The network currents are measured using the current probe type LFR 1/15 (Power Electronic Measurements Ltd., Nottingham, UK) (based on the Rogowski coil). The configuration of the signal conditioning units applied in the current channels is similar to the signal conditioning unit used in the voltage channels, but in the current channels, the VD blocks are missing. The current probe signals are directly fed to the inputs of the GS blocks.
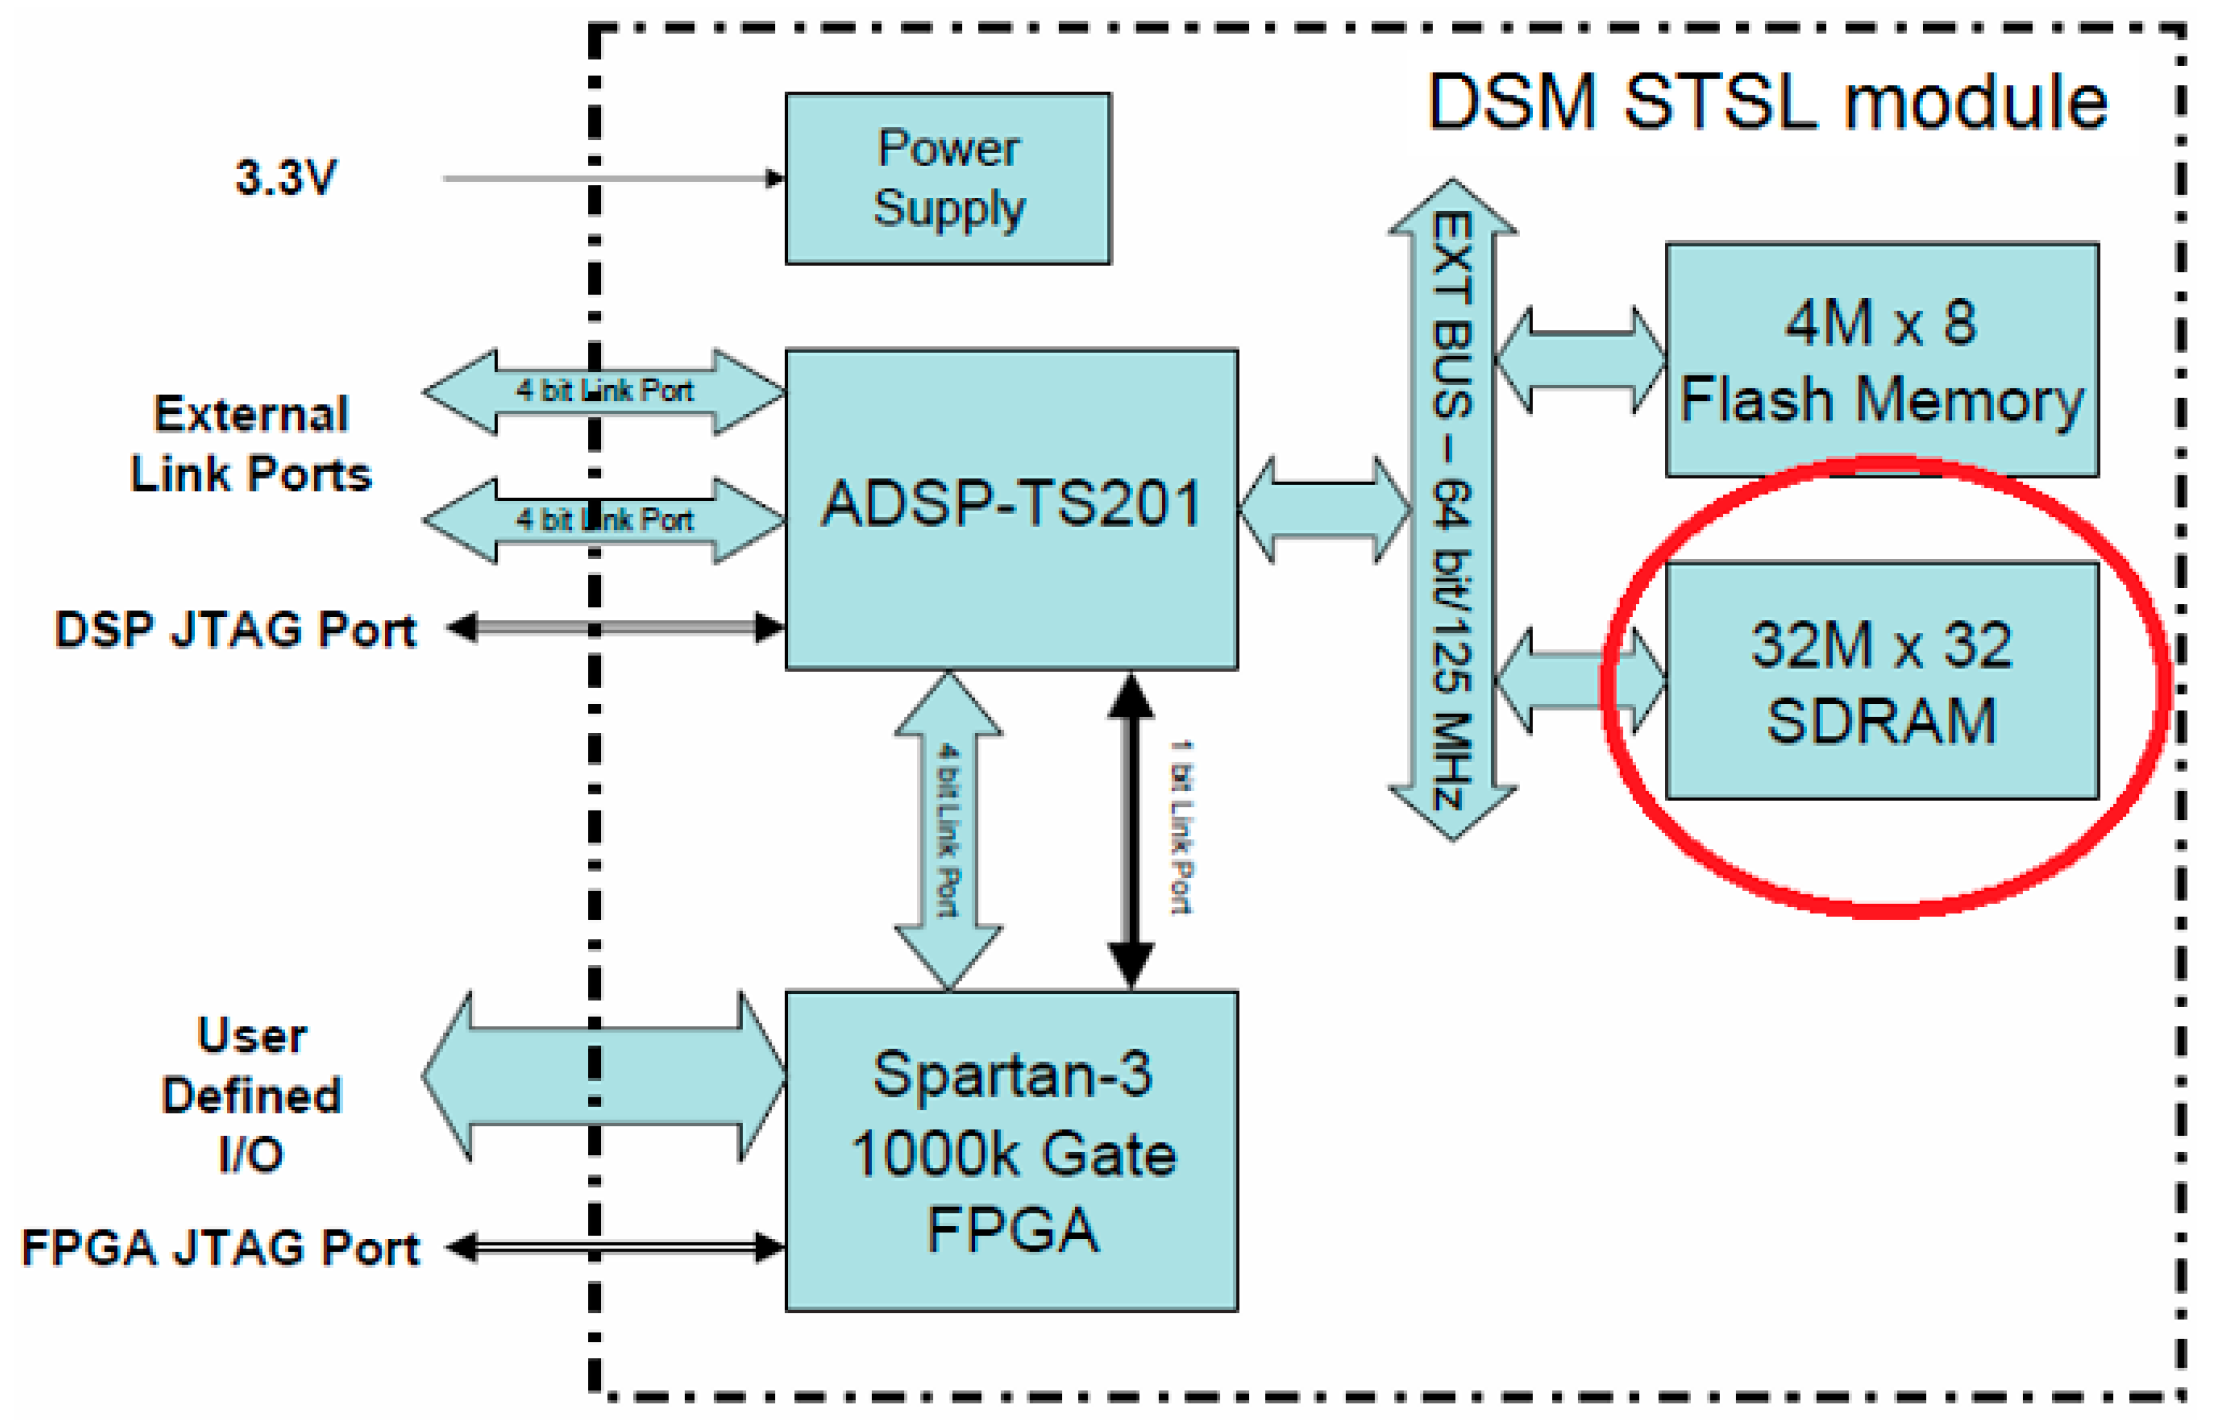
The designation of coefficients describing the electrical power quality is carried out using a ADSP-TS201 TigerSHARC (Analog Devices, Norwood, MA, USA) digital signal processor (DSP) embedded on the DSP Subsystem Module (DSM; STSL stands for “Single TigerSHARC with Logic”) (Kaztek Systems, Acton, MA, USA) [35] (Figure 2). The configuration of the DSM STSL module resources is shown in Figure 4. There is also a field-programmable gate array (FPGA) Xilinx Spartan-3 (Xilinx, Inc., San Jose, CA, USA) which is used for the data exchange between the DSP and other systems of the instrument. For the communication of DSM devices with other E/A circuits, user-defined FPGA input/output (I/O) lines were used. The user interface (Figure 2), designed for the control and selection of individual measurement functions of the instrument, is supported by the general purpose processor (GPP) LPC3250 (ARM926EJ-S core) (NXP Semiconductors Netherlands B.V., Eindhoven, The Netherlands). This processor also controls the indication and registration of the measurement data.
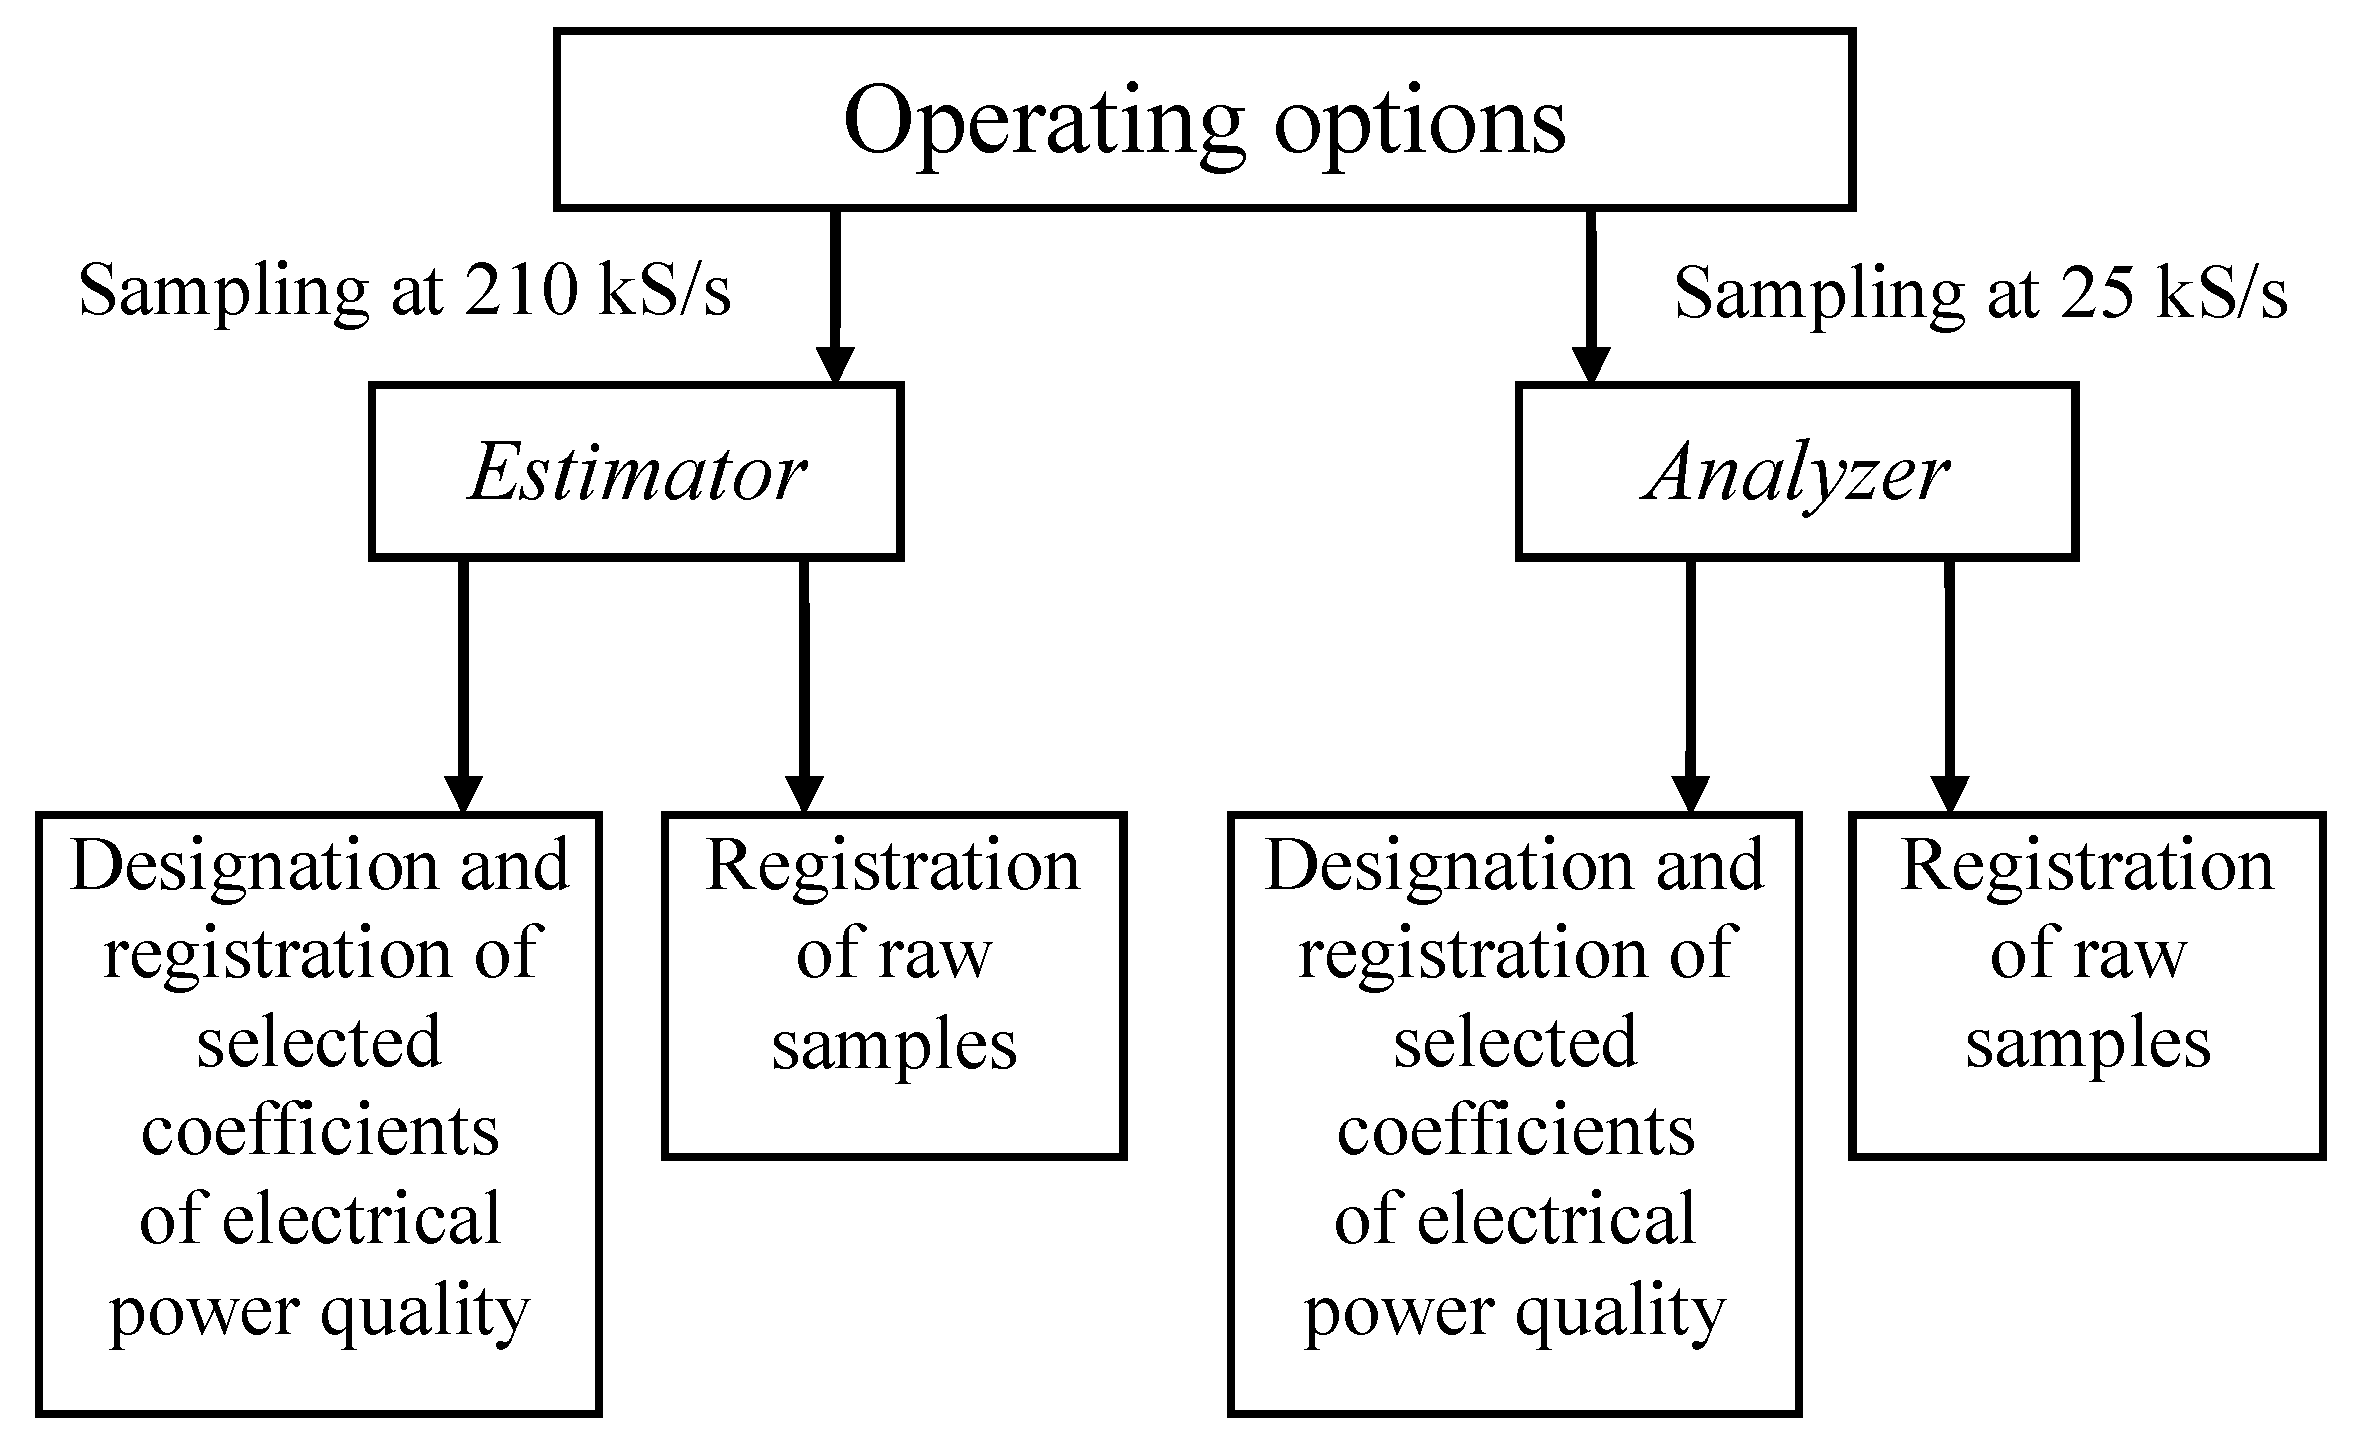
In Figure 5, the main operations carried out in the measurement track of the instrument, connected with data processing, are shown. They differ in the sampling rate of the electrical network signals, as well as in a set of measured quantities and therefore in the set of designated coefficients. The electrical network signals are simultaneously sampled in all voltage channels at the rate of 210 kS/s or in all of the voltage and current channels at the rate of 25 kS/s, depending on the performed measuring function of the E/A.
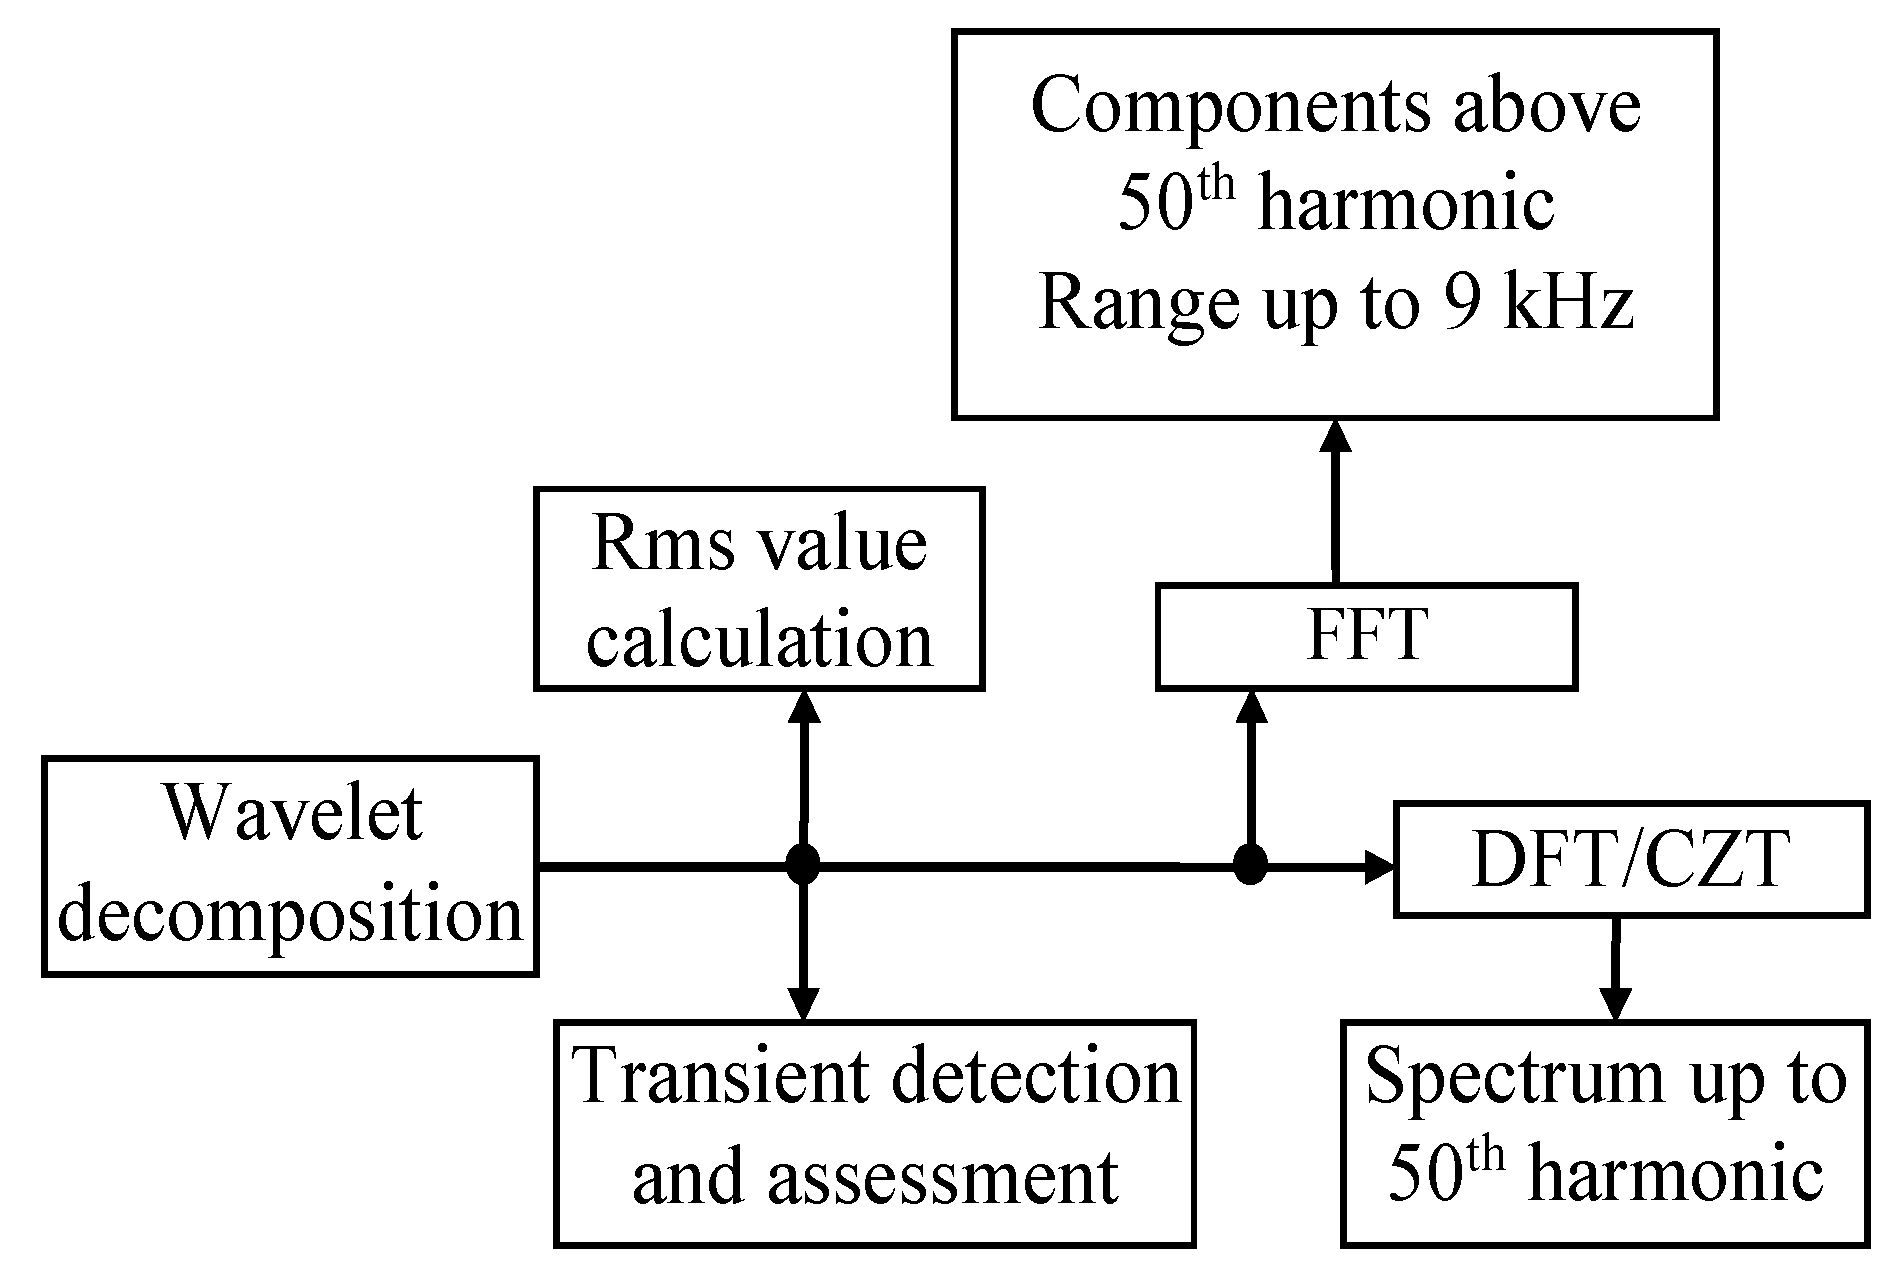
The algorithms of the digital data processing (DDP) used to determine the value of the individual parameters of the electrical power quality are based on the common application of the discrete wavelet transform (DWT), fast Fourier transform (FFT), discrete Fourier transform (DFT), or chirp Z-transform (CZT), performed in a complementary way [30,36,37]. Namely, the wavelet coefficients after respective levels of wavelet decomposition are used as the input data for various procedures employed to calculate the rms values and coefficients in the Fourier series, in combination with the transient monitoring algorithm. The main components of the measurement algorithms are shown in Figure 6. These operations are carried out in the DSP (Figure 2).
3. Procedures for Assessing the Characteristics of the E/A
To evaluate the measurement characteristics of the whole measurement track, the E/A was tested in the laboratory as well as in the ship environment for several different test signals.
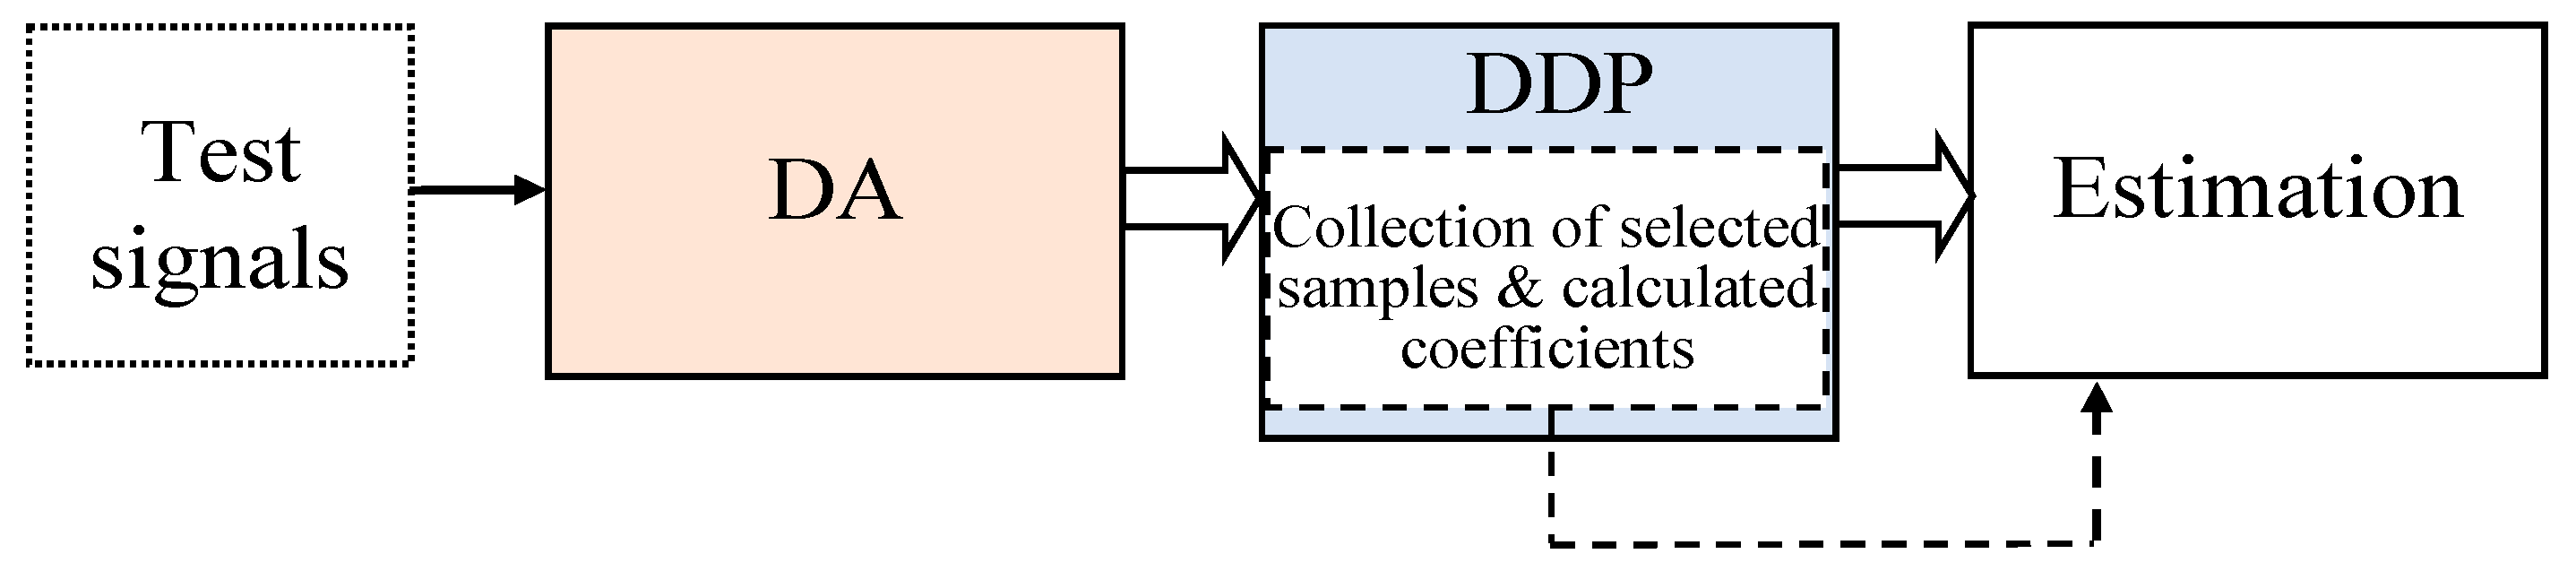
The configuration of each E/A measurement track can be illustrated in simplified form, as shown in Figure 7. The two main parts of the track, the data acquisition (DA) and the DDP, determine the correctness of the measurement result. An evaluation of the measurement characteristics of the designed instrument was made considering these two parts of the track.
Measurement information in the DA part of the track is carried by the instantaneous values of the analog signals, and the conversion of these signals is performed systemically (in analog track). The course of characteristics of the DA may change, because this part of the measurement track is susceptible to the influence of many external impacts. The calibration of the DA part is based on the determination of its actual characteristics of the signal conversion.
In the DDP part, the information in a form of digital representation of the signals from the DA, after they have been sampled and converted in the ADC, is presented by the stream of digital data. The processing of data in this part of the track is performed in the software. The characteristics of the DDP, describing the data processing in the software algorithms, are substantially unchanging. The validation of the DDP characteristics means checking the correctness (as well as further correction) of the measurement algorithms performed in this part of the track.
3.1. The Calibration of DA Part of Measurement Channel
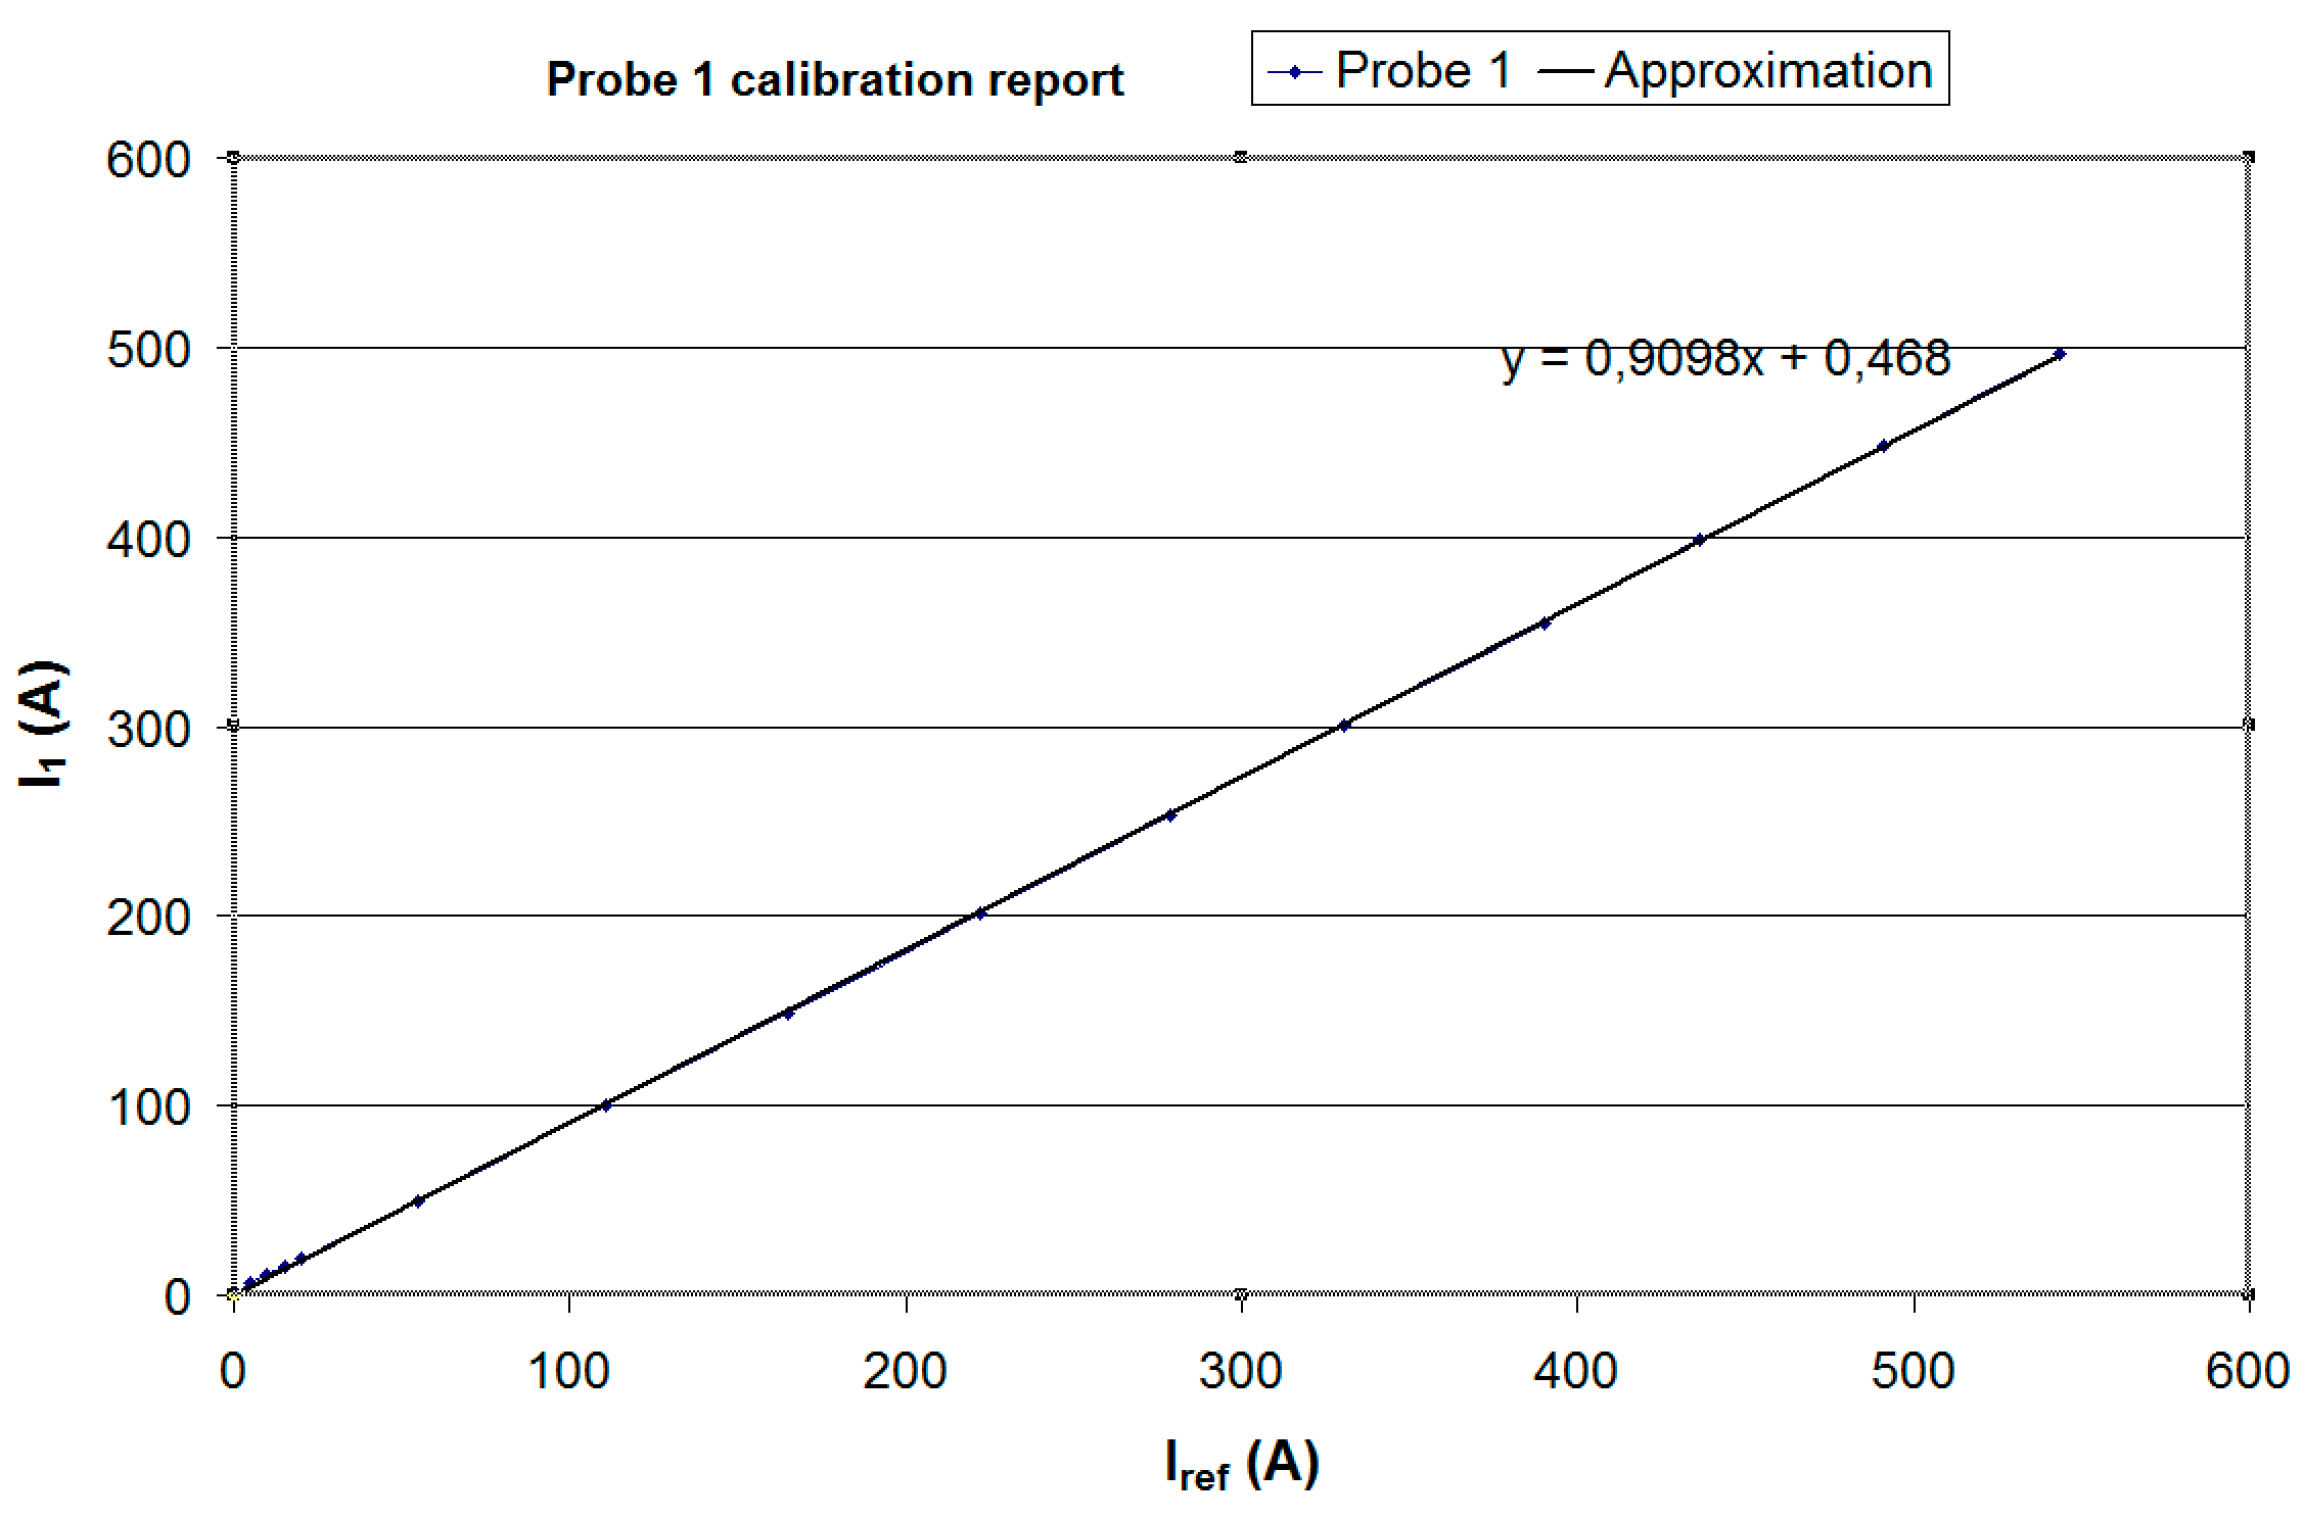
The calibration of the DA part is easy to perform. It relys on determining the relationship between the output signal and the input signal (under stabilized conditions) over the range of the input signal. The calibration of the input analog circuits, starting from the voltage dividers (for three voltage channels) and the Rogowski coils (for six current channels) to the ADC’s (Figure 2), was performed using the pattern sources of the alternating voltage and current. In Figure 8, the exemplary characteristics obtained as a result of the calibration of one of the current probes used, together with a designation of its trend line, are shown. Figure 9 contains the deviation of the trend line from the probe characteristics. The absolute value of this deviation (∆approx) slightly exceeds the value of 0.8 A. Taking into account the range of the current probe LFR 1/15 (peak current to 3000 A), it is an acceptable value in the application under consideration.
The equations of the trend lines, obtained in the calibration procedures of the DA part of the measurement track (Figure 8), were used in the DDP part for the scaling of digital data in the corresponding channels.
Current research on the configuration of the E/A is carried out in a way which leads to the provision of its input circuits to the system for the self-calibration of the DA part of the measurement track. The DDP processing of the DA data, obtained for the standard test signal St, allows one to designate the actual DA characteristics and correct the DA data obtained for the measurement signal Sm, as well as to determine the corrected result, along with the estimation of its uncertainty. The detailed description of the procedures and the calibration circuit is shown, e.g., in [38]. It is assumed that the additional operations performed in the DDP (shown in Figure 10) enable the determination of the uncertainty of the results.
3.2. The Designation of Characreristics of Measurement Channel
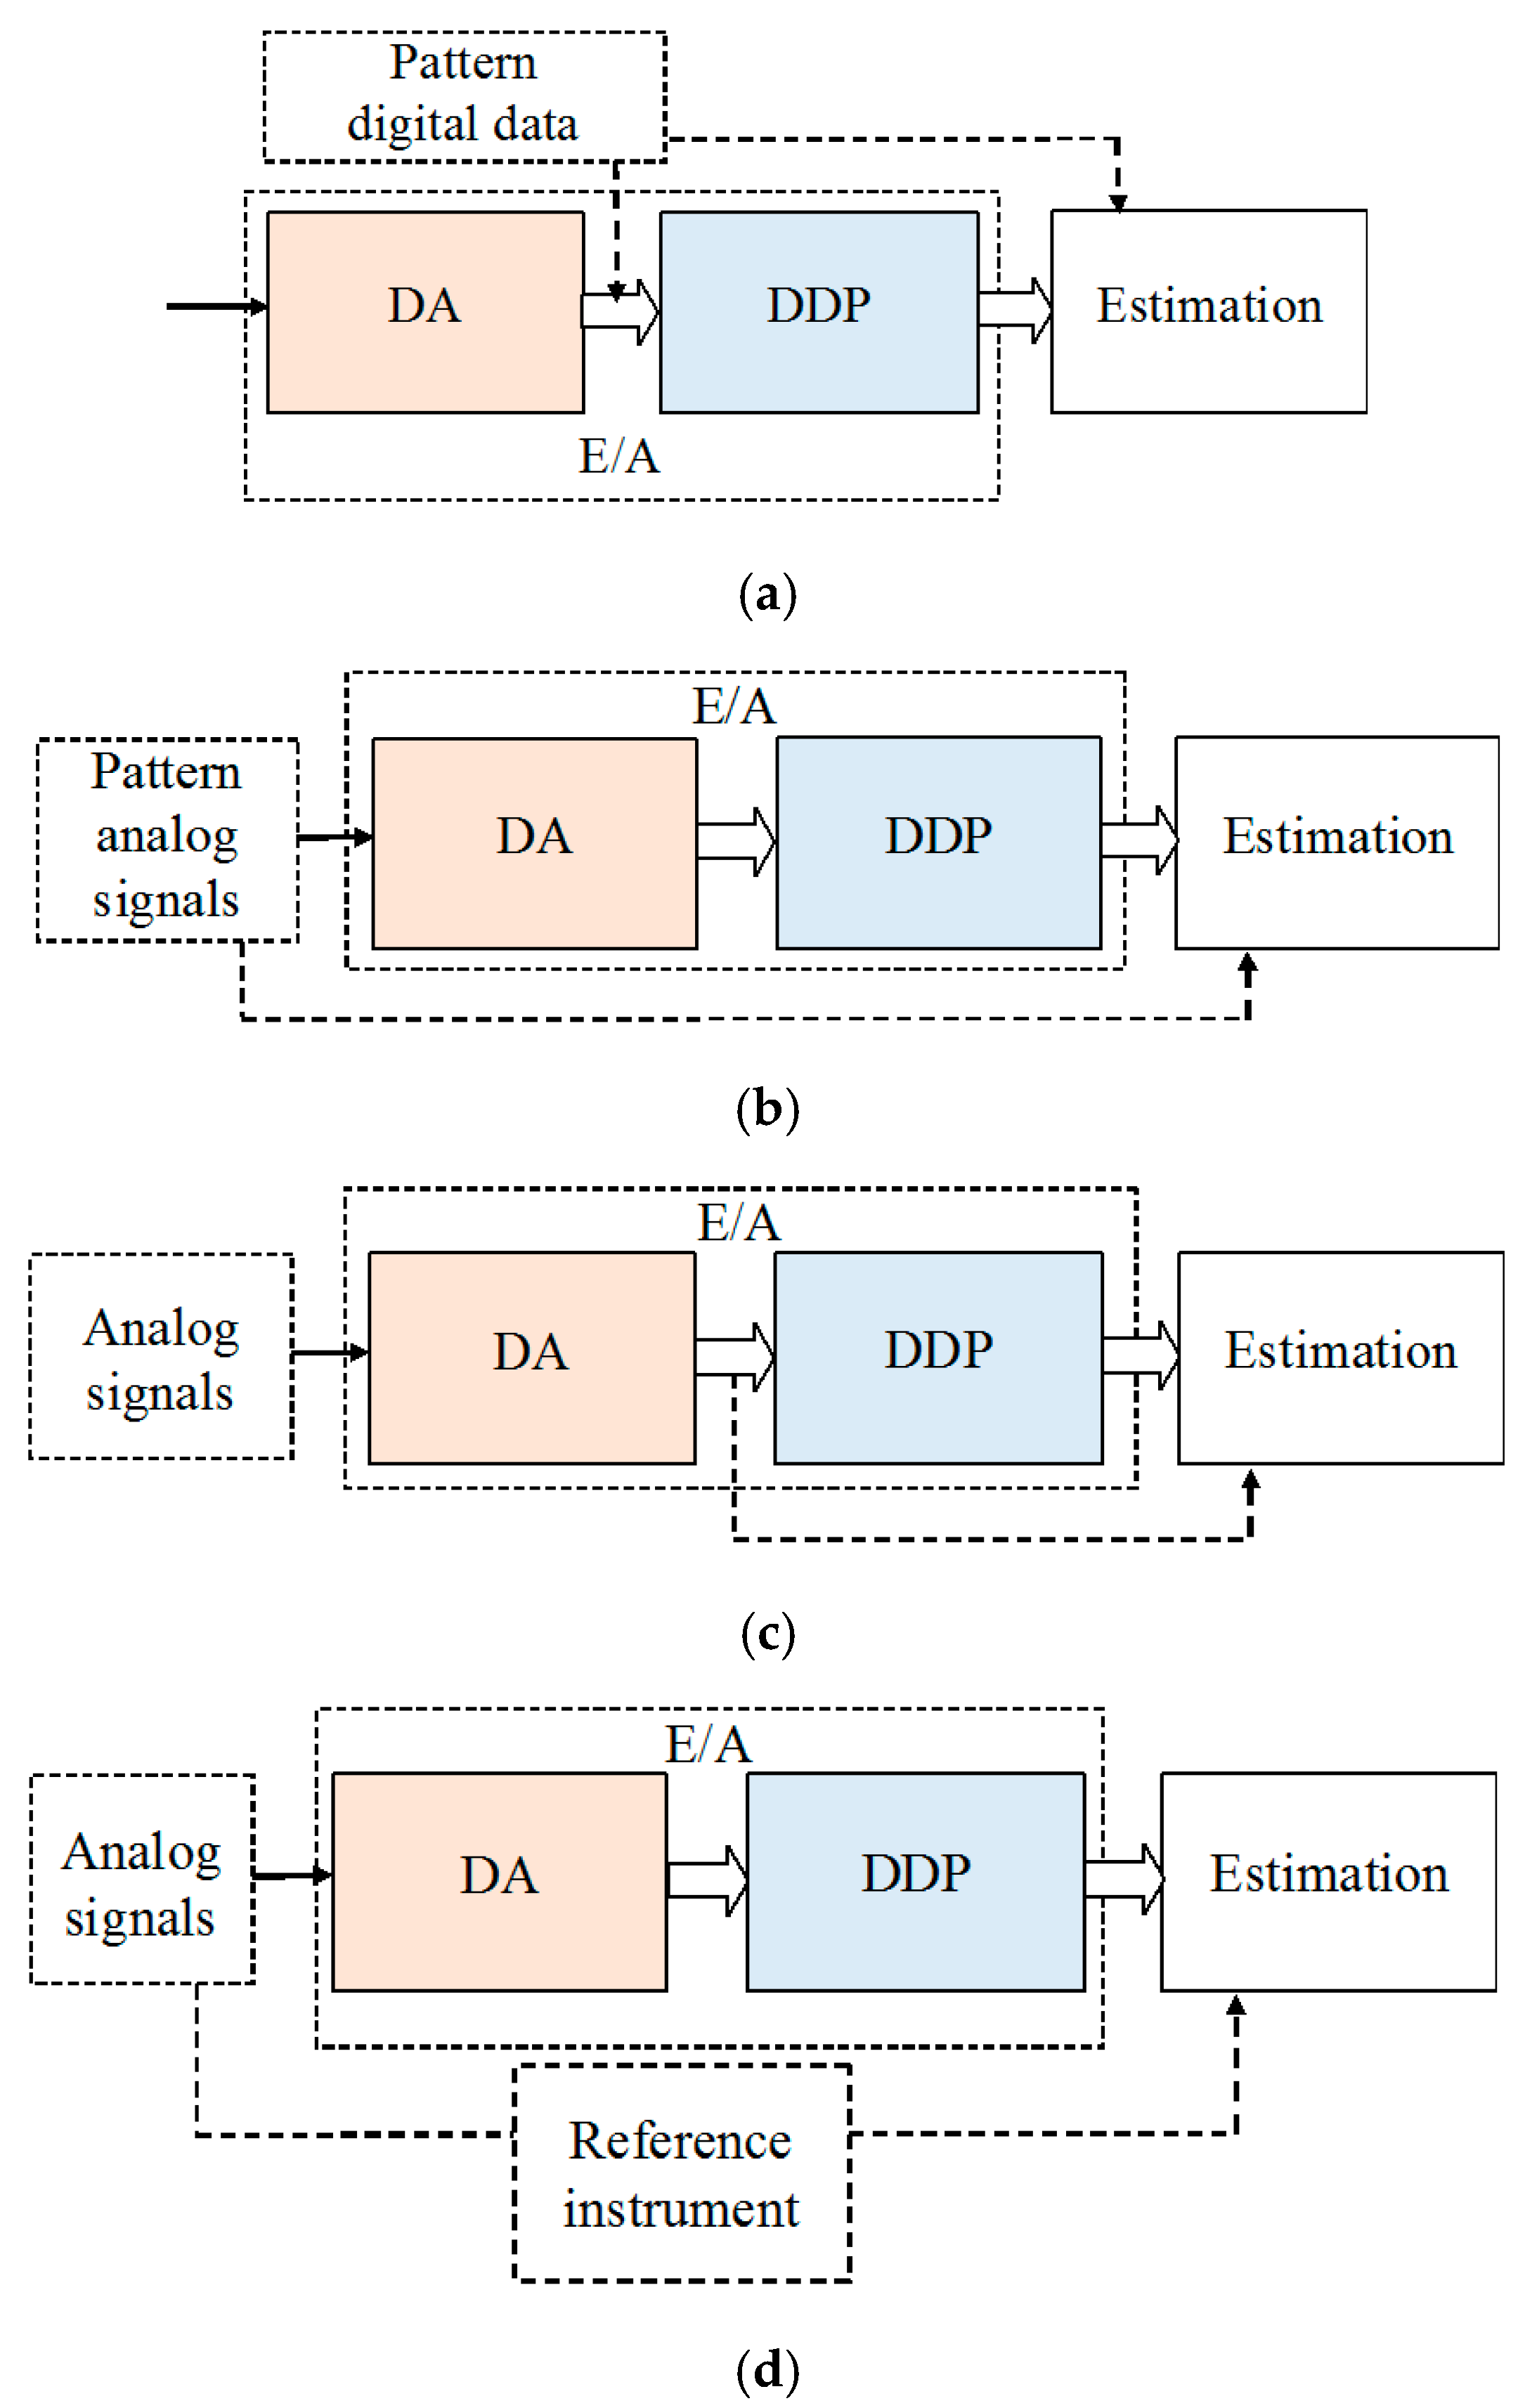
The proper calibration of the instrument’s input circuits seems to be a basic requirement. Probably, for most of the effects described in [15,16], it can be assigned to the change of the conversion characteristics of the DA section of the devices used in the experiment. Independently, the accuracy of the designation of a particular power quality coefficient also depends on the correctness of the algorithms applied in the DDP part of the measurement channels. The goal of the performed experiments is, most of all, the examination of the algorithms embedded in the software executed in the DSP. The research was carried out using the four basic arrangement configurations presented in Figure 11. The estimation procedures are performed in applications running on a PC. The distinction of the DA and DDP parts in the measurement channel allows one to apply various test signals and calibration techniques for the estimation of the measurement features of the E/A instrument.
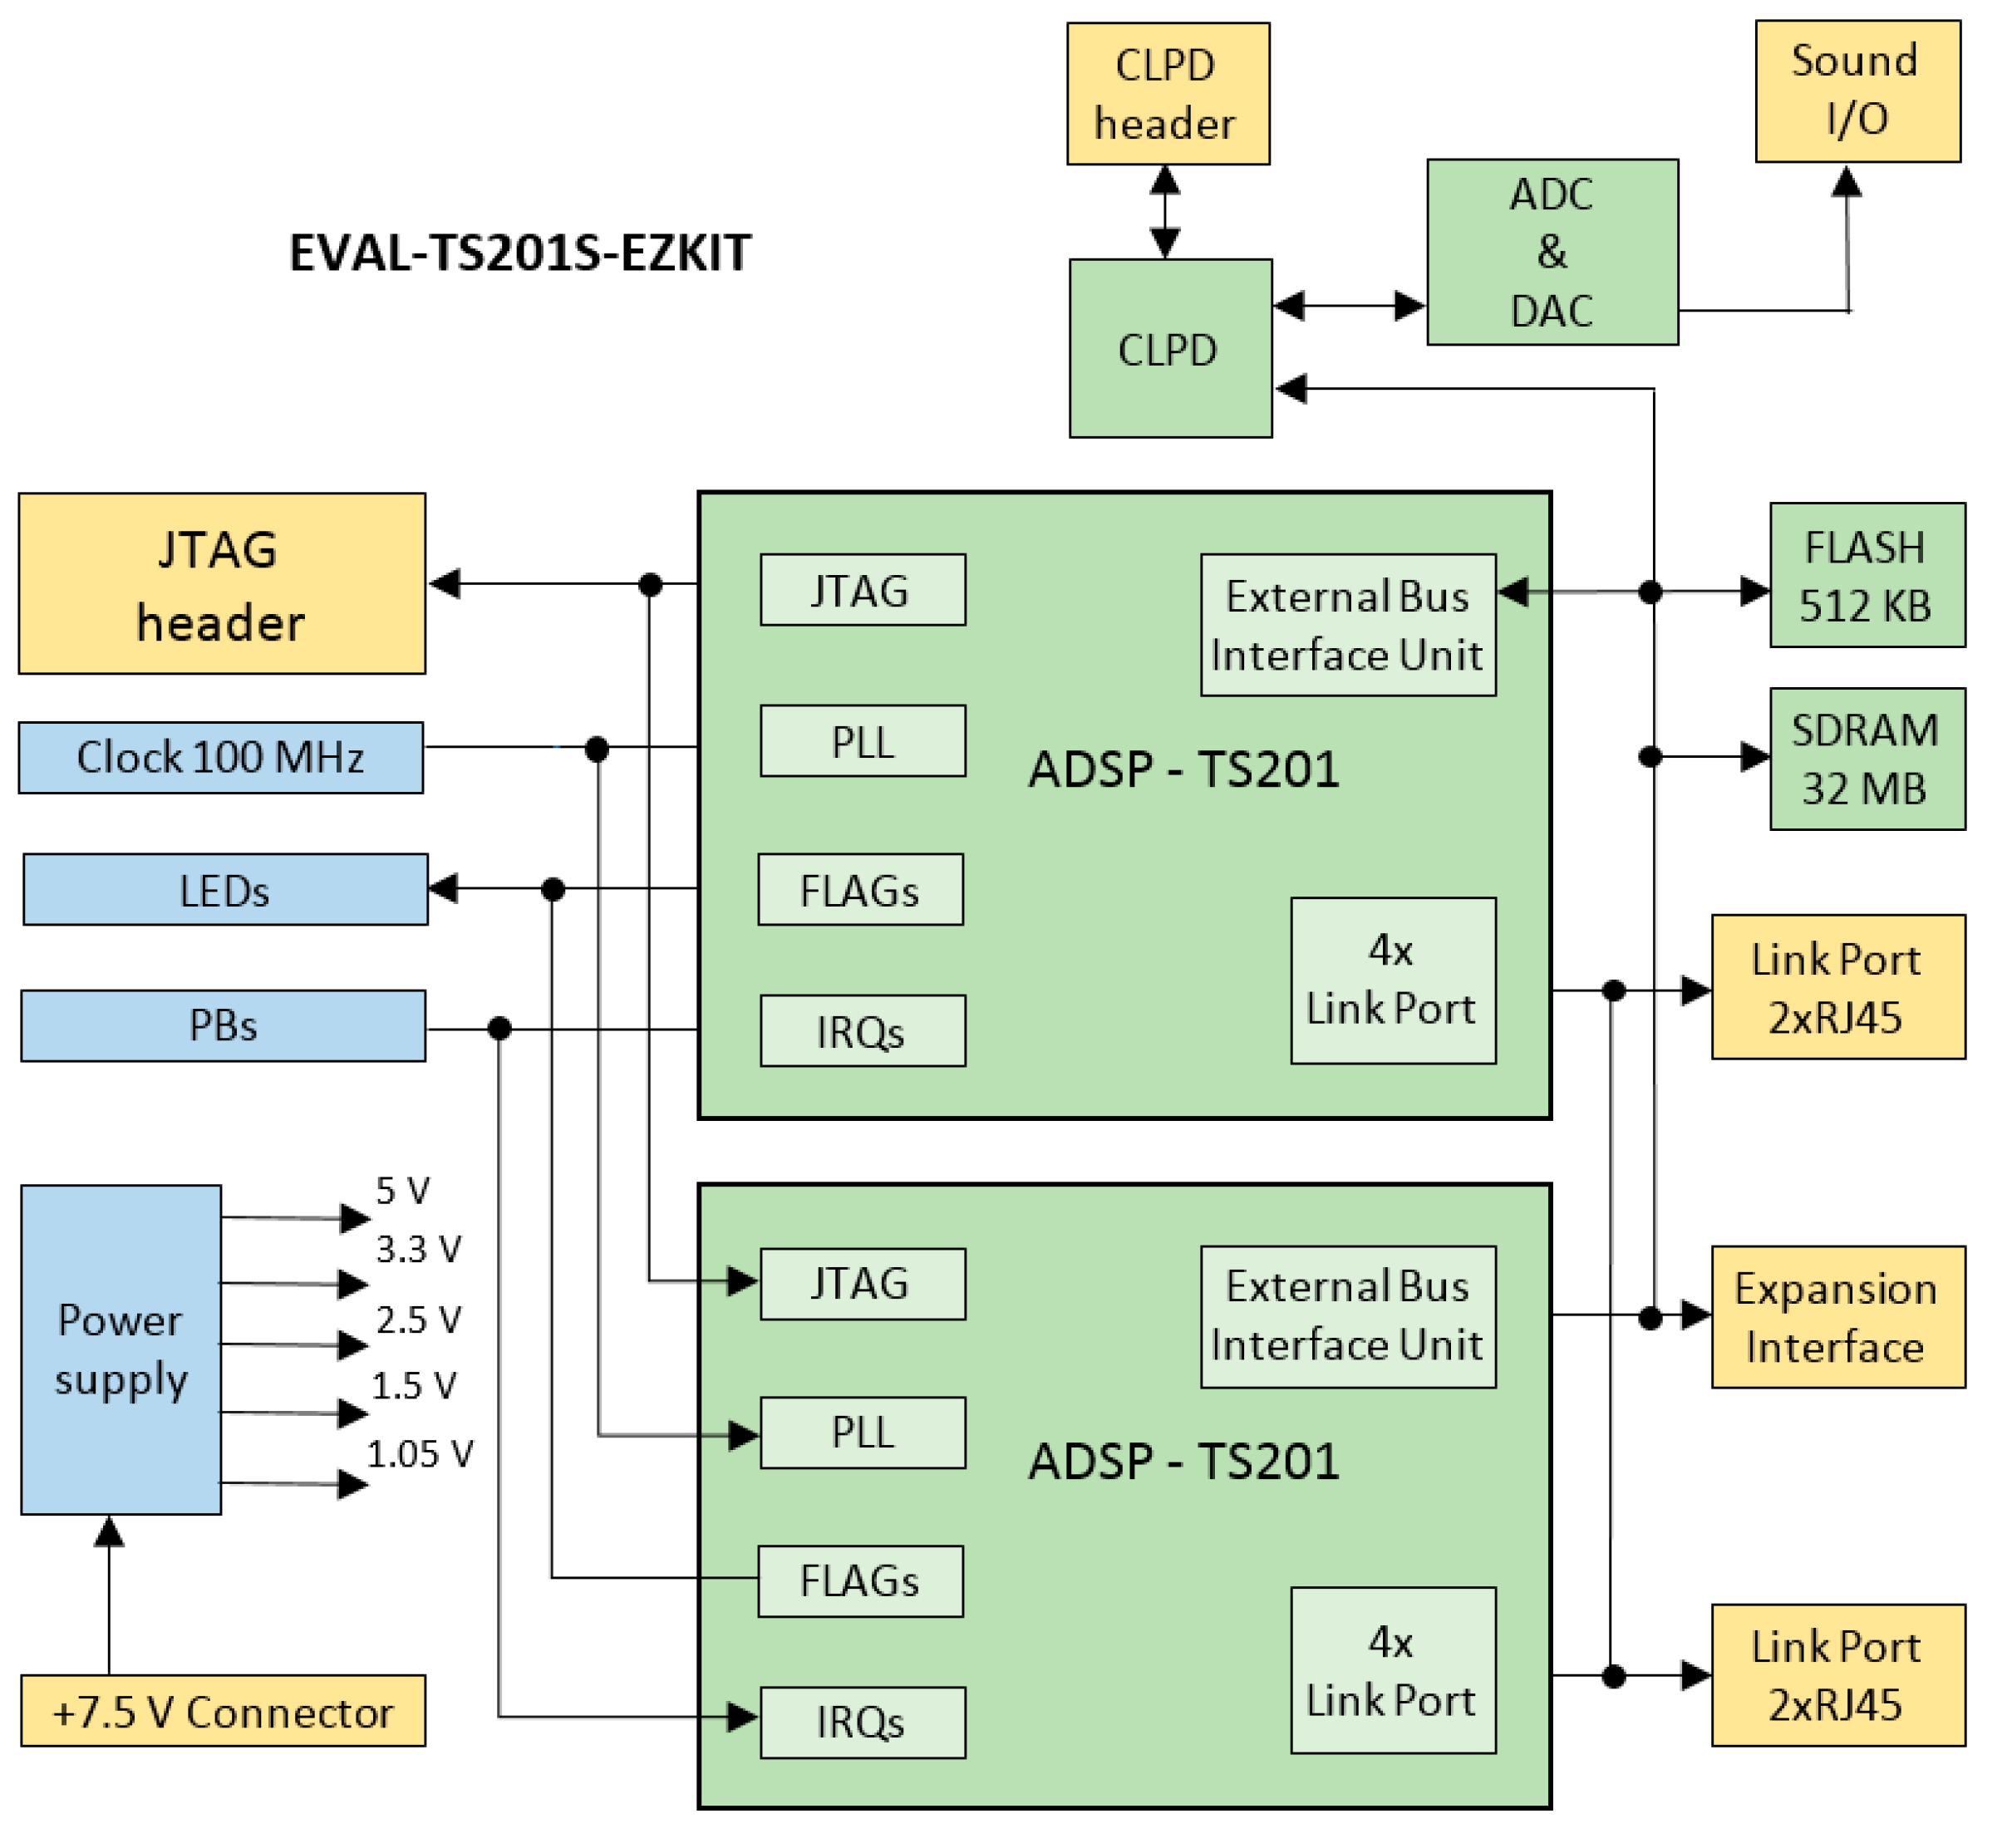
The experimental layout in Figure 11a figuratively shows the preliminary tests of the E/A instrument algorithms. The software designing, as well as the initial verification of the measurement algorithms implemented in software of the E/A, were carried out using the evaluation board EVAL-TS201S-EZKIT Analog Devices (Analog Devices, Norwood, MA, USA) (Figure 12) [39], equipped with two TigerSHARC processors, the same as the DSP used in the E/A instrument (Figure 2). Due to the different configurations of the peripheral circuits of the DSP processors on the evaluation board and in the E/A instrument, the verification only included the selected portions of the measurement functions. However, the verification of the algorithms for measuring the individual factors of energy quality has been fully carried out using the standard sets of digital data. These studies were important to start the instrument, in spite of a limited set of test data which cannot cover various measurement conditions. As a result, the software can be embedded in the DSP on the E/A instrument.
Figure 11b shows the calibration setup using the standard analog test signals. Just as in the previous layout, the set of testing signals is limited, but the calibration procedure refers to both parts of the channel: the DA and the DDP. As a standard signal source, the 3-phase generator Chroma type 6590 Programmable AC Power Source was used [40]. The same signal source was also used, among others, in the setup shown in Figure 11b,c. In the experimental setup in Figure 11b, the measurement results from the E/A are assessed in a PC-based estimation system, taking into account the features of the test signal from the Chroma generator.
Another way of verifying the measurement characteristics of the E/A was achieved using the registered raw samples of the signals. In the experimental setup shown in Figure 11c, for the stationary test signals, the digital representations of the raw samples of these signals were registered. For the same test signals, after changing the option of instrument operation (Figure 5), the particular coefficients are registered. In the estimation arrangement, supported by the PC computer with running software package (independently tested using pattern data), the registered raw samples are processed and then the calculated coefficients are compared with the coefficients obtained from the examined E/A instrument.
Table 2 contains the measurement results of the three-phase triangle signal (experimental setup as in Figure 11b), generated using a Chroma type 6590 Programmable AC Power Source (Chroma ATE Inc., Taipei Hsien, Taiwan) (declared values of Urms, U1 and THD for standard triangle signal DST017 from its waveforms library) [40], combined with the results obtained from the E/A instrument and as a result of the raw samples processing in the PC system (experimental setup as in Figure 11c).
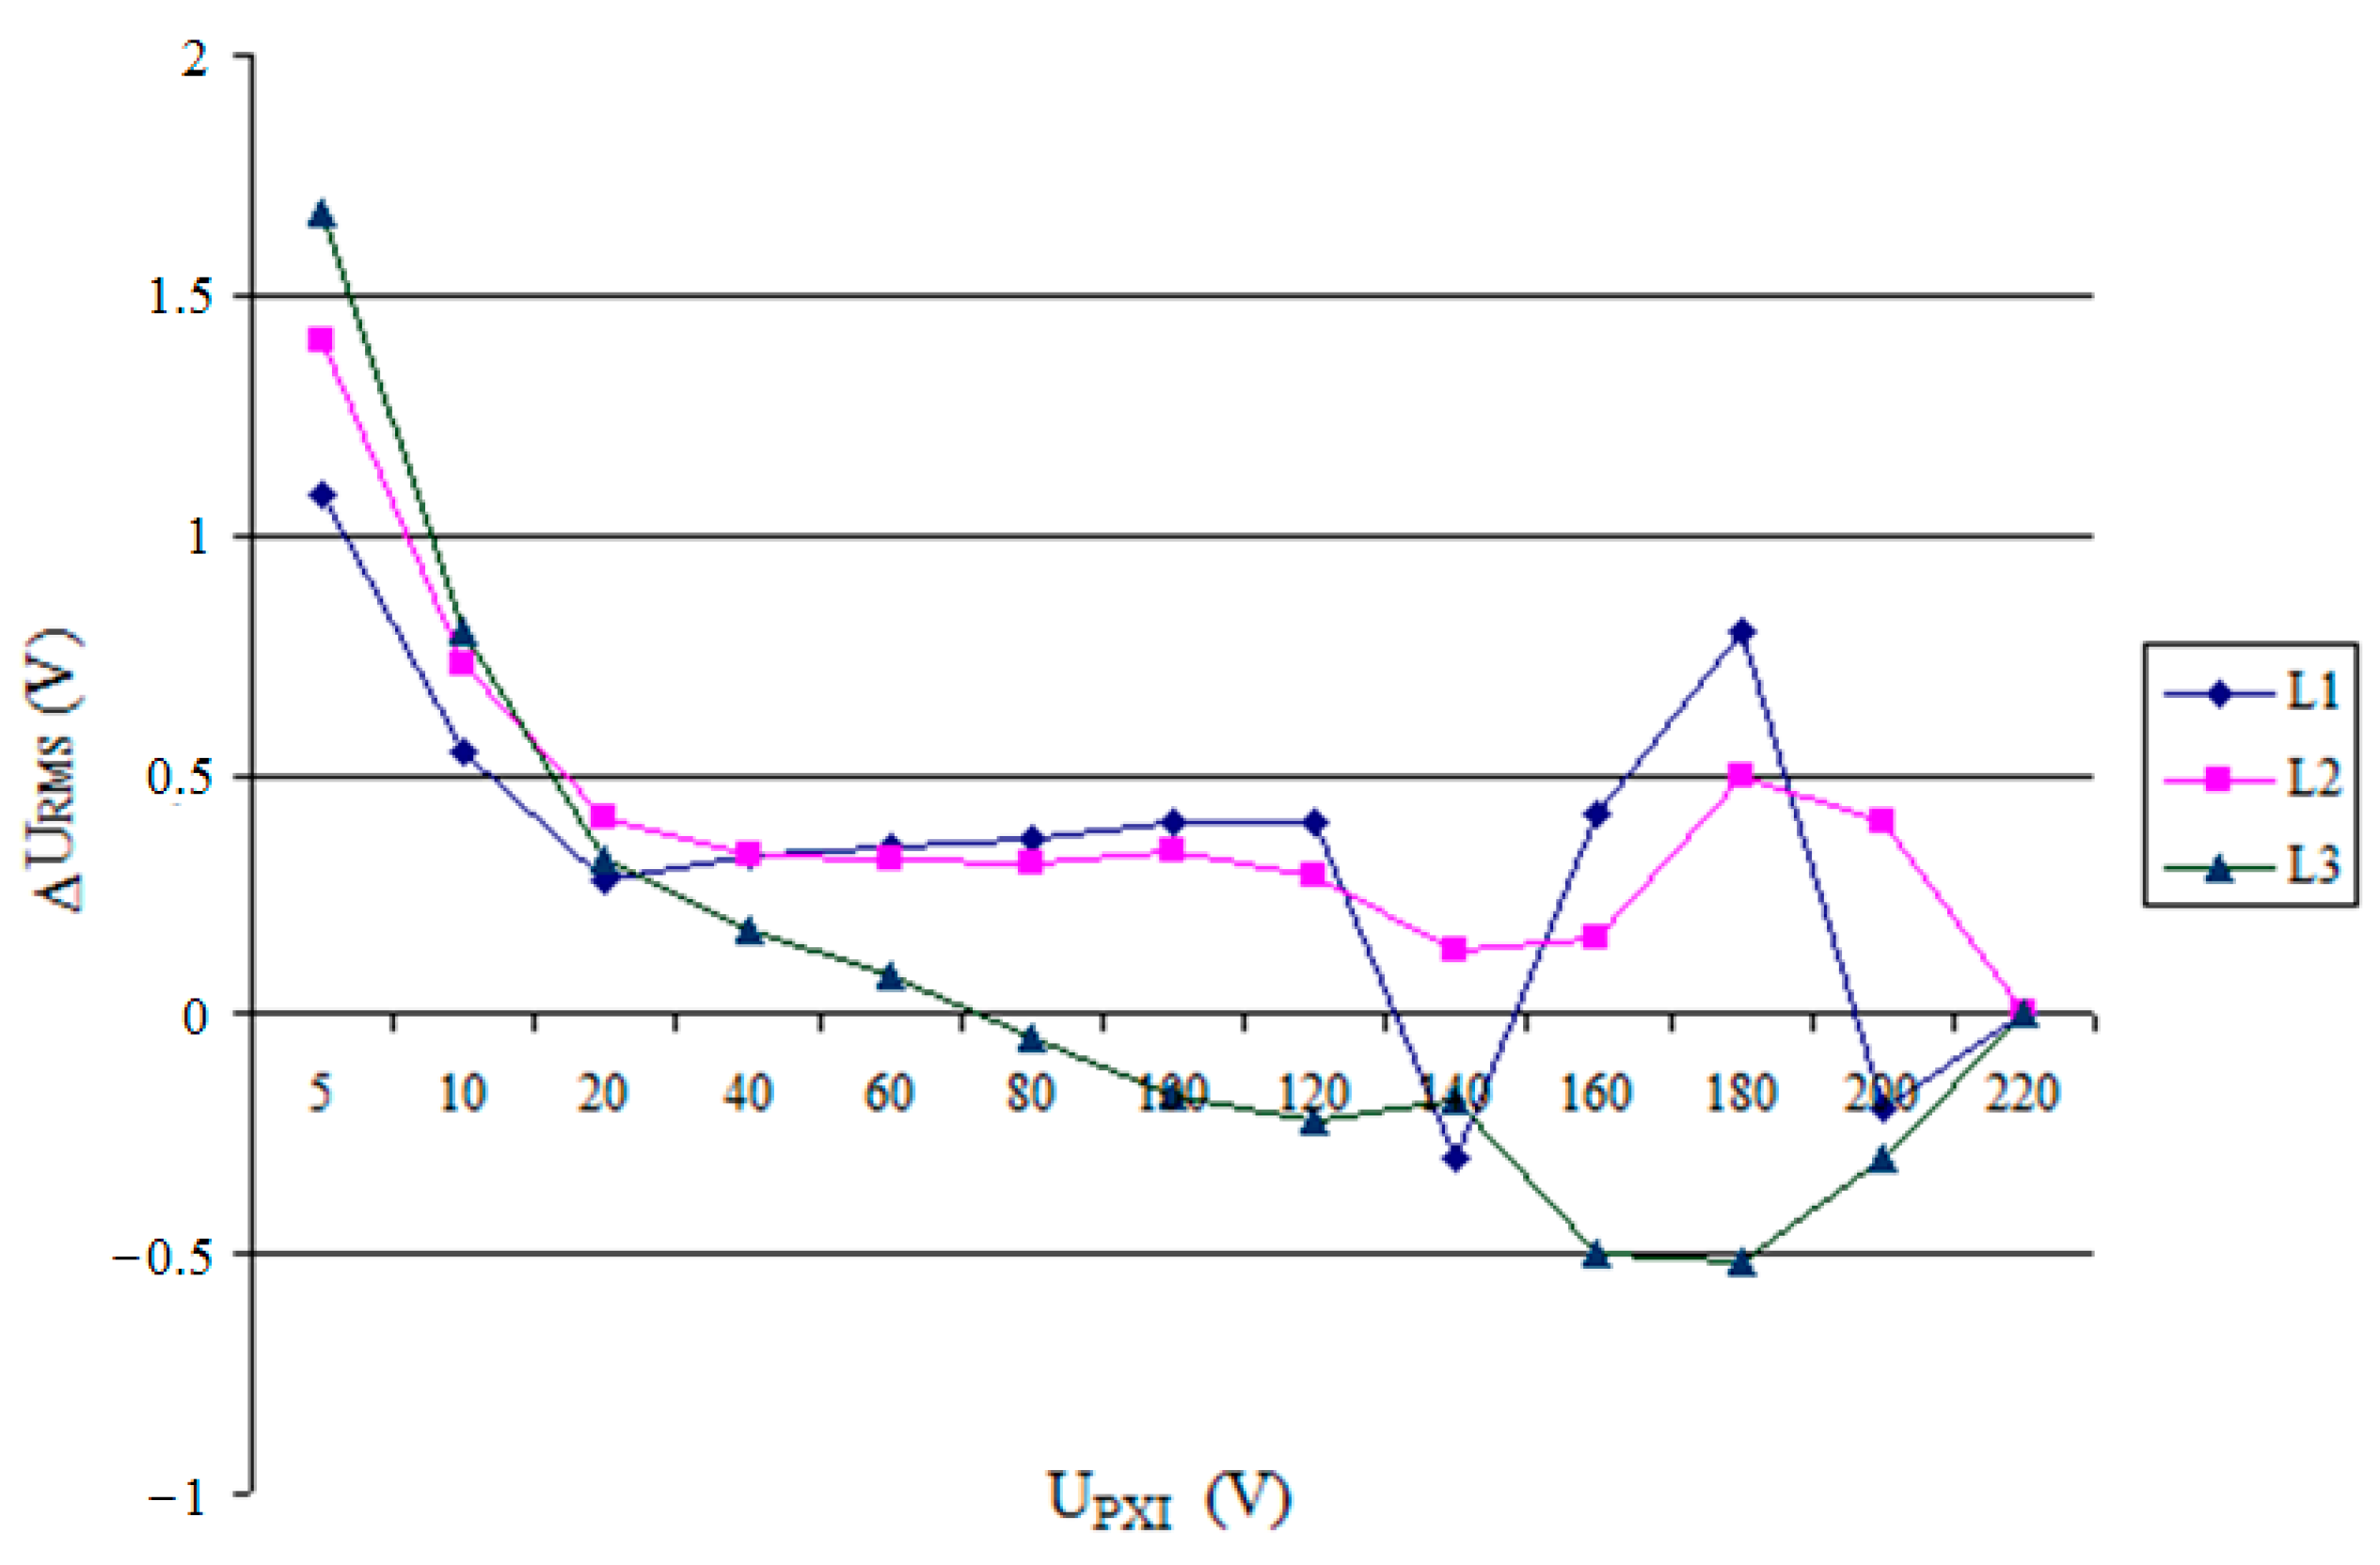
The experimental layout shown in Figure 11d (as well as in Figure 11c) is free from the signal limitations. The test signals were provided, at the same time, to the inputs of the examined E/A instrument and to the reference instrument. The reference instrument was based on the PCI eXtensions for Instrumentation (PXI) platform (National Instruments Corporation, Austin, TX, USA) equipped with suitable peripheries and the virtual instrument designed for measuring the power quality parameters (PCI stands for Peripheral Component Interconnect—personal computer bus). In Figure 13, the exemplary results of calibration of the phase voltage channels are presented. The differences between the rms values, measured by the tested instrument and also the PXI system, are shown.
Table 3 contains the absolute errors ∆ representing the deviations between the rms values of the phase voltages, measured by the E/A instrument and the PXI system, obtained during the calibration of the instrument for different frequencies of the network voltage, as well as the relative (percentage) errors δ, adopting the value indicated by the PXI device as the actual value of the voltage, respectively. The values and course of the errors indicate that their main source were the systematic effects resulting from the incorrect calibration of the processing characteristics of the measurement channels. The random influences cause the dispersion of errors ∆ as a function of frequency (for L2 and L3 channels) not exceeding ∆max = 0.2 V. Assuming the uniform distribution of errors, the standard uncertainty can be calculated using Formula (1):
In sum, all of the applied testing methods for the assessment of the measurement track characteristics are reliable for the specified instrument. The obtained results of the experimental verification are positive within an acceptable tolerance range. However, on the basis of the results, no conclusions about the degree of possible modification algorithms to improve the measurement accuracy can be drawn.
What is the reason for the phenomena described in [15,16]? Can these cases relate to the characteristics of the E/A instrument? Perhaps the problem is that the instrument under test and the testing arrangement operate on different data sets. Because the individual coefficients are calculated using the samples of signals from the electrical network, collected in time windows of approximately 200 ms, the sets of the source data can differ. For specific measurement conditions, the small inaccuracy of the measurement algorithms may result in a large difference of indication compared to other instruments. So, next to the quality of the calibration of the DA part of the instrument, the proper validation of the algorithms performed in the DDP part (the difficult task to do) is important for the quality of the measurement functions of the instrument.
4. The Concept of Validation of Measurement Algorithms
Validation is the technique used to compare the results to be validated with the results obtained through other numerical methods previously validated. In other words, one technique has been validated before it is used as a reference to validate the second method.
The idea of the reliable validation of measurement algorithms, applicable for the E/A instrument (and probably for other devices as well), relies on the assumption that the dataset used for the calculation of coefficients in the examined instrument is the same as the one used in the reference system.
This assumption is met if the measurement data, processed in the DSP for the designation of coefficients, are stored and further used in the reference system to calculate the corresponding coefficients (Figure 14).
Figure 4 shows the resources of the DSM STSL module applied in the E/A instrument (Figure 2). The module is additionally equipped with 128 MB of the synchronous dynamic random access memory (SDRAM). This memory was not used in the E/A operations, because of the sufficient capacity of the internal memory of the DSP (24 Mb) for the calculation of the adopted coefficients of the electrical power quality.
The proposed idea of measurement algorithms validation assumes the use of the SDRAM memory (in Figure 4 marked in red ellipse) for storing the selected samples from the ADC, but only those which were used by the DSP for the coefficients calculation, together with the designated coefficients. The capacity of the SDRAM enables one to accumulate the data from several processing cycles, corresponding to measurement windows of approximately 200 ms. For example, for the “estimator” operating option (Figure 5), for memorizing the data collected from the samples from three voltage channels, converted in the ADC at the rate of 210 kS/s, no more than 256 kB of memory is needed for one measurement window.
To perform the validation of embedded algorithms, the original source data, together with the DSP processing results, are sent to the external system. In this way, it is possible to assess the real characteristics of data processing, as well as those corresponding to the DA part as embedded in the DSP software, in the DDP part of the instrument. The implementation of the proposed method in the E/A instrument is not connected with any hardware modifications. Only software changes are needed to obtain the fixed goal.
The reference system stores the set of data received from the instrument and uses them for the independent off-line calculation of respective coefficients, resulting from the sequentially selected measurement functions of the E/A. The system is under development in the LabVIEW environment. The estimation part of the reference system compares the values of the coefficients designated in the E/A with the results obtained off-line in the PC estimation system. The simple criterion (2) is used for the validation of the examined algorithm implemented in the DSP:
where: —the value of coefficient calculated in the E/A, —the value of the coefficient obtained in the estimation operation in the reference system, —the admissible error specified for the given algorithm under test, and i—the coefficient identifier.
To measure the strength of the relation between the set of and coefficients, obtained in the E/A instrument and in the PC estimation system for many measurement windows, the Pearson coefficient [34] will be used.
The results, shown in [15,16], indicate that other methods of verification of the sophisticated algorithms, even using reliable examination systems, are not always sufficiently correct.
The imperfection of the measurement algorithms is often the result of the rounding used, simplifications, and approximations, and their optimization can help to improve the properties of the measuring instrument.
5. Conclusions
Nowadays, the exploitation of electrical appliances has a significant impact on our natural environment. The monitoring of electrical power quality is an important part of its protection.
The main problem presented in this paper deals with the calibration procedures of the measurement channel and the validation of the measurement algorithms. A case study-based consideration concerning the performed calibration procedures of the E/A is presented, along with the obtained exemplary results. Another approach for the verification of the measurement characteristics, especially applied to the software part of the instrument, is proposed. The concept of the validation of the measurement algorithms embedded in the software of the instrument for the designation of the coefficients of electrical power quality, as well as its application using the resources available onboard of the DSP module of the elaborated E/A instrument, are discussed.
The development of self-calibration procedures and their implementation to the A/D functions, in combination with the validation of the measurement algorithms, can improve the quality of the measurement results. The use of the proposed solutions in the considered instrument certainly cannot solve all of the problems concerning accuracy of the measurement results, but it allows an evaluation of the data processing algorithms implemented in the built-in DSP software and the identification of errors affecting the deteriorations of the instrument’s accuracy.
This research is ongoing and the results will be presented in future papers.
Acknowledgments
The cost of publishing in open access is covered by the author’s employer (Gdynia Maritime University).
Conflicts of Interest
The author declares no conflict of interest.
References
- Arrillaga, J.; Bradley, D.A.; Bodger, P.S. Power System Harmonics; John Wiley & Sons: New York, NY, USA, 1985; p. 664. [Google Scholar]
- Caciotta, M.; Leccese, F.; Trifirò, T. From power quality to perceived power quality. In Proceedings of the IASTED International Conference on Energy and Power Systems EPS 2006, Chiang Mai, Thailand, 29–31 March 2006; Volume 526–119, pp. 94–102. [Google Scholar]
- Caciotta, M.; Leccese, F.; Trifirò, T. Curve-fitting-algorithm (CFA) as power quality basic algorithm. In Proceedings of the XVIII International Measurement Confederation (IMEKO) World Congress, Metrology for a Sustainable Development, Rio de Janeiro, Brazil, 17–22 September 2006. [Google Scholar]
- Fuchs, E.F.; Masoum, M.A.S. Power Quality in Power Systems and Electrical Machines, 1st ed.; Academic Press: Cambridge, MA, USA, 2008; p. 638. [Google Scholar]
- Arrillaga, J.; Watson, N.R.; Chen, S. Power System Quality Assessment; John Wiley & Sons: New York, NY, USA, 2000; p. 300. [Google Scholar]
- Caciotta, M.; Grossoni, M.; Leccese, F. Power quality measurements in telecommunication exchanges. In Proceedings of the International Telecommunications Energy Conference, INTELEC 2008, San Diego, CA, USA, 14–18 September 2008. [Google Scholar]
- International Electrotechnical Commission (IEC). IEC 61000-4-30:2015. Electromagnetic Compatibility (EMC)—Part 4-30: Testing and Measurement Techniques—Power Quality Measurement Methods; IEC: Genova, Switzerland, 2015. [Google Scholar]
- EN 50160, Voltage Characteristics of Electricity Supplied by Public Distribution Systems. Available online: http://www2.schneider-electric.com/library/SCHNEIDER_ELECTRIC/SE_LOCAL/APS/204836_1312/DraftStandard0026rev2-DraftEN501602005-05.pdf (accessed on 10 March 2017).
- IEEE 1159-2009—IEEE Recommended Practice for Monitoring Electric Power Quality; IEEE Standards Association: Piscataway, NJ, USA, 2009.
- Leccese, F. A first analysis of perceived power quality for domestic customers. In Proceedings of the 12th IMEKO TC1 & TC7 Joint Symposium on Man Science & Measurement, Annecy, France, 3–5 September 2008; pp. 246–253. [Google Scholar]
- Fuller, J.F.; Fuchs, E.F.; Roesler, D.J. Influence of harmonics on power system distribution protection. IEEE Trans. Power Deliv. 1988, 3, 546–557. [Google Scholar] [CrossRef]
- Dugan, R.C.; McDermott, T.E. Operating conflicts for distributed generation on distribution systems. In Proceedings of the IEEE Industry Applications Society (IAS) 2001 Rural Electric Power Conference Record, Little Rock, AR, USA, 29 April–1 May 2001. [Google Scholar]
- Mindykowski, J. Assessment of Electric Power Quality in Ship Systems Fitted with Converter Subsystems; Press of Shipbuilding and Shipping Ltd.: Gdańsk, Poland, 2003; p. 276. [Google Scholar]
- Leccese, F. Study and characterization of a new protection system against surges and over voltages for domestic telecommunication networks. In Proceedings of the International Telecommunications Energy Conference INTELEC 2007, Rome, Italy, 30 September–4 October 2007; pp. 363–368. [Google Scholar]
- Bień, A.; Firlit, A.; Folga, P.; Gallus, E.; Hanzelka, Z.; Hartman, M.; Hashad, M.; Iwaszkiewicz, J.; Jarocha, R.; Mieński, R.; et al. Voltage fluctuation measurement—Experiment in the industrial environment. Electr. Power Qual. Util. EPQU 2001, 7, 9–18. [Google Scholar]
- Szlosek, M.; Piekarz, M.; Hanzelka, Z.; Bien, A.; Piatek, M.; Loziak, W.; Pietrucha, R.; Hashad, M.; Wolski, L.; Olczykowski, Z.; et al. Comparative tests of flickermeters. In Proceedings of the 17th International Conference on Electricity Distribution, Barcelona, Spain, 12–15 May 2003. [Google Scholar]
- IEC. IEC 61000-4-15:2010. Electromagnetic Compatibility (EMC)—Part 4-15: Testing and Measurement Techniques—Flickermeter—Functional and Design Specifications; IEC: Genova, Switzerland, 2010. [Google Scholar]
- Hashad, M.; Hanzelka, Z.; Hartman, M.; Bien, A. The hypothesis for the wrong measurements results obtained during the flickermeter comparative test. In Proceedings of the 6th International Conference Electrical Power Quality and Utilisation, Cracow, Poland, 19–21 September 2001. [Google Scholar]
- Hoon, Y.; Radzi, M.A.M.; Hassan, M.K.; Mailah, N.F. DC-link capacitor voltage regulation for three-phase three-level inverter-based shunt active power filter with inverted error deviation control. Energies 2016, 9, 533. [Google Scholar] [CrossRef]
- Ok, Y.; Lee, J.; Choi, J. Analysis and solution for operations of overcurrent relay in wind power system. Energies 2016, 9, 458. [Google Scholar] [CrossRef]
- Leferink, F.; Keyer, C.; Melentjev, A. Static energy meter errors caused by conducted electromagnetic interference. IEEE Electromagn. Compat. Mag. 2016, 5, 49–55. [Google Scholar] [CrossRef]
- Caciotta, M.; Giarnetti, S.; Leccese, F.; Pedruzzi, E. Curve fitting algorithm FPGA implementation. In Proceedings of the 10th International Conference on Environment and Electrical Engineering—EEEIC2011, Rome, Italy, 8–11 May 2011. [Google Scholar]
- Caciotta, M.; Giarnetti, S.; Leccese, F.; Trinca, D. Development of an USB Data acquisition system for power quality and smart metering applications. In Proceedings of the 11th International Conference on Environment and Electrical Engineering—EEEIC2012, Venice, Italy, 18–25 May 2012. [Google Scholar]
- Di Pasquale, S.; Giarnetti, S.; Leccese, F.; Trinca, D.; Caciotta, M. A new platform for high accuracy power quality measurements: The forensic point of view. In Proceedings of the 20th International Measurement Confederation (IMEKO) Technical Committee 4 (TC4) International Symposium and 18th International Workshop on ADC Modelling and Testing, Benevento, Italy, 15–17 September 2014; pp. 404–409. [Google Scholar]
- Di Pasquale, S.; Giarnetti, S.; Leccese, F.; Trinca, D.; Cagnetti, M.; Caciotta, M. A Distributed Web-Based System for Temporal and Spatial Power Quality Analysis. In Power Quality Issues in Distributed Generation; In Tech: Rijeka, Croatia, 2015. [Google Scholar] [CrossRef]
- Giarnetti, S.; Leccese, F.; Caciotta, M. Non recursive multiharmonic least-square fitting for frequency estimation for grid frequency estimation. Measurement 2015, 66, 229–237. [Google Scholar] [CrossRef]
- Giarnetti, S.; Leccese, F.; Caciotta, M. Non recursive Nonlinear Least Squares for periodic signal fitting. Measurement 2017, 103, 208–216. [Google Scholar] [CrossRef]
- Masnicki, R. The fluency of data flow in the instrument for measurement and registration of parameters of the electrical power network. In Proceedings of the 15 IEEE International Conference on Environment and Electrical Engineering, Rome, Italy, 10–13 June 2015; pp. 2040–2044. [Google Scholar]
- Masnicki, R.; Mindykowski, J. Coordination of operations in registration channel of data from electrical power system. Measurement 2017, 99, 68–77. [Google Scholar] [CrossRef]
- Mindykowski, J.; Tarasiuk, T.; Masnicki, R.; Szweda, M.; Gorniak, M. Universal estimator/analyzer of electrical power quality—Part II—Design and technical implementation. In Scientific Papers of the Gdynia Maritime University; Publishing House of Gdynia Maritime University: Gdynia, Poland, 2010; pp. 21–36. (In Polish) [Google Scholar]
- Masnicki, R. Validation of the measurement algorithms in instrument for power quality estimation. In Proceedings of the 16 IEEE International Conference on Environment and Electrical Engineering, Florence, Italy, 6–8 June 2016; pp. 2519–2523. [Google Scholar]
- Masnicki, R.; Mindykowski, J. Examination of the instrument for power quality estimation—Case study. In Proceedings of the 21st IMEKO TC4 International Symposium and 19th International Workshop on ADC Modelling and Testing “Understanding the World through Electrical and Electronic Measurement”, Budapest, Hungary, 7–9 September 2016; pp. 240–244. [Google Scholar]
- Masnicki, R. Verification of algorithms in measuring instrument to assess the quality of electrical energy. In Scientific Papers of the Faculty of Electrical and Control Engineering of Gdansk University of Technology; Politechnika Gdańska: Gdansk, Poland, 2016; Volume 49, pp. 63–67. (In Polish) [Google Scholar]
- Jauregui, R.; Silva, F. Numerical Validation Methods. In Numerical Analysis—Theory and Application; In Tech: Rijeka, Croatia, 2011; Available online: http://www.intechopen.com/books/numerical-analysis-theory-and-application/numerical-validation-methods (accessed on 30 March 2017).
- Kaztek Systems. Available online: http://www.kaztek.com/ (accessed on 7 April 2017).
- Tarasiuk, T. Estimator-analyser of power quality: Part I—Methods and algorithms. Measurement 2011, 44, 238–247. [Google Scholar] [CrossRef]
- Tarasiuk, T. Estimator-analyser of power quality: Part II—Hardware and research results. Measurement 2011, 44, 248–258. [Google Scholar] [CrossRef]
- Masnicki, R. The improvement of measurement accuracy in microprocessor instruments. In Proceedings of the 4th International Workshop, Compatibility in Power Electronics, CPE 2005, Gdynia, Poland, 1–3 June 2005. [Google Scholar]
- Analog Devices. ADSP-TS201S EZ-KIT Lite, Evaluation System Manual. Available online: http://www.analog.com/media/en/dsp-documentation/ evaluation-kit-manuals/ (accessed on 7 April 2017).
- Chroma ATE Inc. Chroma Programmable AC Power Source 6560/6590. In User’s Manual; Available online: http://www.chromaate.com/product/6500_series_Programmable_AC_Source.htm (accessed on 7 April 2017).
Figure 1.
Schematic diagram of the measurement site in the electric steelworks power supply system [16].
Figure 1.
Schematic diagram of the measurement site in the electric steelworks power supply system [16].
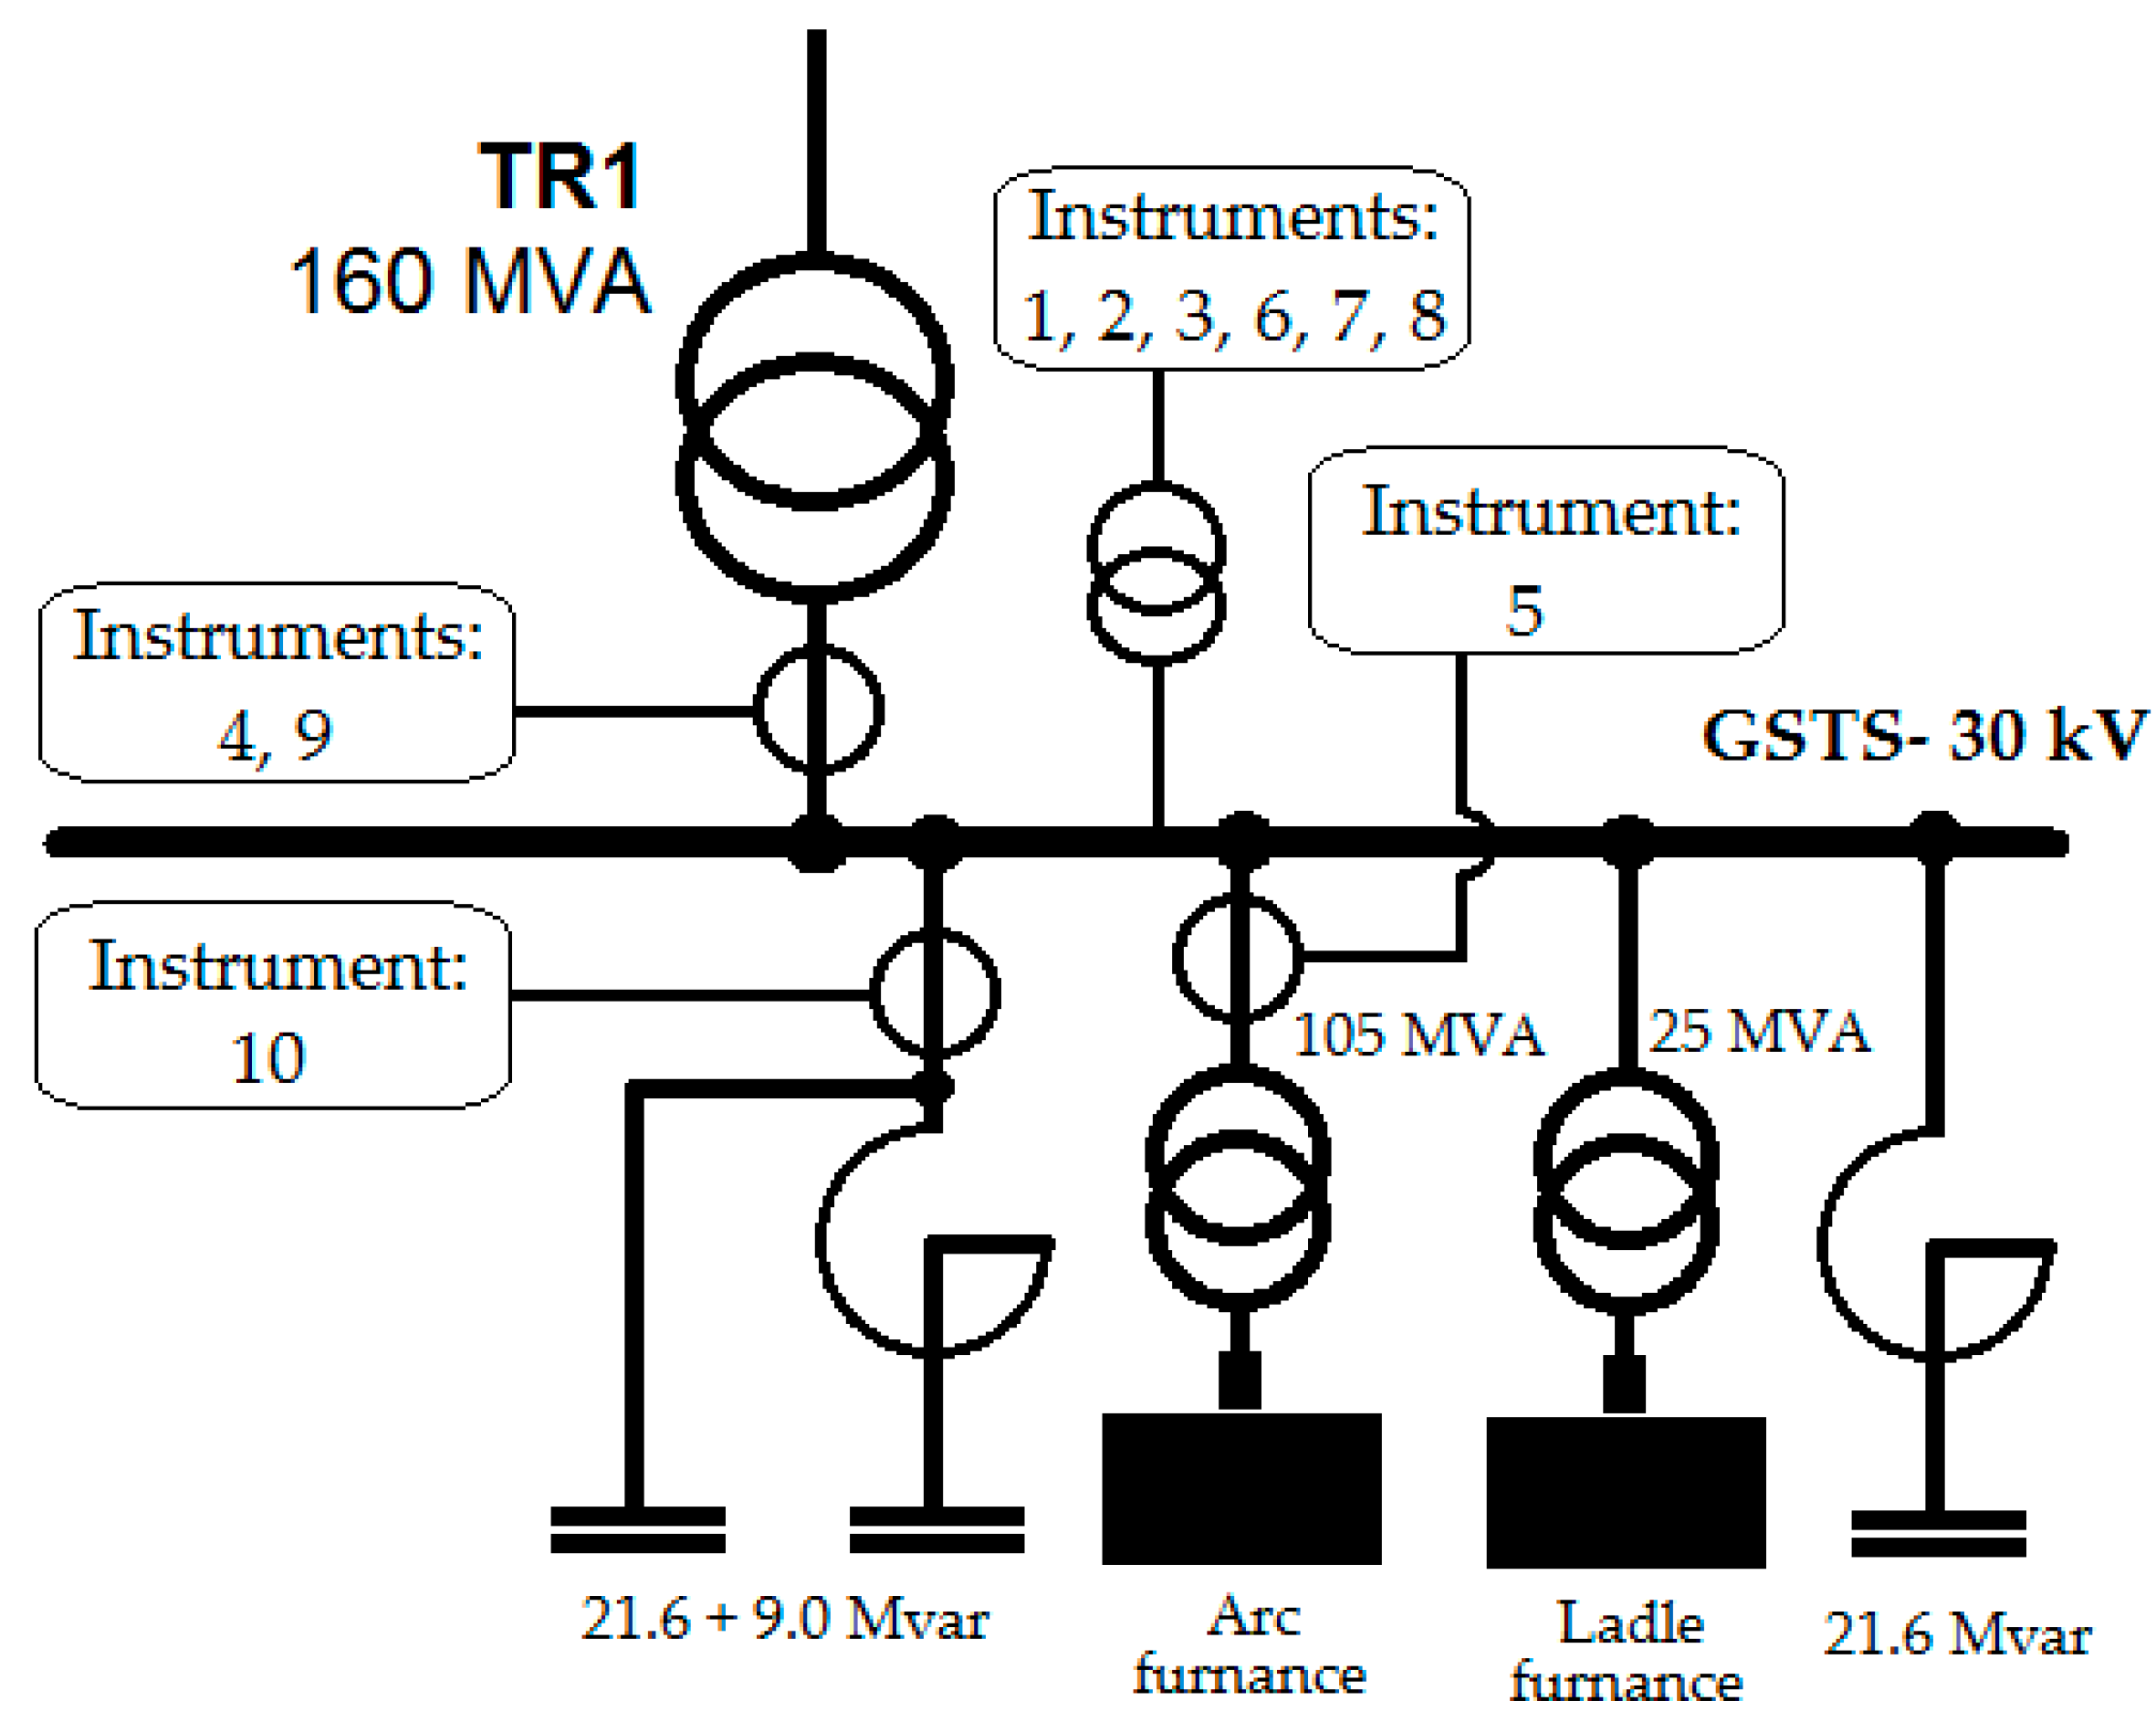
Figure 2.
The hardware structure of instrument [30]. ADC: analog-to-digital converter; DSM STSL: DSP subsystem module; FPGA: field-programmable gate array; DSP: digital signal processor; RAM: random access memory; GPP: general purpose processor; USB: universal serial bus; LCD: liquid crystal display.
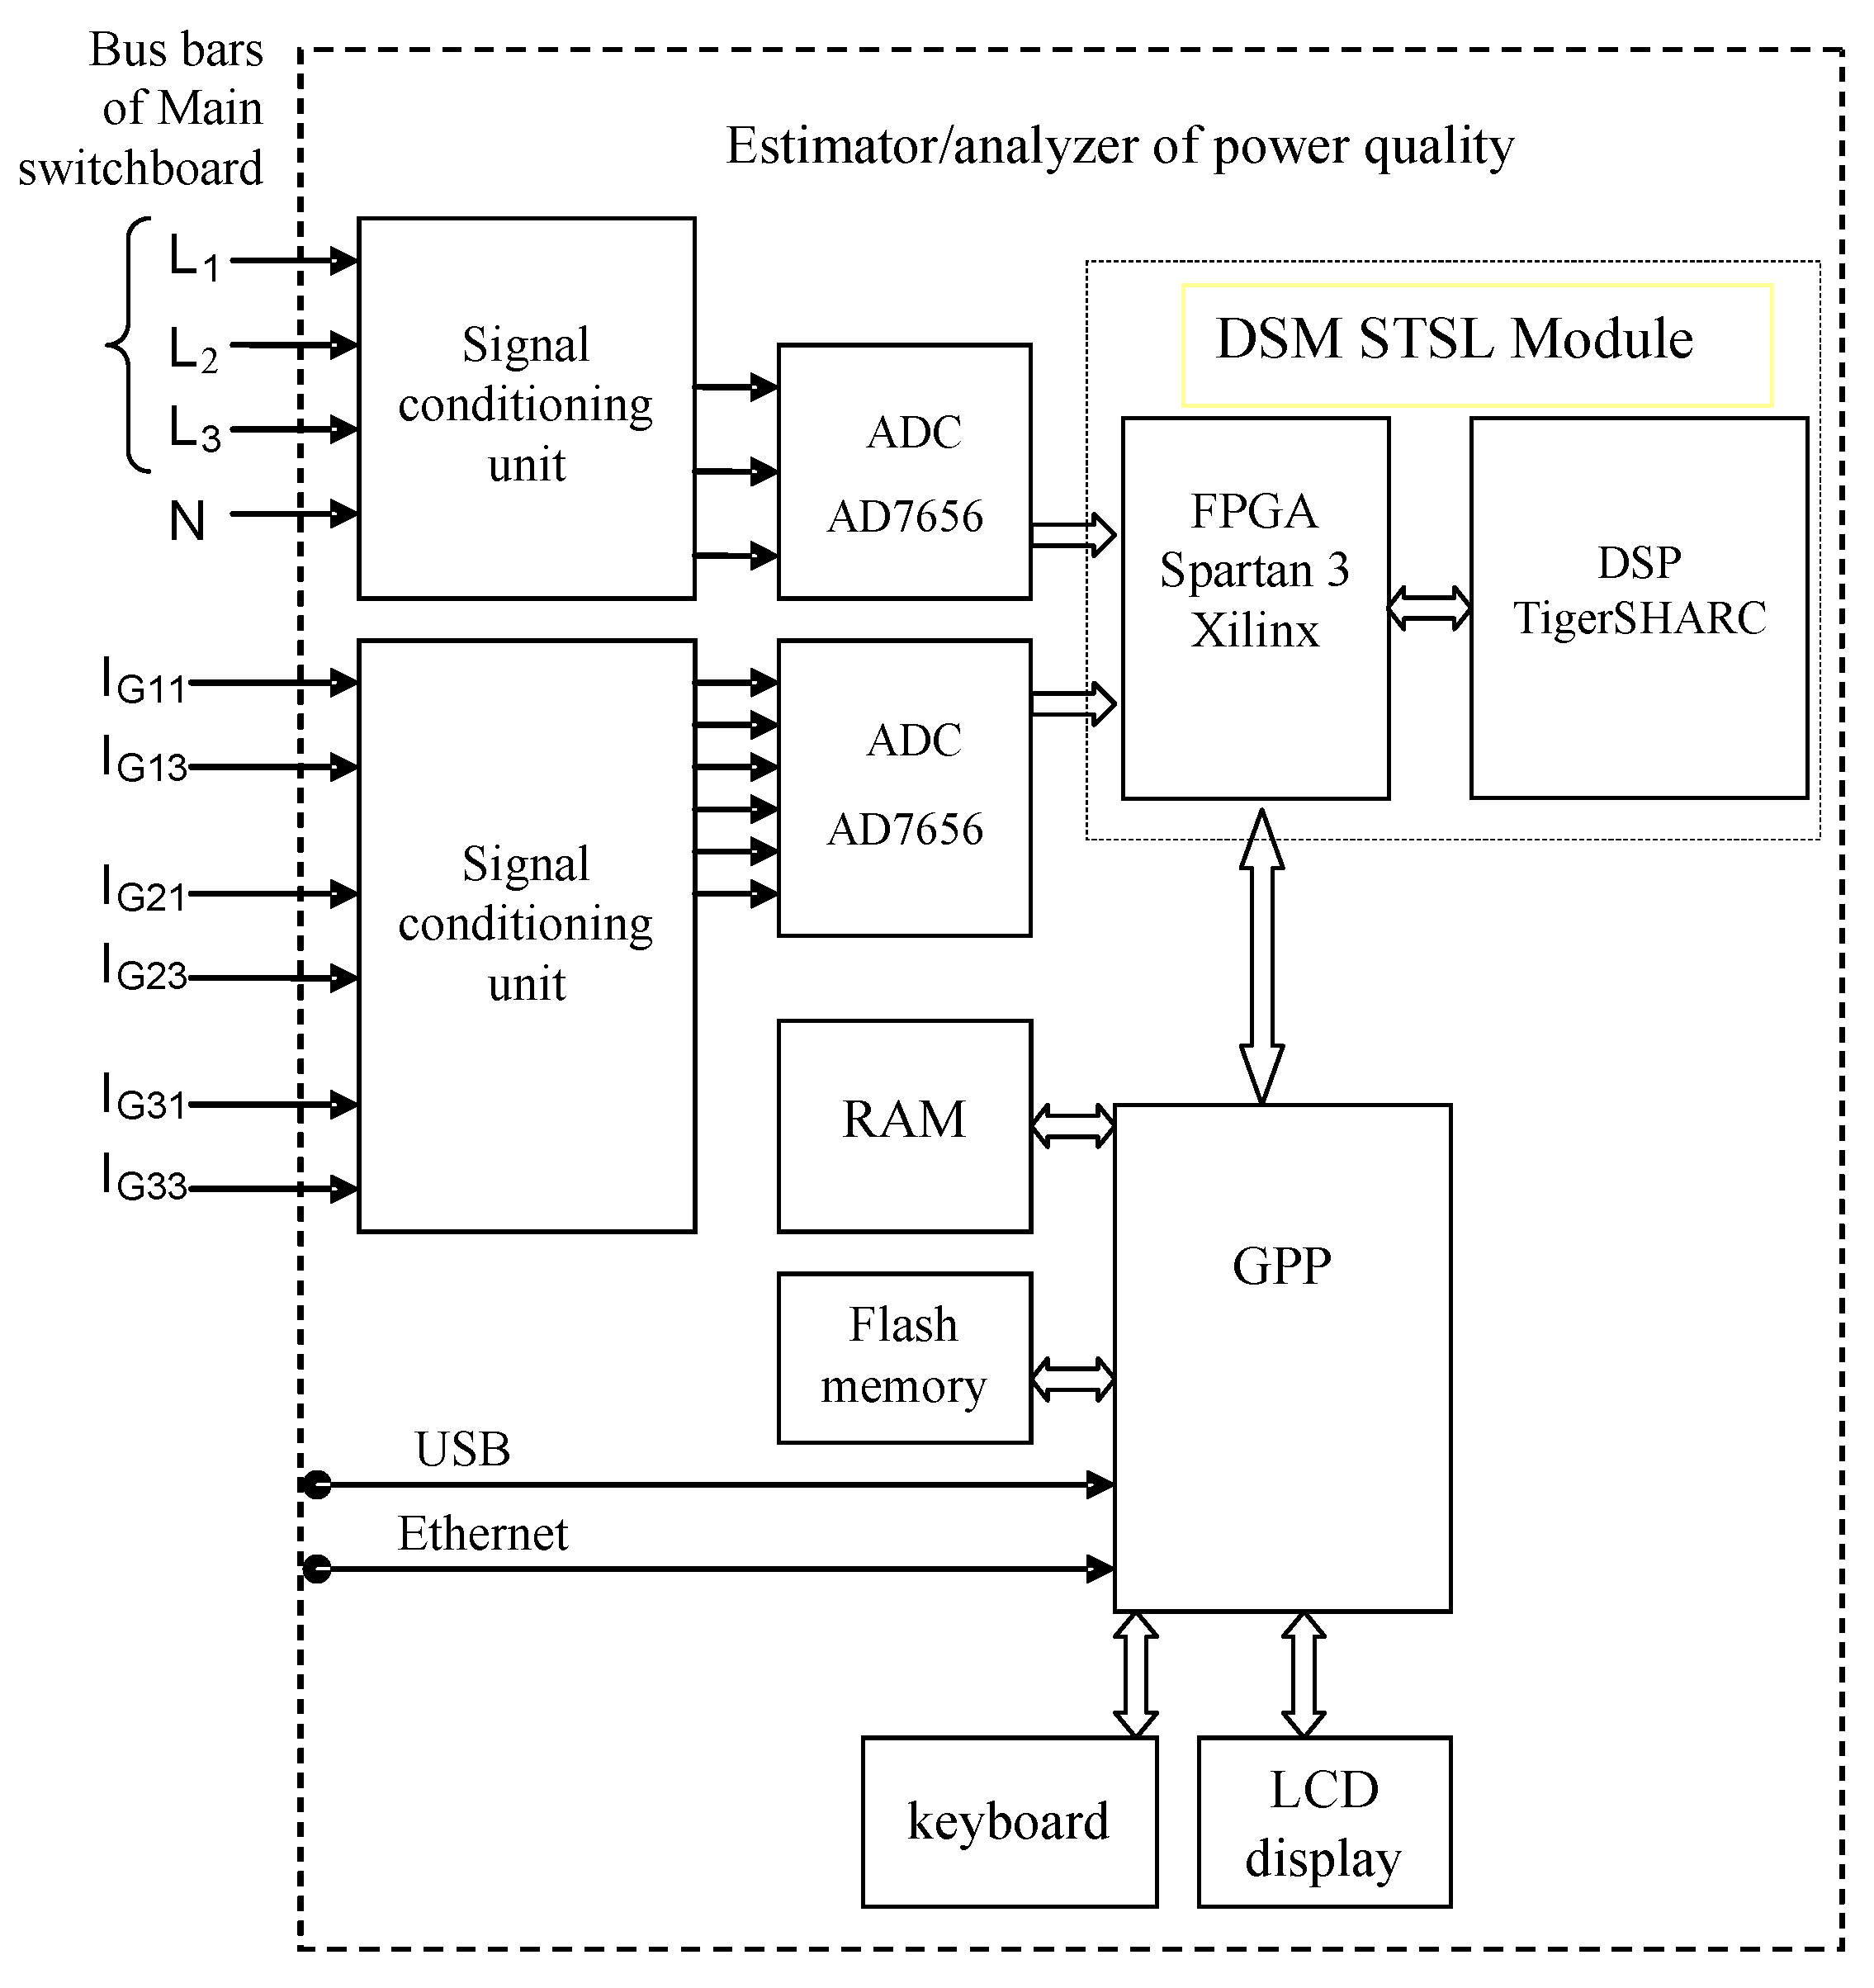
Figure 3.
The configuration of the signal conditioning units applied in the voltage channels.

Figure 4.
The block diagram of the DSM STSL module [35].
Figure 4.
The block diagram of the DSM STSL module [35].

Figure 5.
Main operations performed in the instrument.

Figure 6.
The diagram of operations performed in the measurement algorithms [30].
Figure 6.
The diagram of operations performed in the measurement algorithms [30].

Figure 7.
The simplified block diagram of the digital measurement track.
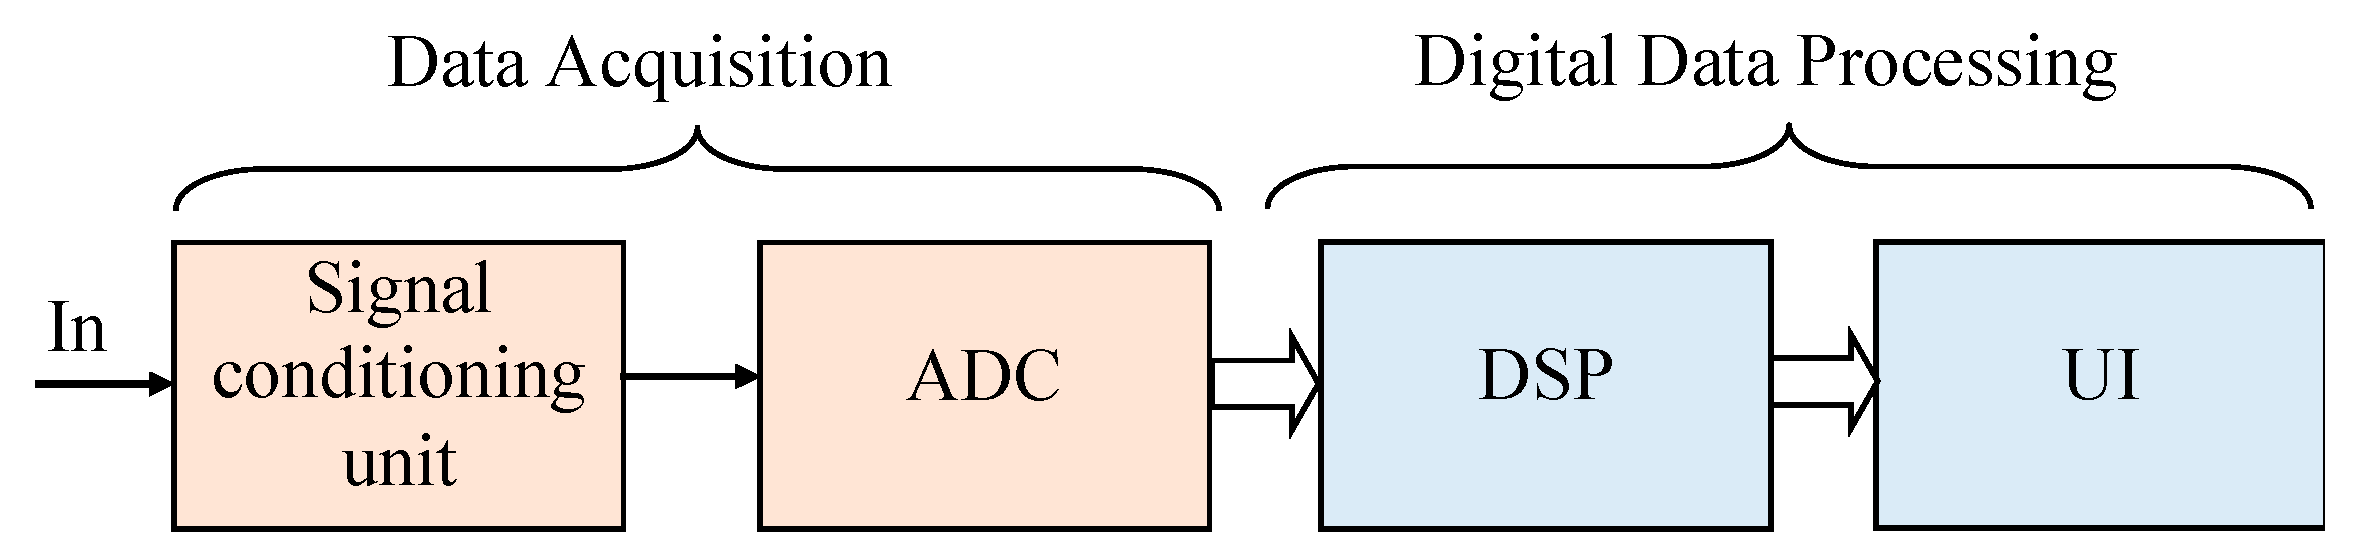
Figure 8.
The exemplary calibration report of current probe No. 1.

Figure 9.
The deviation between the trend line and the current probe characteristics No. 1.
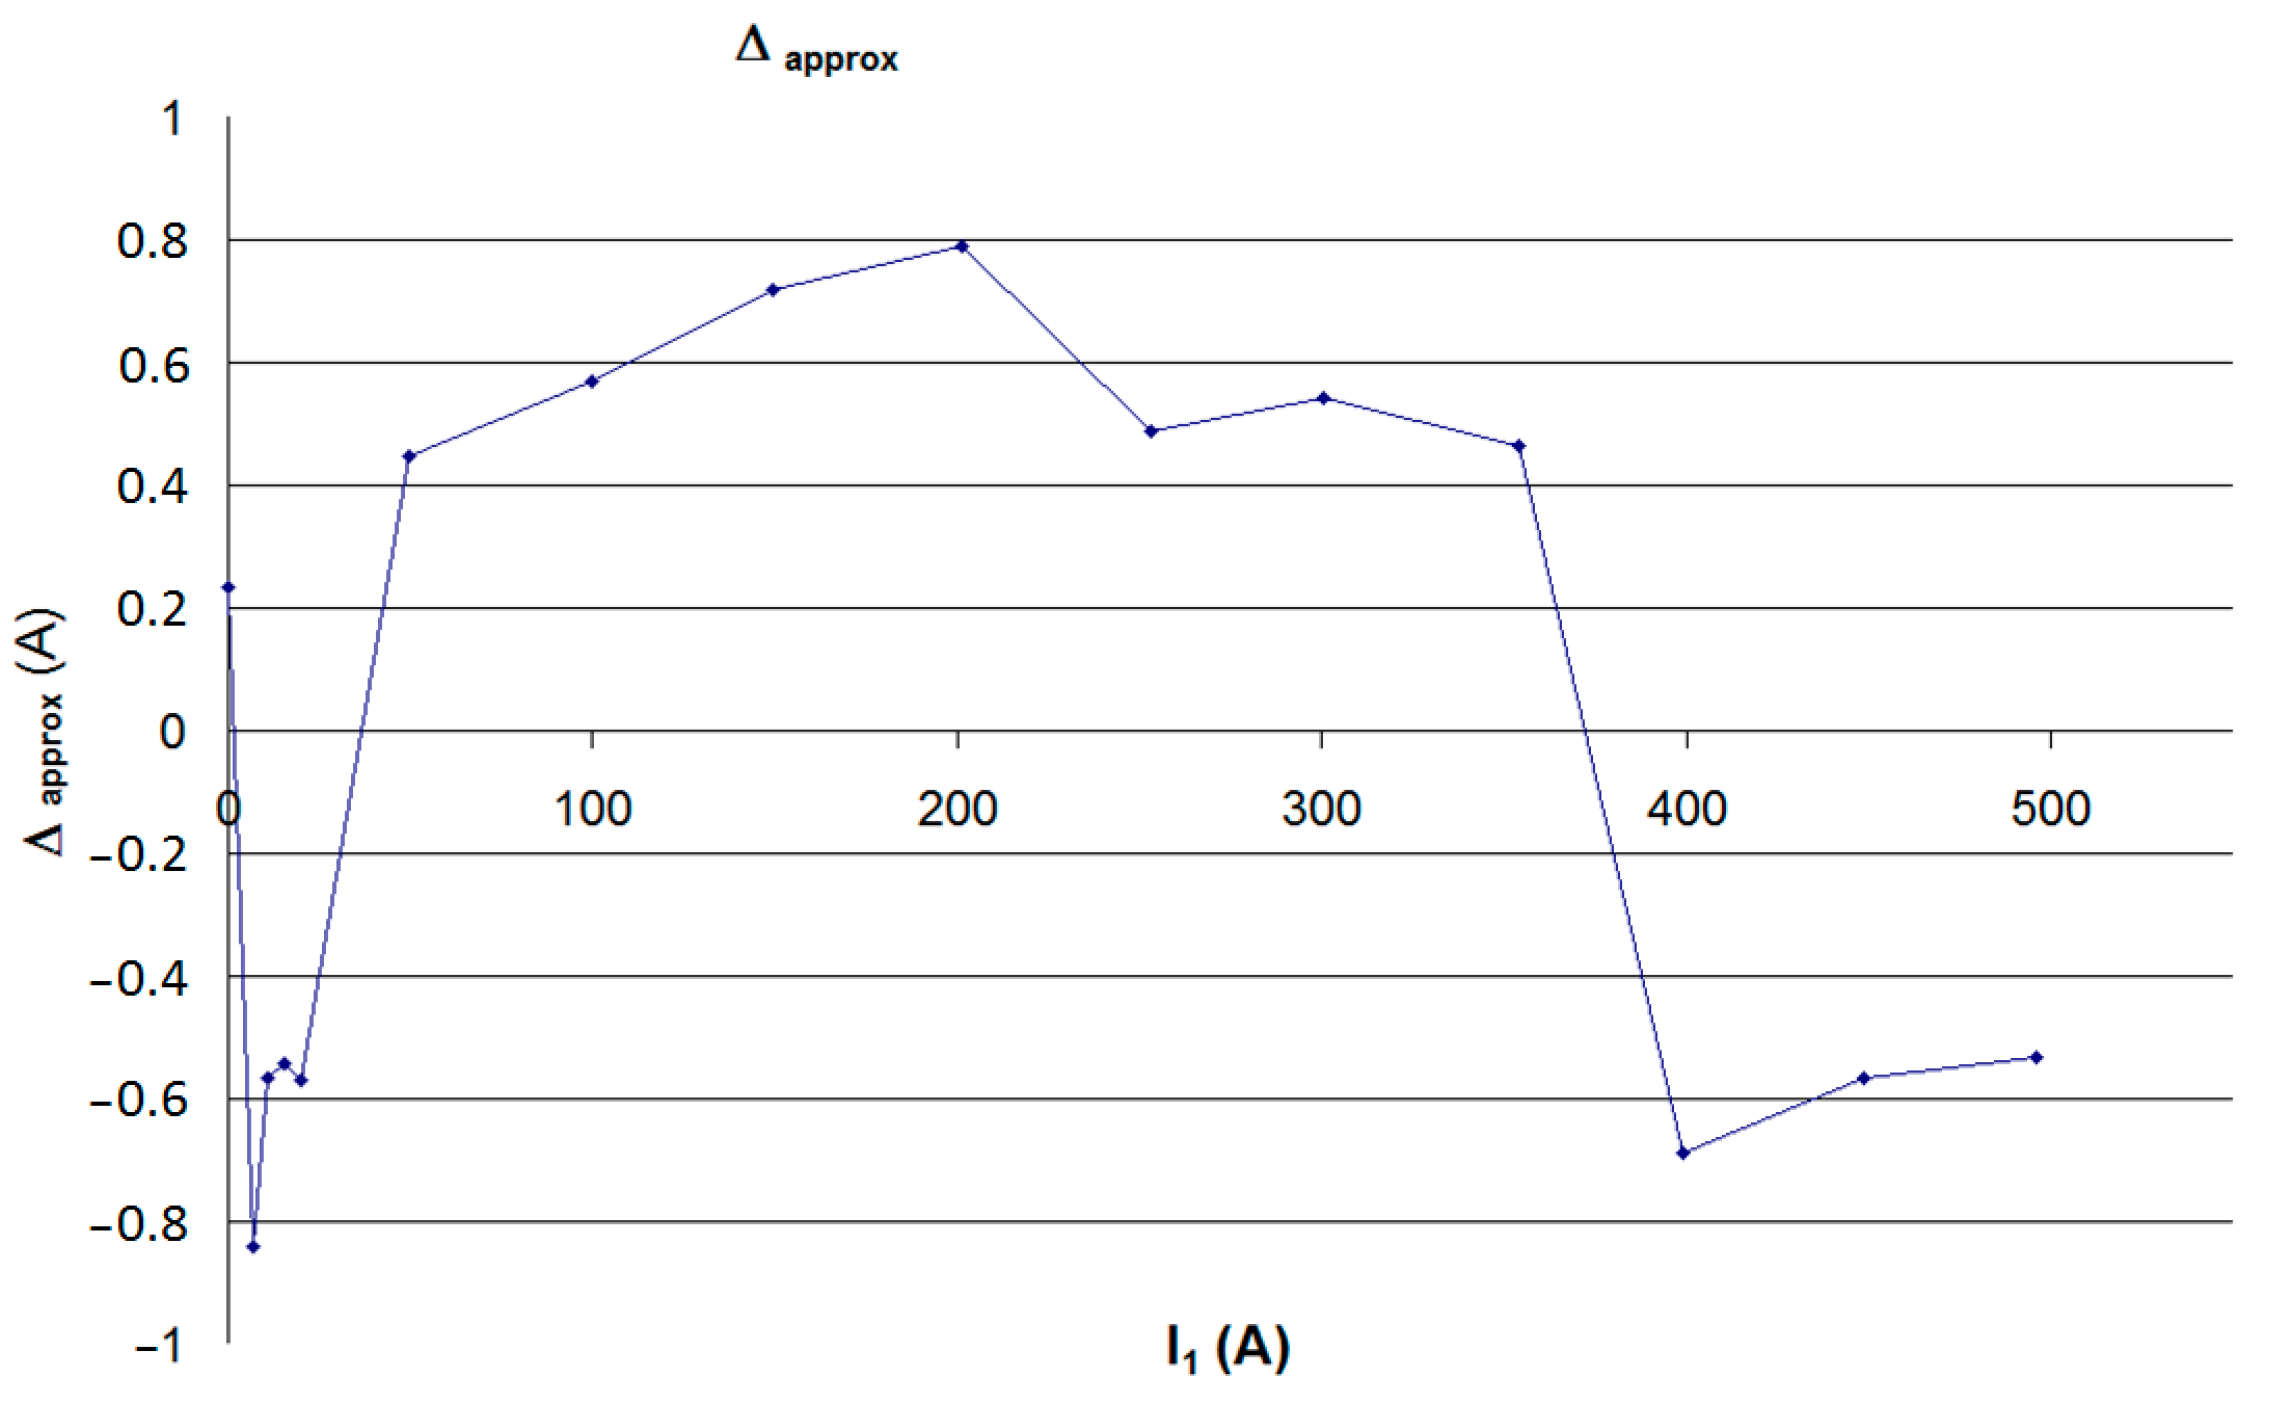
Figure 10.
The idea of the implementation of the auto-calibration procedures in the E/A operations.
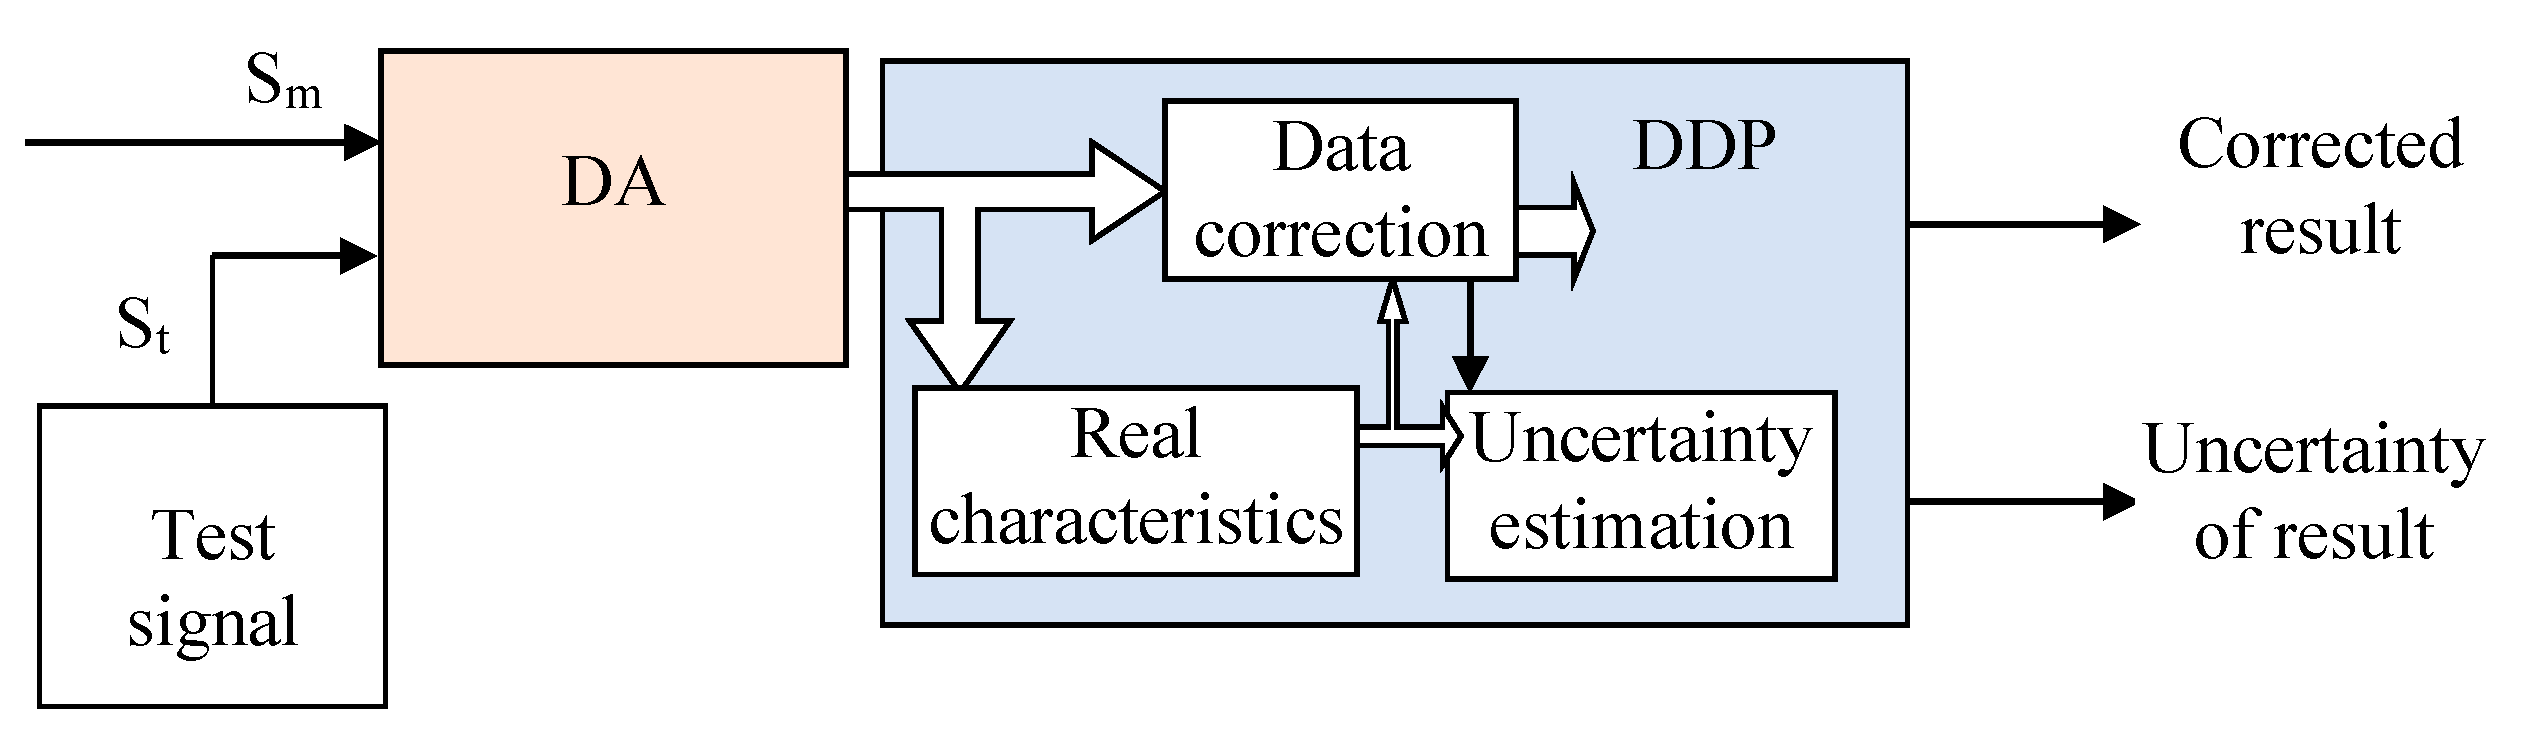
Figure 11.
Experimental setups for the verification of measurement algorithms: (a) The preliminary assessment of algorithms in the development kit; (b) The estimation of algorithms with the use of pattern analog signals; (c) The estimation with the use of the raw samples of signal and coefficients designated in the E/A; and (d) The estimation using the reference instrument.

Figure 12.
The block diagram of evaluation board EVAL-TS201S-EZKIT [39]. CPLD: complex programmable logic device; DAC: digital-to-analog converter; ADC: analog-to-digital converter; JTAG: join test action group; LEDs: light-emitting diodes; PBs: push buttons; PLL: phase-locked loop; FLAGs: processor’s status register; IRQs: interrupt requests; SDRAM: synchronous dynamic random access memory.

Figure 13.
The calibration results of the voltage measurement channel of the instrument.

Figure 14.
The experimental setup for the verification of the measurement algorithms using registered samples and the corresponding coefficients, also in addition to the PC-based estimation system.
Figure 14.
The experimental setup for the verification of the measurement algorithms using registered samples and the corresponding coefficients, also in addition to the PC-based estimation system.


Table 1.
List of instruments used in the measurements [15].
Table 1.
List of instruments used in the measurements [15].
| No. | Type of Instrument | Owner |
|---|---|---|
| 1 | Panensa MEF | Technical University of Radom, Radom, Poland |
| 2 | Memobox 686 | Technical University of Radom, Radom, Poland |
| 3 | Own design | Technical University of Lodz, Lodz, Poland |
| 4 | Own design | Electrotechnical Institute, Gdansk, Poland |
| 5 | Memobox 800 | Semicon, Warszawa, Poland |
| 6 | Power recorder 1650 | University of Mining and Metallurgy, Krakow, Poland |
| 7 | Own design | University of Mining and Metallurgy, Krakow, Poland |
| 8 | Own design | Institute of Power Engineering, Katowice, Poland |
| 9 | Memobox 686 | Energopomiar-Elektryka, Gliwice, Poland |
| 10 | Own design | Gdynia Maritime Academy, Gdynia, Poland |
Table 2.
The results obtained from the E/A and in the PC system for the standard signal DST017 from the Chroma Programmable AC Power Source.
Table 2.
The results obtained from the E/A and in the PC system for the standard signal DST017 from the Chroma Programmable AC Power Source.
| Device | Size | Unit | L1 | L2 | L3 |
|---|---|---|---|---|---|
| E/A | Urms | (V) | 220.75 | 220.56 | 219.70 |
| U1 | (V) | 219.13 | 218.93 | 218.10 | |
| THD | (%) | 12.00 | 10.24 | 11.97 | |
| PC | Urms | (V) | 220.80 | 220.020 | 220.24 |
| U1 | (V) | 219.23 | 219.05 | 218.68 | |
| THD | (%) | 12.18 | 12.23 | 12.14 | |
| DST017 | Urms | (V) | 220.00 | 220.00 | 220.00 |
| U1 | (V) | 218.42 | 218.42 | 218.42 | |
| THD | (%) | 12.04 | 12.04 | 12.04 |
Table 3.
The voltage deviations with reference to the network frequency.
| f (Hz) | Size | Unit | L1 | L2 | L3 |
|---|---|---|---|---|---|
| 45 | UE/A | (V) | 221.4 | 220.7 | 220.3 |
| UPXI | (V) | 220.9 | 220.4 | 220.8 | |
| ∆ | (V) | 0.5 | 0.3 | −0.5 | |
| δ | (%) | 0.23 | 0.14 | −0.23 | |
| 50 | UE/A | (V) | 221.4 | 220.9 | 220.5 |
| UPXI | (V) | 220.9 | 220.4 | 220.8 | |
| ∆ | (V) | 0.5 | 0.5 | −0.3 | |
| δ | (%) | 0.23 | 0.23 | −0.14 | |
| 55 | UE/A | (V) | 221.4 | 220.8 | 220.3 |
| UPXI | (V) | 220.9 | 220.4 | 220.8 | |
| ∆ | (V) | 0.5 | 0.4 | −0.5 | |
| δ | (%) | 0.23 | 0.19 | −0.23 |
© 2017 by the author. Licensee MDPI, Basel, Switzerland. This article is an open access article distributed under the terms and conditions of the Creative Commons Attribution (CC BY) license (http://creativecommons.org/licenses/by/4.0/).
Share and Cite
MDPI and ACS Style
Masnicki, R.
Validation of the Measurement Characteristics in an Instrument for Power Quality Estimation—A Case Study
. Energies 2017, 10, 536.
https://doi.org/10.3390/en10040536
AMA Style
Masnicki R.
Validation of the Measurement Characteristics in an Instrument for Power Quality Estimation—A Case Study
. Energies. 2017; 10(4):536.
https://doi.org/10.3390/en10040536
Masnicki, Romuald.
2017. "Validation of the Measurement Characteristics in an Instrument for Power Quality Estimation—A Case Study
" Energies 10, no. 4: 536.
https://doi.org/10.3390/en10040536
Note that from the first issue of 2016, this journal uses article numbers instead of page numbers. See further details here.