
Jointed Surrounding Rock Mass Stability Analysis on an Underground Cavern in a Hydropower Station Based on the Extended Key Block Theory


1
School of Civil Engineering, Shandong University, Jinan 250061, China
2
Geotechnical & Structural Engineering Research Center, Shandong University, Jinan 250061, China
3
State Key Laboratory for Geomechanics & Deep Underground Engineering, China University of Mining & Technology, Xuzhou 221116, China
*
Author to whom correspondence should be addressed.
Energies 2017, 10(4), 563; https://doi.org/10.3390/en10040563
Submission received: 2 March 2017
/
Revised: 7 April 2017
/
Accepted: 14 April 2017
/
Published: 20 April 2017
Abstract
:The jointed surrounding rock mass stability is of utmost importance to integral stability during the construction and long-term safety operation of the underground caverns in hydropower stations. The key blocks play a significant role in the integral stability of the jointed surrounding rock mass, therefore it is critical to determine the location, size, and failure mode of random key blocks. This paper proposes an improved method combining the traditional key block theory (KBT) and the force transfer algorithm to accurately calculate the safety factors of probabilistic key blocks in the surrounding rock mass. The force transfer algorithm can consider the interactions between the internal blocks. After the probabilistic characteristics of the joint fissures are obtained, the stereographic projection method is employed to determine the locations of dangerous joints. Then the vector analysis method is used to search the random blocks, determine the sliding directions of random blocks, and calculate the block sizes and safety factors near the free surface of the underground cavern, which can be used to comprehensively evaluate the surrounding rock mass stability. The above numerical results have provided powerful guidance for developing a reinforcement system for the surrounding rock mass.
1. Introduction
The natural rock mass is always split into different types of blocks with varying sizes by numerous discontinuities [1,2,3,4,5,6,7,8,9,10,11]. When the spatial states of the blocks satisfy certain conditions, the blocks are apt to slide and incur instability, which can be named as key blocks [12]. Early in the 1980s, key block theory (KBT) was initially proposed and considered an effective method to solve the problems in blocky rock mass media [13]. In this theory, the rock mass is regarded as a rigid body, which would be undergoing mechanical and geometric analysis, and the finite theory and mobility theory are both applied to conduct the stability analysis on the blocky rock masses. Warburton [14] first proposed the stability analysis on arbitrary polyhedral blocks with any number of free faces in the rock mass. Later, Lin and Fairhurst [15], and Mauldon and Goodman [16] theoretically solved the rotation problems of blocks in stability analysis and continuously developed the vector analysis method. Yarahmadi-Bafghi and Verdel [17] extended KBT to a key-group method, which considered not only individual key blocks but also groups of collapsible blocks and explained how to identify the key groups. Continuously, Noroozi et al. [18] performed a rock slope stability analysis using the key-group method under 2D and 3D conditions, and the outcomes of the 3D analysis were in good agreement with reality and the results of 2D analysis. Firpo et al. [19] conducted a rocky slope stability analysis using both digital terrestrial photogrammetry and distinct element numerical method. Kim et al. [20] verified a method for the determination of the block sizes in view of joint persistence. They applied the geological strength index (GSI) system for rock mass classification according to the accurate block sizes and statistically analyzed how the distribution of rock bridges based on the combination of joint orientation, spacing, and persistence. Menéndez-Díaz et al. [21] proposed the concept of non-pyramidal key blocks, which could be generated by dislocation, and the software program Analysis of the Support of Tunnels in Rock (ASTUR) developed by the Ground Engineering Group at the University of Oviedo was applied to develop a ubiquitous approach and allow the analysis of both pyramidal and non-pyramidal tetrahedral and pentahedral blocks. Elmouttie et al. [22] made further efforts to develop a modeler that would be capable of handling multiple curved, finite persistent discontinuities. Then this modeler was used in the stability analysis of an underground excavations and verified to have more significant advantages than the algorithm Menéndez-Díaz et al. [21] proposed. Kulatilake et al. [23] conducted kinematic and block theory analyses for rock slopes to evaluate the stability of slopes, and the numerical results showed that the maximum safe slope angles obtained from kinematic analysis are less than or equal to those obtained from block theory analysis, which verified that the results based on KBT were closer to reality. Fu and Ma [24] extended the KBT and proposed a force transfer algorithm to consider the force interactions of the adjacent batches of key blocks. A two-step safety check was also applied for the evaluation of a selected rock support system. Zheng et al. [25] proposed a probabilistic block theory analysis code (PBTAC) according to the variability of the discontinuity orientation and shear strength for a part of open pit mine in the USA, and the numerical results using PBTAC closely conform to those reported by the mining company. Carranza-Torres et al. [26] employed analytical models and numerical finite-difference method to analyze the geomechanical stability of shallow cavities for compressed air energy storage (CAES).When handling general movable blocks with multiple structural planes, Sun et al. [27,28] reported an optimization model for solving the safety factor of blocks based on KBT. This optimization model considered the safety factor and the normal stress on the slip surface as two independent variables. The objective functions were optimized by conventional optimization techniques and finally the disadvantages of the conventional KBT were overcome.
Previous researchers also conducted relevant work on the support design in surrounding rock mass based on KBT. Windsor and Thompson [29] applied the early development of KBT for identification and stability assessment of the blocks. These developments were supplemented with support design and assessment procedures for the unstable rock blocks. The design of appropriate reinforcement and support schemes in the surrounding rock mass were further investigated using both deterministic and probabilistic analysis methods [30]. Windsor [31] also conducted the stability evaluation of reinforced rock mass including geometric and force equilibrium evaluations, safety assessment using an incremental force-displacement computer program for each reinforced key block. Fu and Ma [24] proposed a two-step check for the reinforced rock mass. The first step was to check the safety of the bolted individual block, and the second step was to check the safety of the bolted block groups.
It can be seen that most previous research ignored the force interactions of the adjacent groups of key blocks. Furthermore, previous research work focused on the stability analysis of special key blocks but not on global characteristics, and the probabilistic characteristics of key blocks were not sufficiently considered. Therefore, there are still a number of deficiencies and difficulties that require further research and improvements in the surrounding rock mass stability analysis using KBT. In this paper, an extended method combining the conventional KBT and the force transfer algorithm was proposed to accurately calculate the safety factors of probabilistic key blocks in the surrounding rock mass of an underground cavern. The force transfer algorithm could consider the interactions between the internal blocks. After the probabilistic characteristics of the joint fissures were obtained, the stereographic projection method was employed to determine the locations of dangerous joints. Then the vector analysis method was used to search the probabilistic blocks, determine the sliding directions of probabilistic blocks, and calculate the block sizes and safety factors near the free surface of the underground cavern, which could help us to comprehensively evaluate the surrounding rock mass stability. Meanwhile, the lining and support system using rock bolts were also checked.
2. Methodology for Probabilistic Blocks
In KBT, the discontinuities in rock mass are assumed to be planes that penetrate throughout the blocks, and the blocks are approximately assumed to be rigid bodies. In the current study, the failure modes in the blocks can be divided into translational modes and rotational modes. Translational modes include free falling or uplifting, single plane sliding, and double plane sliding [17,24,29,32,33]. The safety factor of the key block can be calculated as the following according to the KBT [13]:
where denotes the safety factor; respresents the resistance force; respresents the sliding force; denotes the resultant force vector acting on the rock block (only weight); and denote the normal vectors of joint planes i and j, respectively; and denote normal forces on planes i and j, respectively; and and denote frictional angles for planes i and j, respectively.
Generally speaking, the blocks can be regarded as stable when is larger than 1.5; otherwise, the surrounding rock mass should be supported. In this paper, the characteristics of discontinuities were statistically analyzed by the stereographic projection method and the probability method. The vector analysis method was employed to determine the failure modes and sliding directions. The safety factors were calculated by the conventional KBT with a consideration of interactions between the internal blocks. Finally, the support system using rock bolts had also been verified.
2.1. Stability Analysis of a Single Block
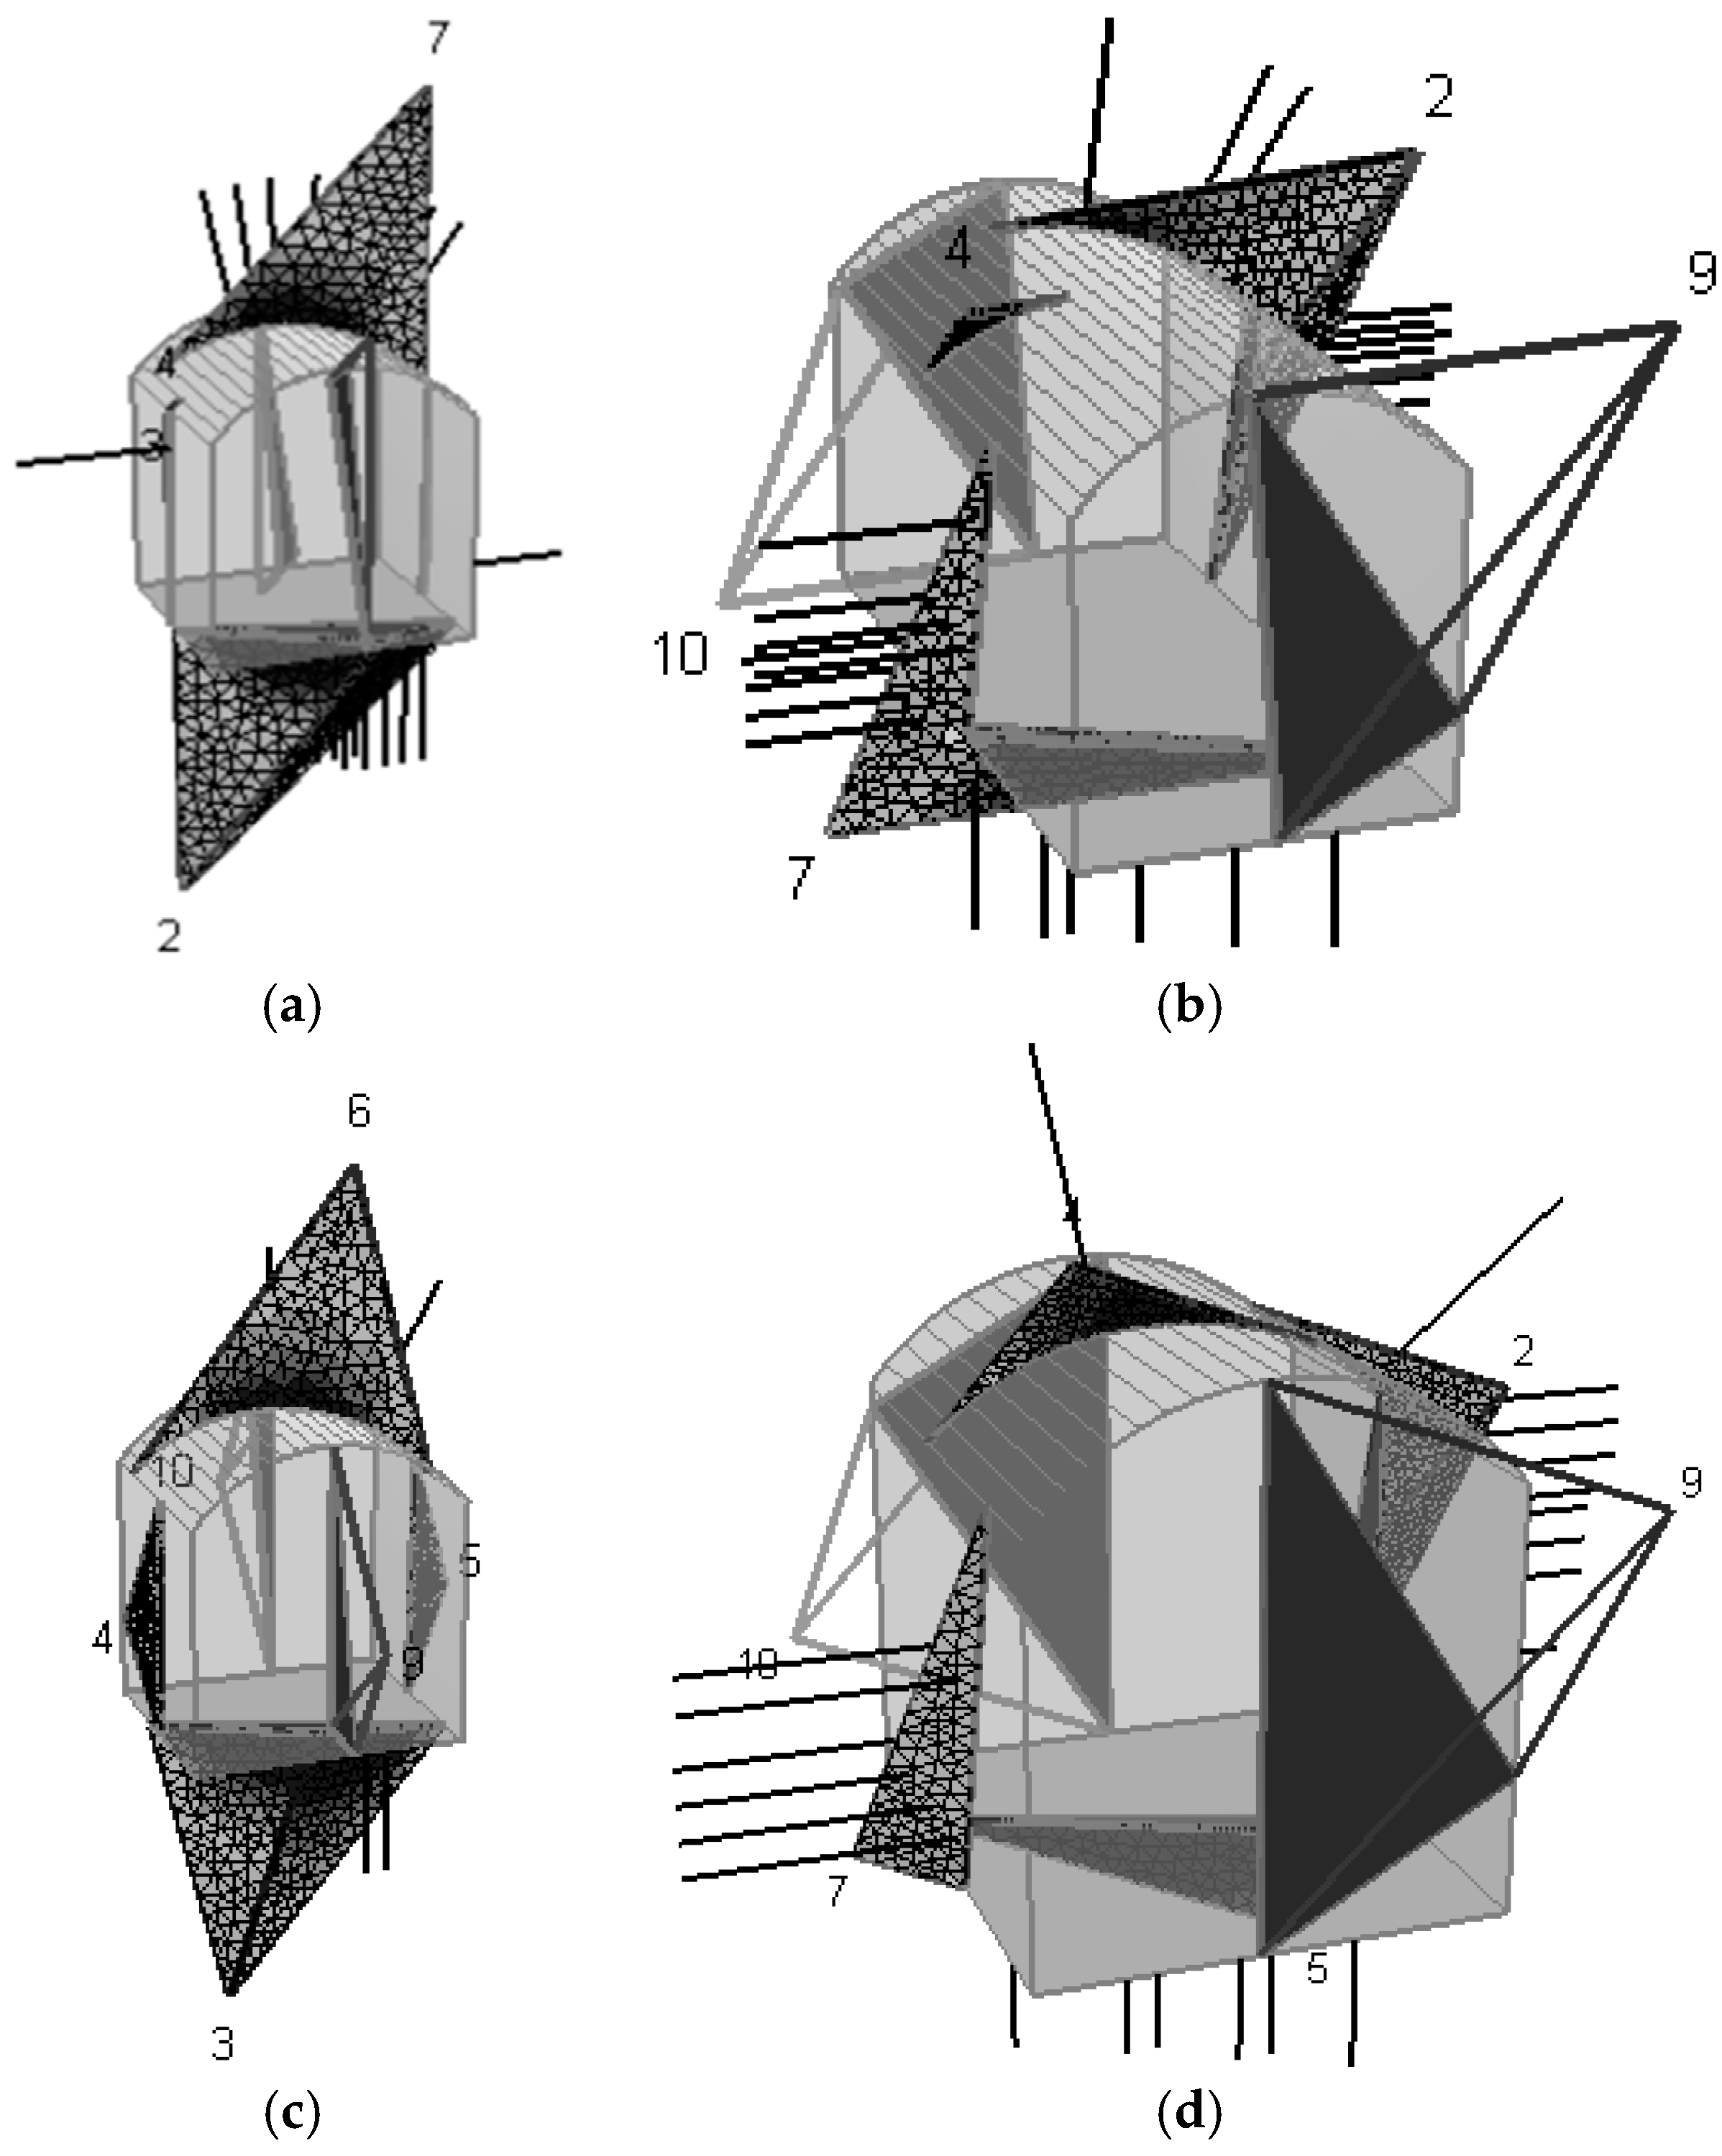
The vector analysis method is employed to determine the sliding directions of blocks, and calculation methods of the safety factors under different failure modes are also proposed [12]. Any potential key block should have at least one free face, named a day-lighting block. For each day-lighting block, the removability analysis can be processed by checking all the possible sliding modes. Initially, the resistance force vector with the unit vector , and the dot product of the unit vector and the unit normal vector of each discontinuity face are all calculated. Four typical states of the probabilistic blocks can be summarized as in Figure 1 and specifically analyzed as follows:
- (1)
- Stable block, as shown in Figure 1a. If there exists i such that , then the block can be regarded as a stable block.
- (2)
- Free falling block, as shown in Figure 1b. If there exists i such that , then the block can be regarded as a free falling block. The formula for calculating the safety factor can be expressed as follows:where represents the sliding resistance force at the i direction, represents the anchoring efficiency, is the component of cohesion at the g direction, and is the component of the block gravity at the g direction.
- (3)
- Sliding along one face, as shown in Figure 1c. If there exists i such that , and for arbitrary k. The sliding direction of the block can be obtained by or . The formula for calculating the safety factor can be expressed as follows:where and denote the normal and tangential components of gravity to sliding plane i respectively, and are the area and cohesion of plane i, and are the normal and tangential components of the anchoring force to sliding plane i respectively, and and are the normal and tangential components of the shotcrete strength to sliding plane I, respectively.
- (4)
- Double plane sliding, as shown in Figure 1d. If there exists i such that , and for arbitrary k. The sliding direction of the block can be obtained by . The formula for calculating the safety factor can be expressed as follows:where , , and denote the components of block gravity, anchoring force, and shotcrete strength in the direction of the intersection line between plane i and j, respectively.
2.2. Internal Force Transfer of Key Blocks in Different Batches
The current methods based on KBT do not consider the adjacent effects of key blocks in different batches. As in these studies, each block is always regarded as if its neighboring key blocks are fixed [14]. In this paper, the neighboring blocks would be relaxed to consider the adjacent effects. Therefore, a force transfer algorithm is improved to realize it.
In order to illustrate the principle of the force transfer algorithm in key blocks, a two-dimensional condition is employed, as shown in Figure 2. In Figure 2, among batch i + 1, there exists block 3, and blocks 1 and 2 belong to batch i. Block 3 has one contact surface with block 1 and 2, respectively. F denotes the out-of-balance force. It can be found that the two contact surfaces are effective contact surfaces as the force transfer must be conducted via them. The deformation of each block would be extremely small as all the blocks are assumed to be rigid bodies. In the whole process of the force transfer, blocks 1 and 2 are assumed to be in a fixed position. Furthermore, according to the translational modes assumption, it is assumed that the magnitude of the transferred force is proportional to the effective radiation area of contact faces to the plane perpendicular to the sliding force of block 3.
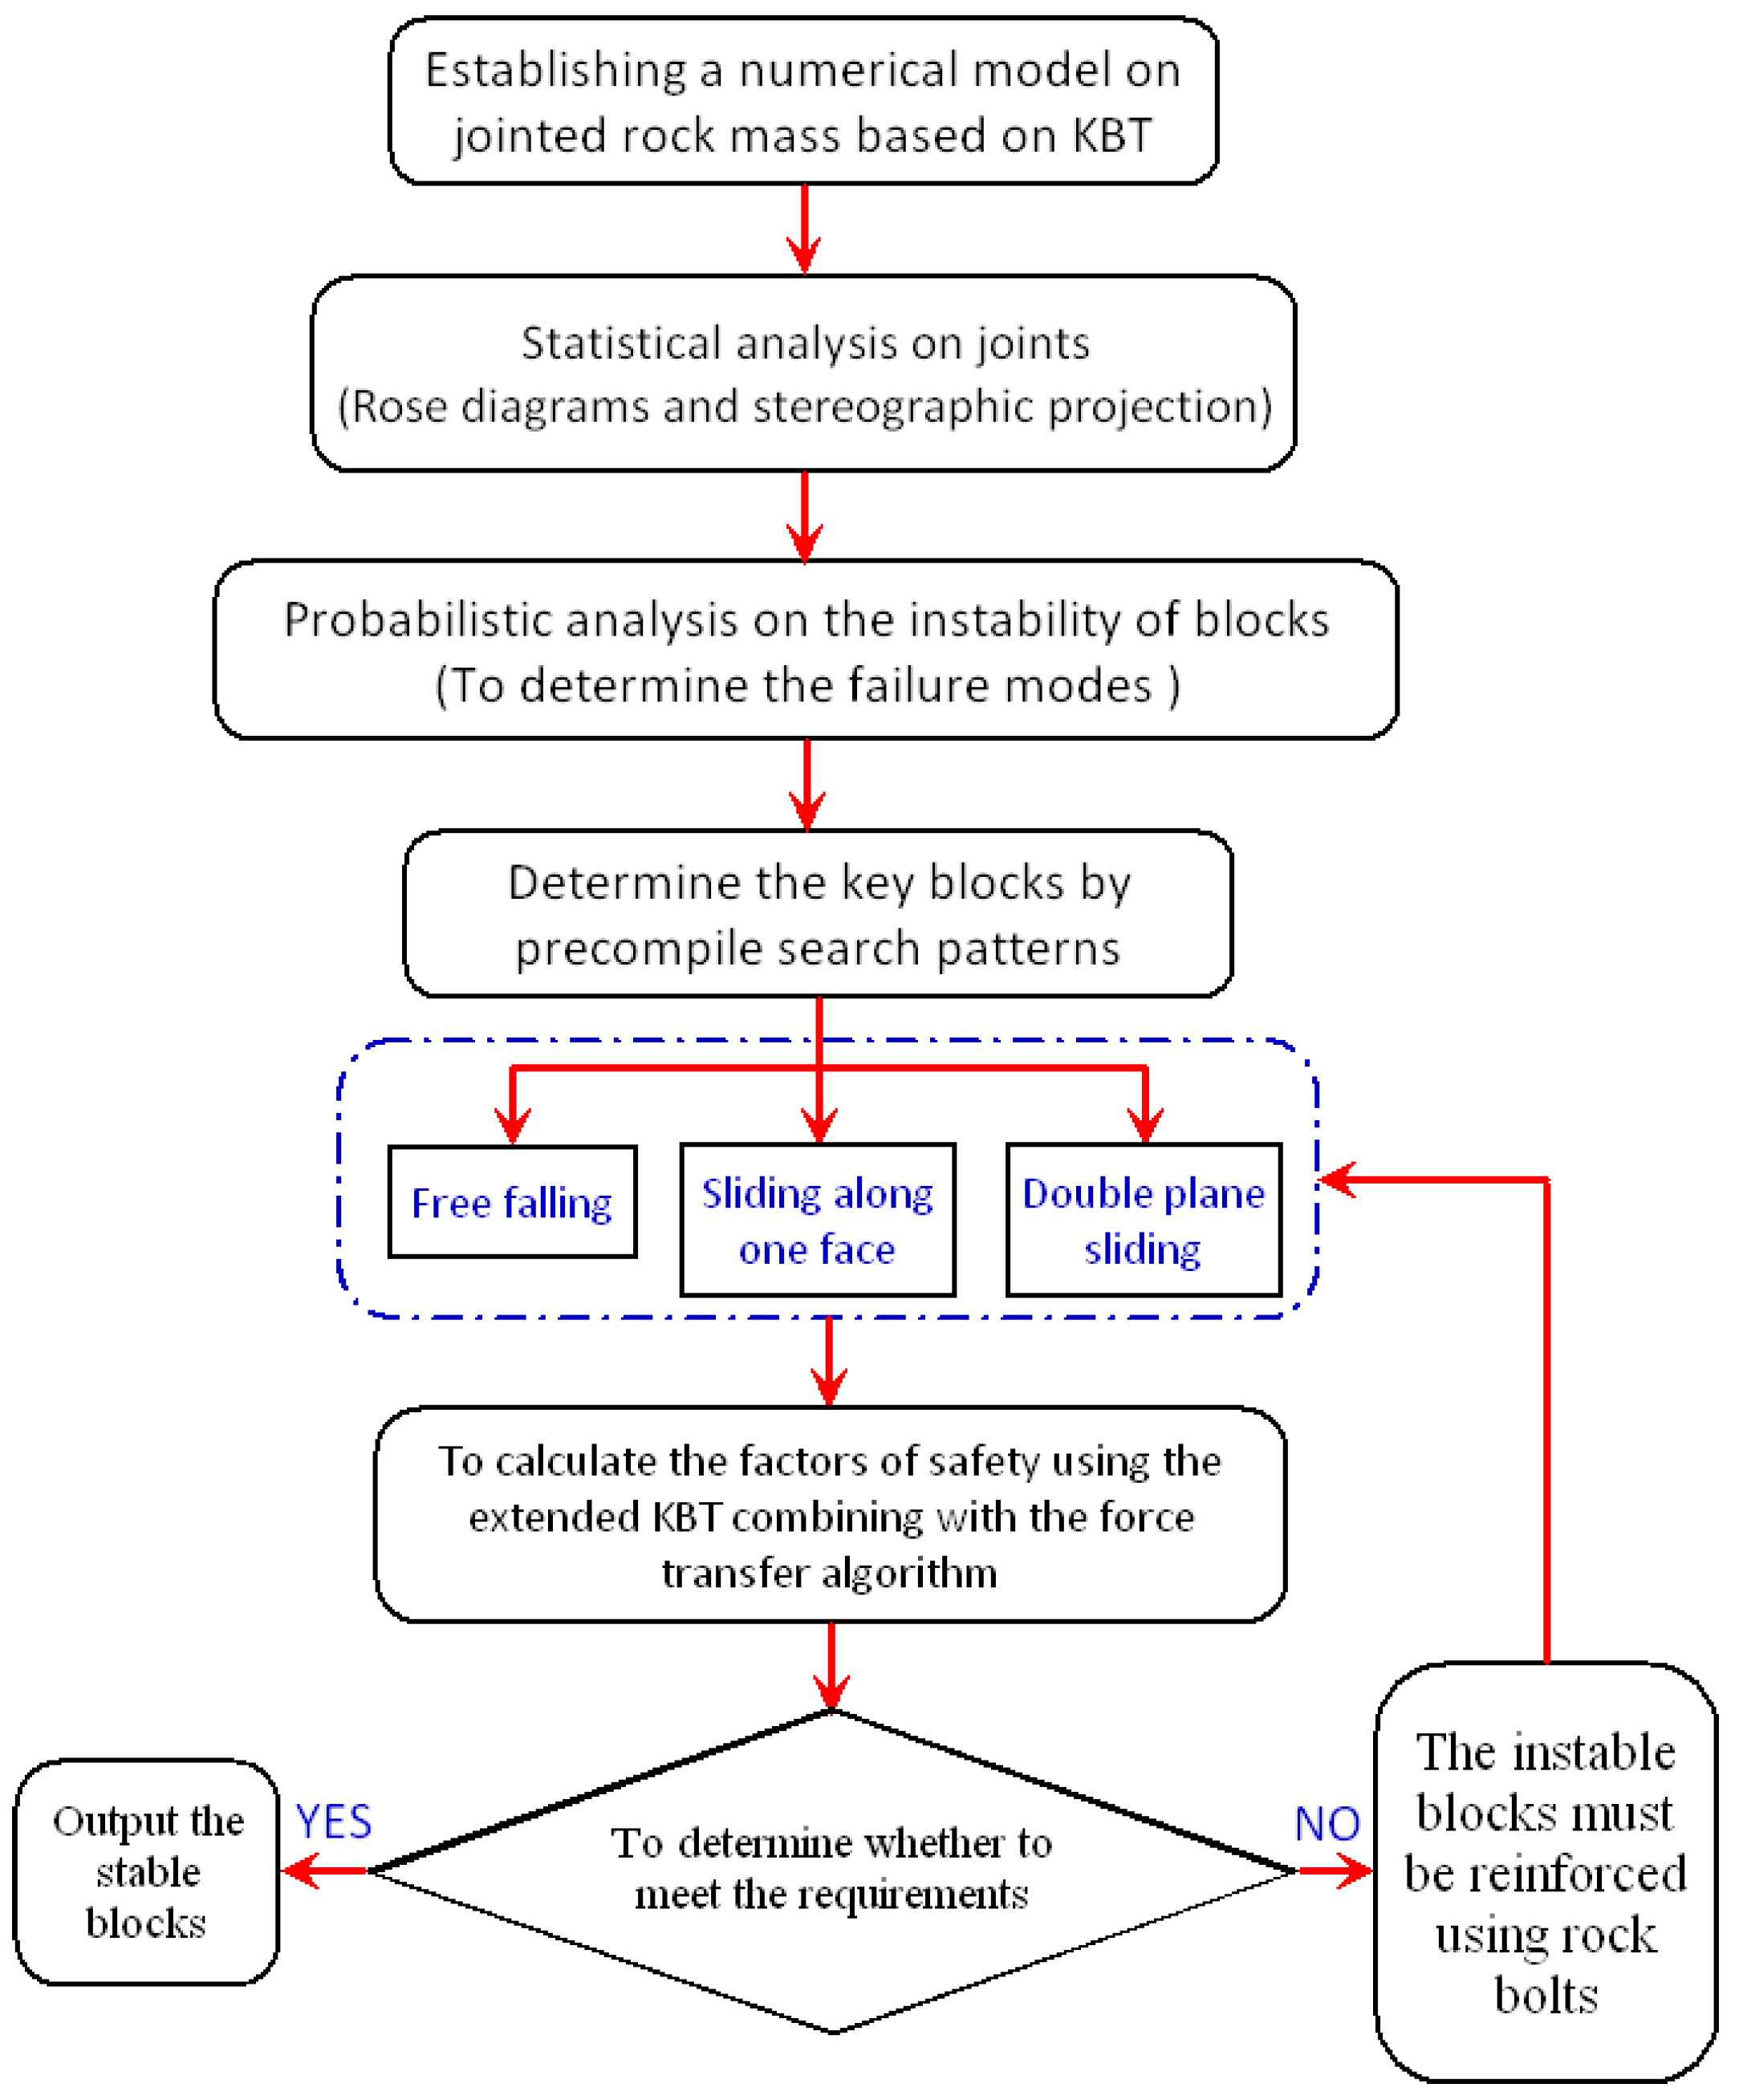
The flowchart in Figure 3 shows the detailed procedure of the methodology for the stability analysis on extended KBT.
3. Numerical Analysis: A Case Study
3.1. Engineering Project Profile
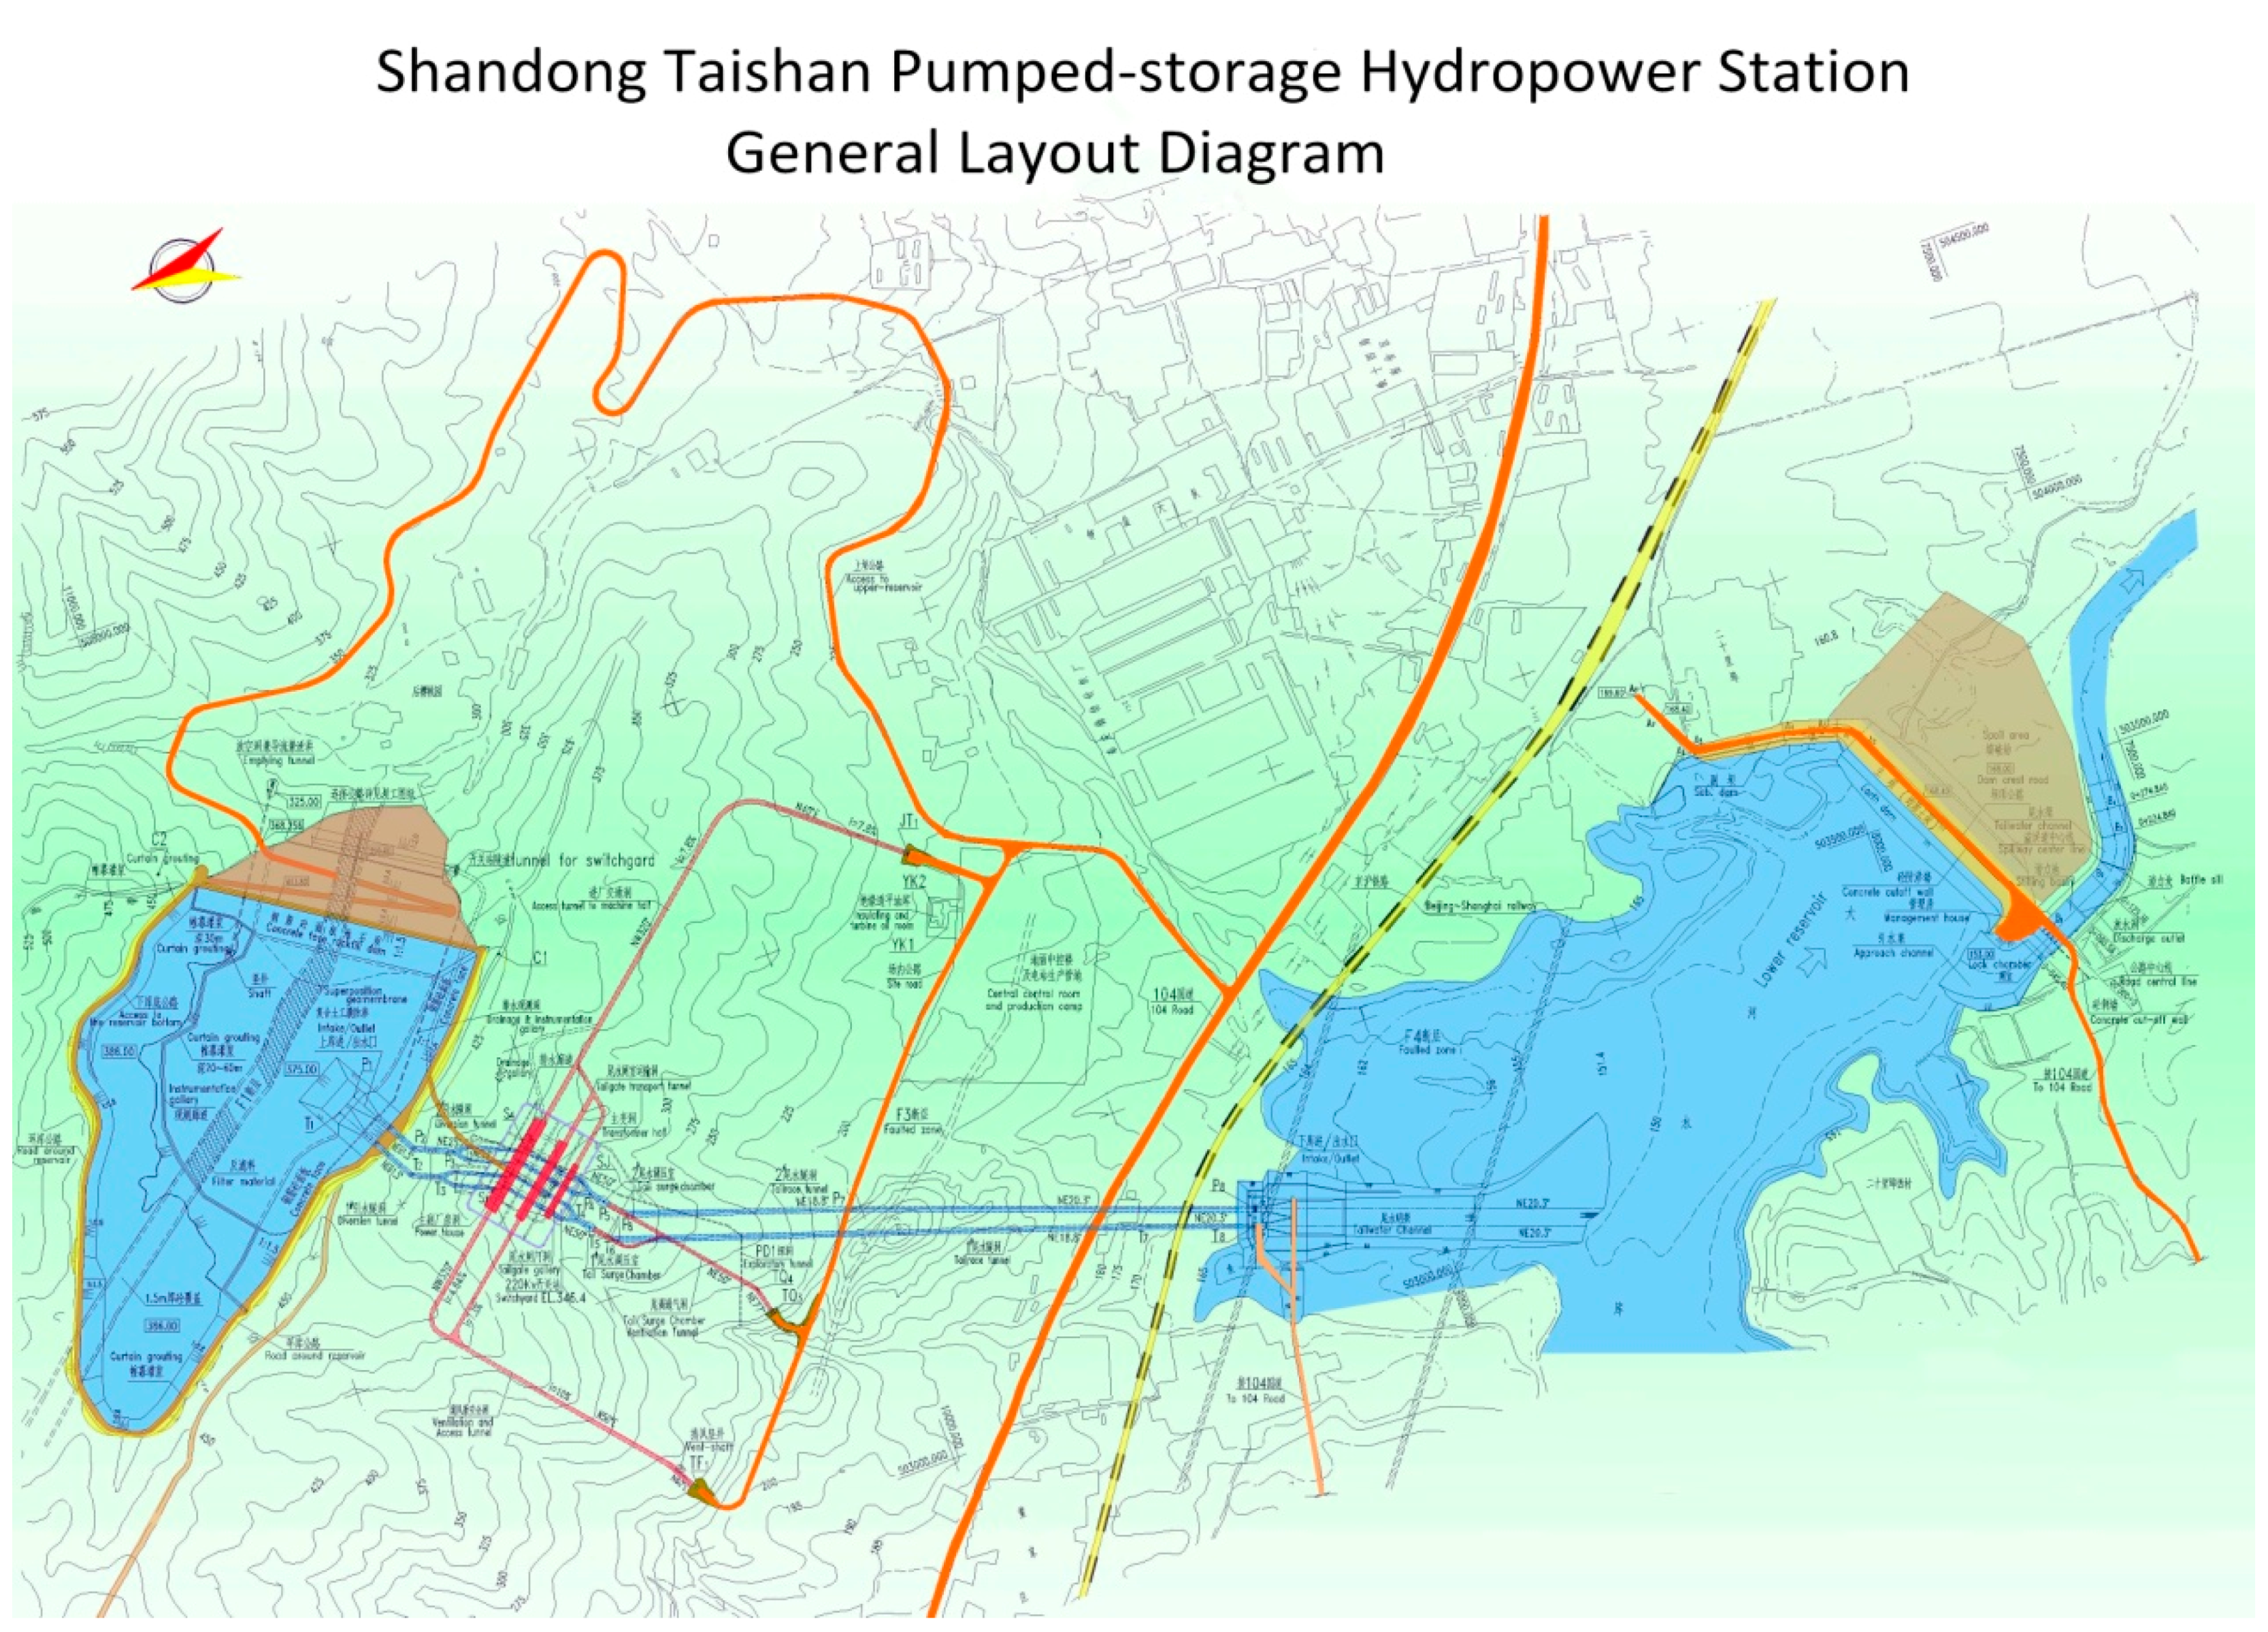
The underground cavern group of the Taishan pumped-storage hydropower station, located in Tai’an, Shandong Province, China, is taken as an engineering case study using the extended KBT, as shown in Figure 4. The overburden depth of the underground cavern group is from 210 m to 240 m, and the average overburden depth is 224.7 m. The dimensions of the main power house are 180 m (length), 24.5 m (width) and 53.23 m (height), and its axis orientation is N40° W. The elevations of the arch crown and the floor are 140.275 m and 86.60 m. The rock strata near the main power house are composed of Mesozoic granite, porphyritic granite, mixing granite, gneiss, amphibolite, and so on. The main occurrences of the rock strata are N60–80° E and SE∠70–85°. The joints near the underground caverns are well developed, and the rock mass can be classified as Type III rock mass according to the Chinese national code for geotechnical investigation (GB50021-2001) [34].The tensile strengths of the saturated rock masses are 0.6–0.7 MPa. The directions of the horizontal maximum principal stresses are N60–80° E, and the magnitudes are 7–12 MPa. From the information on previous geophysical prospecting and initial excavations, a number of developed faults have been found in the mountain, among which f9, f17, f18, f25, f37 and fc1 are determined as relatively large faults.
3.2. Statistical Analysis of the Rock Joints
The main occurrences of the rock strata are N60–80° E and SE∠70–85°. The widths of the fractured zones are 0.6–2 m, and the width of the fractured zones near the downstream side wall is larger than that near the upstream side wall. The faults near the main powerhouse are well developed and concentrated joint bands are locally formed. According to the statistical results, the proportion of the joints with high dip angles can be up to 63.5%, and the trace lengths are 6–18 m. The joints with medium dip angles account for 26.7%, and their trace length are generally less than 5 m. The joints with gentle dip angles only account for 9.8%, and their trace lengths are 7–20 m. Based on the statistical results of the exposed joints during excavations of the main powerhouse, the typical occurrences of the concentrated joint bands are shown in Table 1, and the corresponding stereographic projection of the joints is shown in Figure 5.
Considering the influences of joint trace lengths, the trace length density in structural planes can be obtained by the window moving method, and the trace length density in the unit area can be expressed as follows:
where denotes the area of the statistical window, and is the joint length within the statistical window of the i-th joint. A probabilistic analysis on the in situ measured joints is shown in Table 2.
3.3. Probabilistic Analysis on Failure Modes
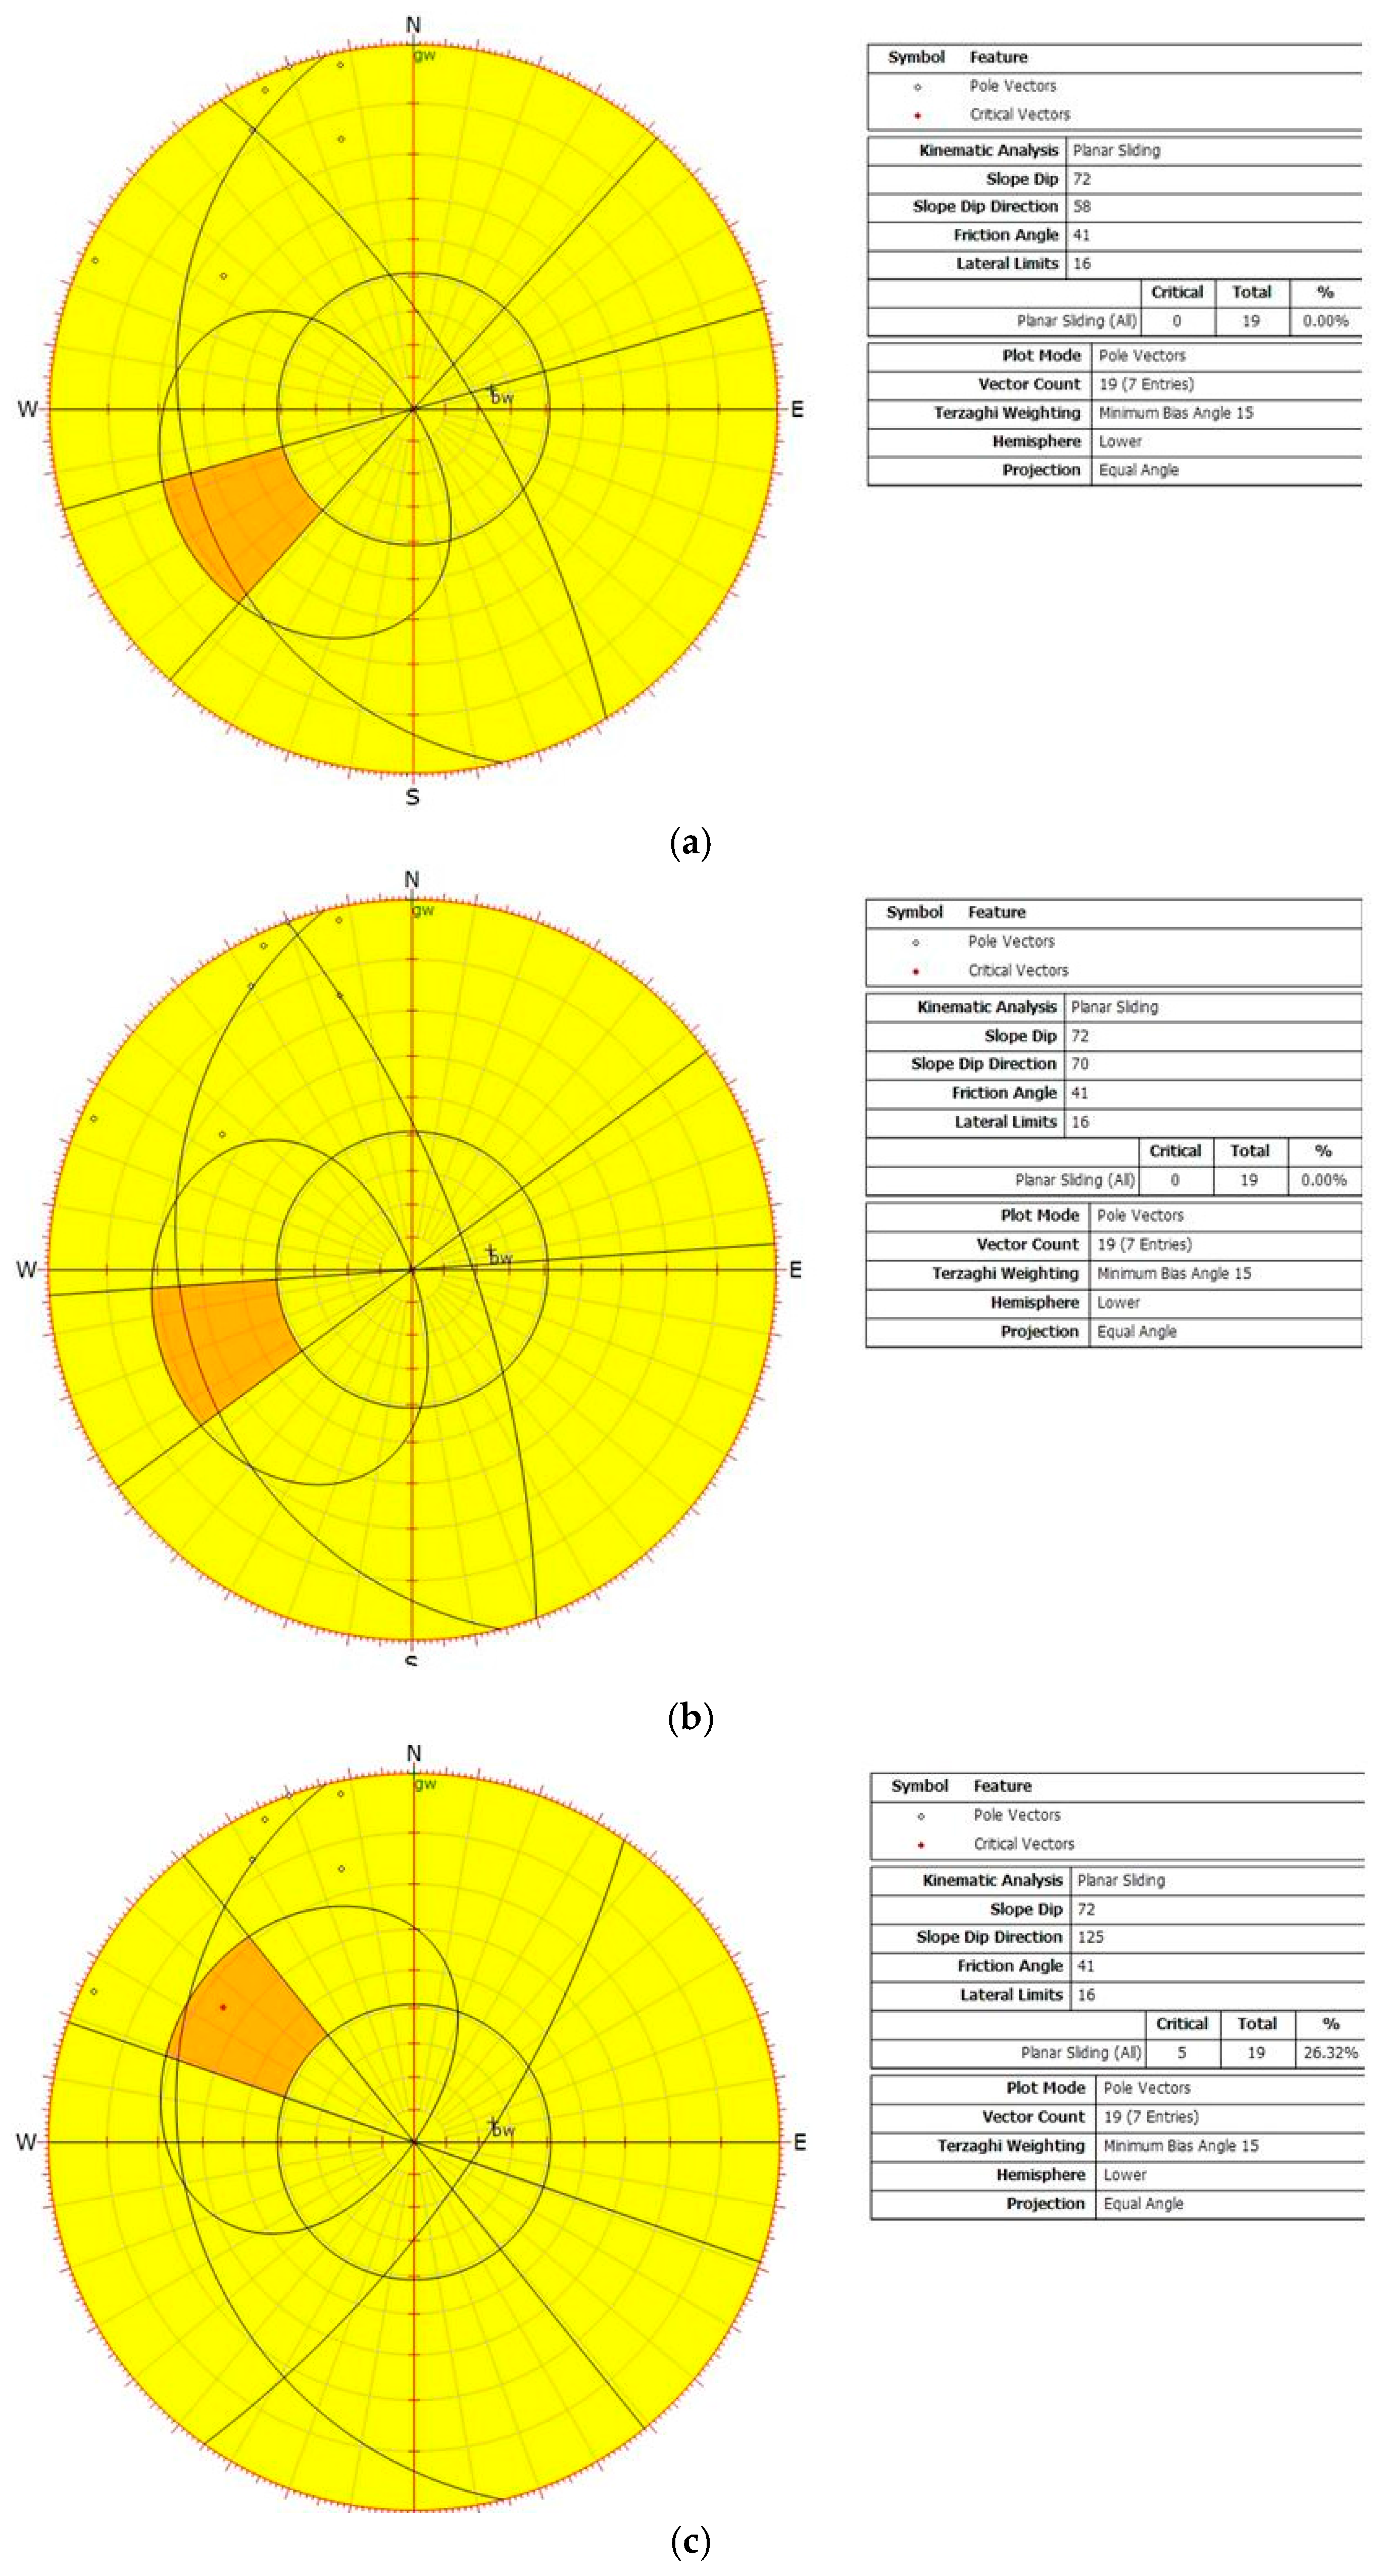
Generally speaking, the probabilistic blocks have the following failure modes: (1) planar sliding; (2) unconfined planar sliding; (3) wedge sliding; (4) direct toppling; (5) flexural toppling [35]. On the basis of the statistical analysis on the joint system, the most critical dip direction can be obtained by taking the average dip direction and the mode dip direction as parameters. Next, the failure probabilities of the five failure modes under the conditions of three typical dip directions can be calculated. The planar sliding is taken as an example to be analyzed when the average dip direction and the mode dip direction are 58–70°. The most critical dip direction is 110–140°, and the failure probabilities under the conditions of three typical dip directions are 0, 0 and 26.32%, respectively. The calculation results are shown in Figure 6.
The probability analysis of the other four failure modes can also be conducted using the same approach, and the most critical dip directions of the five failure modes are shown in Table 3 and Figure 7.
According to the statistical results of the five typical failure modes under the three dip directions, it can be found that the probabilities of appearing planar sliding, unconfined planar sliding, direct toppling, and flexural toppling are smaller, while the wedge sliding failure has the highest probability. Therefore, investigations on the wedge sliding failure will be analyzed.
3.4. Surrounding Rock Mass Stability and Results Analysis of the Main Powerhouse
Firstly, the numerical model of the main powerhouse is established, and its dimensions are 180 m (length), 24.5 m (width) and 53.23 m (height) as shown in Figure 8. The eight-node hexahedron isoparametric elements are adopted in the numerical model. The upper surface is an unconstrained surface and sliding constraints are applied on other planes. According to the in situ investigation data, the related physico-mechanical parameters have been analyzed, and these parameters are finally obtained by regression calculations, as shown in Table 4.
The probabilistic blocks have been searched according to the extended KBT, and the arch crown area of the main powerhouse is regarded as the highest risk area. The spatial states of the probabilistic blocks can be searched by the block analysis program, and the safety factors of some key blocks can be calculated as shown in Figure 9.
It is assumed that the structural planes of key blocks can move in parallel, so the dominant joint groups would be combined, analyzed, and calculated. Every three different joint groups would be simplified as an analytical combination, and it is necessary to analyze all the analytical combinations of ten probabilistic key blocks. Meanwhile, all the key blocks determined by block searching analysis program should be statistically analyzed, and the block with a volume of 1 would be totally eliminated during excavations. The number of searched key blocks is 1246, and the number of remaining blocks whose volume is larger than 1 is only 635. From the statistical results, the average volume of the key blocks is 9.7 , and the volume of one key block should not exceed 43 . The development depths of the joints are less than 10 m, and the average depth is 5.8 m. The distances from the key blocks to the surface of the main powerhouse are 2–8 m. Figure 10 shows the cumulative frequency curves of the buried depths of the key blocks, the volumes of the key blocks, and the safety factors of the blocks need to be supported.
In order to determine the final supporting strength and the corresponding support design of the key blocks, it is necessary to calculate the safety factors of the key blocks after performing the force transfer algorithm. Figure 11 shows the safety factors of some typical key blocks before force transfer and after force transfer. According to the statistical results, the volumes of the key blocks split by structural planes are generally less than 120 , and only a few volumes of the key blocks are 120–150 . The distances from key blocks to the surface of the powerhouse near the upstream and downstream side walls are 2–8 m, and these key blocks exhibit good stability as their calculated safety factors are greater than 2.5. The distances from the key blocks near the arch crown to the surface of the powerhouse are 1.5–8 m. The safety factors of 83 percent of all the key blocks are larger than 2.0, 14 percent of them are between 1.5 and 2.0, and only three percent of them are less than 1.5. For the integral stability of the surrounding rock mass, it is necessary to apply support designs on some of the blocks. The length of the rock bolt in jointed rock mass can be obtained by the following equation [12,36]:
where denotes the length of the rock bolt; denotes the safety factor of resisting failure of the key block; is the spacing of adjacent rock bolts; is the effective internal friction angle; represents the anchoring force of the rock bolt; and is the density of the rock mass.
To verify the stability of the key blocks around the main powerhouse and simultaneously consider the effects of the rock bolts, the following items should be taken into account:
- (1)
- The anchoring force. The corresponding anchoring force in the original design scheme would be converted into anti-sliding force on unit area, then the exposure area in the free excavating surface of the key blocks would be calculated. The product of the anti-sliding force and the exposure area will be the modified anchoring force of the key blocks.
- (2)
- Mechanical behavior of the structural plane. Considering the anchoring effect of the rock bolt on the improvement of mechanical behaviors of the jointed rock mass, the following empirical equation would be adopted:where and are the cohesion and friction angle of the structural plane after applying the support of rock bolt; and are the original cohesion and friction angle; represents the shear strength of rock bolt; is the cross-sectional area of the rock bolt; and are the longitudinal and lateral spacings of the rock bolts; and is a comprehensive empirical coefficient with values between 2.0 and 2.5.
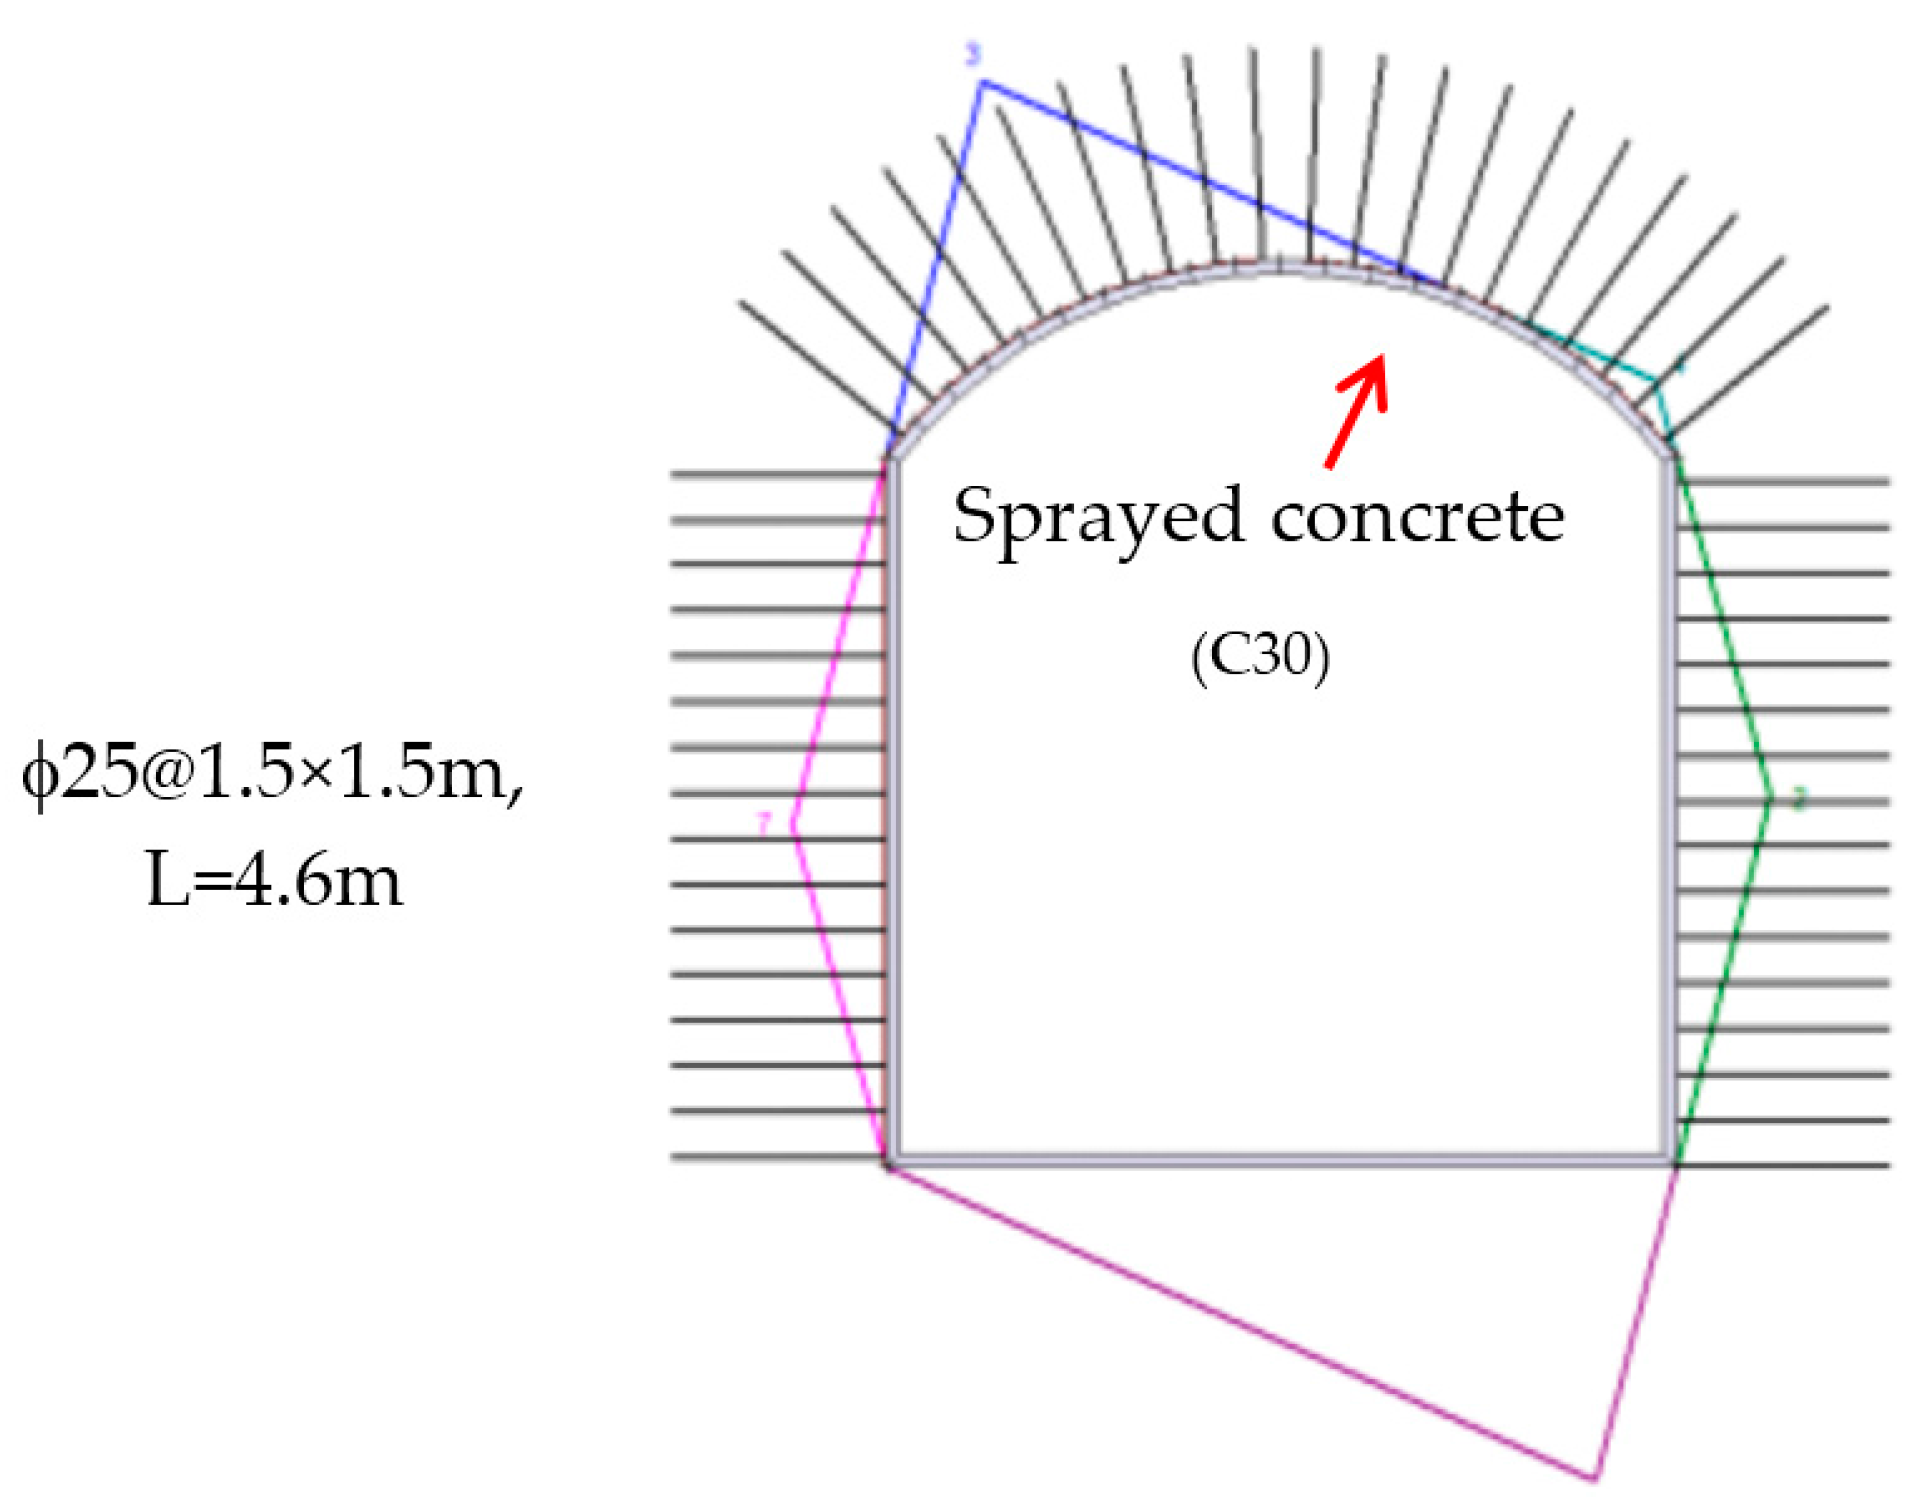
After calculations, the following supporting scheme has been determined. The arrangement for rock bolts is . The length of most rock bolts is 4.6 m, but the length of only a few rock bolts near the boundary of arch crown and side walls is 6.1 m. The exposed portion of rock bolts is 10 cm. To avoid the collapse of key blocks with smaller volumes, sprayed concrete (C30) with a thickness of 12–15 cm has been applied onto the surface of the arch crown. The cross-sectional drawing of the determined supporting design is shown in Figure 12.
In these calculations, we considered 10combinations of unfavorable structural planes. We selected combination No. 7 as a typical one to evaluate the anchoring effect of the supporting design. In No. 7, the tensile strength and the shear strength of the rock bolts are 150 kN and 80 kN. The anchoring force is 34.27 . The friction angle of the structural plane is 26.4°. The impacts of the supporting design and sprayed concrete lining on the key blocks are shown in Figure 13.
The calculation results for the effectiveness evaluations of rock bolts and sprayed concrete lining, the supporting forces, and safety factors of the key blocks are listed in Table 5. It can be found that the maximum tensile strength and the maximum shear strength are 125.6 kN and 67.3 kN, which are both under the capacity of the rock bolts. Owing to the support system of rock bolts and sprayed concrete lining, the safety factors of the key blocks have been greatly improved and the values are all greater than 1.5. Therefore, it can be concluded that the determined supporting scheme of rock bolts and sprayed concrete lining can completely meet the stability requirements of the key blocks around the underground main powerhouse.
Comparing the safety factors before and after applying the determined supporting system, we clearly find that the actions of force transfer have significant impacts on the stability of key blocks. From calculation results, the safety factors of only three key blocks have increased, accounting for 11 percent of all the key blocks. The safety factors of other key blocks have generally decreased. Among them, four stable key blocks have been turned into instable key blocks, and two instable key blocks have been turned into stable key blocks. The variations of the driving force have no direct connection with those of the safety factors, owing to the fact that variations in driving force would simultaneously result in variations of anti-sliding force. Actually, there are a number of factors influencing the safe factor, such as the size, occurrence, penetration conditions, etc. of structural planes.
4. Discussion and Conclusions
This paper proposes an improved method, combining the traditional KBT and the force transfer algorithm to accurately calculate the safety factors of probabilistic key blocks in the surrounding rock mass. Owing to the high randomness of key blocks and discontinuities, the statistical and vector analysis methods are both applied to consider the natural discontinuities near the underground caverns. A case study has been conducted and the final results support the conclusion that this improved KBT is an effective method to evaluate the stability of complex underground caverns in underground projects during excavations.
In the stability analysis of underground caverns during excavations, direct sliding, single-plane sliding, and double-plane sliding are three typical failure modes. As for existing complex anisotropic structural planes, it is necessary to investigate the stability analysis of key blocks. Firstly, the roles of key blocks at all levels should be considered. Then the progressive failure theory and force transfer algorithm should both be employed to study the mechanical behavior of the jointed rock mass. Meanwhile, as for the instable key blocks, a supporting scheme using rock bolts and sprayed concrete lining can greatly increase the safety factors of key blocks, which can certainly improve the surrounding rock mass stability of underground caverns. The calculation results would be more accurate if we consider the randomness of the geometric and physico-mechanical parameters of the jointed rock mass.
However, it should be noted that the current analysis is on the basis of a determined numerical model. It is difficult to accurately measure the spatial distribution characteristics of all the discontinuities, and physico-mechanical parameters of the intact rock and joints. Therefore, the probability theory can be regarded as an effective method to solve the problems.
Acknowledgments
The work was supported by the National Natural Science Foundation of China (41272325), the Shandong Provincial Natural Science Foundation, China (ZR2016EEQ01), the Fundamental Research Funds of Shandong University (2016JC007), and the State Key Laboratory for Geomechanics and Deep Underground Engineering, China University of Mining & Technology (SKLGDUEK1708).
Author Contributions
Chao Jia and Yong Li proposed the idea for the extended KBT method; Mingyuan Lian performed the geological analysis and numerical simulation; Xiaoyong Zhou conducted the results analysis; Yong Li wrote the whole manuscript.
Conflicts of Interest
The authors declare no conflict of interest.
References
- Li, Y.; Zhu, W.; Fu, J.; Guo, Y.; Qi, Y. A damage rheology model applied to analysis of splitting failure in underground caverns of Jinping I hydropower station. Int. J. Rock Mech. Min. Sci. 2014, 71, 224–234. [Google Scholar] [CrossRef]
- Li, Y.; Zhou, H.; Zhu, W.; Li, S.; Liu, J. Numerical study on crack propagation in brittle jointed rock mass influenced by fracture water pressure. Materials 2015, 8, 3364–3376. [Google Scholar] [CrossRef]
- Li, Y.; Wang, H.; Zhu, W.; Li, S.; Liu, J. Structural stability monitoring of a physical model test on an underground cavern group during deep excavations using FBG sensors. Sensors 2015, 15, 21696–21709. [Google Scholar] [CrossRef] [PubMed]
- Li, Y.; Zhou, H.; Zhu, W.; Li, S.; Liu, J. Numerical investigations on slope stability using an elasto-brittle model considering fissure water pressure. Arab. J. Geosci. 2015, 8, 10277–10288. [Google Scholar] [CrossRef]
- Li, Y.; Guo, Y.; Zhu, W.; Li, S.; Zhou, H. A modified initial in-situ stress inversion method based on FLAC3D with an engineering application. Open Geosci. 2015, 7, 824–835. [Google Scholar] [CrossRef]
- Li, Y.; Zhou, H.; Zhu, W.; Li, S.; Liu, J. Experimental and numerical investigations on the shear behavior of a jointed rock mass. Geosci. J. 2016, 20, 371–379. [Google Scholar] [CrossRef]
- Wang, H.; Li, Y.; Li, S.; Zhang, Q.; Liu, J. An elasto-plastic damage constitutive model for jointed rock mass with an application. Geomech. Eng. 2016, 11, 77–94. [Google Scholar] [CrossRef]
- Wang, Z.; Li, Y.; Zhu, W.; Xue, Y.; Song, Y. Splitting failure in side walls of a large-scale underground cavern group: A numerical modelling and a field study. Springerplus 2016, 5, 1528. [Google Scholar] [CrossRef] [PubMed]
- Li, Y.; Zhou, H.; Zhang, L.; Zhu, W.; Li, S.; Liu, J. Experimental and numerical investigations on mechanical property and reinforcement effect of bolted jointed rock mass. Constr. Build. Mater. 2016, 126, 843–856. [Google Scholar] [CrossRef]
- Li, B.; Li, Y.; Zhu, W.; Li, C.; Dong, Z. Impact of in situ stress distribution characteristics on jointed surrounding rock mass stability of an underground cavern near a hillslope surface. Shock Vib. 2017, 2017, 2490431. [Google Scholar] [CrossRef]
- Li, Y.; Li, C.; Zhang, L.; Zhu, W.; Li, S.; Liu, J. An experimental investigation on mechanical property and anchorage effect of bolted jointed rock mass. Geosci. J. 2017. [Google Scholar] [CrossRef]
- Warburton, P.M. Vector stability analysis of an arbitrary polyhedral rock block with any number of free faces. Int. J. Rock Mech. Min. Sci. Geomech. Abstr. 1981, 18, 415–427. [Google Scholar] [CrossRef]
- Goodman, R.E.; Shi, G.H. Block Theory and Its Application to Rock Engineering; Prentice-Hall Press: Englewood Cliffs, NJ, USA, 1985; pp. 55–67. [Google Scholar]
- Warburton, P.M. Implications on keystone action for rock bolt support and block theory. Int. J. Rock Mech. Min. Sci. 1987, 24, 283–290. [Google Scholar] [CrossRef]
- Lin, D.; Fairhurst, C. Static analysis of the stability of three-dimensional blocky systems around excavation in rock. Int. J. Rock Mech. Min. Sci. Geomech. Abstr. 1988, 25, 139–147. [Google Scholar] [CrossRef]
- Mauldon, M.; Goodman, R. Vector analysis of keyblock rotations. J. Geotech. Engrgy 1996, 122, 976–987. [Google Scholar] [CrossRef]
- Yarahmadi-Bafghi, A.R.; Verdel, T. The key-group method. Int. J. Numer. Anal. Methods Geomech. 2003, 27, 495–511. [Google Scholar] [CrossRef]
- Noroozi, M.; Jalali, S.E.; Yarahmadi-Bafghi, A.R. 3D key-group method for slope stability analysis. Int. J. Numer. Anal. Methods Geomech. 2012, 36, 1780–1792. [Google Scholar] [CrossRef]
- Firpo, G.; Salvini, R.; Francioni, M.; Ranjith, P.G. Use of digital terrestrial photogrammetry in rocky slope stability analysis by distinct elements numerical methods. Int. J. Rock Mech. Min. Sci. 2011, 48, 1045–1054. [Google Scholar] [CrossRef]
- Kim, B.H.; Cai, M.; Kaiser, P.K.; Yang, H.S. Estimation of block sizes for rock masses with non-persistent joints. Rock Mech. Rock Eng. 2007, 40, 169–192. [Google Scholar] [CrossRef]
- Menéndez-Díaz, A.; González-Palacio, C.; Álvarez-Vigil, A.E.; González-Nicieza, C.; Ramírez-Oyanguren, P. Analysis of tetrahedral and pentahedral key blocks in underground excavations. Comput. Geotech. 2009, 36, 1009–1023. [Google Scholar] [CrossRef]
- Elmouttie, M.; Poropat, G.; Krähenbühl, G. Polyhedral modelling of underground excavations. Comput. Geotech. 2010, 37, 529–535. [Google Scholar] [CrossRef]
- Kulatilake, P.H.S.W.; Wang, L.; Tang, H.; Liang, Y. Evaluation of rock slope stability for Yujian River dam site by kinematic and block theory analyses. Comput. Geotech. 2011, 38, 846–860. [Google Scholar] [CrossRef]
- Fu, G.Y.; Ma, G.W. Extended key block analysis for support design of blocky rock mass. Tunn. Undergr. Space Technol. 2014, 41, 1–13. [Google Scholar] [CrossRef]
- Zheng, J.; Kulatilake, P.H.S.W.; Shu, B.; Sherizadeh, T.; Deng, J. Probabilistic block theory analysis for a rock slope at an open pit mine in USA. Comput. Geotech. 2014, 61, 254–265. [Google Scholar] [CrossRef]
- Carranza-Torres, C.; Fosnacht, D.; Hudak, G. Geomechanical analysis of the stability conditions of shallow cavities for compressed air energy storage (CAES) applications. Geomech. Geophys. Geo-Energy Geo-Resour. 2017. [Google Scholar] [CrossRef]
- Sun, G.; Zheng, H.; Huang, Y. Stability analysis of statically indeterminate blocks in key block theory and application to rock slope in Jinping-I hydropower station. Eng. Geol. 2015, 186, 57–67. [Google Scholar] [CrossRef]
- Sun, G.; Cheng, S.; Jiang, W.; Zheng, H. A global procedure for stability analysis of slopes based on the morgenstern-price assumption and its applications. Comput. Geotech. 2016, 80, 97–106. [Google Scholar] [CrossRef]
- Windsor, C.R.; Thompson, A.G. Reinforcement design for jointed rock mass. In Proceedings of the 33rd U.S. Symposuim on Rock Mechanics, Santa Fe, NM, USA, 8–10 June 1992; pp. 521–530. [Google Scholar]
- Thompson, A.G.; Windsor, C.R. Block formation around excavations using deterministic and probabilistic methods. In Proceedings of the 11th ISRM Congress on Rock Mechanics, Lisbon, Portugal, 9–13 July 2007; pp. 183–186. [Google Scholar]
- Windsor, C.R. Rock reinforcement systems. Int. J. Rock Mech. Min. Sci. 1997, 34, 919–951. [Google Scholar] [CrossRef]
- Thompson, A.G. Stability assessment and reinforcement of block assemblies near underground excavations. In Proceedings of the 5th North American Rock Mechanics Symposium and the 17th Tunnelling Association of Canada Conference, Toronto, ON, Canada, 7–10 July 2002; pp. 1439–1446. [Google Scholar]
- González-Palacio, C.; Menéndez-Díaz, A.; Álvarez-Vigil, A.E.; González-Nicieza, C. Identification of non-pyramidal key blocks in jointed rock masses for tunnel excavation. Comput. Geotech. 2005, 32, 179–200. [Google Scholar] [CrossRef]
- Ministry of Construction of the People’s Republic of China. Chinese National Code for Geotechnical Investigation (GB 50021-2001); Ministry of Construction of the People’s Republic of China: Beijing, China, 2002.
- Lian, M.Y. Stability Analysis of Jointed Rock Mass in the Plant Area of Taishan Pumped Storage Power Station. Master’s Thesis, Shandong University, Jinan, China, 2016. (In Chinese). [Google Scholar]
- Zhu, W.S.; Li, S.C.; Chen, W.Z. Failure Mechanism and Anchorage Effect of Jointed Rock Mass and Engineering Application; Science Press: Beijing, China, 2002; pp. 99–110. [Google Scholar]
Figure 1.
Vector analysis of the probabilistic blocks: (a) Stable block; (b) Free falling block; (c) Sliding along one face; and (d) Double plane sliding.
Figure 1.
Vector analysis of the probabilistic blocks: (a) Stable block; (b) Free falling block; (c) Sliding along one face; and (d) Double plane sliding.
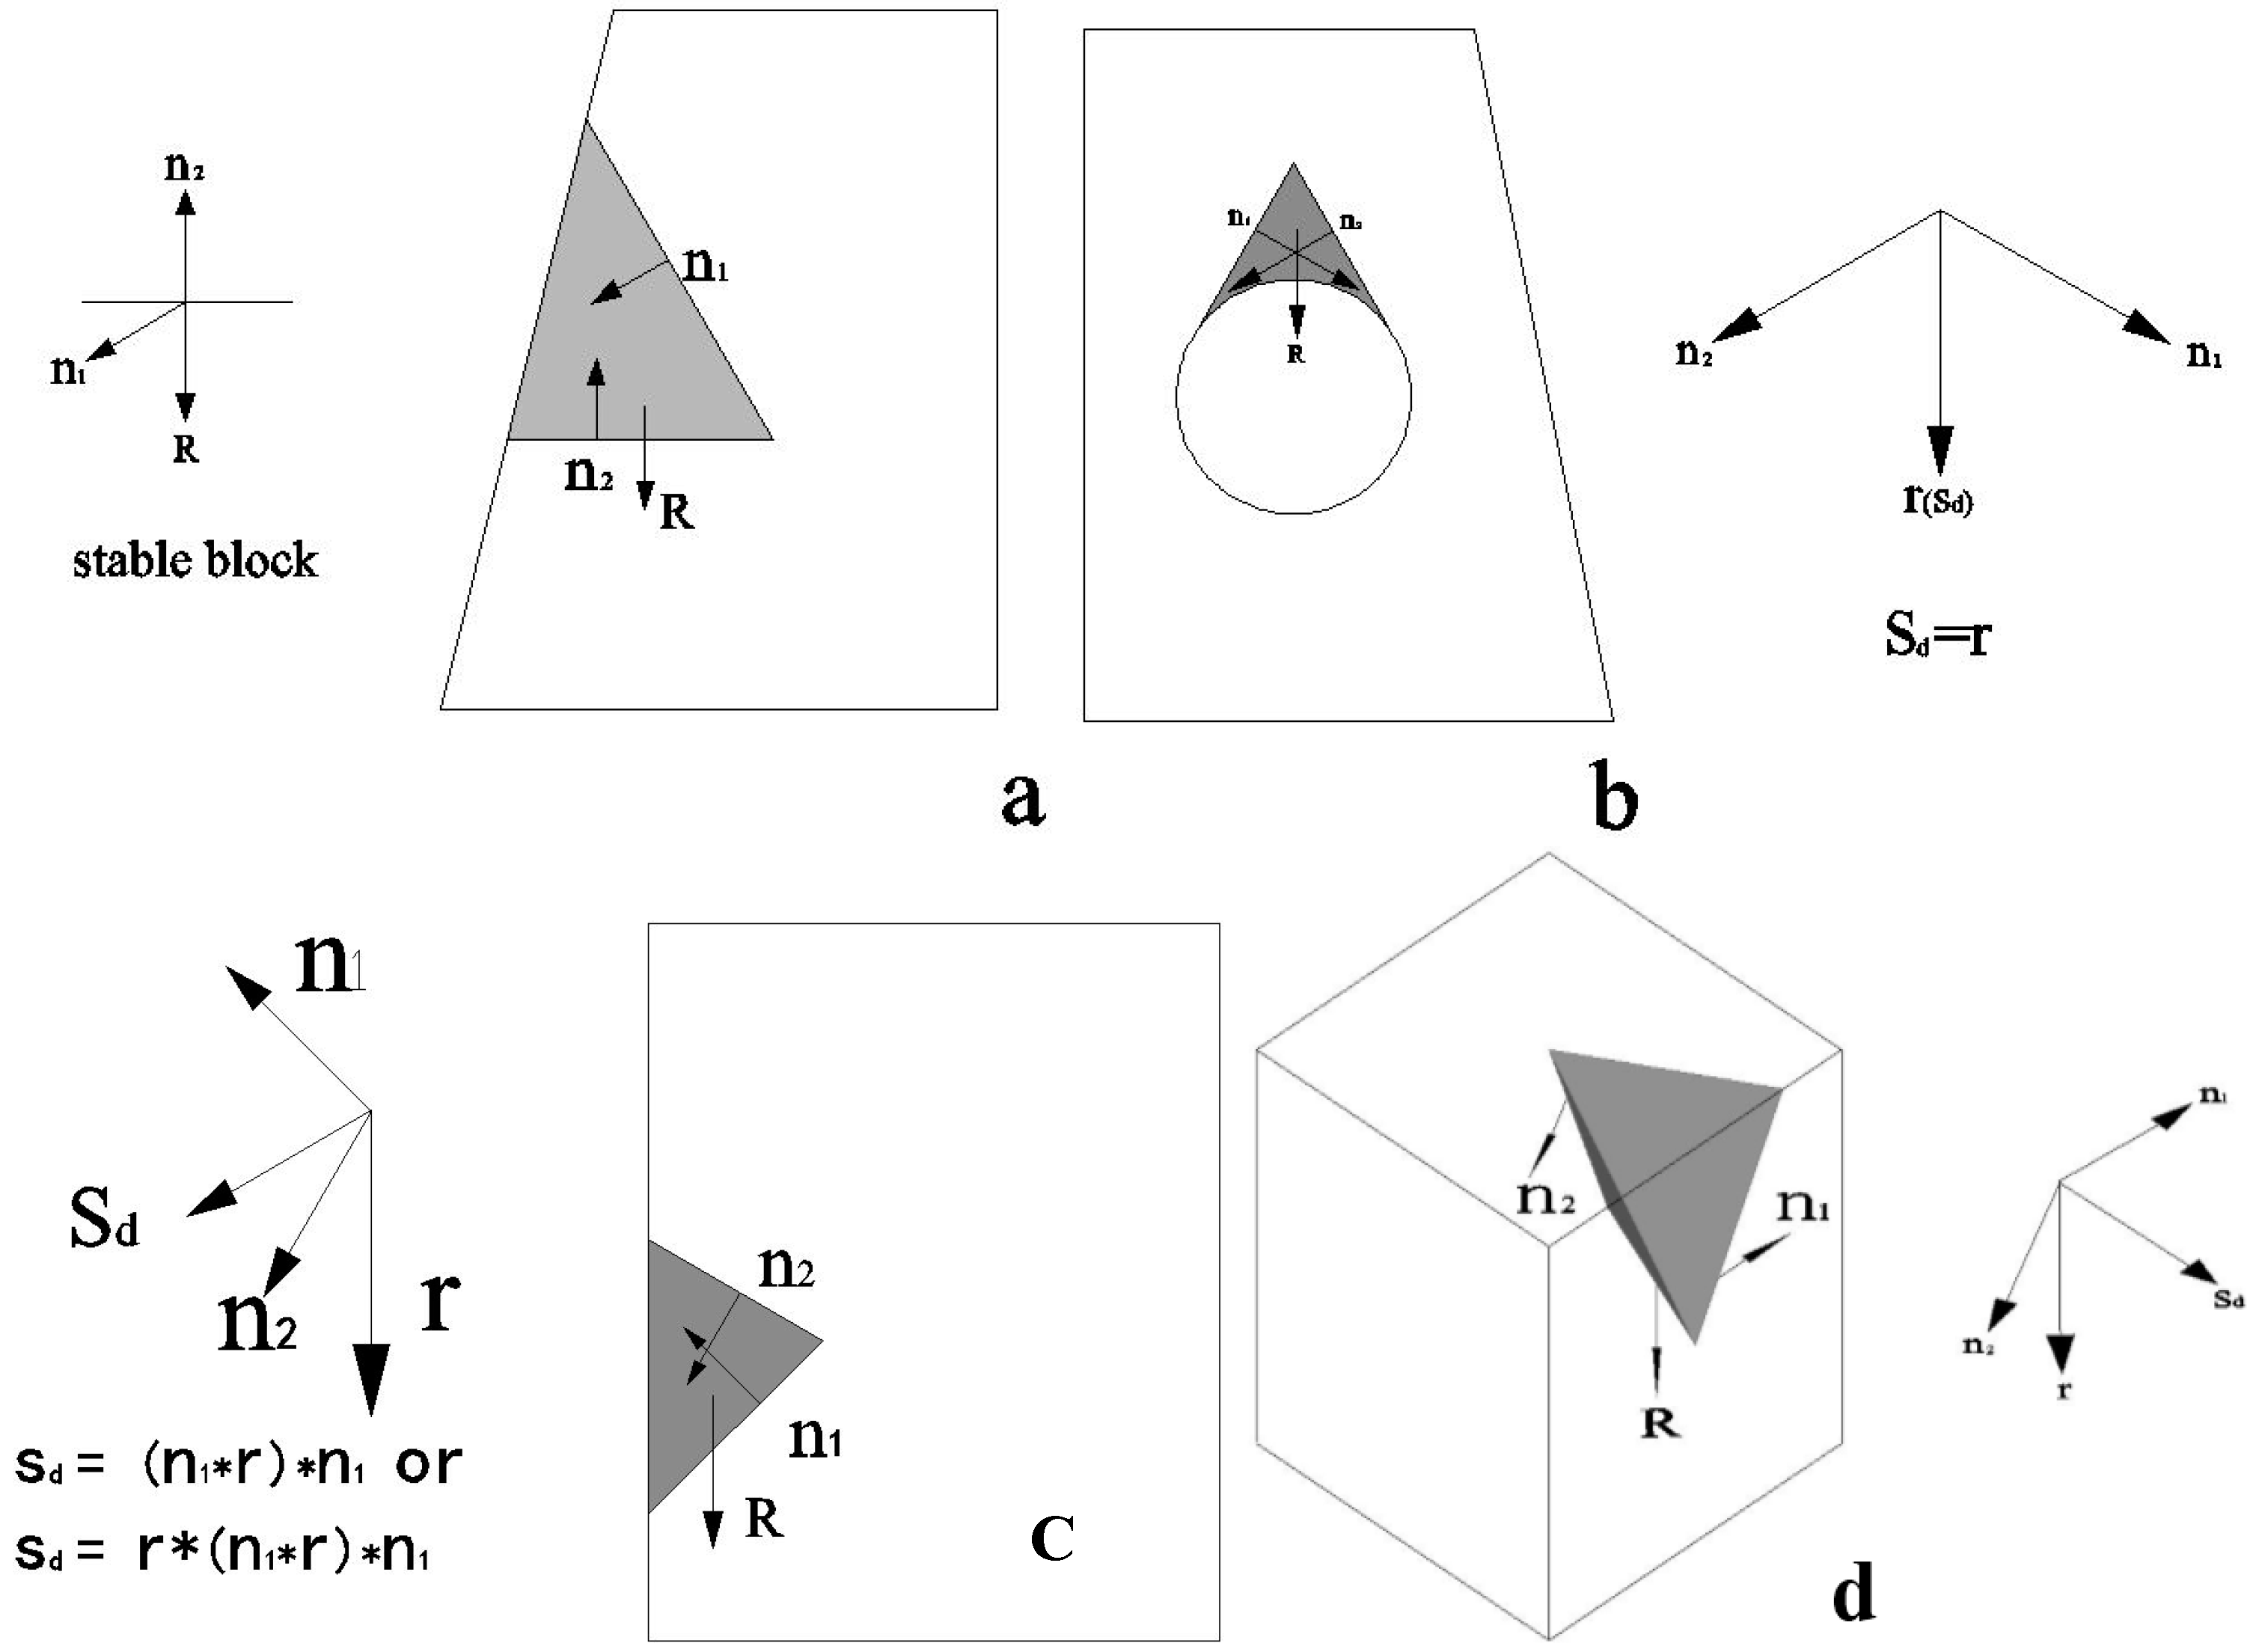
Figure 2.
A sketch map for a two-dimensional condition of the force transfer algorithm in key blocks.
Figure 2.
A sketch map for a two-dimensional condition of the force transfer algorithm in key blocks.
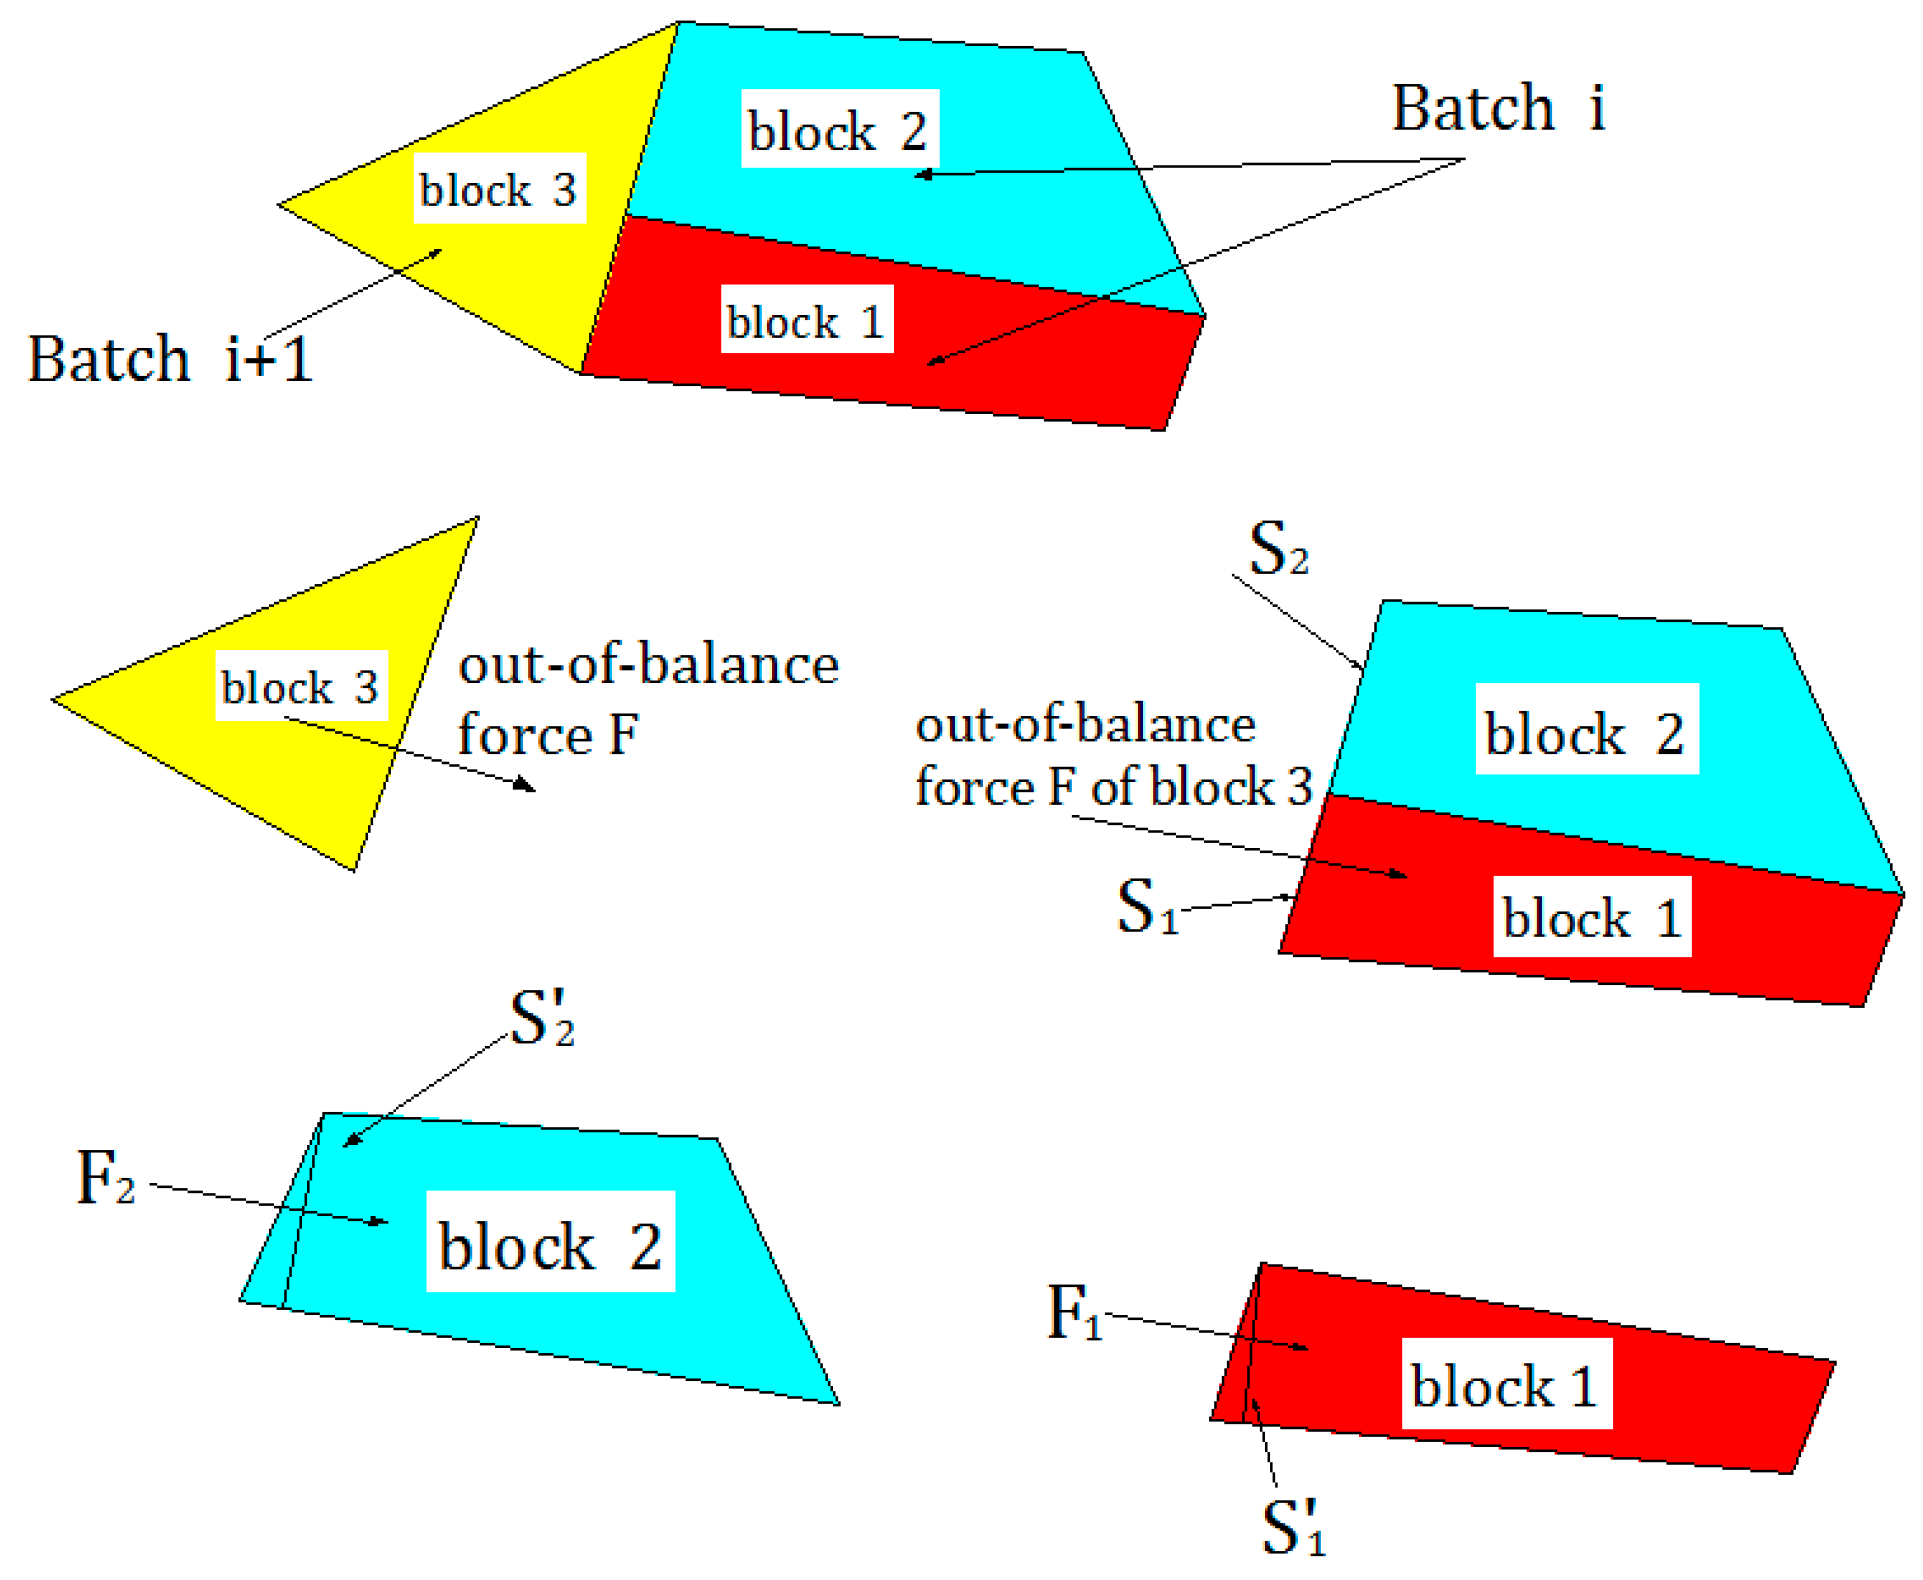
Figure 3.
A flowchart for the detailed procedure of the methodology for the stability analysis on extended KBT.
Figure 3.
A flowchart for the detailed procedure of the methodology for the stability analysis on extended KBT.

Figure 4.
Layout diagram of the Taishan pumped-storage hydropower station.

Figure 5.
Stereographic projection of the joints.
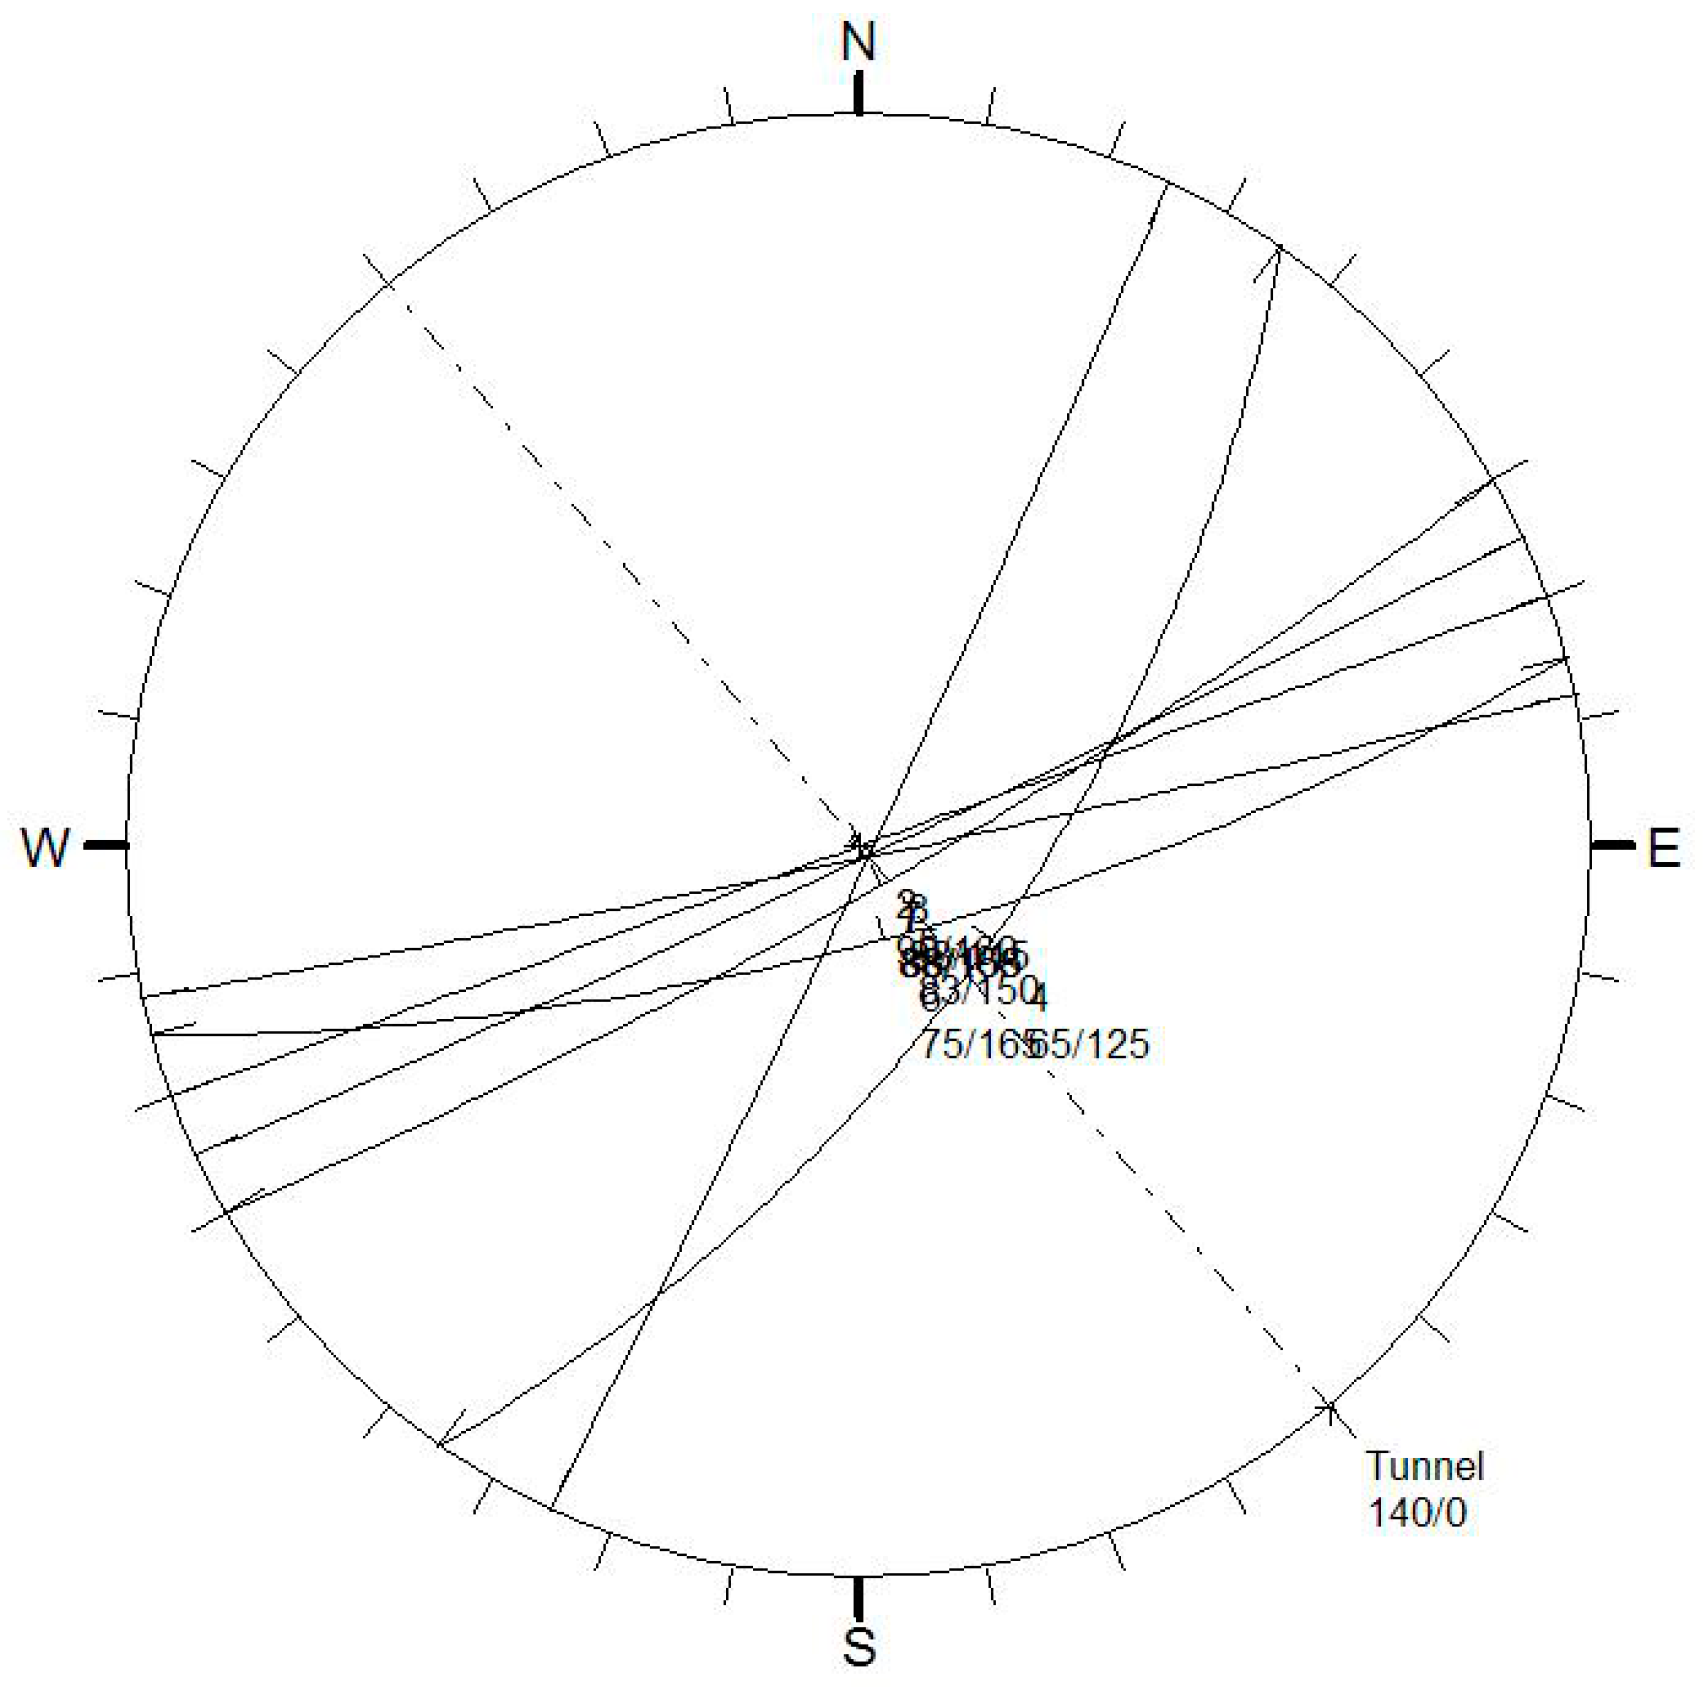
Figure 6.
Failure probability analysis in planar sliding: (a) Failure probability when the average dip direction is 58°;(b) Failure probability when the mode dip direction is 70°; and (c) Failure probability at the most critical dip direction.
Figure 6.
Failure probability analysis in planar sliding: (a) Failure probability when the average dip direction is 58°;(b) Failure probability when the mode dip direction is 70°; and (c) Failure probability at the most critical dip direction.

Figure 7.
Probability analysis of five typical failure modes.
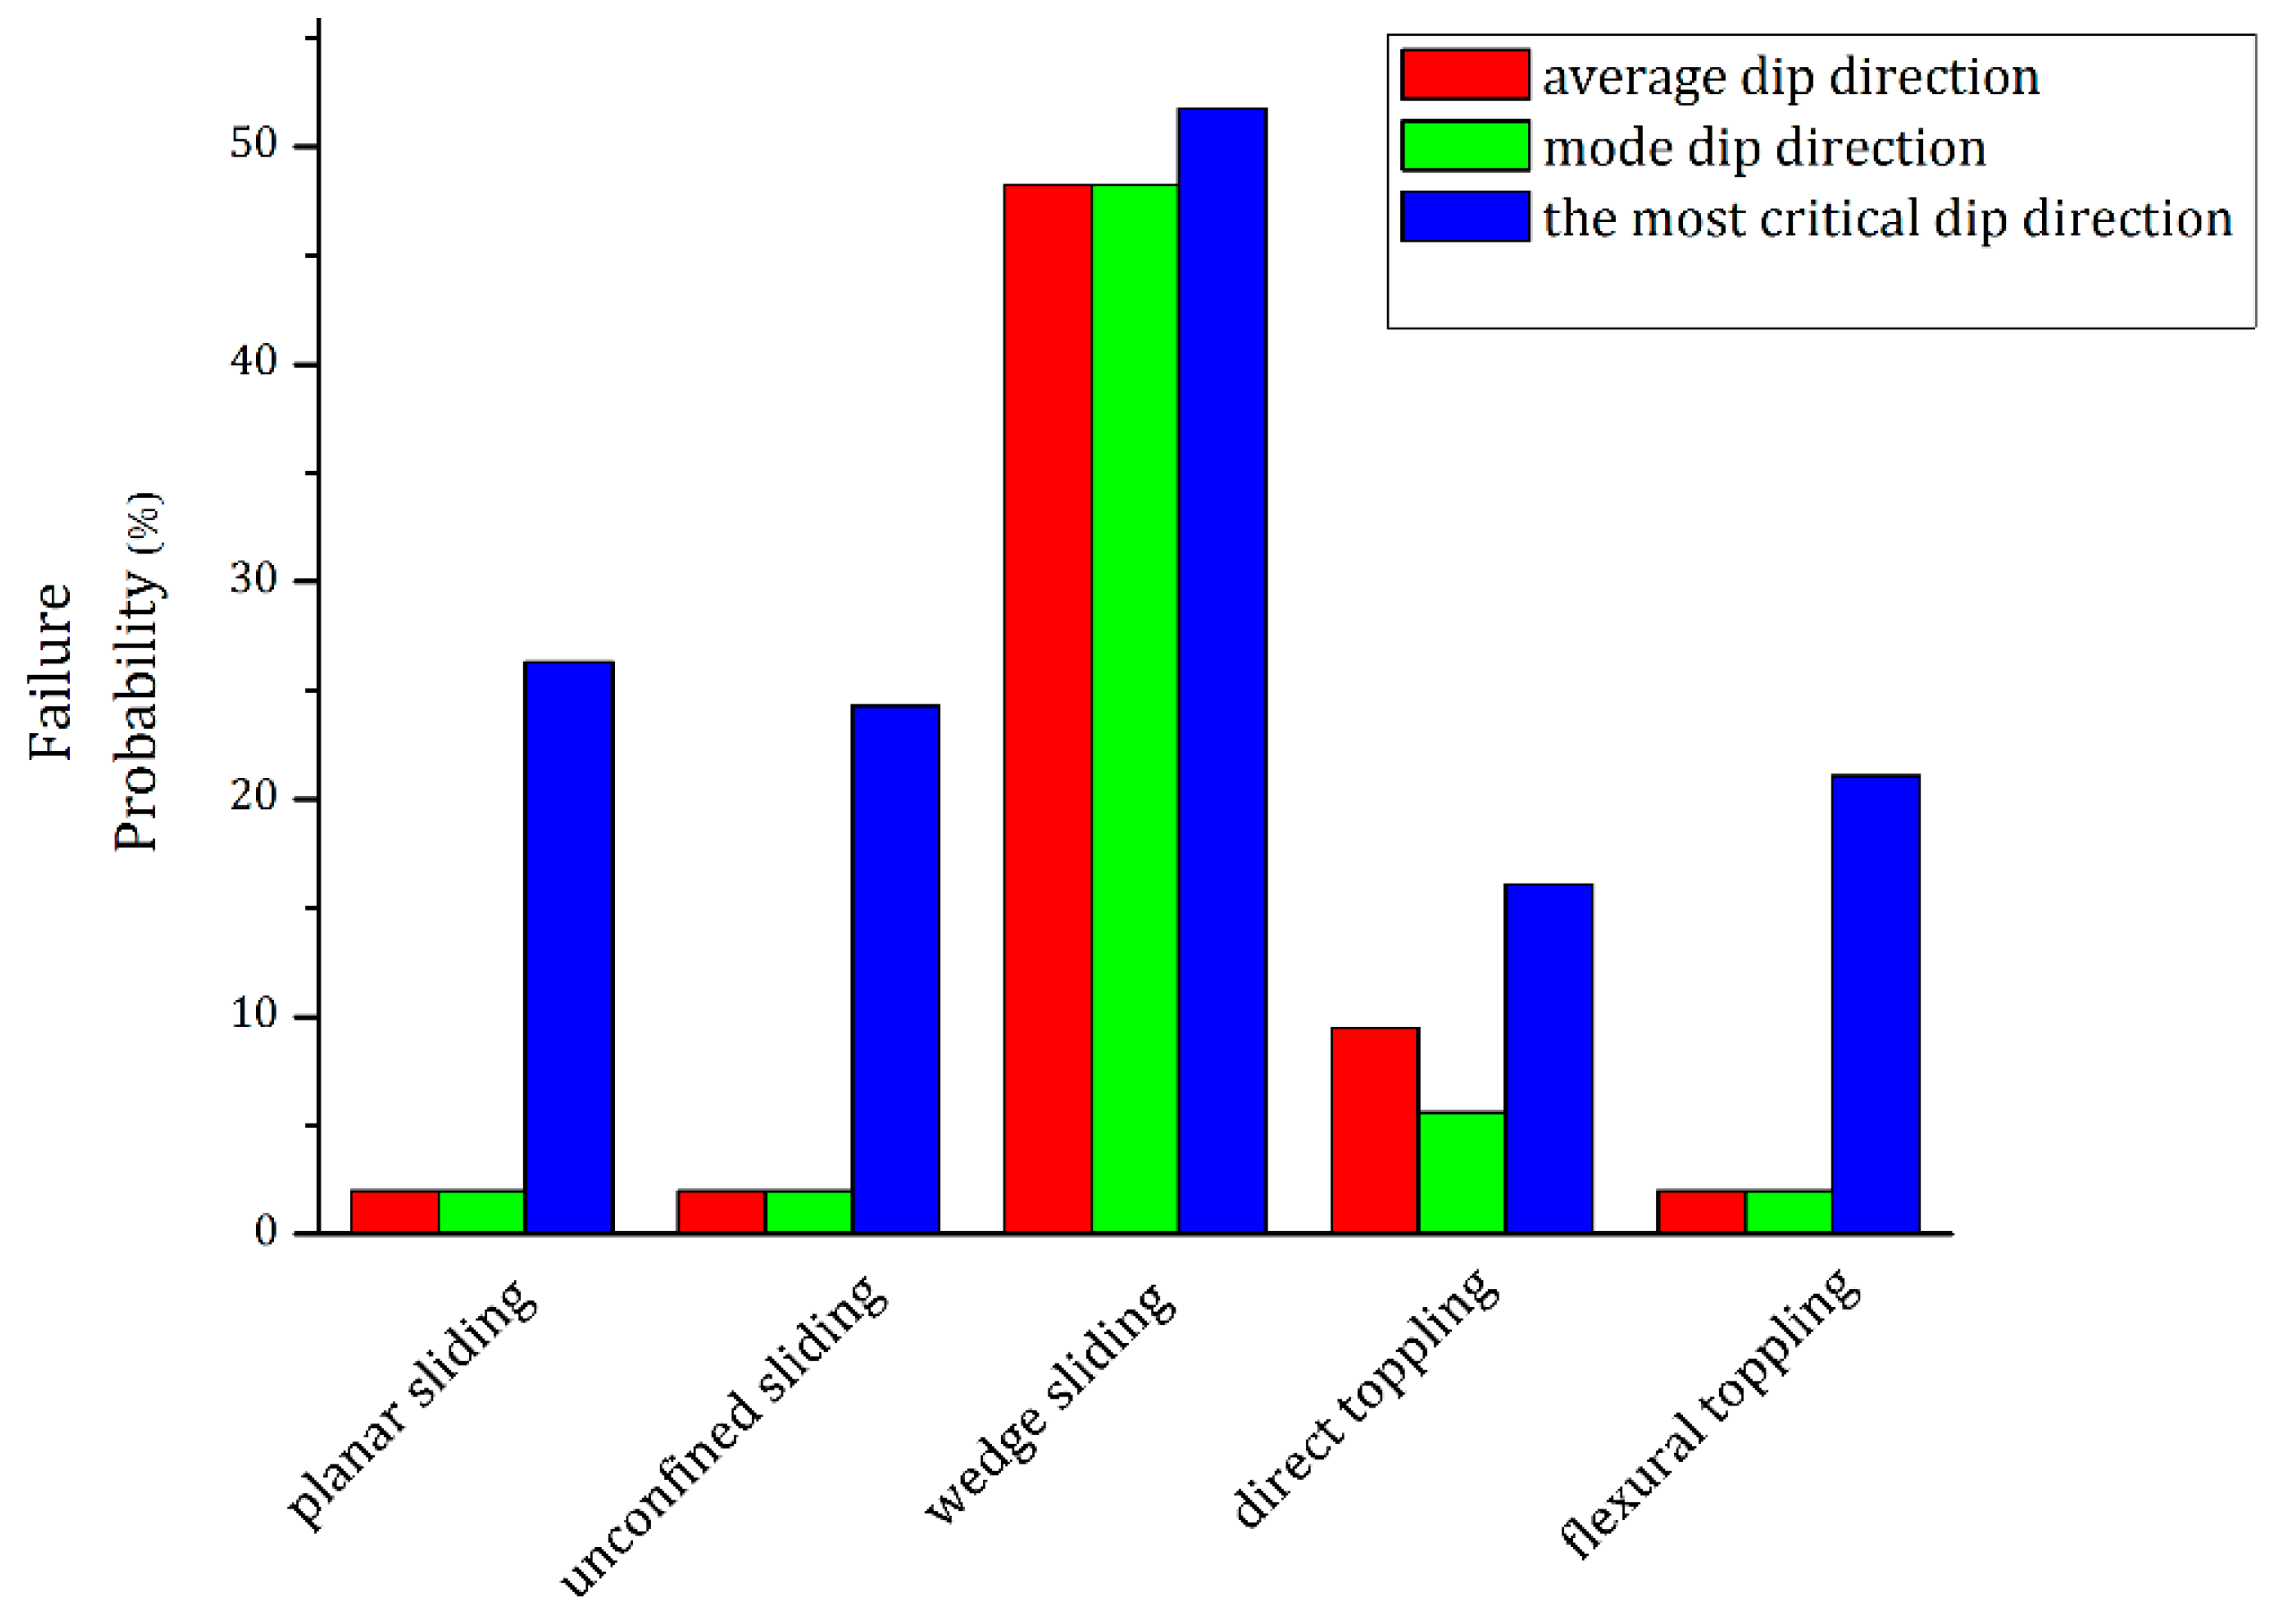
Figure 8.
The dimensions of the main powerhouse (Unit: m).
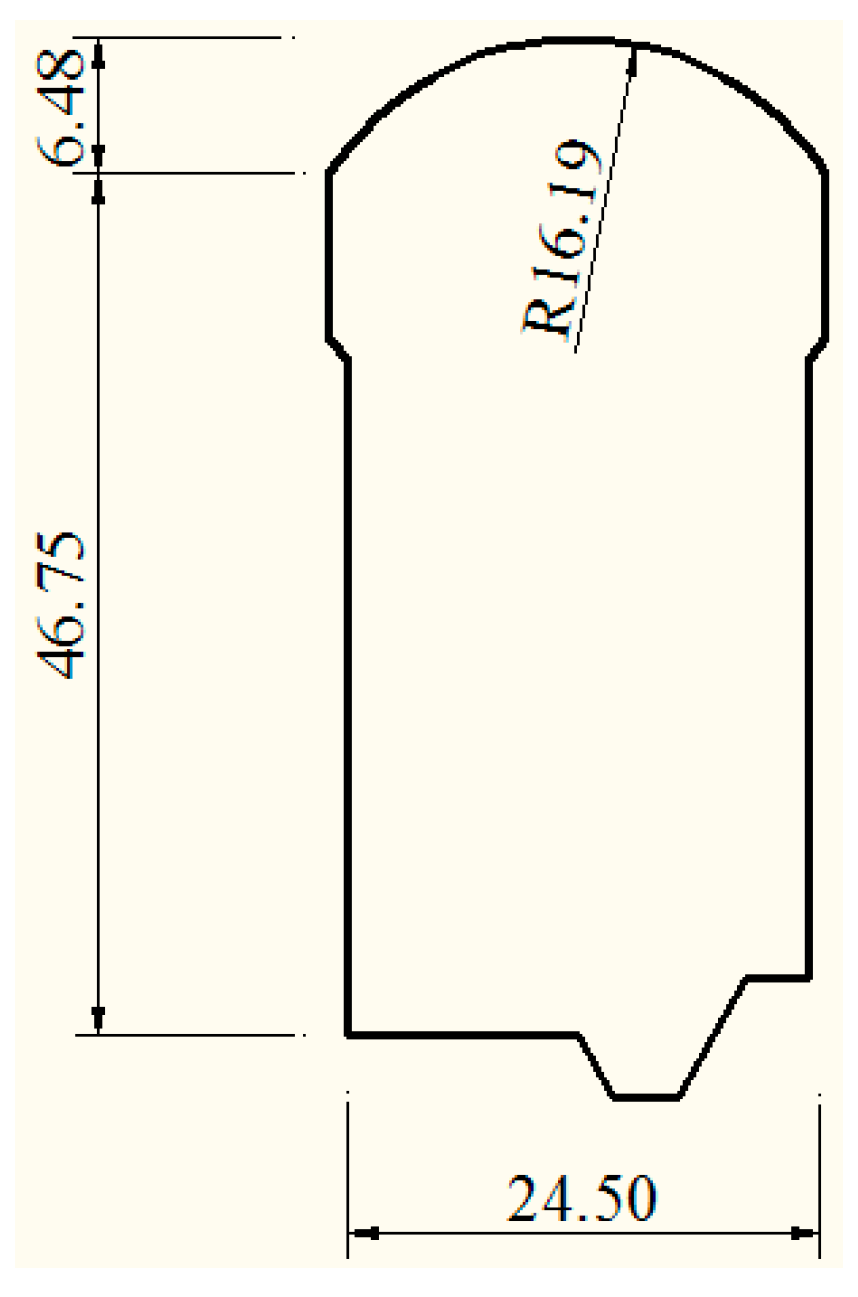
Figure 9.
Search of key blocks and calculations of safety factors: (a) The key blocks in the arch crown; (b) The key blocks in the upstream side wall; (c) The key blocks in the downstream side wall; and (d) The key blocks in the bottom floor.
Figure 9.
Search of key blocks and calculations of safety factors: (a) The key blocks in the arch crown; (b) The key blocks in the upstream side wall; (c) The key blocks in the downstream side wall; and (d) The key blocks in the bottom floor.
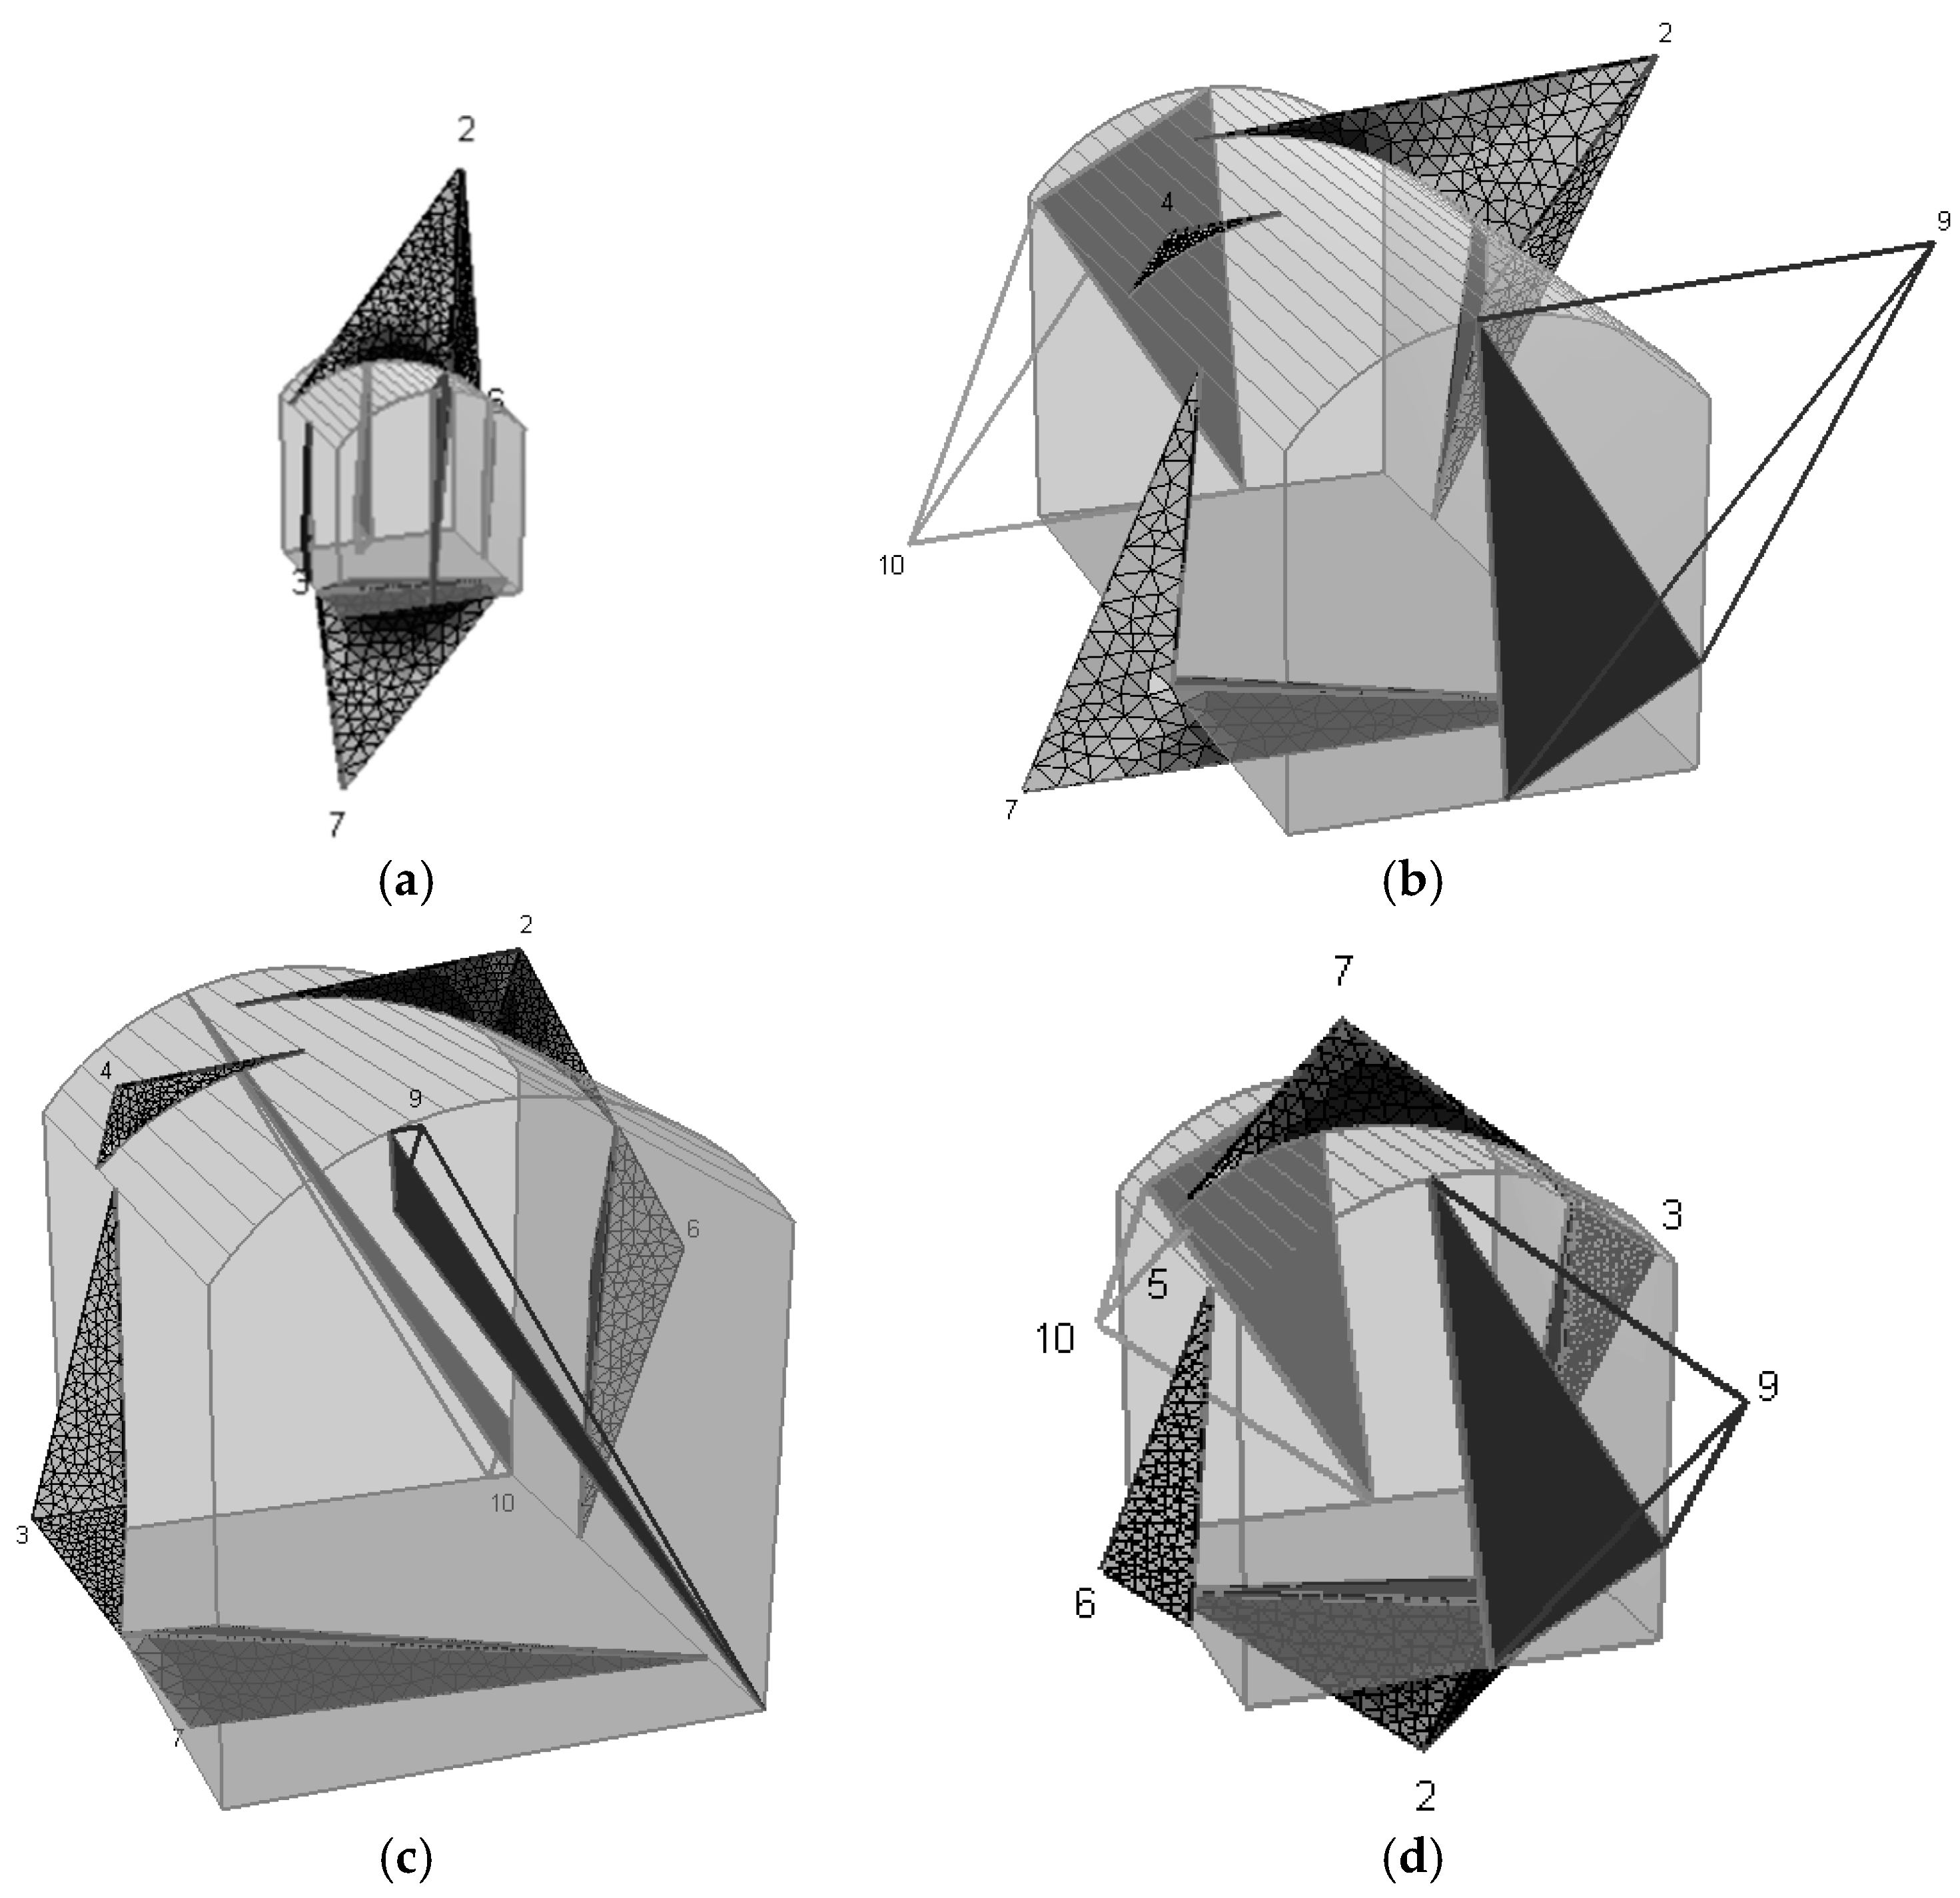
Figure 10.
Cumulative frequency curves: (a) The buried depths of the key blocks; (b) The volumes of the key blocks; and (c) The safety factors of the blocks need to be supported.
Figure 10.
Cumulative frequency curves: (a) The buried depths of the key blocks; (b) The volumes of the key blocks; and (c) The safety factors of the blocks need to be supported.
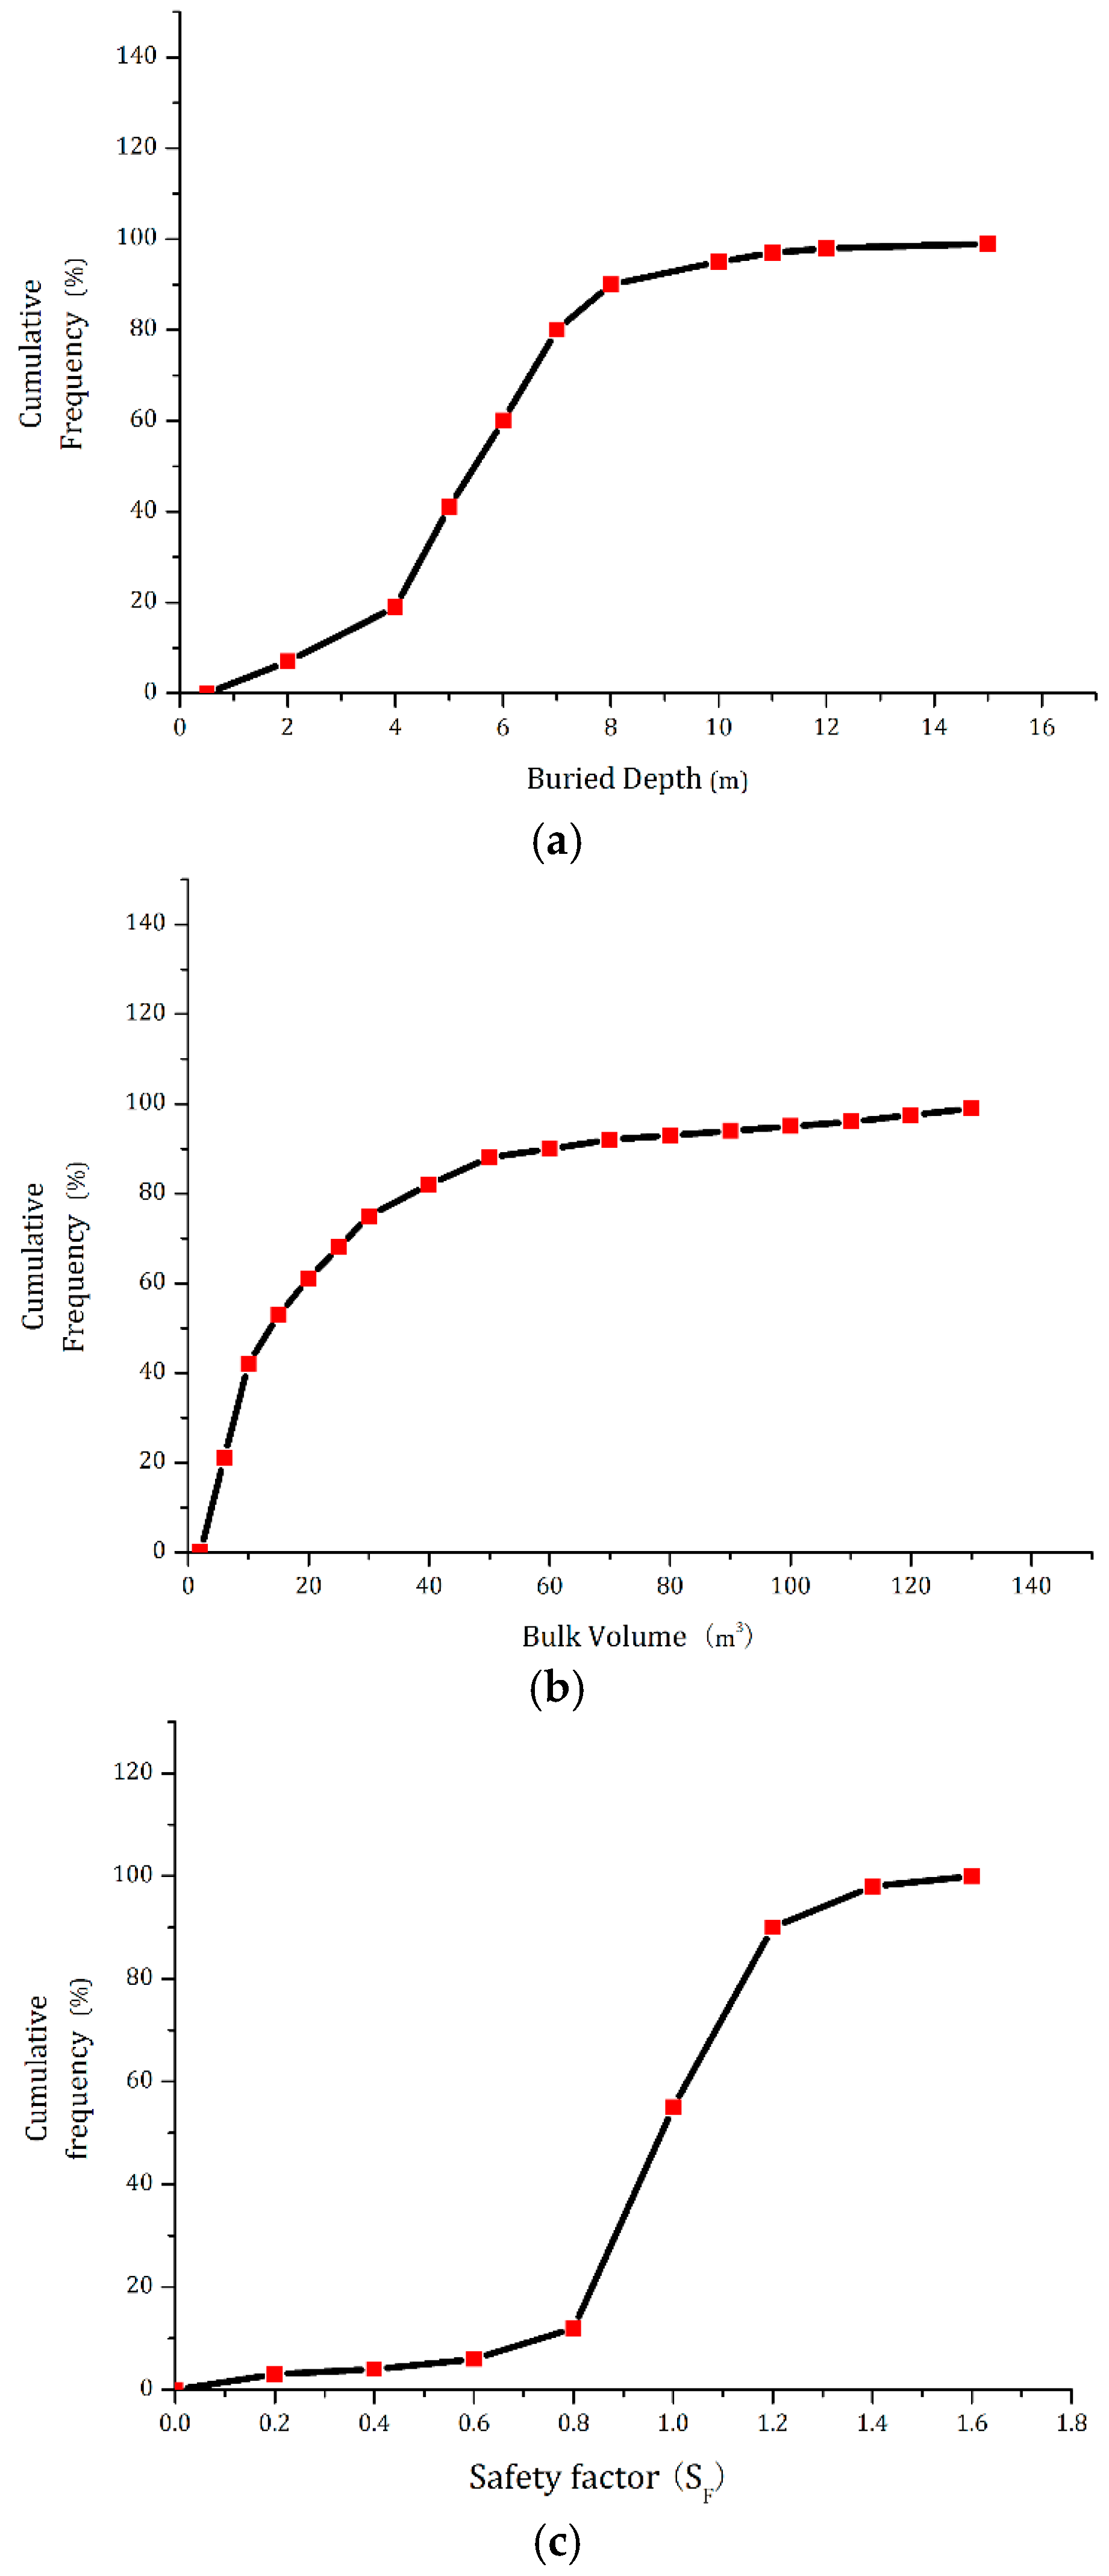
Figure 11.
Safety factors of some typical key blocks before force transfer and after force transfer.
Figure 11.
Safety factors of some typical key blocks before force transfer and after force transfer.
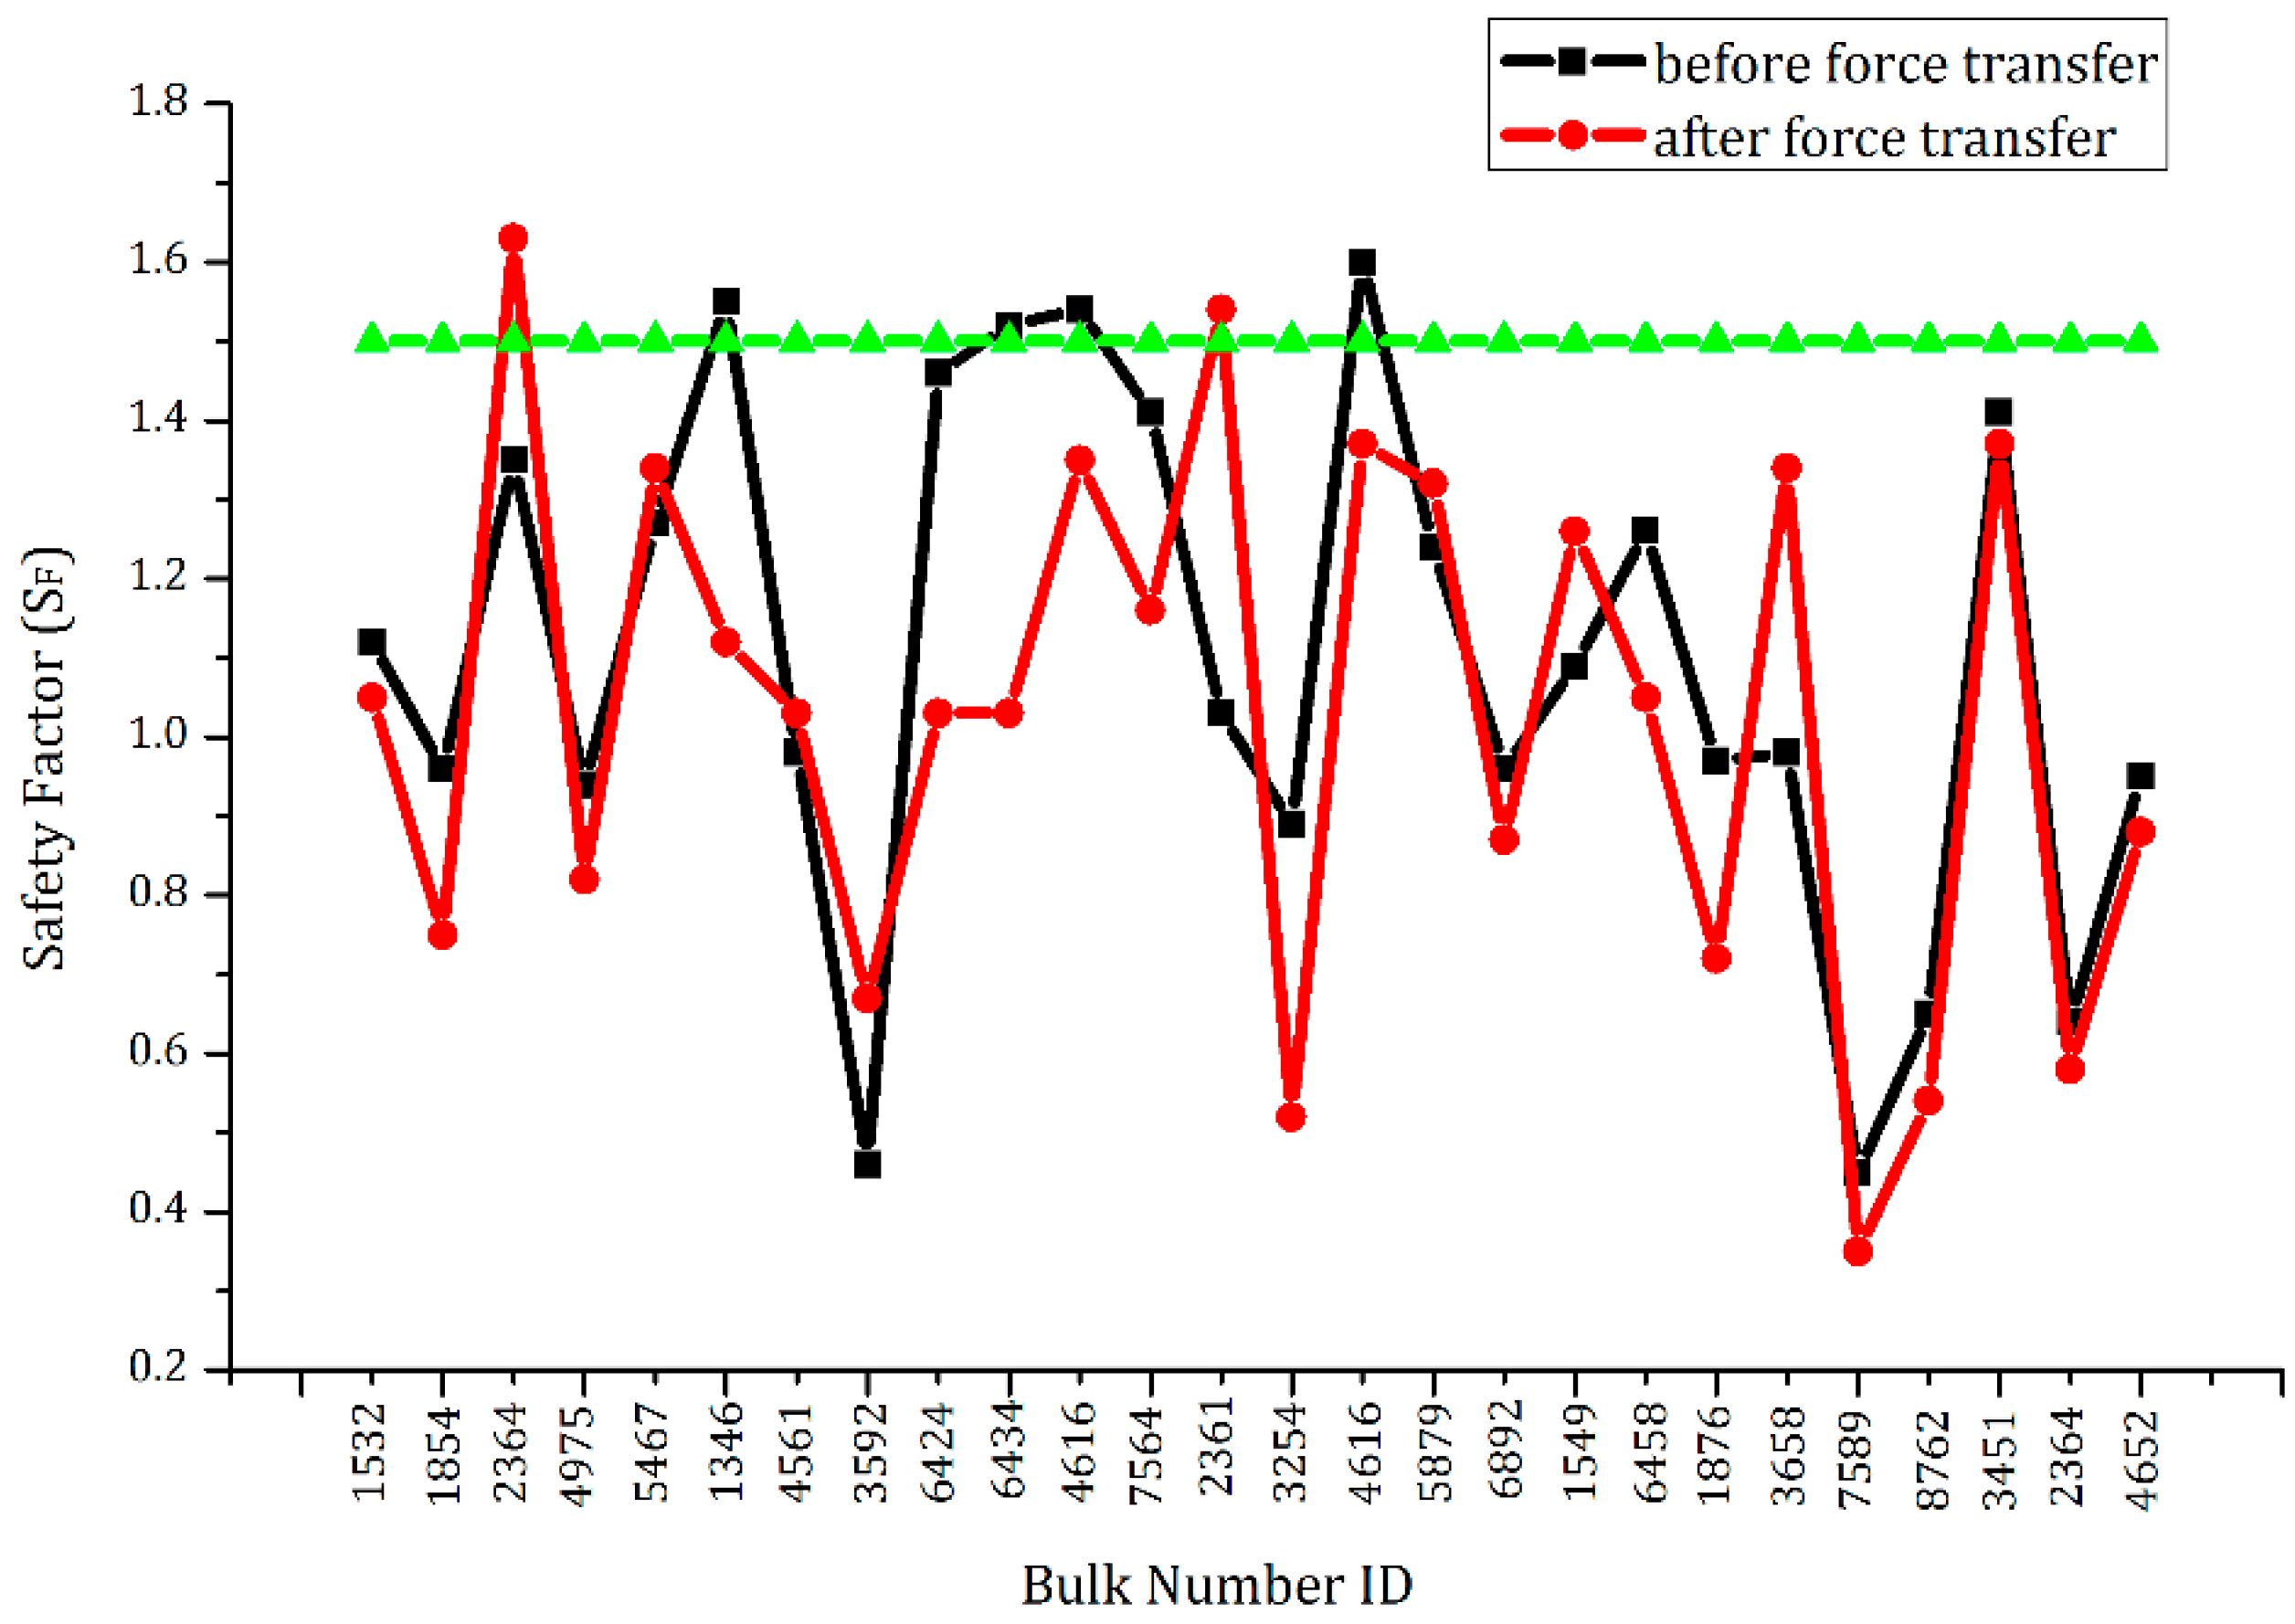
Figure 12.
A cross-sectional drawing for the supporting design of the main powerhouse.

Figure 13.
The supporting scheme of rock bolts and sprayed concrete lining and effectiveness verifications: (a) The key blocks in the arch crown; (b) The key blocks in the upstream side wall; (c) The key blocks in the bottom floor; and (d) The key blocks in the downstream side wall.
Figure 13.
The supporting scheme of rock bolts and sprayed concrete lining and effectiveness verifications: (a) The key blocks in the arch crown; (b) The key blocks in the upstream side wall; (c) The key blocks in the bottom floor; and (d) The key blocks in the downstream side wall.

Table 1.
Statistical results on the occurrences of concentrated joint bands.
| Group Number | Types of Dip Angle | Occurrences | Trace Length (m) | Spacing (cm) | Percentage (%) |
|---|---|---|---|---|---|
| Jm1 | High dip angle | N80–90° E SE∠85–90° | 2.2–34 | 5–20 | 34 |
| Jm2 | High dip angle | N75–85° E⊥ | 3.1–4.6 | 2–5 | 16 |
| Jm3 | High dip angle | N60–80° E SE∠85–90° | 2.8–5.6 | 2–20 | 23 |
| Jm4 | Medium dip angle | N60–80° E SE∠50–60° | 6.3–8.7 | 5–15 | 36 |
| Jm5 | High dip angle | N30° E⊥ | 6.7–9.6 | 5–30 | 18 |
Table 2.
Statistical results of joint generalization.
| Occurrences | Probability Distribution | Mean Value | Standard Deviation |
|---|---|---|---|
| Dip direction (°) | Lognormal | 135.6 | 4.31 |
| Dip angle (°) | Normal | 85.2 | 3.56 |
| Spacing (cm) | Negative exponential distribution | 7.5 | 1.24 |
| Trace length (m) | Normal | 5.7 | 2.03 |
Table 3.
The most critical dip direction angles under five typical failure modes.
| The Most Critical Dip Direction | Planar Sliding | Unconfined Planar Sliding | Wedge Sliding | Direct Toppling | Flexural Toppling |
|---|---|---|---|---|---|
| Angles | 110–140° | 110–140° | 35–120° | 240–265° | 335–345° |
Table 4.
Physico-mechanical parameters of jointed rock mass and the structural plane.
| Rock Type | Density (kN/m3) | Elastic Modulus (GPa) | Poisson’s Ratio | Uniaxial Compressive Strength (MPa) | Friction Coefficient | Cohesion (MPa) |
|---|---|---|---|---|---|---|
| Rock mass | 25.8–27.4 | 13.2–15.5 | 0.25 | 196–200 | 0.83–0.97 | 0.7–1.0 |
| Structural plane | 24.3–25.6 | 3.2–4.3 | 0.30 | N/A | 0.56–0.64 | 3.5–4.1 |
Table 5.
Effectiveness evaluations of rock bolts and sprayed concrete lining, the supporting forces, and safety factors of the key blocks.
Table 5.
Effectiveness evaluations of rock bolts and sprayed concrete lining, the supporting forces, and safety factors of the key blocks.
| ID Number | Safety Factors before Supporting | Required Supporting (kN/m2) | Supporting Force of Rock Bolts and Shotcrete (kN/m2) | Safety Factors after Supporting | Increase Ratio in Safety Factor (%) |
|---|---|---|---|---|---|
| 3204 | 0.86 | 8.46 | 34.27 | 3.49 | 305.28 |
| 3206 | 1.12 | 6.60 | 34.27 | 5.81 | 418.99 |
| 3218 | 0.97 | 5.72 | 34.27 | 5.48 | 498.96 |
| 3216 | 1.41 | 8.10 | 34.27 | 5.97 | 323.34 |
| 3225 | 0.98 | 5.26 | 34.27 | 6.39 | 551.55 |
| 3227 | 1.07 | 10.13 | 34.27 | 3.62 | 238.21 |
| 3229 | 1.11 | 10.46 | 34.27 | 3.64 | 227.74 |
| 3238 | 0.89 | 7.07 | 34.27 | 4.32 | 385.07 |
| 3247 | 1.14 | 10.83 | 34.27 | 3.61 | 216.47 |
| 3250 | 0.96 | 11.84 | 34.27 | 2.78 | 189.48 |
| 3255 | 1.05 | 11.31 | 34.27 | 3.18 | 203.03 |
| 3258 | 0.86 | 9.30 | 34.27 | 3.17 | 268.55 |
| 3269 | 1.18 | 10.86 | 34.27 | 3.72 | 215.61 |
| 3271 | 0.73 | 9.35 | 34.27 | 2.54 | 247.40 |
| 3277 | 1.03 | 7.58 | 34.27 | 3.11 | 202.24 |
| 3283 | 1.14 | 4.59 | 34.27 | 2.25 | 360.78 |
| 3294 | 0.95 | 8.76 | 34.27 | 2.62 | 175.84 |
| 3297 | 1.39 | 7.65 | 34.27 | 6.18 | 345.47 |
© 2017 by the authors. Licensee MDPI, Basel, Switzerland. This article is an open access article distributed under the terms and conditions of the Creative Commons Attribution (CC BY) license (http://creativecommons.org/licenses/by/4.0/).
Share and Cite
MDPI and ACS Style
Jia, C.; Li, Y.; Lian, M.; Zhou, X. Jointed Surrounding Rock Mass Stability Analysis on an Underground Cavern in a Hydropower Station Based on the Extended Key Block Theory. Energies 2017, 10, 563. https://doi.org/10.3390/en10040563
AMA Style
Jia C, Li Y, Lian M, Zhou X. Jointed Surrounding Rock Mass Stability Analysis on an Underground Cavern in a Hydropower Station Based on the Extended Key Block Theory. Energies. 2017; 10(4):563. https://doi.org/10.3390/en10040563
Chicago/Turabian StyleJia, Chao, Yong Li, Mingyuan Lian, and Xiaoyong Zhou. 2017. "Jointed Surrounding Rock Mass Stability Analysis on an Underground Cavern in a Hydropower Station Based on the Extended Key Block Theory" Energies 10, no. 4: 563. https://doi.org/10.3390/en10040563
Note that from the first issue of 2016, this journal uses article numbers instead of page numbers. See further details here.