
PTC Self-Heating Experiments and Thermal Modeling of Lithium-Ion Battery Pack in Electric Vehicles

1
National Engineering Laboratory for Electric Vehicles, Beijing Institute of Technology, Beijing 100081, China
2
Collaborative Innovation Center of Electric Vehicles in Beijing, Beijing Institute of Technology, Beijing 100081, China
*
Author to whom correspondence should be addressed.
Energies 2017, 10(4), 572; https://doi.org/10.3390/en10040572
Submission received: 10 March 2017
/
Revised: 18 April 2017
/
Accepted: 18 April 2017
/
Published: 22 April 2017
(This article belongs to the Special Issue Advanced Energy Storage Technologies and Their Applications (AESA))
Abstract
:This paper proposes a positive temperature coefficient (PTC) self-heating method, in which EVs can be operated independently of external power source at low temperature, with a lithium-ion battery (LIB) pack discharging electricity to provide PTC material with power. Three comparative heating experiments have been carried out respectively. With charge/discharge tests implemented, results demonstrate the superiority of the self-heating method, proving that the discharge capability, especially the discharge capacity of the self-heated pack is better than that of the external power heated pack. In order to evaluate the heating effect of this method, further studies are conducted on temperature distribution uniformity in the heated pack. Firstly, a geometric model is established, and heat-generation rate of PTC materials and LIB are calculated. Then, thermal characteristics of the self-heating experiment processes are numerically simulated, validating the accuracy of our modeling and confirming that temperature distributions inside the pack after heating are kept in good uniformity. Therefore, the PTC self-heating method is verified to have a significant effect on the improvement of performance of LIB at low temperature.
1. Introduction
Improving the performance of the Lithium-ion batteries (LIBs) at low temperature has become an urgent problem to be solved, since some problems may exist, such as dramatic decrease of discharge rate and serious degradation of discharge capacity [1,2], which may lead to shortened driving range, deteriorated dynamic performance, restricted feasibility and applicability for electric vehicles (EVs) [3]. One of the relatively feasible methods proved to be effective is heating the LIB pack [4,5,6,7,8].
Generally, two types of heating methods for LIB have been adopted: the external heating and the internal heating.
As for the researches on the external heating, Wang et al. [9] have put forward a battery bottom-heating method with a design of a bench test, and their experimental results verified the bottom-heating method could effectively improve discharge capacity of LIB pack. Based on charge-/discharge performance experiments on the heated cell, Zhang et al. [10] proved a method of wide-line metal film heating, which could be efficiently applied to enhance cell performances at low temperature. With a low-temperature-heating model for the cell established and a method of electro-thermal-film heater recommended, Cun-shan et al. [11] confirmed the practical efficacy of their method via simulations and experiments. On the basis of experiments on a convection heat transfer method, in which the battery pack was heated by using heated wires to transfer heat through the air, Wang et al. [12] found that the surface temperature of the battery pack could be increased from −15 °C to 0 °C after about 21 min of heating.
For the researches on the internal heating methods [13], Hand and Stuart [14,15,16,17,18] have proposed a method with which battery electrolyte be directly heated with Alternating Current(AC). However, they also warned that Direct Current (DC) should not be applied as it might generate a lot of gas inside and thus damage the battery. Zhang J. et al. [19] pointed out that within a certain scope, the higher the sine AC rose, the lower the frequency might be, and the more rapidly the battery temperature would be increased. Comparing the heat generation process of battery charge and discharge, Zhao et al. [20] proposed that LIB could be heated at low temperature by combining the large pulse discharge with the small pulse charging.
It can be deduced from the above research that the heating method with external resistance is to heat the battery via heat conduction. The battery heats up rapidly, while the size and weight of the battery pack may be increased. In the heating method with convective heat transfer, there are still some problems such as longer heating time, lower heat exchange efficiency, and poorer temperature uniformity inside the battery pack after heating. Even for a heating method that applies AC to a battery to heat it, problems still exist; for instance, the circuits used in the external heating are complex, and the impact of AC heating on battery life remains to be verified. Moreover, the heating methods discussed above are highly dependent on an external power supply, which will be an inconvenience for EVs. For example, when an external power supply is not available in a cold environment, EVs may not function normally at low temperatures.
To solve the above problems, a positive temperature coefficient (PTC) self-heating method is proposed in this paper. With this method, EVs can be operated independently of external power at low temperature, with the LIB pack being heated on its own when it discharges electricity to provide PTC material power. The main advantages of the method are: (1) Making full use of the PTC heat generation characteristics. Namely, when the temperature is low, and the PTC resistances are small, heating power will be increased. When the temperature rises to a certain extent, the PTC resistances increase sharply, and heating power will be reduced to avoid overheating the LIB pack. (2) Improving heating effects. In a low-temperature environment, as the LIB internal resistances rise, the heat generated by the resistances will also increase, which can be partially transferred directly within the LIB, thus further promoting the heating effects. Based on the PTC self-heating method, three comparative heating experiments, including an external power source heating experiment and two self-heating experiments, were carried out. With further tests on charge/discharge performance implemented, results reveal that the discharge performance of a self-heated battery is better than that of a pack heated by an external power source.
In order to evaluate the heating effectiveness of this method, further study has been conducted to examine temperature distribution uniformity of the heated LIB pack. The heat transfer of the external PTC materials and the internal heat of LIB are analyzed theoretically, and a geometric model is established. The thermal parameters of LIB are obtained, and the heat generation rate of the PTC materials and LIB are calculated with our experimental data. The thermal characteristics of the self-heating process are numerically simulated. With comparison of the simulation results and the experimental results, the accuracy of the modeling and simulation is verified. The results also demonstrate that temperature inside the LIB pack after heating is kept in good uniformity, which proves that this method has the advantage of improving heating effectiveness.
2. Experimental Method
2.1. Design of PTC Self-heating for LIB Pack
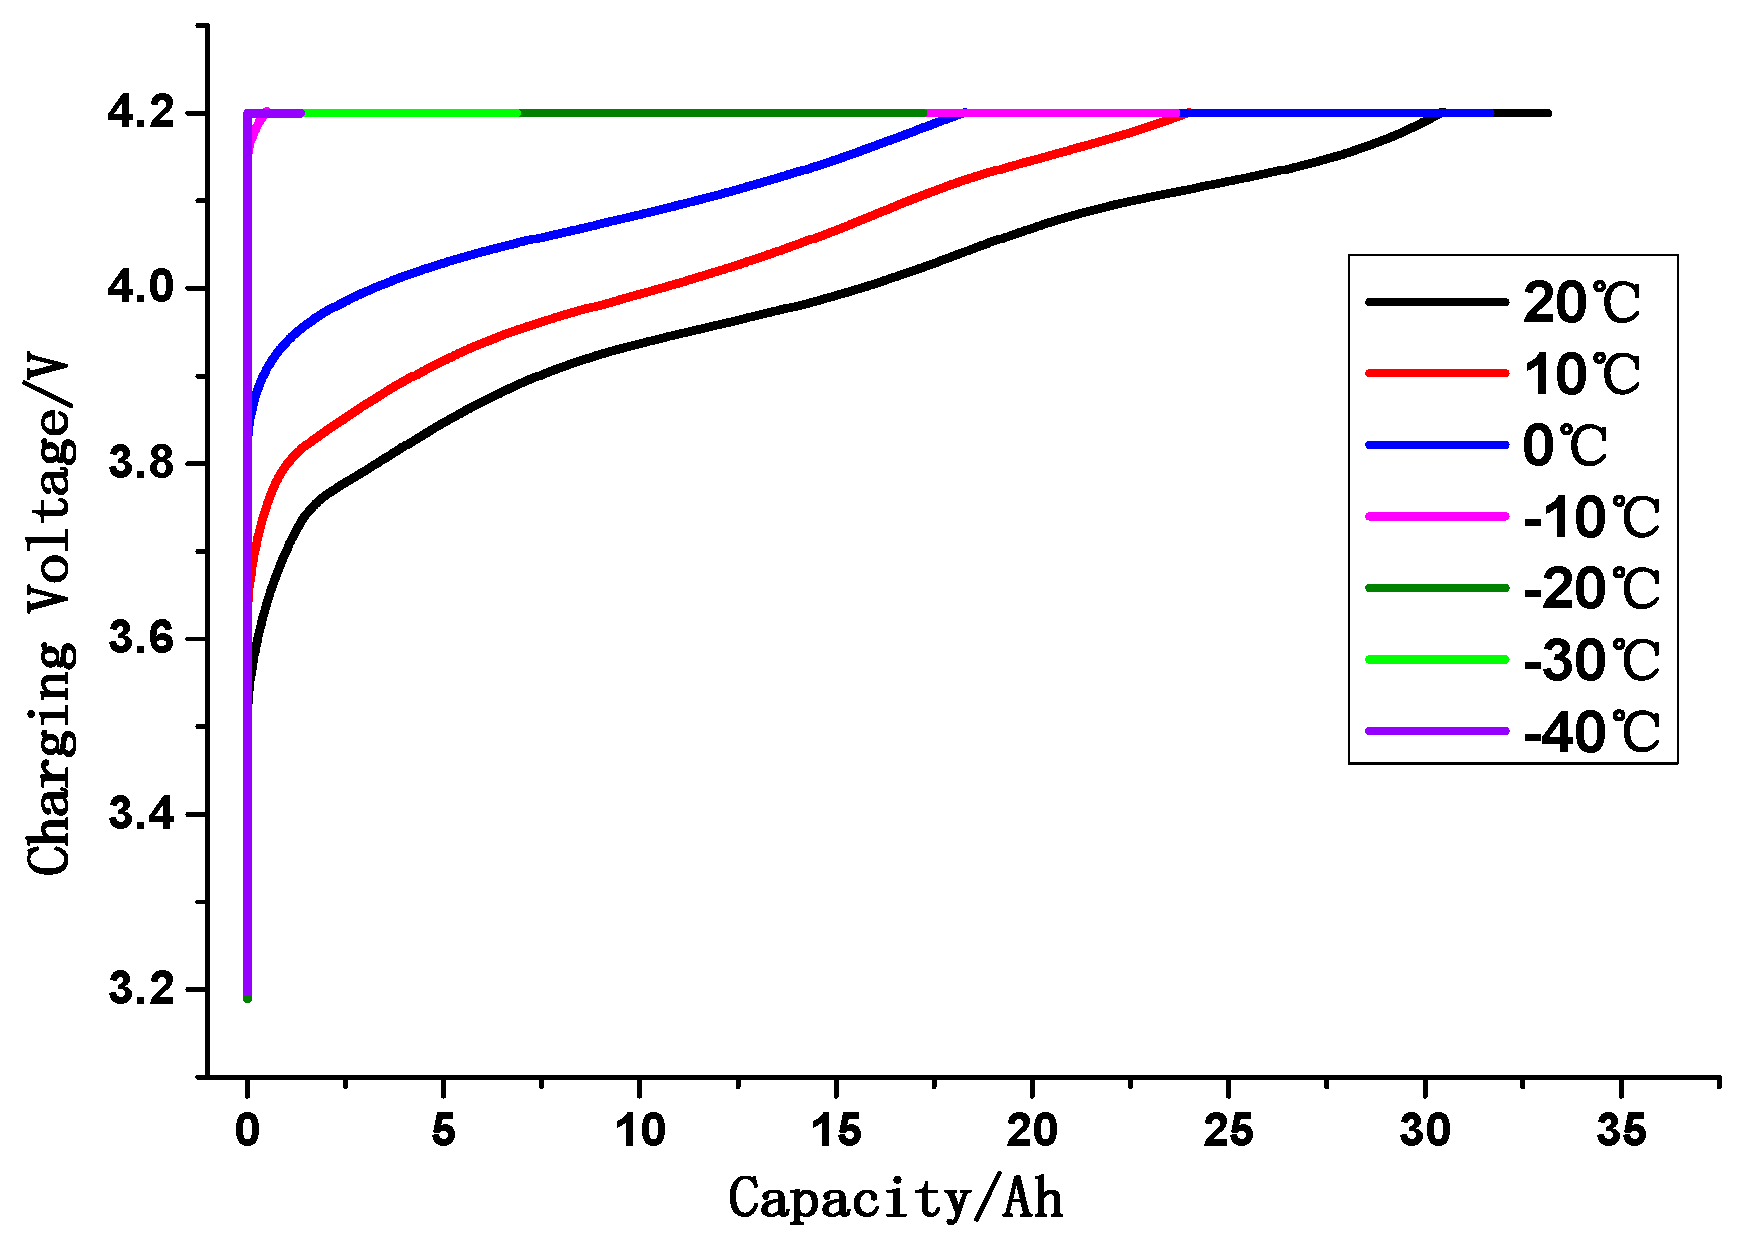
The LIB used in this paper is the 35Ah square aluminum-plastic-film LiMn2O4 cell, its basic parameters are specified in Table 1. When charged and discharged under different temperatures with different rates, its discharge capacity and 1C charge characteristics are shown in Table 2 and in Figure 1, respectively.
From the above results, it can be noted that with the decrease of temperature, the discharge capacity corresponding to the same discharge rate, will diminish, and the low-temperature charging performance is more obviously subject to temperature. The battery cannot be charged at a rate of 1C below −10 °C, which means it is very difficult to charge the battery in winter. Therefore, heating LIB at low temperature seems to be quite necessary.
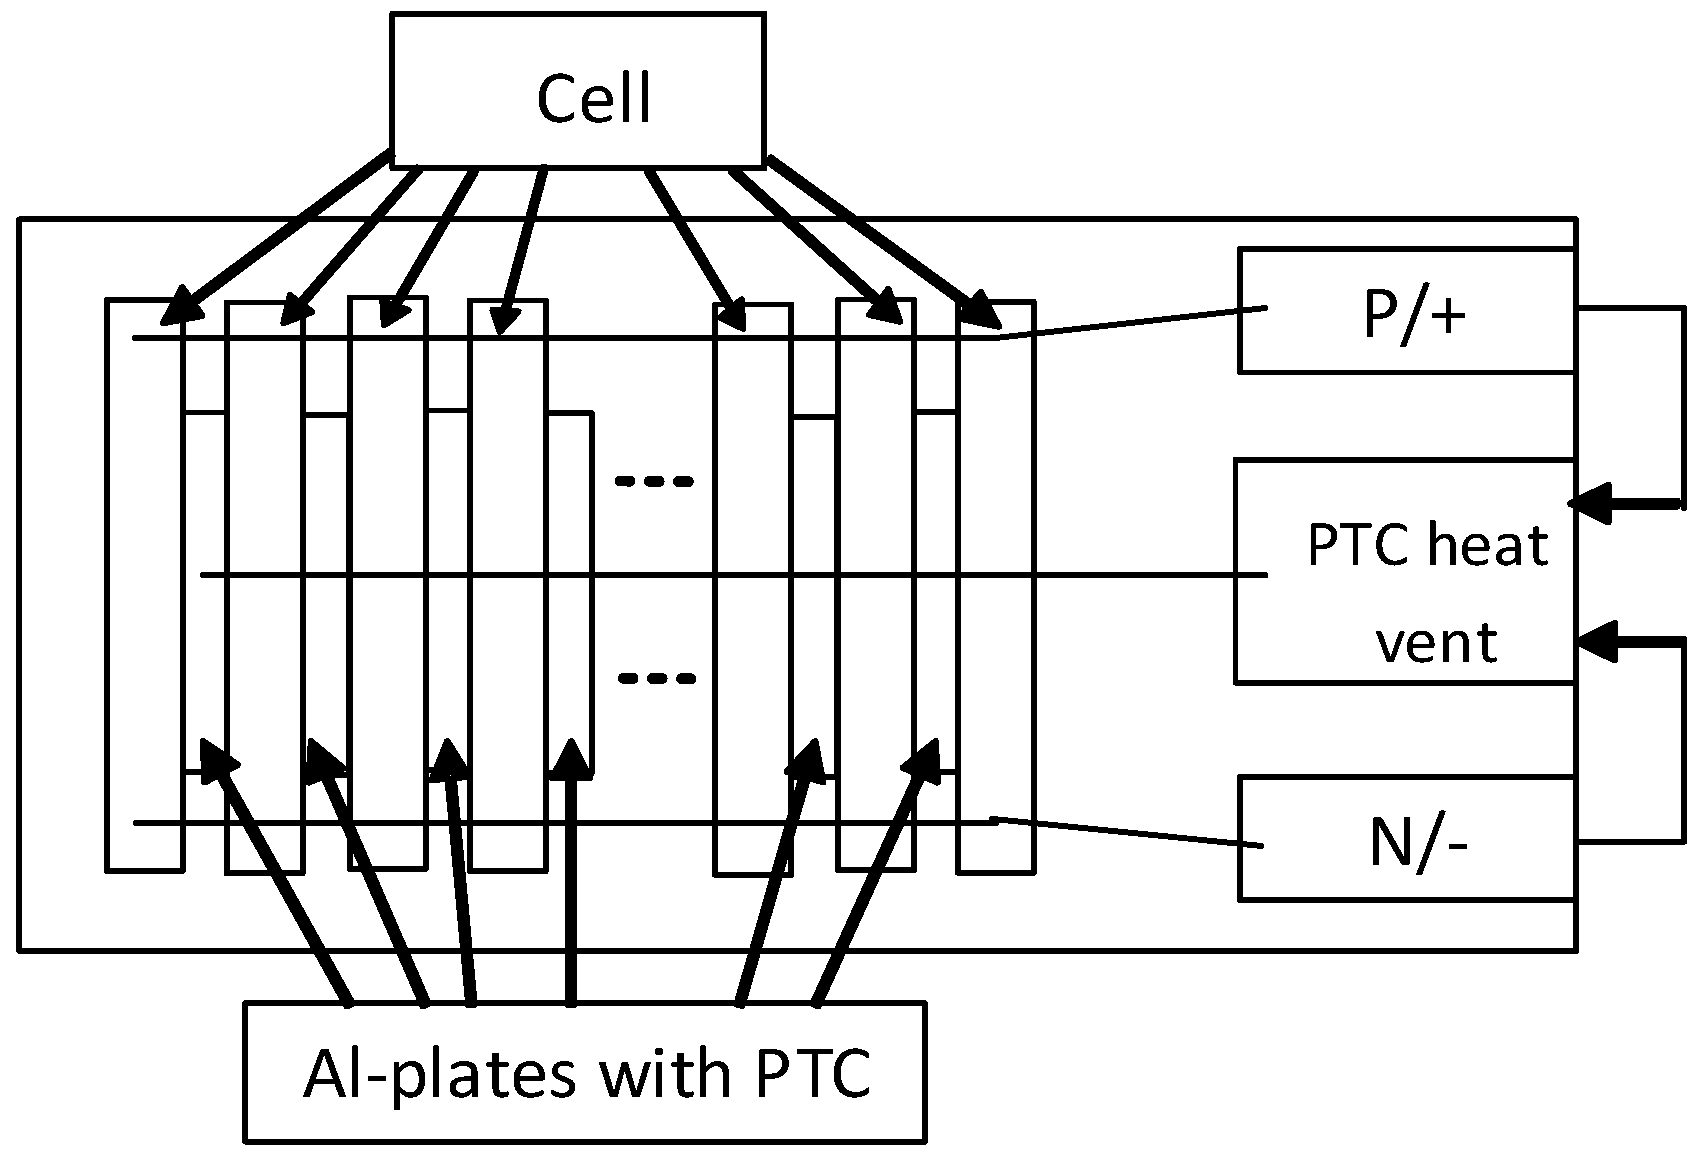
Accordingly, a PTC self-heating method is proposed in this paper. In the design, PTC resistance bands are embedded in slotted aluminum plates, which are arranged between two sides of each cell. PTC is heated by electricity derived from LIB pack, and the heat generated by PTC materials is rapidly transferred to the cell through those aluminum plates. The extra slots on the aluminum plates will be formed as air ducts to dissipate heat at high temperature. This design achieves an integration of low-temperature heating and high-temperature cooling, with a schematic diagram shown in Figure 2. The product of LIB pack with PTC material is exhibited in Figure 3. From Figure 3, there are 24 cells in each of the two columns of the test pack, and in each column, there are 23 aluminum plates placed between two sides of every two cells, ensuring that each cell has at least one side contacting with the aluminum plates. Besides, a temperature sensor is installed at the center of each cell side and on the positive/negative column of each cell. The characteristic of PTC material is shown in Figure 4. Figure 4a depicts the resistance characteristic of PTC material. The resistances will be increased exponentially when the temperature rises to the Curie temperature (TC).
Thereafter, the resistances of the PTC material remain steady and the heat generation rate will be kept constant. Figure 4b is a current change curve when the PTC resistance bands are provided with an external power (220 V AC) at −40 °C. It can be seen from the figure that the temperature of the PTC material will reach the TC point in a very short time (about 40 s) after the power supply is switched on; the current is then basically kept at a constant state, and the PTC material is sustained at a state of constant power to heat the LIB pack.
2.2. Experiment
The experiment consists of three procedures:
- (1)
- External power source heating experiment: when the tested pack is at SOC = 100%, heat is generated only by PTC resistance bands, and the external electricity power (220 V AC) serves as a supplying power;
- (2)
- Self-heating Experiment I: when the pack is at SOC = 100%, heat is generated by PTC resistance bands and the internal resistances of the battery, and the source of supplying power is the pack itself;
- (3)
- Self-heating Experiment II: when the pack is at SOC = 60%, heat is generated by PTC resistance bands and the internal resistances of the battery, and the source of supplying power is the pack itself.
Detailed steps of the external power source heating experiment are as follows:
- Step 1
- Soak the tested pack into a −40 °C incubator for more than 5 h, to maintain the average temperature inside the battery at −40 °C;
- Step 2
- Connect PTC materials with 220 V AC current, then start to heat the pack;
- Step 3
- Suspend the first heating process when the lowest temperature collected in the pack is raised to −20 °C;
- Step 4
- Test the pack with hybrid pulse power characteristic (HPPC) specification by Digatron EVT500-500 (Digatron Power Electronics Company, Aachen, Germany);
- Step 5
- Repeat Step 2;
- Step 6
- Stop the second heating process when the lowest temperature collected in the pack is raised to 0 °C;
- Step 7
- Repeat Step 4;
- Step 8
- Test the pack with 1C constant-rate discharge until the discharge cutoff voltage is reached, then terminate the experiment.
As can be seen from the above steps, the experiment is composed of two heating processes. The lowest temperature of each cell in the pack rises from −40 °C to −20 °C during the first heating process; and rises from −20 °C to 0 °C during the second process. An HPPC test is carried out after each process to study the recovery of charge/discharge performance. Furthermore, a 1C constant-current (CC) discharge rate test is conducted to investigate the recovery of the LIB capacity after the second process.
The experimental steps for Self-heating Experiment I and II are virtually identical to those of the external power source heating experiment, with the only difference being that the supply power is derived from the pack itself, which can only be used to supply DC current, rather than from the external power source (220 V AC). Therefore, the current transmitted through the PTC material is DC rather than AC. The devices used in the experiments are listed in Table 3 and the photos of experiments are shown in Figure 5.
3. Comparison of Experiment Results
3.1. Comparison of Heating Results
- (1)
- During the process of external power source heating experiment, the temperature of the pack increases quickly with the highest heating rate, as the externally applied 220 V AC is high and stable and the PTC material generates heat quickly.
- (2)
- Although the discharge capability of the pack is poor at low temperatures, the heating effect of the pack cannot be neglected when it is heated via supplying power to the PTC resistance bands. In the fully-charged state (SOC = 100%), the self-heating rate will be about 70% of the external power source heating rate.
- (3)
- As the battery SOC grows larger, better heating effects will be achieved, and a higher heating rate can be obtained.
However, some underlying information may have not been reflected from data presented in the above tables, which only represents the surface temperature of the LIB and cannot accurately reflect the actual temperature inside the battery. Reasons are that during processes of heating, in addition to the heat produced by the external PTC resistance bands, the internal Joule heat is also generated due to battery discharge. Hence, the temperature values collected by temperature sensors (attached to cell surfaces) are comparatively lower than the actual temperature.
3.2. Variations of Total Voltage and Average Temperature of the Pack in Self-Heating Process
In the external power source heating experiment, since there is no charge/discharge process for the pack, the variations of total voltage and average temperature of the pack are discussed only in the self-heating experiment.
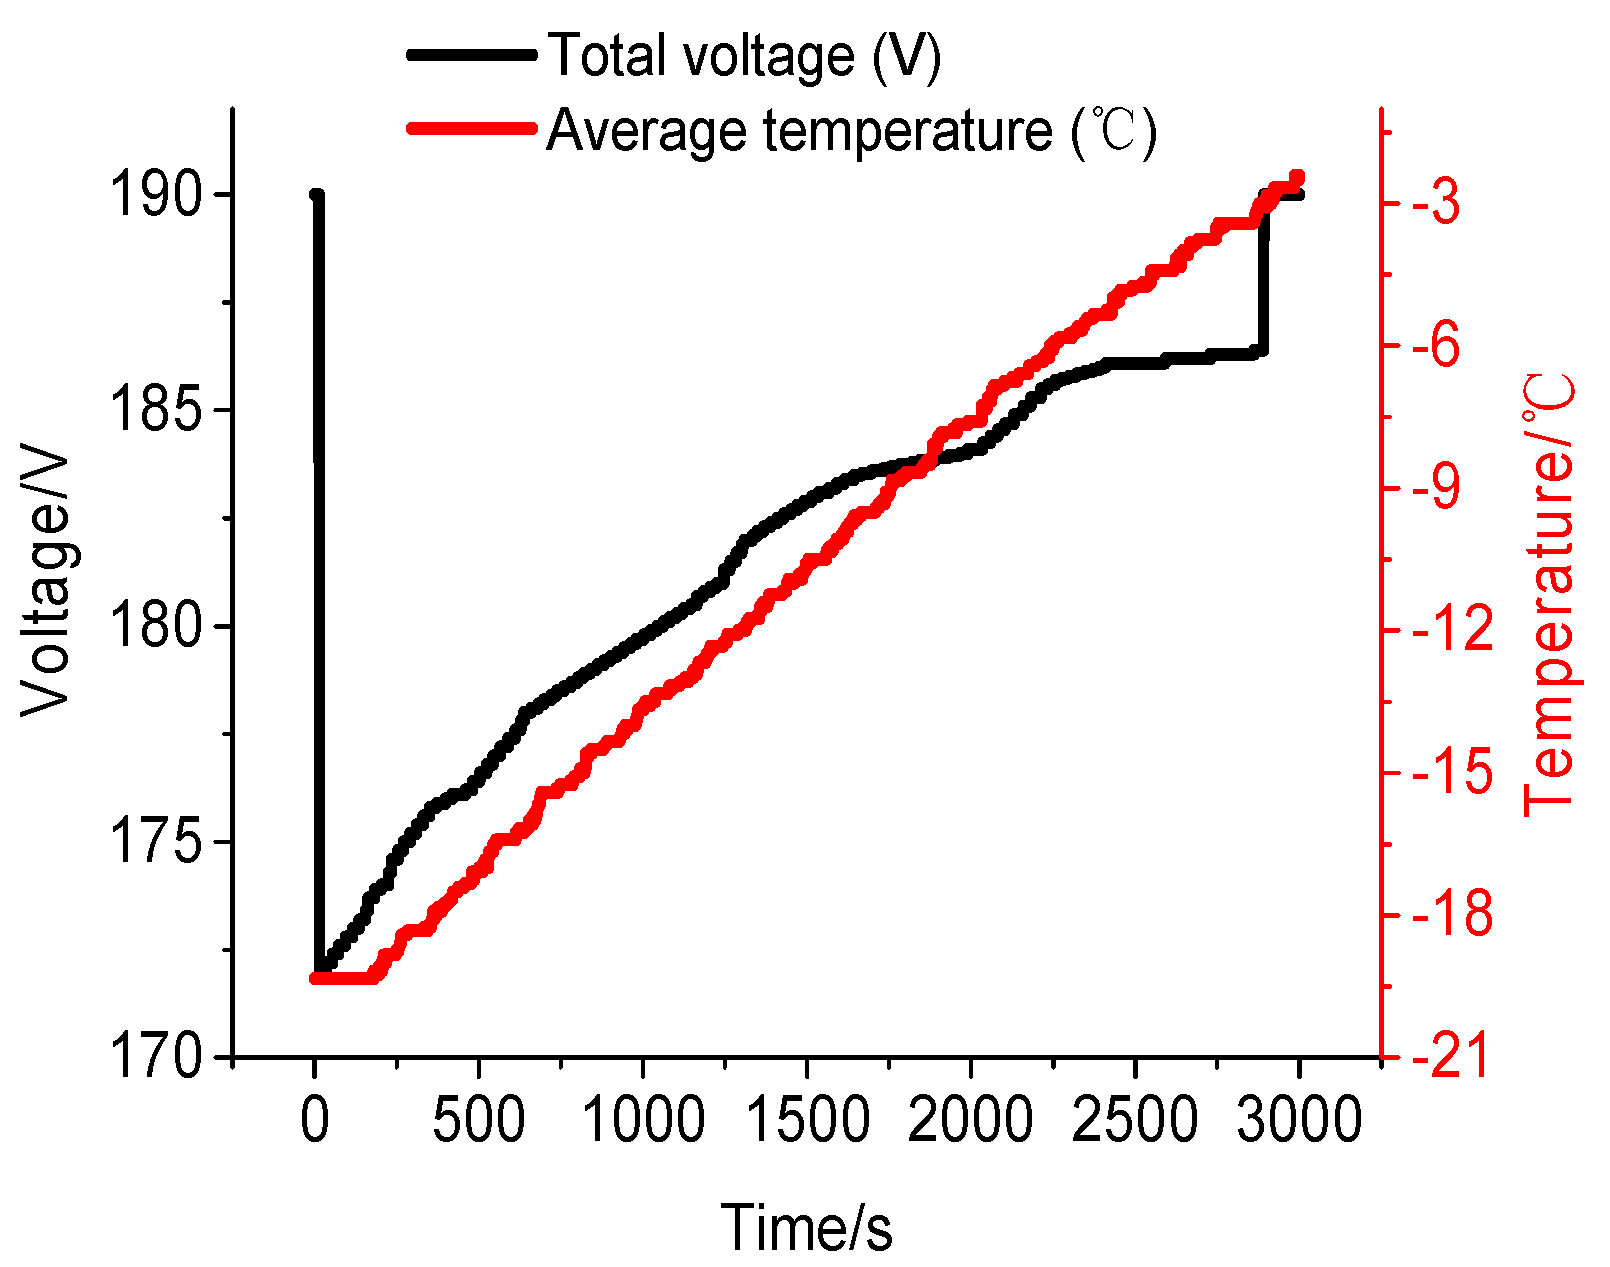
With the pack at 100% SOC, the variations of total voltage and average temperature of the pack in the Self-heating Experiment I are shown in Figure 6 and Figure 7.
In the self-heating processes, the total voltage of the pack rises with the increase in temperature. As can be seen from Figure 6, the initial total voltage of the pack is 190 V at −39.4 °C. At the moment when the pack is supplying power to PTC resistance bands, the total voltage dramatically drops to 142 V since the internal resistances are relatively large at that time. After 34.2 min of heating, the temperature of the pack will go up to −20.7 °C, and then the total voltage will rise to 172 V. That is because during the heating process, though the pack consumes part of its energy in discharging, its charge transfer is speeded up and the voltage platform is elevated gradually as the temperature increases. When the circuit is disconnected and the heating process terminated, the total voltage will be raised to 187 V, which illustrates that, after heating, the internal resistances being subjected to the temperature rise are significantly decreased.
Similarly, the curves of the pack heated from −19.3 °C to −2.4 °C are shown in Figure 7. The voltage platform rises from 172 V to 186 V as the temperature increases; the total voltage is restored to 189 V after heating is stopped, signifying that the temperature may become higher and the internal resistances of the pack grow smaller with a longer heating time. However, the duration of heating time has been increased to about 48 min, since the resistances of the PTC material increase rapidly with the rise in temperature, resulting in a slow heating rate. Further details about the heat generation rate curves will be given in Section 4.
When the pack is at 60% SOC, the variations in total voltage and average temperature of the pack during Self-heating Experiment II are shown in Figure 8 and Figure 9.
As shown in Figure 8, the initial total voltage of the pack is indicated as 183 V and the initial average temperature is −32 °C. After supplying power to the PTC resistance bands, its total voltage drops quickly to 140 V, which means that at this moment large resistances exist inside the pack. After 43.3 min of heating, its temperature is raised from −32 °C to −20.3 °C, with the voltage platform lifted, and the total voltage rises from 140 V to 160 V. When heating is ended, the voltage is restored to 178 V, signifying a significant decrease in its internal resistances.
Again similarly, the initial total voltage of the pack in Figure 9 is indicated as 178 V and its initial average temperature is −19.7 °C. After supplying power to the PTC resistance bands, the pack’s total voltage goes down to 161 V. With 52 min of heating, the temperature goes up to −2.7 °C. When heating is terminated, the total voltage is restored to 177 V.
Comparing the results of the two self-heating experiments, we find that the pack with larger SOC can provide higher voltage, so the heating time will be shortened and the temperature will be raised more quickly, and a better heating effect will be achieved. From Figure 6, Figure 7, Figure 8 and Figure 9, it should also be taken into account that when the total voltage data is being collected, the curves in all figures, in view of the sensor acquisition accuracy, may have different degrees of right-angle folding, which, nevertheless, will not affect voltage variations in the heating process.
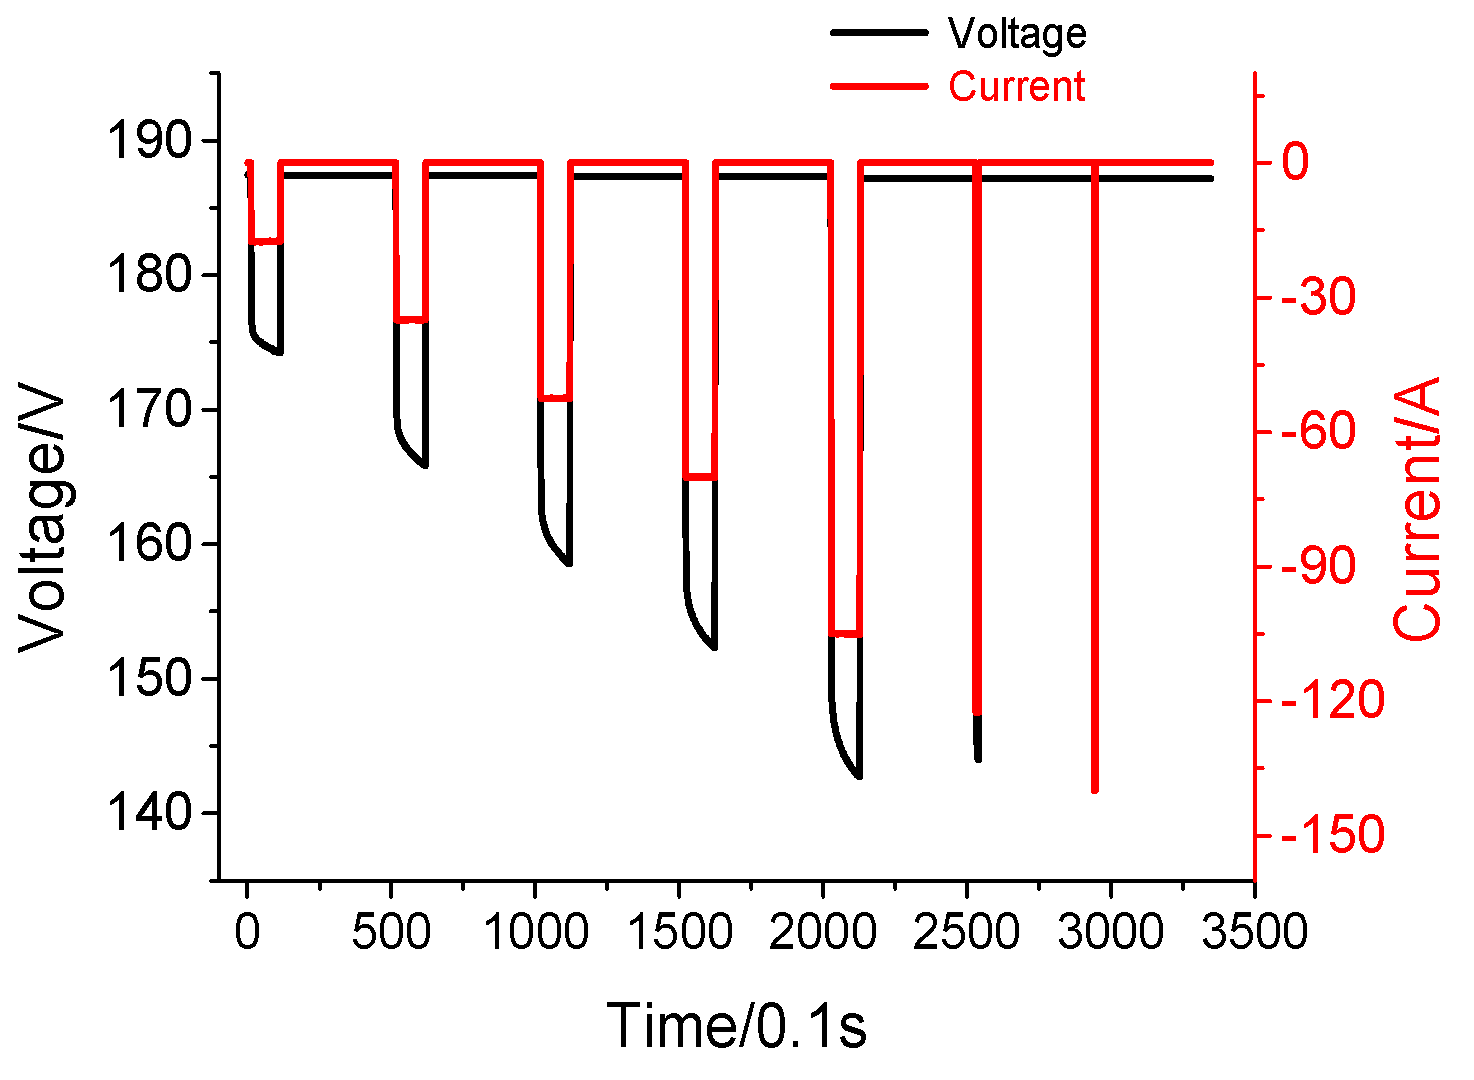
3.3. Pulse Charge–Discharge Capability of the Heated LIB Pack
HPPC tests are implemented to check the performance recovery of pulse charge–discharge capability for the pack after each heating process.
Figure 10 and Figure 11 are the test results after each heating in the external power source heating experiment.
After the first heating, the temperature rises to −20.3 °C, the battery can be discharged at the 0.5C rate for 10 s, but fails to be discharged at the 1C rate, and its discharge curve is shown in Figure 10. As can be seen from Figure 11, after the second heating, the temperature rises to 0.5 °C, the discharge performance of the pack is remarkably improved, and then the pack can be discharged at the 3C rate for 10 s, but not at the 3.5C rate.
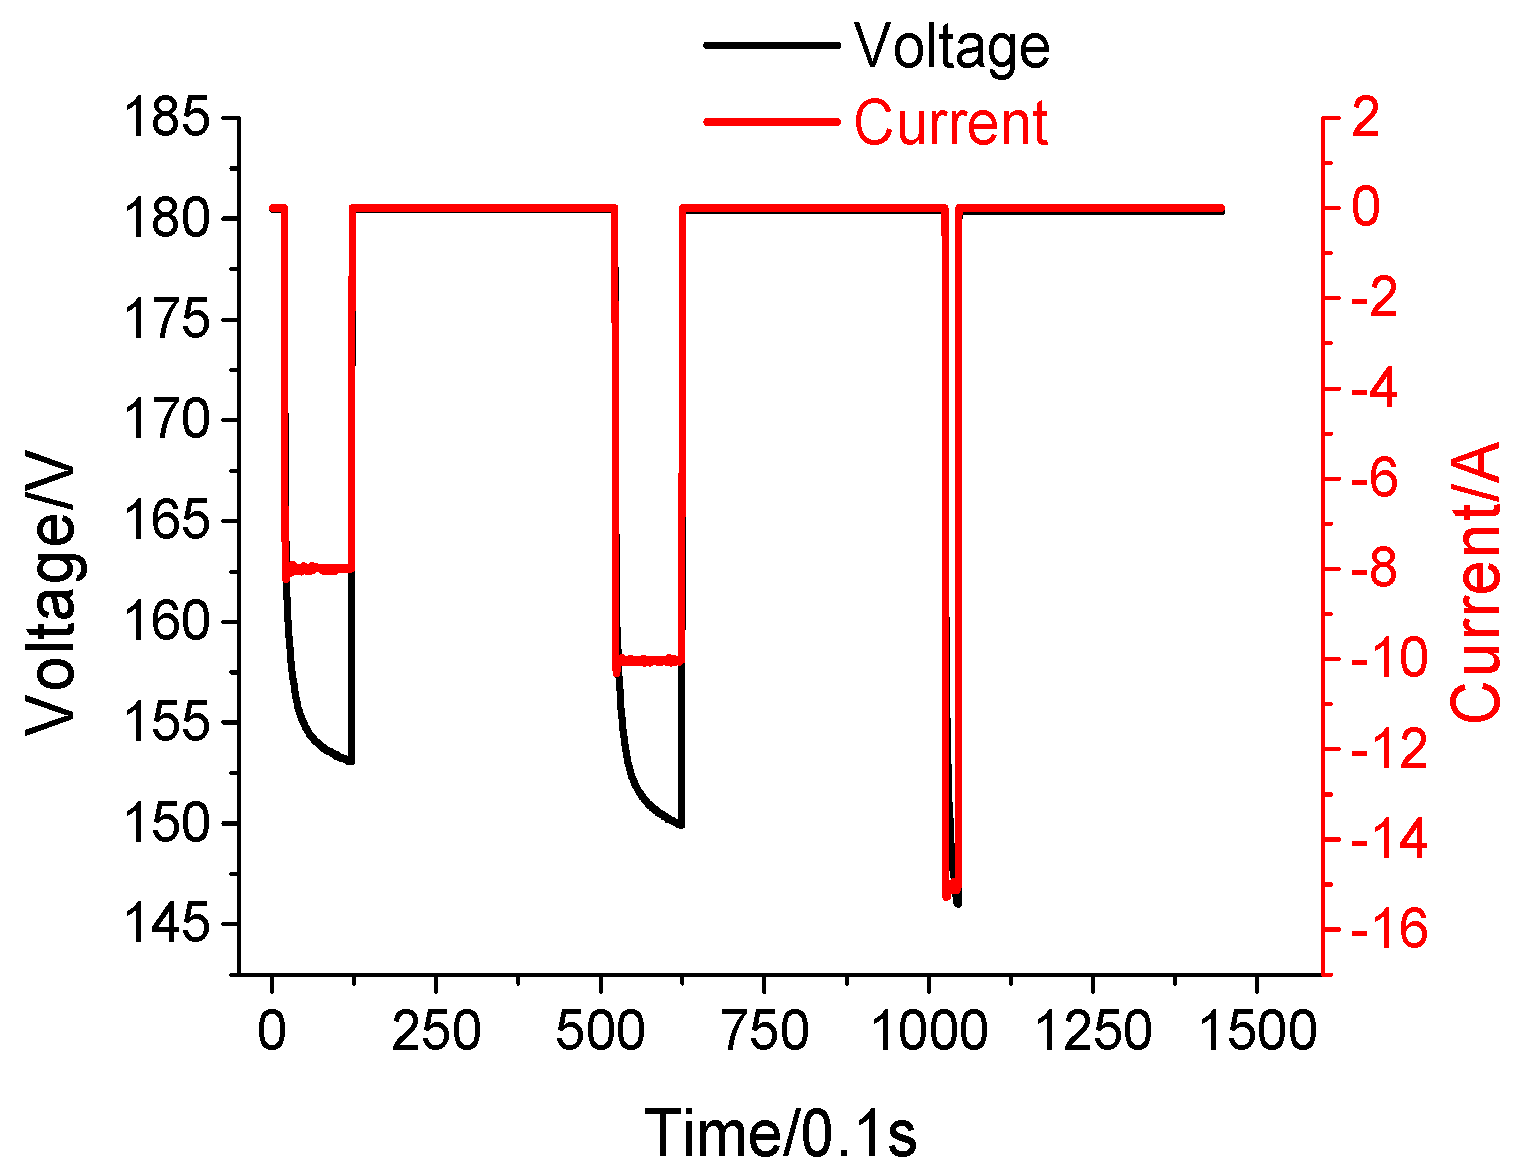
Figure 12 and Figure 13 exhibit graphs of HPPC tests after each heating in Self-heating Experiment I.
From Figure 12 and Figure 13, we find that after the first heating the pack can be discharged at the 0.57C rate for 10 s when heated to a temperature of −20.7 °C, yet not at the 1C rate; after the second heating, when the pack is heated to −2.4 °C, and its performance has been significantly improved, it can be discharged at the 3C rate, but not at the 3.5C rate.
As seen in Figure 14, when it is heated to −20.3 °C after the first heating, the pack can be discharged at the 0.29C rate for 10 s, but fails at the 0.43C rate for 10 s. As seen in Figure 15, when it is heated to −2.7 °C after the second heating, the pack can be discharged at the 1.5C rate for 10 s, but fails at the 2C rate for 10 s.
Results of charging performance recovery are obtained as follows:
- (1)
- Only pulse dynamic tests can be used to verify the pack’s charge capability when it is at 100% SOC. The results of charging performance recovery for the external power source heating experiment are consistent with those of Self-heating Experiment I. After the first heating, the pack cannot be charged at the 0.5C rate; after the second heating, the pack can be charged at the 0.5C rate for 10 s, but fails at 1C.
- (2)
- In Self-heating Experiment II, after the first heating, the pack (at SOC = 60%) cannot be charged at the 0.29C rate; after the second heating, it can be charged at the 0.34C rate for 10 s, but fails at the 0.5C rate.
Comparing the three heating experiments, we can conclude that:
- (1)
- The charge–discharge performance recovery of the pack after the second heating is obviously superior to that after the first heating, due to the fact that the second heating temperature tends to be relatively higher, LIB electrolyte viscosity is decreased, and the charge transfer is speeded up. It is also confirmed that the low-temperature discharge capability of LiMn2O4 LIB is much better than its charge ability.
- (2)
- When the pack is at 100% SOC, though the pack in Self-heating Experiment I consumes part of its energy, there is no significant difference between its discharge capacity during self-heating and external power source heating. Moreover, the former is comparatively better than the latter.
- (3)
- The charge/discharge capability of LIB in Self-heating Experiment II is relatively poor when LIB is at 60% SOC, mainly due to influential factors such as smaller SOC, lower voltage platform, slower heating rate, longer heating time, more consumption of energy, etc.
3.4. Constant-Current Discharge Capability of the Heated LIB Pack
The HPPC tests prove that when the pack is at 100% SOC in self-heating experiments, its charge/discharge performance is relatively better. In order to further study its capacity recovery, 1C CC discharge rate tests (based on the PNGV Battery Test Manual, the Freedom CAR Battery Test Manual for Electric Vehicles is jointly compiled by the authors and the battery manufacturers) are implemented on three heated packs. The test results are depicted in Figure 16.
As can be seen in Figure 16:
- (1)
- Although the pack in Self-heating Experiment I consumes part of its energy, it has discharged up to 19.834 Ah energy, with the highest capacity at 1C CC among the three packs. In contrast, the discharge capacity of the pack in the external power source heating experiment is only 12.853 Ah. Thus, the internal heat is proved to be of non-negligible value. Compared with the external power source heating method, which depends solely on the PTC heating material, the self-heating method can integrate the internal heat with the external heat to effectively promote the restorability of battery discharge capacity. Therefore, even when the self-heated LIB pack is at a state of SOC < 100% after heating, its discharge capacity is still larger than that of the external power source heated pack at 100% SOC. Thereby, the superiority of the self-heating method is validated.
- (2)
- When the pack is at 60% SOC and heated in the Self-heating Experiment II, the pack discharges the least capacity (<2 Ah). This is mainly because the initial SOC of the pack is comparatively small; the voltage platform is lower than that of the pack at 100% SOC and its heating rate is low, so the two heating processes will require a longer time and consume more energy, causing lower residual capacity. Another reason is that the 1C discharge rate is too large for the pack when SOC < 60% at low temperatures. Moreover, in order to protect the pack from being damaged during the experiment, its discharge cutoff voltage is set to be comparatively higher than its minimum cutoff voltage, leading to the consequence that virtually no energy is discharged.
4. Modeling for PTC self-heating
The above experimental results show when the pack at 100% SOC is heated from −40 °C to 0 °C by using the self-heating method and the external power source heating method, its pulse charging/discharging capabilities are equivalent to each other, and yet the 1C CC discharge capacity of the former pack is far greater than that of the latter pack. One possible reason for that result may be that the temperature is not distributed uniformly. Accordingly, a self-heating model is established to further study the temperature distribution uniformity of the pack after heating.
Generally, thermal models for a battery come in a variety of types, such as an electrochemical–thermal coupled model, an electro-thermal coupled model, a thermal abuse model, a 1D model, a 2D model, a 3D model, etc. [21,22,23,24,25]. An electrochemical–thermo-coupled model is a battery thermal model established on the basis of the thermo–chemical reaction of the battery, in which the temperature in the battery is considered to be distributed uniformly, with the distribution of current density on the battery pole pieces being ignored. Tiedemann et al. [26], Pollard and Newman [27], and Bernardi et al. [28] have performed many in-depth studies on the electrochemical–thermo-coupled model. The equation of the heat generation rate model proposed by Bernardi, which is one of the most widely used models, will be adopted in this paper.
In this paper, the discussed heat resources generated by heating a LIB pack with self-heating method are derived from two sources: internal heat and external heat. (1) The internal heat refers to the amount of heat produced by the internal resistances, when the LIB is supplying power to the PTC resistance bands; (2) the external heat means the amount of heat produced by the PTC resistance bands. Thus, thermal modeling usually begins with an analysis of the heat generation theories of the internal and external power source.
4.1. Theoretical Analysis of Heat Generation
4.1.1. Theoretical Analysis of the Internal Heat Generation
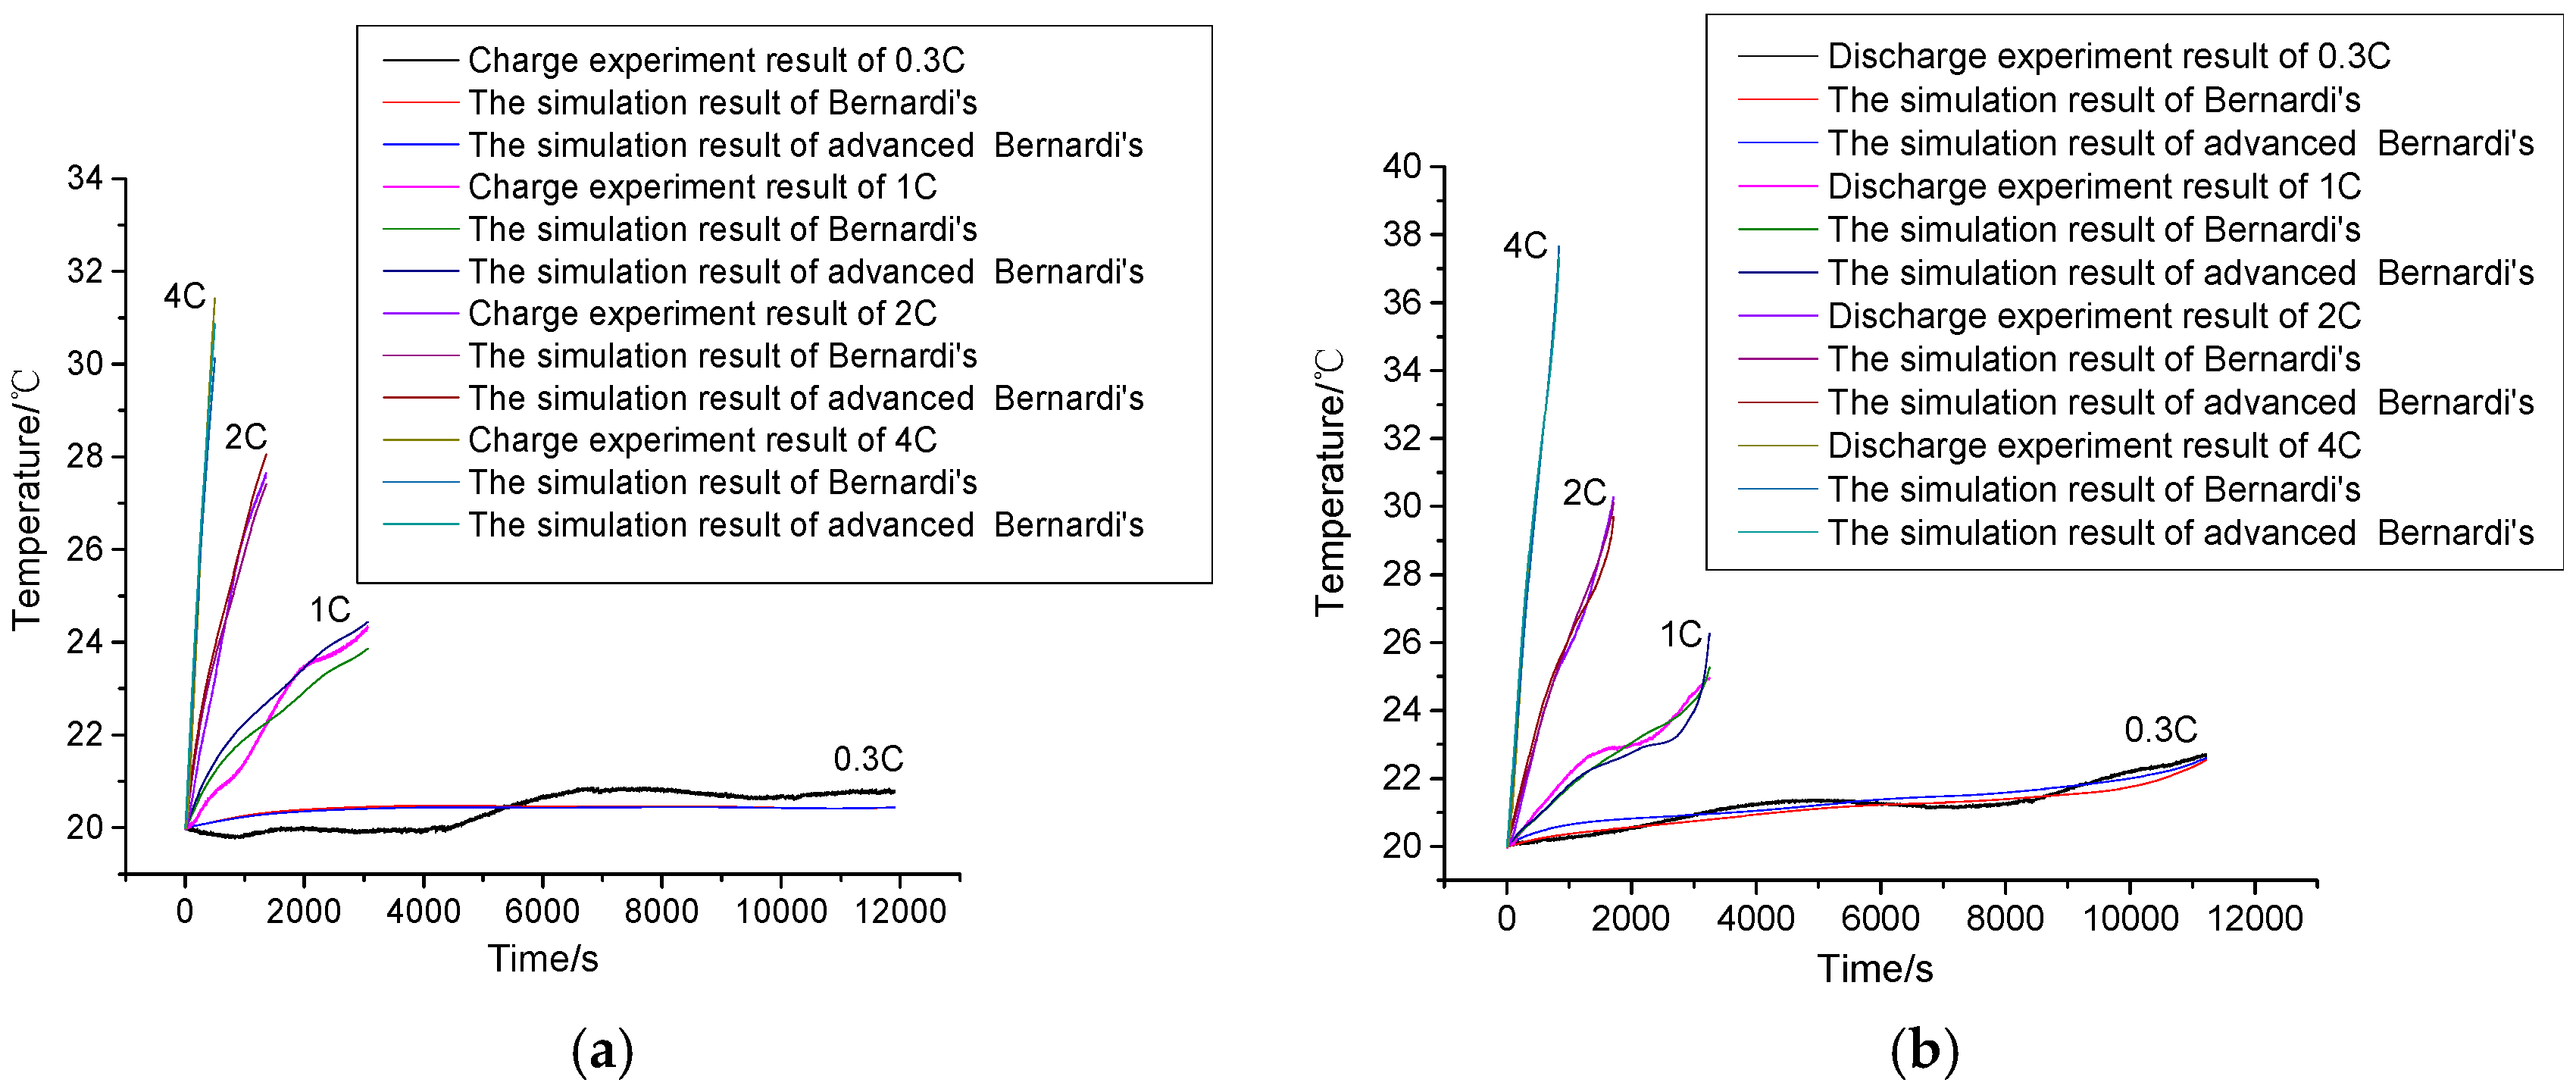
The internal heat generation of the LIB is the internal heat source of the thermal model, so the calculation accuracy of heat generation directly influences the accuracy of the thermal model. As the assumption of Bernardi heat generation model is not consistent with the actual temperature distribution in the LIB, some researchers have made improvements in the Bernardi heat generation model based on the introduction of the current density.
- (1)
- The Bernardi heat generation rate model.The equation for Bernardi’s heat generation rate model is as follows [28]:where denotes the heat generation rate, the unit is W; denotes the charge/discharge current, the unit is A, and in the charging process, has a negative value, while in the discharging process, has a positive value; T denotes the temperature, the unit is K, and the average temperature is adopted when calculating ; denotes the change rate of open circuit voltage with the temperature; Joule heat and reaction heat are mainly considered in . In Equation (1), denotes joule heat, and denotes reaction heat.
- (2)
- The advanced Bernardi heat generation rate model.The equation for the advanced Bernardi heat generation rate model is as follows:where denotes the charge/discharge current density of the positive/negative plate.
According to the LIB temperature variation during the charging/discharging process at different currents, the accuracies of the two models are compared and the results are shown in Figure 17.
It can be seen from Figure 17 that the calculation accuracy of the advanced Bernardi heat generation model is not superior to that of the initial one, and the advanced model is also highly computationally demanding, which is not conducive to calculations for the heating model of the LIB pack. Therefore, this paper adopts the Bernardi heat generation model.
4.1.2. Analysis of Internal Heat Conduction
Before establishing the model, we initially set up a differential equation of heat conduction for a LIB cell, which will help us to understand at the microscopic level the heat generation, heat transfer, and temperature rise inside the cell.
Also before establishing the thermal differential equation, we put forward some assumptions: (1) The inner part of a cell composed of different materials should be simplified into an isotropic continuous medium; (2) if heat is generated inside a cell, the internal heat should be uniformly distributed.
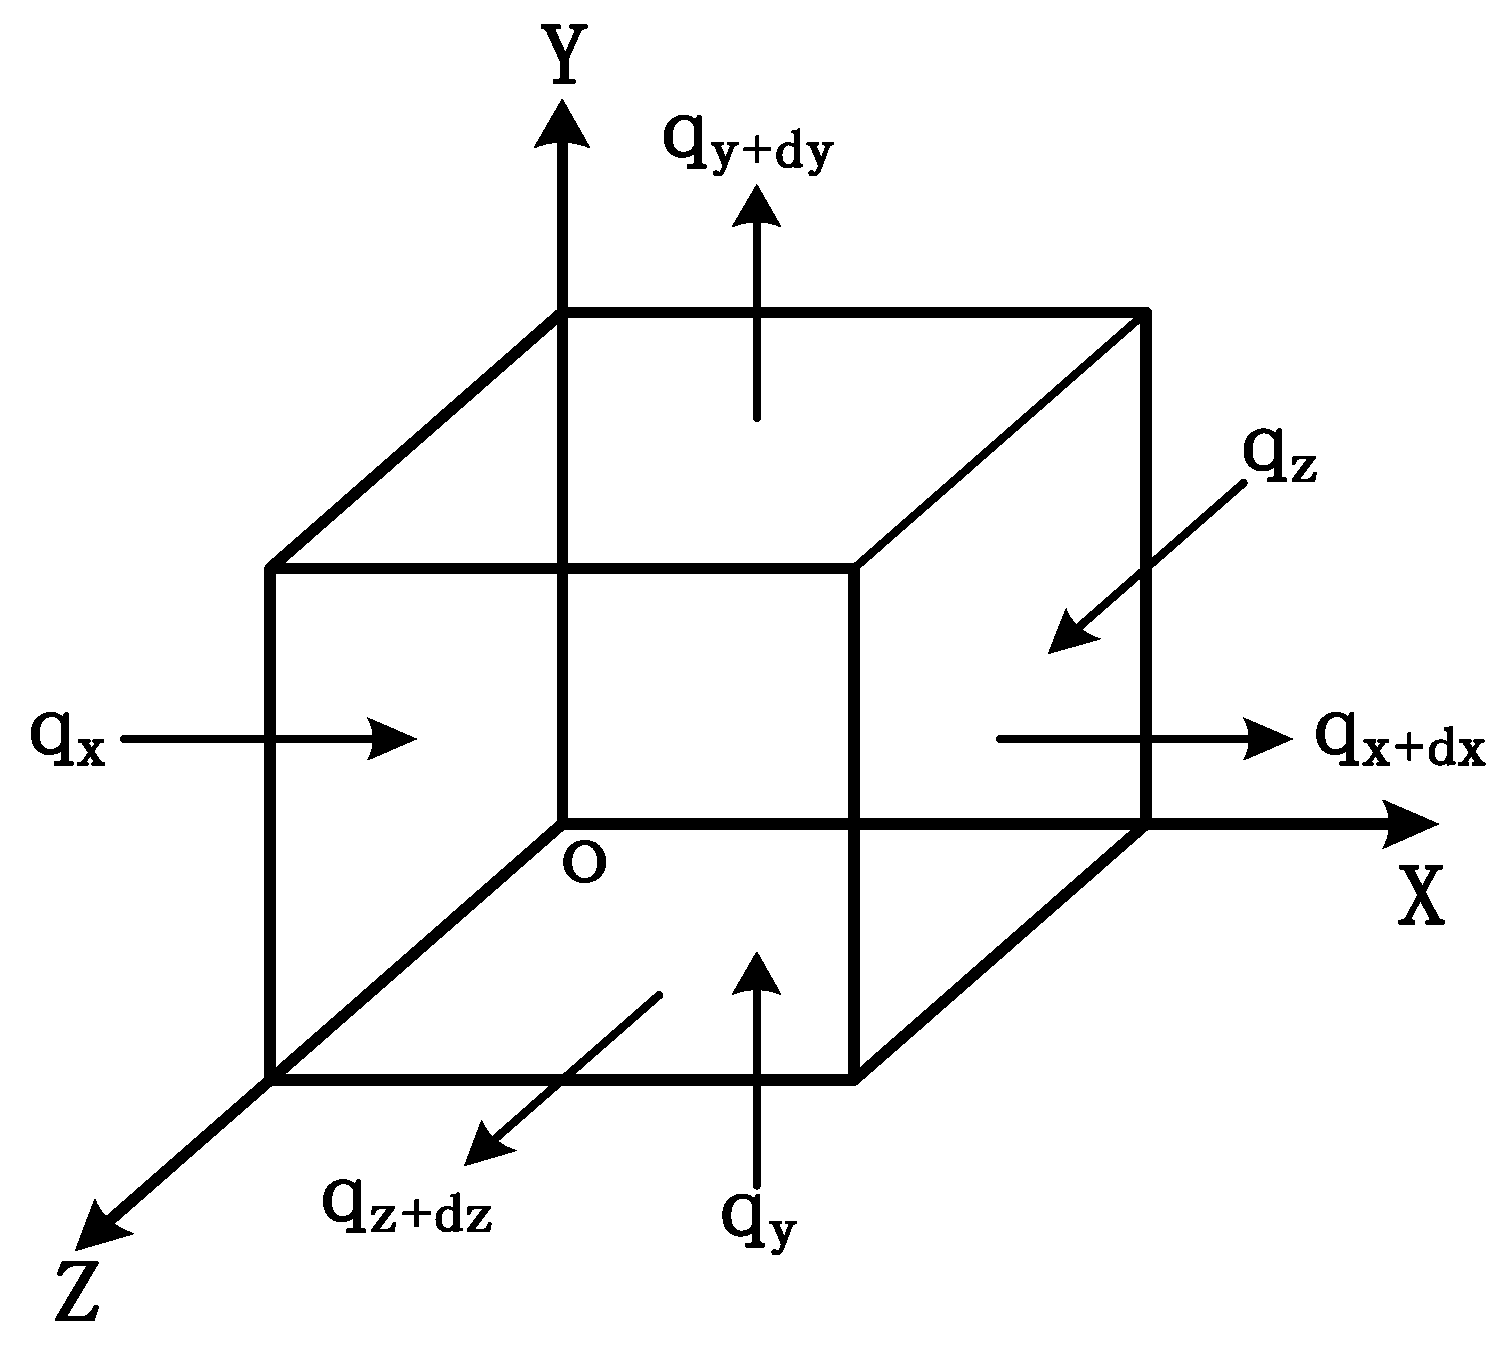
Next, we assume that a micro-unit will be taken out from a cell; as shown in Figure 18, , , represent the heat fluxes flowing respectively into the micro-unit from its left side, from below, and from the back, respectively; , , stand for the heat fluxes flowing out of the micro-unit from the right side, from the top, and from the front, respectively. According to Fourier’s law, Equation (3) can be obtained:
Here, the internal instantaneous heat power of the micro-unit is . If there is no internal heat source in a micro-unit, then ; and the thermodynamic increment of a micro-unit is , where denotes the heat power per unit volume; denotes the density; denotes the specific heat capacity; denotes the temperature; and denotes the time.
According to the conservation of energy, a general expression of the heat conduction differential equation in the rectangular coordinate system can be obtained:
4.1.3. Analysis of the External Heat Conduction
As the heat generated externally is originated primarily from the PTC material, this paper analyzes the external heat transfer, with two aspects considered—heat conduction and heat convection—and with the radiation heat transfer being ignored.
The theoretical basis of heat transfer is Fourier’s law, which can be expressed as: the heat flux at any point and any time is proportional to the temperature gradient at that point. The formula is as follows:
where denotes the heat flux density of heat conduction; denotes the coefficient of heat conductivity; and denotes the direction of the outer normal. Since the heat is transferred from the points of high temperature to those of low temperature, the resulting value in Equation (5) is negative.
As the sides of the cells are heated directly by the aluminum plates arranged between the sides of every two cells, the other sides of the cells can only be heated by the heated air flow, which can be calculated by using the Newton cooling formula:
where denotes the heat transfer coefficient and the unit is W/(m2·K).
4.1.4. Heat Generation and Conduction Model
Combining the heat conduction differential equation and the Bernardi heat generation rate model, the heat generation and conduction model can be obtained:
where is the correction coefficient of the heat generation rate.
The initial and boundary conditions are as follows:
4.2. The Establishment of a Geometric Model
Several assumptions are made to simplify the geometry model of the pack. (1) As the thickness of each element inside the LIB is very small, the amount of calculation work will become considerable if the three-dimensional model is established with every element. Therefore, the cell composed of different materials is simplified into an isotropic continuous medium. (2) The PTC heat generation rate is assumed to be equivalent to the heat generation rate of aluminum plates; because the thermal conductivity of aluminum plates is relatively larger and the PTC resistance bands are embedded in the aluminum-plate containers, the heat produced by the PTC material can be rapidly transferred to the aluminum plates. (3) The connectors, wires, and insulation objects inside the pack are ignored, and the irregular structures of the pack are assumed to be regular cuboids. All the above assumptions can help simplify the model and shorten the calculation. (4) Based on the symmetry principle, the 48 s battery pack can be reduced to a 1/4 model composed of 12 cells. Simulations of the temperature field of the whole LIB pack can thus be simulated with boundary conditions.
Based on the above simplifications, the 1/4 geometry model falls into four aspects: (1) 12 cells; (2) 12 aluminum plates, including an aluminum plate at the center of the original 48s pack; (3) the LIB pack shell; and (4) the air flow inside the pack. Relevant parameters for modeling are listed in Table 6 and a geometric model is shown in Figure 19.
4.3. Acquisition of Model Parameters
4.3.1. Acquisition of the Thermo-Physical Parameters
The general thermo-physical parameters of each components inside LiMn2O4 cell are as shown in Table 7.
Yet, some thermo-physical parameters still need to be calculated, such as: density, specific heat capacity, heat conductivity coefficient, etc.
- (1)
- The cell density can be calculated by using the mean method, and the general formula is:where M is the total quality of the cell, and V the total volume of the cell.
- (2)
- The specific heat capacity of the cell can be calculated by using the theoretical equation expressed as Equation (10):
- (3)
- The heat conductivity coefficient of the cell can be calculated by using the thermal resistance method, which leads to Equations (11) and (12):where is the thickness of the cell; and , , , and , , , denote the lengths and the heat conductivity coefficients of cathode plates and anode plates, separator, and shell, respectively.
Based on Equations (9)–(12), the calculated results are: density 2182.7 kg/m3; specific heat capacity 1100 J/(K·kg); and heat conductivity coefficient 0.895 W/(m·K).
4.3.2. Internal and External Heat Generation Rates
The discharge voltage and current in the heating processes are acquired with self-heating experiments. The calculation approach discussed in Section 4.1 is used to determine the internal and external heat generation rate. The heat generation rates are obtained many times to fully demonstrate the real-time changes in heating, so the simulation may be kept closer to the actual experiment. Graphs of the heating current and power during the first and second heating experiments are shown in Figure 20 and Figure 21, respectively.
- (1)
- In the first self-heating process, the heating current tends to decrease, while the heating power keeps increasing. The reasons may be that the PTC material resistances increase as the temperature rises; at the same time, the pack voltage platform is also being raised, and the degree of resistance increase is greater than that of the voltage rise.
- (2)
- In the second self-heating process, although the temperature is still rising, the battery voltage platform has been basically stabilized. At this time, as the PTC material resistances increase dramatically, the heating current will decrease and the heating power is gradually reduced.
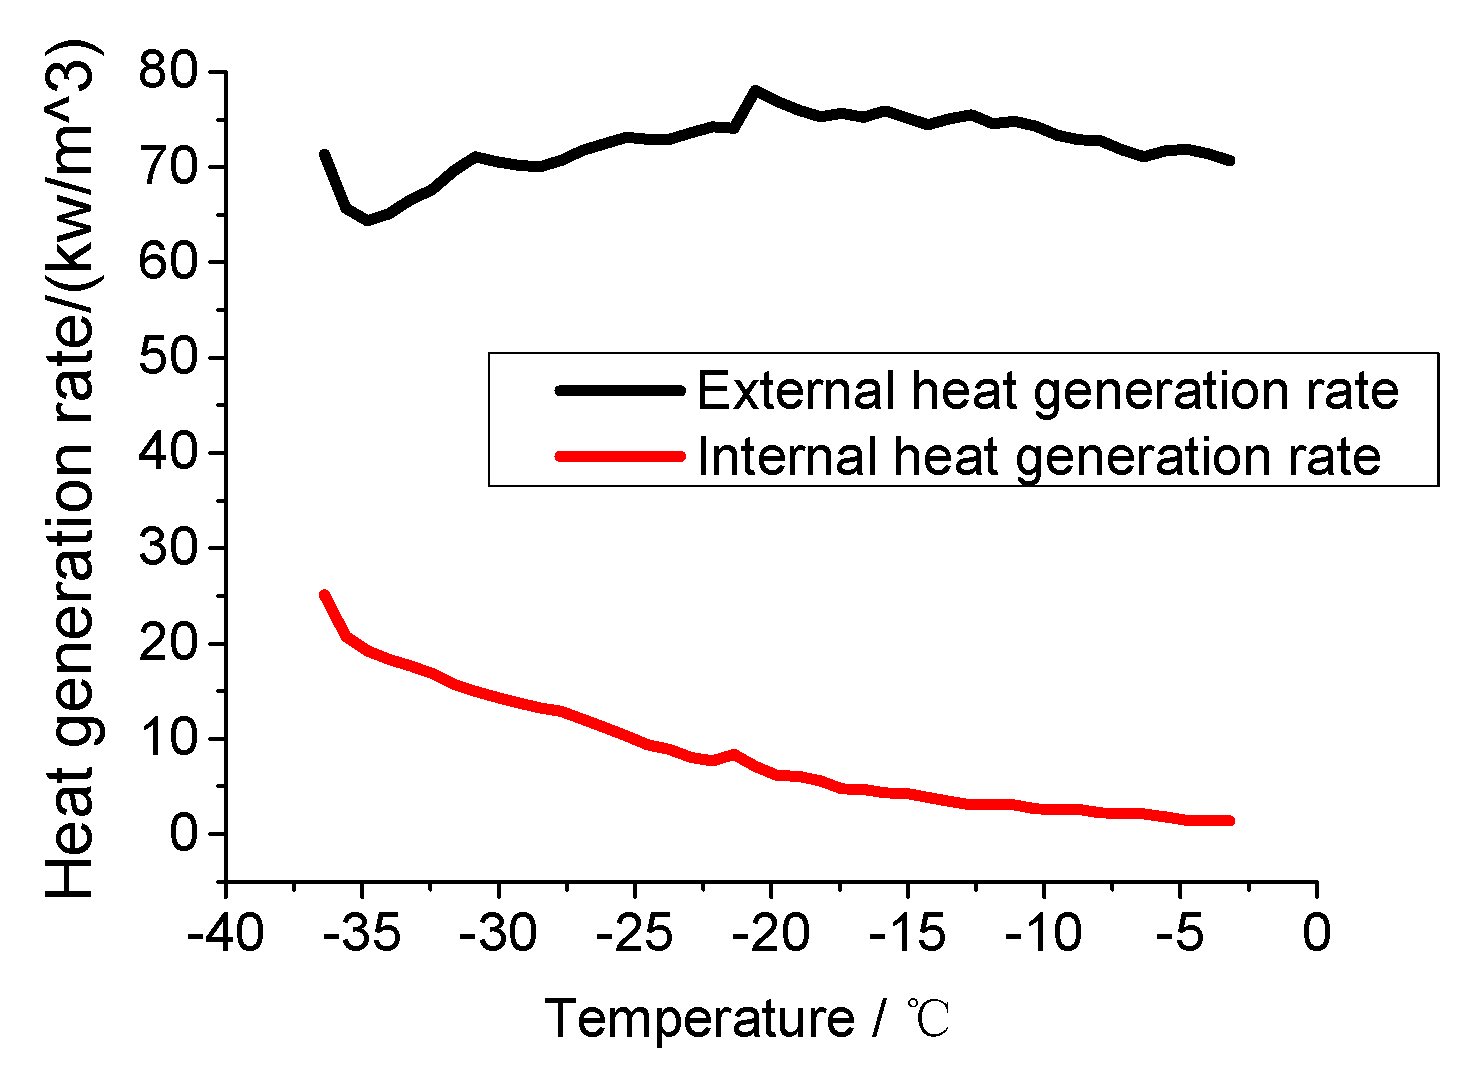
With the calculation results of the internal and external heat generation rate, we can acquire a graph of the heat generation rate for the pack from −40 °C to 0 °C. As shown in Figure 22, the mean value of the external heat generation rate is 72.386 kw/m3, and the mean value of the internal heat generation rate is 8.337 kw/m3, which is about 11.5% of the former.
5. Results and discussion
We write the program according to the results in Figure 22 and import the geometric model in to our simulation design, then conduct a numerical simulation.
Although the heat generation rate inside the battery is rather small, it cannot be ignored because of its direct effect on the battery. In order to better verify the characteristics of the internal heat generation, two cases are also included in the simulation:
- (1)
- Considering the co-generation of both the internal and the external heat in the heating process, which is in line with the actual situation.
- (2)
- Ignoring the internal heat, with only the external heat considered.
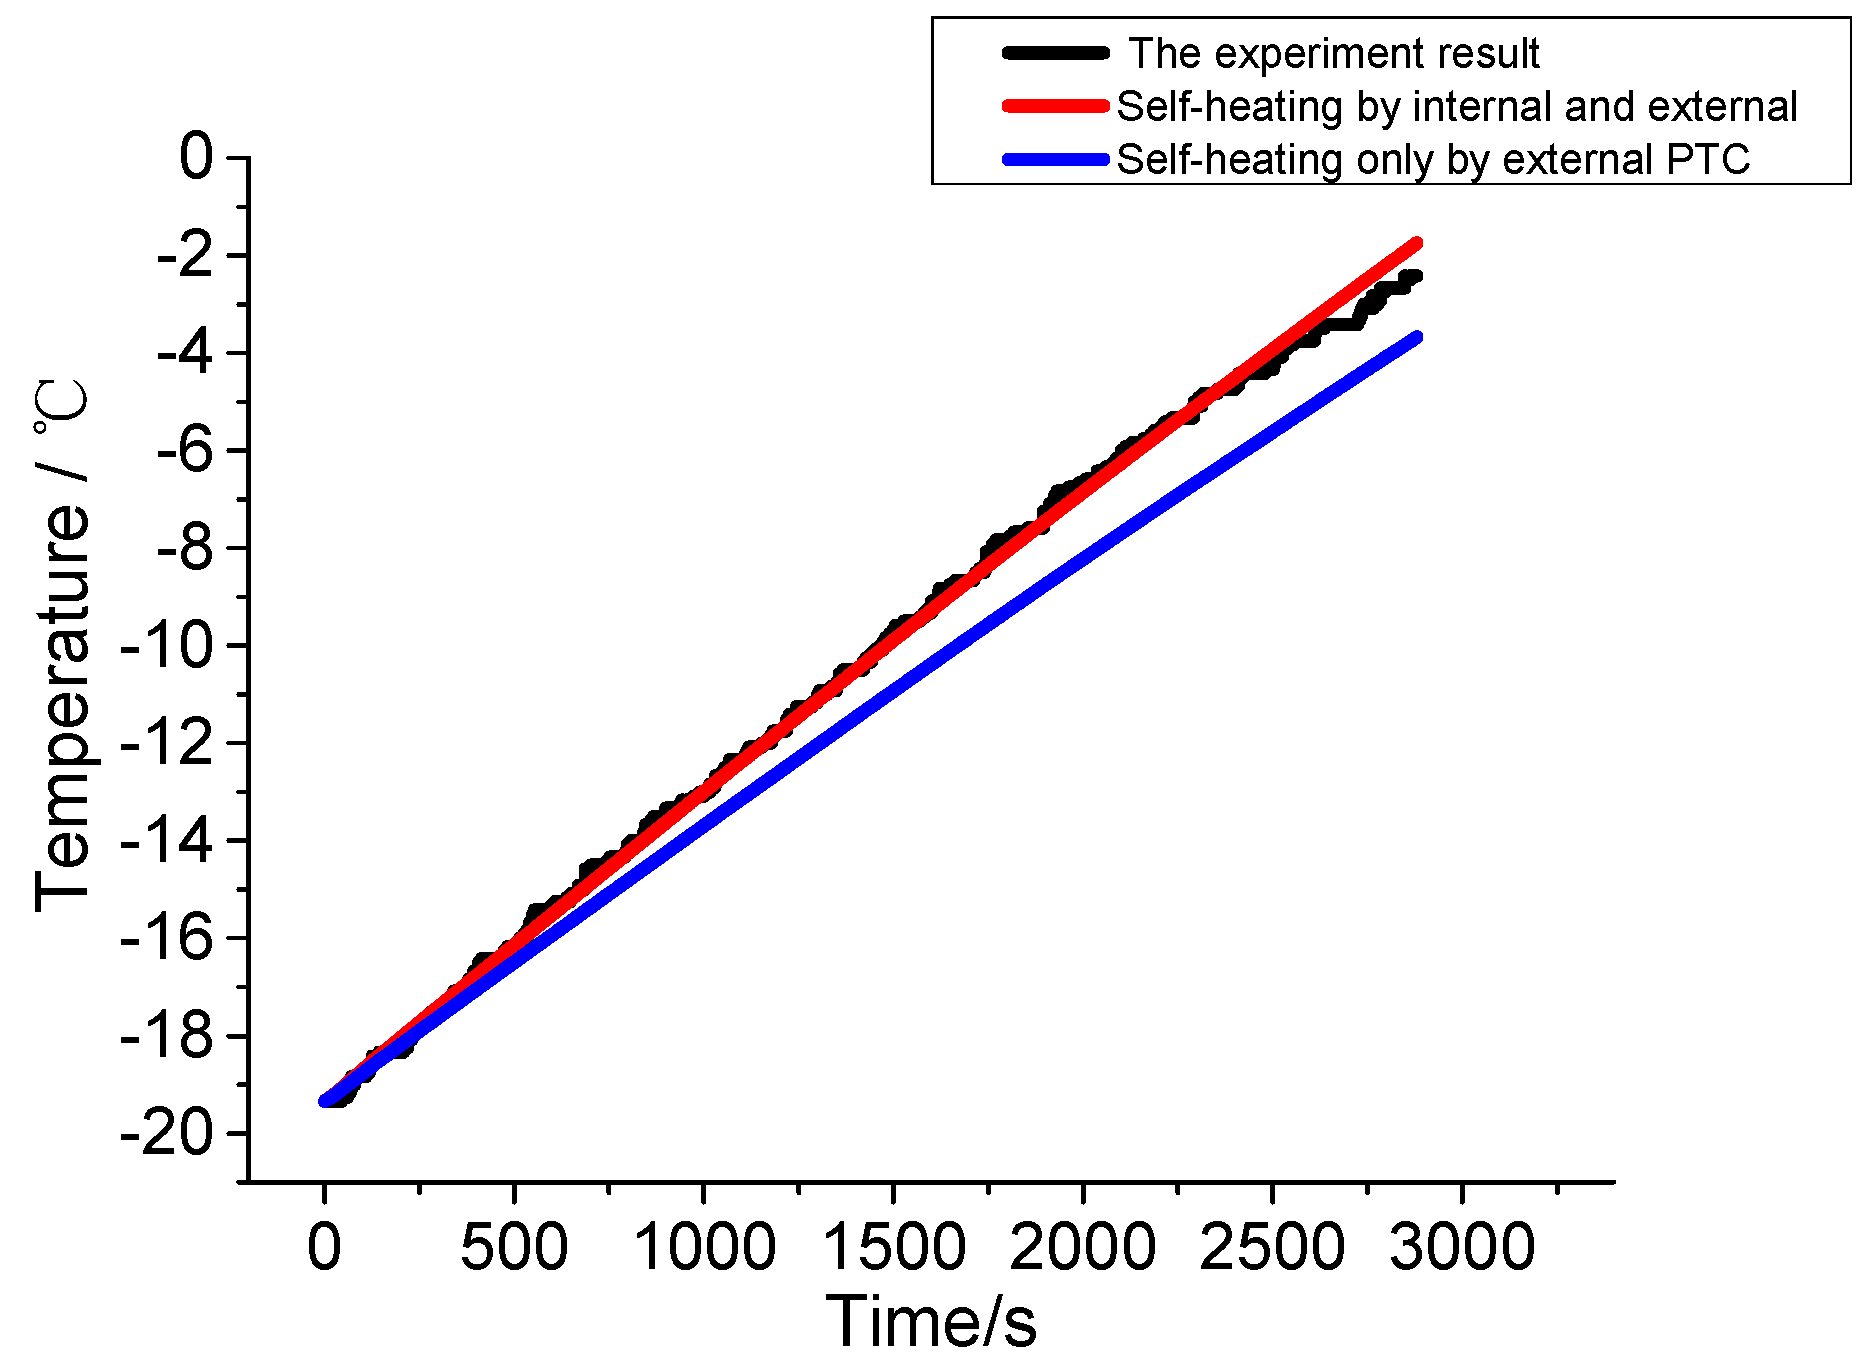
The curves of temperature rise, acquired from experiments and simulations on the battery during two heating processes, are shown in Figure 23 and Figure 24, respectively.
As shown in Figure 23 and Figure 24, simulation curves of the internal and external co-heating are in good agreement with the temperature rise curves obtained during the experiments. The average and maximum temperature difference in the first heating process are 0.201 °C and 0.938 °C, respectively. The average and maximum temperature difference in the second heating process are 0.164 °C and 0.783 °C, respectively. The above results verify the accuracy of the simulation results. The simulation curve, without regard for the internal heat, is significantly lower than the curve in the experimental process, which fully illustrates the significance of internal heat on the LIB temperature rise. Even if the heat rate is comparatively tiny, it should not be ignored.
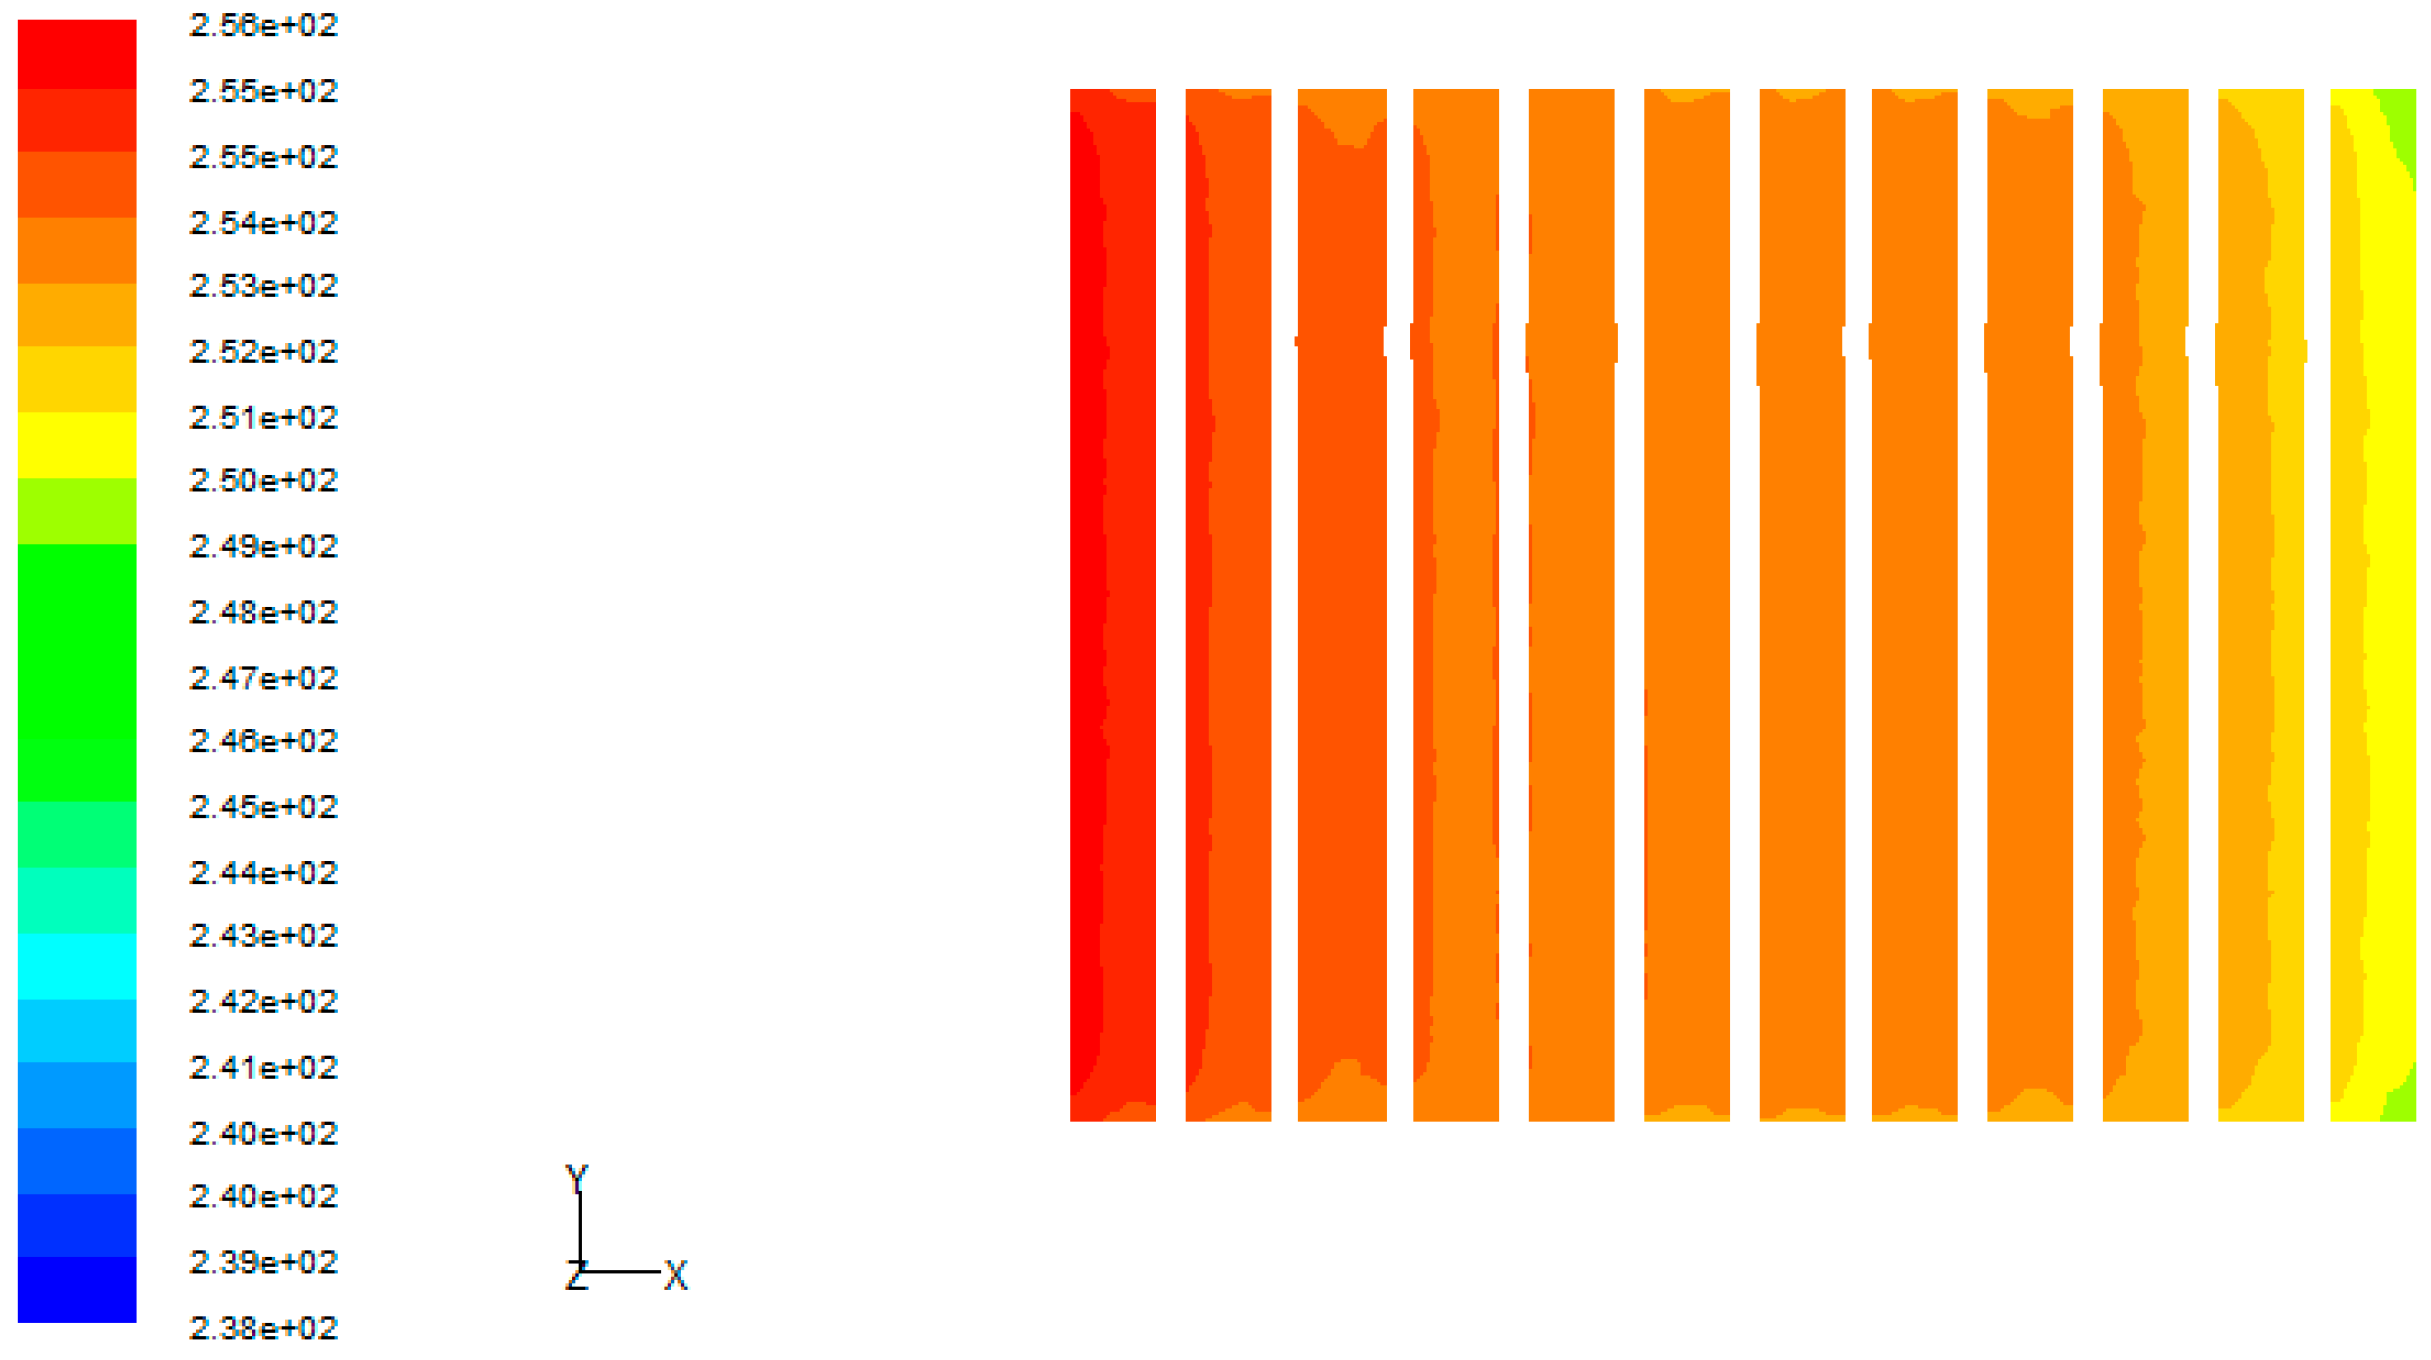
Next, utilizing the function of temperature contour, we further analyze the temperature distribution inside the pack after heating. The results are shown in Figure 25 and Figure 26.
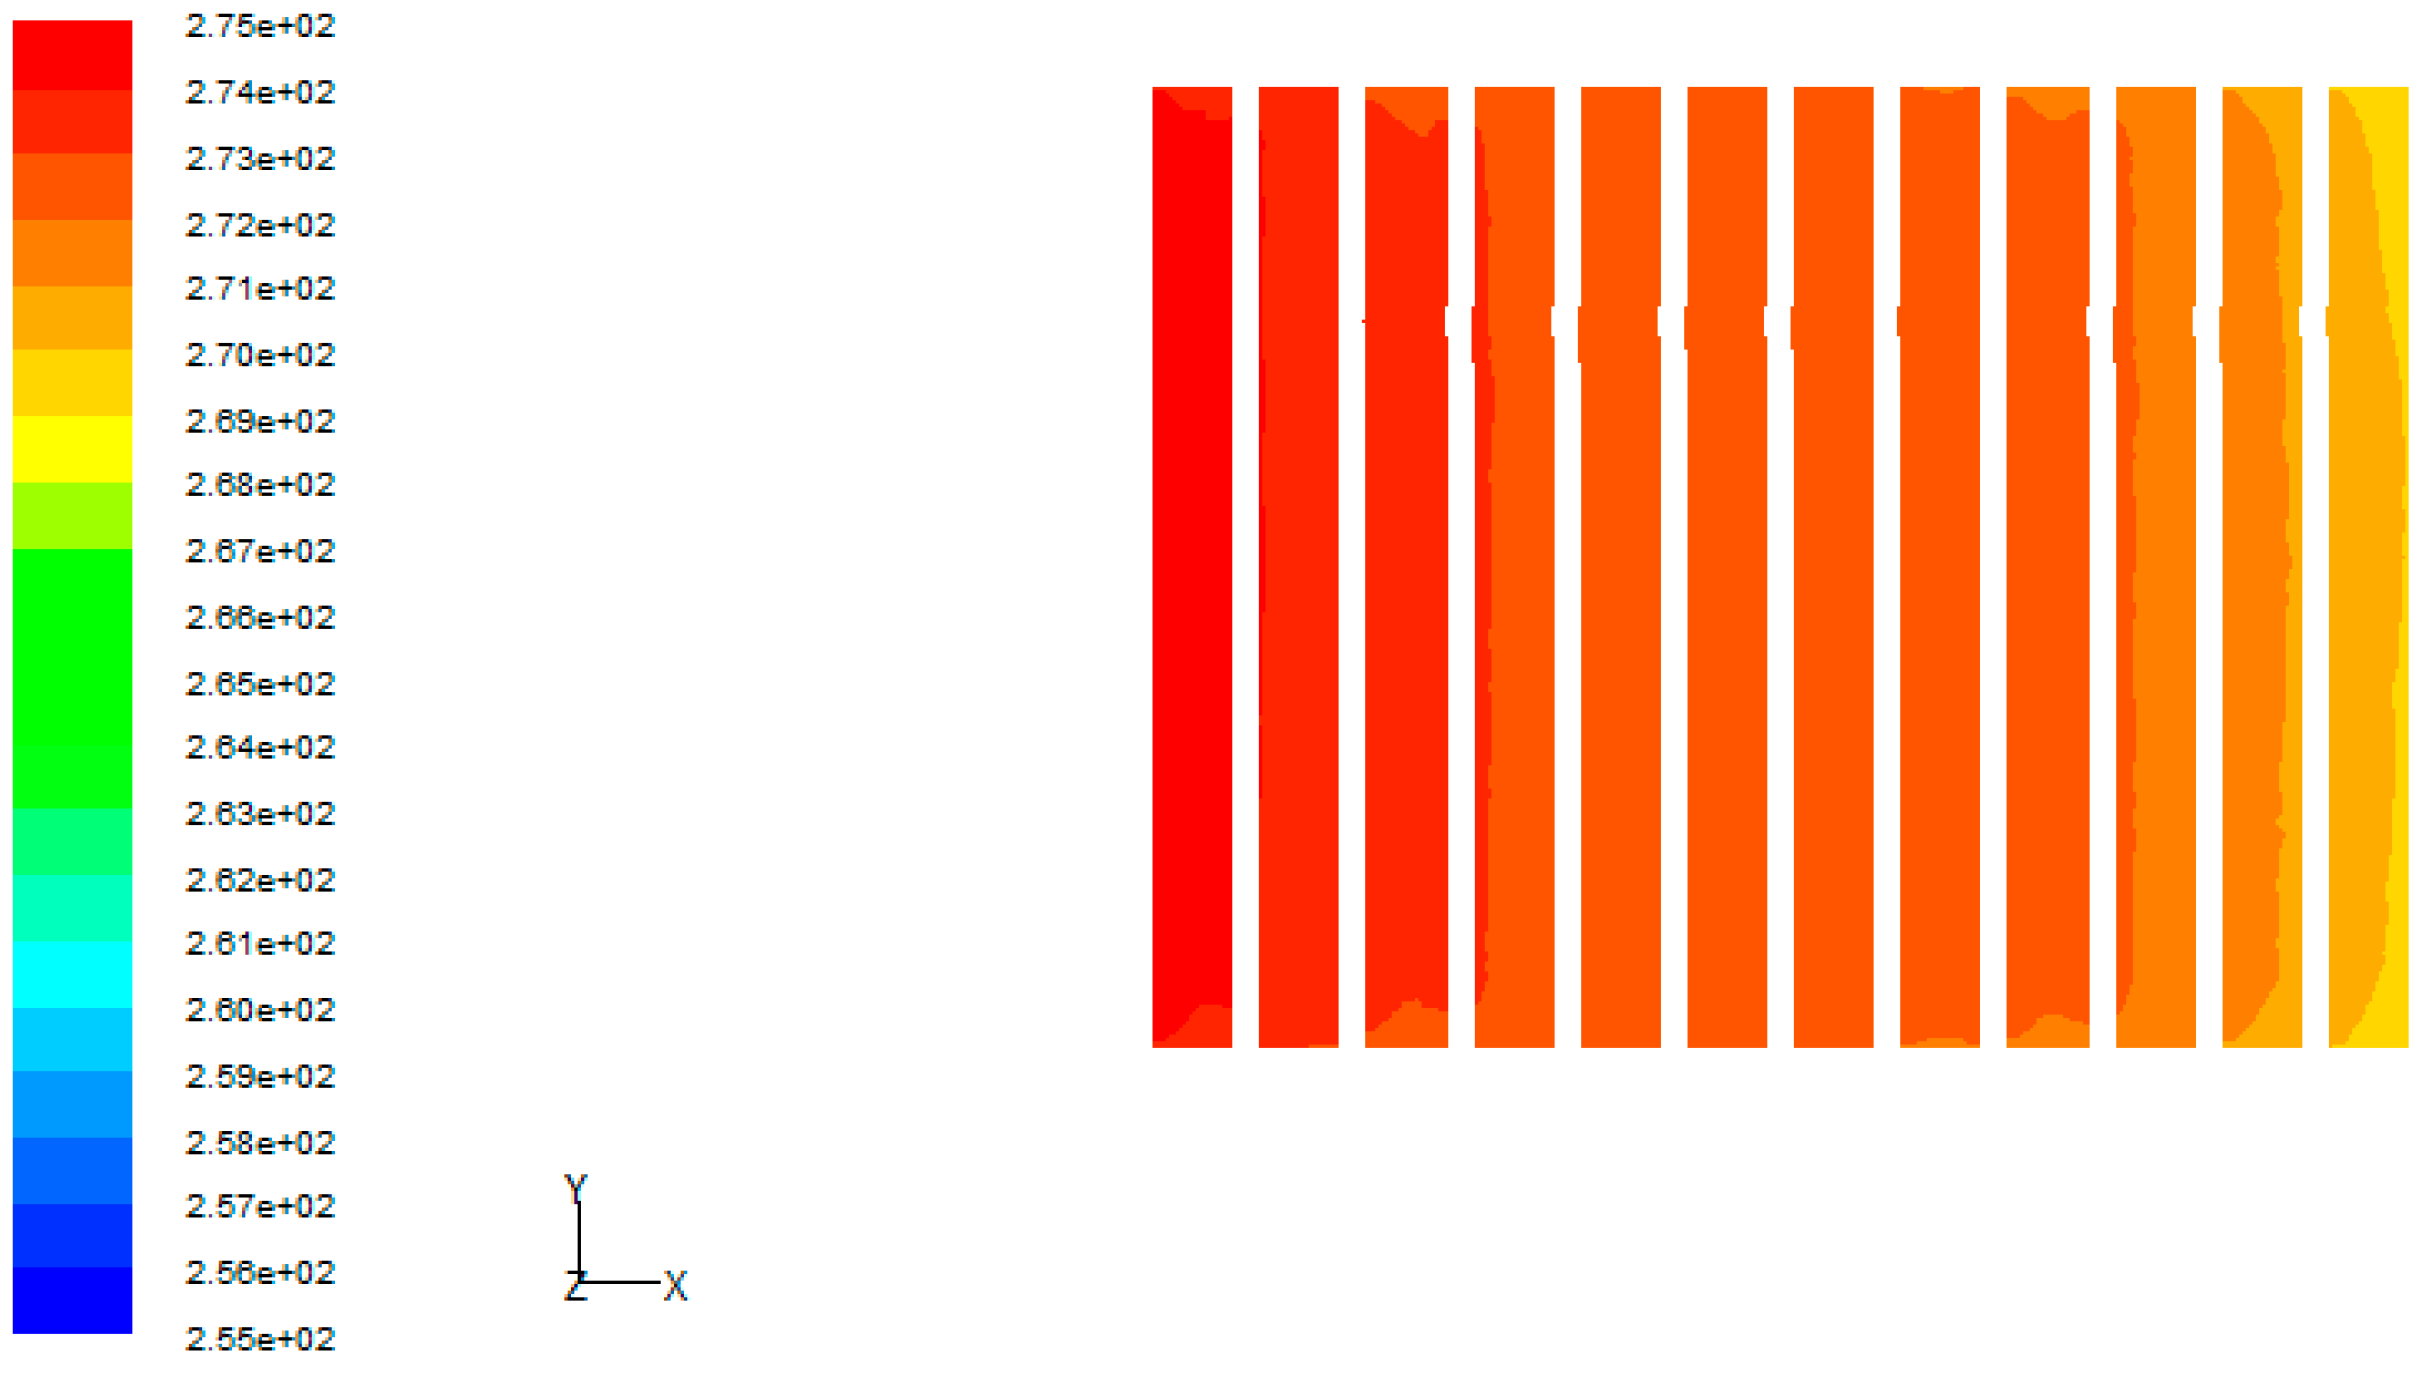
As can be seen from Figure 25, for the cell on the far left, namely in the middle of the original 48-s battery pack, it is raised to the highest temperature of −18.8 °C after heating; for the cell on the far right, namely close to the pack container shell, the lowest temperature only reaches −23.47 °C after heating. The maximum temperature difference inside the pack amounts to 4.67 °C. Similarly, as can be seen in Figure 26, the highest and lowest temperatures within the pack after heating are 0.248 °C and −3.258 °C, respectively, with a maximum temperature difference of 3.506 °C.
Although the quantity of heat generation for each cell is virtually identical, the temperature of the cell on the far left is the highest and the temperature of the cell on the far right is the lowest. The reason may be that the position of the cell on the far left is at the center of the original 48-s pack, and the heat convection is slow, as a result, it is kept at the highest temperature and vice versa, as the cell on the far right is placed next to the outer shell of the pack and the heat convection is rapid, it is maintained at the lowest temperature. The temperature difference after the second heating is smaller than that of the first heating, which may be explained by the fact that with the extension of heating time, the heat generated inside the battery is more favorable for the uniform temperature distribution.
6. Conclusions
The work presented in this paper can be summarized as follows:
- (1)
- A PTC self-heating method is proposed, in which the supplying power is the pack itself rather than the external power source, and EVs can be operated independently of external power source in cold areas.
- (2)
- Although the power consumption of the pack truly exists in the self-heating experiment process (the consumed energy in the whole self-heating experiment is approximately 13% of the total pack energy), the experimental results show that the charge/discharge capability and capacity recovery of the pack in Self-heating Experiment I are superior to that of the pack in the other two heating experiments. The results fully illustrate the superiority of the method and the pack with a high SOC is more helpful to the recovery of LIB performance.
- (3)
- Although the average internal heat generation rate is only 11.5% of the external heat generation rate, the impact of temperature rise on capacity recovery cannot be ignored because the internal heat has a direct effect on the inside of LIB.
- (4)
- The simulation results verify the accuracy of the modeling and simulation, and demonstrate that temperature distribution inside the pack after heating is kept uniform, which further proves that this method is of great value for the performance improvement of LIB and can be utilized to effectively promote the feasibility and applicability of EVs at low temperatures. However, if the initial SOC of the LIB pack is small and self-heating is unavailable, external power source heating is an alternative approach. The main reasons are that the energy and capacity of the pack with the external power source heating cannot be reduced. In our future work, we will work at a strategy that can incorporate the advantages of both internal and external heating to reduce the restrictions on initial SOC.
Acknowledgments
The authors would like to thank the Collaborative Innovation Center of Electric Vehicles in Beijing Institute of Technology for the support of this research project.
Author Contributions
Chengning Zhang and Junqiu Li contributed to the conception of the study; Xin Jin did the experiments and established the model; Junqiu Li and Xin Jin performed the data analyses and wrote the manuscript; Chengning Zhang helped perform the analysis with constructive discussions.
Conflicts of Interest
The authors declare no conflict of interest.
References
- Ng, S.S.; Xing, Y.; Tsui, K.L. A naive bayes model for robust remaining useful life prediction of lithium-ion battery. Appl. Energy 2014, 118, 114–123. [Google Scholar] [CrossRef]
- Wang, C.; Xiong, R.; He, H.; Ding, X.; Shen, W. Efficiency analysis of a bidirectional DC/DC converter in a hybrid energy storage system for plug-in hybrid electric vehicles. Appl. Energy 2016, 183, 612–622. [Google Scholar] [CrossRef]
- Zhang, C.; Zhao, T.; Xu, Q.; An, L.; Zhao, G. Effects of operating temperature on the performance of vanadium redox flow batteries. Appl. Energy 2015, 155, 349–353. [Google Scholar] [CrossRef]
- Zhang, Y.; Xiong, R.; He, H.; Shen, W. A lithium-ion battery pack state of charge and state of energy estimation algorithms using a hardware-in-the-loop validation. IEEE Trans. Power Electron. 2016, 32, 4421–4431. [Google Scholar] [CrossRef]
- Song, Z.; Hofmann, H.; Li, J.; Hou, J.; Zhang, X.; Ouyang, M. The optimization of a hybrid energy storage system at subzero temperatures: Energy management strategy design and battery heating requirement analysis. Appl. Energy 2015, 159, 576–588. [Google Scholar] [CrossRef]
- Qiao, Y.; Tu, J.; Wang, X.; Gu, C. The low and high temperature electrochemical performances of Li 3 V 2 (PO 4) 3/C cathode material for Li-ion batteries. J. Power Sources 2012, 199, 287–292. [Google Scholar] [CrossRef]
- Zhang, S.; Xu, K.; Jow, T. Electrochemical impedance study on the low temperature of Li-ion batteries. Electrochim. Acta 2004, 49, 1057–1061. [Google Scholar] [CrossRef]
- Fan, J.; Tan, S. Studies on charging lithium-ion cells at low temperatures. J. Electrochem. Soc. 2006, 153, A1081–A1092. [Google Scholar] [CrossRef]
- Wang, Z.P.; Lu, C.; Liu, P. Reviews of Studying on Thermal Management System in EV/HEV Battery Pack. Adv. Mat. Res. 2011, 291–294, 1674–1678. [Google Scholar] [CrossRef]
- Zhang, C.-N.; Lei, Z.-G.; Dong, Y.-G. Method for heating low-temperature lithium battery in electric vehicle. Trans. Beijing Inst. Technol. 2012, 32, 921–925. [Google Scholar]
- Liu, C.S.; Zhang, H.W. Research on heating method at low temperature of electric vehicle battery. Chin. J. Power Sources 2015, 39, 1645–1647. (In Chinese) [Google Scholar]
- Wang, F.-C.; Zhang, J.-Z.; Wang, L.-F. Design of electric air-heated box for batteries in electric vehicles. Chin. J. Power Sources 2013, 7, 1184–1187. [Google Scholar]
- Wang, T.; Tseng, K.; Zhao, J.; Wei, Z. Thermal investigation of lithium-ion battery module with different cell arrangement structures and forced air-cooling strategies. Appl. Energy 2014, 134, 229–238. [Google Scholar] [CrossRef]
- Zhang, S.; Xu, K.; Jow, T. The low temperature performance of li-ion batteries. J. Power Sources 2003, 115, 137–140. [Google Scholar] [CrossRef]
- Hande, A.; Stuart, T. Ac Heating for EV/HEV Batteries. In Proceedings of the 2002 Power Electronics in Transportation, Auburn Hills, MI, USA, 24–25 October 2002; pp. 119–124. [Google Scholar]
- Hande, A. A High Frequency Inverter for Cold Temperature Battery Heating. In Proceedings of the 2004 IEEE Workshop on Computers in Power Electronics, Piscataway, NJ, USA, 15–18 August 2004; pp. 215–222. [Google Scholar]
- Stuart, T.; Hande, A. Hev battery heating using ac currents. J. Power Sources 2004, 129, 368–378. [Google Scholar] [CrossRef]
- Hande, A.; Stuart, T. Effects of high frequency ac currents on cold temperature battery performance. In Proceedings of the 9th IEEE International Power Electronics Congress (IICPE 2004), Mumbai, India, 17–22 October 2004. [Google Scholar]
- Zhang, J.; Ge, H.; Li, Z.; Ding, Z. Internal heating of lithium-ion batteries using alternating current based on the heat generation model in frequency domain. J. Power Sources 2015, 273, 1030–1037. [Google Scholar] [CrossRef]
- Zhao, X.W.; Zhang, G.Y.; Yang, L.; Qiang, J.X.; Chen, Z.Q. A new charging mode of li-ion batteries with life PO4/C composites under low temperature. J. Therm. Anal. Calorim. 2011, 104, 561–567. [Google Scholar] [CrossRef]
- Jiang, J.; Ruan, H.; Sun, B.; Zhang, W.; Gao, W.; Wang, L.Y.; Zhang, L. A reduced low-temperature electro-thermal coupled model for lithium-ion batteries. Appl. Energy 2016, 177, 804–816. [Google Scholar] [CrossRef]
- Sato, N. Thermal behavior analysis of lithium-ion batteries for electric and hybrid vehicles. J. Power Sources 2001, 99, 70–77. [Google Scholar] [CrossRef]
- Lin, C.; Mu, H.; Xiong, R.; Shen, W. A novel multi-model probability battery state of charge estimation approach for electric vehicles using h-infinity algorithm. Appl. Energy 2016, 166, 76–83. [Google Scholar] [CrossRef]
- Sun, F.; Xiong, R.; He, H. A systematic state-of-charge estimation framework for multi-cell battery pack in electric vehicles using bias correction technique. Appl. Energy 2016, 162, 1399–1409. [Google Scholar] [CrossRef]
- Sun, F.; Xiong, R. A novel dual-scale cell state-of-charge estimation approach for series-connected battery pack used in electric vehicles. J. Power Sources 2015, 274, 582–594. [Google Scholar] [CrossRef]
- Tiedemann, W.H.; Newman, J.; Gross, S. Battery design and optimization. J. Electrochem. Soc. 1979, 79, 23. [Google Scholar]
- Pollard, R.; Newman, J. Mathematical modeling of the lithium‐aluminum, iron sulfide battery I. Galvanostatic discharge behavior. J. Electrochem. Soc. 1981, 128, 491–502. [Google Scholar] [CrossRef]
- Bernardi, D.; Pawlikowski, E.; Newman, J. A general energy balance for battery systems. J. Electrochem. Soc. 1985, 132, 5–12. [Google Scholar] [CrossRef]
Figure 1.
The 1C charge characteristics of a cell at different temperatures.

Figure 2.
Schematic diagram of PTC self-heating method.

Figure 3.
Product of battery pack with PTC.
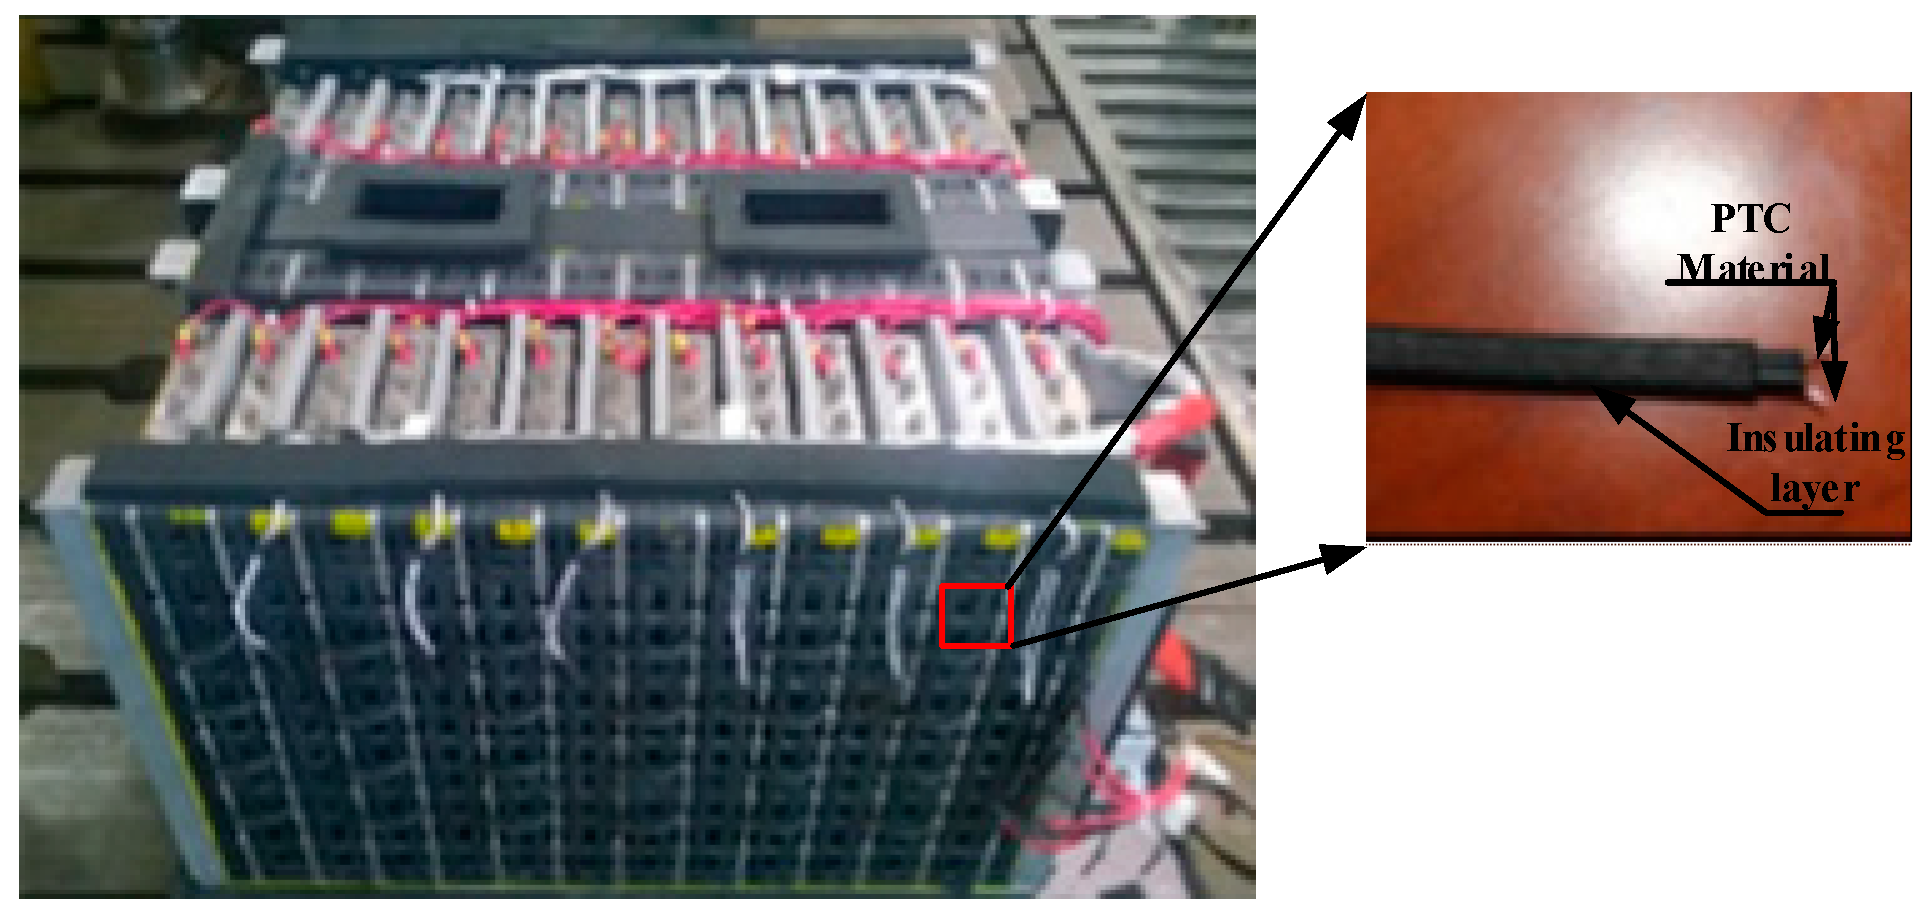
Figure 4.
The characteristics of the PTC material: (a) The resistance characteristic of PTC; and (b) the current curve in the heating process at −40 °C.
Figure 4.
The characteristics of the PTC material: (a) The resistance characteristic of PTC; and (b) the current curve in the heating process at −40 °C.
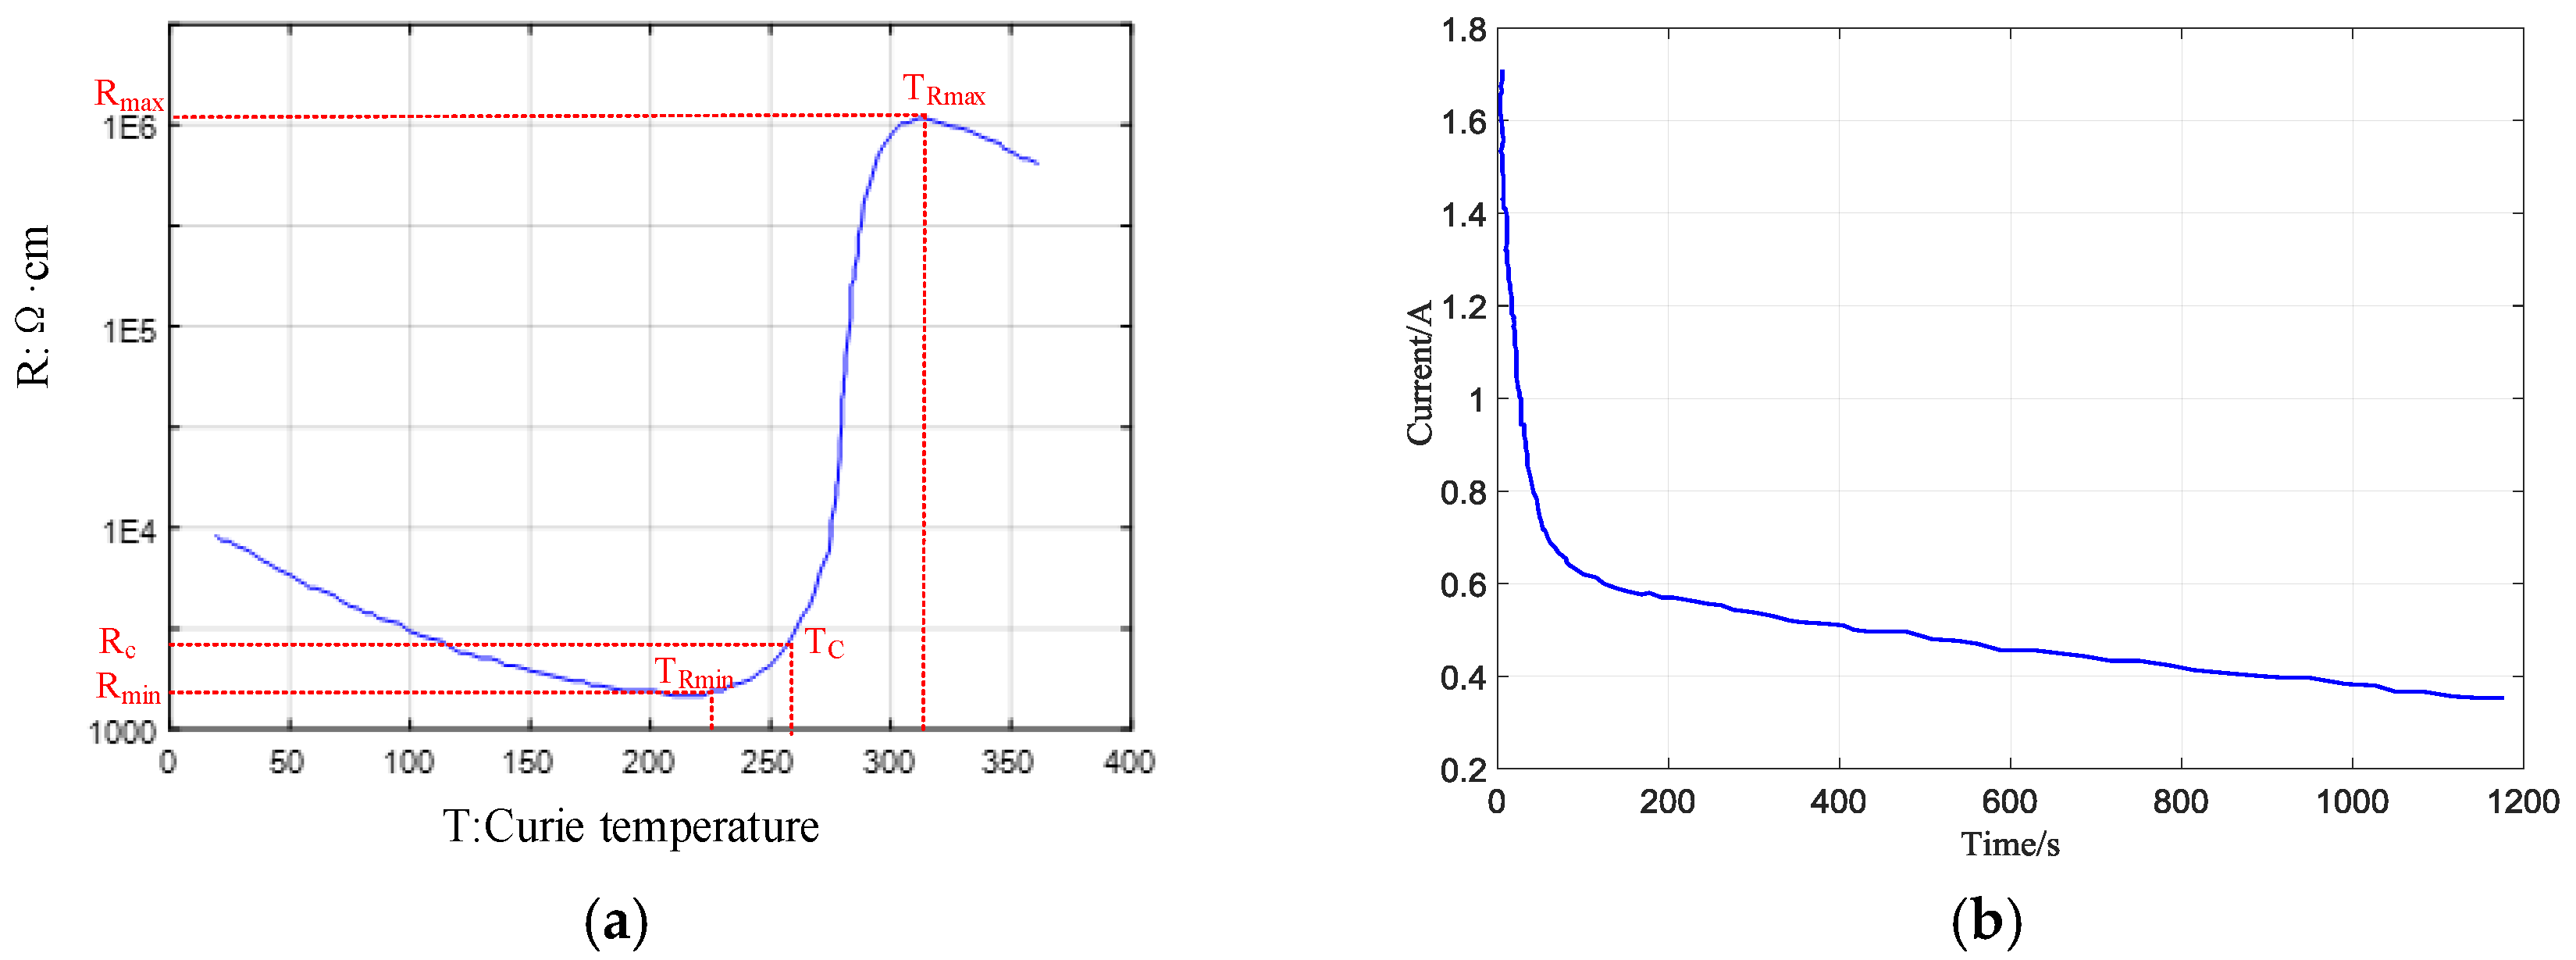
Figure 5.
The scene photos of the experiments.
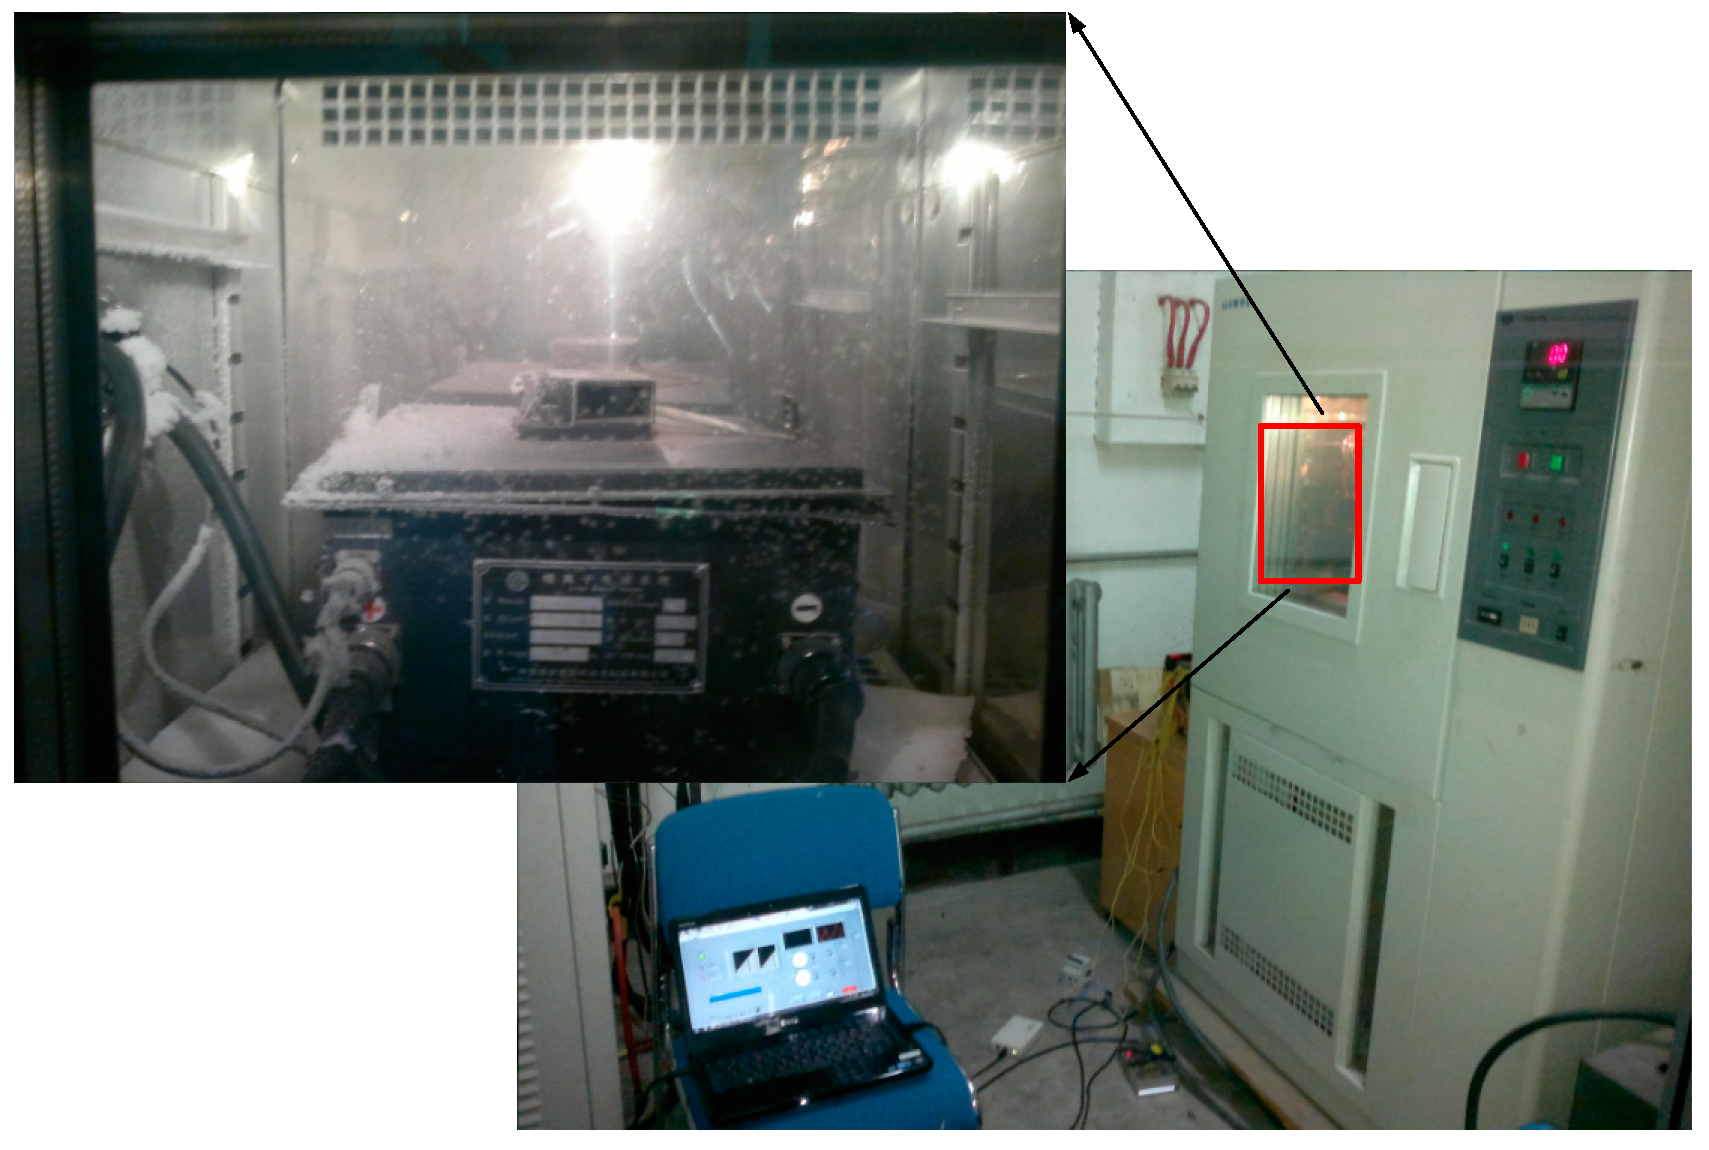
Figure 6.
The first heating curves of Self-heating Experiment I.
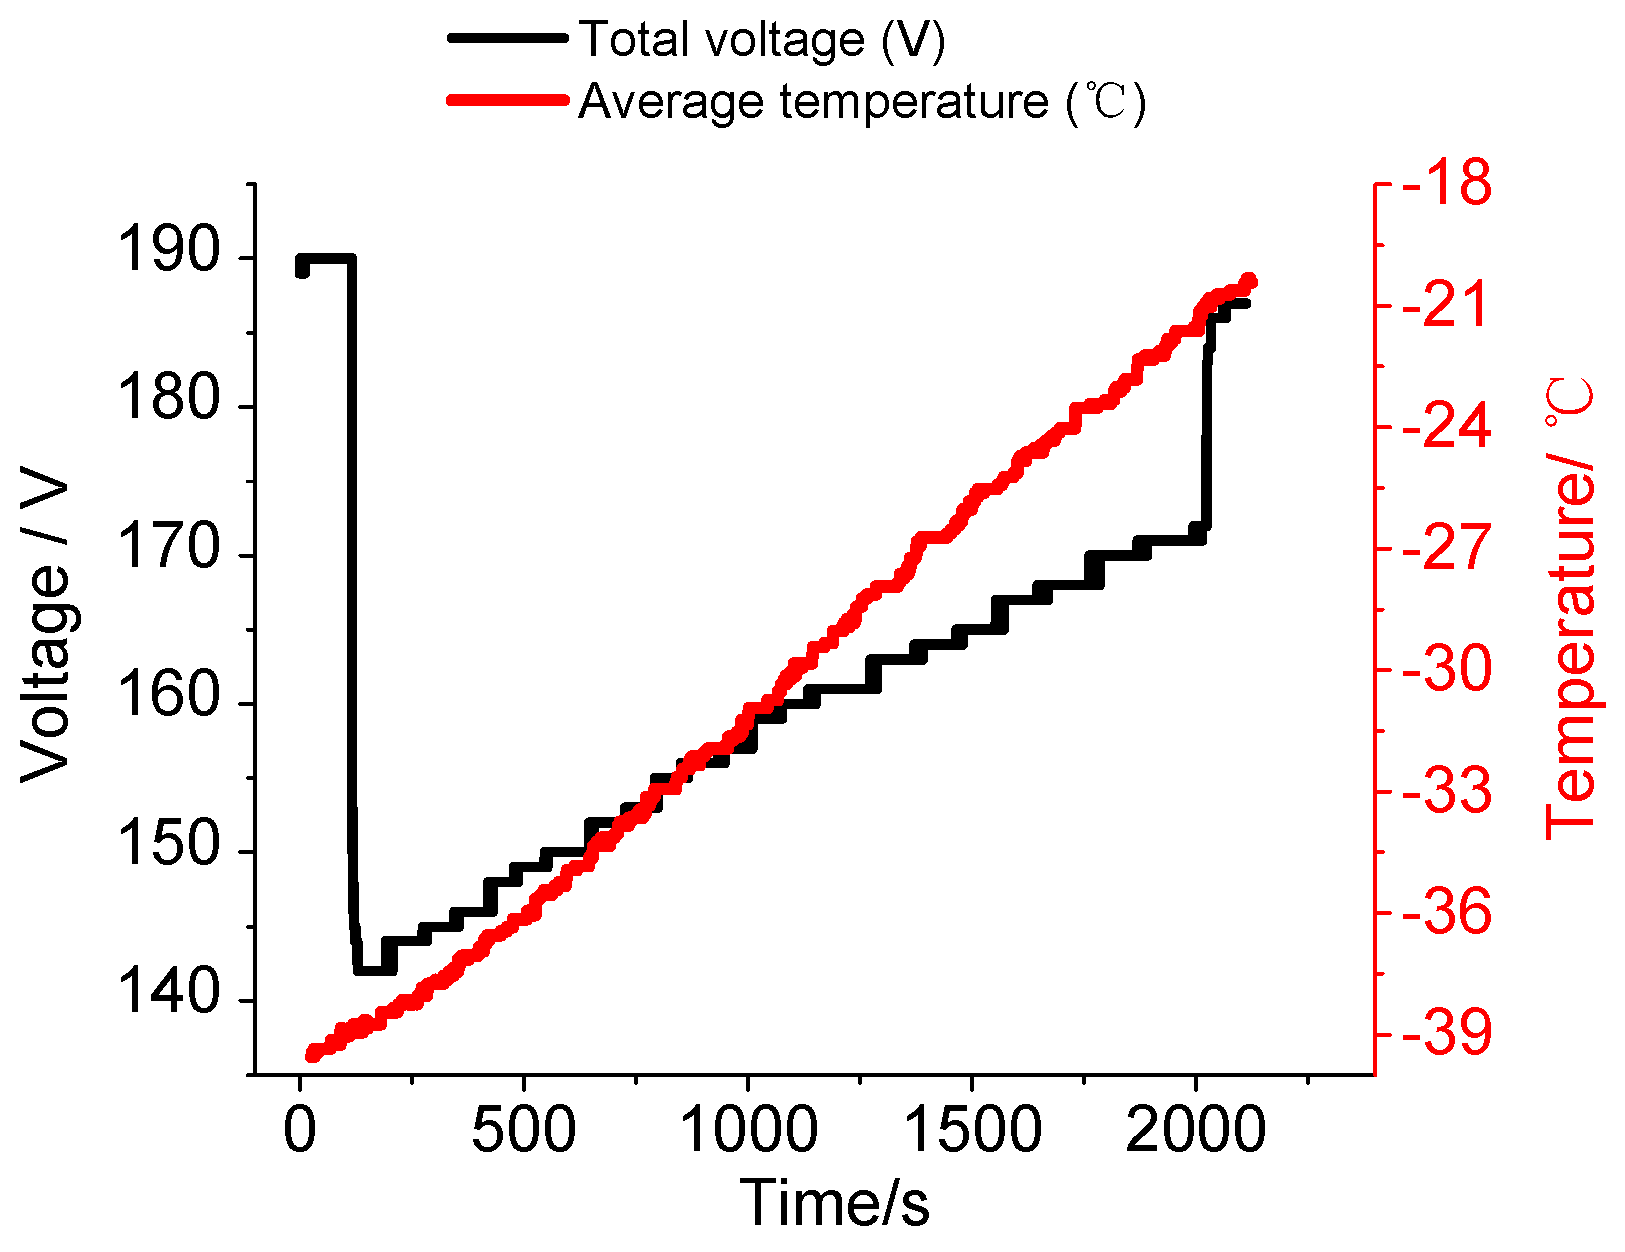
Figure 7.
The second heating curves of Self-heating Experiment I.

Figure 8.
The first heating curves of Self-heating Experiment II.
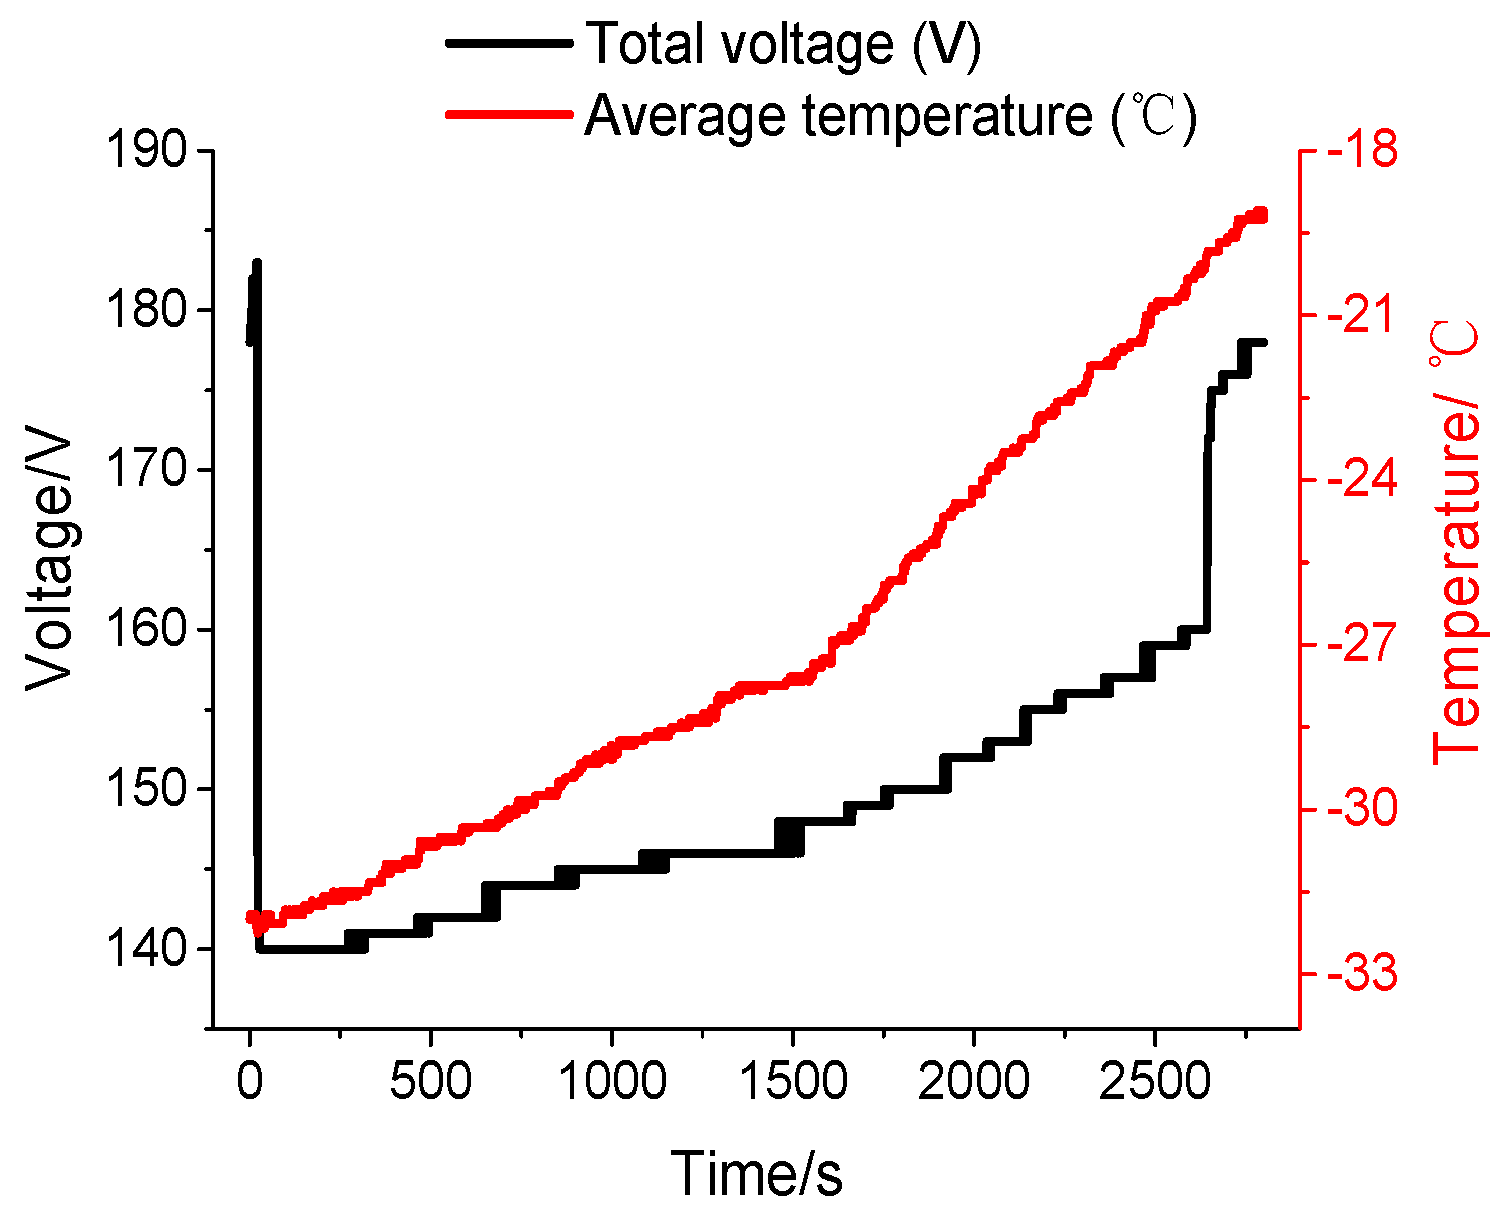
Figure 9.
The second heating curves of Self-heating Experiment II.
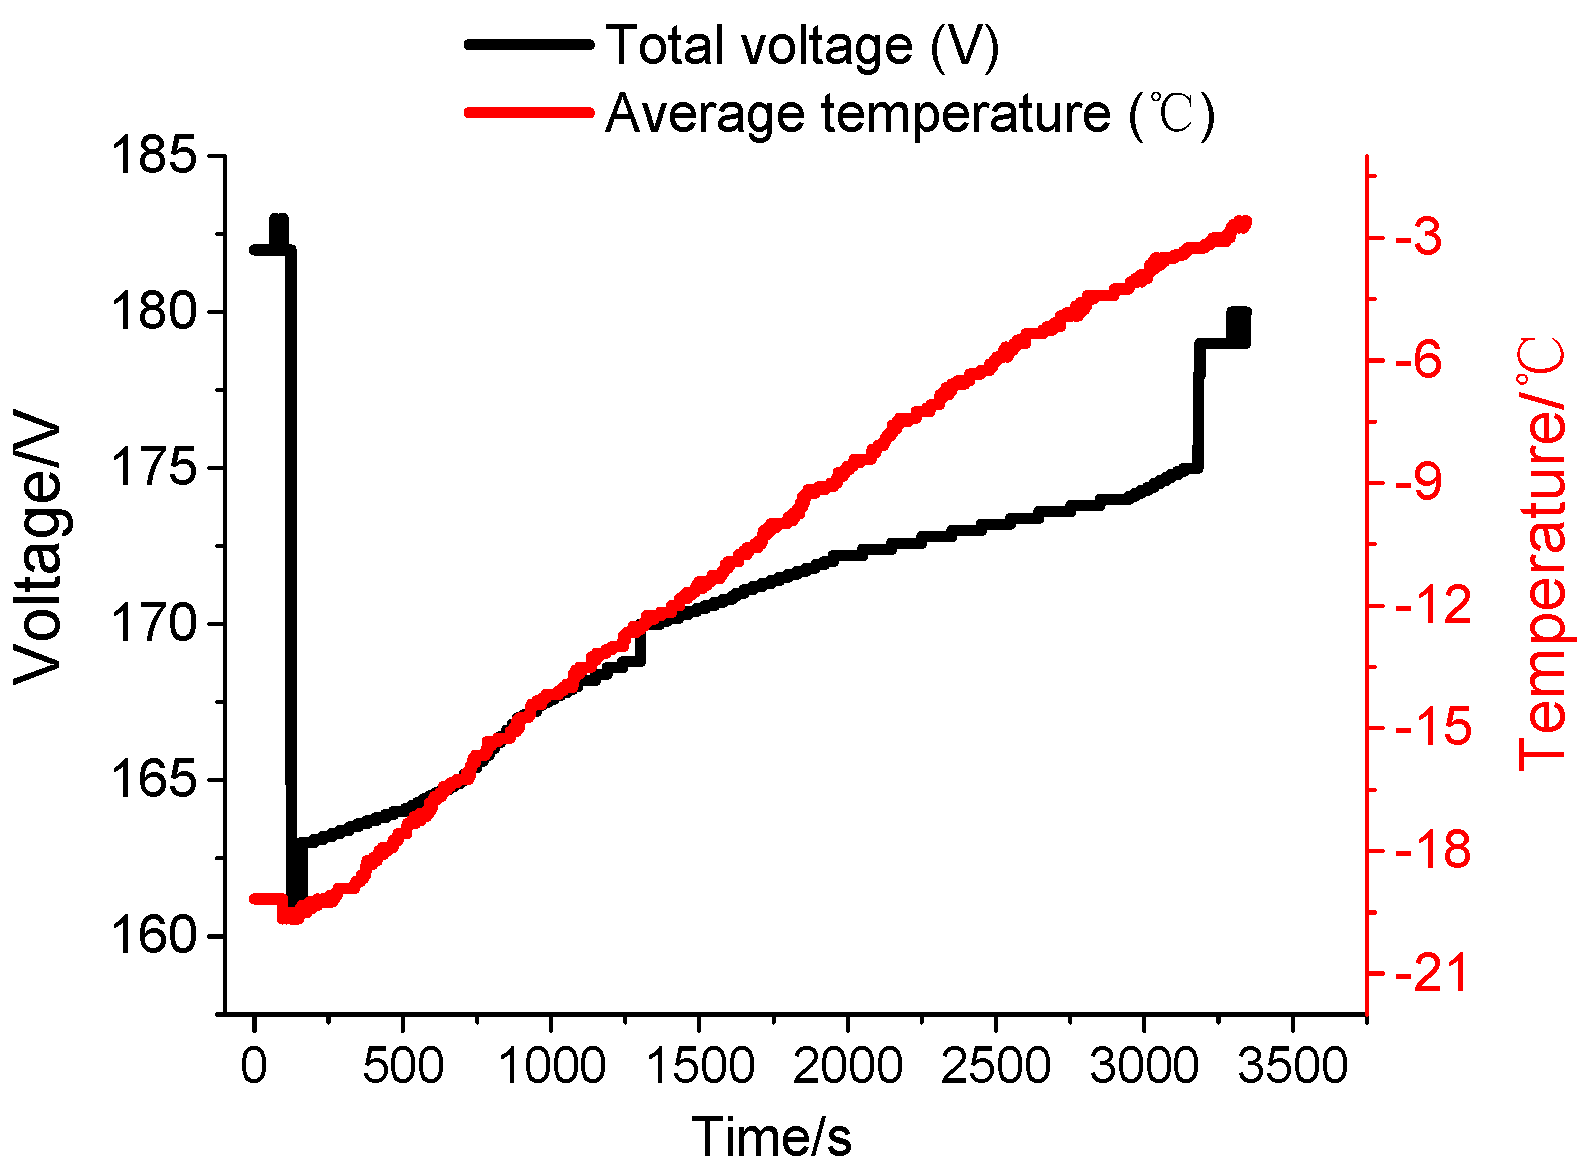
Figure 10.
Pulse discharge capability of the pack after the first heating with an external power source.
Figure 10.
Pulse discharge capability of the pack after the first heating with an external power source.
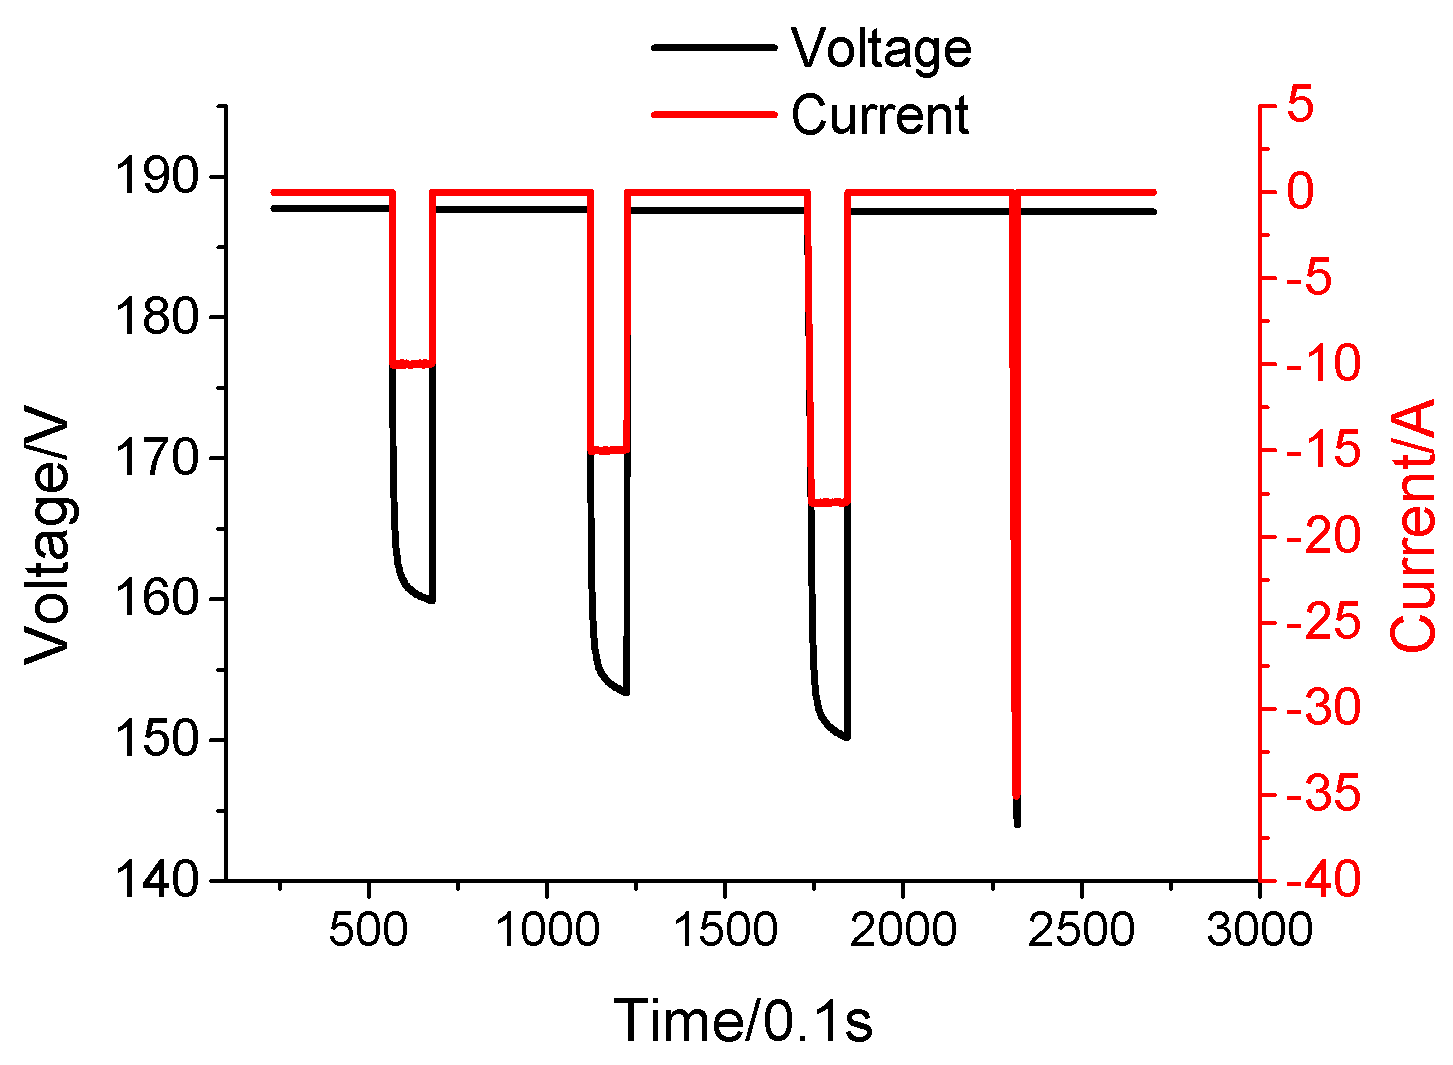
Figure 11.
Pulse discharge capability of the pack after the second heating with an external power source.
Figure 11.
Pulse discharge capability of the pack after the second heating with an external power source.

Figure 12.
Pulse discharge capability of the pack after the first heating in Self-heating Experiment I.
Figure 12.
Pulse discharge capability of the pack after the first heating in Self-heating Experiment I.
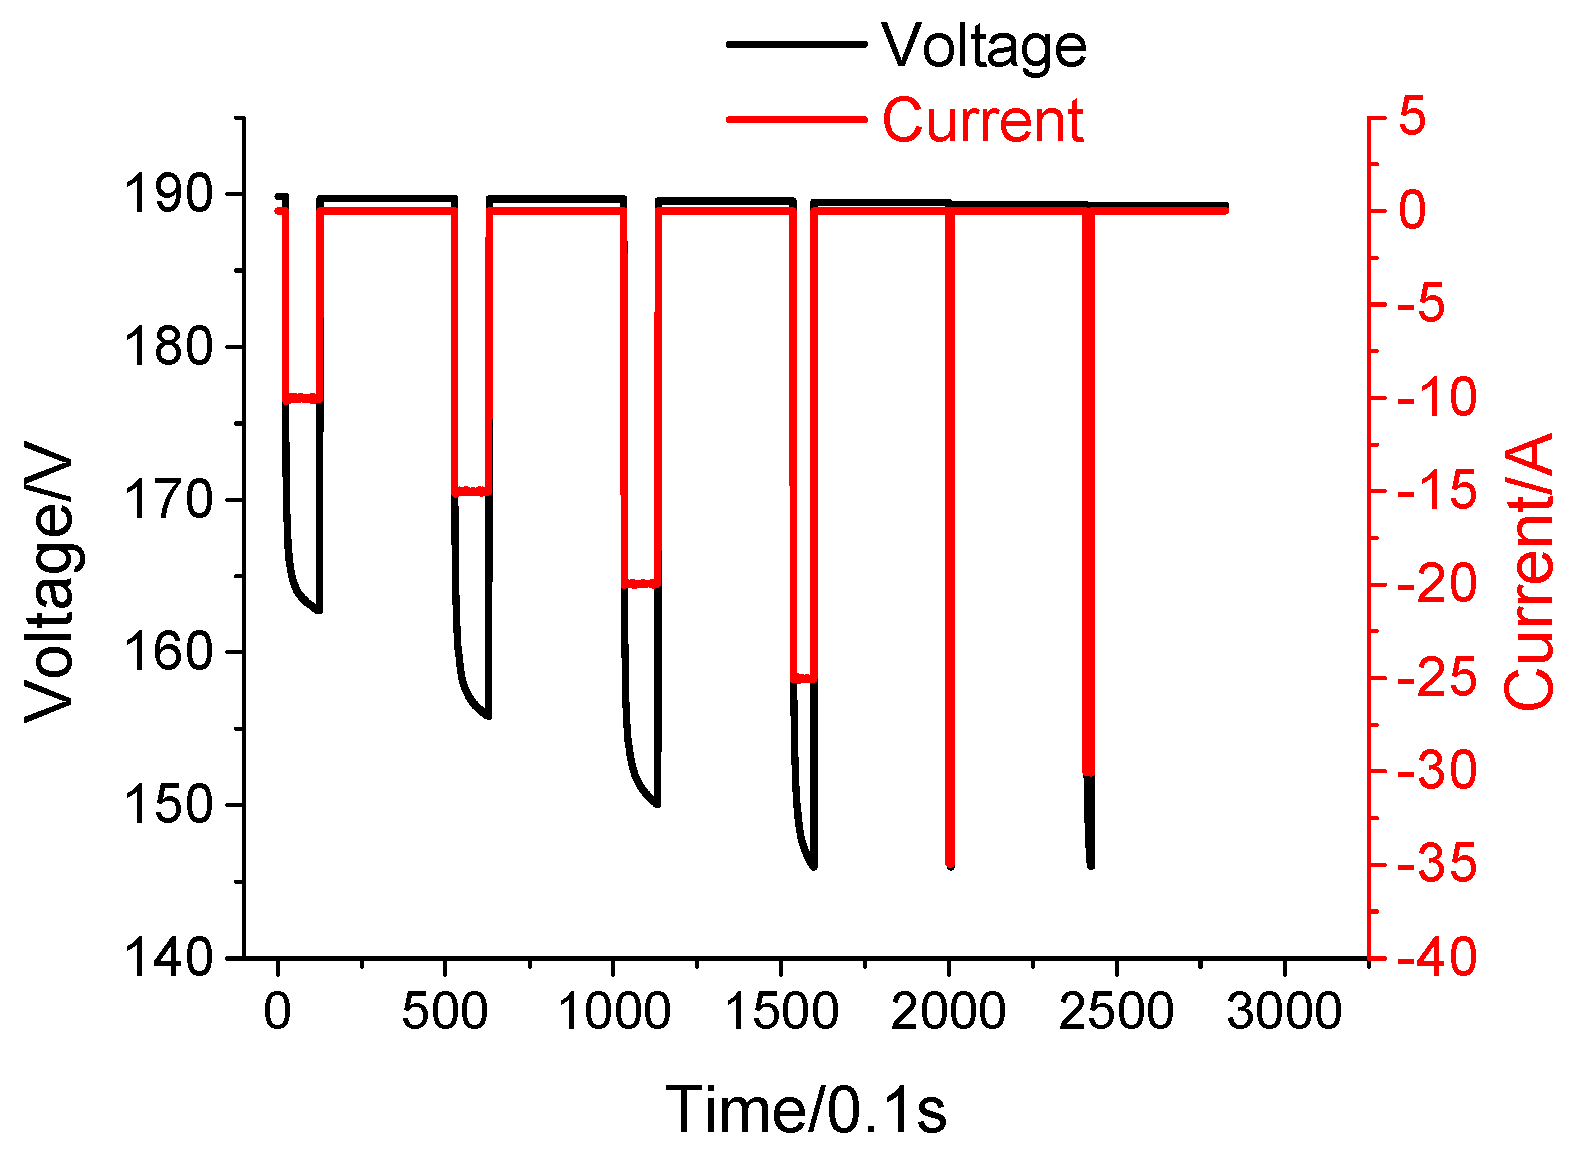
Figure 13.
Pulse discharge capability of the pack after the second heating in Self-heating Experiment I.
Figure 13.
Pulse discharge capability of the pack after the second heating in Self-heating Experiment I.
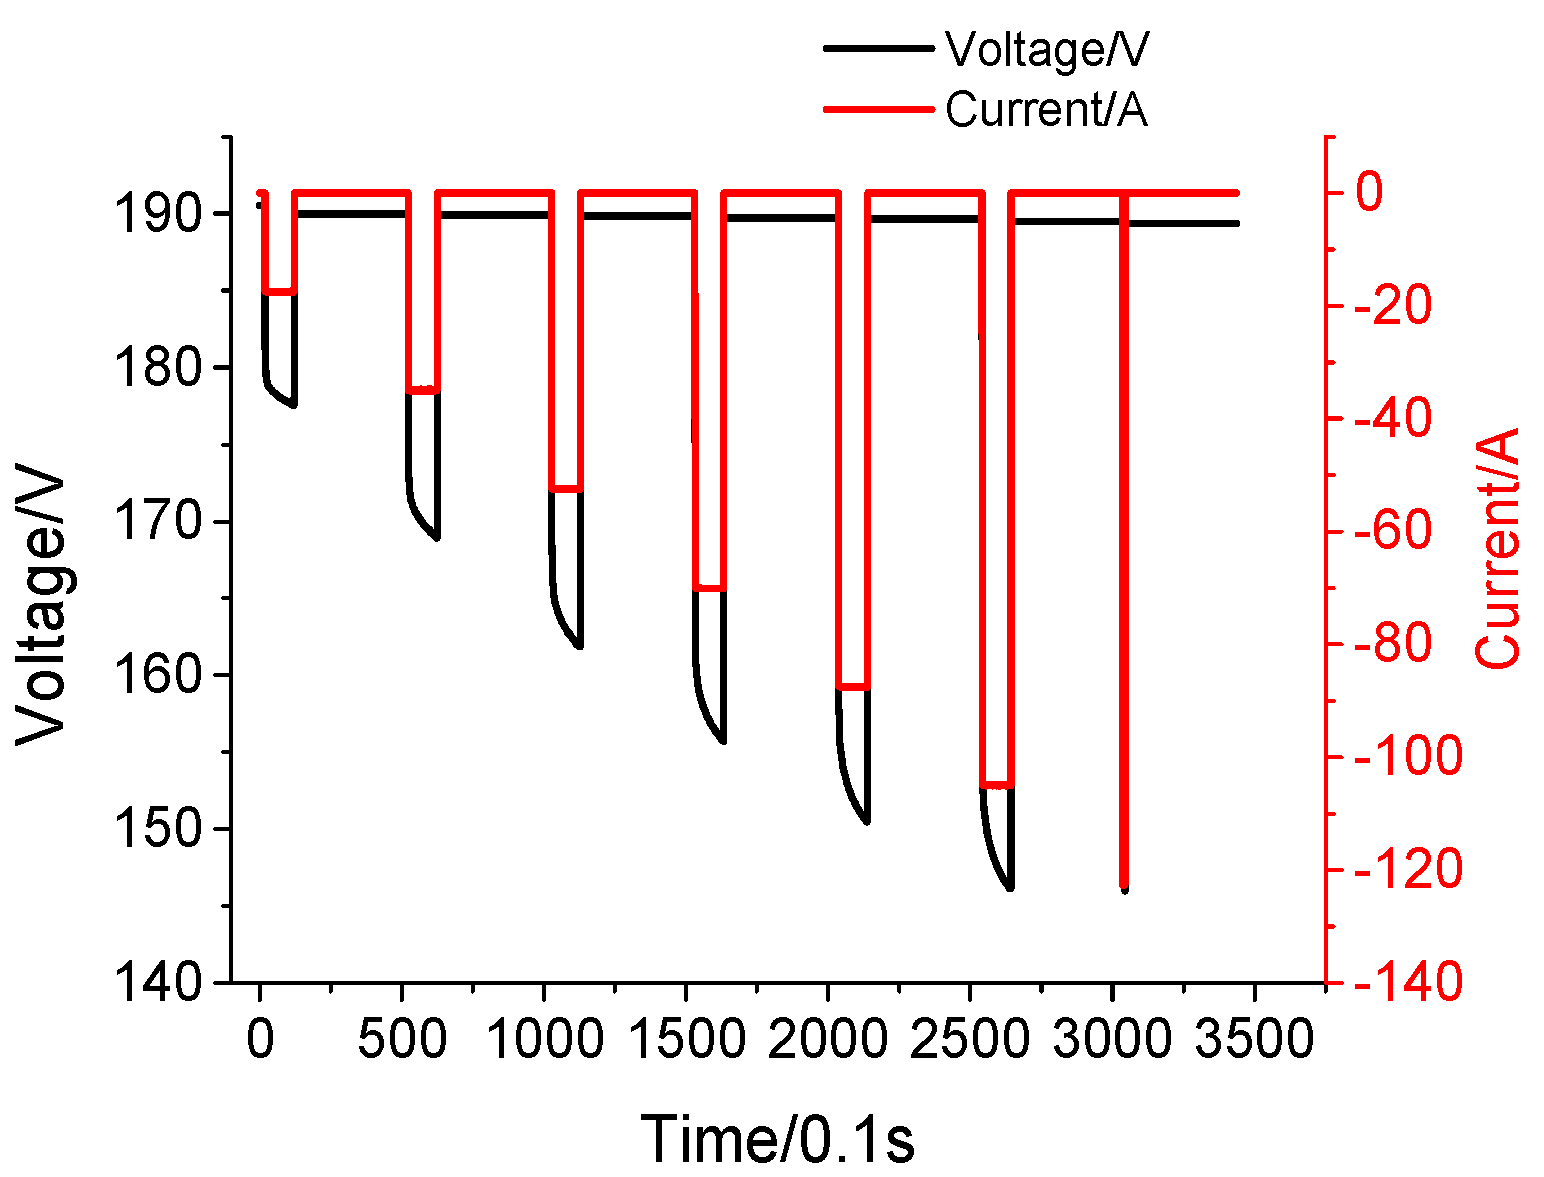
Figure 14.
Pulse discharge capability of the pack after the first heating in Self-heating Experiment II.
Figure 14.
Pulse discharge capability of the pack after the first heating in Self-heating Experiment II.

Figure 15.
Pulse discharge capability of the pack after the second heating in Self-heating Experiment II.
Figure 15.
Pulse discharge capability of the pack after the second heating in Self-heating Experiment II.
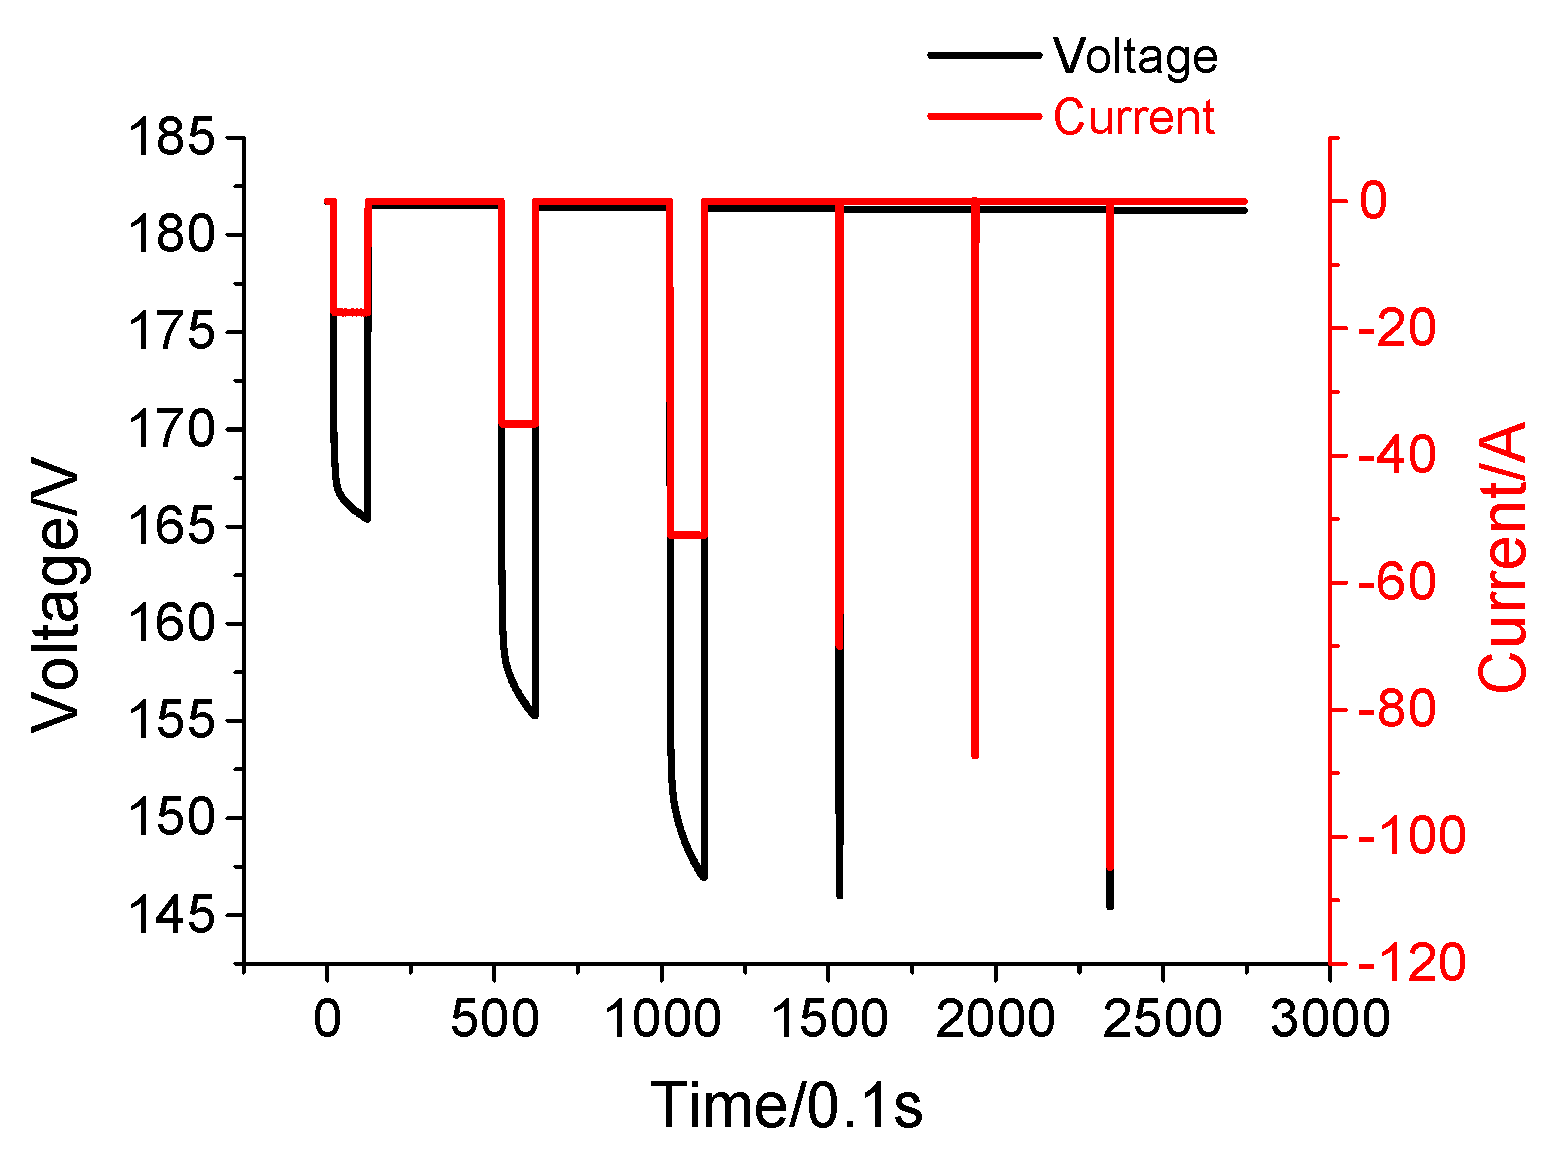
Figure 16.
Comparison of 1C CC discharge tests.
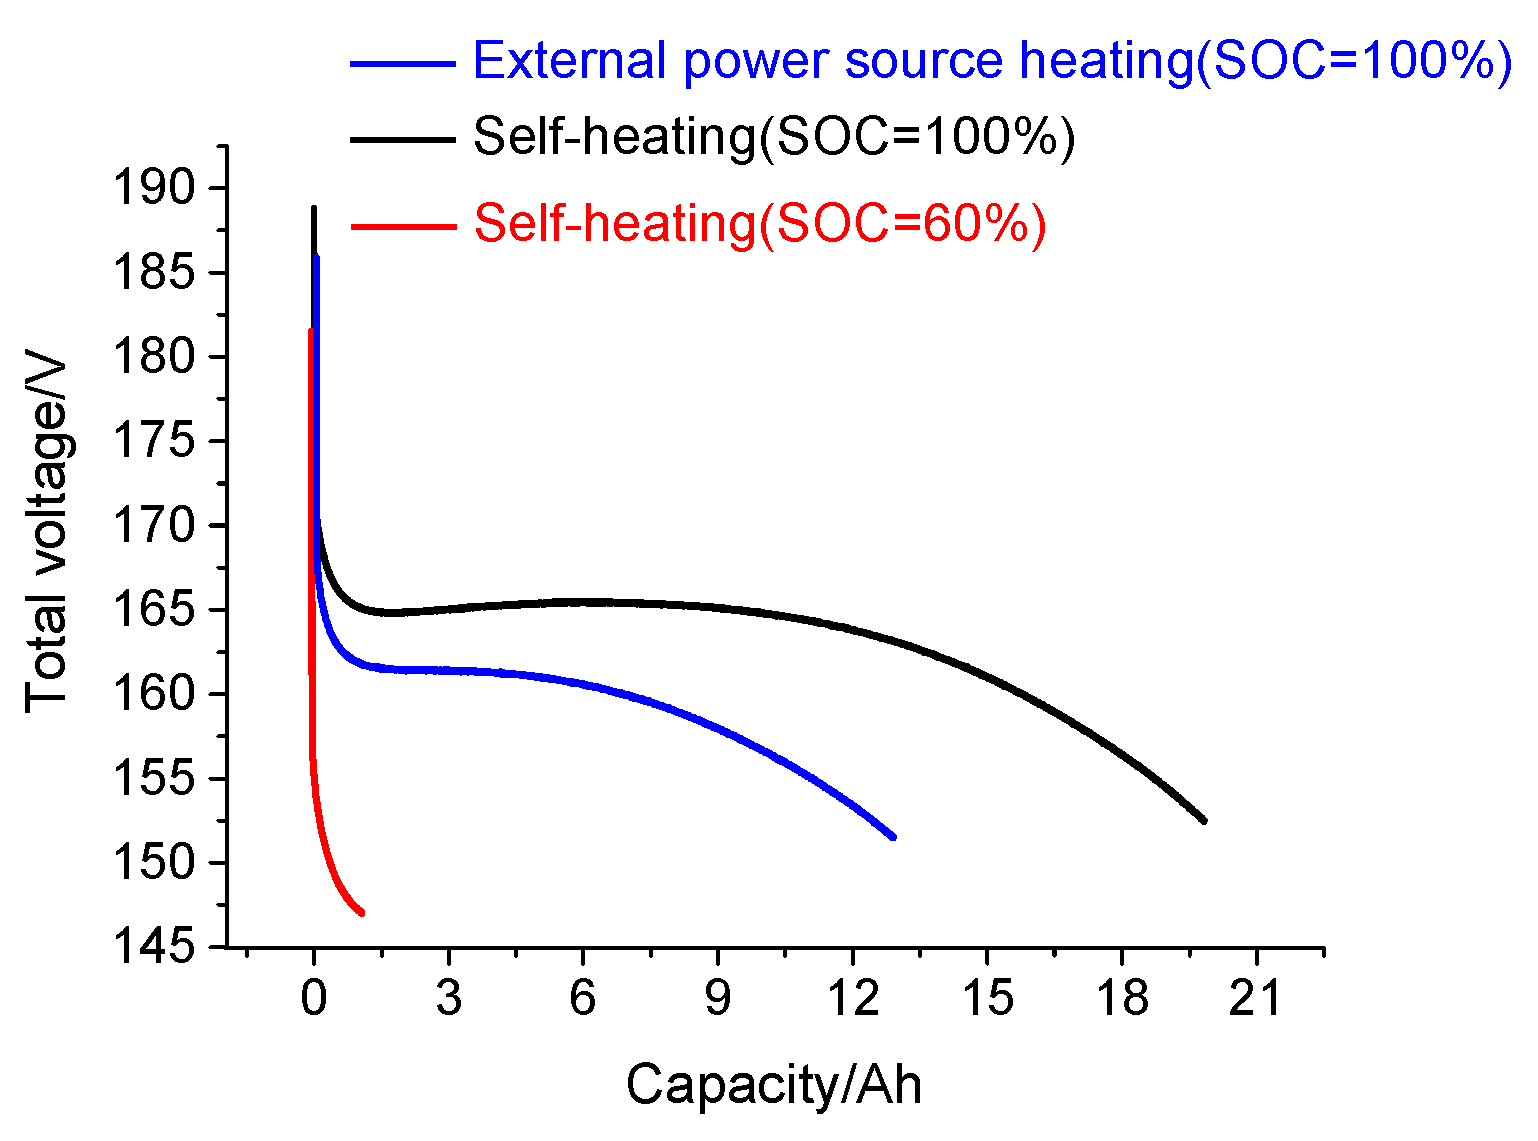
Figure 17.
Comparison of simulation results of two models and the experimental results. (a) Temperature variation in the charge process; and (b) temperature variation in the discharge process.
Figure 17.
Comparison of simulation results of two models and the experimental results. (a) Temperature variation in the charge process; and (b) temperature variation in the discharge process.

Figure 18.
The micro-unit of the cell.

Figure 19.
The 1/4 geometry model.
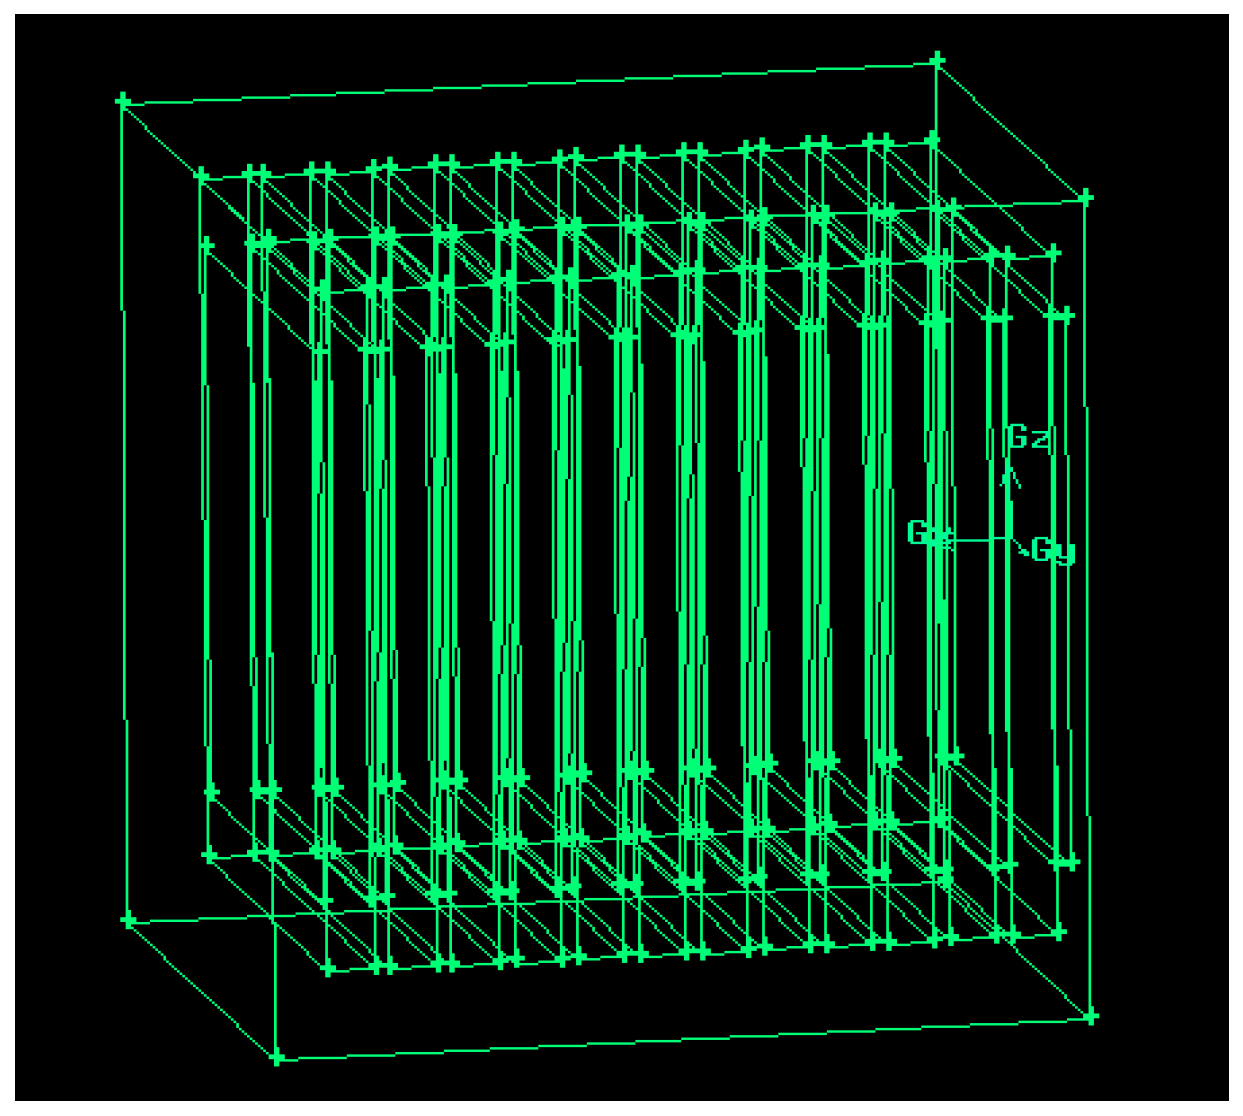
Figure 20.
Heating current and heating power in the first self-heating process.
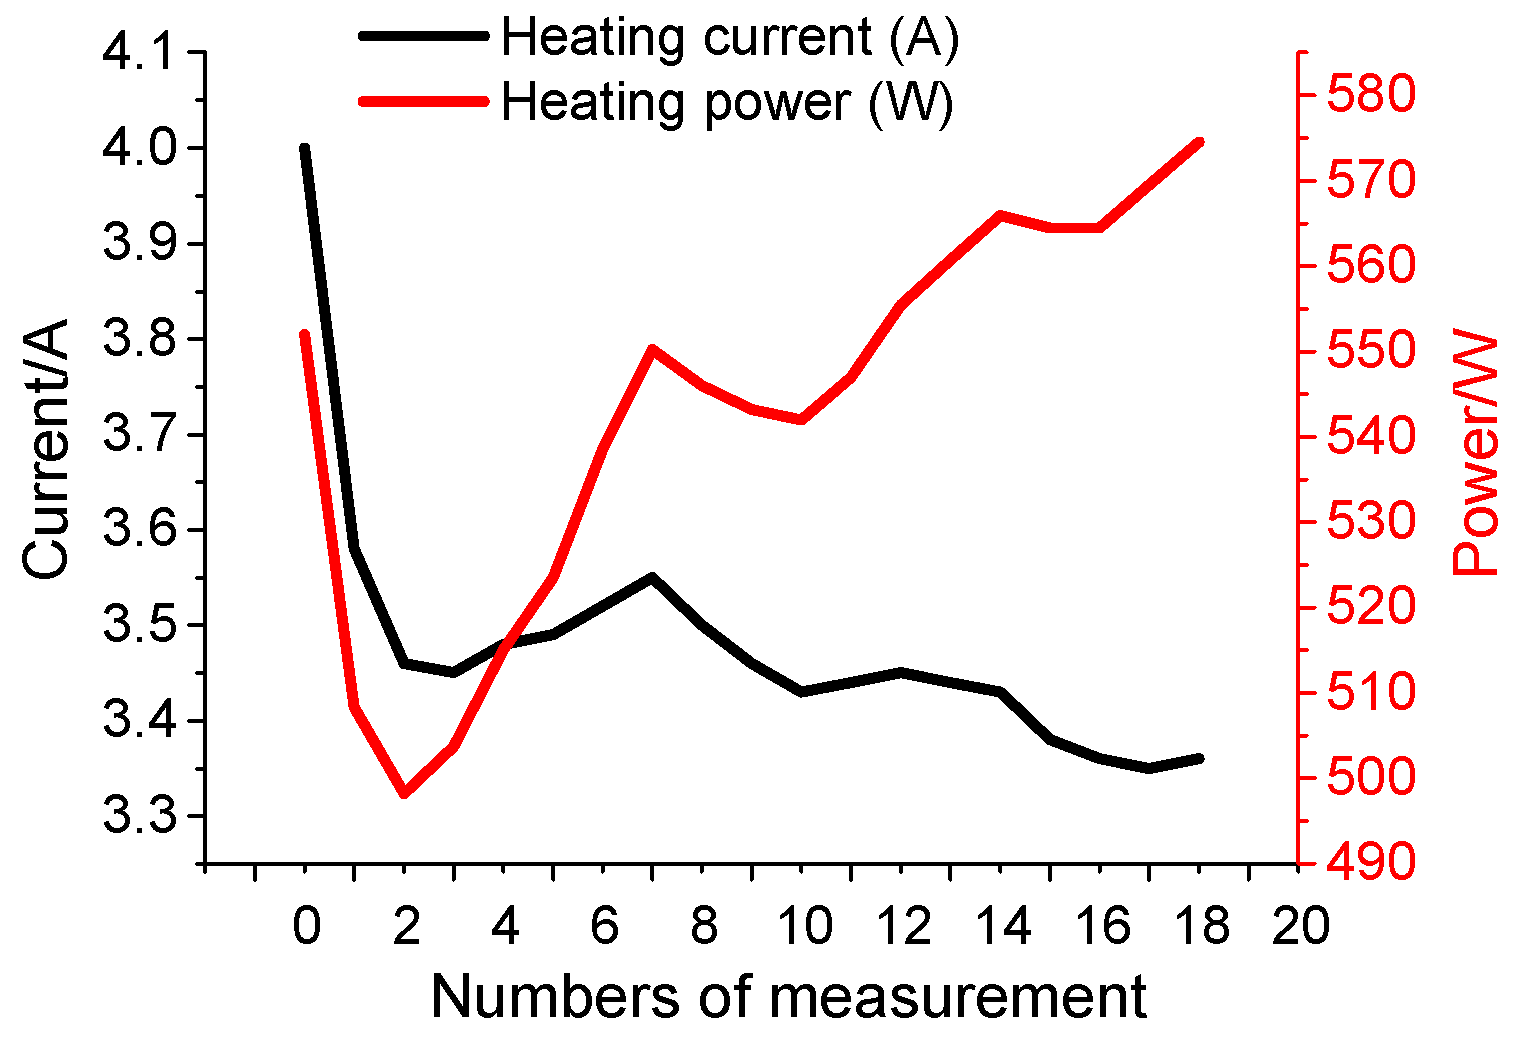
Figure 21.
Heating current and heating power in the second self-heating process.

Figure 22.
Variation of the internal and external heat generation rates of the whole self-heating process.
Figure 22.
Variation of the internal and external heat generation rates of the whole self-heating process.

Figure 23.
Comparison of simulation and experimental results in the first self-heating process.
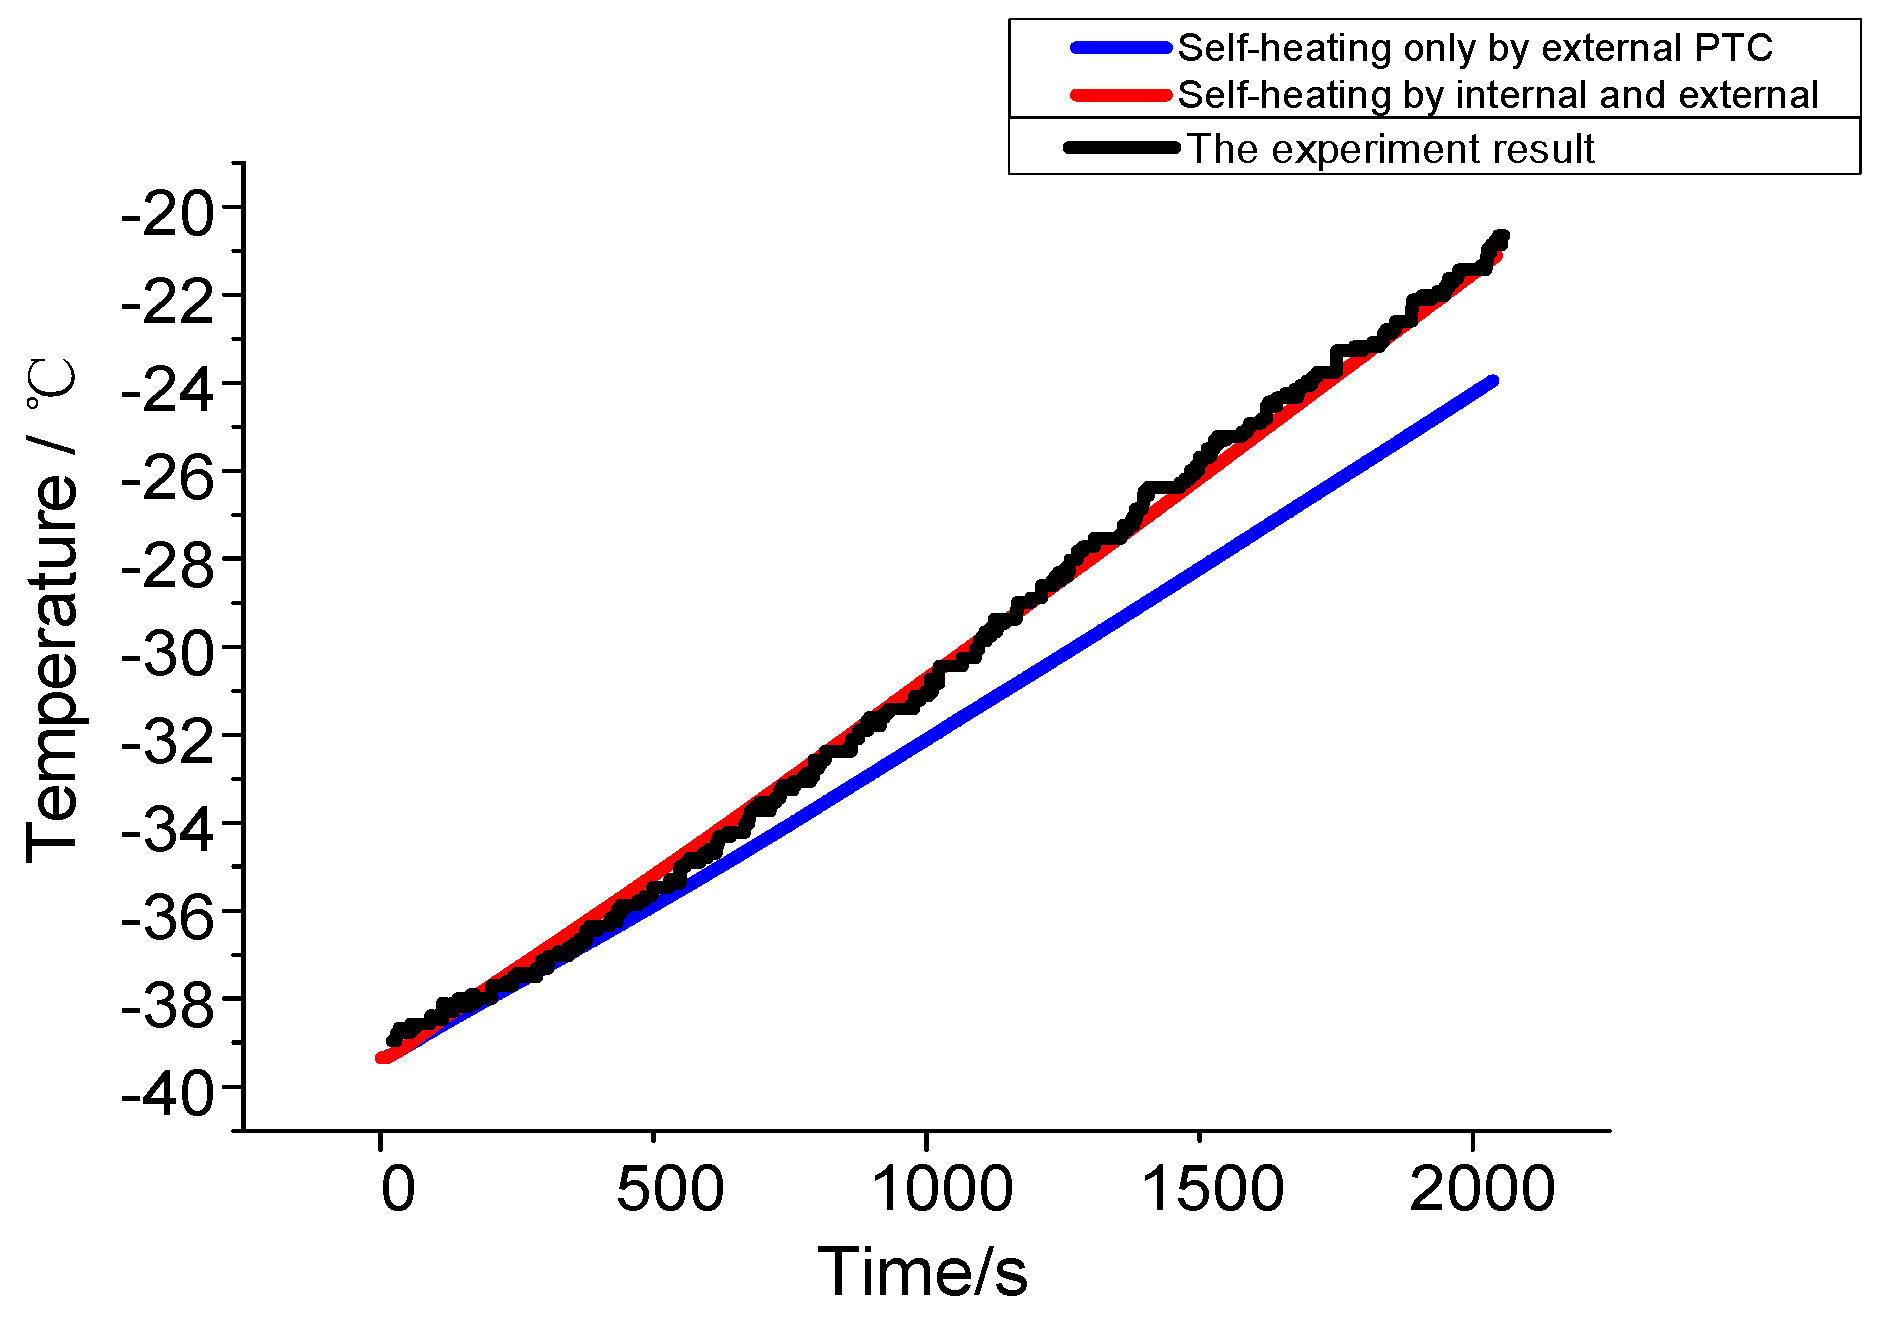
Figure 24.
Comparison of simulation and experimental results in the second self-heating process.

Figure 25.
Temperature distribution of 12 cells on the z = 0 section (the center) at the end of the first self-heating process.
Figure 25.
Temperature distribution of 12 cells on the z = 0 section (the center) at the end of the first self-heating process.

Figure 26.
Temperature distribution of 12 cells on the z = 0 section (the center) at the end of the second self-heating process.
Figure 26.
Temperature distribution of 12 cells on the z = 0 section (the center) at the end of the second self-heating process.


Table 1.
Basic parameters of the LiMn2O4 cell.
| Parameters | Unit |
|---|---|
| Mass | 1.08 (kg) |
| Length/width/height | 246/180/14.7 (mm) |
| Rated Voltage | 3.7 (V) |
| Rated Capacity | 35 (Ah) |
| Maximum Voltage | 4.2 (V) |
| Minimum Voltage | 3.0 (V) |
| Resistance | ≤1 mΩ |
Table 2.
Discharge capacity of a cell at different temperatures and discharge rates (Unit: Ah).
| Rates | 0.3C (10 A) | 1C (35 A) | 2C (70 A) | |
|---|---|---|---|---|
| Temperature | ||||
| 20 °C | 36.1 | 35.2 | 33.8 | |
| 0 °C | 33.7 | 32.4 | 32.0 | |
| −20 °C | 20.3 | 15.6 | 14.8 | |
| −40 °C | 6.9 | 0.2 | 0.0 | |
Table 3.
Main devices needed in the experiments.
| Serial Number | Device |
|---|---|
| 1 | Battery Management System (BMS) |
| 2 | Digatron EVT 500V-500A |
| 3 | Incubator |
Table 4.
Results acquired in the three experiments after the first heating process.
| Experiment Types | Time (min) | Temperature (°C) | Rate (°C/min) |
|---|---|---|---|
| External power source heating | 31 | −39.8 to −20.3 | 0.629 |
| Self-heating I | 34.2 | −39.4 to −20.7 | 0.459 |
| Self-heating II | 43.33 | −32 to −20.3 | 0.270 |
Table 5.
Results acquired in the three experiments after the second heating process.
| Experiment Types | Time (min) | Temperature (°C) | Rate (°C/min) |
|---|---|---|---|
| External power source heating | 45 | −23.2 to −0.5 | 0.504 |
| Self-heating I | 48 | −19.3 to −2.4 | 0.352 |
| Self-heating II | 52 | −19.7 to −2.7 | 0.327 |
Table 6.
The parameters of the 1/4 geometry model.
| Components | Size (Length × Width × Height, Unit: mm3) |
|---|---|
| A cell | 180 × 14.7 × 246 |
| Aluminum plate | 170 × 5 × 198 |
| shell of the container | 220 × 262.5 × 296 |
Table 7.
The thermo-physical parameters.
| Parameters | Density (kg/m3) | Specific Heat Capacity J/(kg·K) | Heat Conductivity Coefficient W/(m·K) | |
|---|---|---|---|---|
| Components | ||||
| Anode | 2840 | 839 | 3.9 | |
| Aluminum foil | 2710 | 903 | 238 | |
| Cathode | 1671 | 1064 | 3.3 | |
| Copper foil | 8933 | 385 | 398 | |
| Separator | 659 | 1978 | 0.33 | |
| Shell of the cell | 1636 | 1377 | 0.427 | |
© 2017 by the authors. Licensee MDPI, Basel, Switzerland. This article is an open access article distributed under the terms and conditions of the Creative Commons Attribution (CC BY) license (http://creativecommons.org/licenses/by/4.0/).
Share and Cite
MDPI and ACS Style
Zhang, C.; Jin, X.; Li, J. PTC Self-Heating Experiments and Thermal Modeling of Lithium-Ion Battery Pack in Electric Vehicles. Energies 2017, 10, 572. https://doi.org/10.3390/en10040572
AMA Style
Zhang C, Jin X, Li J. PTC Self-Heating Experiments and Thermal Modeling of Lithium-Ion Battery Pack in Electric Vehicles. Energies. 2017; 10(4):572. https://doi.org/10.3390/en10040572
Chicago/Turabian StyleZhang, Chengning, Xin Jin, and Junqiu Li. 2017. "PTC Self-Heating Experiments and Thermal Modeling of Lithium-Ion Battery Pack in Electric Vehicles" Energies 10, no. 4: 572. https://doi.org/10.3390/en10040572
Note that from the first issue of 2016, this journal uses article numbers instead of page numbers. See further details here.