
China’s Energy Transition in the Power and Transport Sectors from a Substitution Perspective

1
School of Business Administration, China University of Petroleum, Beijing 102249, China
2
Global Energy Systems, Department of Earth Science, Uppsala University, SE-751 05 Uppsala, Sweden
*
Authors to whom correspondence should be addressed.
Energies 2017, 10(5), 600; https://doi.org/10.3390/en10050600
Submission received: 20 February 2017
/
Revised: 24 April 2017
/
Accepted: 25 April 2017
/
Published: 29 April 2017
Abstract
:Facing heavy air pollution, China needs to transition to a clean and sustainable energy system, especially in the power and transport sectors, which contribute the highest greenhouse gas (GHG) emissions. The core of an energy transition is energy substitution and energy technology improvement. In this paper, we forecast the levelized cost of electricity (LCOE) for power generation in 2030 in China. Cost-emission effectiveness of the substitution between new energy vehicles and conventional vehicles is also calculated in this study. The results indicate that solar photovoltaic (PV) and wind power will be cost comparative in the future. New energy vehicles are more expensive than conventional vehicles due to their higher manufacturer suggested retail price (MSRP). The cost-emission effectiveness of the substitution between new energy vehicles and conventional vehicles would be $96.7/ton or $114.8/ton. Gasoline prices, taxes, and vehicle insurance will be good directions for policy implementation after the ending of subsidies.
1. Introduction
China’s carbon emissions from fossil fuel combustion and cement production were 9 Gt CO2 in 2013, making it the country with the largest emissions in the world [1]. The power and heating generation sectors and transport sector contributed 49% (4416.9 MT) and 8.4% (760.2 MT) of the total emissions respectively [2]. Clean energy consumption in China is still at low levels, although coal consumption’s share of total energy consumption has been decreasing in recent years [3]. For the transport sector, shifting part of the vehicle fleet from fuel to electricity and natural gas (EVs and NGVs) is one of the current strategies to control the transportation sector’s impacts due to the relatively low carbon content of EV and NGV emissions [4,5]. High costs are an obstacle to the wide implementation of clean energy technologies in many areas of China. Despite the lower levelized cost of electricity (LCOE) from hydropower, at approximately USD 0.04/KWh, other renewable energy (RE) power had high costs, ranging from USD 0.05/KWh to USD 0.11/KWh in 2014 [6]. As an emerging option, the market share of electric cars in 2015 was close to 1%. Financial incentives and the availability of charging infrastructure emerged as factors that were positively correlated with the growth of electric vehicle market shares [7].
Traditionally, natural gas had served as a bridge fuel for the transition from exhaustible fossil energy to zero emission renewables. Impacts on decadal-scale climate change from the increased use of natural gas are not consistent with existing studies: switching from coal to natural gas can reduce CO2 emission, while other green gases from large-scale development and usage of shale gas make its lifecycle emissions higher than that of coal [8]. In the power sector, conclusions show climate benefits ranging from less than 6% (unconventional gas replacing conventional gas) to more than 30% for the switch to natural gas from coal [9]. Compared to coal energy systems, natural gas systems can provide a part of the flexibility and storage and act as a robust backbone in the energy system. Gas-fired generation can provide flexible and controllable electricity at both centralized and decentralized levels [10]. The flexible and storable nature of natural gas play a key role in the progress of the energy transition.
Between 2005 and 2014, total annual natural gas consumption climbed from 46.4 billion cubic meters (bcm) to 185.5 bcm with an average annual growth rate of 11.6% [11]. However, China did not make significant strides in the natural gas share of its primary energy supply which increased from 2.6% to approximately 6% in 2013, much lower than the global average (23.7% in 2013) [12]. According to the National Bureau of Statistics of China (Beijing), the industrial sector accounted for 34% of the total natural gas consumption in 2012, which ranks the first, followed by the residential sector (20%), power sector (18%), transport sector (10%), and commercial sector (6%) [13]. The left 10% was used for the non-energy purposes. China has made significant progress in diversifying its natural gas supplies, and China´s natural gas supply is mainly from imported LNG, imported pipeline gas, domestic conventional gas, shale gas, coal bed methane, and tight gas production. Domestic production rose 164% from 2004 to 2014, to 135 billion cubic meters (bcm). Natural gas imports, which did not begin until 2006, grew from 1 bcm that year to over 58 bcm in 2014 [11].
Based on flows instead of exhaustible stocks, the role of RE will grow in importance over time from a long-term energy security perspective. In general, having more RE in the system can increase its diversity, making it less sensitive to some types of disturbances [14]. In addition to contributing to the social and economic development, energy access, and a secure energy supply [15], the transition of the energy system from fossil to renewable energies provides a chance to mitigate global warming and risks for ecosystems and human health [16]. Regarding nuclear power, it is as competitive in terms of both effective productivity and steady operation as fossil-fired electricity and has similar environmental benefits as RE [17]. According to the results of an EU case study [18], a 1% increase in renewable energy could achieve a 0.03% reduction of carbon emissions and a 1% increase in non-RE, mitigating environmental impacts by 0.44%. This will also happen in China. From 2010 to 2020, existing renewable electricity targets contributed to a 1.8% reduction in cumulative CO2 emissions compared to a no policy scenario [19].
The objective of this study is to calculate the life cycle costs and emission reduction costs of energy transition in the power sector and transport sectors. Natural gas, renewable energies, and nuclear power are chosen to compete with traditional coal-dominated energy systems in both the power and transport sectors. Which kind of energies or technologies will play the more important role depends on their potential, availability, and accessibility, and on the policies that promote their development. In Section 2, resource endowment, accessibility, and policies in both sectors are reviewed based on existing literature. For the power sector, this paper focuses on a comparison of unit costs of different technologies in the mid to long term using the learning curve approach. For the transport sector, the replacement of natural gas and electricity vehicles lead to cost and emission changing. In Section 3, we introduce the learning curve approach to analyze the LCOE and the cost-emission effectiveness method to investigate the changes in costs and emissions from the energy substitution in the transport sector. In Section 4, we present the results of the calculation with the methodology introduced in Section 3 with a high RE scenario and “New Policies Scenario”. Governmental subsidies and other variables that impact the costs of lowering 1 ton of GHG emissions are discussed.
2. Cleaner Energy Resource and Policies in Power and Transport Sectors
2.1. Cleaner Energy Potential and Accessibility
2.1.1. Natural Gas
The results of natural gas resource endowments evaluated by peer experts are shown in Table 1. Based on a national survey published in 2005, conventional natural gas resources amounted to 56 trillion cubic meters (tcm) prospectively and 35 tcm geologically [20].
Mohr and Evans [32] assessed the ultimately recoverable resources (URRs) of China’s conventional natural gas, and the results showed that conventional gas URRs were about 5.28 tcm and 12.82 tcm in low and high scenarios, respectively.
EIA estimates that China possesses 31.6 tcm (1115 trillion cubic feet) of risked technically recoverable shale gas resources [21]. The risked oil and natural gas in-place estimates are derived by first estimating the volume of in-place resources for a prospective formation within a basin, and then factoring in the formation’s success factor and recovery factor. Shale gas production has accelerated over the past two years, with total output reaching 5.72 bcm. In 2015 alone, shale gas production soared 258.5% from one year earlier to 4.47 bcm [33]. The results of national oil and gas resource assessment show that geological resources of CBM were 36.8 tcm with about two-thirds in eastern China, and recoverable resources of 10.9 tcm [25]. Coalbed methane URRs were estimated by Mohr and Evans [32] in low, best guess, and high scenarios, and the results were 2.77, 8.05, and 31.68 tcm respectively. Jia et al. used the analogy method to provide a preliminary evaluation of the tight gas resource potential in China, and proposed that the geological resources of tight gas in China are 17.4–25.1 tcm with recoverable resources of tight gas in China of 8.8–12.1 tcm [25]. In the estimation of Mohr and Evans [32], China’s tight gas URRs were 1.51, 4.02, and 10.31 tcm in low, best guess, and high scenarios, respectively. Wang et al. [34] developed three alternative scenarios of how unconventional gas resources are supplied, using the Geologic Resources Supply-Demand Model (Figure 1).
2.1.2. Nuclear and Renewable Power
China has 36 nuclear power reactors in operation, 21 under construction, and more about to start construction. The total nuclear capacity is set to rise to 80 GW by 2020, 200 GW by 2030 and 400 GW by 2050 [35]. In 2014, the electricity generation from hydropower increased by 144.05 TWh, corresponding to an increase of 15.65% [11]. The wind generated 156.3 TWh in 2014 and accounted for 2.8% of total electricity generation in China (a marginal increase from 2.6% in 2013) [36]. Davidson et al. [37] developed a model to predict how much wind energy can be generated and integrated into China’s electricity mix, and estimated a potential production of 2.6 petawatt-hours (PWh) per year in 2030. Wind power can provide nearly three-quarters of the target of producing 20% of primary energy from non-fossil sources by 2030 if operational flexibility of China’s coal fleet is increased [37]. China is one of the countries with the highest solar technically potential and it has been estimated at 6900–70,100 TWh per year with a potential stationary solar capacity from 4700 GW to 39,300 GW and 200 GW of distributed solar capacity based on potential/demand ratio at provincial level [38]. Table 2 shows the potential of RE sources. Total renewable electricity potential can reach at least 12,666 TWh/year, which is even higher than total demand in 2030 (11,900 TWh/year) [39] and can supply almost 88% of electricity demand in 2050 (14,300 TWh/year) [36]. Table 2 lists the RE sources in China, for more information see in [40].
2.2. Energy Policy for Energy Substitution
China’s clean energy promotion policies include national and urban targets; regulations on utilizations; electricity pricing; and subsidies, tax relief and feed-in tariffs for electricity generation. An energy policy that promotes energy transition in the power and transport sectors is discussed in two groups: (1) law and regulations; and (2) finance and taxation.
2.2.1. Power Sector
According to the “Mid- to Long-Term Nuclear Development Plan (2011–2020)” issued in October 2012, China aims to have 58 GW (net) in operation by 2020, and 30 GW under construction at that time [42]. The National Energy Development Strategy Action Plan (2014–2020) [43], Intended Nationally Determined Contribution (INDC) [44], and the 13th Five-Year Plan (2016–2020) planned the similar development targets for cleaner energy [45]. The 13th Five-Year Plan significantly raises the installed capacity of the wind and solar power to 250 GWe and 150 GWe, respectively, and each has 50 GW more than in the 2014 action plan. In addition, installed nuclear power capacity is to reach 58 GW and hydropower reach 350 GW by 2020. Geothermal energy, bio-energy, and maritime energy will also be proactively developed (see in Table 3 and Table 4).
2.2.2. Transport Sector
The General Office of the State Council of China (Beijing) has issued the “Energy Saving and New Energy Vehicle Industry Development Plan (2012–2020)” which is a major component of the national economy stimulus package during the period of global economic depression [58]. The central government subsequently adopted a target of 500,000 cumulative EV sales by 2015, and 5 million by 2020 [59].
In order to help China, adjust its economic structure toward resource savings and move in an environmentally friendly direction, and recognizing the strategic impacts of new energy vehicles (NEVs) on the auto industry in the future, the State Council issued Decisions on Accelerating the Cultivation & Development of Emerging Strategic Industries in October 2010, and it selected NEVs as one of the seven strategic industries. In the policy, plug-in hybrid and pure electric vehicles were further highlighted as the focus of demonstration and commercialization [60].
The Administration Rules on Access to the Production of New Energy Vehicles (2007) has significant instructional function for the new energy vehicle industry’s development in China [61]. In June 2012, the State Council published the Planning for the Development of Energy-Saving and New Energy Automobile Industry (2012–2020) [58], which established the guidelines for the development of the new energy automobile industry in China.
In March 2012, the Tax and Fee Notice of New Energy Cars and Ships was issued by the Ministry of Finance, State Administration of Taxation and Ministry of Industry and Information Technology of China (Beijing). According to this notice, the tax of energy saving cars and ships is reduced by half, and the tax of new energy cars and ships is waived from January 2012 [61]. For more information about subsidies and tax incentives to encourage new energy vehicle consumptions, see [62,63].
3. Materials and Methods
3.1. The LCOE Formula for the Power Sector
The overnight capital cost is the cost of building a power plant, assuming no interest occurs during construction. Because it does not take into account the cost of financing, it is a very useful cost measure that can compare the cost of technology and different countries without having to consider different power generation technologies and different countries’ engineering capacity for different leverage, interest rates and construction time. According to the US Energy Information Administration (EIA) (Washington, DC, USA), the basic costs include: civil and structural costs, machinery and equipment supply and installation, electrical and instrument control, indirect project costs, owner costs. Under normal circumstances, the basic cost can be calculated as follows:
where TI is the total investment in the project, and IDC is the benefit of the construction period (this paper assumes that there is no interest). The above basic investment equation is used to calculate the static base investment at a given point in time. In order to predict future infrastructure investments, it is divided into regional and global components:
where OCCg is the global base investment, OCCl is the regional basis investment component, GLRcum is the global cumulative learning rate, LLRcum is the local cumulative learning rate.
OCC = TI + IDC
OCC = [OCCg * GLRcum * GlobalPPPscalingFactor] * r + [OCC1 * LLRcum * GlobalPPPscalingFactor] * (1 − r)
As shown in Equation (2), OCC is decomposed into local and global components. The local cost component is related to local learning speed, while global cost components are related to global learning speed. For non-price countries, the local cost component is a relatively small part of the total OCC, usually including non-trade items such as labor, land, permits and permits, electricity, and so on. The global cost component includes equipment, research and development, etc. and moves at the same rate worldwide.
The cumulative learning rate is expressed by the product of the cumulative capacity of each technique and the learning rate. Thus, the global learning rate is the product of the global installed capacity cumulative deployment and the global learning rate for each technology, and the regional learning rate is the product of the local installed capacity cumulative deployment and the regional learning rate.
Simply adding the product of the cost component to its learning rate is still insufficient because it does not take into account the varying price levels expressed by purchasing power parity (PPP) at the real exchange rate. Therefore, in order to calculate the future OCC, the cost component will be adjusted through its relative learning rate and local or global price level. The actual price level in some countries will rise, while the price levels of other countries may fluctuate. Therefore, OCC will not always be reduced. Some countries purchasing power evaluation data as shown in Table 5.
Larsson et al. reviewed existing assessments of electricity production costs and the Formula (1) below is a widely-accepted approach for calculating the LCOE [65]. Overnight capital cost (OCC) is a typical parameter that is used in the power generation industry to describe the cost of building a power plant overnight. We thus have:
where OCC is the overnight capital cost, Mf are the fixed operating and management (O&M) expenses, Mt the variable O&M expenses at year t, Ft the fuel costs at year t, Et the electricity generated in year t, i the interest rate (WACC), and n the lifetime of the power plant.
By far, the most common model used in the energy literature to forecast changes in technology cost is the “one-factor learning curve” (or “experience curve”) [66]. The learning curve is based on empirical observations that present the relationship between the unit cost of the technology and its cumulative output (production) or installed capacity. A widely-used formulation is [66]:
where is the unit cost of the technology, x represents cumulative experience, and a is the cost for the first unit, and b is an experience index. For power generation technologies the latter term is commonly quantified as cumulative installed capacity (MW). If the cumulative experience is doubled, the fractional reduction is given by:
where the factor in Equation (5) is the progress ratio. For example, when LR is 0.15 it means that after one doubling of the cumulative installed capacity, the unit cost can be reduced by 15% of the original costs.
3.2. Total Ownership Costs (TOC) and Life Cycle Emissions Method for Transport Sector
We have:
where TOC is the total ownership cost, I represent the initial cost, MSRP the manufacturer’s suggested retail price, S the governmental subsidy, P the purchase tax, Ct the maintenance and operating costs, Ce is the energy costs, Cm is the cost of maintenance, CT&I are the tax and insurance costs, i the discount factor and R the resale price. Maintenance and operating costs include energy cost, vehicle use tax and insurance, and battery replacement cost or machine oil change cost.
Rose et al. [67] established a cost-effectiveness function to compare the costs of conventional and alternative vehicles, and in [5,67], natural gas vehicles were used to substitute for diesel as a vehicle fuel:
In this equation, FCRa and FCRc are the vehicle fuel consumption ratings of alternative vehicles and conventional vehicles; Fa and Fc are the fuel or electricity prices; VKTy the vehicle vehicle kilometers traveled per year; P/F and P/A are factors to calculate the present value of a future cost and the present value of a series of future constant annual costs assuming an economic lifetime n and a discount rate i; OM are the constant annual non-fuel operating and maintenance costs over the life ($); Pa − Pc the difference in purchase price of alternative-fueled and conventionally fueled vehicles; C0 any other miscellaneous costs; GHGc − GHGa the total lifetime GHG emission difference between the two fuels and VKTt the total vehicle kilometers traveled over its lifetime. From the energy substitution perspective, the differences in maintenance and operating costs, and the resale price between alternative vehicles and conventional vehicles should be taken into consideration. OM costs are different between the CVs and alternative vehicles. This study establishes the following equation to evaluate the cost-emission effectiveness:
Since the GHG emission reduction is used for normalization of the cost, the result of the calculation (in USD per unit CO2 equivalent) will be either positive or negative. Should the alternative fuel/vehicle have lower emissions than the conventional one, which is generally the expectation, positive and negative numbers would indicate increased and reduced life cycle cost, respectively.
Regarding life cycle emissions from electricity is shown as Equation (11):
where, ri is the share of generation from technology i in total generation, and represents life cycle greenhouse emissions of one-unit generation from technology i that includes fuel energy extraction process transport and generation. Life cycle GHG emissions of gasoline include crude oil extraction and processing, transportation, oil refining, and diesel used for transportation to the end-use location.
Life cycle GHG emissions for this calculation includes the three primary types of GHG emissions (CO2, CH4 and N2O) emitted during the life cycle process. Each of the GHG emissions is then converted to CO2 equivalents (CO2 e) according to their global warming potential (GWP) value [68]:
3.3. Cost Assumptions Used
3.3.1. Generation Cost Assumptions
This sector analyzed the levelized cost of electricity (LCOE) trends of six generation technologies, and our assumptions are shown in Table 6, Table 7, Table 8, Table 9 and Table 10. Basic assumptions and learning rates used to forecast the LCOE of power production are shown in Table 6, respectively. Two generation mix scenarios (Table 7 and Table 8) are considered to calculate the GHG emissions per unit generation of the generation mix. And the generation portfolios for 2015 represent observed portfolios. Table 10 is the global cumulative capacity deployments with the forecasted data from IEA 450 scenario due to the high installed capacity of RE in China. The generation portfolios for 2015 in Table 7 and Table 8, represent observed portfolios. In order to reflect the impact of changes in fuel prices on future generation costs more accurately, this section refers to EIA’s projected growth rate of nuclear fuel (−0.8%) and biomass price growth (0.2%) [69]. On the basis forecast of the EIA, Li et al gave four scenarios of China’s coal and natural gas prices growth rates. Considering the rapid development of RE, this paper adopts the low growth rate scenario in the paper, namely, annually growth rate of the two fuels prices are both 1% [70].
New Policies Scenario of the World Energy Outlook broadly serves as the IEA baseline scenario. It takes account of broad policy commitments and plans that have been announced by countries, including national pledges to reduce greenhouse-gas emissions and plans to phase out fossil-energy subsidies, even if the measures to implement these commitments have yet to be identified or announced.
3.3.2. Transport Sector Assumptions
Two alternative vehicle types are included in this sector. First is a battery electric vehicle (BEV), which exclusively uses a large battery to power an electric motor to drive the wheels. The battery is recharged by plugging the vehicle into the electric grid; Second is a plug-in hybrid gasoline-electric vehicle (PHEV), which uses an electric motor to power the wheels. The battery can be charged by plugging the vehicle into the electric grid or by use of an on-board gasoline engine.
Two BEVs and two PHEVs sold in the China market with governmental subsidies were selected for analysis, and corresponding similarly sized conventional models, are used as their counterparts (Table 11).
Total energy costs depend on energy consumption rate, vehicle kilometers traveled per year and fuel prices. This study used electricity prices and gasoline prices in 2015, assumed to be $0.13 KWh and $0.9768/L, respectively [73]. The amount of the annual vehicle-use tax is related to engine displacement, and the newest rules for vehicle-use tax calculation were applied [74]. According to China’s conventional vehicle purchase tax is 8.55% of the MSRP [75] and the battery and fuel-cell electric passenger vehicles are exempt from the purchase tax (see Section 4). According to Bit Auto, the liability coverage costs are the same for all vehicles, and the annual collision coverage cost is equal to 1.088% of the MSRP plus 459 CNY ($75) for basic insurance fees [76]. The resale value is 15% of the MSRP for an ICEV and 10% for a BEV [76]. The discount rate is an average of [73,75,76] at 7.33%. Machine oil is assumed to be changed every 5000 km and to cost approximately 320 CNY ($52) per change [76]. Owing to the long lifetime of batteries, battery change costs do not accrue during the BEV and PHEV lifetimes. Life cycle emissions of gasoline are shown in Table 12.
Natural gas could be used as a primary energy for the transport sector in six ways: compressed natural gas (CNG), liquefied natural gas (LNG), methanol, gas-to-liquid (GTL), H2, and electricity pathways [79]. As NGVs are usually used as taxis and conventional heavy duty vehicles, CNG-taxis and LNG-heavy duty vehicles were selected for the analysis of the cost efficiency of substitution between NGVs and conventional vehicles. The acquisition cost of a private CNGV in China is only $990–$1650 higher than that of an equivalent gasoline car and the cost of a liquefied natural gas vehicle (LNGV) is $3300 to $11,500 more than the cost of an equivalent conventional vehicle [80]. It is difficult to select a vehicle mode, so for this study we made the assumptions listed in Table 12. Assumptions for CNGVs and LNGVs is shown in Table 13.
4. Results
4.1. Power Sector
It can be seen from the Table 14 that the emission of greenhouse gas (GHG) emissions is the smallest, only 12 g CO2 e/KWh, followed by biomass power generation, on shore wind power to the life cycle of GHG emissions (207 g CO2 e/KWh) higher than the nuclear life cycle of GHG (114 g CO2 e/KWh), mainly depends on the high capacity factor of nuclear power stability. The life cycle of GHG emissions from circulating natural gas is 520 g CO2 e/KWh, which is about the life cycle of pulverized coal. GHG (1020 g CO2 e/KWh) Half. In the two power generation scenarios, the combined GHG emissions were 485 g CO2 e/KWh and 592 g CO2 e/KWh, respectively. Non-coal power generation ratio increased by about 10%, the unit power generation life cycle GHG emissions decreased by 18% (more details can be seen in Table A1, Table A2, Table A3, Table A4, Table A5, Table A6 and Table A7 in Appendix A).
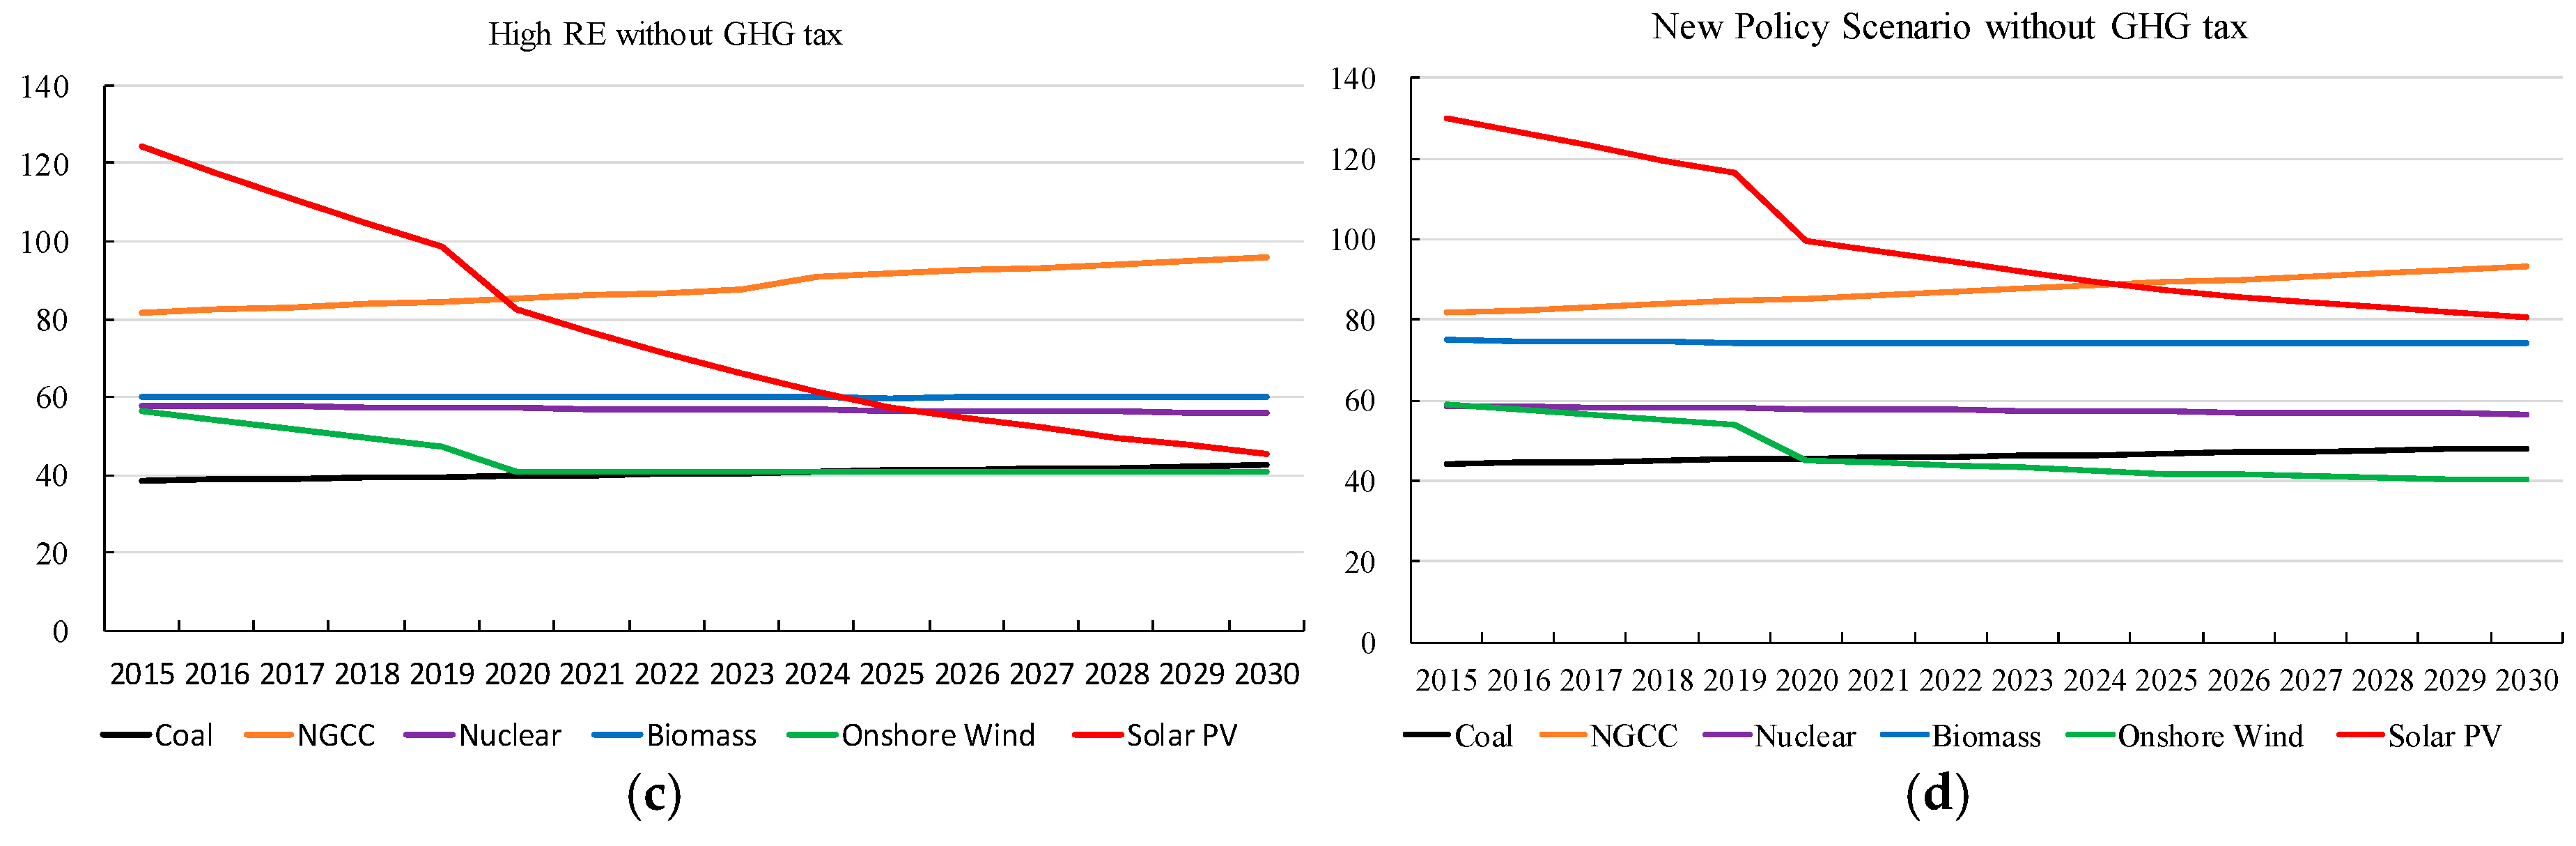
When the carbon tax reaches $30/ton, the LCOE of coal-fired power generation increases from $69/MWh to $73/MWh from 2015 to 2030, natural gas-fired generation from $97/MWh to $111/MWh, nuclear power decreases from $58/MWh to $56/MWh, biomass power costs remains at $66/MWh (Figure 2). In 2019, the LCOE of PV is close to that of natural gas-fired generation. The LCOE of photovoltaic power generation in 2023 is $68/MWh, which is lower than the LCOE of coal-fired power generation ($71/MWh). In 2024, the LCOE of PV is $63, lower than that of biomass fired generation ($66/MWh) in the same period; the LCOE of photovoltaic power generation will reach to $56/MWh, lower than that of nuclear power costs ($57/MWh). The LCOE of on shore wind power technology in 2016 can reach 57 US dollars/MWh, almost always the lowest cost of power generation technology, onshore wind power costs will reach 44 US dollars/MWh by 2030. In the new policy scenario with the carbon tax ($30/ton), the LCOE of coal-fired power generation will increase from $75/MWh to $79/MWh during 2015–2030, natural gas-fired generation from $97/MWh to $109/MWh, nuclear will drop from $59/MWh to $57/MWh, and biomass power will remain at $80/MWh. The LCOE of photovoltaic power generation in 2020 will be $101/MWh, equivalent to that of natural gas generation ($101/MWh); the LCOE of photovoltaic power generation wiil be $82/MWh by 2030, higher than the LCOEs of the other four power generation technologies. By 2030, onshore wind power costs will be $44/MWh, the lowest cost of power generation technology. In High RE scenario, the LCOE of coal-fired power generation will increase from $39/MWh to $42/MWh during 2015–2030, natural gas-fired generation cost from $82/MWh to $96/MWh; the LCOE of nuclear power will drop from $58/MWh to $56/MWh, and biomass power LCOE will remain at $60/MWh. In 2020, the LCOE of PV power will be $82/MWh lower than that of NCGG. In 2024, the LCOE of PV will be $61, close to that of biomass fired generation ($60/MWh). In 2025, the LCOE of PV will be $57/MWh, close to that of nuclear power ($56/MWh). The LCOE of photovoltaic power generation in 2030 is $45/MWh, which is still higher than that of onshore wind power and coal-fired power generation. In 2015, the LCOE of on shore wind power generation is $56/MWh. By 2020, the LCOE of onshore wind generation will be close to coal-fired power generation costs ($41/MWh); since then, land-based wind power is maintained at $41/MWh. In the new policy scenario without carbon tax, the cost of photovoltaic power generation in 2024 is $89/MWh, which is the same as the cost of natural gas-fired generation in the same period; in 2030, the LCOE of PV ($80/MWh) will be still higher than that of the other four power generation technologies. Onshore wind power generation LCOE will fluctuate less and will be $40/MWh by 2030.
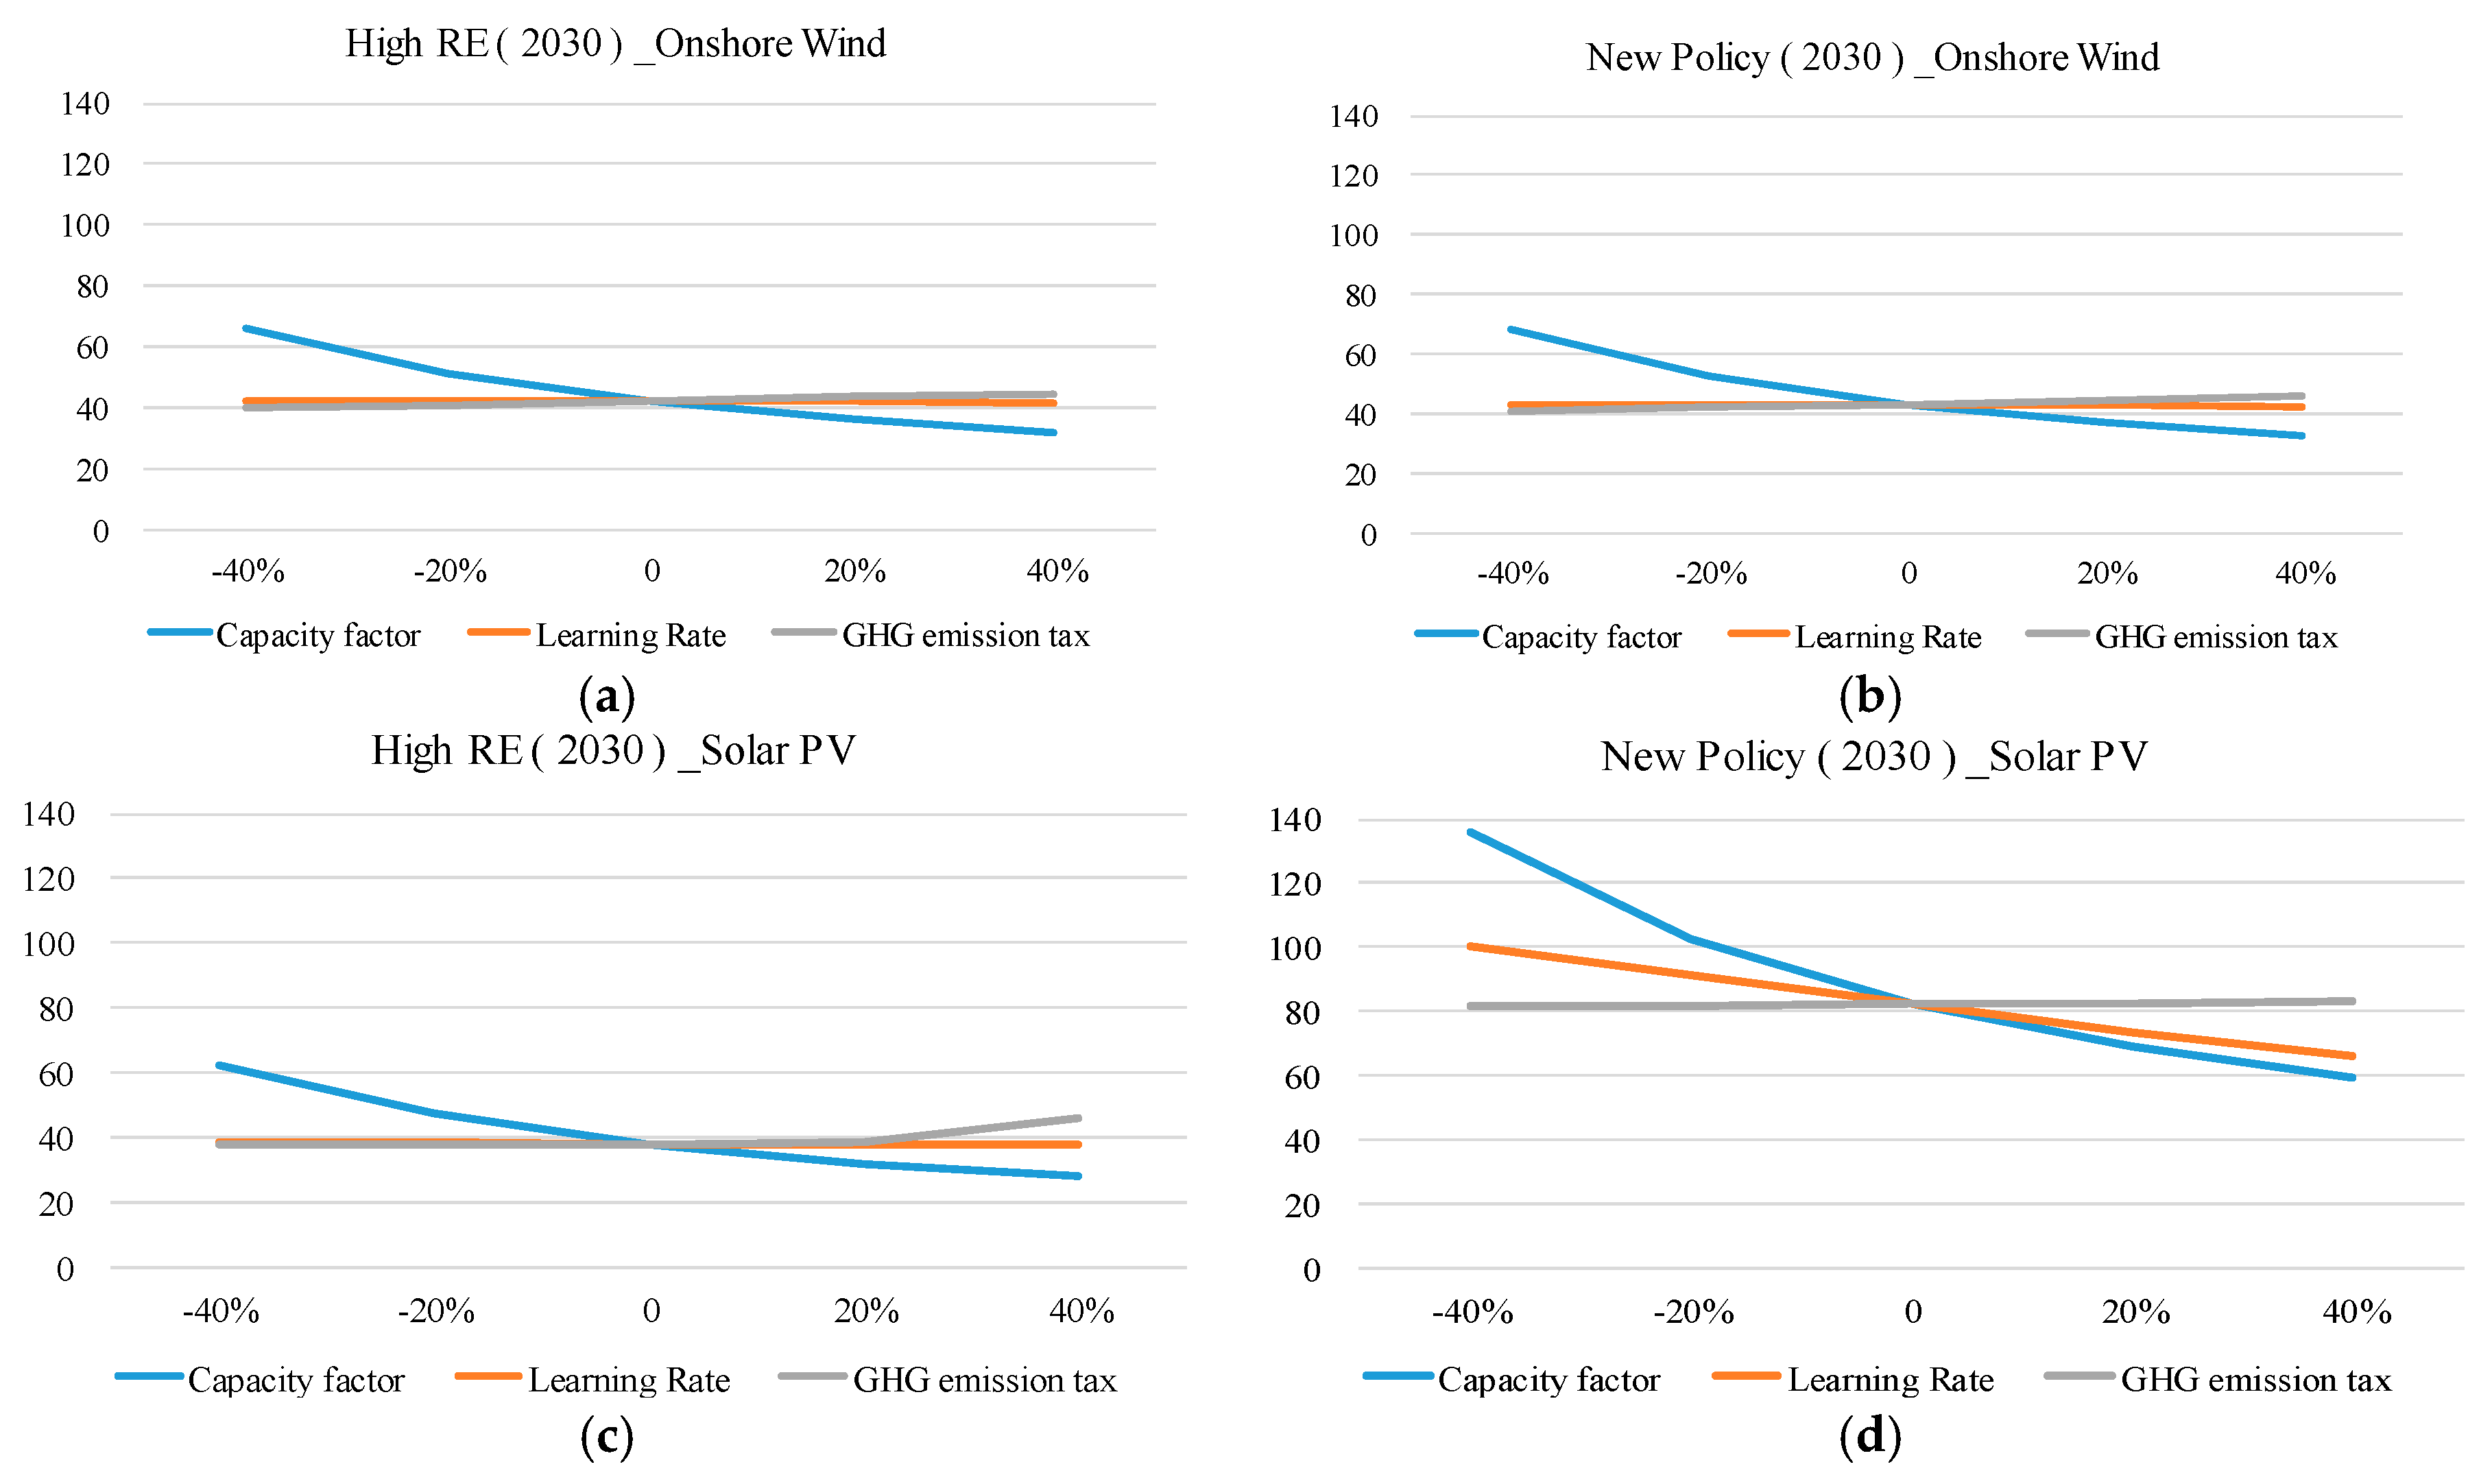
Figure 3 shows the sensitivity analysis of photovoltaic power generation and onshore wind power generation. The selected sensitivity factors include capacity factor, learning rate and GHG emission tax. The results show that, in both scenarios, the capacity factor is the most important factor affecting LCOE, followed by learning rate and GHG emission tax. In the new policy scenario, the change of capacity factor has the greatest influence on the prediction result of LCOE. In the new policy scenario, the onshore wind power capacity factor increased from 15.6% to 36.4%, LCOE dropped from $68/MWh to 33/MWh; the PV capacity factor increased from 12% to 28%, LCOE dropped from $136/MWh to 59/MWh.
4.2. Transport Sector Cost
4.2.1. BEVs and PHEVs versus Conventional Vehicles
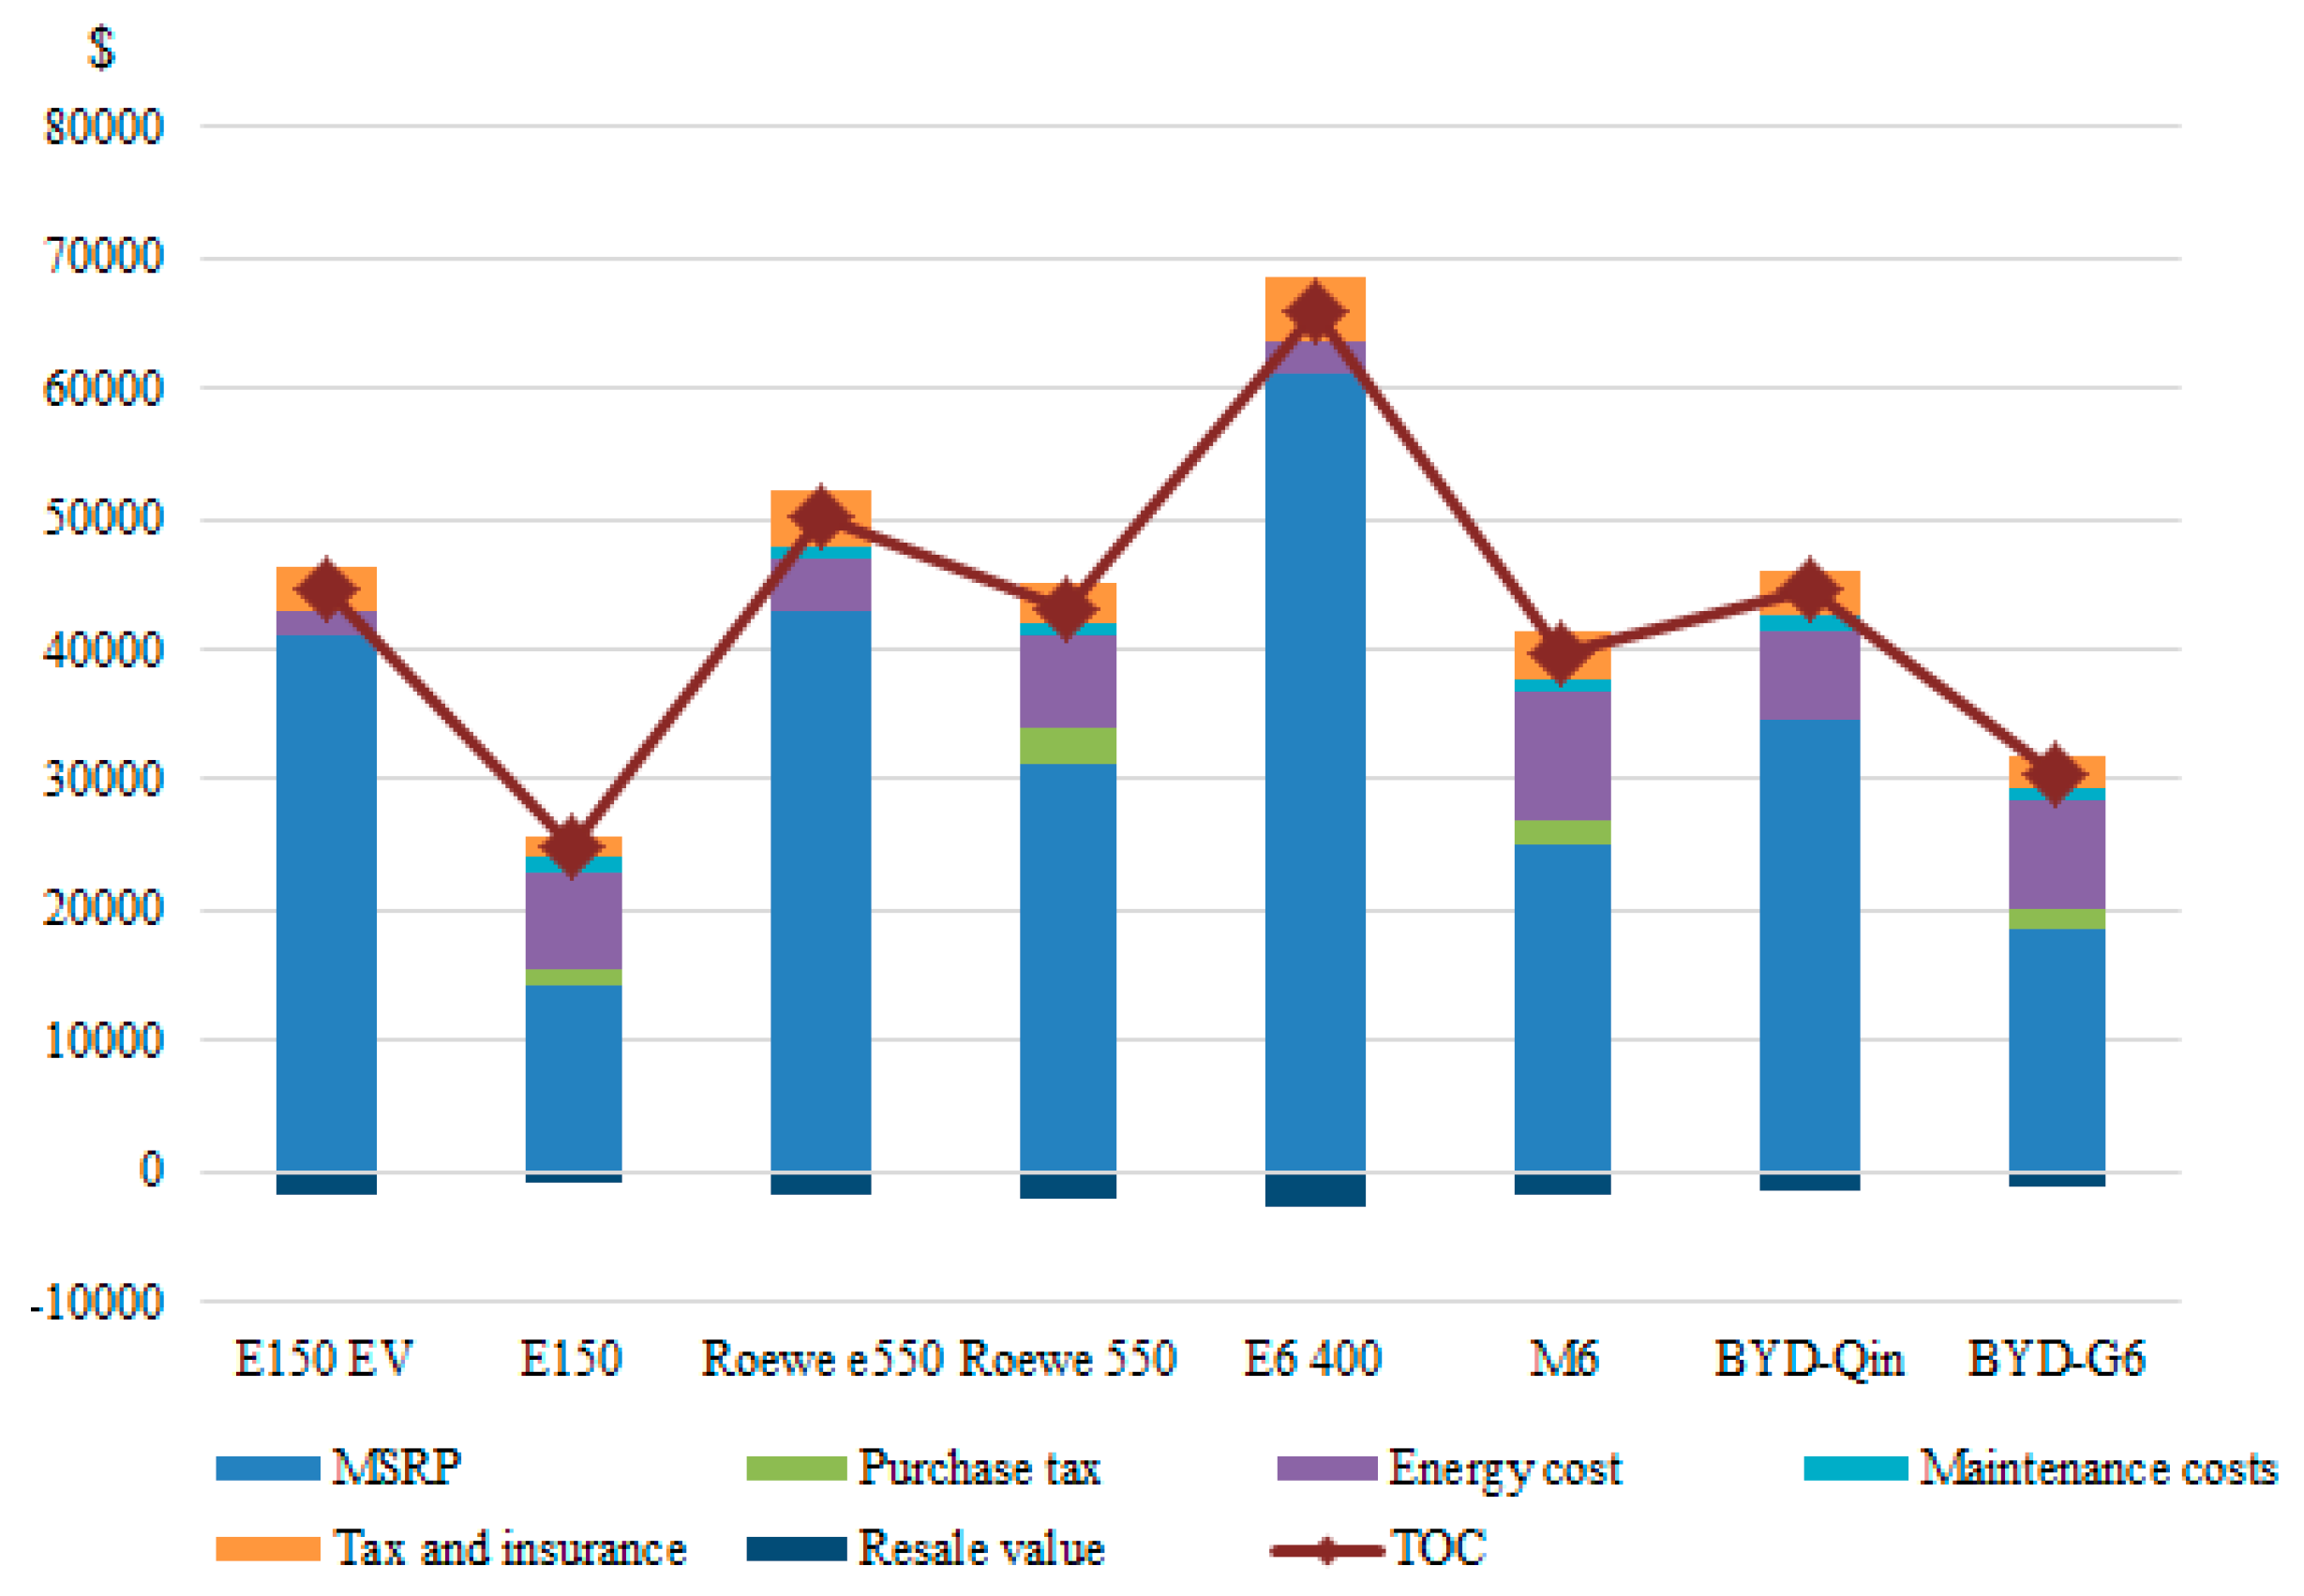
The TOCs for vehicles without and with a subsidy are presented in Figure 4 and Figure 5, respectively. The color bars represent different cost contributions to the TOCs, and the line indicates the TOC level after balancing out the negative resale value that provides a comparison between alternative vehicles and conventional vehicles. The comparisons of the four sets of results show that though BEVs and PHEV have higher resale prices and lower operating costs, the consumer should pay another $19,733, $7106, $26,234, and $13,944 more than the conventional vehicles cost to buy new energy vehicles. Except for MRSP, tax and insurance costs rank the second for almost all new energy vehicles, while energy costs rank the second for all conventional vehicles.
Compared to the acceptable costs, the significantly higher MSRPs of BEVS and PHEVs require a large amount of government subsidy (Figure 5), even higher than the purchase price of CVs. PHEVs. As shown in Figure 6, based on the electricity mix in the two selected scenarios and on the life cycle emissions of power and gasoline, this study analyzed the unit GHG emissions of the four sets. Substitutions from BEVs could reduce life cycle emissions significantly, while that from PHEVs depend on the driving behavior.
Compared to the “New Polices Scenario”, a decrease of 12% in the share of coal-fired electricity does not show any prominent, noteworthy impacts on GHG emission reduction per km. As shown in Figure 5, this paper analyzes four sets of vehicle emissions based on two power combinations (as shown in Figure 6) and the life cycle emissions (including manufacturing and fuel consumption) of gasoline. Electric vehicles instead of conventional car emissions significantly, PHEV alternative conventional car emission reduction depends on driving habits. In the case of high-RE scenarios, four alternative emission reductions were 156 g CO2 e/km, 74 g CO2 e/km, 194 g CO2 e/km and 126 g CO2 e/km. In the new policy scenario, four groups of alternative emission reductions are 143 g CO2 e/km, 62 g CO2 e/km, 173 g CO2 e/km and 112 g CO2 e/km, and overall GHG emissions per kilometer half. The high-RE scenario is 12% less than the new policy scenario. This reduction is less noticeable in terms of unit mileage. Relying on new energy vehicles to replace conventional power vehicles to reduce GHG emissions depends on a significant reduction in coal power generation.
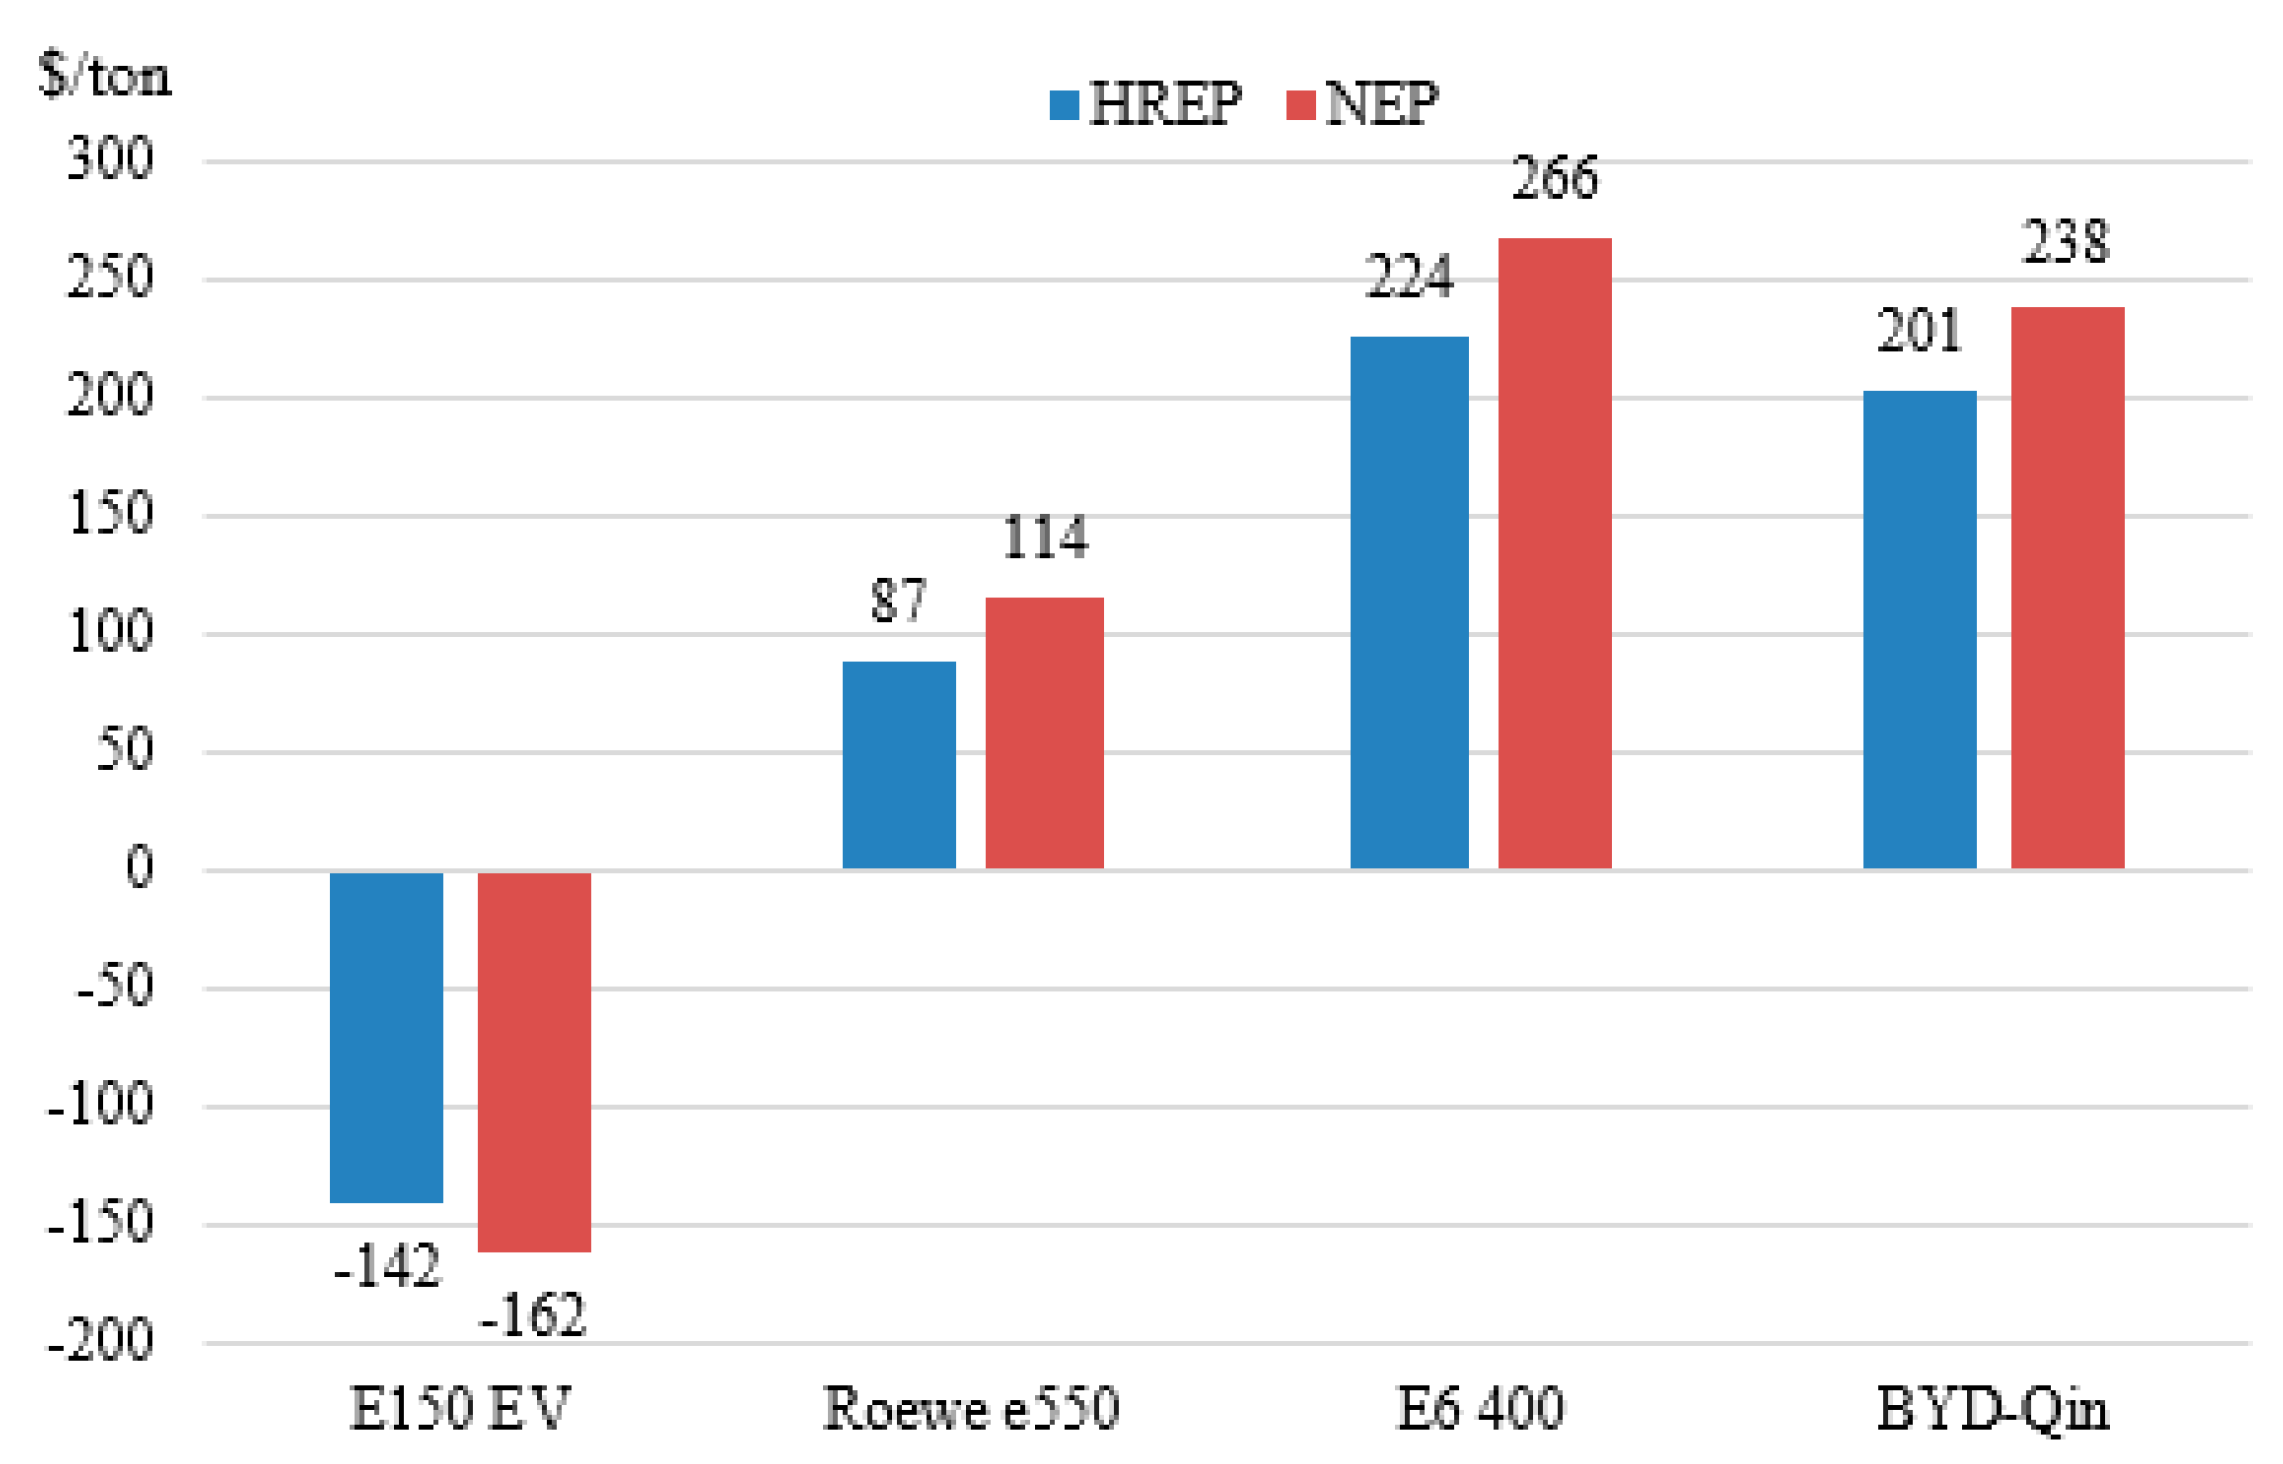
The cost-emission effectiveness (Ec) of substitutions between BEVs or PHEVs and CVs is shown in Figure 7.
Despite the large amount cost of government subsidies, the cost-emission effectiveness (Ec) of the replacement of CVs of BEVs is $87 and $114/ton, $224 and $266/ton, and $201 and $238/ton in the last three cases in the figure. In the E150 EV case, 1 ton of GHG emissions reduced by energy substitution could save $142–$162. While as the total ownership costs considered in this study are private costs, and GHG emissions are fuel life cycle emissions, the costs of GHG emission reduction from substitutions between alternative vehicles and CVs will be distributed to other sectors.
4.2.2. Natural Gas as an Alternative Energy to Replace Gasoline or Diesel-Fueled Vehicles
Owing to the large VKT per year, CNGVs and LNGVs can provide large cost savings; for example, a CNG-taxi could save $8307 and reduce 40 tons of GHG emissions (Table 15); and a LNG-heavy duty vehicle could save $52,833 and reduce 10 tons of GHG emissions during its lifetime. Compared to the case of BEVs and PHEVs case, energy costs dominate the cost-emission efficiency due to its longer VKT.
4.3. Subsidy Impacts
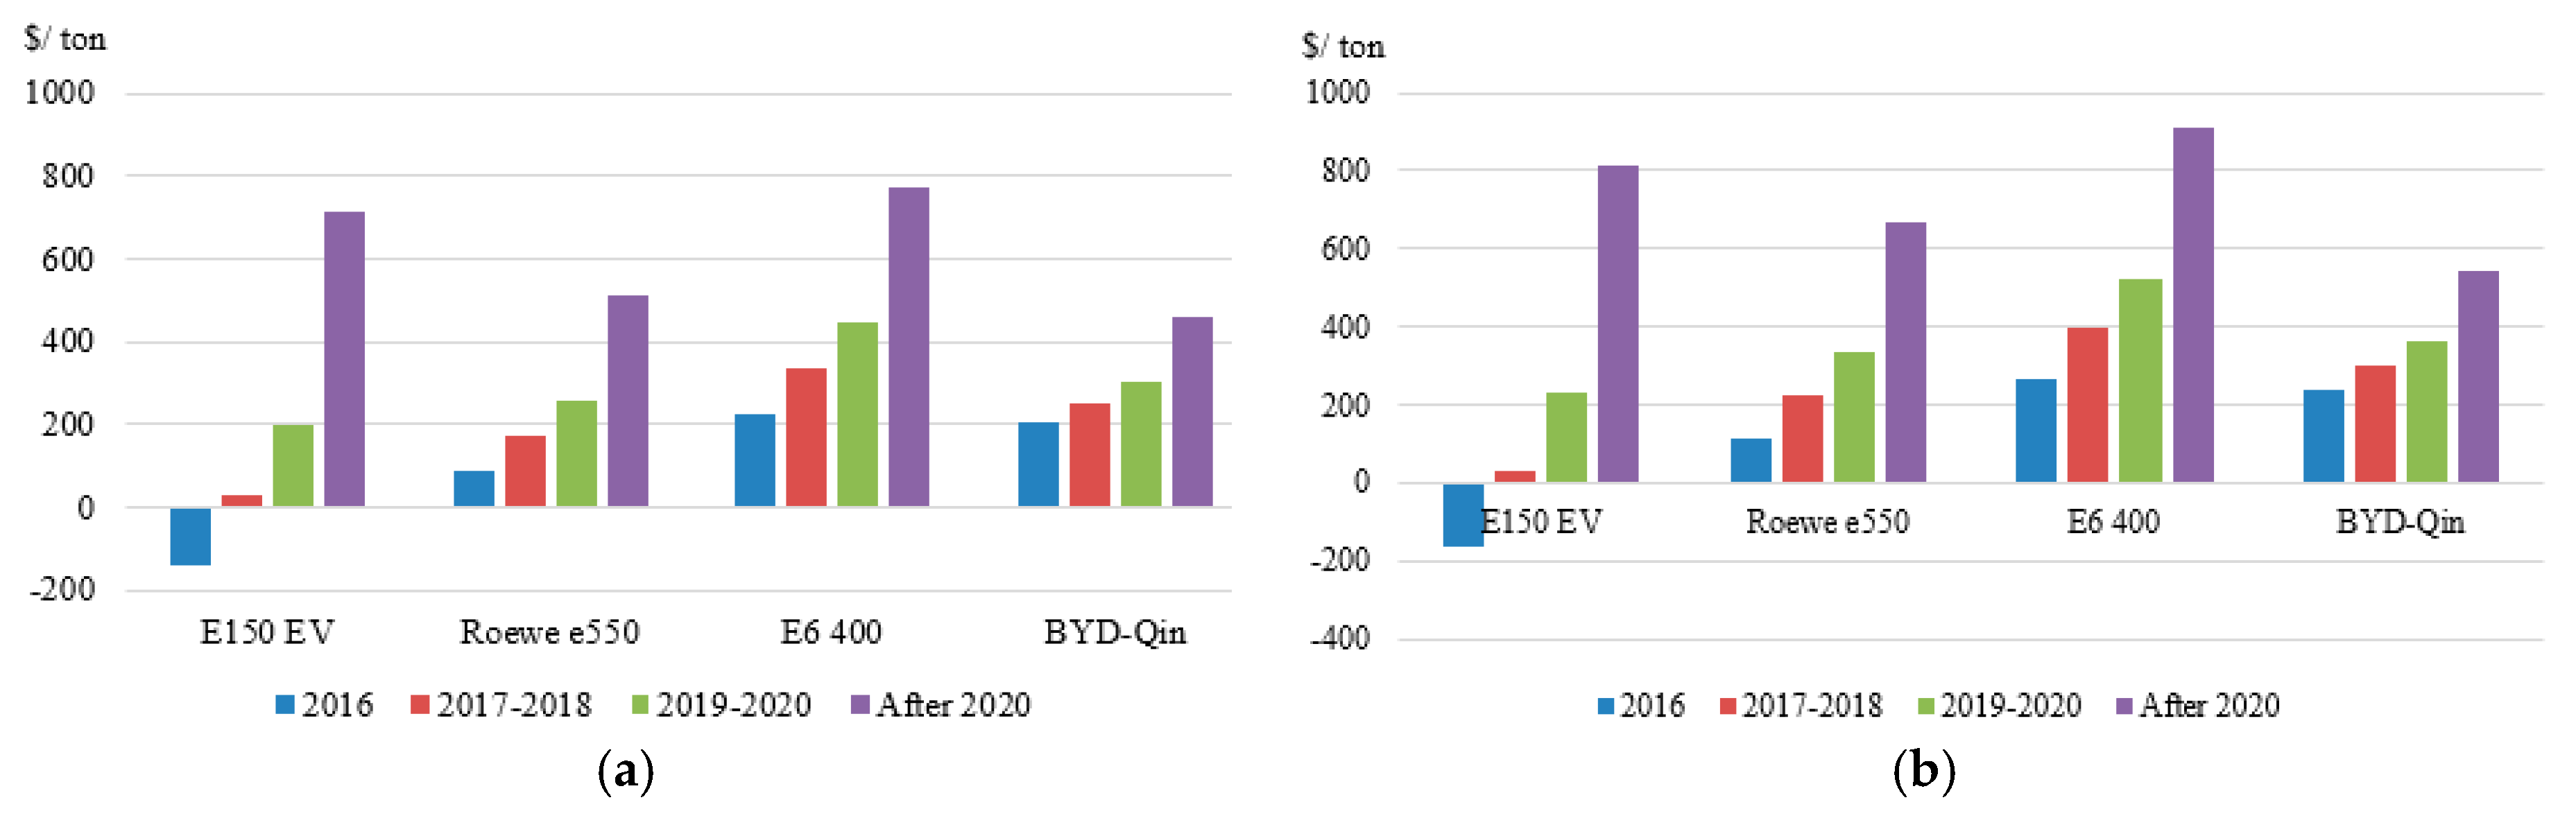
According to the new subsidy policy for alternative energy vehicles that will be implemented from 2016 to 2020, the subsidy for passenger vehicles, except for fuel-cell vehicles, will be reduced to some extent from 2017 to 2020. Compared to that issued in 2016, the subsidy issued from 2017 to 2018 will decrease by 20% from 2017 to 2018 and that issued from 2019 to 2020 will decrease by 40%. China will end subsidies for new energy vehicles (NEVs) after 2020. When the subsidy decreases, the cost for avoiding GHG emissions increases approximately 10 times. NEVs can never be economical compared to conventional vehicles. In the E6 400 set, the consumer should pay more than $900 to reduce 1 ton of GHG emissions in new energy policy scenarios. This policy may lead to existing new energy car models, but it will slow down the trend of reducing GHG emissions. Other policies that could promote GHG emission reduction should be imposed if subsidies will decrease in the near future (Figure 8).
4.4. Fuel and Electricity Prices
As was calculated in Section 4, the LCOE of PV and wind power will decrease in the near future, but the share of renewable power is increasing in both scenarios. Furthermore, the electricity price depends on the governmental policies. Future electricity prices are difficult to forecast. As was analyzed in Section 4.1, both wind power and solar power costs will decrease from 2015 to 2030, but they will still be higher than coal-fired generation costs. Owing to the higher share of RE in the power sector, electricity prices will be higher than they are now. A wide range of electric prices, from $0.13/KWh to $0.26/KWh, was used and the gasoline price was $0.825/L–$1.98/L, with an average of $0.9768/L [76]. The number of miles traveled every year is limited, and a variation of ±20% was assumed, as was the resale value, tax, and insurance costs. Negative values mean that its increase will lead to a lower cost-per-unit emission reduction. The analysis presented here has a sensitivity on the cost-emission effectiveness (Ec) of substitution between NEVs and CVs and was carried out using a Monte Carlo simulation and @Risk software based on Microsoft Excel.
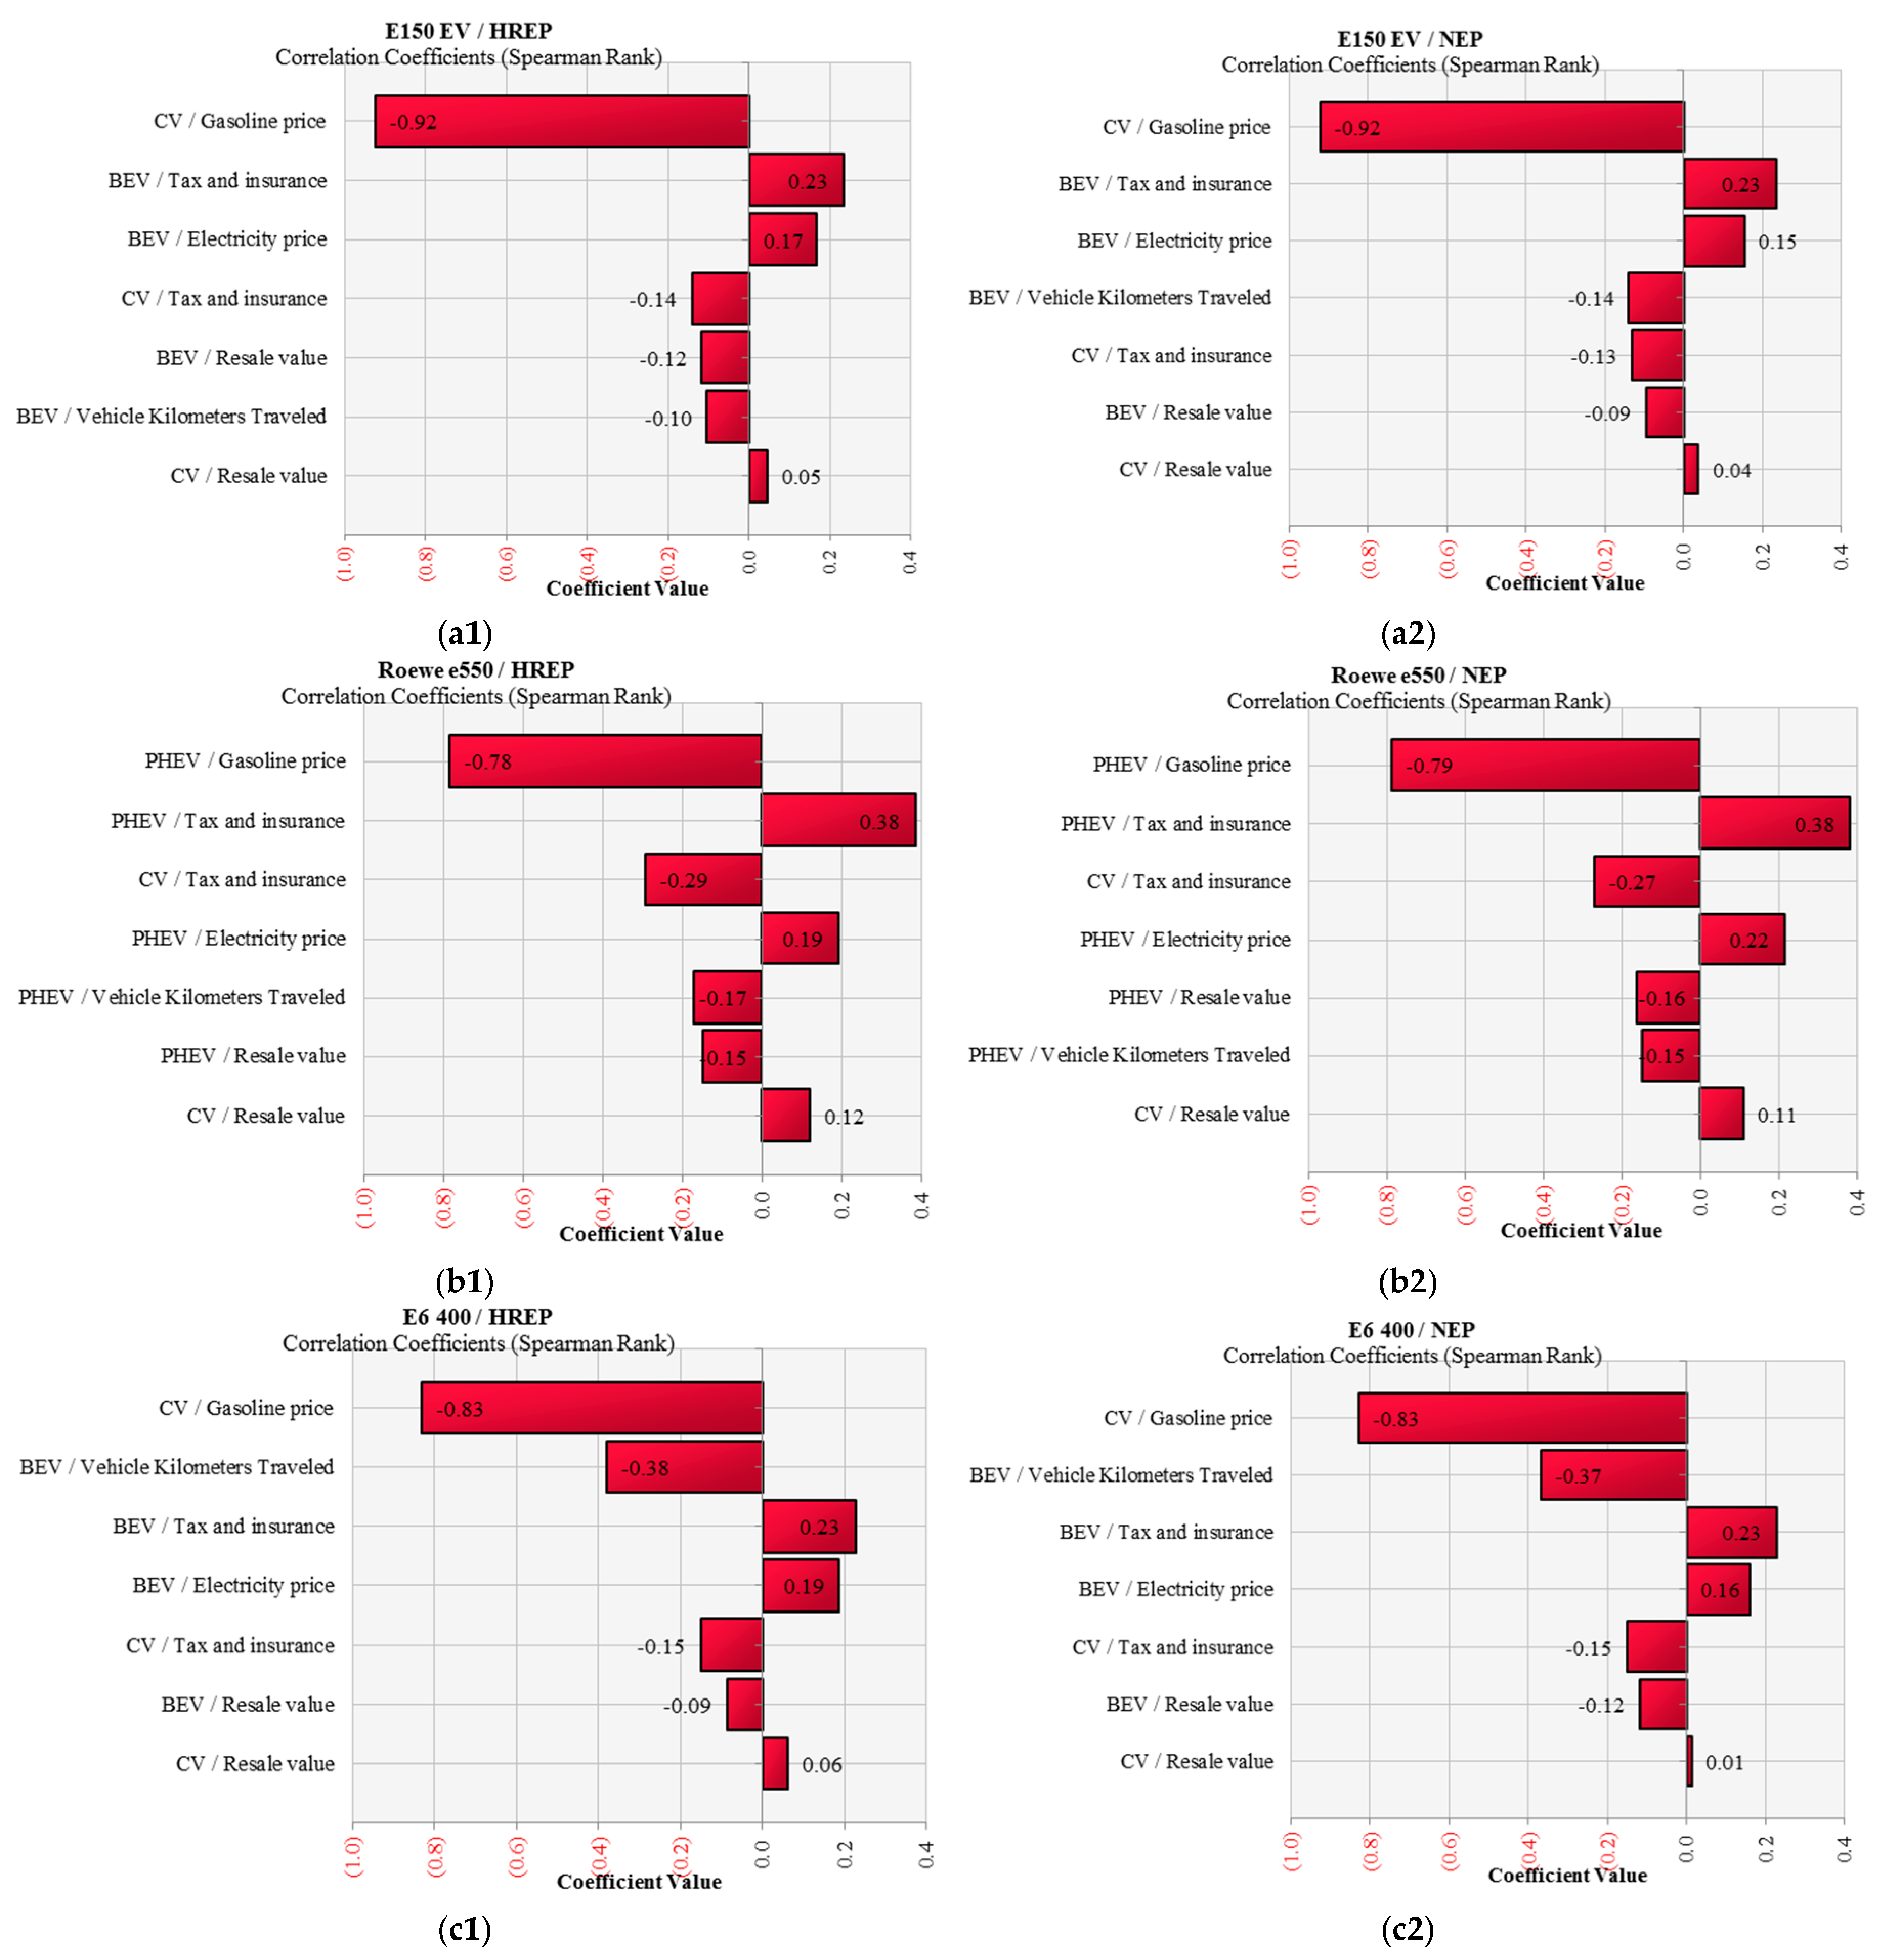
The sensitivity analysis was conducted on the key variables that affect the cost-emission efficient (Figure 9). In this study, the sensitivity of cost-emission effectiveness (Ec) of substitution between new energy vehicles and their counterparts was determined by testing the coefficient values corresponding to the probability distribution of relative variables. Negative coefficient values mean that its increase will result in a lower cost-per-unit emission reduction. In Figure 9, we present the results of the sensitivity analysis for the four sets. There is no doubt that the increase in gasoline price (PHEVs and BEVs have the same gasoline price), CV/tax and insurance, VKT, and the resale value of new energy vehicles have the positive effect of lowering the costs of reducing GHG emissions. According to the results, the cost-emission efficiency of the substitutions is most sensitive to gasoline price in both scenarios and all sets. Among all other variables in the high-renewable-energy penetration scenario, tax and insurance costs for new energy vehicles, and electricity price have significant impacts after the gasoline price. In addition, BEVs and PHEVs produced by BYD rely much more on their VKT than other vehicle models, and VKT is the second among variables that impact cost-emission efficiency. Their high MSRPs lead to the high purchase tax and insurance expenses of BEVs and PHEVs and result in high resale values of new energy vehicles. Thus, the cost-emission efficiency value is more correlated to the resale value of new energy vehicles than that of CVs.
5. Conclusions
LCOE of six generation technologies in China was projected from 2015 to 2030 using a learning curve approach including coal-fired, natural gas-fired, biomass-fired, nuclear power, the wind, and solar PV under two scenarios. The results show that the LCOE of onshore wind power generation and photovoltaic power generation can reach the level equivalent to the cost of thermal power when there is a high carbon tax. Although the learning curve method used in this paper is predicted, the results of the sensitivity analysis show that capacity factor is the most influential factor to LCOE, so increasing the utilization of terrestrial wind power and photovoltaic power generation and accelerating the development of these two power generation capacity of the installed capacity is essential to reduce the LCOE; in the scenarios of the paper, by 2030 the LCOE of photovoltaic power generation will reach 36–82 US dollars/MWh, onshore wind power LCOE can reach 39–43 US dollars/MWh. The paper chooses four groups of RE vehicles and conventional vehicles to carry out energy reduction cost research, the selected four groups of vehicles, the conventional car life cycle per kilometer GHG emissions 262–343 g CO2 equivalent, new energy vehicle life cycle per kilometer GHG emissions 116–201 g CO2 equivalent. The results show that new energy vehicles replace conventional cars to reduce GHG emissions have a positive effect, but the cost is higher, it is recommended that the government can put the cost of GHG emission reduction to the entire energy production and consumption process. In the vehicles selected, TOCs of NEVs were $1101, $6909, and $4163 higher than their counterparts and E150 EVs will save $3577 with large subsidies. Substitutions between BEVs or PHEVs and CVs (except for the E150 EV set) show that the costs to lower 1 ton of GHG emissions are $87–$266. After 2020, this will increase to as high as $900/ton of GHG emission. This will be a heavy burden for NEV consumers and will obstruct the progress toward reducing emissions in the transport sector. The government should initiate policies that will allocate the cost of the entire life cycle of energy production and consumption. Longer VKT will expand the impact of alternative energy on the cost-emission efficiency when comparing the EV case and NGV case. If there are no subsidies, EVs should be considered as viable vehicles in the public passenger and freight transport sectors.
Acknowledgments
The authors would like to thank National Social Science Funds of China (No. 13&ZD159), National Natural Science Foundation of China (No. 71303258, No. 71503264), Ministry of Education in China (MOE) Project of Humanities and Social Sciences (No. 13YJC630148), Science Foundation of China University of Petroleum, Beijing (No. ZX20150130, No. 2462014YJRC024) and the StandUp for Energy collaboration initiative for financial support.
Author Contributions
Baosheng Zhang designed the paper; Xiaoyang Sun took care of the literature review; Shangfeng Han and Song Han provided the background and filtered the results; and Mikael Höök supervised the paper writing.
Conflicts of Interest
The authors declare no conflict of interest.
Abbreviations
| BEV | Battery electric vehicle |
| CBM | Coalbed Methane |
| EV | Electric vehicle |
| FIT | Feed-in-Tariff |
| GHG | Greenhouse Gas |
| HREP | High Renewable Energy Penetration |
| IEA | International Energy Agency |
| INDC | Intended Nationally Determined Contribution |
| LCOE | Levelized cost of electricity |
| LNG | Liquefied Natural Gas |
| MSRP | Manufacturer suggested retail price |
| NGCC | Natural Gas Combined Cycle |
| NGV | Natural gas vehicle |
| OECD | Organization for Economic Co-operation and Development |
| PHEV | Plug-in hybrid electric vehicle |
| RE | Renewable energy |
| tcm | trillion cubic meters |
| OCC | Overnight Capital Cost |
| URR | Ultimately recoverable resource |
Appendix A

Table A1.
Lifecycle greenhouse gas emissions of pulverized coal fired generation.
| Process | GHG (kg CO2 eq/KWh) |
|---|---|
| Coal production | 9.888 × 10⁻² |
| coal | 1.890 × 10⁻² |
| equipment transportation | 4.136 × 10⁻⁴ |
| equipment production | 1.537 ×10⁻⁵ |
| power plant construction | 1.537 ×10⁻⁵ |
| Power plant operation | 9.143 ×10⁻⁴ |
| Total | 1.02 |
Table A2.
Lifecycle GHG emissions of combined cycle natural gas fired generation (g CO2 eq/KWh).
| Process | CO2 | CH4 | N2O |
|---|---|---|---|
| Building materials transportation | 7.48 × 10⁻³ | 3.80 × 10⁻⁷ | 3.68 × 10⁻⁵ |
| power plant construction | 1.40 | 6.21 × 10⁻³ | 9.34 × 10⁻⁵ |
| retirement | 1.40 × 10⁻¹ | 6.21 × 10⁻⁴ | 9.34 × 10⁻⁶ |
| Fuel production | 66 | 2.77 | 5.77 × 10⁻⁴ |
| fuel transportation | 3.42 × 10⁻¹ | 8.00 × 10⁻⁴ | 1.22 × 10⁻³ |
| combustion for power generation | 371 | 4.51 × 10⁻² | 0 |
| Total | 439 | 2.82 | 1.94 × 10⁻³ |
Table A3.
Lifecycle greenhouse gas emissions of nuclear power (g CO2 eq/KWh).
| Process | Material | Energy |
|---|---|---|
| Uranium mining | 0.495 | 1.83 |
| The transformation of uranium and uranium enrichment | 0.84 | 0.314 |
| Diffusion decommissioning project | 0.079 | - |
| fuel fabrication facility | 0.00787 | 0.21 |
| nuclear power plant | 0.451 | 1.96 |
| postprocessing | - | 5.29 |
| waste disposal | - | 0.433 |
| Total | 1.87 | 10 |
Table A4.
Lifecycle greenhouse gas emissions of hydropower (g CO2 eq/KWh).
| Categories | GHG(g CO2 eq/KWh) |
|---|---|
| Rolled steel | 3.43 |
| concrete | 6.07 |
| diesel | 2.18 |
| inundated area | 7.56 |
| Total | 19.24 |
Table A5.
Lifecycle greenhouse gas emissions of biomass (g CO2 eq/KWh).
| Process | GHG (g CO2 eq/KWh) |
| Trees obtain | 6.39 |
| smash | 12.76 |
| transportation | 14.78 |
| Electricity generation | 44.41 |
| Sub-total | 78.34 |
| Upstream manufacture | |
| equipment | 26.36 |
| construction | 6.11 |
| water | 3.07 |
| lubricating oil | 0.35 |
| Sub-total | 35.9 |
| Total | 114.23 |
Table A6.
Lifecycle greenhouse gas emissions of polycrystalline solar PV (g CO2 eq/KWh).
| Photovoltaic Solar Power Manufacturing | GHG Emissions (g CO2 eq/KWh) |
|---|---|
| Quartz mining | 0.202 |
| transportation | 34.6 |
| UMG-Siredox reaction | 0.4 |
| UMG-Si production | 2.88 |
| SoG-Si production | 21.3 |
| ingotting | 1.3 |
| wafer cutting | 3.38 |
| Cell production | 6.32 |
| module production | 6.32 |
| system integration | 7.91 |
| Manufacturing subtotal | 50.16 |
| Photovoltaic power station operation | 0.05 |
| transmission | 3.11 |
| Power station disposal | 5.81 |
| Total | 60.13 |
Table A7.
Lifecycle greenhouse gas emissions of onshore wind power.
| Wind Turbine | Material | Tons |
| Rotor | synthetic resin | 154 |
| fiberglass | 106 | |
| pigging | 190 | |
| cabin | iron | 480 |
| steel | 560 | |
| silicon dioxide | 9.6 | |
| copper | 9.1 | |
| fiberglass | 0.9 | |
| synthetic resin | 1.3 | |
| tower | steel | 2100 |
| Transformer Substation | ||
| transformer | silicon dioxide | 0.6 |
| steel | 11 | |
| copper | 4.8 | |
| computer | - | 5 |
| Bauarbeit | ||
| Drum tower foundation | concrete | 8300 |
| rebar | 990 | |
| electric substation | concrete | 160 |
| rebar | 7.9 | |
| Operations and Maintenance | ||
| blade | synthetic resin | 52.1 |
| fiberglass | 35.9 | |
| dynamo | silicon dioxide | 0.72 |
| copper | 7.9 | |
| steel | 17 | |
References
- IEA Statistics. CO2 Emissions from Fuel Combustion Highlights. 2015. Available online: https://www.iea.org/publications/freepublications/publication/CO2EmissionsFromFuelCombustionHighlights2015.pdf (accessed on 24 October 2016).
- Organization for Economic Co-operation and Development (OECD). CO2 Emissions from Fuel Combustion. 2015. Available online: http://www.oecd-ilibrary.org/docserver/download/6115291e.pdf?expires=1470293242&id=id&accname=ocid195069&checksum=FAE956F9B01EBE9FED1E2DA439956DDC (accessed on 12 October 2016).
- BP. Statistical Review of World Energy 2016; BP P.L.C.: London, UK, 2016. [Google Scholar]
- Hofmann, J.; Guan, D.; Chalvatzis, K.; Huo, H. Assessment of electrical vehicles as a successful driver for reducing CO2 emissions in China. Appl. Energy 2016, 184, 995–1003. [Google Scholar] [CrossRef]
- Shahraeeni, M.; Ahmed, S.; Malek, K.; Van Drimmelen, B.; Kjeang, E. Life cycle emissions and cost of transportation systems: A Case study on diesel and natural gas for light-duty trucks in municipal fleet operations. J. Nat. Gas Sci. Eng. 2015, 24, 26–34. [Google Scholar] [CrossRef]
- The International Renewable Energy Agency (IRENA). Renewable Power Generation Costs in 2014. 2015. Available online: http://www.irena.org/documentdownloads/publications/irena_re_power_costs_2014_report.pdf (accessed on 20 October 2015).
- Organisation for Economic Co-operation and Development (OECD). Global EV Outlook 2016. 2016. Available online: https://www.iea.org/publications/freepublications/publication/Global_EV_Outlook_2016.pdf (accessed on 10 September 2016).
- McJeon, H.; Edmonds, J.; Bauer, N.; Clarke, L.; Fisher, B.; Flannery, B.; Hilaire, J.; Krey, V.; Marangoni, G.; Mi, R.; et al. Limited impact on decadal-scale climate change from increased use of natural gas. Nature 2014, 514, 482–485. [Google Scholar] [CrossRef] [PubMed]
- Moore, C.; Zielinska, B.; Pétron, G.; Jackson, R. Air impacts of increased natural gas acquisition, processing, and use: A critical review. Environ. Sci. Technol. 2014, 48, 8349–8359. [Google Scholar] [CrossRef] [PubMed]
- Vandewalle, J. Natural Gas in the Energy Transition—Technical Challenges and Opportunities of Natural Gas and Its Infrastructure as a Flexibility-Providing Resource. Ph.D. Thesis, University of Leuven, Leuven, Belgium, 2014. [Google Scholar]
- BP. Statistical Review of World Energy 2015; BP P.L.C.: London, UK, 2015. [Google Scholar]
- Paltsev, S.; Zhang, D. Natural gas pricing reform in China: Getting closer to a market system? Energy Policy 2015, 86, 43–56. [Google Scholar] [CrossRef]
- Xin, L. Natural Gas in China: A Regional Analysis; Oxford Energy Comment; Oxford Institute for Energy Studies: Oxford, UK, 2015. [Google Scholar]
- Johansson, B. Security aspects of future renewable energy systems—A short overview. Energy 2013, 61, 598–605. [Google Scholar] [CrossRef]
- Intergovernmental Panel on Climate Change (IPCC). IPCC Special Report on Renewable Energy Sources and Climate Change Mitigation; Cambridge University Press: Cambridge, UK; New York, NY, USA, 2011. [Google Scholar]
- Creutzig, F.; Goldschmidt, J.; Lehmann, P.; Schmid, E.; von Blücher, F.; Breyer, C.; Fernandez, B.; Jakob, M.; Knopf, B.; Lohrey, S.; et al. Catching two European birds with one renewable stone: Mitigating climate change and Eurozone crisis by an energy transition. Renew. Sustain. Energy Rev. 2014, 38, 1015–1028. [Google Scholar] [CrossRef]
- Zeng, M.; Wang, S.; Duan, J.; Sun, J.; Zhong, P.; Zhang, Y. Review of nuclear power development in China: Environment analysis, historical stages, development status, problems and countermeasures. Renew. Sustain. Energy Rev. 2016, 59, 1369–1383. [Google Scholar] [CrossRef]
- Dogan, E.; Seker, F. Determinants of CO2 emissions in the European Union: The role of renewable and non-renewable energy. Renew. Energy 2016, 94, 429–439. [Google Scholar] [CrossRef]
- Qi, T.; Zhang, X.; Karplus, V. The energy and CO2 emissions impact of renewable energy development in China. Energy Policy 2014, 68, 60–69. [Google Scholar] [CrossRef]
- Wang, J.; Feng, L.; Zhao, L.; Snowden, S. China’s natural gas: Resources, production and its impacts. Energy Policy 2013, 55, 690–698. [Google Scholar] [CrossRef]
- Energy Information Administration (EIA). Technically Recoverable Shale Oil and Shale Gas Resources: China. 2015. Available online: https://www.eia.gov/analysis/studies/worldshalegas/pdf/China_2013.pdf (accessed on 5 August 2016).
- Bundesanstalt für Geowissenschaften und Rohstoffe (BGR). Energy Study 2012: Reserves, Resources and Availability of Energy Resources. 2012. Available online: http://www.bgr.bund.de/DE/Gemeinsames/Produkte/Downloads/DERA_Rohstoffinformationen/rohstoffinformationen-15e.pdf?__blob=publicationFile&v=3 (accessed on 10 August 2015).
- Ministry of Land and Resources of PRC. China Mineral Resources. Ministry of Land and Resources, Beijing. 2015. Available online: http://www.mlr.gov.cn/sjpd/zybg/2015/201510/P020151030354926948039.pdf (accessed on 10 August 2015).
- Ministry of Land and Resources of PRC, 2016. Available online: http://www.mlr.gov.cn/xwdt/tpxw/201606/t20160613_1408483.htm (accessed on 9 August 2016).
- Jia, C.; Zheng, M.; Zhang, Y. Unconventional hydrocarbon resources in China and the prospect of exploration and development. Pet. Explor. Dev. 2012, 39, 139–146. [Google Scholar] [CrossRef]
- Bundesanstalt für Geowissenschaften und Rohstoffe (BGR). Energy Study 2013: Reserves, Resources and Availability of Energy Resources; BGR: Hannover, Germany, 2013. [Google Scholar]
- International Energy Agency (IEA). Golden Rules for a Golden Age of Gas. 2012. Available online: http://www.worldenergyoutlook.org/media/weowebsite/2012/goldenrules/weo2012_goldenrulesreport.pdf (accessed on 11 January 2016).
- International Energy Agency (IEA). World Energy Outlook 2013. 2013. Available online: http://www.worldenergyoutlook.org/weo2013/ (accessed on 11 January 2016).
- International Energy Agency (IEA). World Energy Outlook 2007; IEA: Paris, France, 2007. [Google Scholar]
- International Energy Agency (IEA). World Energy Outlook 2009; IEA: Paris, France, 2009. [Google Scholar]
- Tian, L.; Wang, Z.; Krupnick, A.; Liu, X. Stimulating shale gas development in China: A comparison with the US experience. Energy Policy 2014, 75, 109–116. [Google Scholar] [CrossRef]
- Mohr, S.; Evans, G. Long term forecasting of natural gas production. Energy Policy 2011, 39, 5550–5560. [Google Scholar] [CrossRef]
- Bloomberg. China’s Shale Gas Reserves Jump Fivefold as Output Lags Target. 2016. Available online: http://www.bloomberg.com/news/articles/2016-04-06/china-s-shale-gas-reserves-jump-fivefold-as-output-lags-target (accessed on 15 March 2016).
- Wang, J.; Mohr, S.; Feng, L.; Liu, H.; Tverberg, G. Analysis of resource potential for China’s unconventional gas and forecast for its long-term production growth. Energy Policy 2016, 88, 389–401. [Google Scholar] [CrossRef]
- Liu, Z.; Guan, D.; Crawford-Brown, D.; Zhang, Q.; He, K.; Liu, J. Energy Policy: A low-carbon road map for China. Nature 2013, 500, 143–145. [Google Scholar] [CrossRef] [PubMed]
- REN21. Renewables 2015 Global Status Report; REN21: Paris, France, 2015. [Google Scholar]
- Davidson, M.; Zhang, D.; Xiong, W.; Zhang, X.; Karplus, V. Modelling the potential for wind energy integration on China’s coal-heavy electricity grid. Nat. Energy 2016, 1, 16086. [Google Scholar] [CrossRef]
- He, G.; Kammen, D. Where, when and how much solar is available? A provincial-scale solar resource assessment for China. Renew. Energy 2016, 85, 74–82. [Google Scholar] [CrossRef]
- Liu, W.; Lund, H.; Mathiesen, B.; Zhang, X. Potential of renewable energy systems in China. Appl. Energy 2011, 88, 518–525. [Google Scholar] [CrossRef]
- Sun, X.; Zhang, B.; Tang, X.; McLellan, B.C.; Höök, M. Sustainable energy transitions in China: Renewable options and impacts on the electricity system. Energies 2016, 9, 980. [Google Scholar] [CrossRef]
- Yuan, J.; Hu, Z. Low carbon electricity development in China—An IRSP perspective based on Super Smart Grid. Renew. Sustain. Energy Rev. 2011, 15, 2707–2713. [Google Scholar] [CrossRef]
- Organisation for Economic Co-operation and Development (OECD). Technology Roadmap: Nuclear Energy; IEA: Paris, France, 2015. [Google Scholar]
- State Council. Energy Development Strategy Action Plan (2014–2020); State Council: Beijing, China, 2014.
- United Nations Framework Convention on Climate Change. China’s Intended Nationally Determined Contribution: Enhanced Actions on Climate Change. 2015. Available online: http://www4.unfccc.int/submissions/INDC/Published%20Documents/China/1/China’s%20INDC%20-%20on%2030%20June%202015.pdf (accessed on 15 March 2016).
- World Nuclear Association. Nuclear Power in China. 2016. Available online: http://www.world-nuclear.org/information-library/country-profiles/countries-a-f/china-nuclear-power.aspx (accessed on 15 March 2016).
- National Development and Reform Commission (NDRC). Natural Gas Utilization Policy. Available online: http://www.sdpc.gov.cn/zcfb/zcfbl/201210/t20121031_511891.html (accessed on 15 March 2016). (In Chinese)
- Central People’s Government of the People's Republic of China. The Renewable Energy Law of the People’s Republic of China. Available online: http://www.gov.cn/ziliao/flfg/2005-06/21/content_8275.htm (accessed on 15 March 2016). (In Chinese)
- National People’s Congress. The People’s Republic of China Renewable Energy Law (amendment). Available online: http://www.npc.gov.cn/huiyi/cwh/1112/2009-12/26/content_1533216.htm (accessed on 15 March 2016). (In Chinese)
- National Development and Reform Commission (NDRC). Renewable Energy Generation Related Regulations. Available online: http://www.sdpc.gov.cn/zcfb/zcfbtz/200602/t20060206_58735.html (accessed on 15 March 2016). (In Chinese)
- National Development and Reform Commission (NDRC); National Energy Administration (NEA). Improving Power Operations, Adjusting Incentives for Clean Energy Production Guiding Opinion. China National Development and Reform Commission, 2015. Available online: http://www.gov.cn/xinwen/2015-03/23/content_2837637.htm (accessed on 15 March 2016).
- National Development and Reform Commission (NDRC). The Central Committee of the Communist Party of the Several Opinions on Further Deepening the Reform of Electric Power System by the State Council. Available online: http://tgs.ndrc.gov.cn/zywj/201601/t20160129_773852.html (accessed on 15 March 2016). (In Chinese)
- Zhang, D.; Paltsev, S. The Future of Natural Gas in China: Effects of Pricing Reform and Climate Policy. Available online: https://dspace.mit.edu/handle/1721.1/103778 (accessed on 15 March 2016).
- National Development and Reform Commission (NDRC). Notification to Improve Nuclear Power Pricing Mechanism. 2013. Available online: www.sdpc.gov.cn/zwfwzx/zfdj/jggg/201307/t20130708_549225.html (accessed on 15 March 2016). (In Chinese)
- National Development and Reform Commission (NDRC). Notification to Improve On-Grid Wind Pricing Mechanism. 2009. Available online: www.sdpc.gov.cn/fzgggz/jggl/zcfg/200907/t20090727_748211.html (accessed on 15 March 2016). (In Chinese)
- Shen, J.; Luo, C. Overall review of renewable energy subsidy policies in China—Contradictions of intentions and effects. Renew. Sustain. Energy Rev. 2015, 41, 1478–1488. [Google Scholar] [CrossRef]
- National Development and Reform Commission (NDRC). Notification to Improve On-grid Solar PV Power Pricing Mechanism. 2011. Available online: http://www.sdpc.gov.cn/zwfwzx/zfdj/jggg/201108/t20110801_426507.html (accessed on 15 March 2016). (In Chinese)
- Zhao, X.; Li, S.; Zhang, S.; Yang, R.; Liu, S. The effectiveness of China’s wind power policy: An empirical analysis. Energy Policy 2016, 95, 269–279. [Google Scholar] [CrossRef]
- The Energy Saving and New Energy Vehicle Industry Development Plan 2012–2020. The State Council of China: Beijing, 2012. Available online: http://www.gov.cn/zwgk/2012-07/09/content_2179032.htm (accessed on 15 March 2016). (In Chinese)
- Wan, Z.; Sperling, D.; Wang, Y. China’s electric car frustrations. Transp. Res. D Transp. Environ. 2015, 34, 116–121. [Google Scholar] [CrossRef]
- Gong, H.; Wang, M.; Wang, H. New energy vehicles in China: Policies, demonstration, and progress. Mitig. Adapt. Strateg. Glob. Chang. 2013, 18, 207–228. [Google Scholar] [CrossRef]
- Wang, Y.; Li, K.; Xu, X.; Zhang, Y. Transport energy consumption and saving in China. Renew. Sustain. Energy Rev. 2014, 29, 641–655. [Google Scholar] [CrossRef]
- Hao, H.; Ou, X.; Du, J.; Wang, H.; Ouyang, M. China’s electric vehicle subsidy scheme: Rationale and impacts. Energy Policy 2014, 73, 722–732. [Google Scholar] [CrossRef]
- Huang, Y. China’s New Energy Vehicle Market and Policy Analysis; China Automotive Technology & Research Center: Tianjin, China, 2015. [Google Scholar]
- Miao, B. Outlook of Power Generation Technology Cost in China. Master’s Thesis, Norwegian School of Economics, Bergen, Norway, 2015. [Google Scholar]
- Larsson, S.; Fantazzini, D.; Davidsson, S.; Kullander, S.; Höök, M. Reviewing electricity production cost assessments. Renew. Sustain. Energy Rev. 2014, 30, 170–183. [Google Scholar] [CrossRef]
- Rubin, E.; Azevedo, I.; Jaramillo, P.; Yeh, S. A review of learning rates for electricity supply technologies. Energy Policy 2015, 86, 198–218. [Google Scholar] [CrossRef]
- Rose, L.; Hussain, M.; Ahmed, S.; Malek, K.; Costanzo, R.; Kjeang, E. A comparative life cycle assessment of diesel and compressed natural gas powered refuse collection vehicles in a Canadian city. Energy Policy. 2013, 52, 453–461. [Google Scholar] [CrossRef]
- Ou, X.; Zhang, X.; Zhang, X.; Zhang, Q. Life cycle GHG of NG-based fuel and electric vehicle in China. Energies 2013, 6, 2644–2662. [Google Scholar] [CrossRef]
- Energy Information Administration (EIA). Annual Energy Outlook 2017. Available online: https://www.eia.gov/outlooks/aeo/data/browser/#/?id=3-aeo2017&cases=ref2017~ref_no_cpp&sourcekey=0 (accessed on 12 July 2016).
- Li, Y.; Lukszo, Z.; Weijnen, M. The implications of CO2 price for China’s power sector decarbonization. Appl. Energy 2015, 146, 53–64. [Google Scholar] [CrossRef]
- National Development and Reform Commission (NDRC). China 2050 High Renewable Energy Penetration Scenario and Roadmap Study. 2015. Available online: http://www.efchina.org/Attachments/Report/report-20150420/China-2050-High-Renewable-Energy-Penetration-Scenario-and-Roadmap-Study-Executive-Summary.pdf (accessed on 12 July 2016).
- International Energy Agency (IEA). World Energy Outlook 2015; IEA: Paris, France, 2015. [Google Scholar]
- Diao, Q.; Sun, W.; Yuan, X.; Li, L.; Zheng, Z. Life-cycle private-cost-based competitiveness analysis of electric vehicles in China considering the intangible cost of traffic policies. Appl. Energy 2016, 178, 567–578. [Google Scholar] [CrossRef]
- China Briefing. China’s SAT Clarifies Issues Regarding Vehicle and Vessel Tax Collection. 2013. Available online: http://www.china-briefing.com/news/2013/08/07/chinas-sat-clarifies-issues-regarding-vehicle-and-vessel-tax-collection.html (accessed on 12 July 2016).
- Lin, C.; Wu, T.; Ou, X.; Zhang, Q.; Zhang, X.; Zhang, X. Life-cycle private costs of hybrid electric vehicles in the current Chinese market. Energy Policy 2013, 55, 501–510. [Google Scholar] [CrossRef]
- Zhao, X.; Doering, O.; Tyner, W. The economic competitiveness and emissions of battery electric vehicles in China. Appl. Energy 2015, 156, 666–675. [Google Scholar] [CrossRef]
- ChinaAutoWeb. Available online: http://chinaautoweb.com/ (accessed on 12 July 2016).
- Sun, C.; Ouyang, X. Price and expenditure elasticities of residential energy demand during urbanization: An empirical analysis based on the household-level survey data in China. Energy Policy 2016, 88, 56–63. [Google Scholar] [CrossRef]
- Hao, H.; Liu, Z.; Zhao, F.; Li, W. Natural gas as vehicle fuel in China: A review. Renew. Sustain. Energy Rev. 2016, 62, 521–533. [Google Scholar] [CrossRef]
- Wang, H.; Fang, H.; Yu, X.; Wang, K. Development of natural gas vehicles in China: An assessment of enabling factors and barriers. Energy Policy 2015, 85, 80–93. [Google Scholar] [CrossRef]
- Ou, X.; Zhang, X. Life-Cycle Analyses of Energy Consumption and GHG Emissions of Natural Gas-Based Alternative Vehicle Fuels in China. J. Energy 2013, 2013, 268263. [Google Scholar] [CrossRef]
- CBN. Natural Gas in China’s Transport Sector. 2016. Available online: http://www.gastechnology.org/Training/USChinaShaleWrkshps/March2016/CBN-Tao-Wang-Transportation-Mar2016-EN.pdf (accessed on 12 July 2016).
- Enerdata. Effect of Price Reforms on the Demand of LNG in Transport in China. 2014. Available online: http://www.enerdata.net/enerdatauk/press-and-publication/energy-news-001/china-lng-price-reforms-effets_30271.html (accessed on 12 July 2016).
Figure 1.
Three scenarios of China’s future unconventional gas production [34]. (a) High scenario; (b) Medium scenario; and (c) Low scenario.
Figure 1.
Three scenarios of China’s future unconventional gas production [34]. (a) High scenario; (b) Medium scenario; and (c) Low scenario.
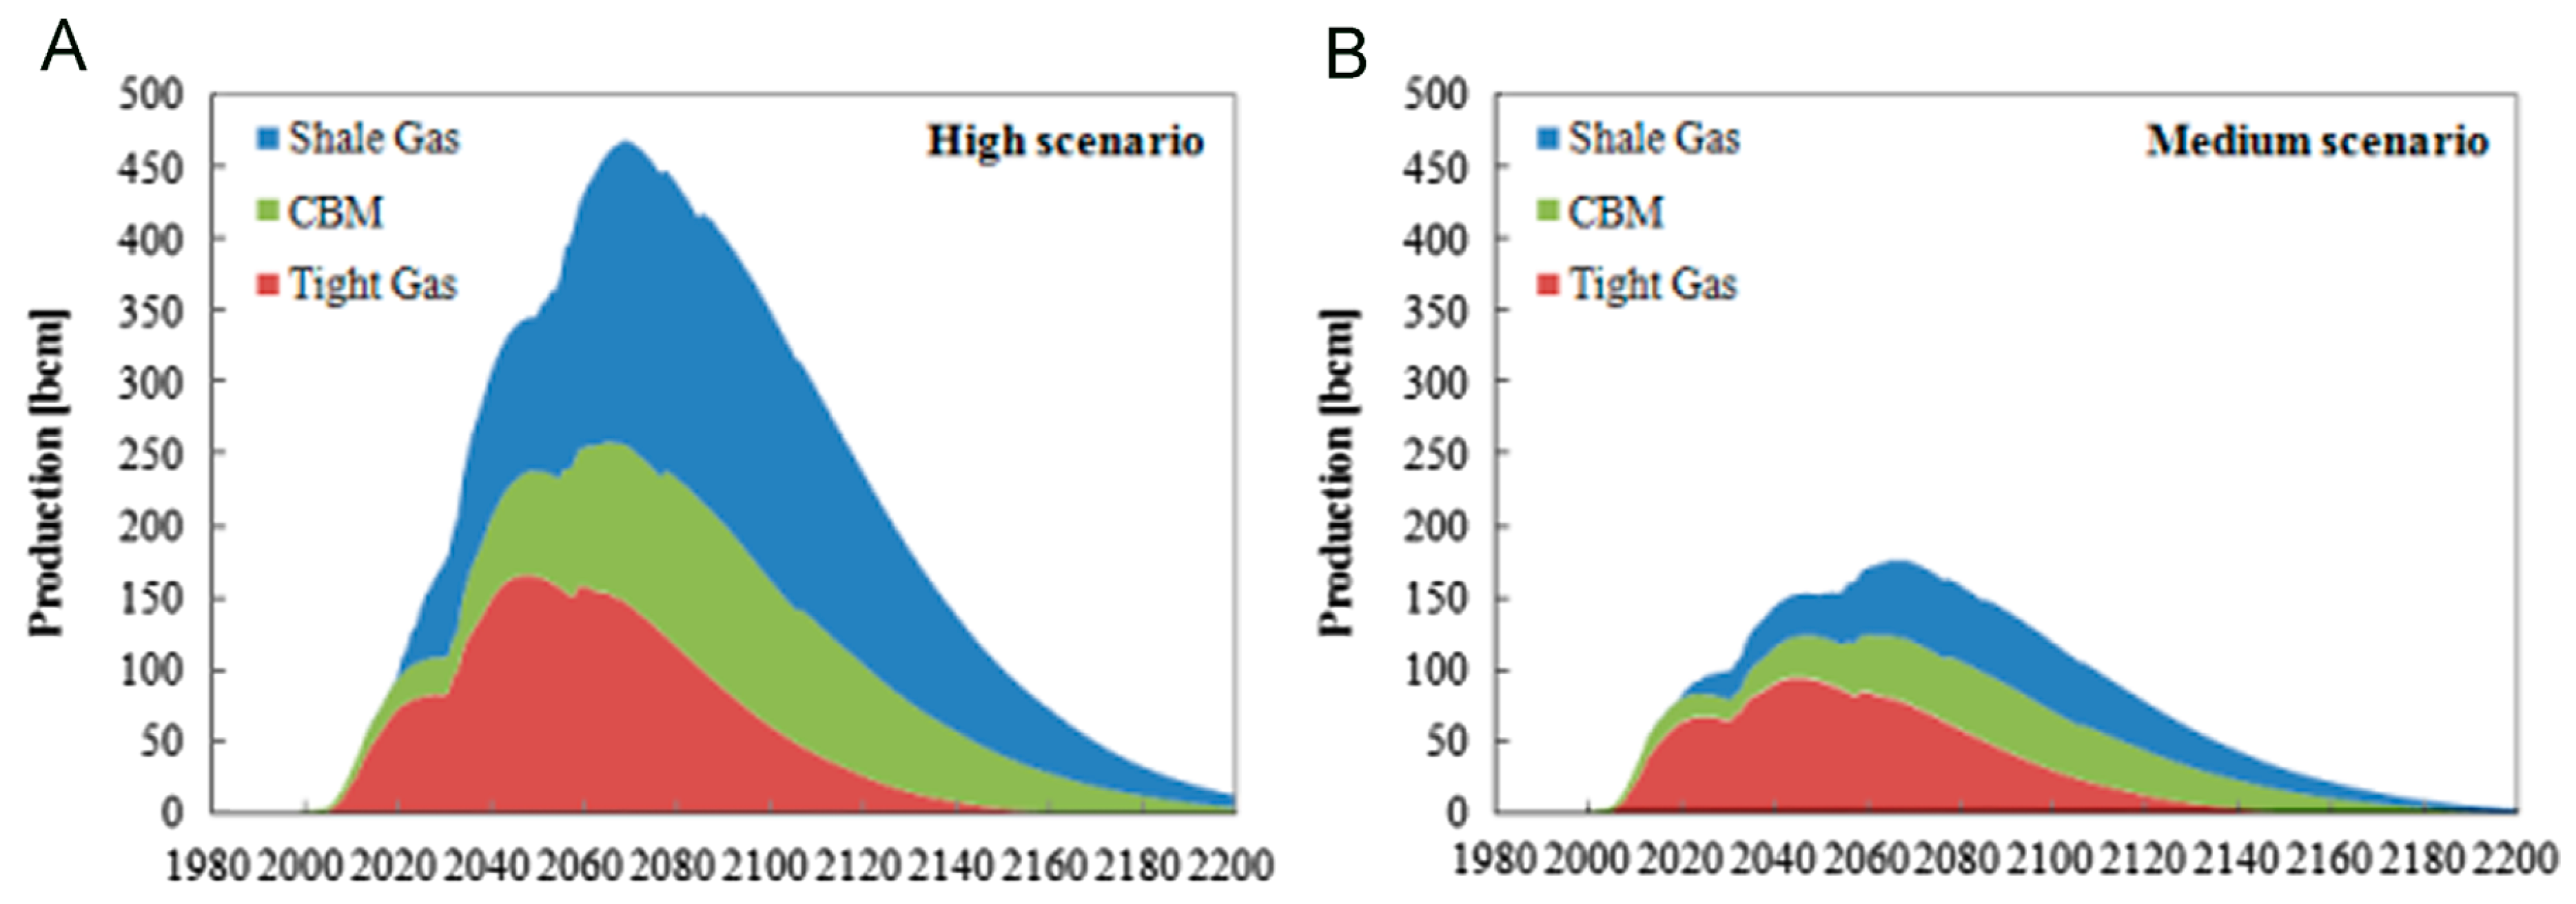
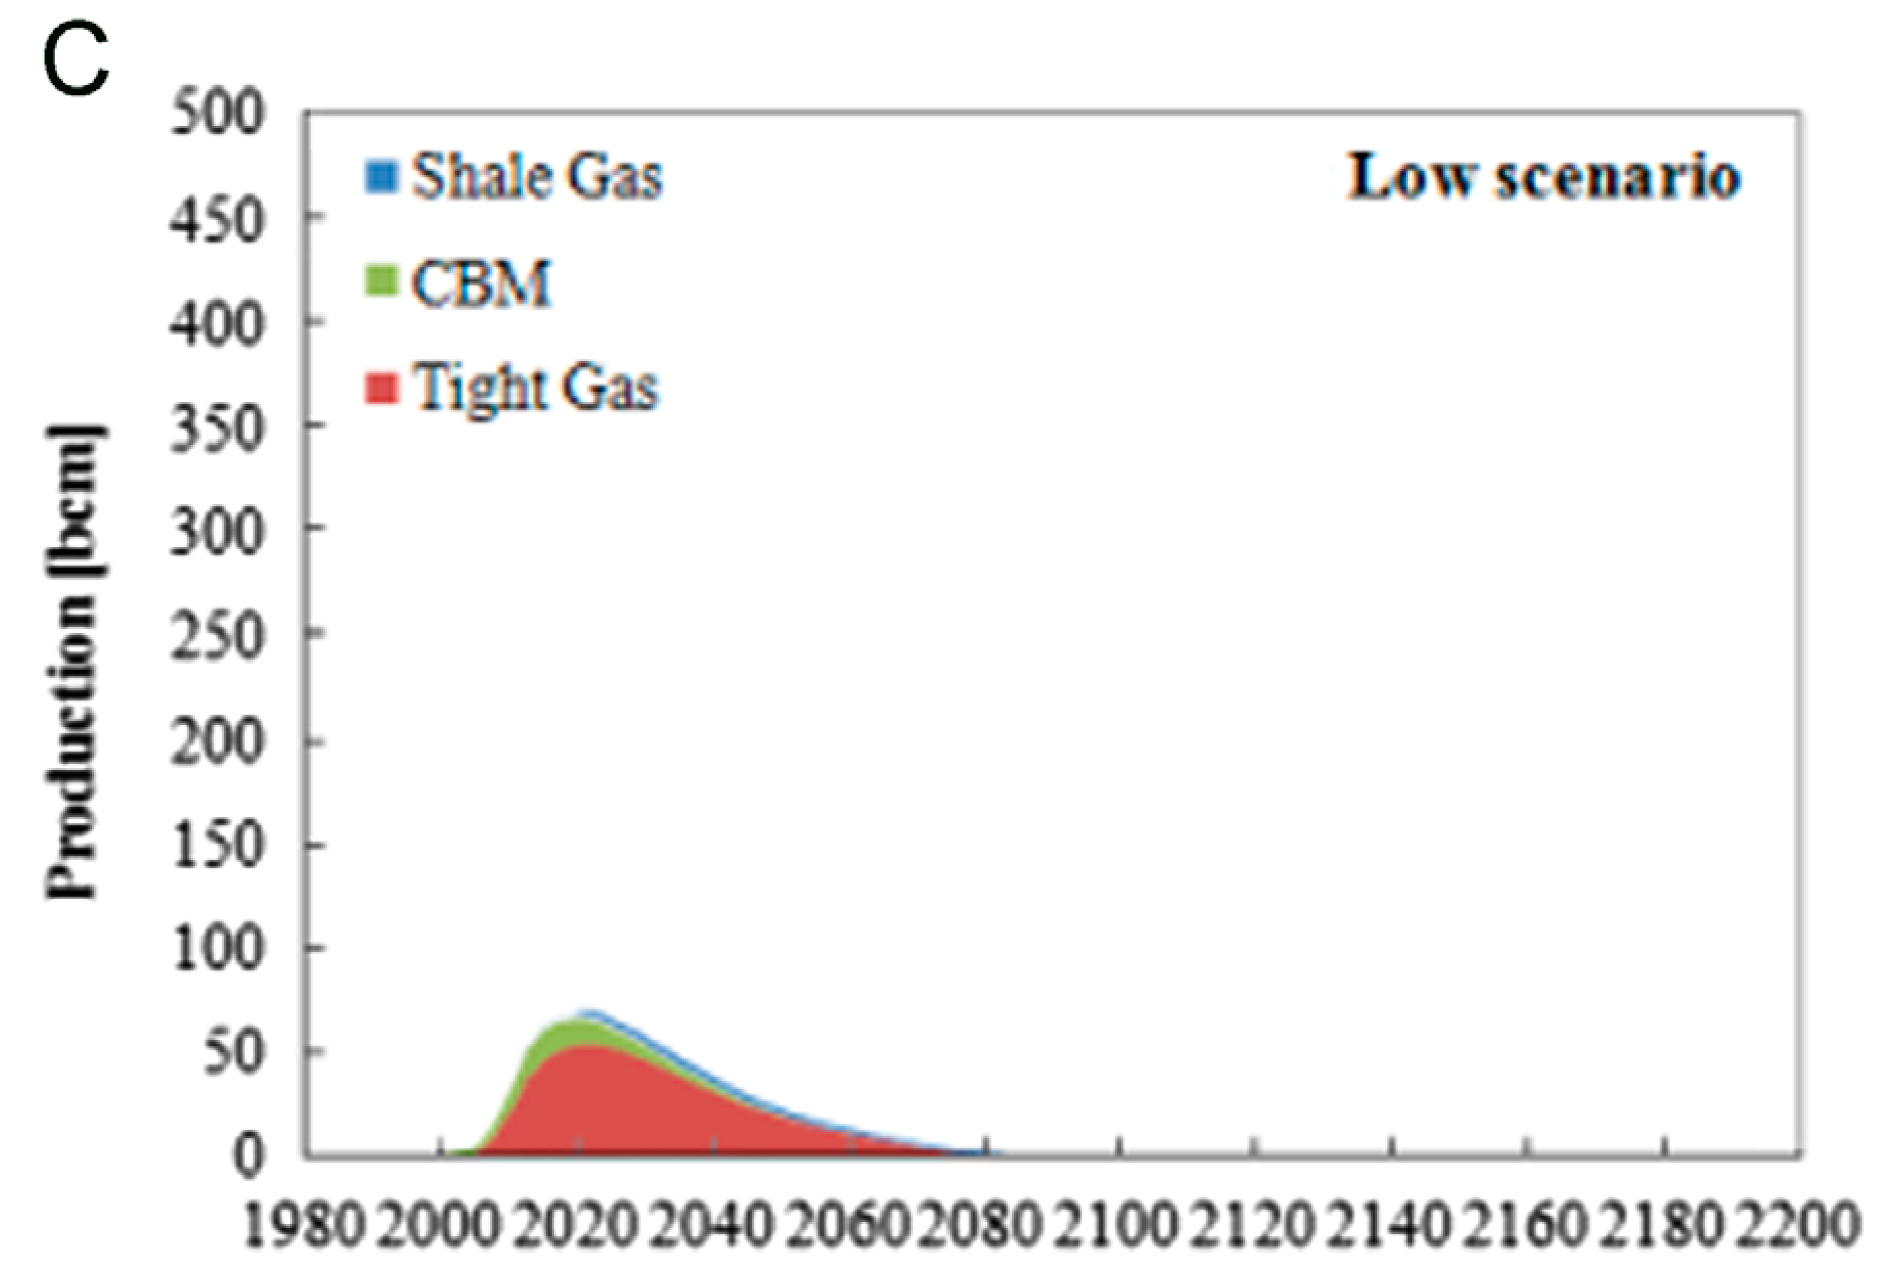
Figure 2.
LCOE ($/MWh) of different electricity technologies in the “high renewable energy penetration scenario” (ERI& NDRC) and “New Policies” (IEA) scenario. (a) High RE with GHG tax; (b) New Policy scenario with GHG tax; (c) High RE without GHG tax; and (d) New Policy scenario without GHG tax.
Figure 2.
LCOE ($/MWh) of different electricity technologies in the “high renewable energy penetration scenario” (ERI& NDRC) and “New Policies” (IEA) scenario. (a) High RE with GHG tax; (b) New Policy scenario with GHG tax; (c) High RE without GHG tax; and (d) New Policy scenario without GHG tax.
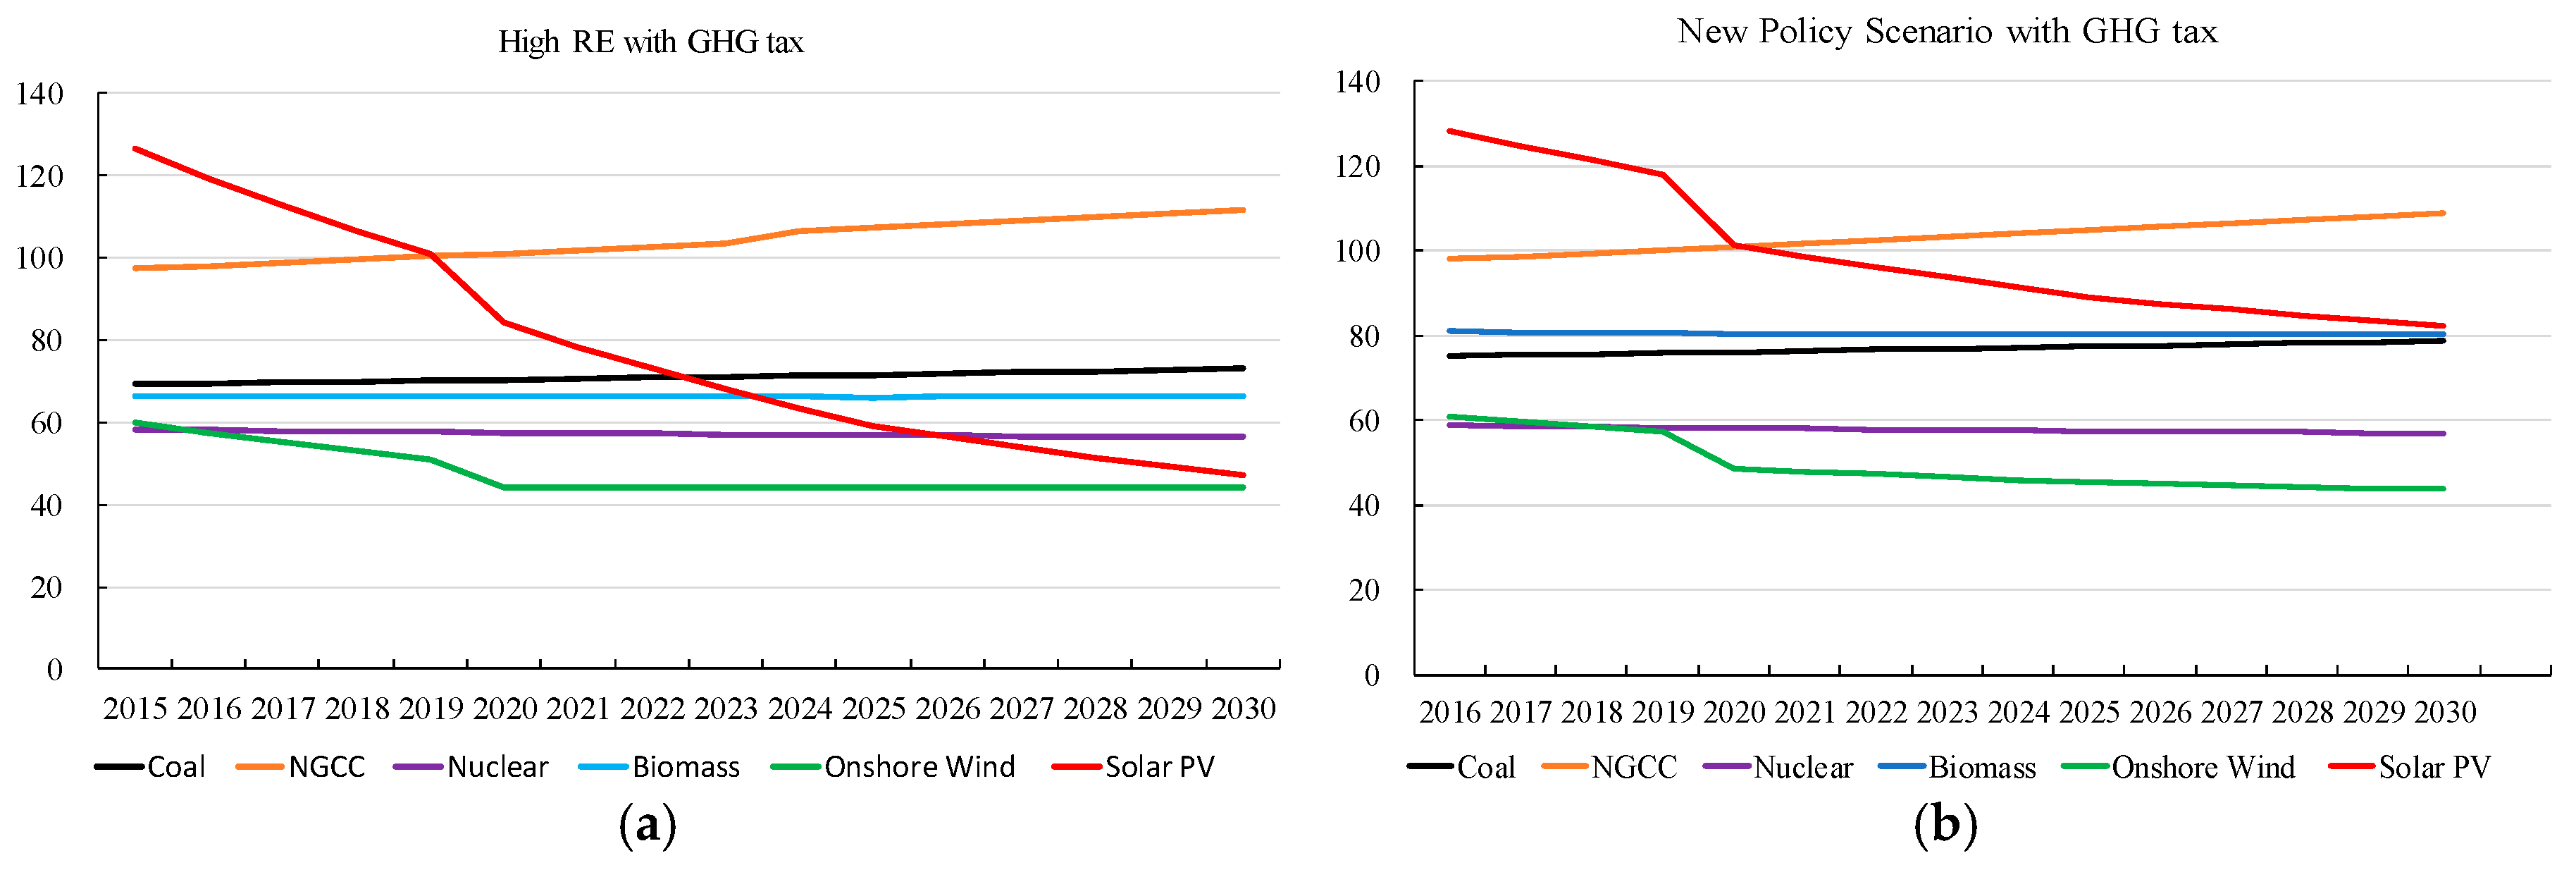

Figure 3.
LCOE ($/KWh) sensitivity analysis of onshore wind and solar PV in the “high renewable energy penetration scenario” (ERI& NDRC) and “New Policies” (IEA) scenario. (a) High RE on shore wind; (b) New policy onshore wind; (c) High RE solar PV; and (d) New policy solar PV.
Figure 3.
LCOE ($/KWh) sensitivity analysis of onshore wind and solar PV in the “high renewable energy penetration scenario” (ERI& NDRC) and “New Policies” (IEA) scenario. (a) High RE on shore wind; (b) New policy onshore wind; (c) High RE solar PV; and (d) New policy solar PV.

Figure 4.
The TOCs for conventional vehicles, battery vehicles, and plug-in hybrid gasoline-electric vehicles (without government subsidy).
Figure 4.
The TOCs for conventional vehicles, battery vehicles, and plug-in hybrid gasoline-electric vehicles (without government subsidy).

Figure 5.
The TOCs for conventional vehicles, battery vehicles and plug-in hybrid gasoline-electric vehicles (with government subsidy).
Figure 5.
The TOCs for conventional vehicles, battery vehicles and plug-in hybrid gasoline-electric vehicles (with government subsidy).
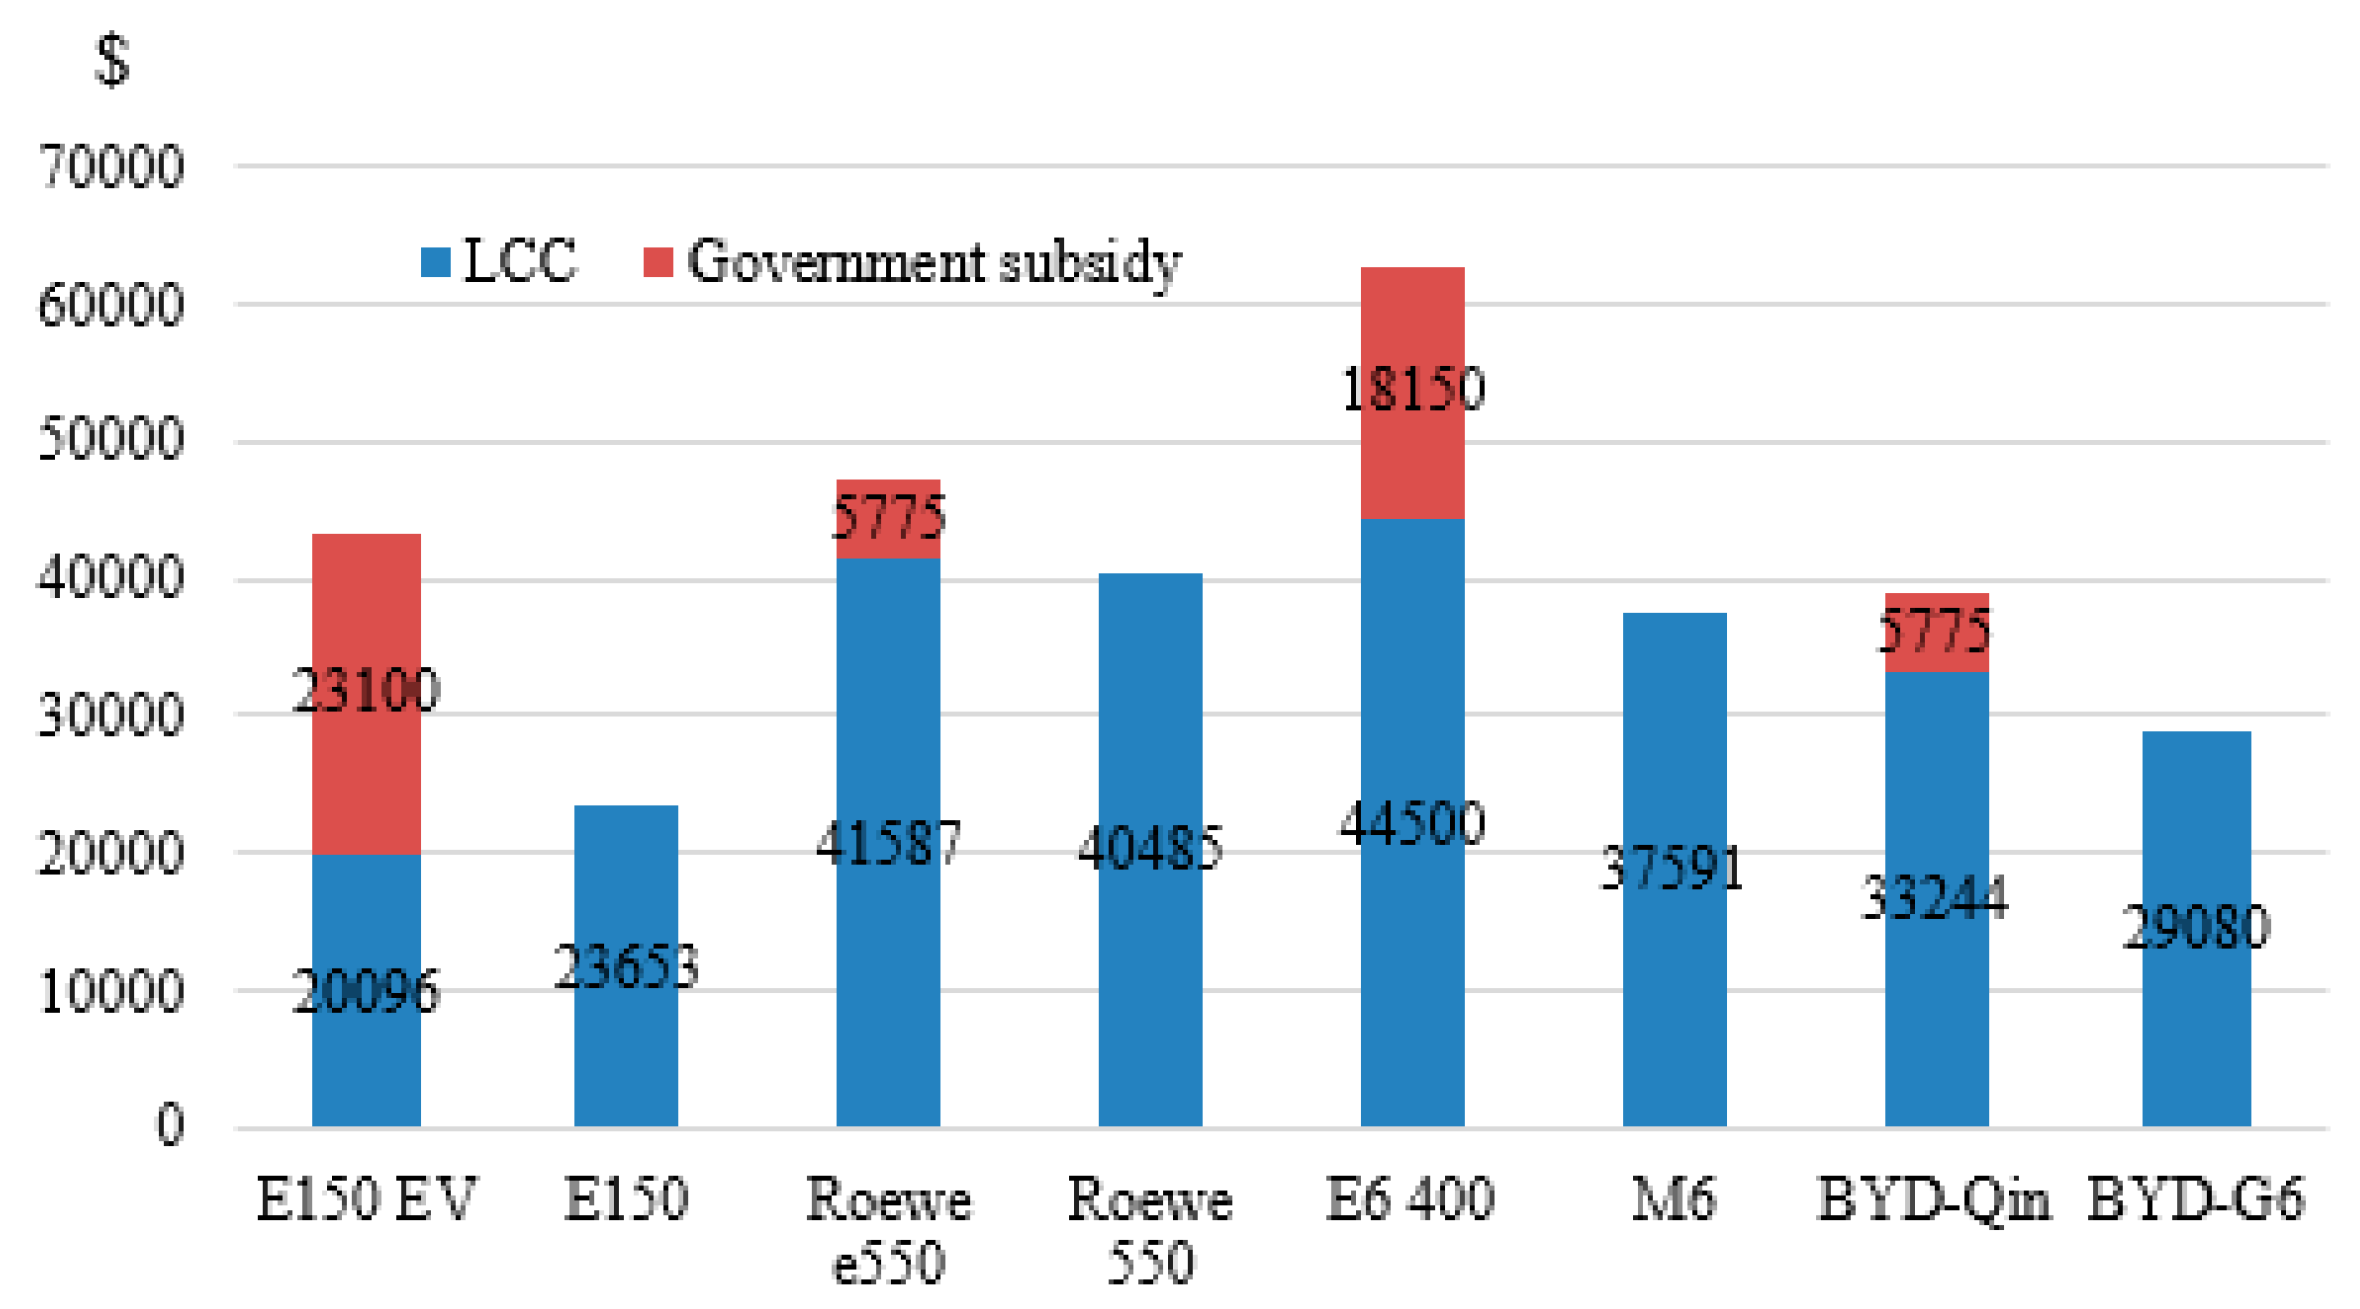
Figure 6.
GHG emissions per km from selected vehicles.
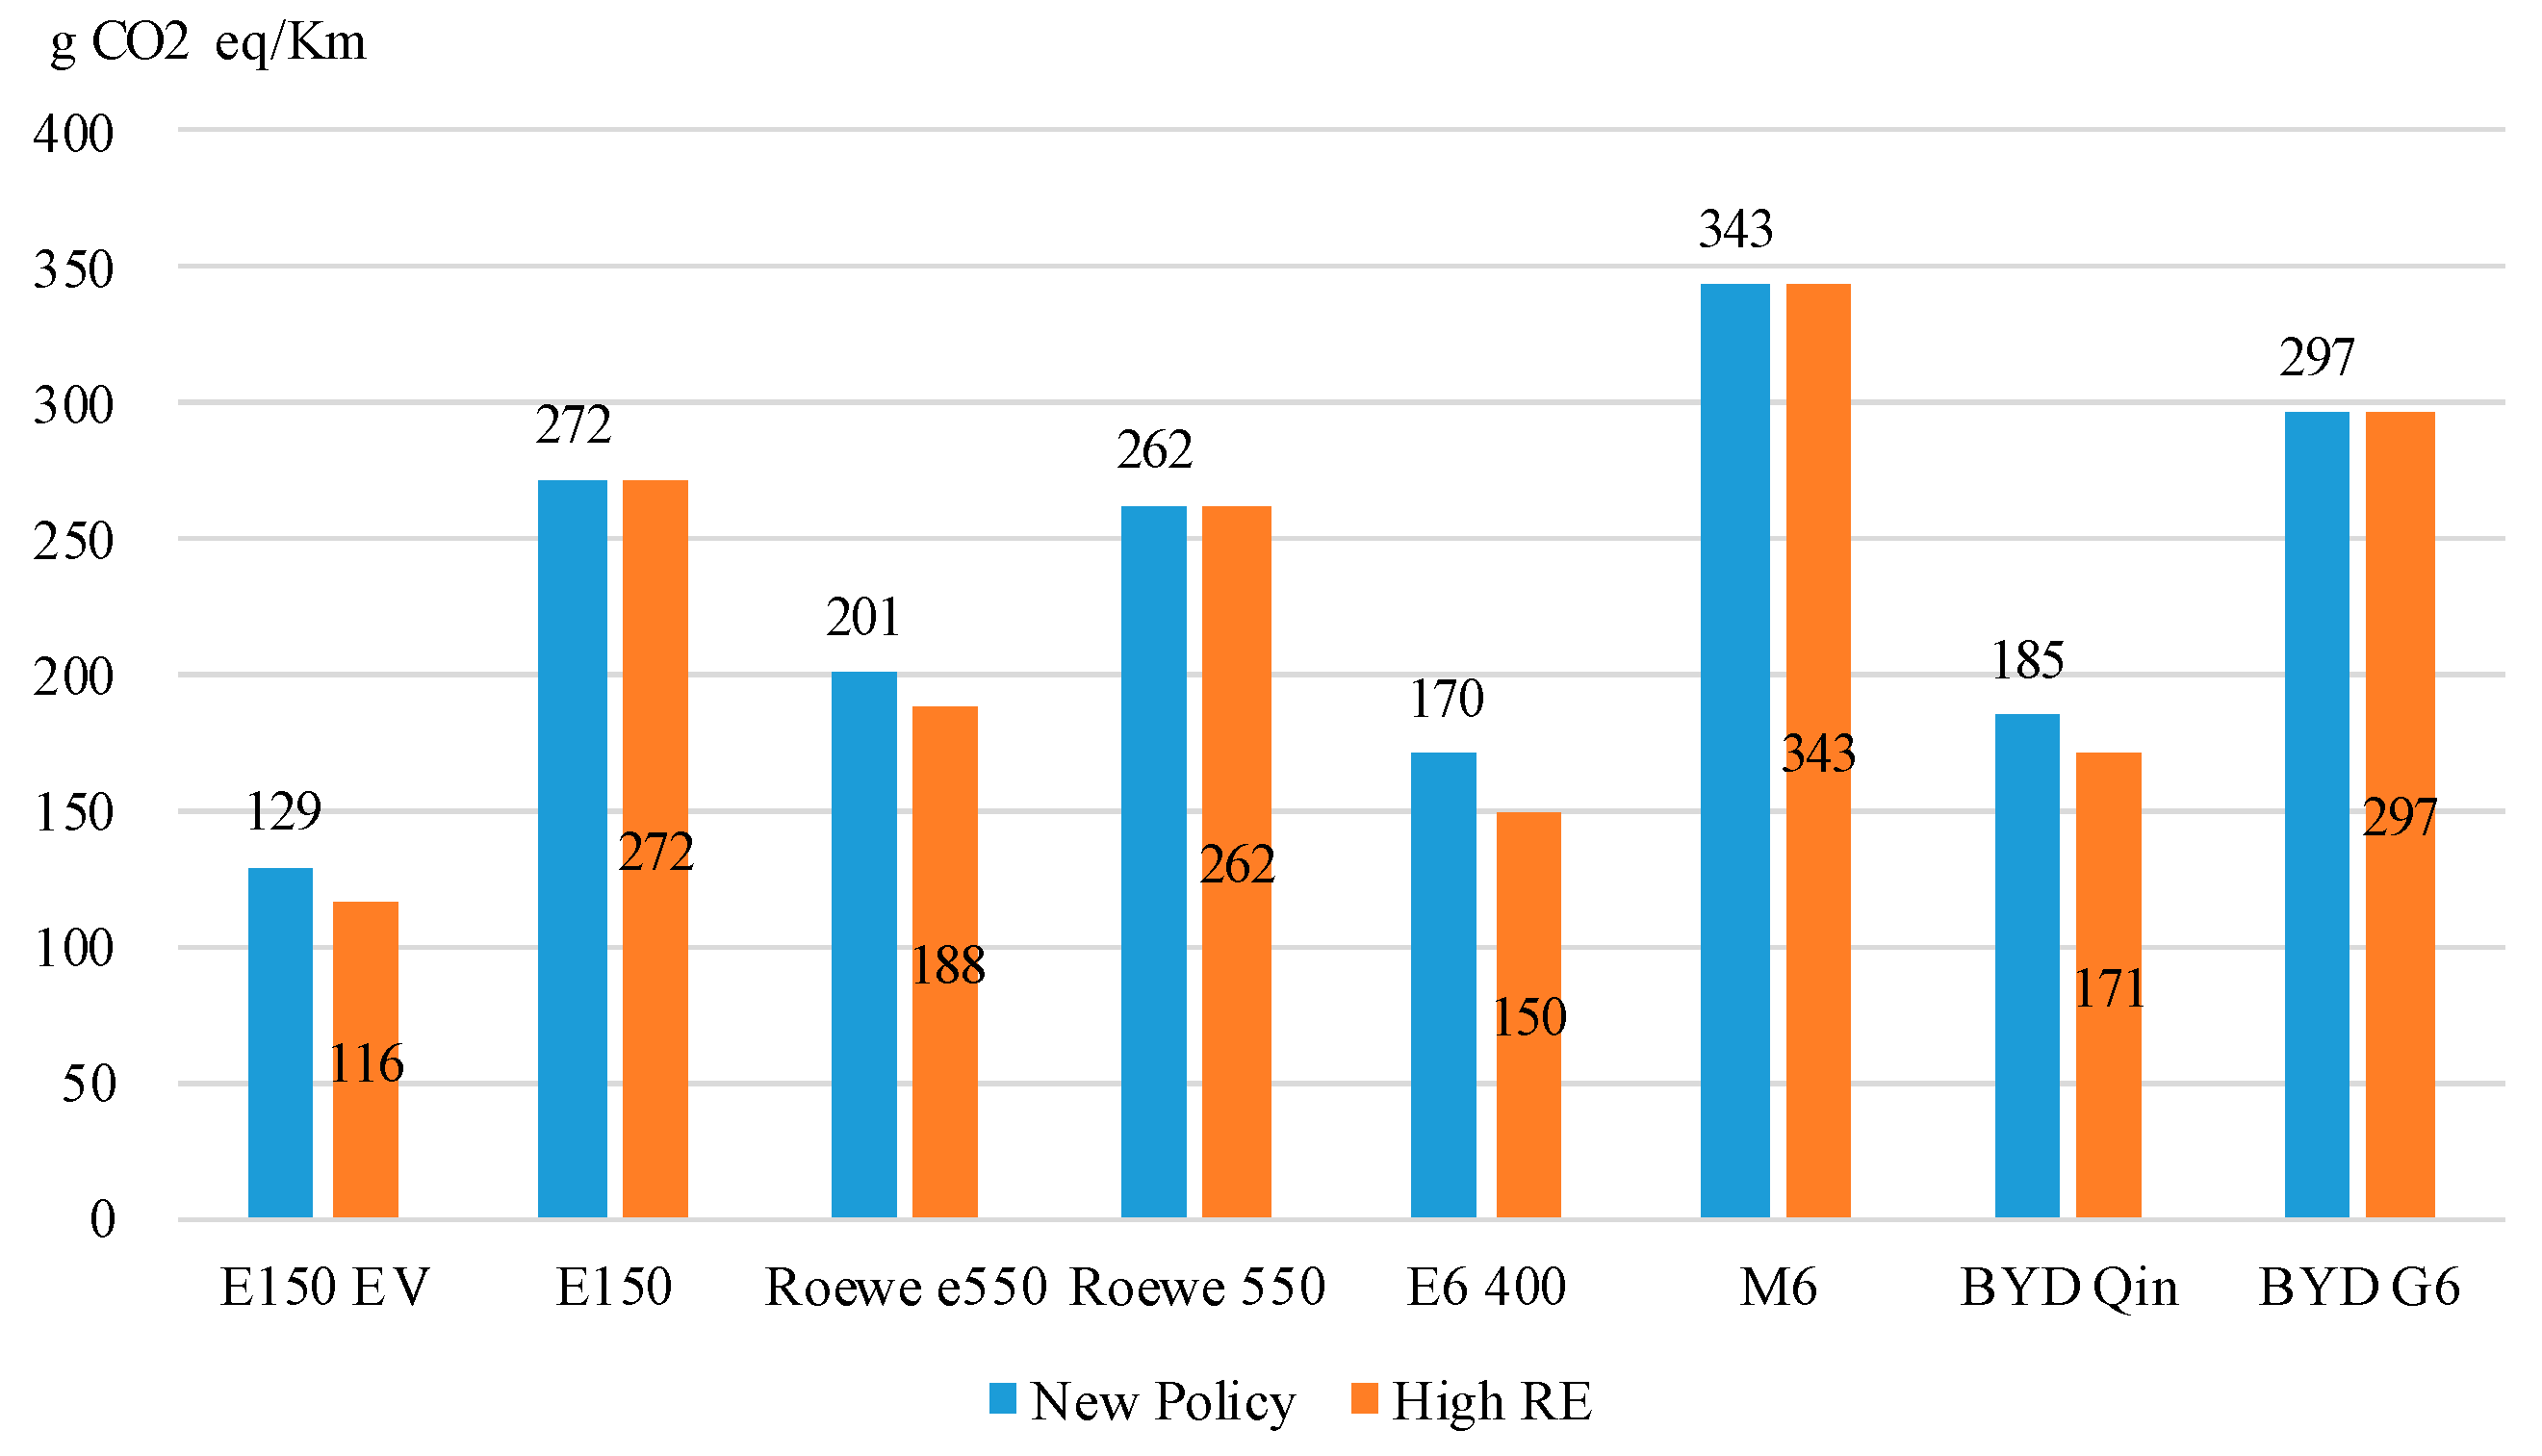
Figure 7.
Cost efficiency of substitutions between BEVs or PHEVs and CVs.

Figure 8.
Cost-emission efficiency from 2016 under future government subsidy policies. (a) High RE scenario; (b) New policy scenario.
Figure 8.
Cost-emission efficiency from 2016 under future government subsidy policies. (a) High RE scenario; (b) New policy scenario.

Figure 9.
Sensitivity analysis of cost-emission effectiveness () of substitution between NEVs and CVs. (a1–d1) the results in high RE (HREP) scenario; (a2–d2) the results in new policy scenario for the four substitution sets.
Figure 9.
Sensitivity analysis of cost-emission effectiveness () of substitution between NEVs and CVs. (a1–d1) the results in high RE (HREP) scenario; (a2–d2) the results in new policy scenario for the four substitution sets.

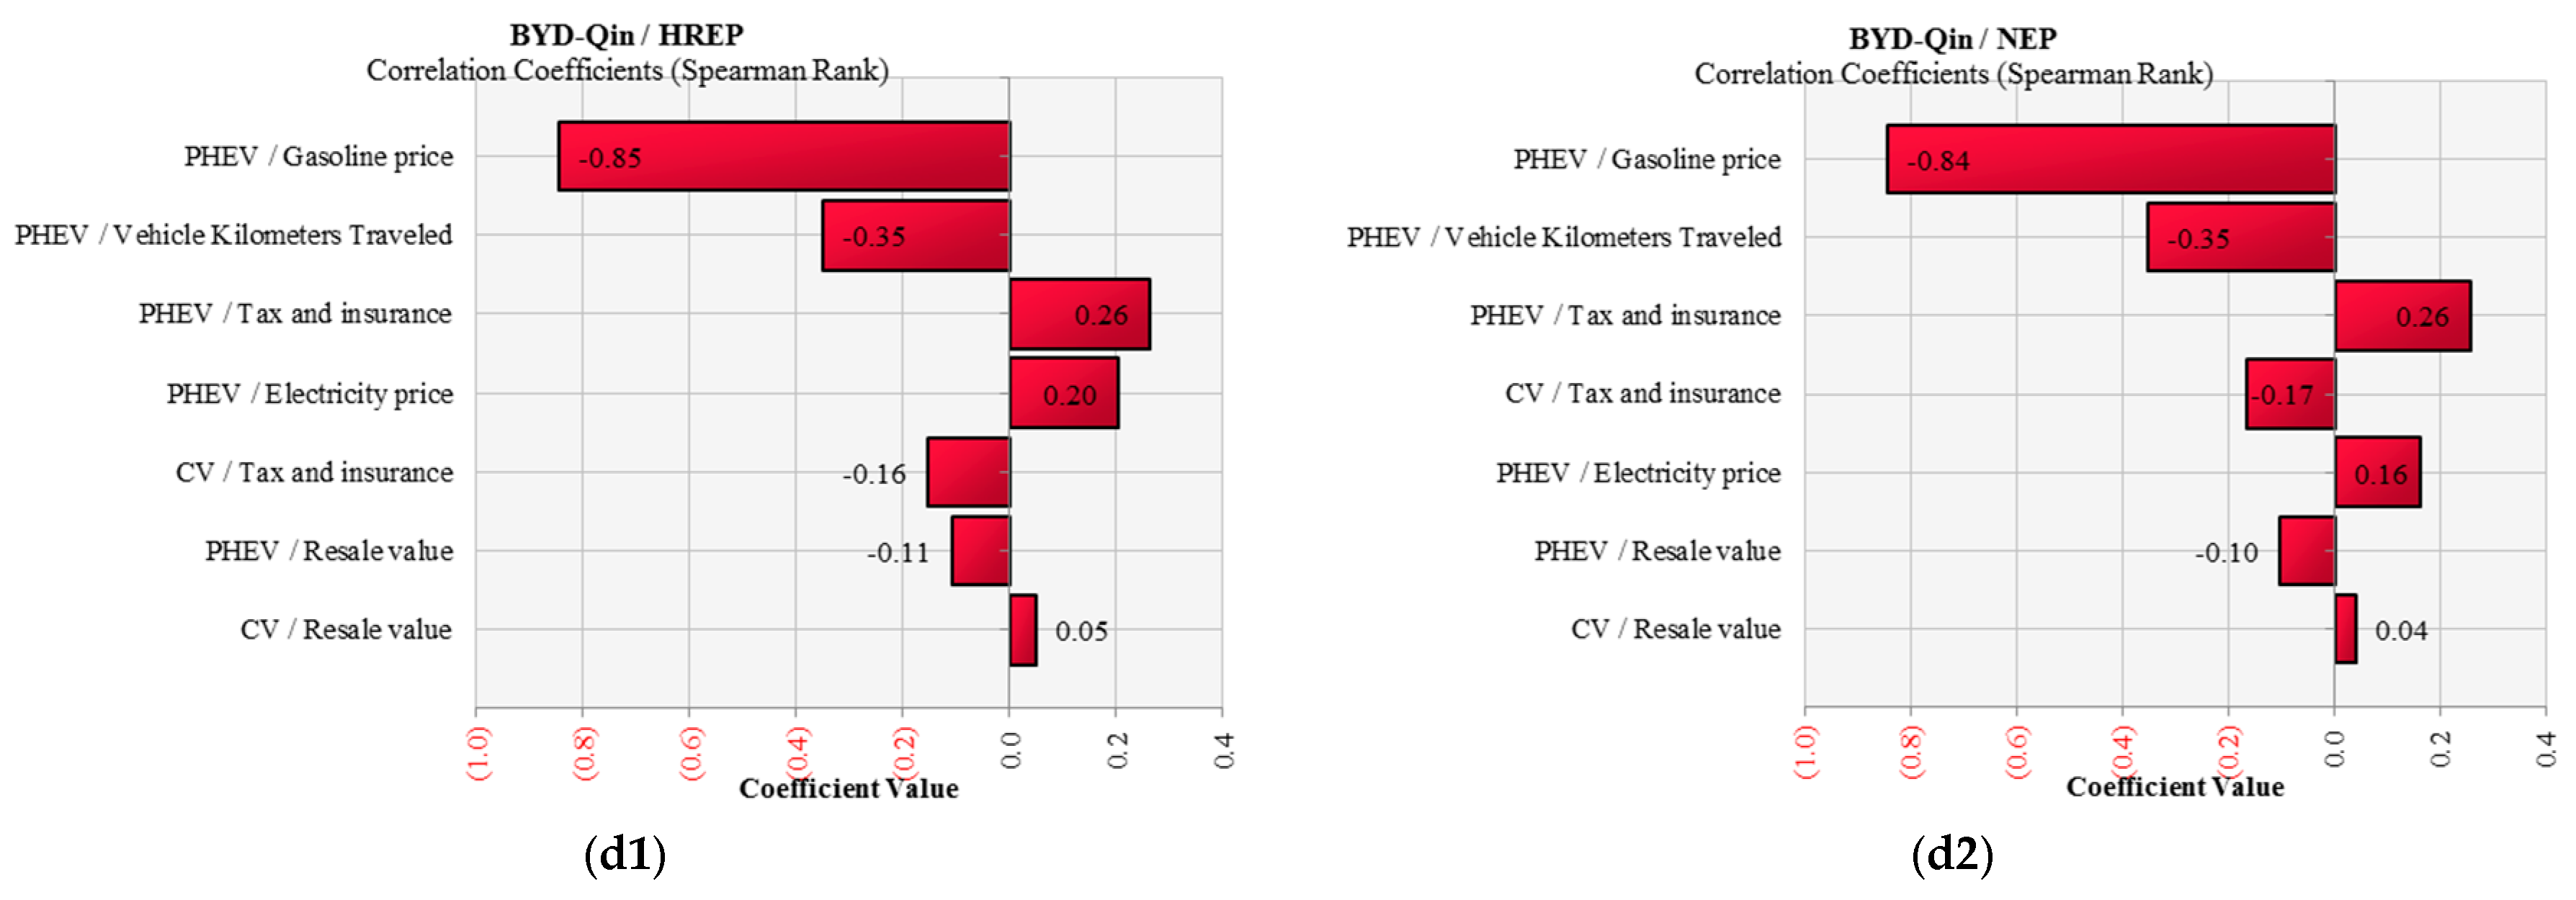
Table 1.
Natural gas resource endowment (in tcm) in China.
| Types of reserves | Conventional | Shale Gas | Coalbed Methane | Tight Gas |
|---|---|---|---|---|
| Resources | 56 [20] | 31.6 [21], 8.6 [22] | - | - |
| Geologically | 35 [20], 68 [23] | 122 [24] | 36.8 [25] | 17.4–25.1 [25] |
| Recoverable | 40 [23] | 22 [26] | 10.9 [25] | 8.8–12.1 [25] |
| Reserves | 30 [26] | - | - | - |
| Remaining recoverable resources | - | - | 9 [27], 9.5 [28] | - |
| Proven reserves | 3.7 [29], 5.94 [30] | - | - | - |
| Recoverable, proven and probable reserves | 5 [29] | - | - | - |
| Technically recoverable reserves | - | 25.1 [31] | - | 12 [31] |
| Technically and economically producible reserves | 3.09 [30] | - | - | - |
| Ultimately recoverable resources | 5.28–12.82 [32] | - | 2.77–31.68 [32] | 1.5–10.31 [32] |
Table 2.
Renewable energy sources.
| Source | Capacity (GW) | Generation (TWh/y) |
|---|---|---|
| Theoretical hydropower | 694 [39] | 6082.9 [39] |
| Technically exploitable hydropower | 542 [39] | 2473.9 [39] |
| Economically exploitable hydropower | 402 [39], | 1750 [39], 1700 [41] |
| Technically exploitable wind energy | 2548 [39] | 7644 [39] |
| Wind power (10 m) | 250 GW (onshore) | 2000 [41] |
| 750 GW (offshore) | ||
| Wind power (50 m) | 2000–2500 | 4000–5000 [41] |
| Solar photovoltaic | - | 1296–6480 [39], 128,000 (theoretical) [41], 8000–69,900 [38] |
| Concentrate solar power (CSP) | 3900–32,700 [38] | 6600–60,700 [38] |
| Biomass | - | 1500–1750 [41] |
| Tidal energy | 20 [39] | >620 GWh [39] |
| Wave | - | >1500 [39] |
| Total | - | >12,666 |
Table 3.
Laws and regulations concerning cleaner energy use in the power sector.
| Policies | Description | References |
|---|---|---|
| Natural Gas Utilization Policy | Natural gas saving and improving energy efficient | [46] |
| Revised Natural Gas Utilization Policy | Highlight the role of natural gas share in primary energy consumption and encourage natural gas used as fuel preferentially in residential, manufacturing, electricity and transportation sectors | [46] |
| Renewable Energy Law | Enlarge the share of renewable energy, safeguard energy security and achieve the goal of sustainable economic development | [47] |
| Amendments to the Renewable Energy Law | Further, strengthen the process through which renewable electricity projects are connected to the grid and dispatched efficiently | [48] |
| Related Regulations on Renewable Energy Generation | Propose the standard development for renewable energy generation industry | [49] |
| Policy guidance document | Re-emphasize the need for priority dispatch for renewable energy | [50] |
| Relative Policies on Deepening the Reform of Power Industry No. 9 Document | Envisage China to further optimize its energy mix and improve the share of renewable energy in electricity generation | [51] |
Table 4.
Finance and taxation policies that promote cleaner energy use in the power sector.
| Sources | Policies | Amount | References |
|---|---|---|---|
| Natural gas | Value-added tax refund; feed-in tariffs for gas-fired power | - | [52] |
| Nuclear power | Feed-in tariff | $0.071/KWh | [17,53] |
| Onshore wind power | Four-category FITs | $0.084–0.0165/KWh | [54] |
| Notice on the Taxation of the Comprehensive Utilization of Resources and Other Value-additional | 50% discount in value-added tax | [55] | |
| Solar PV | Two-category FITs | $0.18/KWh and $0.19/KWh | [56] |
| Announcement of Value-added Policies for PV Generated Electricity | 50% discount in value-added tax | [57] |
Table 5.
Purchasing power parity (local currency/USD) [64].
Table 5.
Purchasing power parity (local currency/USD) [64].
| Country | 2015 | 2020 | 2025 | 2030 |
|---|---|---|---|---|
| US | 1 | 1 | 1 | 1 |
| China | 0.69 | 0.71 | 0.72 | 0.73 |
| India | 0.43 | 0.47 | 0.50 | 0.54 |
| Brazil | 0.98 | 0.82 | 0.76 | 0.70 |
| Turkey | 0.57 | 0.66 | 0.73 | 0.77 |
Table 6.
Basic assumptions according to [52].
Table 6.
Basic assumptions according to [52].
| Categories | Units (2015 USD) | Coal | NGCC | Nuclear | Wind | Biomass | Solar PV |
|---|---|---|---|---|---|---|---|
| Construction Time | years | 4 | 2 | 5 | 2 | 4 | 2 |
| Overnight Capital Cost | $/kW | 704 | 593 | 2751 | 1282 | 1701 | 1484 |
| WACC | % | 8.5% | 8.5% | 8.5% | 8.5% | 8.5% | 8.5% |
| Fixed O&M | $/kW | 10.23 | 16.17 | - | 26.466 | 17.8695 | 8.679 |
| Variable O&M | $/KWh | 0.006105 | 0.00231 | 0.02145 | - | - | - |
| Project Life | years | 20 | 20 | 20 | 20 | 20 | 20 |
| Capacity Factor | % | 54% | 54% | 85% | 26% | 54% | 16% |
| Heat Rate | BTU/KWh | 8740 | 6333 | 10,479 | - | 13,500 | - |
| Fuel Cost | $/MMBTU | 2.60205 | 9.9759 | 1.221 | 0 | 4.10685 | 0 |
| GHG emission tax | $/tonne (2030) | 30 | 30 | 30 | 30 | 30 | 30 |
Table 7.
Cumulative capacity deployments (in MW) for China in High Renewable Energy Penetration scenario [71].
Table 7.
Cumulative capacity deployments (in MW) for China in High Renewable Energy Penetration scenario [71].
| Generation Technologies | 2015 | 2020 | 2025 | 2030 |
|---|---|---|---|---|
| Coal | 884,000 | 1,083,388 | 1,079,878 | 1,052,150 |
| NG | 66,370 | 110,355 | 125,909 | 130,119 |
| Nuclear | 26,080 | 50,500 | 64,000 | 66,000 |
| Wind | 129,340 | 317,088 | 632,176 | 1,103,944 |
| Biomass | 10,300 | 39,306 | 39,304 | 39,304 |
| Solar PV | 43,180 | 157,025 | 500,235 | 1,048,858 |
| Hydropower | 267,099 | 313,973 | 402,363 | 440,752 |
Table 8.
Cumulative capacity deployments (in MW) for China in New Policies Scenario [72].
Table 8.
Cumulative capacity deployments (in MW) for China in New Policies Scenario [72].
| Generation Technologies | 2015 | 2020 | 2025 | 2030 |
|---|---|---|---|---|
| Coal | 884,000 | 979,000 | 1,044,000 | 1,115,000 |
| NG | 66,370 | 110,000 | 143,000 | 170,000 |
| Nuclear | 26,080 | 55,000 | 86,000 | 110,000 |
| Wind | 129,340 | 200,000 | 267,000 | 321,000 |
| Biomass | 10,300 | 30,000 | 41,000 | 48,000 |
| Solar PV | 43,180 | 100,000 | 151,000 | 194,000 |
| Hydropower | 267,099 | 365,000 | 410,000 | 454,000 |
Table 9.
Global and China’s learning rates and cost components [64].
Table 9.
Global and China’s learning rates and cost components [64].
| Technology | Global Learning Rate (%) | Local Learning Rate (%) | Global Cost Component (%) | Local Cost Component (%) |
|---|---|---|---|---|
| Coal | 5 | 5 | 10 | 90 |
| CCGT | 5 | 5 | 50 | 50 |
| Nuclear | 1 | 1 | 5 | 95 |
| Wind | 17 | 17 | 10 | 90 |
| Biomass | 5 | 5 | 10 | 90 |
| Solar PV | 20 | 20 | 10 | 90 |
Table 10.
Global cumulative capacity deployments (in GW) in IEA 450 scenario [72].
Table 10.
Global cumulative capacity deployments (in GW) in IEA 450 scenario [72].
| Generation Technologies | 2015 | 2020 | 2025 | 2030 |
|---|---|---|---|---|
| Coal | 1930 | 2094 | 2049 | 1687 |
| NG | 1475 | 1789 | 1810 | 2010 |
| Nuclear | 348 | 449 | 465 | 642 |
| Wind | 107 | 141 | 148 | 233 |
| Biomass | 427 | 710 | 769 | 1572 |
| Solar PV | 230 | 517 | 566 | 1278 |
Table 11.
Vehicle models and assumptions.
| Vehicle Models | Type | MSRP ($) | Government Subsidy ($) | Energy Consumption Rate (/100 km) | Engine Displacement (L) | Curb Weight (kg) | |
|---|---|---|---|---|---|---|---|
| BAIC (Beijing) | E150 EV | BEV | 41,217 | 23,100 | 12.5 KWh | 0 | 1370 |
| E150 | CV | 14,322 | 0 | 7.1 L | 1.3 | 1090 | |
| Roewe e550 | PHEV | 42,867 | 13,695 | 12 KWh & 2.3 L | 1.5 | 1699 | |
| Roewe 550 | CV | 31,317 | 0 | 6.8 L | 1.8 | 1532 | |
| BYD | E6 400 | BEV | 51,117 | 18,810 | 19.5 KWh | 0 | 2380 |
| M6 | CV | 24,882 | 0 | 9.40 L | 2.4 | 1760 | |
| BYD-Qin | PHEV | 31,317 | 11,550 | 6.2 L & 2.5–3.0 KWh | 1.5 | 1720 | |
| BYD-G6 | CV | 18,612 | 0 | 7.9 L | 1.5 | 1450 | |
Note: Source: http://chinaautoweb.com/ [77] with an exchange rate at 1 RMB = 0.165 USD [78].
Table 12.
Life cycle upstream and direct emission factors for gasoline in China [68].
Table 12.
Life cycle upstream and direct emission factors for gasoline in China [68].
| Process | Upstream CO2 | Upstream CH4 | Upstream N2O | Direct CO2 | Direct CH4 | Direct N2O | Total |
|---|---|---|---|---|---|---|---|
| g/MJ | g/MJ | mg/MJ | g/MJ | g/MJ | mg/MJ | g CO2 e/L | |
| Gasoline | 20.2 | 0.05 | 0.49 | 67.9 | 0.08 | 0.002 | 3120.26 |
| Vehicle Types | Taxi | Heavy Duty |
|---|---|---|
| VKT | 350 km/day | 200 km/day |
| Life time (years) | 10 | 10 |
| Pa − Pc (USD) | 1650 | 11,500 |
| Fuel price | ||
| CNG | $0.7425/m3 | - |
| LNG | - | $0.7425/m3 |
| Gasoline | $0.924/L | - |
| Diesel | - | $1.254/L |
| Fuel consumption | ||
| CNG | 8.2 m3/100 km | - |
| LNG | - | 4.6 m3/100 km |
| Gasoline | 8 L/100 km | - |
| Diesel | - | 39 L/100 km |
| WTW GHG emission (g CO2, e/km) | ||
| CNG | 205 | - |
| LNG | - | 191–198 |
| Gasoline | 236 | - |
| Diesel | - | 212 |
Table 14.
Lifec ycle unit GHG emissions from the power sector.
| Generation Technologies | GHG Emissions (g CO2 e/KWh) |
|---|---|
| Coal | 1020 |
| Natural gas | 520 |
| Nuclear | 12 |
| Onshore Wind | 207 |
| Biomass | 114 |
| PV | 60 |
| Hydro | 19 |
| Mix (2030) High renewable energy penetration scenario | 485 |
| New Policies Scenario | 592 |
Table 15.
Comparison of results for NG fuel vehicles and CVs.
| Vehicles | Costs Add(US $) | GHG Emissions Reduction(Tons) | Ec$/Ton |
|---|---|---|---|
| Taxi | −8307 | 40 | −210 |
| Heavy duty | −52,833 | 10 | −5170 |
© 2017 by the authors. Licensee MDPI, Basel, Switzerland. This article is an open access article distributed under the terms and conditions of the Creative Commons Attribution (CC BY) license (http://creativecommons.org/licenses/by/4.0/).
Share and Cite
MDPI and ACS Style
Han, S.; Zhang, B.; Sun, X.; Han, S.; Höök, M. China’s Energy Transition in the Power and Transport Sectors from a Substitution Perspective. Energies 2017, 10, 600. https://doi.org/10.3390/en10050600
AMA Style
Han S, Zhang B, Sun X, Han S, Höök M. China’s Energy Transition in the Power and Transport Sectors from a Substitution Perspective. Energies. 2017; 10(5):600. https://doi.org/10.3390/en10050600
Chicago/Turabian StyleHan, Shangfeng, Baosheng Zhang, Xiaoyang Sun, Song Han, and Mikael Höök. 2017. "China’s Energy Transition in the Power and Transport Sectors from a Substitution Perspective" Energies 10, no. 5: 600. https://doi.org/10.3390/en10050600
Note that from the first issue of 2016, this journal uses article numbers instead of page numbers. See further details here.