
Energy Return on Investment of Canadian Oil Sands Extraction from 2009 to 2015


1
School of Business Administration, China University of Petroleum (Beijing), Beijing 102249, China
2
Haskayne School of Business, University of Calgary, Calgary, AB T2N1N4, Canada
*
Author to whom correspondence should be addressed.
Energies 2017, 10(5), 614; https://doi.org/10.3390/en10050614
Submission received: 24 January 2017
/
Revised: 24 April 2017
/
Accepted: 24 April 2017
/
Published: 2 May 2017
(This article belongs to the Section L: Energy Sources)
Abstract
:Oil sands, as unconventional oil, are so essential to both Canada and the world that special attention should be paid to their extraction status, especially their energy efficiency. One of the most commonly used methods to evaluate energy efficiency is the Energy Return on Investment (EROI) analysis. This paper focuses on EROI analysis for both in situ oil sands and mining oil sands over the period of 2009 to 2015. This time period represents an extension to periods previously considered by other analyses. An extended Input-Output model is used to quantify indirect energy input, which has been ignored by previous analyses of oil sands extraction. Results of this paper show that EROI of both mining oil sands (range of value: 3.9–8) and in situ oil sands (range of value: 3.2–5.4) display an upward trend over the past 7 years; EROI of mining oil sands is generally higher, but is more fluctuating than the EROI of in situ oil sands. Compared with EROI of other hydrocarbons, the EROI of oil sands is still quite low, despite the fact that it is increasing gradually.
1. Introduction
Canada, the world’s fourth largest oil producer, has the richest resource of oil sands [1,2]. Proven reserves of oil sands at the end of 2015 was 165.4 billion barrels [3], accounting for 96% of Canada’s total proven oil reserves and 10% of total world proven oil reserves [1]. In 2015, production of oil sands in Canada reached 2.4 million barrels/day, 85% more than production of its conventional oil at 1.3 million barrels/day [3].
More than 70% of the oil produced by Canada is exported to other countries, mainly to the USA [1], and 24.2% of Canadian oil sands (COS) production is controlled by foreign-based companies [4], therefore, the COS sector is important not only to Canada, but also to the global oil economy.
During the past decade, many changes have occurred in the COS sector: oil sands extraction technology has improved rapidly [5], the oil price has fluctuated, and there have been heated debates regarding the environmental, economic, and social trade-offs of the COS industry. Thus, it is important to investigate the most current situation in the COS sector.
Energy Return on Investment (EROI), which refers to the energy returned to the economy and society compared to the energy required to obtain that energy [6], can evaluate the efficiency of energy extraction [7] and is being used more and more frequently by energy researchers [8,9,10,11].
So far, the most recent EROI research regarding COS [12] has focused only on mining oil sands, while in situ oil sands, another type of oil sands accounting for 80% of the total COS reserves, has been ignored. Brandt et al. [13] considered both mining oil sands and in situ oil sands in their calculation for a group of energy return ratios, however, the energy consumption data of in situ oil sands used in their paper was mostly interpolated; furthermore, they did not consider indirect energy input. As well, the time period considered by Poisson and Hall was 1994–2008, while that considered by Brandt et al. was 1970–2010; both of which are now quite outdated, especially considering technological advances. Since the results of EROI analyses are significant to the investment and development planners, both within the Canadian government and the private sector, updated EROI numbers are necessary. Therefore, this paper focuses on EROI analysis of both mining and in situ oil sands extraction in Canada for the period of January 2009 to December 2015 (with monthly data).
2. Methods
2.1. Energy Return on Investment
EROI is a useful tool to carry out net energy analysis and to examine the energy efficiency of extracting an energy resource [14]. The basic equation for calculating EROI is as follows [15,16]:
However, results of the calculation, even for the same kind of energy resource, can be very different due to the different boundaries of analysis used [17]. To deal with this problem, Mulder and Hagens [17] suggested a consistent theoretical framework for EROI analysis, which was then further researched by Murphy et al. [16]. As a result, a more explicit two-dimensional framework for EROI analysis was proposed and the term standard EROI (EROIstnd) was created. The EROI calculation of the COS in this paper is based on the EROIstnd. EROIstnd is defined as the ratio between energy output in the boundary of the well mouth (or at the mine) and direct plus indirect energy inputs and can be represented in the following equation:
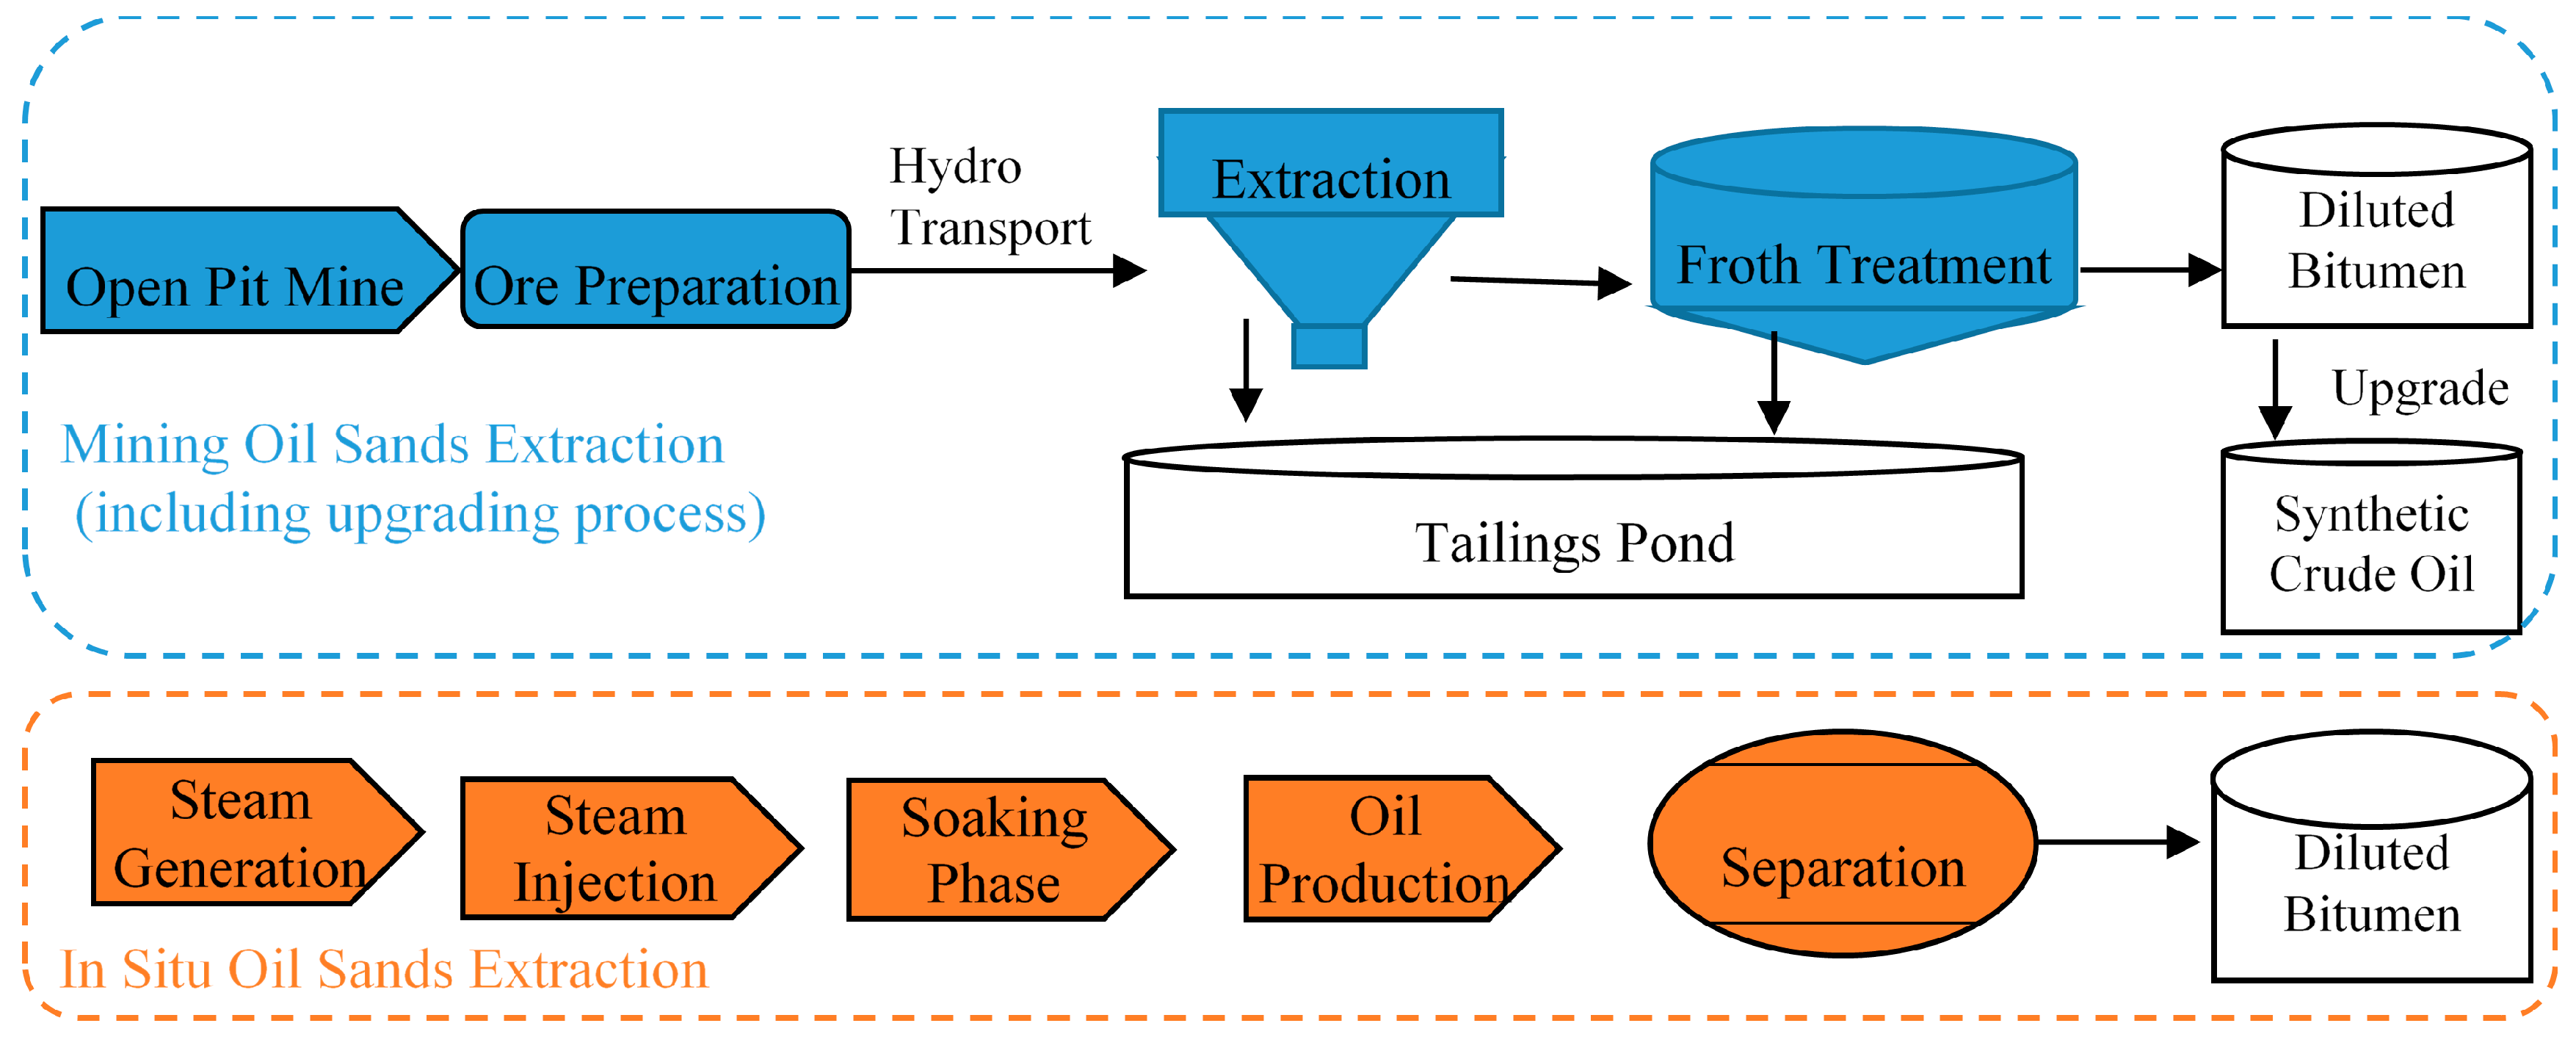
where Eo represents the sum of energy outputs expressed in the same units, while Ed and Ei represent the total direct energy input and indirect energy input, respectively. In order to make the results of our paper more comparable with the results of many other EROI research, we choose the boundary of EROIstnd as our research boundary. Figure 1 shows the boundary of EROI analysis in this paper and illustrates the different procedures of mining oil sands extraction and in situ oil sands extraction.
Getting indirect energy input (Ei) is challenging since this data is usually not available directly. Different methods have been tried to estimate Ei [7,12,18]: Hu et al. and Kong et al. used “industrial energy intensity” published by the government to transfer monetary input to energy input, but the use of “industrial energy intensity” is crude and approximate, and the monetary input considered is not complete. Poisson and Hall used government issued energy intensity to convert value of products to energy input, however, the resulting energy input is the sum of direct energy input and indirect energy input and the indirect energy input cannot be separated from the total energy input transferred from the monetary value of products. In addition, by calculating both direct and indirect energy input using the energy intensity, Poisson and Hall’s calculation relies heavily on monetary value. Therefore, this paper uses the Environmental Input-Output (EIO) model, the method we consider most reasonable so far, to analyze indirect energy input of oil sands extraction in Canada.
2.2. Environmental Input-Output (EIO) Model
To achieve a more accurate EROI value of oil sands extraction, we choose the EIO model in order to calculate the indirect energy input of oil sands extraction. The EIO model is extended from the standard Leontief Input-Output (IO) model in order to capture energy consumption flows in the economy [19,20] and is already used by some scholars to compute energy input in EROI analysis [21,22]. A detailed framework description of embodied energy analysis using the EIO can be found in [23,24,25]. A simplified description of the essential parts is as below.
The total output of one economy is expressed as:
X = AX + y
X represents total economic output, which can be expressed as a vector; y represents the final demand vector; and A represents the economy’s direct demand matrix. Matrix A describes the relationship between all sectors of the economy.
Assuming that (I − A) is non-singular, then the total economic output vector X can be expressed by Equation (4):
I represents the identity matrix, is the Leontief inverse. Equation (4) illustrates the gross output needed to satisfy both the final consumption “y” and the corresponding intermediate consumption “” from each economic sector.
The EIO method combines the economic IO model with sectoral embodied energy input by multiplying the total economic output by each sector’s energy intensity (energy consumption per unit economic output from each sector).
If E(1 × n) denotes the direct energy inputs for each sector from the perspective of sectoral production, Ω(1 × n) denotes the factor vector of the direct energy intensity for each sector, then
Therefore, the total energy consumption per unit of economic output of each sector within the country can be represented as:
If we subtract the direct energy input from the total energy consumption per unit of economic output, we can then get the indirect energy consumption per unit of economic output of each sector within the country. So the indirect energy consumption per unit of economic output of each sector within the country can be presented as:
3. Data Collection and Handling
The Alberta Energy Regulator (AER), previously the Energy Resources Conservation Board, provided the majority of the energy output and energy input data. Data was also collected and used from Statistics Canada, the National Energy Board (NEB) of Canada, the Canadian Association of Petroleum Producers (CAPP) and other related peer-reviewed literature.
The number of oil sands projects covered in this paper varies yearly, due to a limitation of complete source data regarding both energy output and energy input for all oil sands projects. As time goes by, data from more projects become available, thus, more projects are considered.
For the mining oil sands, there are a total of 10 projects for the years 2009 and 2010, 11 projects for each of the years 2011–2013, 12 projects for the year 2014, and 13 projects for the year 2015 included by Statistical (ST) reports of AER. However, due to data completeness, the energy output and energy input data of mining oil sands used in this paper only covers 8 projects for the years 2009; 9 projects for each of the year 2010–2011; 10 projects for the year 2012, and 11 projects for each of the years of 2013–2015. The total energy output of mining projects selected in this paper is almost the same as the total energy output of mining projects included by AER, which is larger than the energy output of the total mining oil sands sector published by CAPP (The reason why the total energy output of mining oil sands projects included by AER is sometimes even larger than the total energy output of the mining oil sands sector published by CAPP might be that some output of experimental crude production of mining oil sands extraction is not included by CAPP data). The sample mining oil sands projects chosen in this paper can objectively reflect the general situation of Canadian mining oil sands extraction.
The energy output and energy input data of in situ oil sands used in this paper covers 15 projects for the year 2009, 18 projects for the years 2010 and 2011, 20 projects for the year 2012, 22 projects for the year 2013, 25 projects for the year 2014, and 20 projects for the year 2015. All the in situ projects considered in this paper are thermal in situ projects, including steam assisted gravity drainage (SAGD) in situ projects and cyclic steam stimulation (CSS) in situ projects. The difference in number of projects considered for different years may have an effect on our results, while we think that the increasing number of projects included as time goes by actually reflects the objectively real-life situation of the COS industry.
There are about 200 in situ projects included in ST reports of the AER, therefore, the number of selected projects only accounts for 10–12% of the total number of projects included by the AER. However, the production of projects selected in this paper accounts for 59–77% of total production of in situ projects included by the AER, which is an average of 77% of the total of in situ oil sands production published by CAPP (see detail information in Table S1 in the Supplementary Materials). Therefore, the selected in situ projects in this paper can essentially represent the general situation of in situ oil sands extraction, though the incomplete samples may have some impact on the result of in situ oil sands EROI.
The included projects for each year are listed in Table S2 in the Supplementary Materials.
3.1. Energy Output of Oil Sands Extraction
All the energy output data was collected from ST reports provided by the AER. Energy output for mining oil sands comes from ST 39 (2009–2015) [26], including: Synthetic crude oil (SCO) delivered, bitumen delivered, intermediate hydrocarbons delivered, paraffinic solvent delivered, diluent naphtha delivered, and electricity exported; while energy output for in situ oil sands comes from ST 53 (2009–2015) [27], including bitumen produced and electricity exported.
Energy output data is given in different units, including m3, tons, and MWh, which are then transferred, based on thermal values of different kinds of energy output, into the unit of tera joule (TJ) using the transfer indicator given by the NEB (2015) of Canada [28].
3.2. Energy Input of Oil Sands Extraction
Direct energy input data for mining oil sands comes from ST 39, including: coke-fuel and plant use, process gas-further processing, process gas-fuel and plant use, paraffinic solvent-fuel and plant use, diluent naphtha-fuel and plant use, SCO-fuel and plant use, natural gas purchased, and electricity purchased. The majority of the direct energy input data for in situ oil sands comes from In situ Performance Presentation (ISPP) reports of different in situ oil sands projects in different years [29]. Since the ISPP reports of some in situ oil sands projects only give energy consumption data in the form of line charts or column charts, we used “Engauge Digitizer 4.1” software (Mark Mitchell, Torrance, CA, USA), where required, to convert data into the form of direct numbers. Direct energy input data of in situ oil sands projects from ISPP include: natural gas consumption (including natural gas purchased and produced) and electricity consumption. Another kind of direct energy input of in situ oil sands projects, diesel consumption of in situ drilling activities, is calculated by multiplying total depth drilled with depth-specific drilling intensity. Data of total depth drilled comes from ST 98 [30], while that of depth-specific drilling intensity comes from [31].
Indirect energy input intensity is calculated using the EIO model described in Section 2.2. Input-Output Tables of the Canadian economy were obtained from the Canadian Socio-Economic Information Management System (CANSIM) database of Statistics Canada (2009–2013) [32]. Since even the most detailed version (Level L) of the Input-Output table of Canada only offers data from the “Oil and Gas Extraction” sector, instead of data from the “oil sands extraction” sector, we were only able to obtain indirect energy intensity for the oil and gas extraction sector, rather than for the oil sands extraction sector through the EIO model. Therefore, in this paper, we used the indirect energy intensity of the oil and gas extraction industry to replace the indirect energy input intensity of the oil sands extraction sector. In addition, since the most recently available Input-Output Table is from 2011, we calculated indirect energy input intensity for the years before 2011 (including 2011) and used the same indirect energy input intensity of 2011 as that of the years following 2011. Production energy consumption (direct energy use) data for different sectors of the Canadian economy was also obtained from CANSIM, Statistics Canada (2016). After getting the indirect energy input intensity, we multiplied it with the monthly economic output of the oil sands extraction sector to get the monthly indirect energy input data. The economic output of the oil sands extraction sector is calculated by multiplying the unit price and the production of the two main products of oil sands extraction sector: bitumen and SCO. The price of bitumen and SCO is collected from Alberta Ministry of Energy [33].
A summary of all direct energy input and energy output items considered in this paper are shown in Table S3 in the Supplementary Materials.
4. Results
For mining oil sands extraction projects, the most significant energy outputs are bitumen and SCO, while the most significant energy inputs are process gas, natural gas purchased, and coke. Indirect energy input accounts for an average of 12% of the total energy input (see Figure 2). Both energy output and energy input data show strong fluctuations during the period of January 2009 to December 2015, while energy output presents a general upward trend.
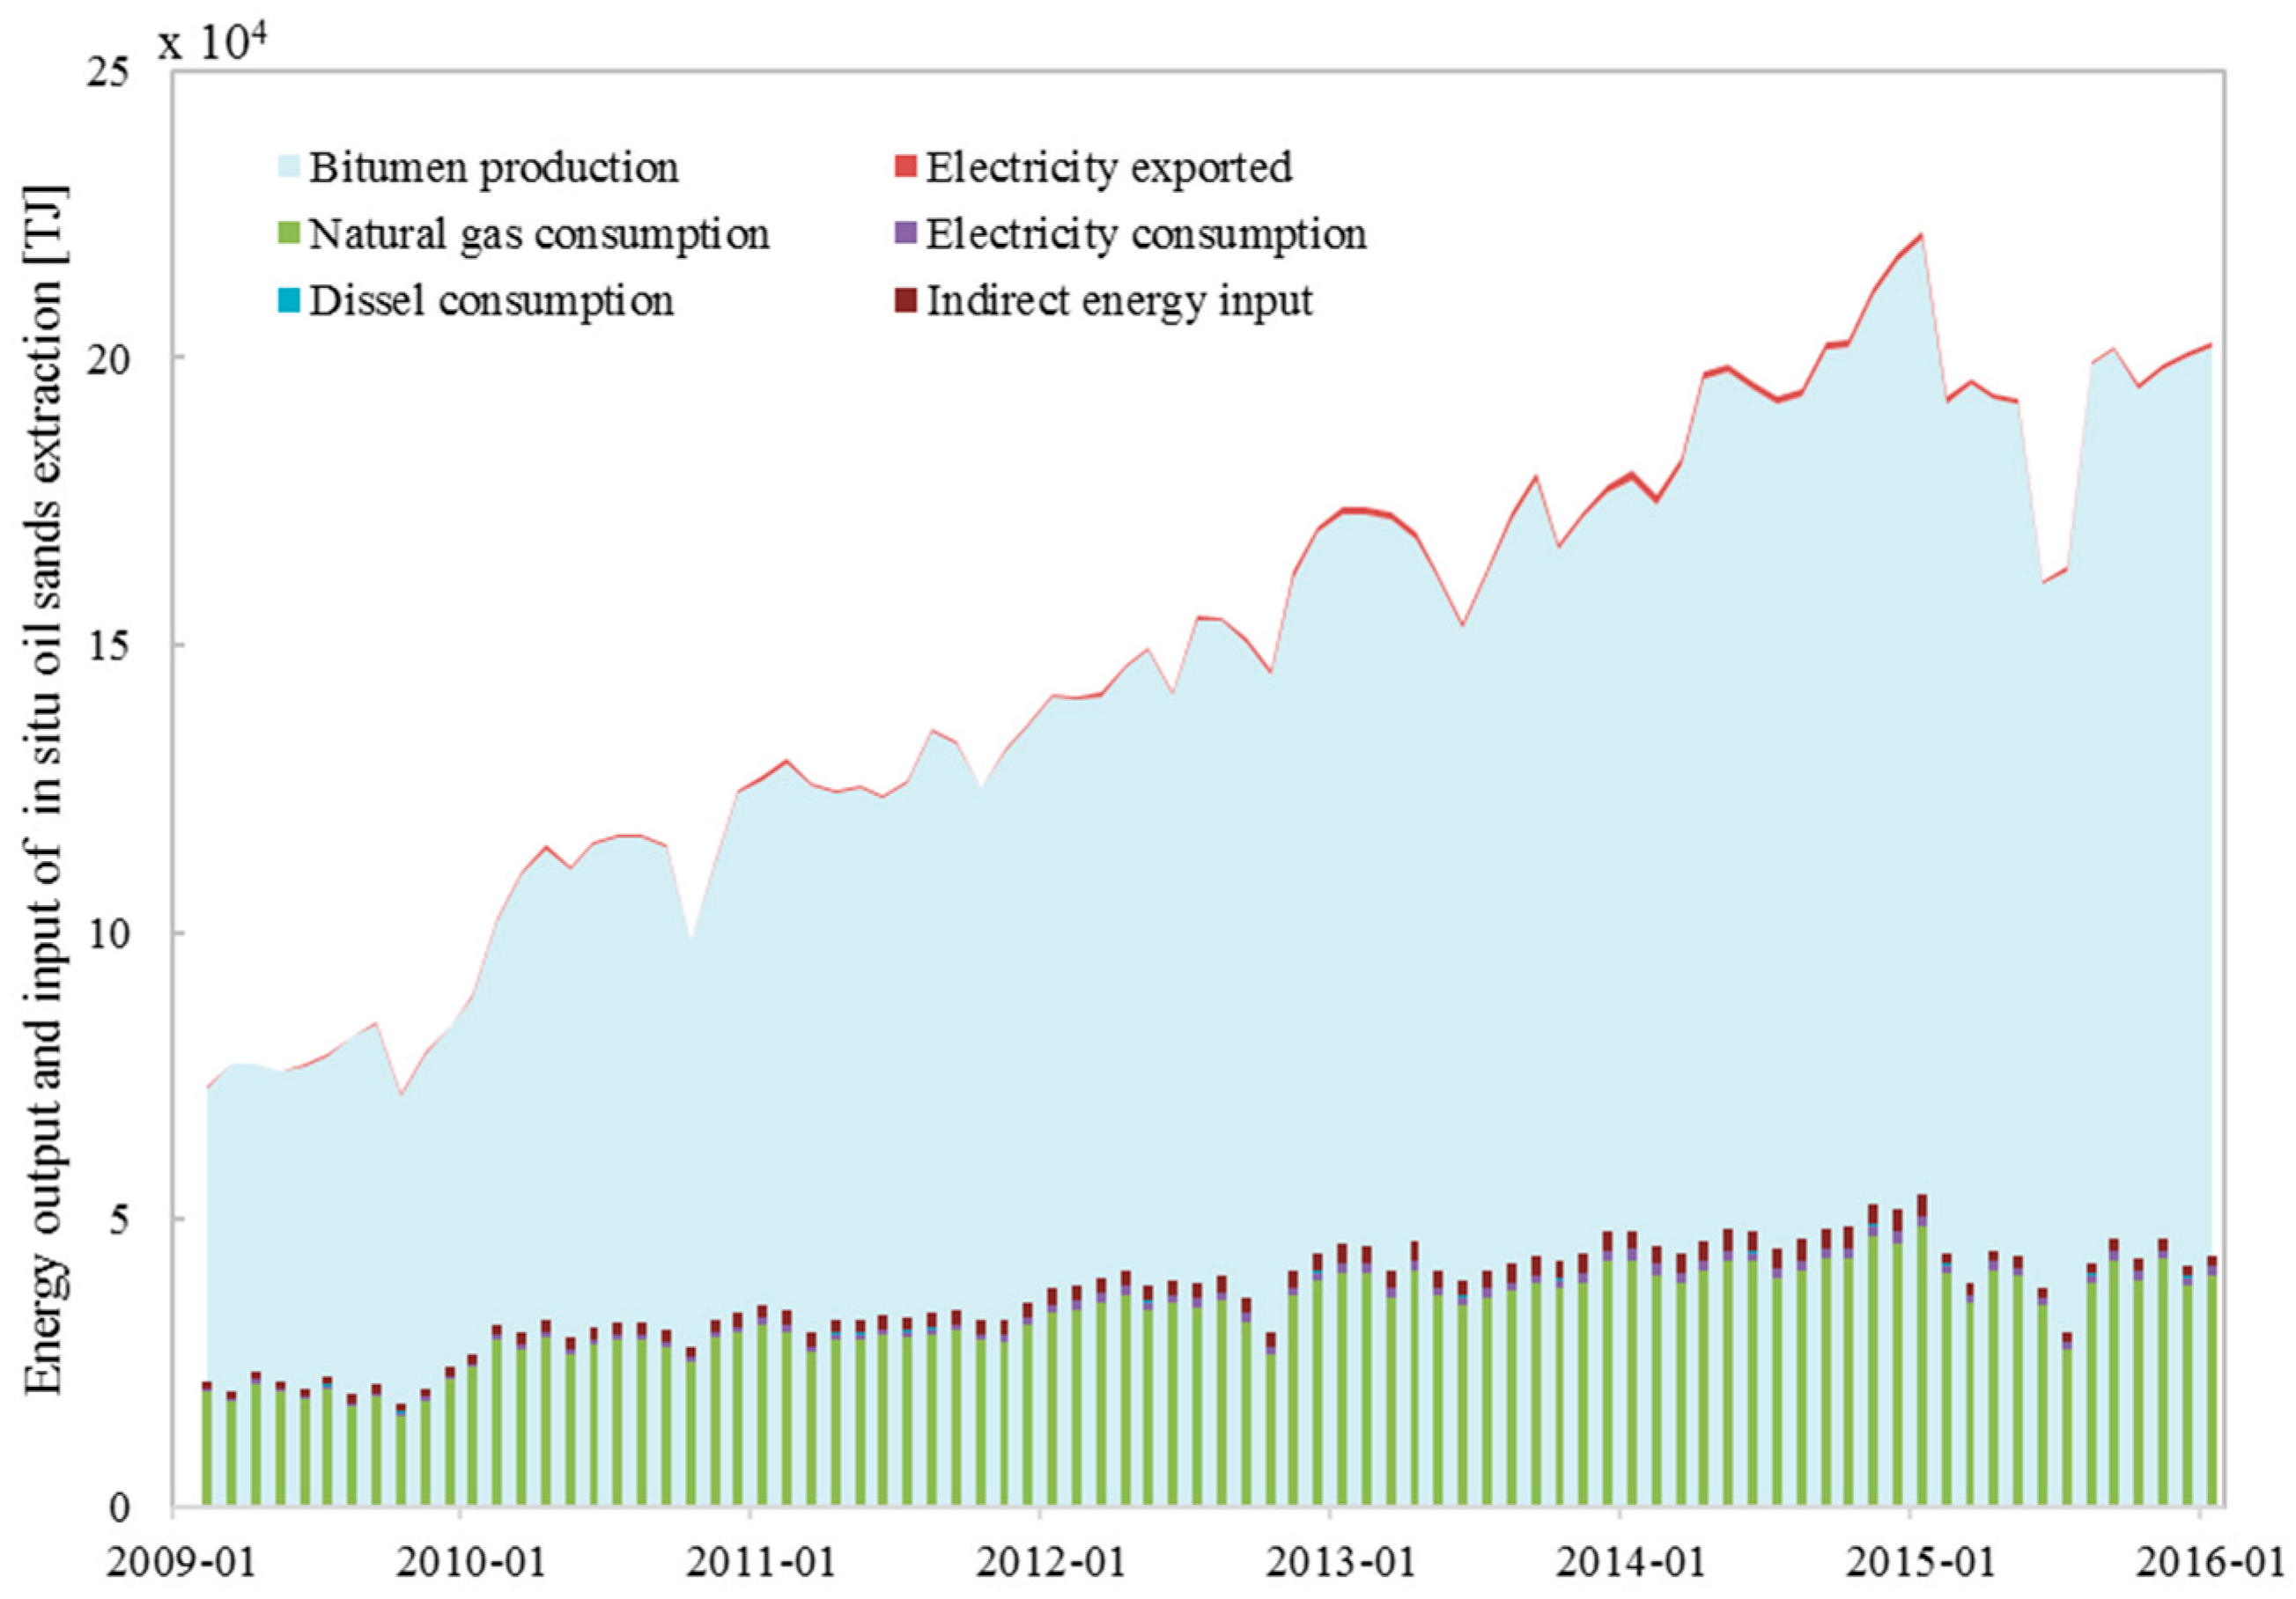
For in situ oil sands extraction projects, bitumen production makes up the majority of energy output. Electricity exported, another kind of energy output, is an extremely small amount. Natural gas consumption dominates the energy input of in situ oil sands extraction. Indirect energy input represents 6.8% of total energy input (see Figure 3). An increase of both energy output and energy input of in situ oil sands extraction was observed during this period.
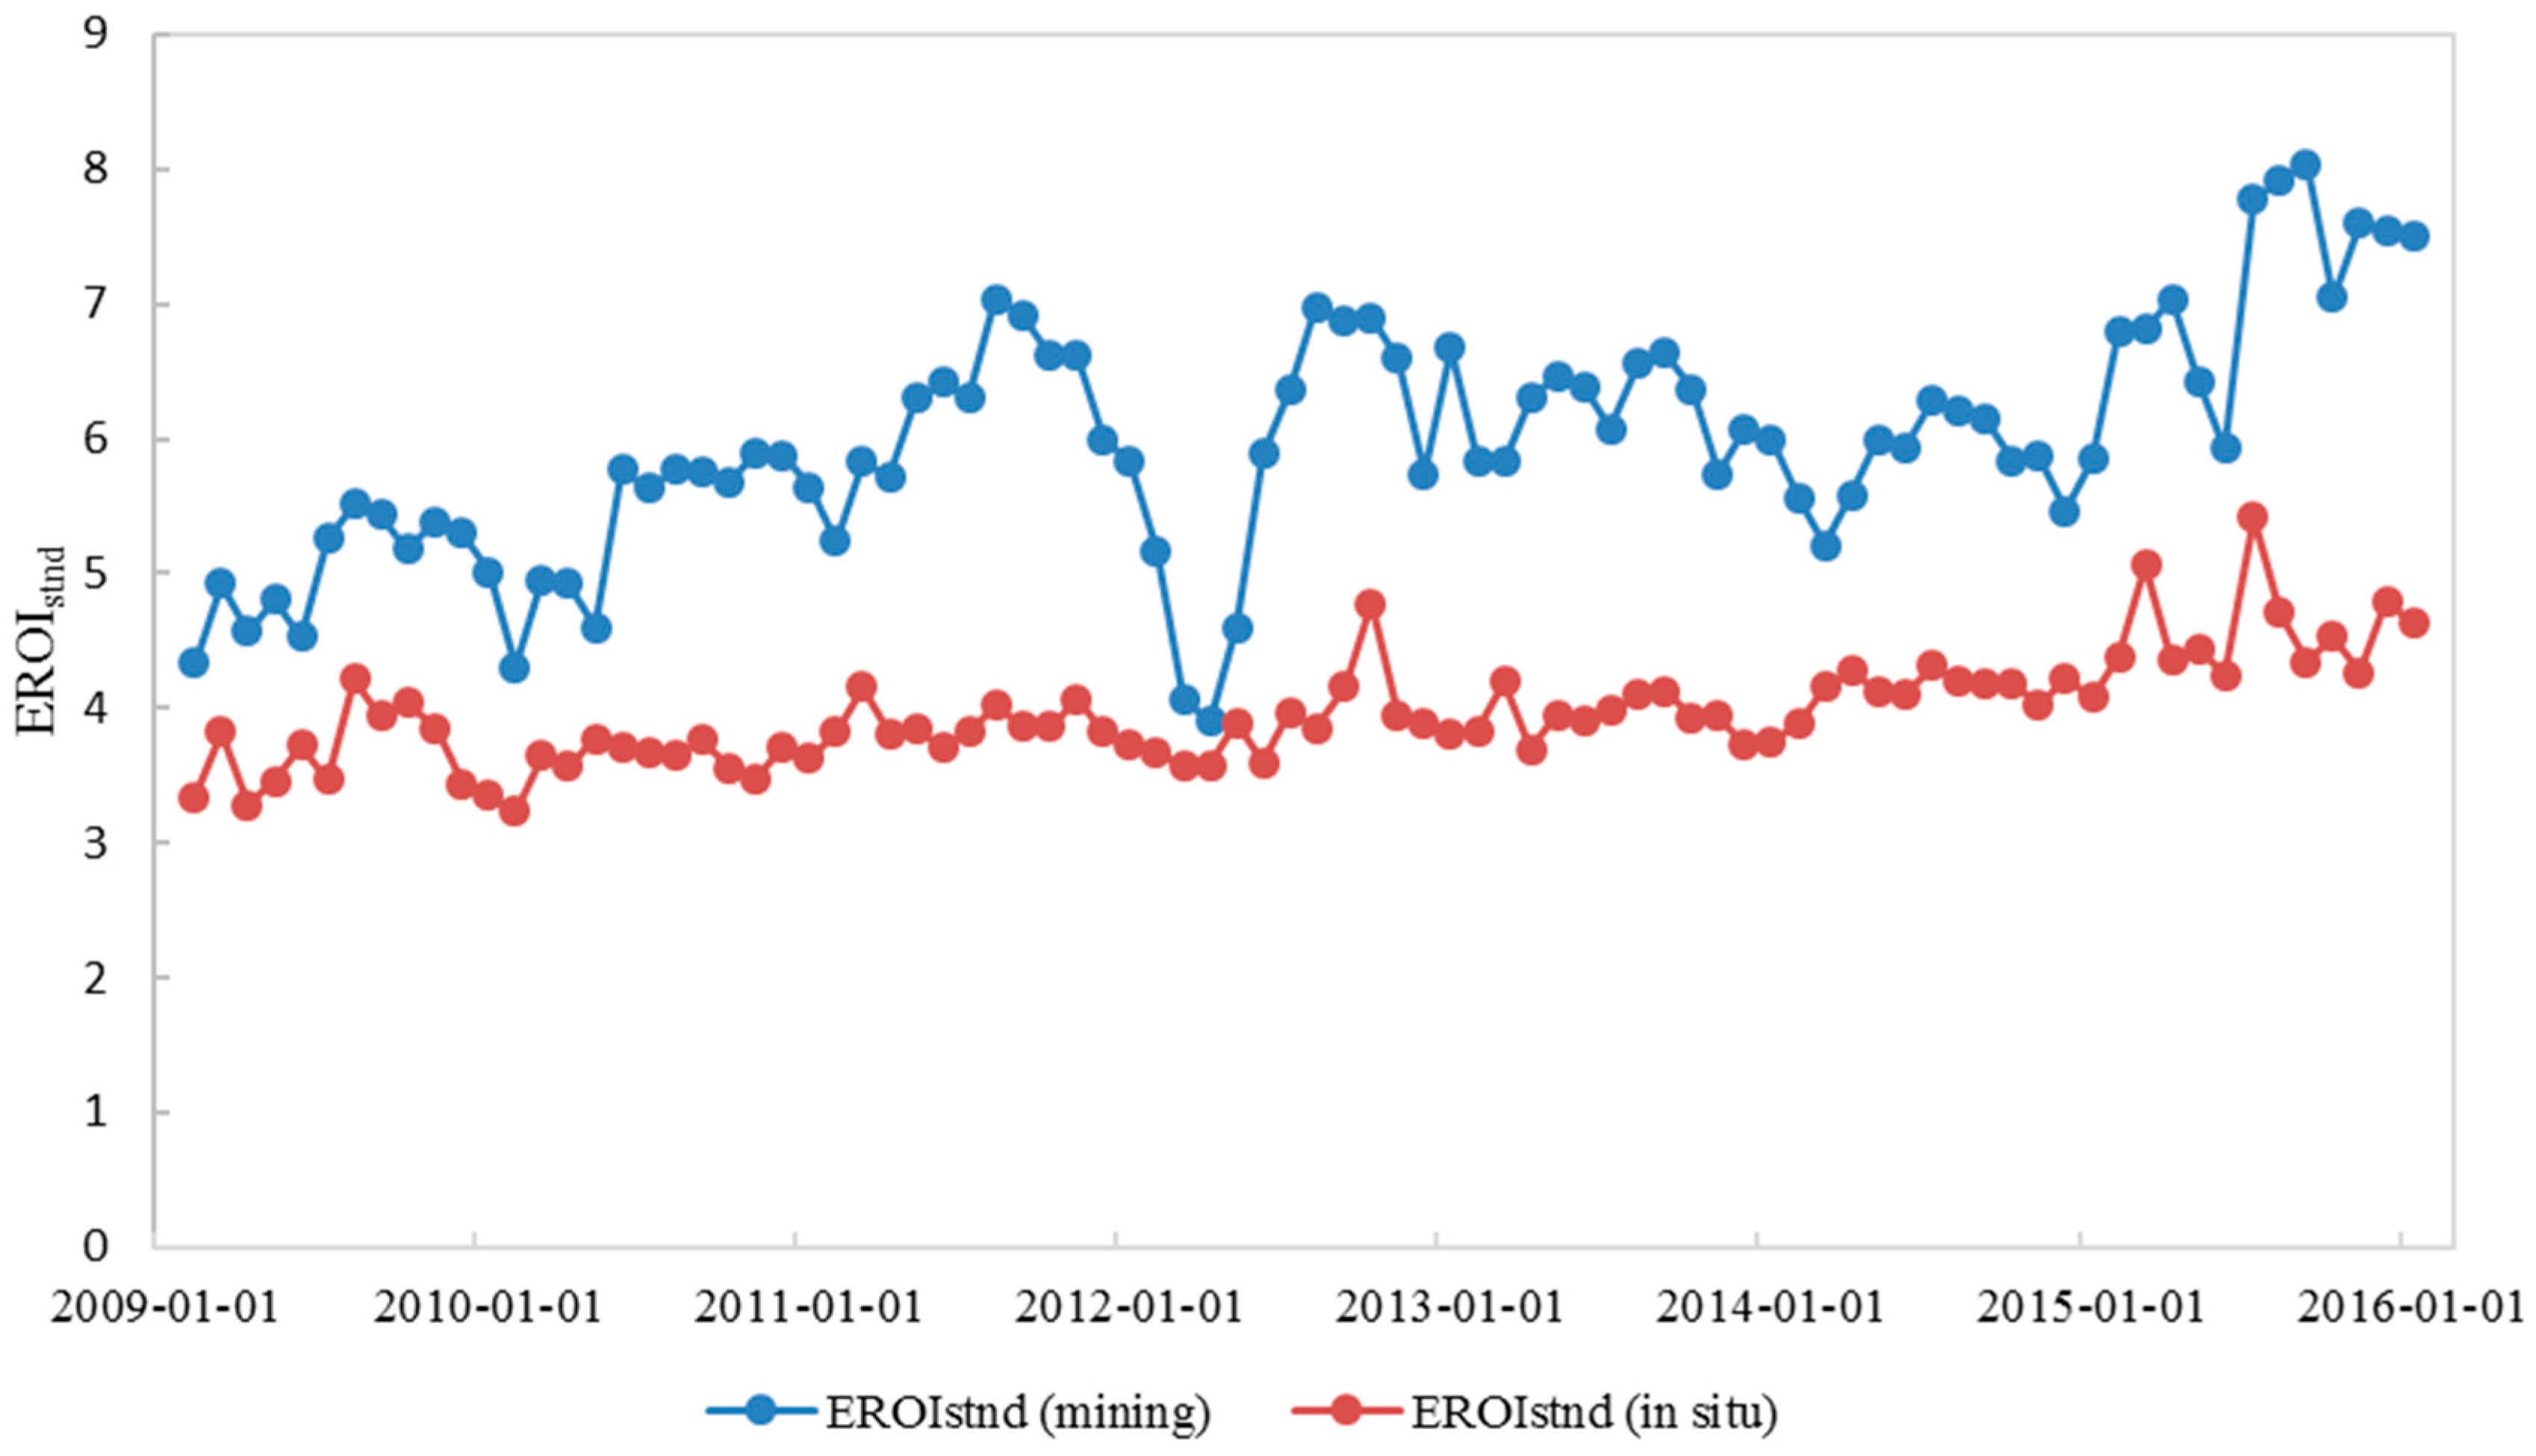
According to Figure 4, EROI of mining COS is generally higher (range of value: 3.9–8.0) than that of in situ COS (range of value: 3.2–5.4). This is due to the fact that mining oil sands is easier to extract, as they are located in shallower areas underground (usually less than about 65 m) compared to in situ oil sands which are located much deeper underground [2]. We also found that the EROI of mining oil sands projects is more fluctuating than the EROI of in situ oil sands. According to our analysis, the significant fluctuation of mining oil sands EROI is mainly caused by the fluctuation of energy output (especially bitumen delivered and SCO delivered). The fluctuation of energy output might be caused by the different depths and different resource quality of different parts of mining oil sands ore. Another possible cause might be the frequent maintenance of the oil sands mining facility since an oil sands mining facility is generally much larger and more complex than an in-situ processing plant [34].
Generally, the EROIs of both mining COS and in situ COS display an upward trend over the past seven years, and the trend is especially obvious for mining COS during the period 2014–2015.
The increase in mining oil sands EROI from 2014 to 2015 is most likely caused by the low global oil price, which started in the second half of 2014. The low oil prices may have added more pressure on oil sands companies to move to better-quality reservoir areas or to improve their efficiency through technology in order to survive.
We can see there is a big drop in mining oil sands EROI during the first season of the year 2012. Upon further investigation, we found that the drop was mainly due to the planned maintenance of mine equipment and the operational problem of a coker unit of the ABOS0077189 Suncor Energy OSG project [35], a large mining oil sands project that accounts for more than 30% of the total SCO deliveries and about 10% of the total bitumen deliveries of all the mining oil sands projects included in this paper. Another reason could be the temporary decline in bitumen ore grade quality [35].
5. Discussion
5.1. Comparison with EROI from Previous Research
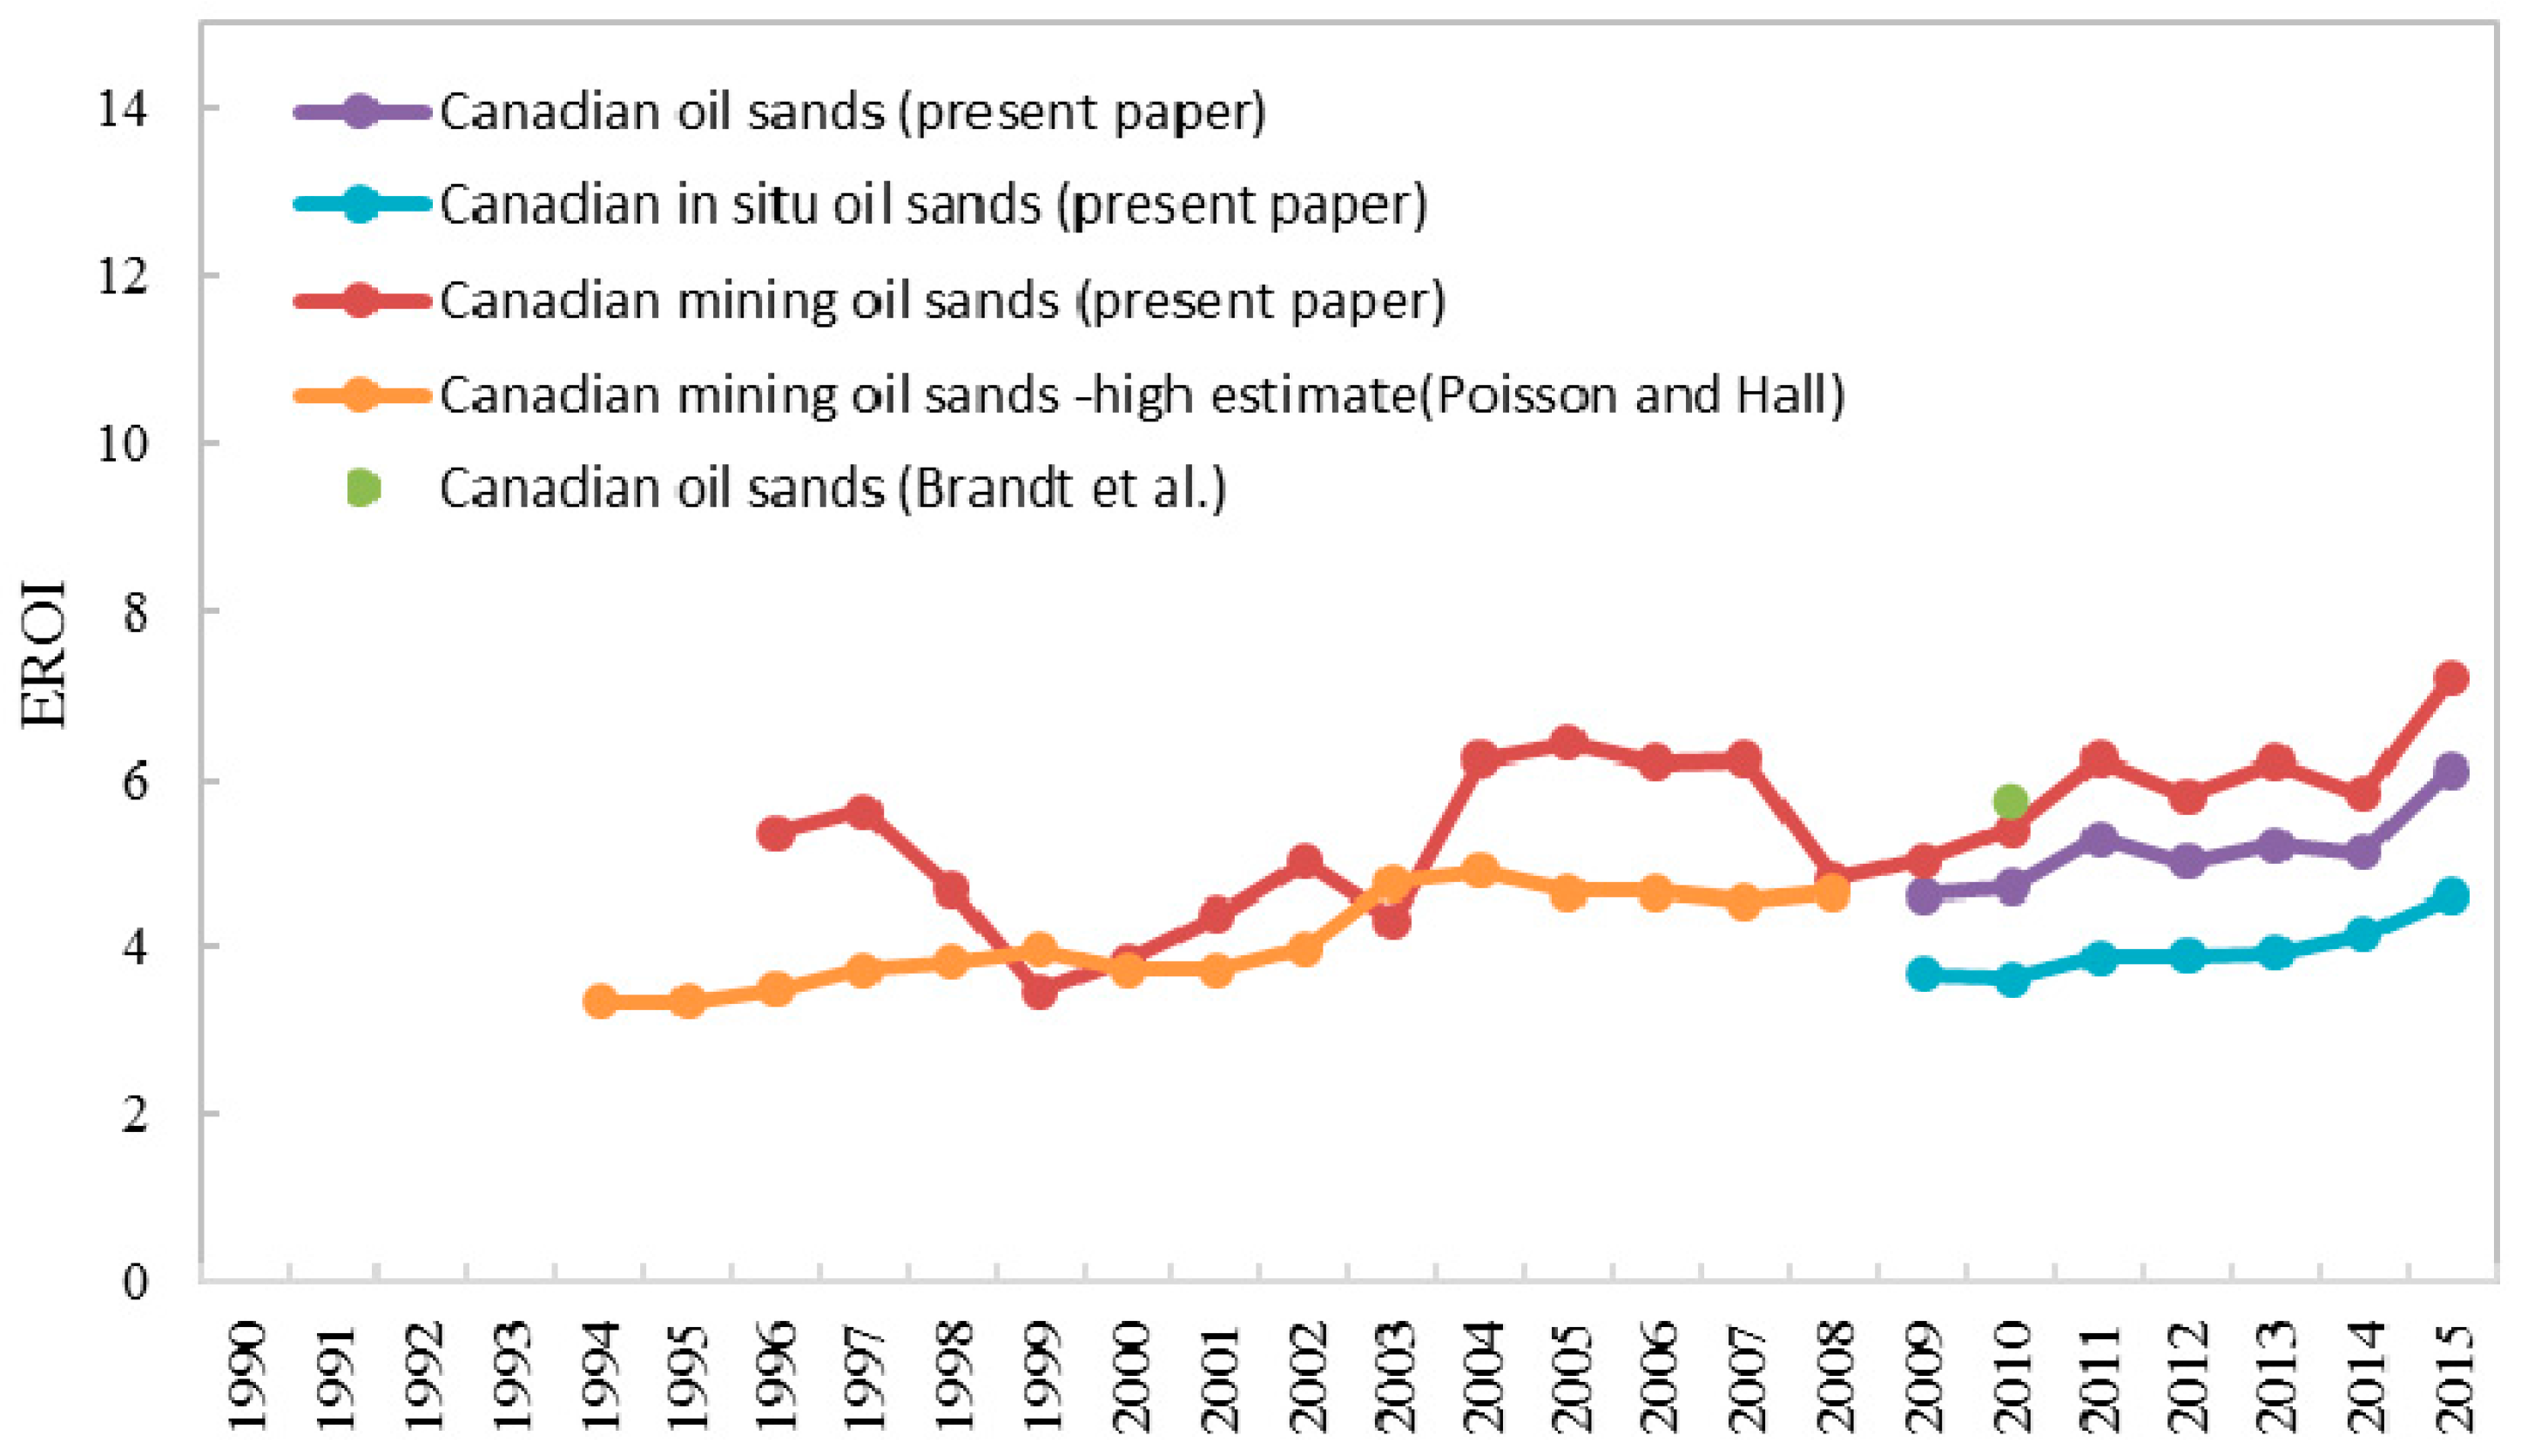
The results of the research reported by Poisson and Hall show that EROI of Canadian mining oil sands fluctuated around 4:1 during 1994–2008, with a small upwards trend [12]. In order to compare our results with the results of Poisson and Hall’s paper, we extended the period considered in our calculation of the mining oil sands EROI to 1996–2015 (we start from 1996 since yearly data before 1996 was not found). Our calculation shows that EROI of Canadian mining oil sands was fluctuating in the range of 3.5–6.5 without a significant trend during 1996–2008. According to Figure 5, the EROI result of our calculation is generally similar to but is comparatively higher and more fluctuating than the EROI result in Poisson and Hall’s paper.
We attribute the variance partly to the different data sources. Firstly, the energy input data used in Poisson and Hall’s paper was processed (using energy intensity factor) from a report by the Natural Resources Canada’s Industry Program for Energy Conservation (CIPEC). As is noted by Poisson and Hall in their paper, the data from CIPEC is not as transparent as they would like, and the data processing (from volumes to energy units) for CIPEC’s analysis was effected by Natural Resources Canada’s Office of Energy Efficiency [12]. On the other hand, the energy input data in our paper was obtained directly from the Alberta Energy Regulator government agency without any manual data processing. Secondly, the energy output data used in Poisson and Hall’s paper was also different from that used in this paper. Poisson and Hall used energy output data from the CANSIM database [36] and from Natural Resources Canada [37], while this paper used energy output data from the AER, and this data is more detailed. Thirdly, in Poisson and Hall’s paper, the data source of energy output and that of energy input are different, so they are not perfectly paired, while the energy output and energy input in this paper are from the same data source—the AER—and are included in the same files and are paired well. Therefore, we would consider our data more reliable and accurate.
Another possible reason for the different EROI results, as far as we can see, could be that the energy output data used in Poisson and Hall’s paper includes only synthetic crude oil (SCO) [12], while the energy output used in this paper includes more products besides SCO, such as bitumen delivered, intermediate hydrocarbons delivered, paraffinic solvent delivered, diluent naphtha delivered, and electricity exported, and we consider all the other products as energy output. That might cause the higher EROI result in our paper. Brandt et al. [13] showed that energy efficiency of both mining and in situ oil sands operations have increased over the history of the COS industry (before 2010). In addition, the Gross Energy Return ratio (GER) of COS (including both in situ oils sands projects and mining oil sands projects) in the year 2010 was 5.74; we consider GER as very similar to the indicator of EROI. Our research result shows that the upward trend of the COS industry has continued during the period 2009–2015, nevertheless, the EROI of oil sands calculated in this paper is lower than the results (GER) calculated by Brandt et al. We consider the potential explanation of this finding as the inclusion of indirect energy in our paper.
5.2. Comparison between EROI of Oil Sands and EROI of Other Energy Resources
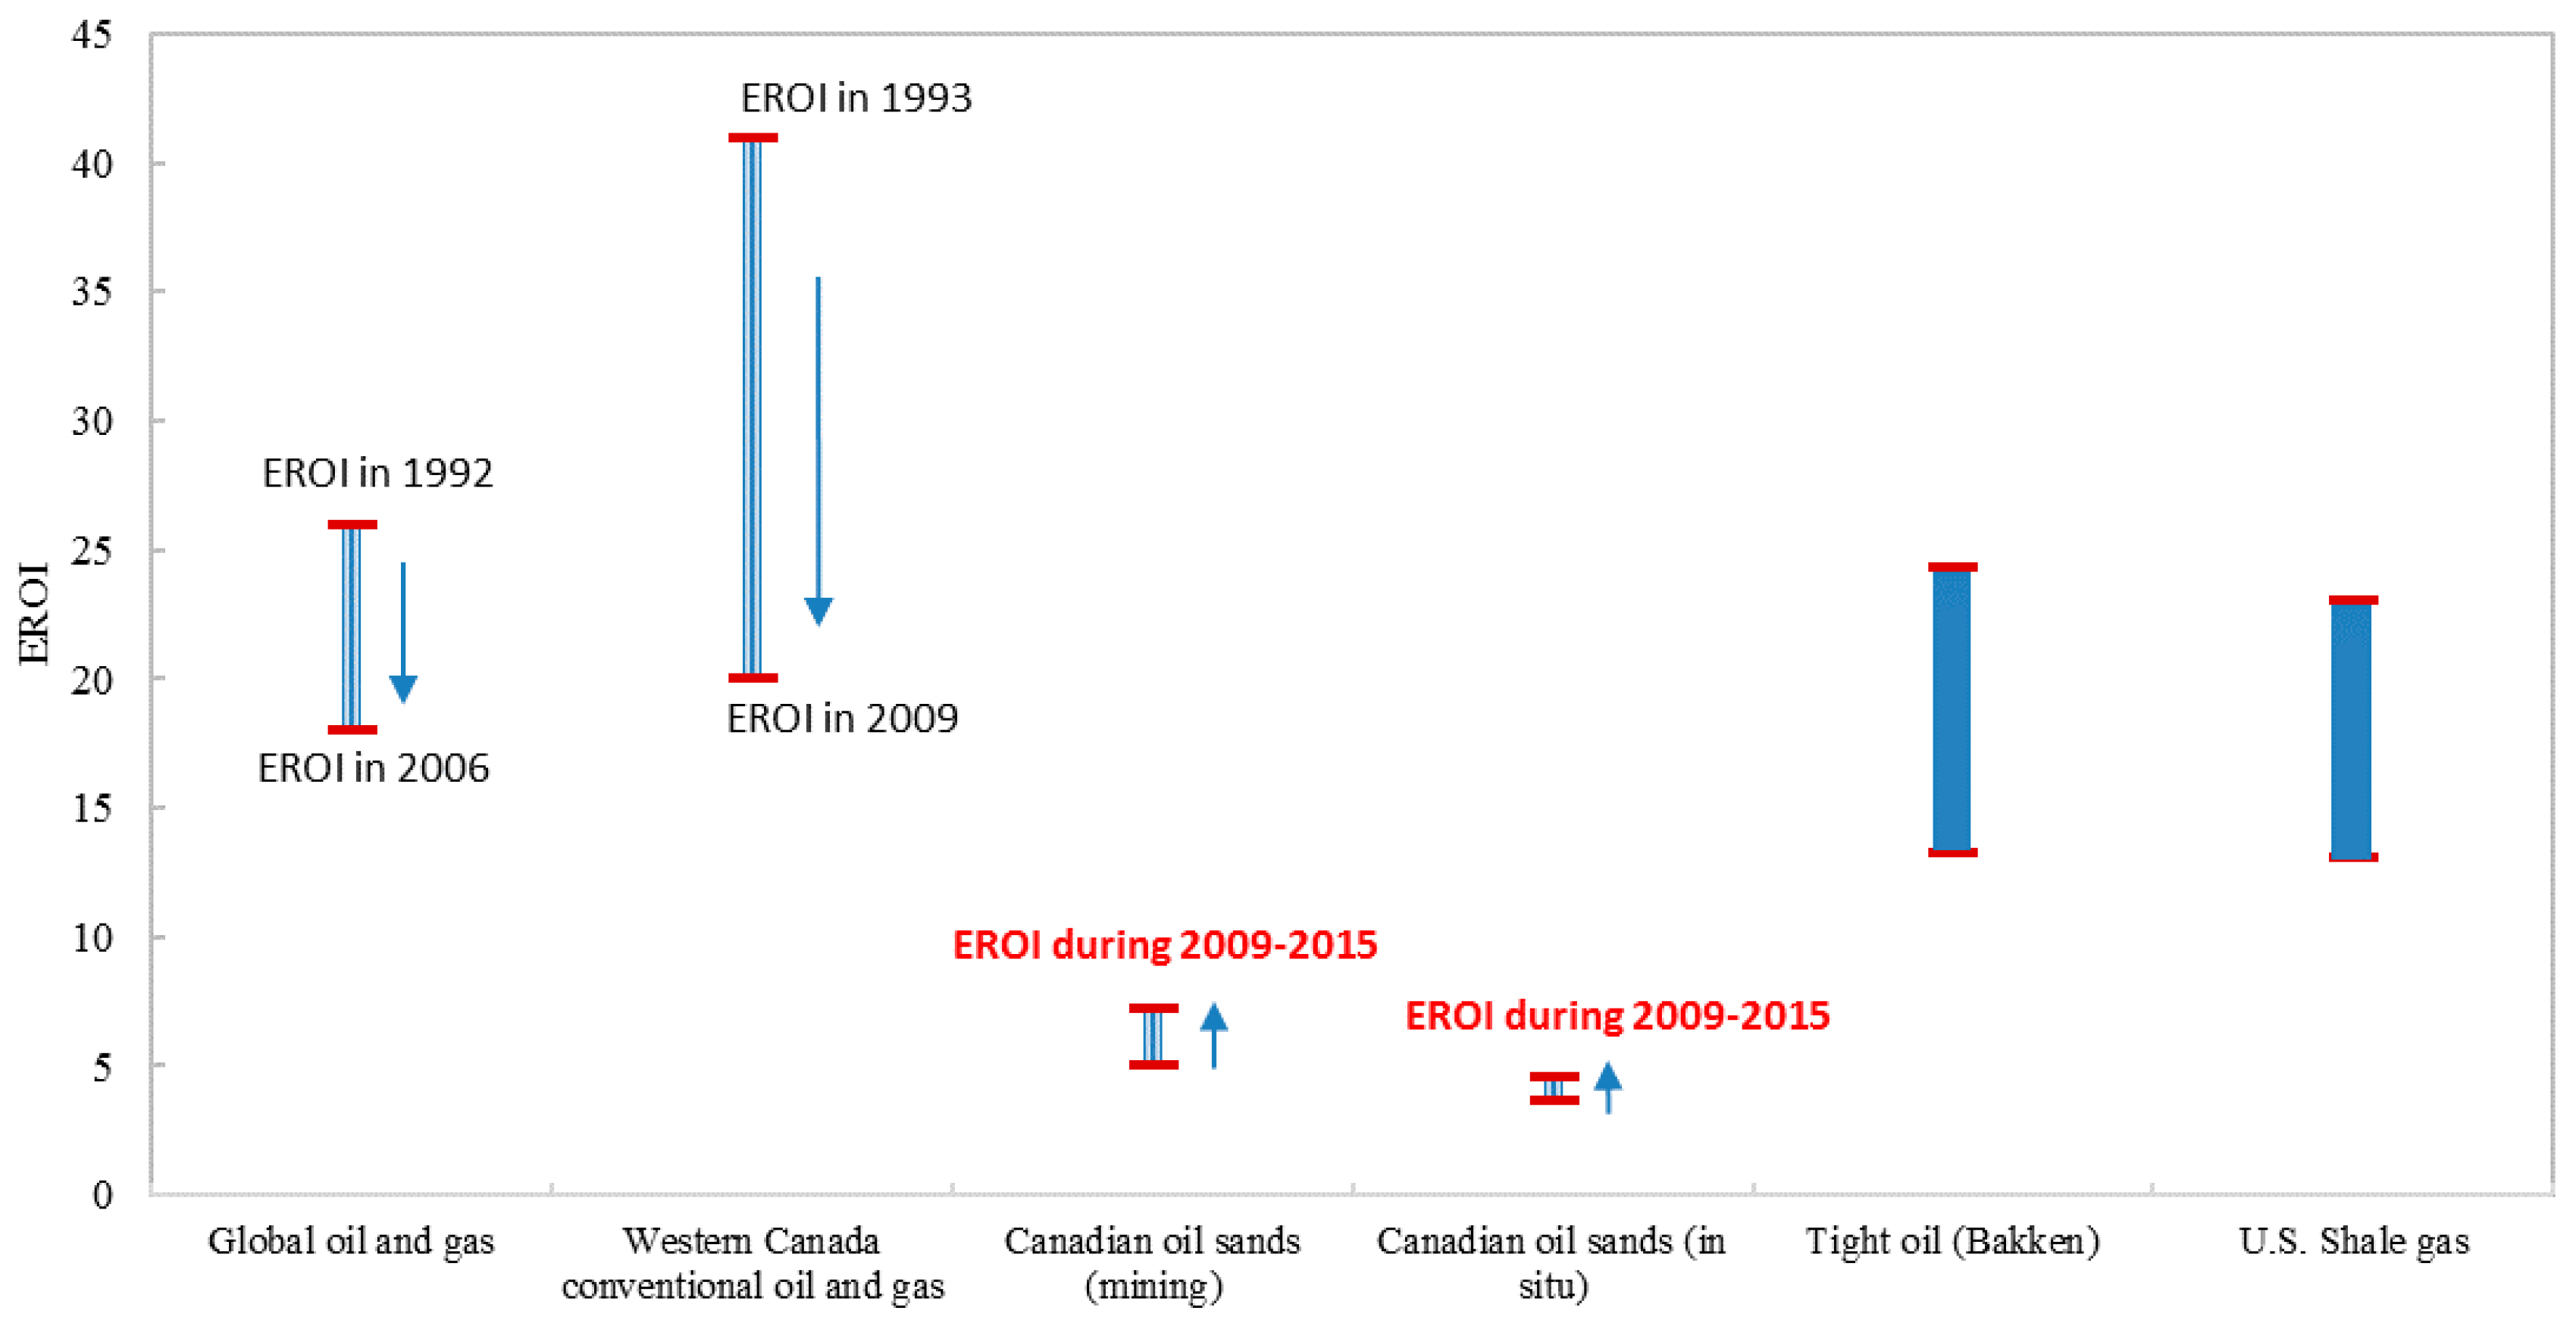
Although EROI of COS extraction has been increasing, it is still quite low compared with extraction of other types of energy resources (as is shown specifically in Figure 6).
According to Gagnon et al. [8], the EROI at the wellhead of global oil and gas extraction was approximately 26:1 in 1992, 35:1 in 1999, and 18:1 in 2006, which, though declining, is still much higher than the EROI of COS. Similar to the EROI of global oil and gas extraction, the EROI of Canadian conventional oil and gas extraction, though declining [9], is still higher than the EROI of COS extraction.
Next, we compared oil sands EROI with EROI of other unconventional petroleum, given that we already know the EROI of oil sands is much lower than the EROI of conventional petroleum. According to Brandt et al. [11], the EROI of tight oil extraction from the Bakken formation in the United States is in the interquartile range of 24.3–35.7; while Waggoner indicates that for the sweet spot of Bakken Oil production is as high as 63:1 [38]. According to Yaritani and Matsushima [10], the EROIproduction/processing of US shale gas, another typical type of unconventional fossil energy resource, is estimated to be in the range of 13–23. These results show that the EROI of tight oil and the EROI of shale gas are in similar ranges, and that both of them are much higher than the EROI of COS and are even higher than the EROI of global oil and gas. It should be noted that there are large ranges for both tight oil EROI and shale gas EROI since real data regarding energy input and energy output of tight oil and shale gas extraction is not available, and current published research are based on simulated data, thus, the reliability of these results is questionable. Further research is needed to calculate accurate results for US tight oil and shale gas production.
According to a simple linear extrapolation analysis, the increasing EROI of COS will catch up to the decreasing EROI of global oil and gas after a decade, around the year 2027. However, the real trend for the future EROI of COS may not be as optimistic as what we have extrapolated, since the oil price may remain low, long-term continuous technology improvements may not be secured, and the reserves may become harder to access as the easy resources are extracted in the early stage.
Our extrapolation might also be subject to two possible “shocks”. One possible shock is that government policy pressure to reduce greenhouse gas emissions (i.e., the already-announced Alberta and Federal Canadian policies regarding oil sands emission caps and carbon taxes) will result in a step-change disruptive technology innovation analogous to the high oil price market-driven step-change disruptive technology innovation of multi-stage fracturing and horizontal drilling that brought shale oil and gas to market; this will dramatically increase oil sands extraction efficiency and improve EROI dramatically. Another possible shock is that conventional oil- and shale oil-EROI will reduce dramatically as lower quality conventional and shale oil reserves are accessed in response to the global oil price recovery. The oil price is expected to recover due to increasing world oil supply/demand balance and renewed discipline among members of the Organization of Oil Producing Countries (OPEC) cartel and their non-OPEC allies, like Russia, to limit supply after their 2014–2016 experiment with allowing global oil markets to operate without cartel intervention. One or both of these two possible shocks could see the oil sands, conventional oil, and shale oil EROI converge sooner than our straight-line extrapolation.
In addition, it should be noted that the EROI shown above is all for energy extraction procedures. If subsequent energy industry procedures, such as transportation, were also considered, the EROI results could be different. Further research is required to compare the different energy resources based on other EROI that considers not only energy extraction procedures, but also the procedure of transporting extracted energy to a specific market.
6. Conclusions and Implications
Net energy analysis provides a useful way to represent information about the efficiency of energy resource extraction. Oil sands are an essential energy resource for both Canada and the world. Therefore, the increasingly scientifically accepted method of net energy analysis-EROI was used in this paper to analyze energy efficiency trends of oil sands extraction.
Our results indicate that during the time period from January 2009 to December 2015, the EROI of Canadian mining oil sands fluctuated in the range of 3.9–8, with a general upward trend; the EROI of in situ oil sands also demonstrated a trend of steady increase (range of value: 3.2–5.4). Indirect energy input for mining oil sands extraction and that for in situ oil sands extraction accounted for 12% and 6.8%, respectively, of total energy input of mining oil sands extraction and in situ oil sands extraction. We also find that EROI of mining COS is more fluctuating than the EROI of in situ oil sands.
Compared with conventional oil and gas and other types of unconventional hydrocarbons, oil sands, especially in situ oil sands, still have a lower EROI. Low EROI of oil sands will have adverse effects on the natural environment because more energy is consumed to extract one unit of energy output, and greater energy consumption leads to more emissions. Also, a low EROI of oil sands will have an adverse effect on the economic development in Canada since larger amounts of energy are needed to be invested in the oil sands extraction industry instead of other value creation sectors. According to Hall et al. (2009) [39], if the mine-mouth EROI of an oil-based fuel that will deliver a given service to the consumer falls below the minimum EROI for society of 3:1, this fuel must be subsidized by other fuels to be useful, and this fuel will not make energetic sense to the society. Further research should be done to calculate the accurate degree of the implication of low oil sands EROI.
Nevertheless, according to the results of this paper, the oil sands EROI is increasing gradually. Given that the global oil and gas EROI is generally declining, the COS should have a greater opportunity for future development, if the EROI of COS continues to increase (or increases faster) for a long enough period of time. However, a simple linear extrapolation analysis in this paper shows that it will take about a decade for the EROI of COS to catch up with the EROI of global oil and gas. In addition, due to the future potential risks of low oil price, discontinuous technology improvements, and the depletion effect of oil sands extraction, the real time needed by the COS industry to catch up with the EROI of conventional petroleum could be even longer. On the other hand, it is also possible that due to political pressure, resulting from the Paris Agreement, and new carbon taxes and emission caps, a future step-change disruptive technology innovation will improve EROI of the oil sands extraction dramatically, or that the EROI of conventional oil and gas will decrease dramatically, so that the time needed by the COS industry to catch up with the EROI of conventional petroleum could be shorter.
As oil sands development and other new unconventional energy resource development have become increasingly politically charged in an environmentally aware world, it is imperative that we have accurate scientifically sound information on the societal impact of this resource development. EROI is emerging as the increasingly accepted standard for this assessment as it is comparable across fuel types. Studies like ours must be done on other unconventional energy extraction technologies so that these different types of energy resources can be compared and evaluated. Policy and media discussions must be based on such scientifically vetted data rather than on claims by activists and counter-claims by industry or government.
Finally, it has long been stated the act of measuring and reporting something is the first step to improving its performance. One could argue that measuring and reporting in a scientifically sound manner the EROI of energy resource extraction types and individual projects will serve as an incentive to improving performance. Companies are required to report on a myriad of financial performance measures and have them audited by third-party auditors. EROI could similarly be required by companies to report and have audited. A standardized way of doing this, such as this paper suggests, is the first step to such a reporting system.
Supplementary Materials
The following are available online at www.mdpi.com/1996-1073/10/5/614/s1. Table S1: Proportion of projects number and production of selected in situ projects; Table S2: Oil sands projects considered in this paper; Table S3: Direct energy input and energy output items included in this paper.
Acknowledgments
The authors of this paper would like to thank the Alberta Energy Regulator and Statistics Canada for their support with providing the source data. Also, the authors would like to thank National Natural Science Foundation of China (Grant No. 71373285; Grant No. 71503264), and the Humanities and Social Sciences Fund of China’s Ministry of Education (Grant No. 15YJC630121) for their generous support. Finally, the authors would like to thank the Haskayne School of Business for hosting the first author for a 12-month period as part of the scholarly partnership between the University of Calgary and the China University of Petroleum, Beijing.
Author Contributions
Basic idea and research design: Lianyong Feng, Ke Wang, Yi Xiong. Data collection and main body writing: Ke Wang. Later Edits and Revisions: Harrie Vredenburg, Jianliang Wang.
Conflicts of Interest
The authors declare no conflict of interest.
References
- BP Statistical Review of World Energy 2016. Available online: http://www.bp.com/statisticalreview (accessed on 2 January 2017).
- Alberta Energy Regulator (AER). Oil Sands. Available online: https://www.aer.ca/about-aer/spotlight-on/oil-sands (accessed on 29 April 2016).
- Canadian Association of Petroleum Producers (CAPP). Basic Statistics. Available online: http://www.capp.ca/publications-and-statistics/statistics/basic-statistics (accessed on 2 January 2017).
- Forest Ethics Advocacy. Available online: http://business.financialpost.com/news/majority-of-oil-sands-ownership-and-profits-are-foreign-says-analysis (accessed on 12 December 2016).
- PricewaterhouseCoopers (PwC). Innovation Surge Sparks Oil Sands Opportunities. Available online: https://www.pwc.com/ca/en/energy-utilities/publications/pwc-technology-oil-sands-report-2013-11-en.pdf (accessed on 29 February 2016).
- Hall, C.A.S. Introduction to special issue on new studies in EROI (Energy Return on Investment). Sustainability 2011, 3, 1773–1777. [Google Scholar] [CrossRef]
- Hu, Y.; Hall, C.A.S.; Wang, J.L.; Feng, L.Y.; Poisson, A. Energy Return on Investment (EROI) of China’s conventional fossil fuels: Historical and future trends. Energy 2013, 54, 352–364. [Google Scholar] [CrossRef]
- Gagnon, N.; Hall, C.; Brinker, L. A preliminary investigation of the energy return on energy investment for global oil and gas production. Energies 2009, 2, 490–503. [Google Scholar] [CrossRef]
- Freise, J. The EROI of Conventional Canadian Natural Gas Production. Sustainability 2011, 3, 2080–2104. [Google Scholar] [CrossRef]
- Yaritani, H.; Matsushima, J. Analysis of the Energy Balance of Shale Gas Development. Energies 2014, 7, 2207–2227. [Google Scholar] [CrossRef]
- Brandt, A.R.; Yeskoo, T.; Vafi, K. Net energy analysis of Bakken crude oil production using a well-level engineering-based model. Energy 2015, 93, 2191–2198. [Google Scholar] [CrossRef]
- Poisson, A.; Hall, C.A.S. Time Series EROI for Canadian Oil and Gas. Energies 2013, 6, 5940–5959. [Google Scholar] [CrossRef]
- Brandt, A.R.; Englander, J. The energy efficiency of oil sands extraction: Energy return ratios from 1970 to 2010. Energy 2013, 55, 693–702. [Google Scholar] [CrossRef]
- Murphy, D.J.; Hall, H.A.S. Year in review—EROI or energy return on (energy) invested. Ann. N. Y. Acad. Sci. 2010, 1185, 102–118. [Google Scholar] [CrossRef] [PubMed]
- Hall, C.A.S.; Klitgaard, K.A. Energy and the Wealth of Nations: Understanding the Biophysical Economy; Springer: New York, NY, USA, 2012. [Google Scholar]
- Murphy, D.J.; Hall, C.A.S.; Dale, M.; Cleveland, C.J. Order from chaos: A preliminary protocol for determining the EROI of fuels. Sustainability 2011, 3, 1888–1907. [Google Scholar] [CrossRef]
- Mulder, K.; Hagens, J.N. Energy return on investment: Toward a consistent framework. J. Hum. Environ. 2008, 37, 74–79. [Google Scholar] [CrossRef]
- Kong, Z.; Dong, X.; Xu, B.; Li, R.; Yin, Q.; Song, C. EROI analysis for direct coal liquefaction without and with CCS: The case of the Shenhua DCL project in China. Energies 2015, 8, 786–807. [Google Scholar] [CrossRef]
- Leontief, W.W. Quantitative input and output relations in the economic systems of the United States. Rev. Econ. Stat. 1936, 18, 105–125. [Google Scholar] [CrossRef]
- Leontief, W. Environmental repercussions and the economic structure: An input-output approach. Rev. Econ. Stat. 1970, 52, 262–271. [Google Scholar] [CrossRef]
- King, C.W. Matrix method for comparing system and individual energy return ratios when considering an energy transition. Energy 2014, 72, 254–265. [Google Scholar] [CrossRef]
- Brandt, A.R.; Dale, M.; Barnhart, C.J. Calculating systems-scale energy efficiency and net energy returns: A bottom-up matrix-based approach. Energy 2013, 62, 235–247. [Google Scholar] [CrossRef]
- Bullard, C.W.; Herendeen, R.A. The energy cost of goods and services. Energy Policy 1975, 3, 268–278. [Google Scholar] [CrossRef]
- Costanza, R. Embodied energy and economic valuation. Science 1980, 210, 1219–1224. [Google Scholar] [CrossRef] [PubMed]
- Liu, Z.; Geng, Y.; Lindner, S.; Zhao, H.; Fujita, T.; Guan, D. Embodied energy use in China’s industrial sectors. Energy Policy 2012, 49, 751–758. [Google Scholar] [CrossRef]
- Alberta Energy Regulator (AER). ST39: Alberta Mineable Oil Sands Plant Statistics (Various Years); Technical Report; Alberta Energy Regulator: Calgary, AB, Canada; pp. 20009–22015.
- Alberta Energy Regulator (AER). ST53: Alberta Crude Bitumen in Situ Production Statistics (Various Years); Technical Report; Alberta Energy Regulator: Calgary, AB, Canada; pp. 20009–22015.
- National Energy Board, Market Snapshot: In-Situ Oil Sands Producers More Efficient, Using Less Steam per Barrel in 2014. Available online: https://www.neb-one.gc.ca/nrg/ntgrtd/mrkt/snpsht/2015/05-01nstlsnd-eng.html (accessed on 9 March 2016).
- Alberta Energy Regulator (AER). Yearly in situ Performance Presentations (Various Corporate Presentations); Technical Report; Alberta Energy Regulator and Various Oil Sands Producers: Calgary, AB, Canada; pp. 20009–22015.
- Alberta Energy Regulator (AER). ST-98: Alberta’s energy Reserves 2014 and Supply/Demand Outlook; Technical Report; Alberta Energy Regulator: Calgary, AB, Canada; pp. 2015–2024.
- Brandt, A.R. Oil Depletion and the Energy Efficiency of Oil Production: The Case of California. Sustainability 2011, 3, 1833–1854. [Google Scholar] [CrossRef]
- CANSIM (Database), Statistics Canada. Table 153-0113: Physical Flow Account for Energy Use. 2009–2011. Available online: http://www5.statcan.gc.ca/cansim/a26?lang=eng&retrLang=eng&id=1530113&&pattern=&stByVal=1&p1=1&p2=-1&tabMode=dataTable&csid= (accessed on 9 March 2016).
- Alberta Energy. Alberta Historical Royalty Data. Available online: http://www.energy.alberta.ca/About_Us/1701.asp (accessed on 28 March 2017).
- Oil Sands Magazine. In-Situ Bitumen Extraction. Available online: http://www.oilsandsmagazine.com/technical/in-situ (accessed on 25 February 2017).
- Suncor Energy Inc. Suncor Energy Reports 2012 Second Quarter Results. Available online: http://www.suncor.com/newsroom/news-releases/1615437 (accessed on 29 March 2016).
- Statistics Canada. North American Industry Classification (NAICS) 2007. Available online: http://stds.statcan.gc.ca/naics-scian/2007/cs-rc-eng.asp?criteria=21111 (accessed on 25 February 2017).
- Statistics Canada. Concepts, Sources and Methods of the Canadian System of Environmental and Resource Accounts. Available online: http://www5.statcan.gc.ca/bsolc/olc-cel/olc-cel?catno=16-505-G&lang=eng#olcinfopanel (accessed on 2 March 2017).
- Waggoner, E.G. Sweet spots, EROI, and the limits to Bakken production. In Dissertations & Theses-Gradworks; State University of New York College of Environmental Science and Forestry: Syracuse, NY, USA, 2013. [Google Scholar]
- Hall, C.A.S.; Balogh, S.; Murphy, D.J. What is the Minimum EROI That a Sustainable Society Must Have? Energies 2009, 2, 25–47. [Google Scholar] [CrossRef]
Figure 1.
Procedures of mining oil sands extraction and in situ oil sands extraction.

Figure 2.
Energy output and input of Canadian mining oil sands extraction. Note: In this figure, the stacked area figure represents energy output, while the stacked column figure represents energy input.
Figure 2.
Energy output and input of Canadian mining oil sands extraction. Note: In this figure, the stacked area figure represents energy output, while the stacked column figure represents energy input.
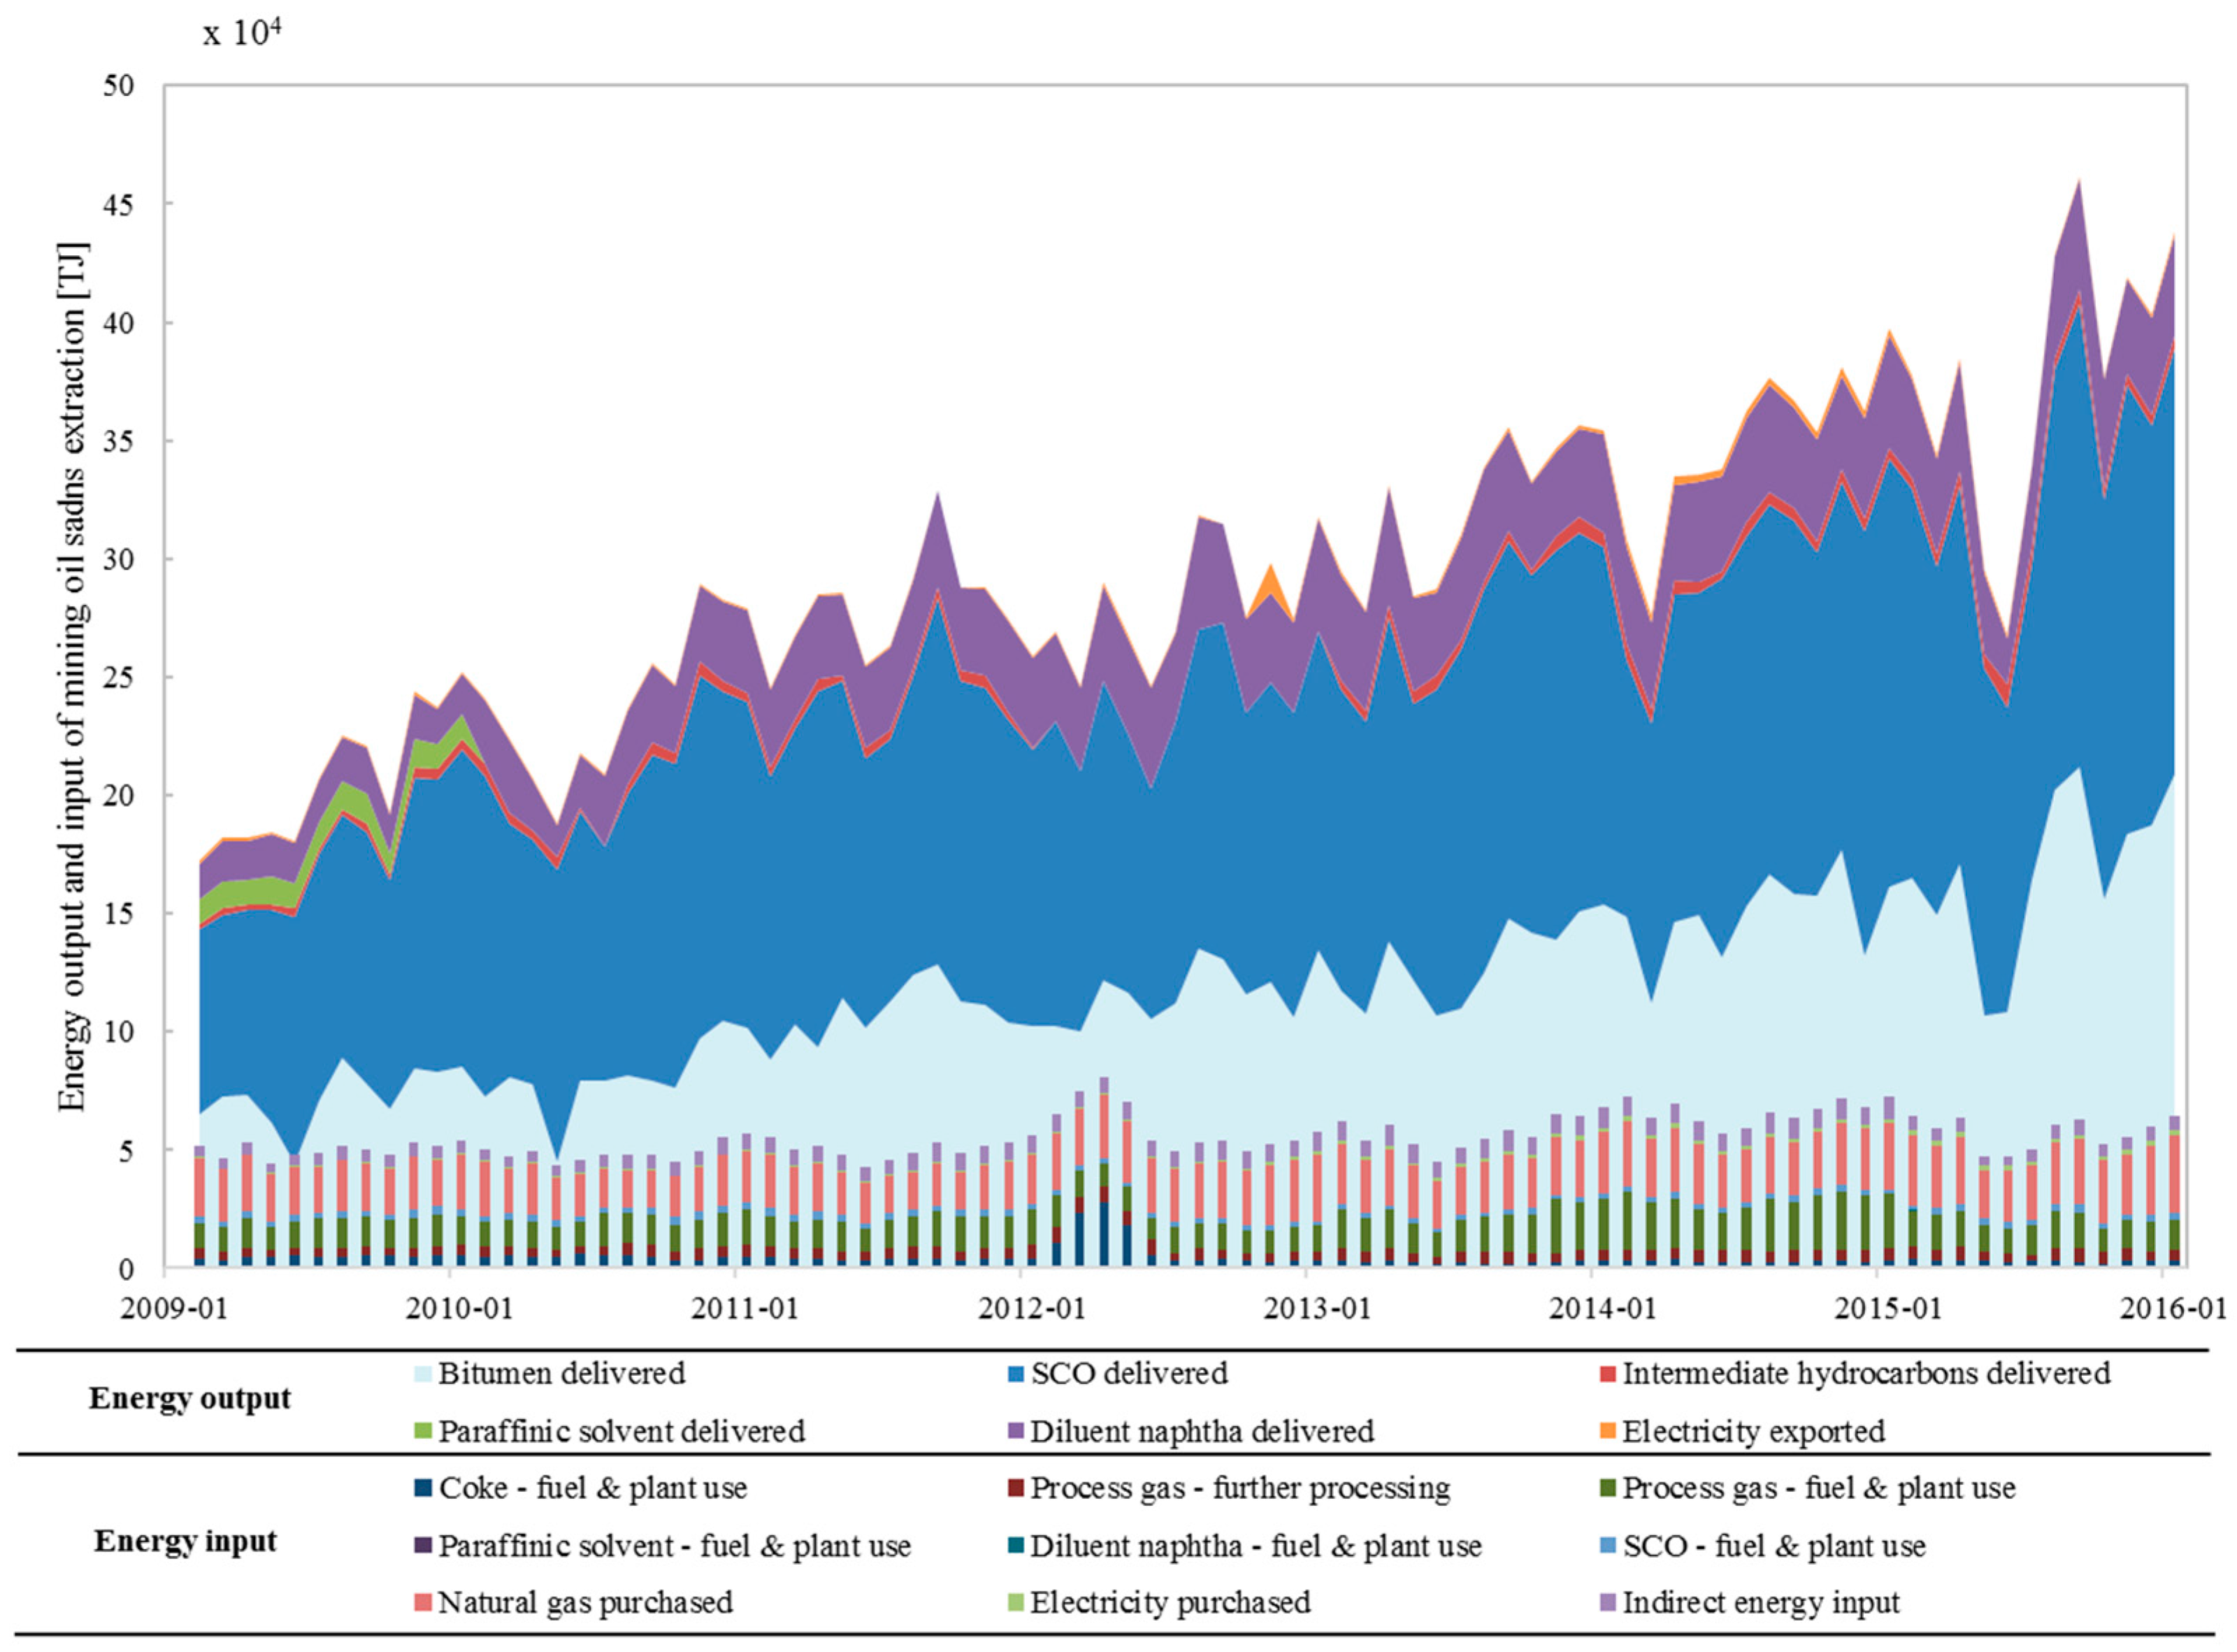
Figure 3.
Energy output and input of Canadian in situ oil sands extraction. Note: In this figure, the stacked area figure represents energy output, while the stacked column figure represents energy input.
Figure 3.
Energy output and input of Canadian in situ oil sands extraction. Note: In this figure, the stacked area figure represents energy output, while the stacked column figure represents energy input.

Figure 4.
Standard Energy Return on Investment (EROIstnd) of Canadian mining oil sands and in situ oil sands.
Figure 4.
Standard Energy Return on Investment (EROIstnd) of Canadian mining oil sands and in situ oil sands.

Figure 5.
Comparison among EROIstnd of Canadian oil sands (COS) (mining and in situ) from this paper and Energy Return on Investment (EROI) results from previous papers.
Figure 5.
Comparison among EROIstnd of Canadian oil sands (COS) (mining and in situ) from this paper and Energy Return on Investment (EROI) results from previous papers.

Figure 6.
Comparison of EROI with other energy resources. Note: EROI of global oil and gas comes from [8]; EROI of Western Canadian conventional oil and gas comes from [9]; EROI of COS (mining) and COS (in situ) during 2009–2015 are the results of this paper; EROI of tight oil (Bakken crude oil) comes from [11]; EROI of US shale gas comes from [10].
© 2017 by the authors. Licensee MDPI, Basel, Switzerland. This article is an open access article distributed under the terms and conditions of the Creative Commons Attribution (CC BY) license (http://creativecommons.org/licenses/by/4.0/).
Share and Cite
MDPI and ACS Style
Wang, K.; Vredenburg, H.; Wang, J.; Xiong, Y.; Feng, L. Energy Return on Investment of Canadian Oil Sands Extraction from 2009 to 2015. Energies 2017, 10, 614. https://doi.org/10.3390/en10050614
AMA Style
Wang K, Vredenburg H, Wang J, Xiong Y, Feng L. Energy Return on Investment of Canadian Oil Sands Extraction from 2009 to 2015. Energies. 2017; 10(5):614. https://doi.org/10.3390/en10050614
Chicago/Turabian StyleWang, Ke, Harrie Vredenburg, Jianliang Wang, Yi Xiong, and Lianyong Feng. 2017. "Energy Return on Investment of Canadian Oil Sands Extraction from 2009 to 2015" Energies 10, no. 5: 614. https://doi.org/10.3390/en10050614
Note that from the first issue of 2016, this journal uses article numbers instead of page numbers. See further details here.