
Development of a Leader-End Reclosing Algorithm Considering Turbine-Generator Shaft Torque
by

Gyu-Jung Cho
, 
Ji-Kyung Park
,
Seung-Hyun Sohn
,
Se-Jin Chung
,
Gi-Hyeon Gwon
,
Yun-Sik Oh
and
Chul-Hwan Kim
* College of Information and Communication Engineering, Sungkyunkwan University, 2066, Seobu-ro, Jangan-gu, Suwon-si, Gyeonggi-do 16419, Korea
*
Author to whom correspondence should be addressed.
Energies 2017, 10(5), 622; https://doi.org/10.3390/en10050622
Submission received: 8 March 2017
/
Revised: 21 April 2017
/
Accepted: 28 April 2017
/
Published: 3 May 2017
Abstract
:High-speed auto-reclosing is used in power system protection schemes to ensure the stability and reliability of the transmission system; leader-follower auto-reclosing is one scheme type that is widely used. However, when a leader-follower reclosing scheme responds to a permanent fault that affects a transmission line in the proximity of a generation plant, the reclosing directly impacts the turbine-generator shaft; furthermore, the nature of this impact is dependent upon the selection of the leader reclosing terminal. We therefore analyzed the transient torque of the turbine-generator shaft according to the selection of the leader-follower reclosing end between both ends of the transmission line. We used this analysis to propose an adaptive leader-end reclosing algorithm that removes the stress potential of the transient torque to prevent it from damaging the turbine-generator shaft. We conducted a simulation in actual Korean power systems based on the ElectroMagnetic Transients Program (EMTP) and the Dynamic Link Library (DLL) function in EMTP-RV (Restructured Version) to realize the proposed algorithm.
1. Introduction
Power system disturbances that are followed by circuit-breaker switching can cause transient phenomena in transmission lines that are located near generation plants, whereby the electromechanical forces in the turbine-generator are changed. The phenomena vibrates the turbine-generator shaft, resulting in torsional shaft stress [1,2,3,4,5,6]. Numerous factors such as circuit-breaker switching can cause turbine-generator shaft torsional stress, and an accumulation of critical stress can result in the cracking of the shaft [7,8,9,10].
Protection schemes have applied high-speed reclosing (HSR) technology to transmission lines because it can improve power system stability, reliability, and the continuity of the power supply when power system faults occur [11,12]. HSR has also been applied to transmission lines near generation plants, where it can easily affect the turbine-generator shaft; of particular significance, repetitive HSR following power system faults can result in accumulative damage to a turbine-generator shaft. The most severe situation in this context is the occurrence of a reclosing failure after the activation of HSR in response to a permanent fault, which also damages the turbine-generator shaft in an especially serious manner [1,6].
A leader-follower reclosing scheme is a type of HSR that involves the use of a leader-end leader-follower reclosing scheme that reduces the potential of mechanical damage to the turbine-generator, as suggested in many studies including [6,13,14], has been applied in actual situations. However, the extent of the research on the selection of the leader-end, that is reclosed firstly, is insufficient.
In the case of a permanent fault, an attempt by the leader-end to reclose can impose significant disturbances upon the turbine-generator according to the selection of the leader reclosing terminal. When a reclosing attempt into a permanent fault is inevitable, it is therefore necessary to determine which leader reclosing end is less harmful to the generator shaft to prevent accumulated shaft stress from the transient torque.
In this paper, we propose a novel protection algorithm that evaluates the preferable leader reclosing terminal according to the fault location. Through this protection scheme, the turbine-generator can avoid potential damage from critical and accumulative transient shaft torque that is caused by the selection of an unsuitable leader end for reclosing into the permanent fault.
First, we modeled actual Korean 154 kV and 345 kV transmission systems including turbine-generators, and assumed two types of permanent fault in a transmission line located in the proximity of a generation plant. Both ends are considered for suitability as a leader reclosing end to evaluate which end is less harmful to the generator shaft when it recloses as a leader end into the permanent fault. The ElectroMagnetic Transients Program (EMTP) was used in all of our studies.
This paper is constructed as follows: In Section 2, we introduce the leader-follower reclosing scheme in the transmission system. Section 3 describes the modeling procedure, torque, and power delivery characteristics of the synchronous generator, and some assumptions to perform the study. The overall procedure and results of the system study to evaluate an influence of the leader reclosing end on the turbine-generator-shaft torque is presented in Section 4. In Section 5, we finally propose a novel leader end reclosing algorithm for mitigation of the turbine generator shaft stress caused by leader reclosing attempts during a permanent fault.
2. Leader-Follower Reclosing Scheme
The leader end refers to the line terminal that recloses first in a leader-follower reclosing scheme. In general, the leader end is selected as the weaker source of the two ends of a transmission line, and it is used to test the transmission line for regeneration after the fault clearing. The fault can, however, be permanent and can persist even after the circuit breaker (CB) successfully isolates the faulted transmission line. In the case of a permanent fault, testing from the weaker end should exert less mechanical stress on the turbine-generator shaft compared with testing from the stronger end; however, a post-fault analysis should be conducted to determine the selection of the leader reclosing end. The sequence of the leader-follower reclosing scheme is shown in Figure 1, as follows [14]:
In Figure 1, the details of the operation timing of the CB tripping and reclosing at both ends are illustrated. Each CB operation is triggered by protection relays that correspond to sequential, predetermined protection steps. For example, in the case of a successful reclosing, the CBs of both ends trip to isolate the faulted transmission line after fault detection; then, the timing of each of the reclosing relays of both ends is operated successively, and the leader-end reclosing relay is initiated first; after the leader end is successfully reclosed, the voltage relay checks the restoration of the voltage at the follower end to permit the reclosing of that end; lastly, the CB recloses the follower terminal after the initiation of the successive follower-end reclosing relay. In actuality, the time settings of relays differ according to the policy of the corresponding power company or the composition of the transmission lines.
3. Power System Modeling and Assumption
3.1. Modeling of the Power System and Turbine-Generator
First, we modeled two actual Korean transmission systems including a turbine-generator. The single line diagrams of the 154 kV and 345 kV power systems are shown in Figure 2a,b, respectively. In both of the modeled power systems, large systemic parts were reduced through the use of an infinite bus that is composed of equivalent source and impedance. The bold transmission lines in Figure 2a,b are adjacent to the generation plant.
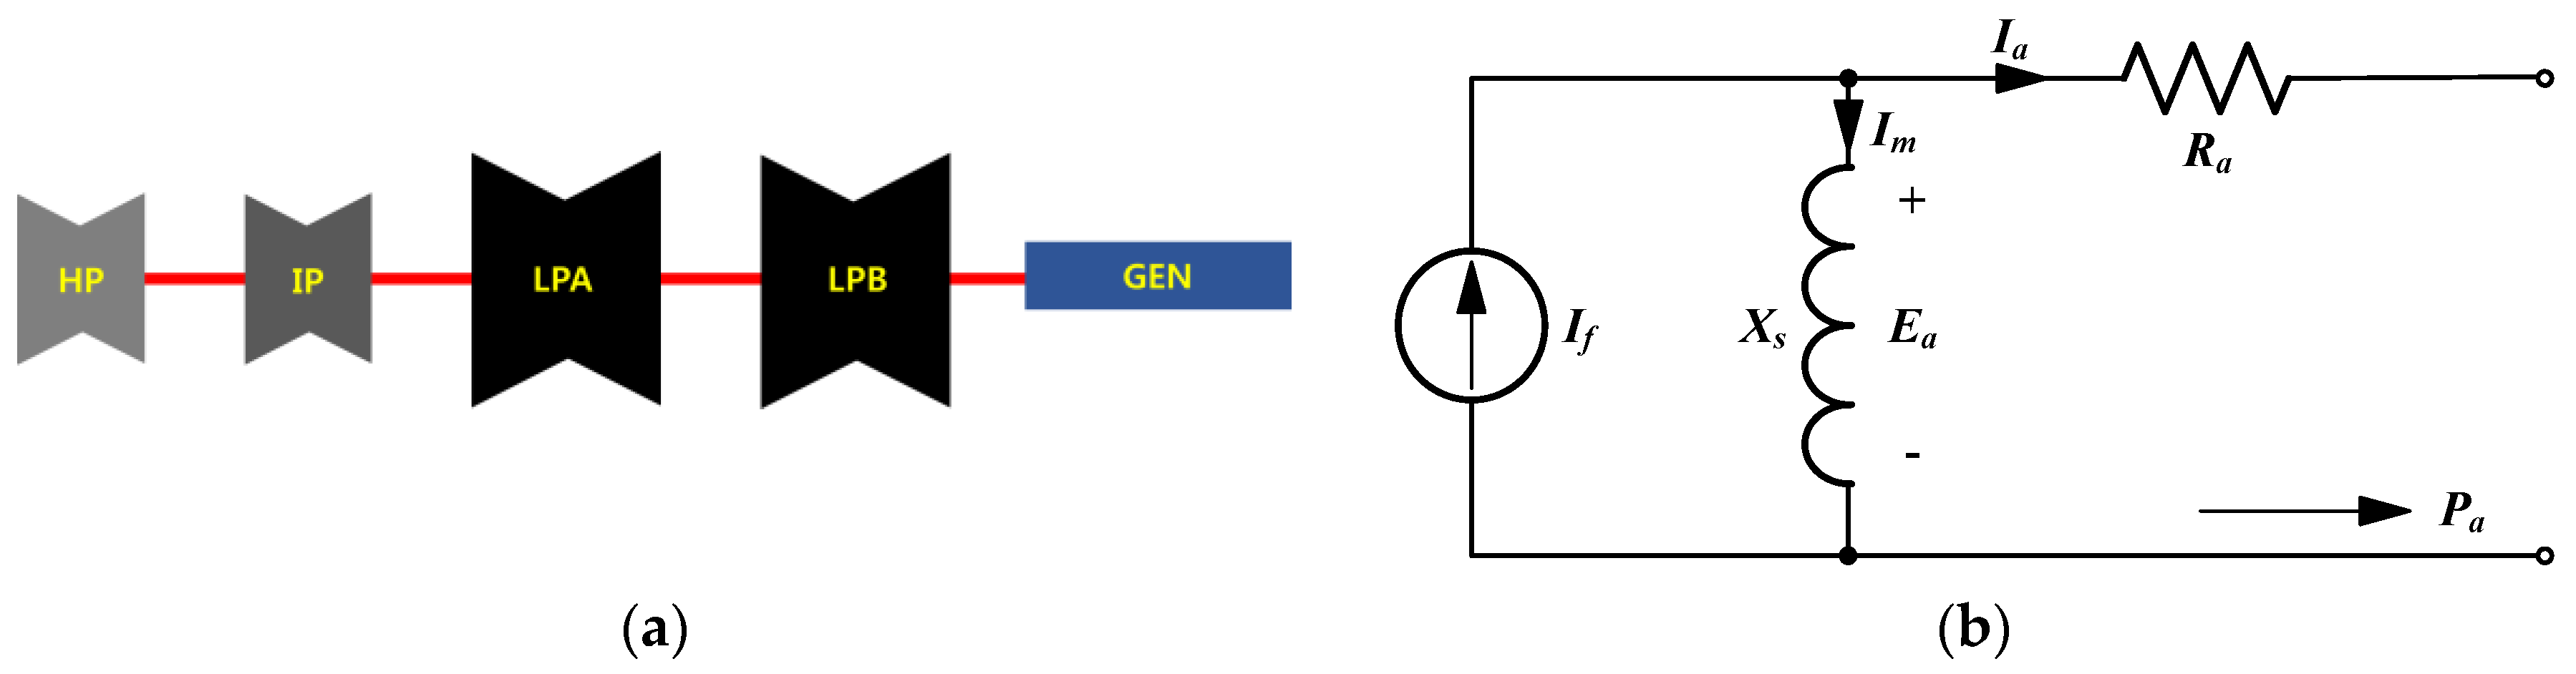
Moreover, the multiple mass-spring system of a synchronous generator was used to analyze the torsional vibrations of the turbine shaft. The segments of the turbine-generator are shown in Figure 3a. We modeled the turbine-generator with five masses including four turbines that consist of high pressure (HP), intermediate pressure (IP), low pressure A (LPA), low pressure B (LPB), and one generator (GEN). Since a generator airgap connects the power system and turbines, we expected the power system disturbances to affect the shaft between each of the turbine components. Each of the turbine-generators of the 154 kV and 345 kV power systems has the same structure, but the mechanical and electrical parameters of the generators are different. The details of the turbine-generator parameters are shown in Table A1 and Table A2 of the Appendix A.
3.2. Torque and Power Delivery Characteristics of the Synchronous Generator
We used multi-mass modeling to calculate the transient torque of the turbine-generator shaft with Equation (1), as follows [15]:
where : diagonal matrix of moments of inertia; : vector of angular positions; : tridiagonal matrix of damping coefficients; : tridiagonal matrix of stiffness coefficients; : vector of torques applied to the turbines; : vector of electromagnetic torques of the generator; and was calculated by Equation (2), as follows:
In Equation (2), is the active power applied to turbine i.
is the shaft torque between i − 1 mass and i mass, and the impacts on the rotor shaft are reflected in the transient shaft torque, as shown in the following Equation (3):
As shown by Equation (3), the shaft torque acted in the reverse directions on each of the turbine masses, but had the same magnitude.
The equivalent circuit of the synchronous generator is shown in Figure 3b. In the case of the synchronous generator, voltage applied at armature () can be assumed by Equation (4) [16], as follows:
where : synchronous reactance; : magnetizing current; : field current; : armature current, assumed as ; : phase-angle difference between and ; The active power transferred across the airgap () was calculated using Equation (5), as follows:
where is the active-power output of the generator through the airgap. If the armature losses are neglected, can be regarded as the active-power output of the generator that was developed at the generator terminal, and it is directly related to the torque transferred across the airgap.
Therefore, if power system disturbances such as a leader reclosing into the permanent fault occur in the transmission lines in the proximity of the generator, the of Equation (5) should fluctuate, along with fluctuations of the active power and torque across the airgap. The equilibrium of the electromechanical force, which connects the stator terminal to the rotors, would consequently be lost, and this change directly affects each turbine stage and the shaft.
3.3. Assumptions for Simulation
We applied the following preconditions in our study:
- In all cases, the fault resistance of the permanent ground fault was set to zero Ohm for the purpose of analyzing the mechanical stress on the turbine-generator shaft under the most severe condition.
- We calculated the peak-to-peak transient shaft torque beyond the moment of the leader reclosing failure to determine the quantity of the mechanical stress that was applied to the turbine shaft. The shaft torque calculation point was between the LPB and GEN because the maximum transient shaft torque during disturbances typically occurs at this point.
4. Analysis of Turbine-Generator-Shaft Torque According to Leader Reclosing
4.1. Simulation Cases
Table 1 shows the simulation cases that we analyzed. In the modeled transmission systems, we assumed three-phase and single-phase permanent faults at three locations for each transmission line (T/L).
Three different fault locations were also selected to evaluate an influence of the fault location on the turbine-generator shaft torque due to the reclosing operation. The percentage of the fault location means the ratio of the distance between the generation plant and the fault location to the length of the fault relevant transmission line. For example, 10% of the fault location means the 10% ratio of the faulted transmission line length from the sending-end, which is very close to the generation plant, while 90% is close to the receiving-end. The transient shaft torque of the turbine-generator was calculated according to the leader-end selection.
The time sequence of the CB operation that was used in each modeled power system is shown in Figure 4; in all cases, the permanent fault occurred at 0.2 s and remained until the end of the simulation time. The CB operation sequence follows actual Korean auto-reclosing relay operation standards [17]. Also, we only considered the operation of the leader-end CB because we needed to check the turbine-generator shaft torque according to the reclosing failure from each leader reclosing terminal. The leader reclosing time differed according to the transmission-line voltage level; however, after 6 cycles, each of the leader-end CBs would be tripped to re-clear the remaining fault. We reflected actual dead time of Figure 4 for each voltage level, prior to the leader-end auto-reclosing operation. Under this process, a turbine-generator shaft would experience continual torsional stress.
4.2. Simulation Result for the Three-Phase Fault
Table 2 shows the turbine-generator-shaft torque for leader reclosing and tripping attempts following the three-phase permanent fault. “S” represents a sending-end (Bus 1 for case 1, 2, and Bus 5, 8 for case 3, 4) leader reclosing attempt and “R” is a receiving-end leader reclosing attempt.
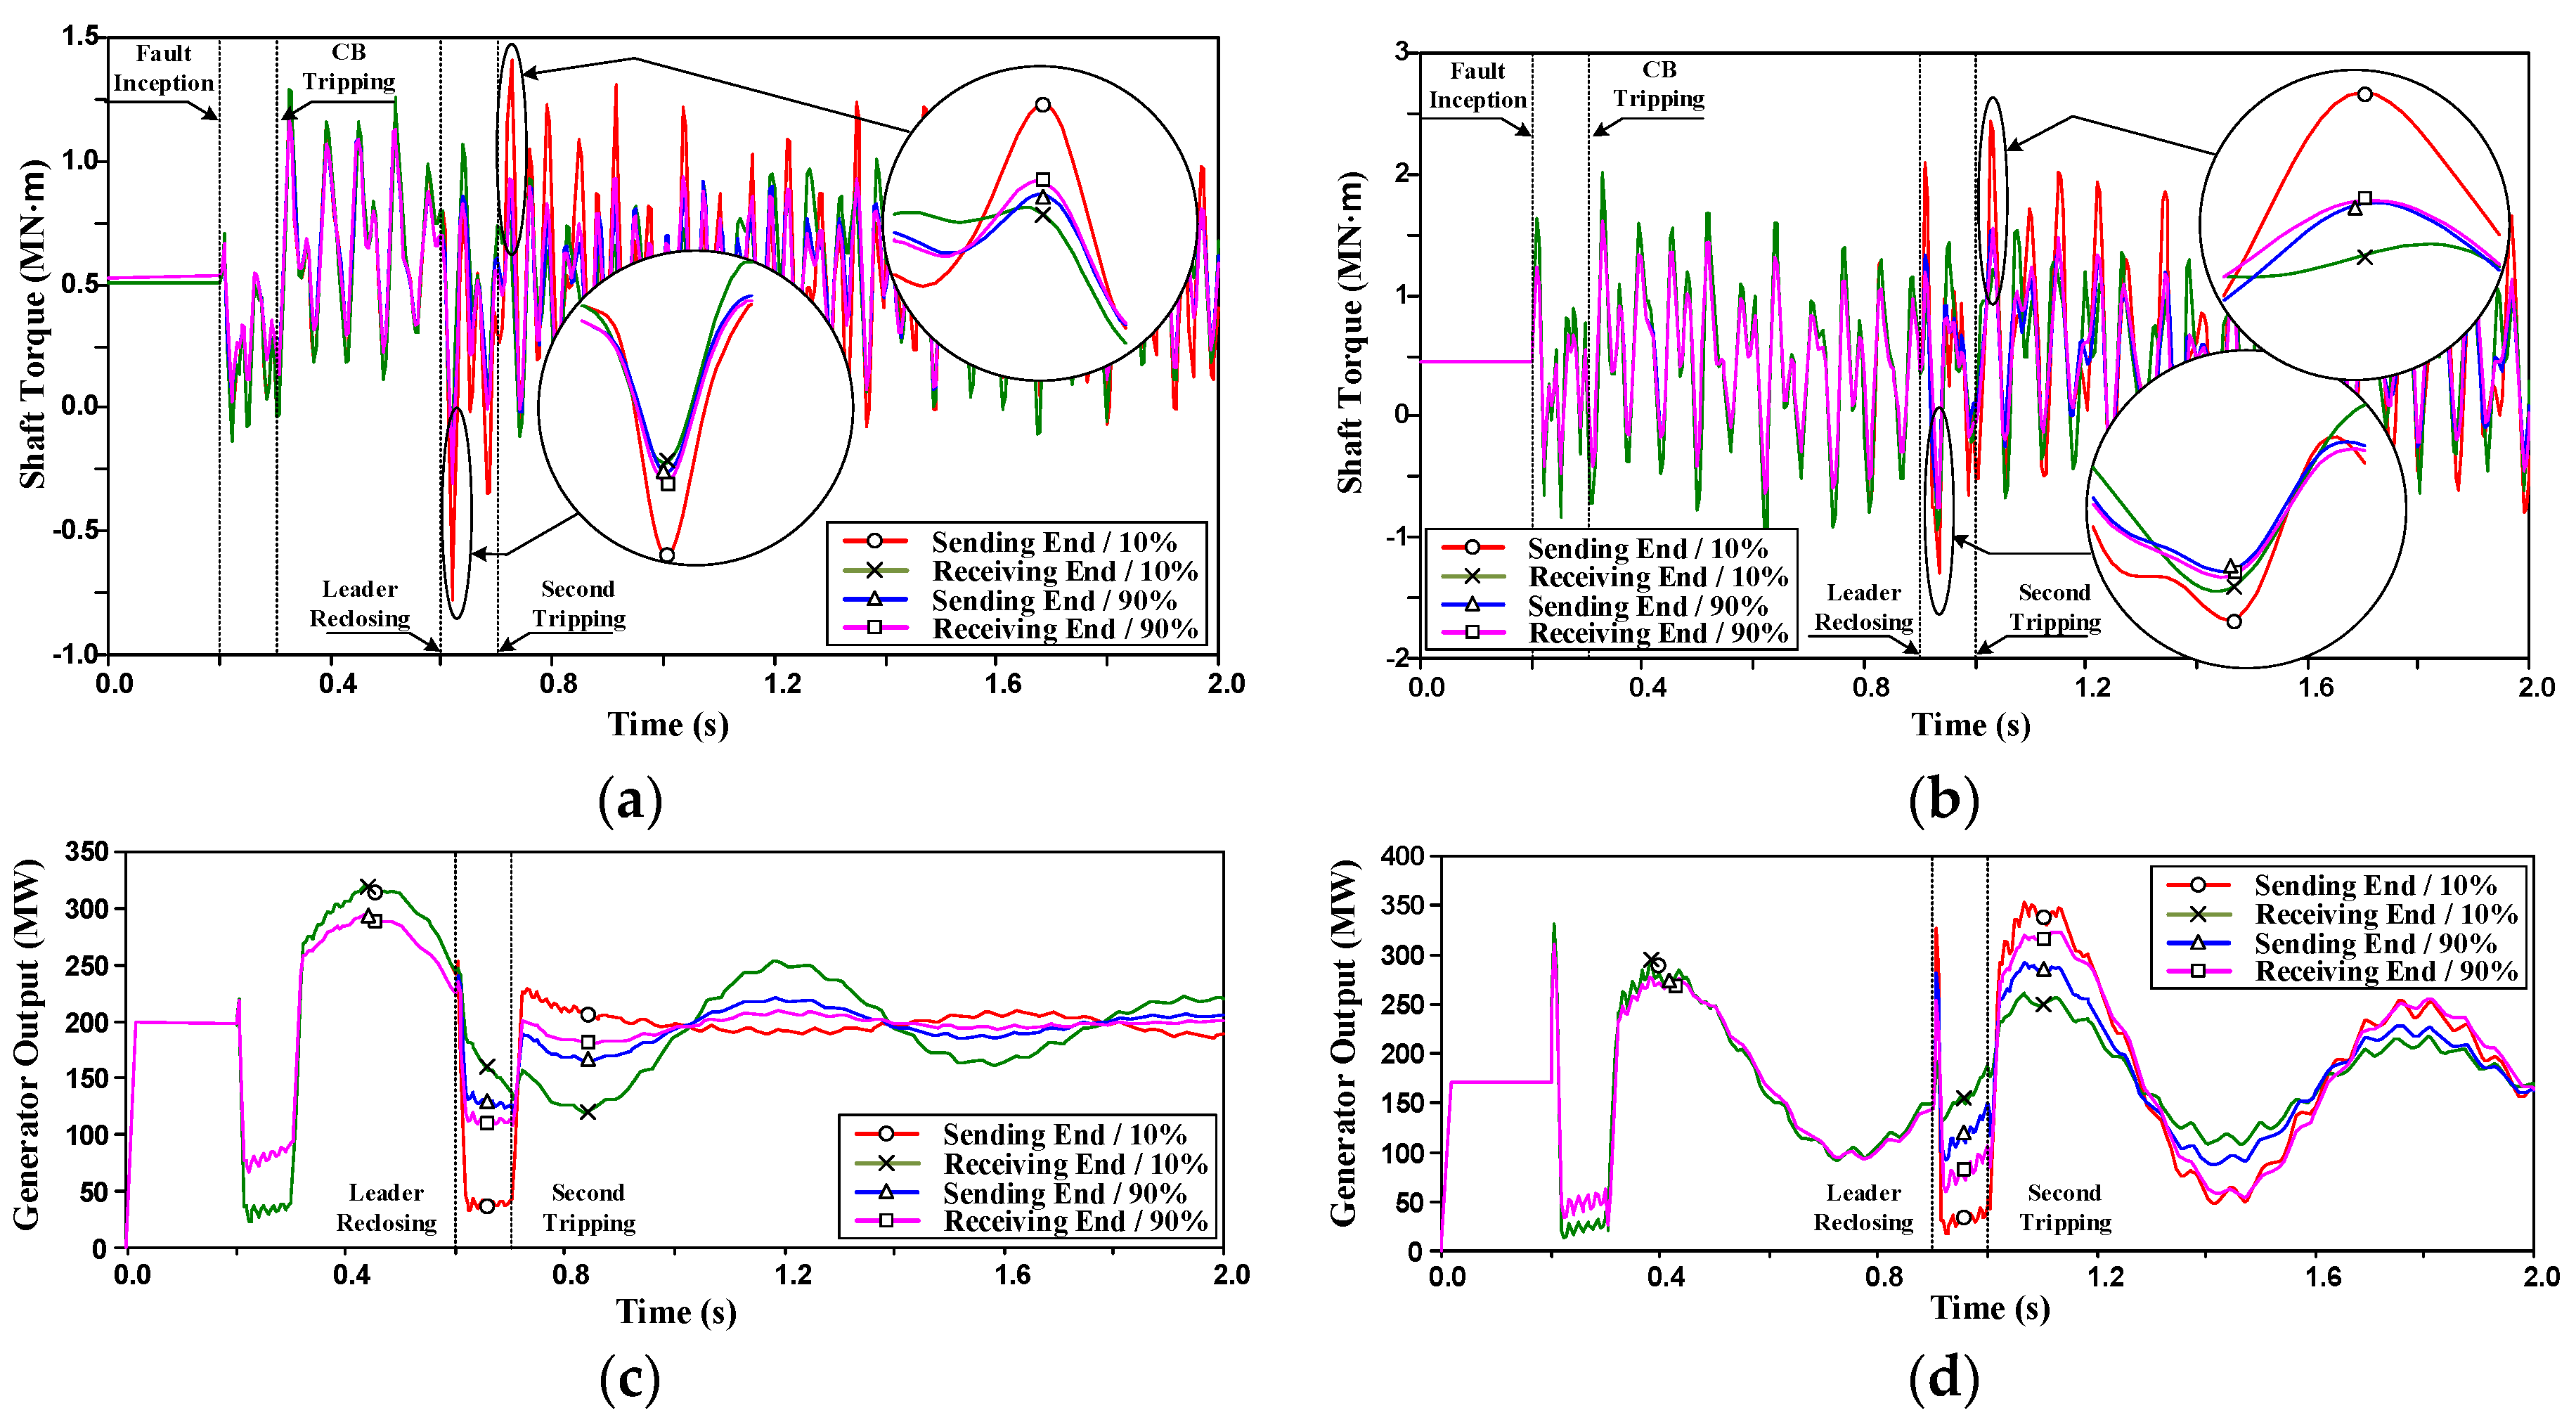
The instantaneous shaft torques of LPB-GEN in the 154 kV and 345 kV generators according to the operation of the CBs are shown in Figure 5a,b, respectively. We can see the oscillation of the mechanical shaft torque that was caused by the fault inception and the following successive CB switching.
In general, the closer that the fault occurred to the generator, the greater the stress upon the generator shaft, and reclosing into the three-phase fault significantly impacted the shaft.
Additionally, the receiving-end leader reclosing attempt generally had a more favorable influence on the turbine-generator than the sending-end leader reclosing. This difference was caused by a change of the generator power output at the moment of the leader-end reclosing attempt. When the permanent fault occurred in the proximity of the generation plant, the leader-reclosing operation at the sending end directly affected the generator power output since the current instantly flows from the generator terminal to the fault location at the moment of reclosing. This power flow change affected the generator shaft, whereby the sending-end leader reclosing directly impacted the generator shaft.
However, for the permanent fault locations of the transmission lines 3, 4, 6, and 8, the sending-end leader reclosing showed a lesser impact on the generator shaft. As shown in Figure 5c,d, we followed each generator’s instantaneous power-output fluctuation to compare not only this particular case, but also other ordinary cases.
The existence of different active generator power outputs with respect to fault locations and the leader-end selection of each power system was obvious. As shown from Figure 5, a considerable reduction of active power occurred in the instance of reclosing, so that the minimum peak torque should occur during this event. This active power reduction also appeared at the initial fault inception, whereby the leader that reclosed into the permanent fault can be regarded as an additional fault inception. When the three-phase fault was applied, the bus voltage decreased due to the large flow of reactive current to the fault point; a reduction of the voltage immediately resulted in low active power. Furthermore, three-phase tripping of both ends of the circuit breakers isolated the faulted line from the power system grid, thereby temporarily restoring the generator’s power output. Subsequent leader reclosing and second tripping, however, caused the turbine-generator to undergo another fault, leading to another generator power output fluctuation. In this case, the selection of the leader end, which determines which terminal is reclosed first, strongly influenced the extent of the damage to the turbine-generator shaft due to an active power fluctuation.
When a permanent fault occurred in 10% of T/L #3 and #6, the sending-end leader reclosing caused a more significant fluctuation of the generator’s output of active power compared with the receiving-end leader reclosing. For the fault in 90% of T/L #3 and #6, the receiving-end leader reclosing caused a more severe active-power fluctuation in a contrasting manner, that was caused by a difference of the line impedance.
The previously mentioned power transfer is represented by Equation (6), as follows:
where δ is the voltage phase angle difference between both ends; and are the bus voltages of the sending end and receiving end, respectively; and is the line impedance.
As we compared each leader-end reclosing into the same permanent location, we did not expect significant changes of the voltage magnitudes and voltage phase angles of the buses, which are connected to both ends of the transmission lines, during the fault. We therefore expected the line impedance to be a critical factor that affected the fluctuation of the generator’s active power due to the selection of the leader-reclosing terminal. In addition, the line impedance at the moment of the leader reclosing can be significantly affected by the location of the permanent fault. In our study, the greater fluctuation of the power flow that was due to the change of the line impedance meant that the turbine-generator shaft was more significantly affected by the leader reclosing into the permanent fault; therefore, despite the reclosing of the receiving-end leader, the magnitude of the detrimental effect on the turbine shaft was dependent upon the condition of the permanent fault.
In summary, our analysis showed that, for a certain fault location in a particular transmission line in the proximity of a generation plant, a sending-end leader reclosing into the permanent fault can result in the turbine-generator shaft being subject to a lesser amount of stress compared with a reclosing of the receiving-end as the leader reclosing terminal.
4.3. Simulation Result for the Single-Phase Fault
Table 3 shows the turbine-generator shaft torque for the leader reclosing and tripping attempts following a single-phase permanent fault. Similar to the three-phase fault cases, the receiving-end leader reclosing attempt had a lesser impact on the turbine-generator and, generally, the further away that the fault occurred from the generator, the lower the amount of the stress that the generator shaft was subject to. The overall shaft torque values for the single-phase permanent fault are not considered critical to this paper because they are smaller than the three-phase fault values; therefore, we omitted the time-domain plot of the turbine-generator active-power output and the plot of the turbine-generator shaft.
4.4. Additional Simulation Result of the Three-Phase Fault for Determining the Preferable Leader-End
We then conducted additional simulations for detailed fault locations in T/L #3, #4, #6, and #8 to establish specific permanent fault locations at which the sending-end leader reclosing caused a lesser amount of stress on the generator shaft. Table 4 shows the results of the additional simulations.
As shown in Table 4, we obtained the fault location criteria of each transmission line that caused a lesser amount of stress to the turbine-generator shaft when the sending-end leader reclosing was implemented during the permanent fault. In the cases of T/L #3 and #4, the fault location criteria of each transmission line is 84% in accordance with a comparison of each torque value. We can therefore say that if the permanent fault occurs beyond the 84% location criteria for T/L #3 and #4, the sending-end leader reclosing attempt results in less harm to the turbine-generator shaft compared with a receiving-end leader reclosing attempt; this also applies to the 88% and 89% fault location criteria of T/L #6 and #8, respectively. By this stage of the study, the simulation results showed that a system study of a target generation plant power grid is necessary to determine the particular criteria for the selection of the leader-end. This criteria is utilized for the proposed leader-end reclosing algorithm described in Section 5.
5. Development of the Leader-End Reclosing Algorithm
5.1. Outline of the Algorithm
In this paper, we suggest a leader-end reclosing algorithm for determining the more effective reclosing terminal in the mitigation of the turbine-generator shaft stress caused by leader reclosing attempts during a permanent fault. In spite of the risks of enacting a leader-end reclosing attempt into a permanent fault, many studies on reclosing schemes in transmission systems have focused on power system stability or discrimination of the fault type. Discrimination of the permanent fault might be the best solution to prevent reclosing into the permanent fault, but it needs additional hardware or a complex algorithm. Contrary to existing studies, we propose a more practical reclosing scheme that considers the turbine-generator-shaft torque without any additional hardware or complicated calculations. Through this algorithm, a CB for leader reclosing operates flexibly according to the determination of the leader reclosing terminal.
As we mentioned in Section 4, a receiving-end leader reclosing into the permanent fault generally causes less harmful damage to a turbine-generator shaft. In some transmission lines, however, receiving-end reclosing burdens the turbine-generator shaft with more harmful mechanical damage in certain fault locations; therefore, we determined the reference fault location to verify that receiving-end leader reclosing is more harmful to the turbine-generator shaft than sending-end leader reclosing. In the case of a permanent fault beyond this reference fault location, we expected sending-end leader reclosing to be preferable to receiving-end leader reclosing; for example, by referring to Table 4, it was possible to determine that the of T/L #3 is 84% of the transmission line in modeled system.
The operation of the proposed leader-end reclosing algorithm was based on the fault location , whereby the greater the accuracy of the distance or impedance relay that is applied to a transmission line, the better the performance of the algorithm. Until recently, studies on the calculation of the fault location confirmed distance relays with a high degree of accuracy [18,19,20,21,22], and various techniques that increase the reliability of the distance relay have been developed.
The proposed algorithm also cooperated with a live/dead voltage detector at both ends of the transmission line. Since a Live Bus Dead Line (LBDL) condition is a precondition for leader reclosing, the voltage detector must cooperate with the proposed algorithm to check the LBDL or LBLL (Live Bus Live Line) satisfaction.
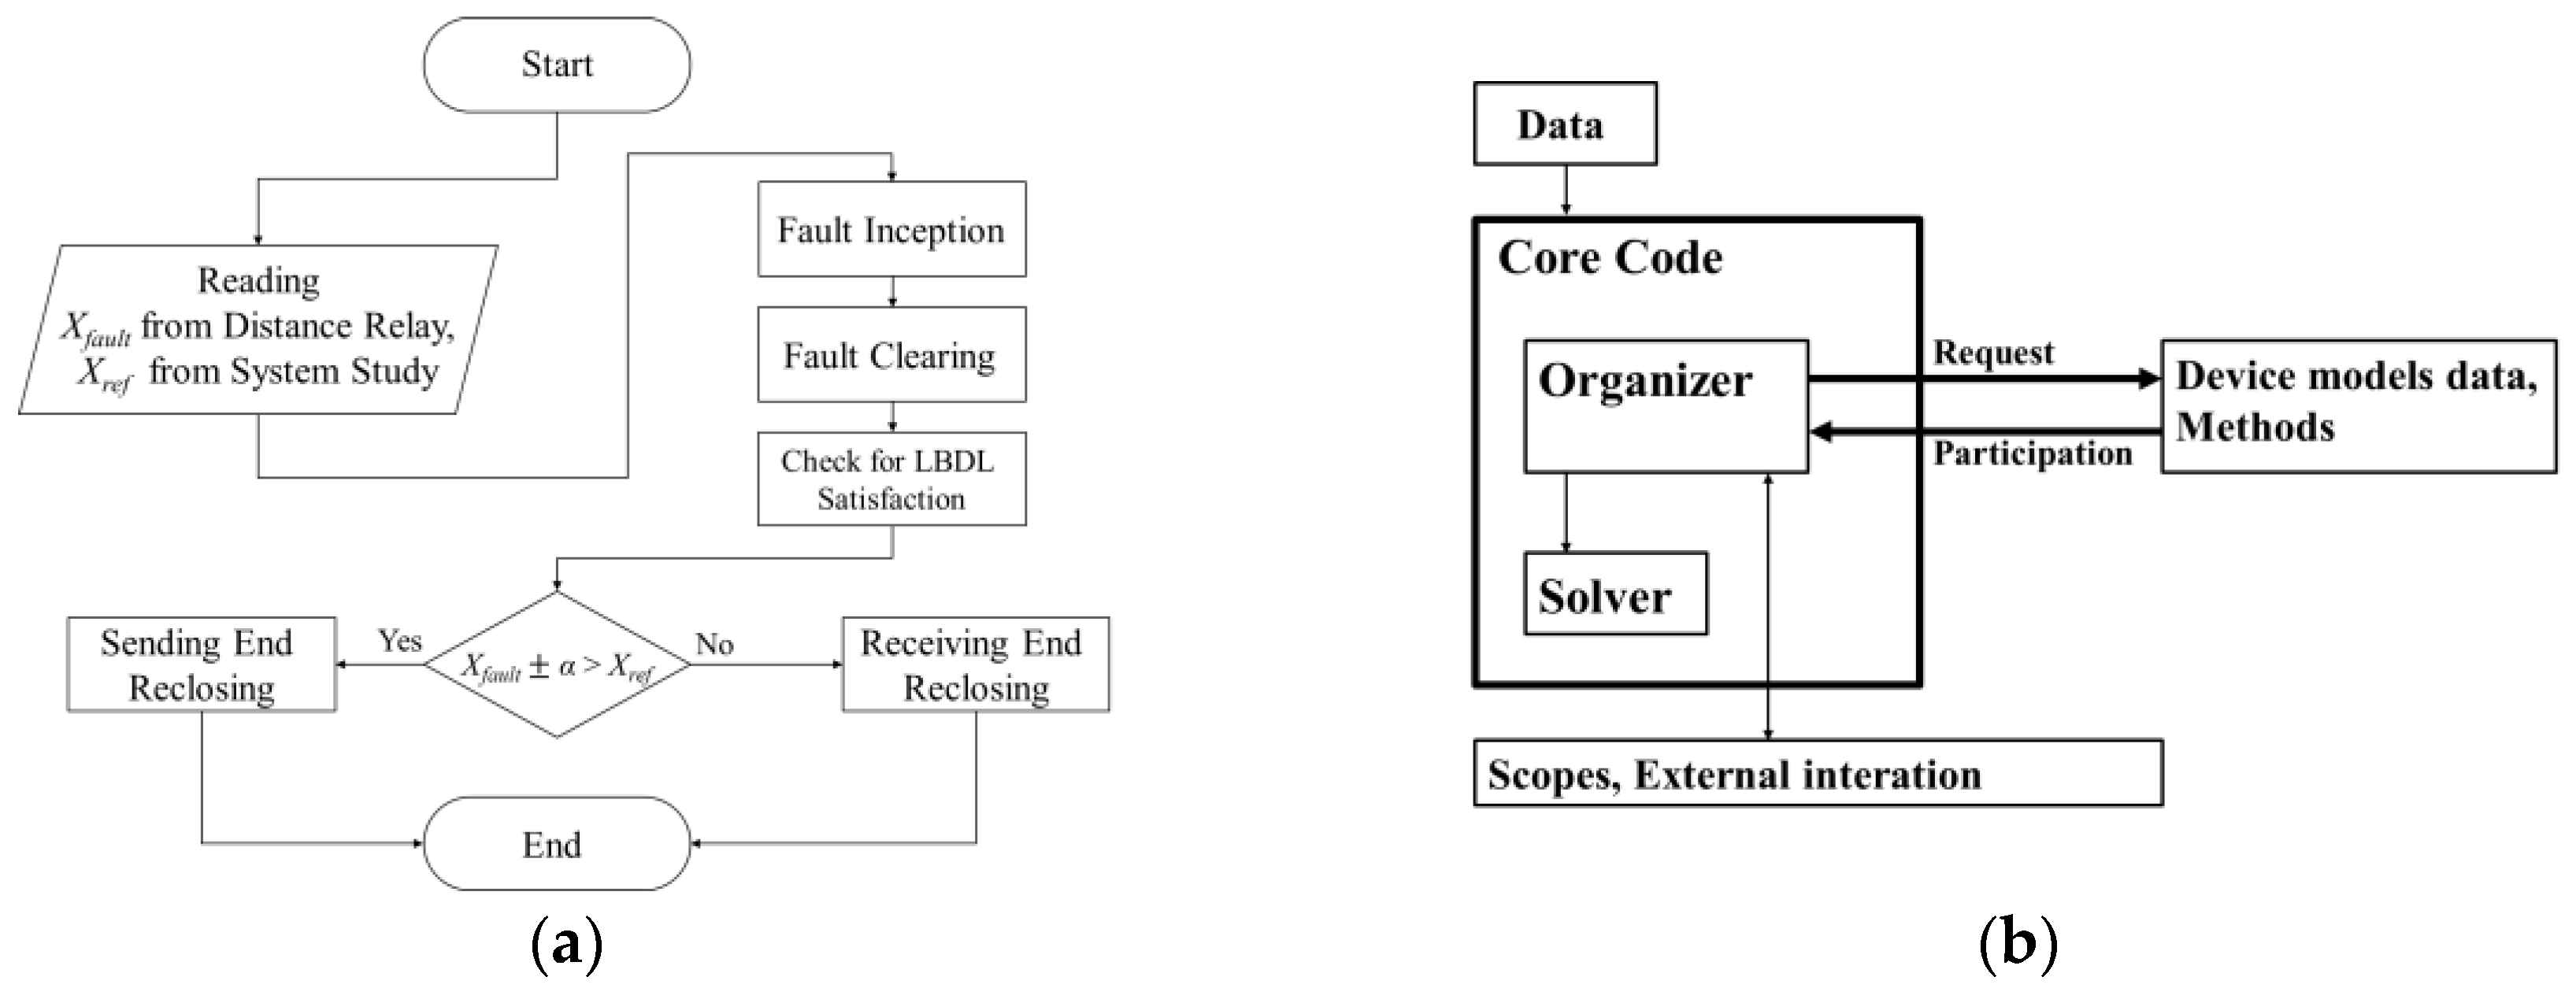
A flowchart of the proposed algorithm is shown in Figure 6a. As previously mentioned, the algorithm uses two types of locational data:
The was used to determine whether the fault location corresponded to where the sending-end leader reclosing operation is less harmful to the turbine-generator shaft; this variable can be easily obtained from the distance relay. The was used as reference data for comparison with the fault-location data . As a comparison calculation, the algorithm determined the leader reclosing terminal and ordered the circuit breaker to reclose the selected leader end for testing of the transmission line. If the LBLL condition is not satisfied, the selected leader-end circuit breaker will re-trip after the completion of the algorithm. The α represents a margin to cover a measurement error of the distance relay; however, it would not be significant due to the high reliability of the existent distance relay. A value of the α depends on the distance relay used in the generation plants. In this study, we assumed an ideal distance relay operation, so we set the α as close to zero. Through the adoption of the adaptive leader reclosing terminal, the turbine-generator shaft can be subject to less stress when the leader-end reclosing into the permanent fault is unavoidable.
To realize the algorithm in EMTP, we used a Dynamic Link Library (DLL) to link the algorithm model with the EMTP-RV (Restructured Version) engine. The DLL function can be used to allow EMTP-RV users to develop user-defined or personalized model modules. The relationship between the basic core code of the EMTP-RV and DLL device models like the proposed algorithm is illustrated in Figure 6b. Each device model exchanges data with the core code through the simulation steps of the request-participation relationship that is shown [23].
For the DLL devices to accommodate requests to solve the equations of the main system, the inner DLL code must include the following sections:
- Common memory section.
- Common services.
- Used external services or objects.
- Internal function definitions.
- Exported function definitions.
These five sections fall into three categories—memory sections, internal function, and exported output function—and procedures were implemented by corresponding subroutines in the DLL code in accordance with a certain sequence. To build the DLL code, we used Intel® Visual Fortran Composer as a compiler.
5.2. Verification of the Algorithm
We simulated several fault locations to verify the proposed algorithm and Table 5 presents all of the simulation cases. We selected particular cases from the simulations in Section 2. First, we selected the four cases of 5-1, 5-4, 6-1, and 6-4, and to verify the algorithm operation according to permanent faults in the proximity of the generator and remote end, we applied 10% and 90% of each T/L, respectively.
The rest of the cases were chosen to verify a main function of the algorithm—adaptive leader-end reclosing—according to the fault locations, and the fault locations were selected based on the of each transmission line.
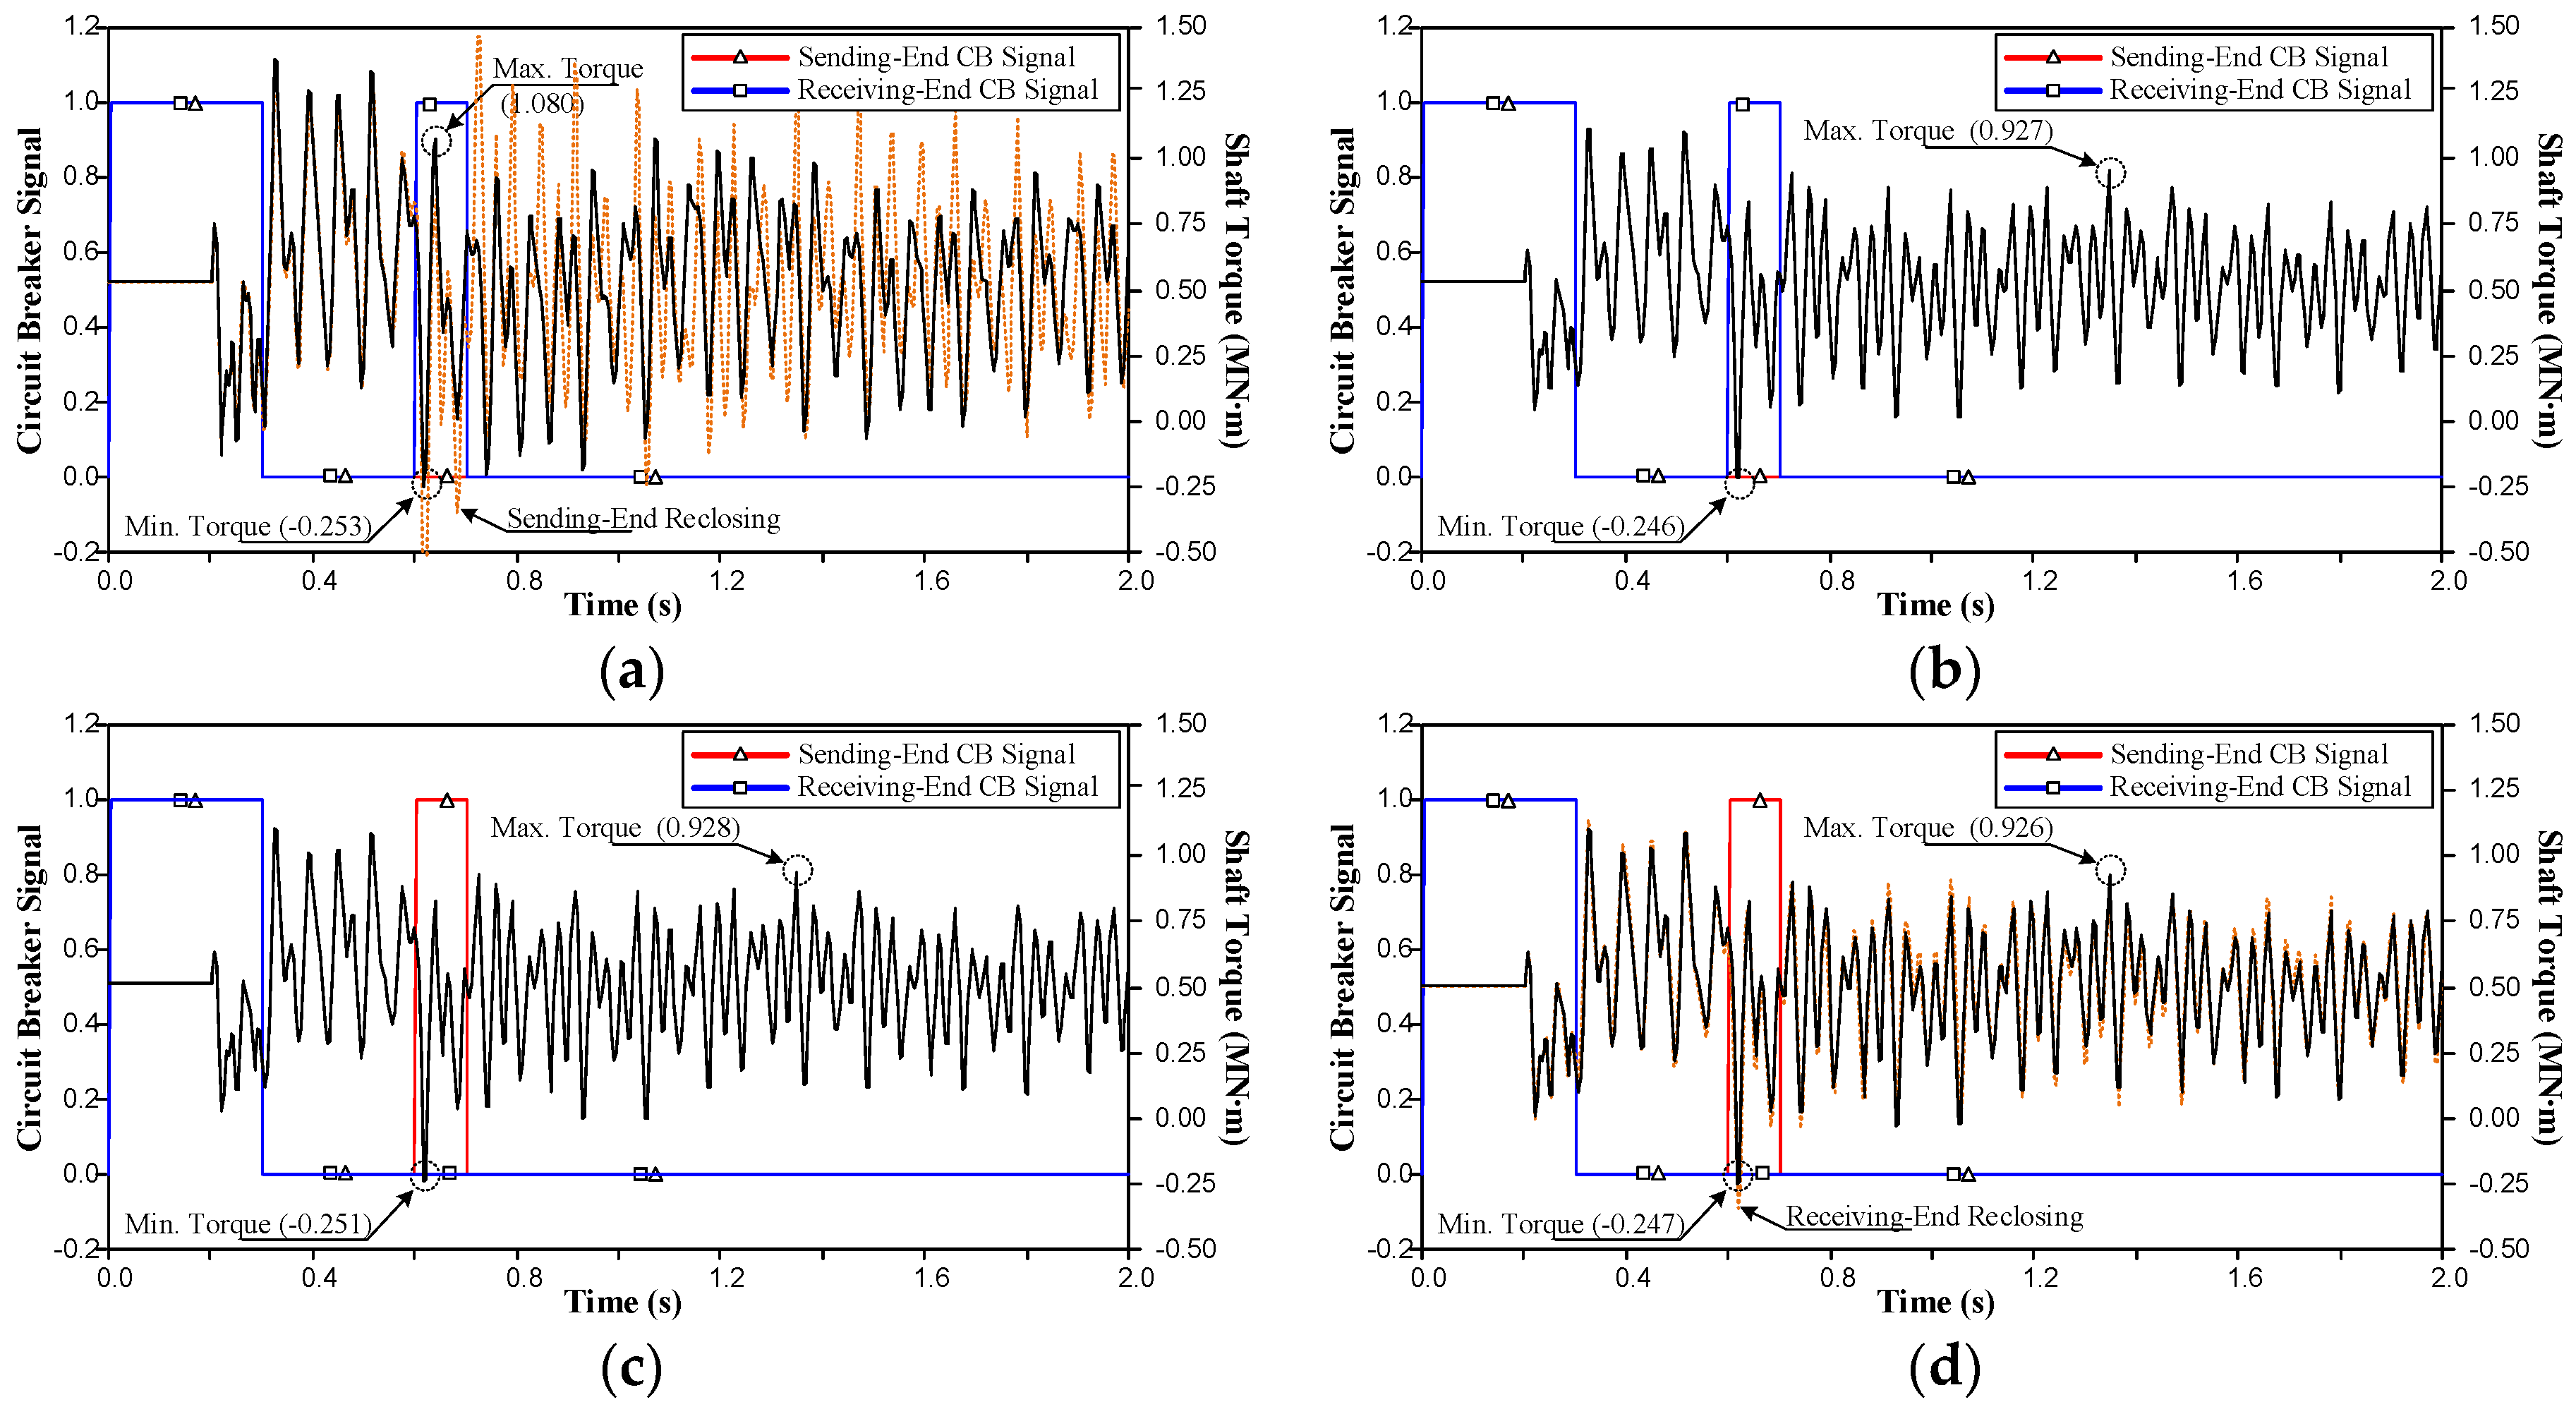
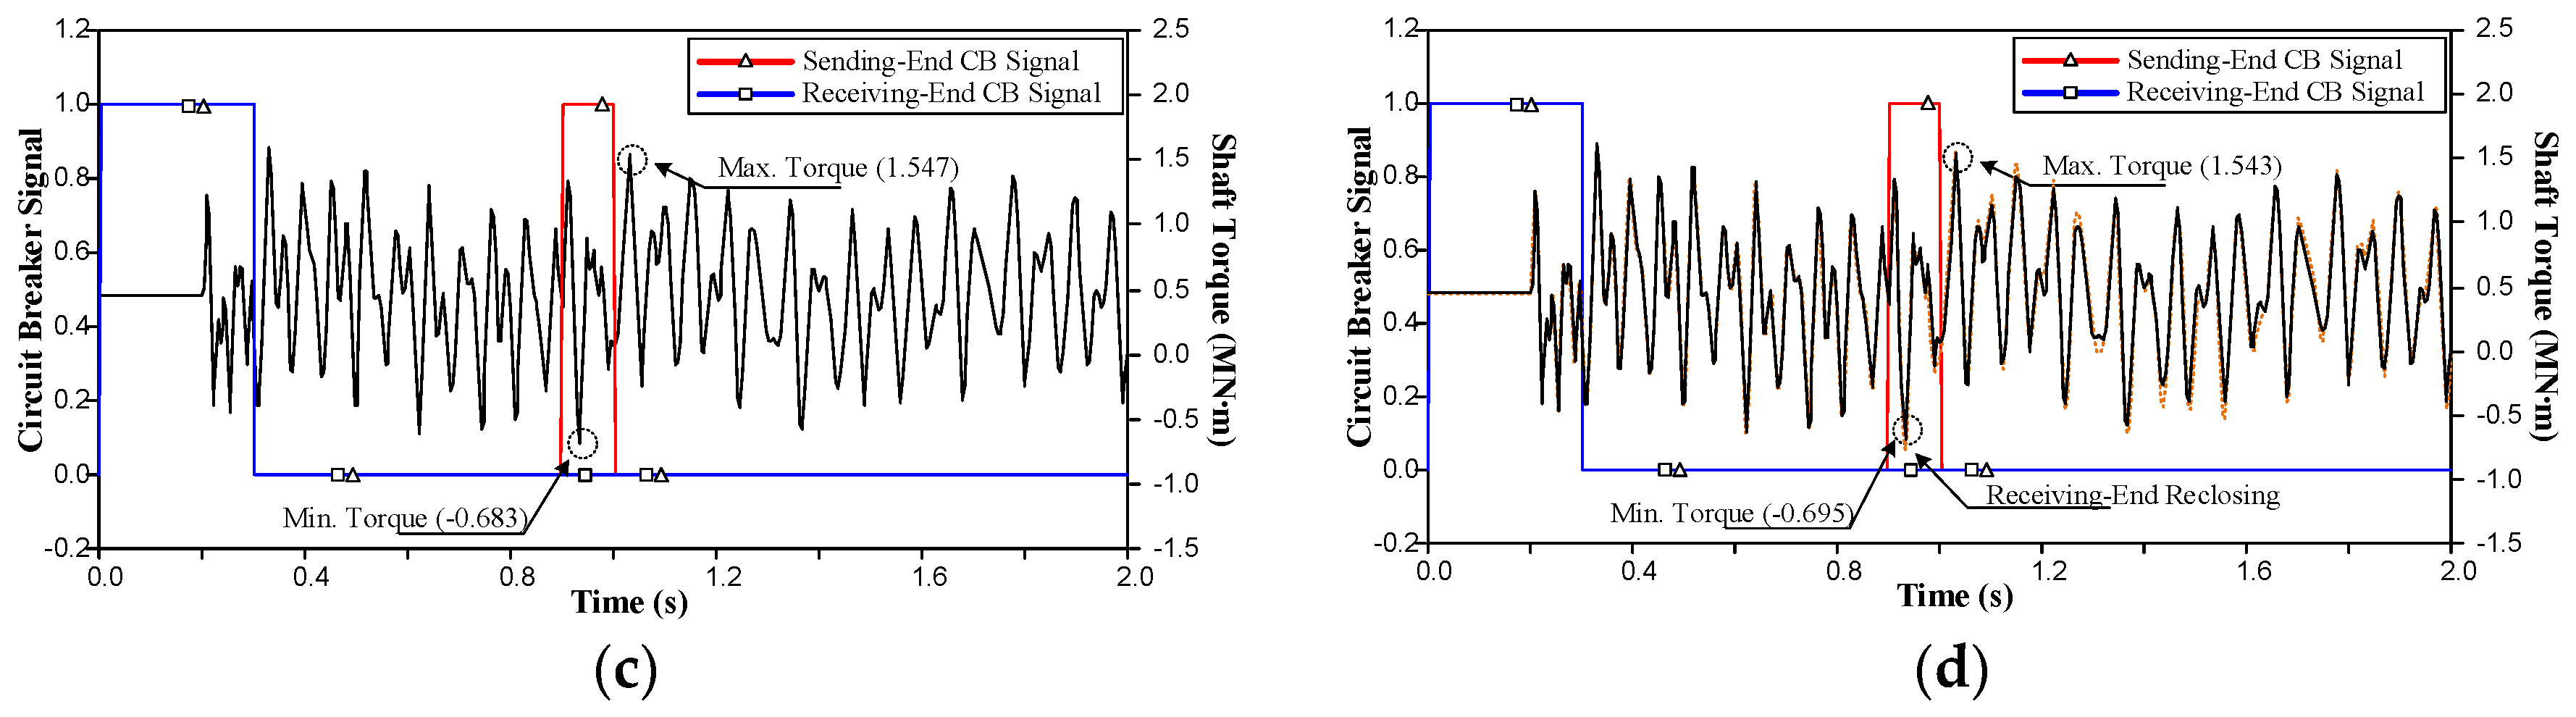
The simulation results of cases 5-1 and 5-2 are shown in Figure 7a,b, where the “circuit breaker signal” represents the instantaneous state of the CB. The value of “1” is for the signal to close the CB and “0” is for a tripping operation. Since both cases did not exceed the fault location of , the algorithm commanded the leader-end reclosing relay to reclose the receiving-end CB; additionally, subsequent CB re-tripping was operated according to a LBLL condition.
Peak-to-peak shaft torque is illustrated in Figure 7a,b, and while also referring to Table 2 and Table 4, it is possible to clearly see the use of the proposed algorithm to select the preferable leader-end reclosing in both figures. The shaft torque profile which is not a preferable leader-end reclosing case is also presented as a dotted line in Figure 7a to verify the performance of the algorithm.
The simulation results for case 5-3 and 5-4 are shown in Figure 7c,d. Since the fault locations of the these two cases exceeded the , the algorithm ordered the leader-end reclosing relay to operate the sending-end CB, and the subsequent CB re-tripping was operated according to the outcome of the LBLL condition check. Peak-to-peak shaft torques are also illustrated in each of the two figures. In Figure 7d, the shaft torque profile which is not a preferable leader-end reclosing case is also presented as a dotted line to verify the performance of the algorithm.
The simulation results for case 6-1 and case 6-2, corresponding to the 345 kV generation plant, are shown in Figure 8a,b. The receiving-end CB reclosed first for both case 6-1 and case 6-2 because both cases belonged to the fault locations below the , and sending-end-leader reclosing was selected for the other cases to reduce the impacts on the turbine shaft.
Through a comparison with Table 2 and Table 4, the Figure 8c,d for case 6-3 and 6-4 verifies that the proposed algorithm operated exactly in accordance with the fault location in all cases. In Figure 8a,d, it is also possible to compare the transient shaft torque profile in cases between the selection of the preferable leader-end reclosing, represented as a straight line, and unpreferable leader-end selection, shown as a dotted line.
6. Conclusions
In this paper, a leader-reclosing end selection algorithm for a leader-follower reclosing scheme is proposed to reduce turbine-generator shaft stress for reclosing into a permanent fault in transmission lines that are in the proximity of a generation plant. We simulated permanent faults in actual Korean 154 kV and 345 kV power systems and verified the effects of the leader-reclosing terminal selection on the turbine-generator shaft.
In general, the receiving-end leader reclosing attempt into the permanent fault subjected the turbine-generator to less mechanical stress compared with a sending-end leader reclosing attempt. In terms of the impact on the turbine-generator shaft, though, sending-end leader reclosing can be preferable in particular cases. Furthermore, since line impedance can change instantaneously upon reclosing depending on which leader end is reclosed first, fluctuation changed the generator active-power output following the leader-reclosing end selection. The difference of the generator output affected the turbine-generator shaft directly, so that the selection of the leader-end reclosing terminal affected the transient shaft torque in a different way. Finally, these phenomena were strongly affected by the permanent fault location.
We therefore propose a novel protection algorithm that selects the suitable leader reclosing end according to the permanent fault location. The operation of the algorithm is based on a predetermined fault-location reference that is used to select a preferable leader reclosing end. The DLL function of EMTP-RV was used to verify the algorithm in actual 154 kV and 345 kV power systems. Through this protection scheme that is applied to transmission lines in the proximity of generation plants, turbine-generator shafts are subject to less harmful stress—even in the case of a transmission line testing failure—during leader reclosing attempts for a permanent fault. It is therefore possible to prevent the cracking of the turbine-generator shaft that is caused by critical mechanical stress from accumulative, transient shaft torque.
Acknowledgments
This work was supported by the National Research Foundation of Korea (NRF) grant funded by the Korean government (MSIP) (No. 2015R1A2A1A10052459).
Author Contributions
Gyu-Jung Cho performed the simulation and developed the proposed algorithm; Ji-Kyung Park, Seung-Hyun Sohn, and Se-Jin Chung contributed in detailed modeling of the generator model in EMTP; Gi-Hyeon Gwon and Yun-Sik Oh contributed in DLL modeling in EMTP; Chul-Hwan Kim provided guidance in the overall simulation and writing. All authors reviewed and approved the manuscript.
Conflicts of Interest
The authors declare no conflict of interest.
Appendix A. Tables of Each Turbine-Generator Parameters

Table A1.
154 kV turbine-generator parameters.
| Rating | 2 Pole, 246 MVA, 3-Phase, 19.6 kV | ||
|---|---|---|---|
| Electrical Parameters | Reactance [p.u.] | ||
| Time Constant [s] | |||
| Mechanical Parameters | Moment of Inertia [] | HP = 380.609 | LPB = 3622.785 |
| IP = 637.580 | GEN = 3558.311 | ||
| LPA = 3517.856 | |||
| Spring Constant [] | HP-IP = 14.898 | LPA-LPB = 40.162 | |
| IP-LPA = 26.958 | LPB-GEN = 54.687 | ||
Table A2.
345 kV turbine-generator parameters.
| Rating | 2 Pole, 612 MVA, 3-Phase, 22 kV | ||
|---|---|---|---|
| Electrical Parameters | Reactance [p.u.] | ||
| Time Constant [s] | |||
| , | . | ||
| Mechanical Parameters | Moment of Inertia [. ] | HP = 773.61 | LPB = 7363.54 |
| IP = 1295.72 | GEN = 7232.66 | ||
| LPA = 7150.74 | |||
| Spring Constant [. ] | HP-IP = 30.281 | LPA-LPB = 81.634 | |
| IP-LPA = 54.794 | LPB-GEN = 111.158 | ||
References
- EPRI Solutions. Torsional Interaction between Electrical Network Phenomena and Turbine-Generator Shafts; EPRI Technical Report; EPRI: Palo Alto, CA, USA, 2006. [Google Scholar]
- Hammons, T.J.; Canay, I.M. Effect of damper modeling and the fault clearing process on response torque and stressing of turbine-generator shafts. IEEE Trans. Energy Convers. 1986, EC-1, 113–121. [Google Scholar] [CrossRef]
- Canay, I.M.; Rohrer, H.J.; Schnirel, K.E. Effect of electrical disturbances, grid recovery voltage and generator inertia on maximization of mechanical torques in large turbogenerator sets. IEEE Trans. Power Appar. Syst. 1980, PAS-99, 1357–1370. [Google Scholar]
- Hammons, T.J.; Chanal, L. Measurement of torque in steam turbine-generator shafts following severe disturbances on the electrical supply system-analysis and implementation. IEEE Trans. Energy Convers. 1991, 6, 193–203. [Google Scholar] [CrossRef]
- Oh, Y.S.; Seo, H.C.; Yang, J.J.; Kim, C.H. Development of a reclosing scheme for reduction of turbine generator shaft torsional torques: A decision method to achieve optimal reactor capacity. J. Electr. Eng. Technol. 2014, 9, 742–750. [Google Scholar] [CrossRef]
- IEEE Working Group. Effects of switching network disturbances on turbine-generator shaft systems. IEEE Trans. Power Appar. Syst. 1982, PAS-101, 3151–3157. [Google Scholar]
- Chyn, C.; Wu, R.-C.; Tsao, T.P. Torsional fatigue of turbine-generator shafts owing to network faults. IEE Proc. Gener. Transm. Distrib. 1996, 143, 479–486. [Google Scholar] [CrossRef]
- Abolins, A.; Lambrecht, D.; Joyce, J.S.; Rosenberg, L.T. Effect of clearing short circuits and automatic reclosing on torsional stress and life expenditure of turbine-generator shafts. IEEE Trans. Power Appar. Syst. 1976, PAS-95, 14–25. [Google Scholar] [CrossRef]
- Joyce, J.S.; Kulig, T.; Lambrecht, D. The impact of high-speed reclosure of single and multi-phase system faults on turbine-generator shaft torsional fatigue. IEEE Trans. Power Appar. Syst. 1980, PAS-99, 279–291. [Google Scholar] [CrossRef]
- Joyce, J.S.; Kulig, T.; Lambrecht, D. Torsional fatigue of turbine-generator shafts caused by different electrical system faults and switching operations. IEEE Trans. Power Appar. Syst. 1978, PAS-97, 1965–1977. [Google Scholar] [CrossRef]
- IEEE Power System Relaying Committee Working Group. Single phase tripping and auto reclosing of transmission lines IEEE committee report. IEEE Trans. Power Deliv. 1992, 7, 182–192. [Google Scholar]
- Ahn, S.P.; Kim, C.H.; Aggarwal, R.K.; Johns, A.T. An alternative approach to adaptive single pole auto-reclosing in high voltage transmission systems based on variable dead time control. IEEE Trans. Power Deliv. 2001, 16, 676–686. [Google Scholar] [CrossRef]
- Berdy, J.; Brown, P.G.; Andrichak, J.G.; Wilkinson, S.B. High-Speed Reclosing System and Machine Considerations. Available online: http://store.gedigitalenergy.com/faq/Documents/750_760/GER-3224.pdf (accessed on 2 March 2017).
- IEEE Guide for Automatic Reclosing of Circuit Breakers for AC Distribution and Transmission Lines; IEEE Std. C37.104; IEEE: New York, NY, USA, 2012.
- Anderson, P.M. Power System Protection, 1st ed.; Wiley-IEEE Press: Hoboken, NJ, USA, 1998. [Google Scholar]
- Sen, P.C. Principles of Electric Machines and Power Electronics, 3rd ed.; John Wiley & Sons Press: Chichester, UK, 1989. [Google Scholar]
- Myongji University and Korea Power eXchange. A Study on Establishment of Protective Relay Setting Rules; Final Report; Korea Power eXchange: Seoul, Korea, 2003. [Google Scholar]
- Jo, Y.H.; Xiang, L.; Choi, M.S.; Park, J.S.; Lim, S.I.; Kim, S.T.; Lee, S.J. A Fast Algorithm of the Apparent Factor Calculation for Distance Relay Setting without Fault Analysis. J. Electr. Eng. Technol. 2013, 8, 64–69. [Google Scholar] [CrossRef]
- Seyedi, H.; Behroozi, L. New distance relay compensation algorithm for double-circuit transmission line protection. IET Gener. Transm. Distrib. 2011, 5, 1011–1018. [Google Scholar] [CrossRef]
- Dubey, R.; Samantaray, S.R. Wavelet singular entropy-based symmetrical fault-detection and out-of-step protection during power swing. IET Gener. Transm. Distrib. 2013, 7, 1123–1134. [Google Scholar] [CrossRef]
- Ahn, Y.J. Distance Relay for Protection of Transmission Line Having Minimized Reactance Effect. U.S. Patent 06661630, 9 December 2003. [Google Scholar]
- Janne, A.; Ari, W. System and Method for Determining Location of Phase-to-Earth Fault. U.S. Patent US7514933 B2, 7 April 2009. [Google Scholar]
- Mahseredjian, J. DLL Programming in EMTP (EMTP-EMTPWorks Help Files); Powersys: Le Puy-Sainte-Réparade, France, 2012; pp. 1–24. [Google Scholar]
Figure 1.
Sequence of the leader-follower auto-reclosing scheme.
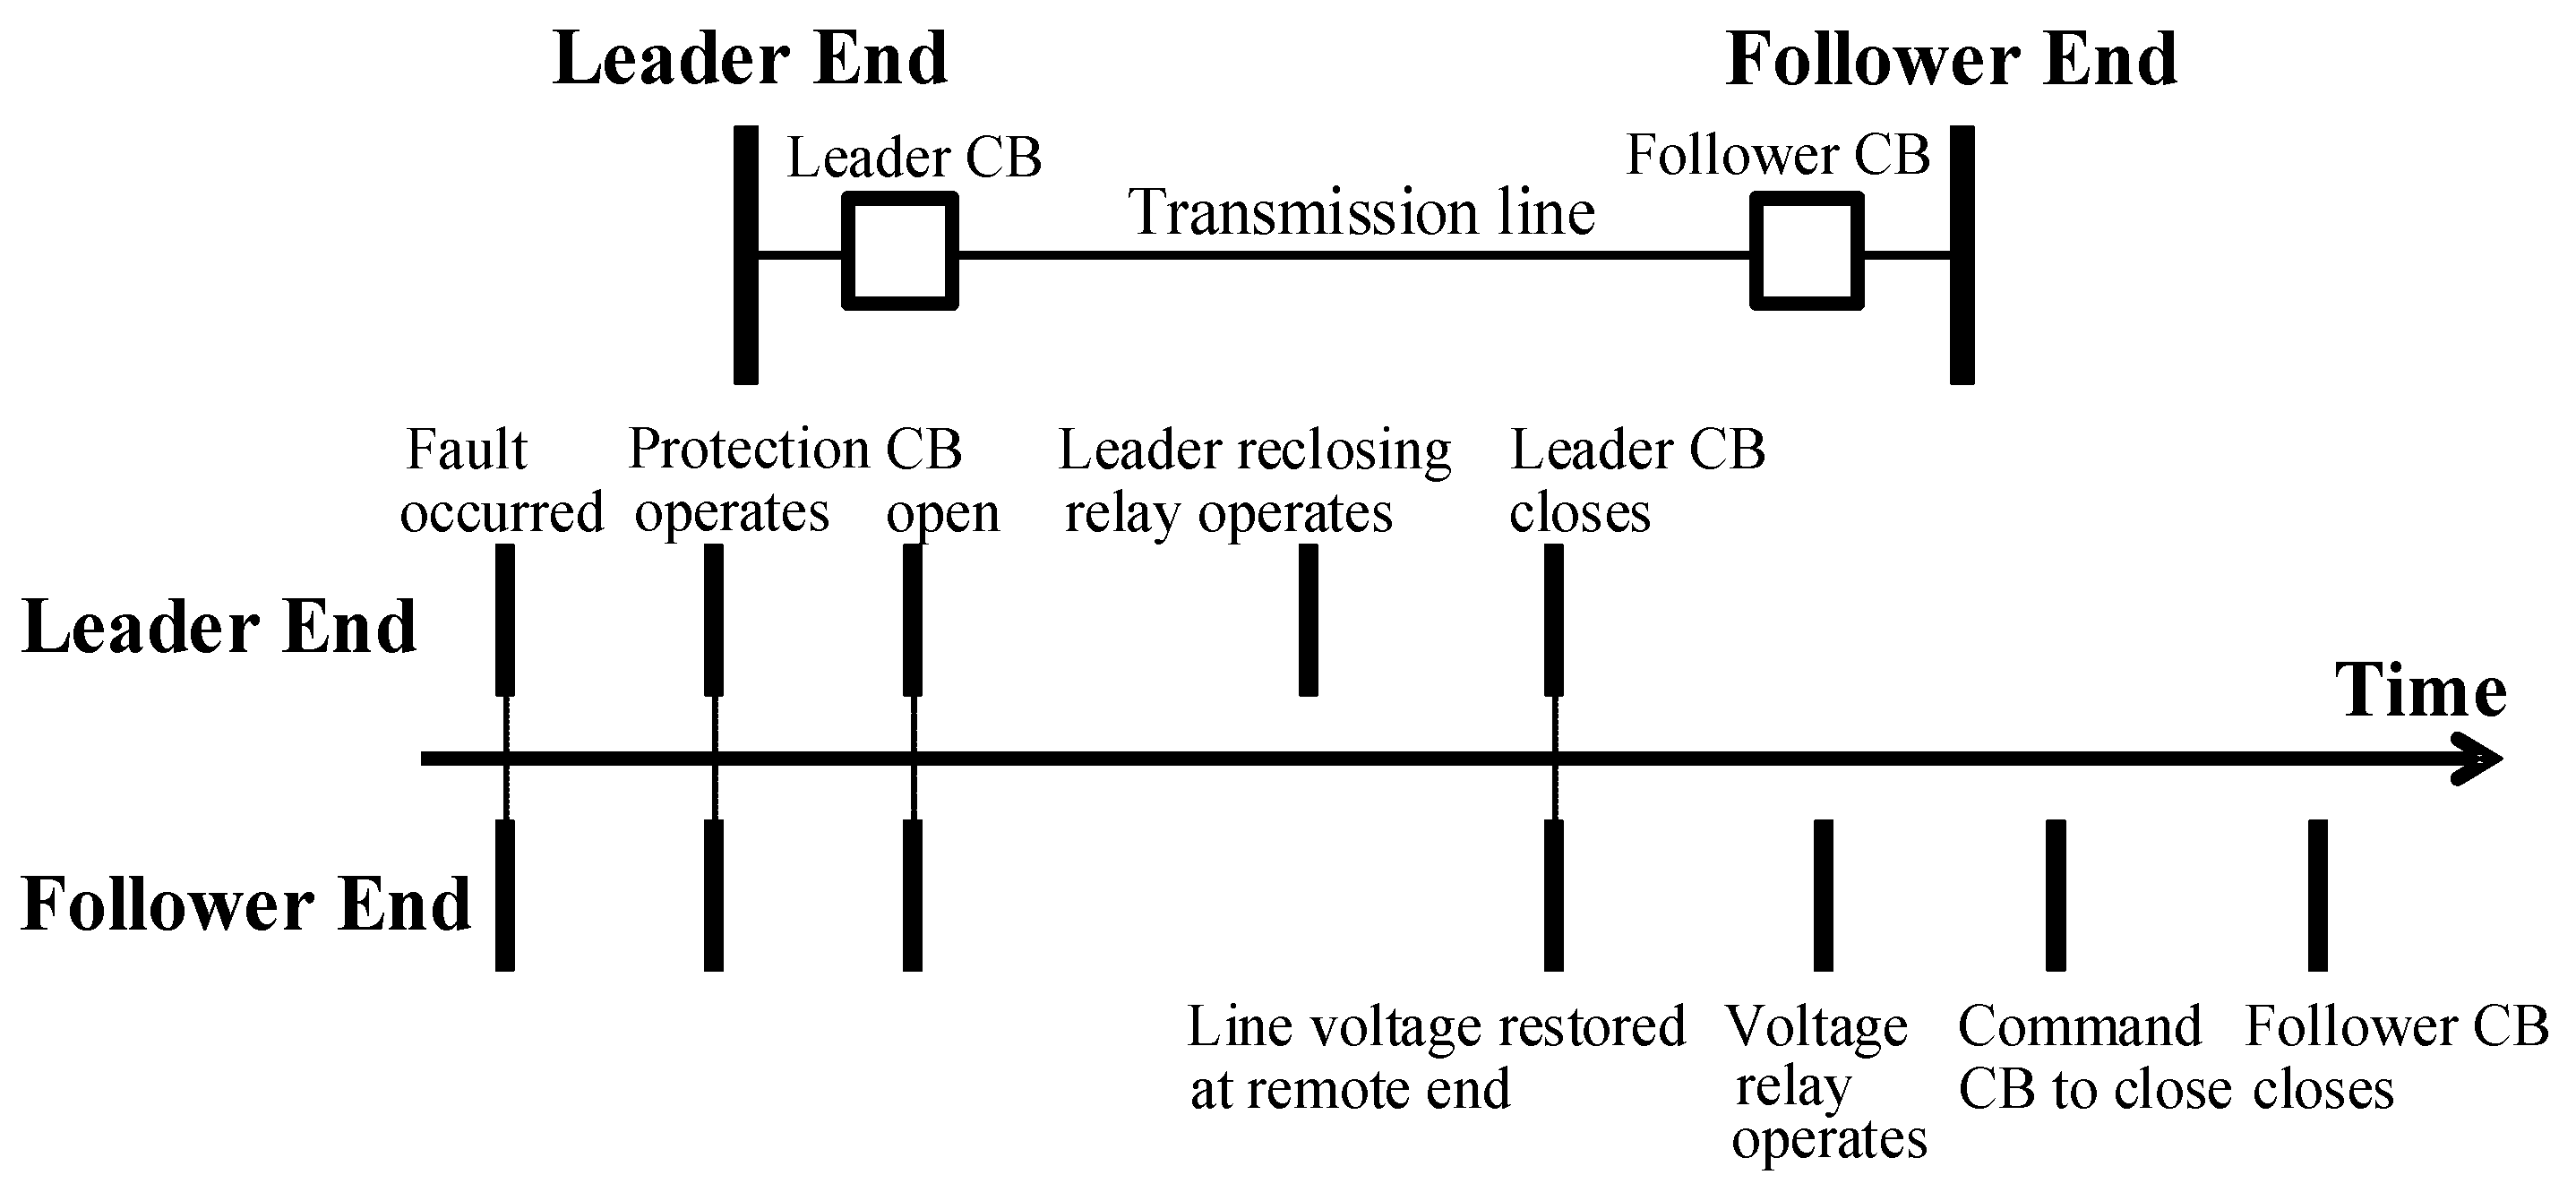
Figure 2.
Single-line diagram of the transmission system: (a) Single-line diagram of the 154 kV transmission system; (b) Single-line diagram of the 345 kV transmission system.
Figure 2.
Single-line diagram of the transmission system: (a) Single-line diagram of the 154 kV transmission system; (b) Single-line diagram of the 345 kV transmission system.
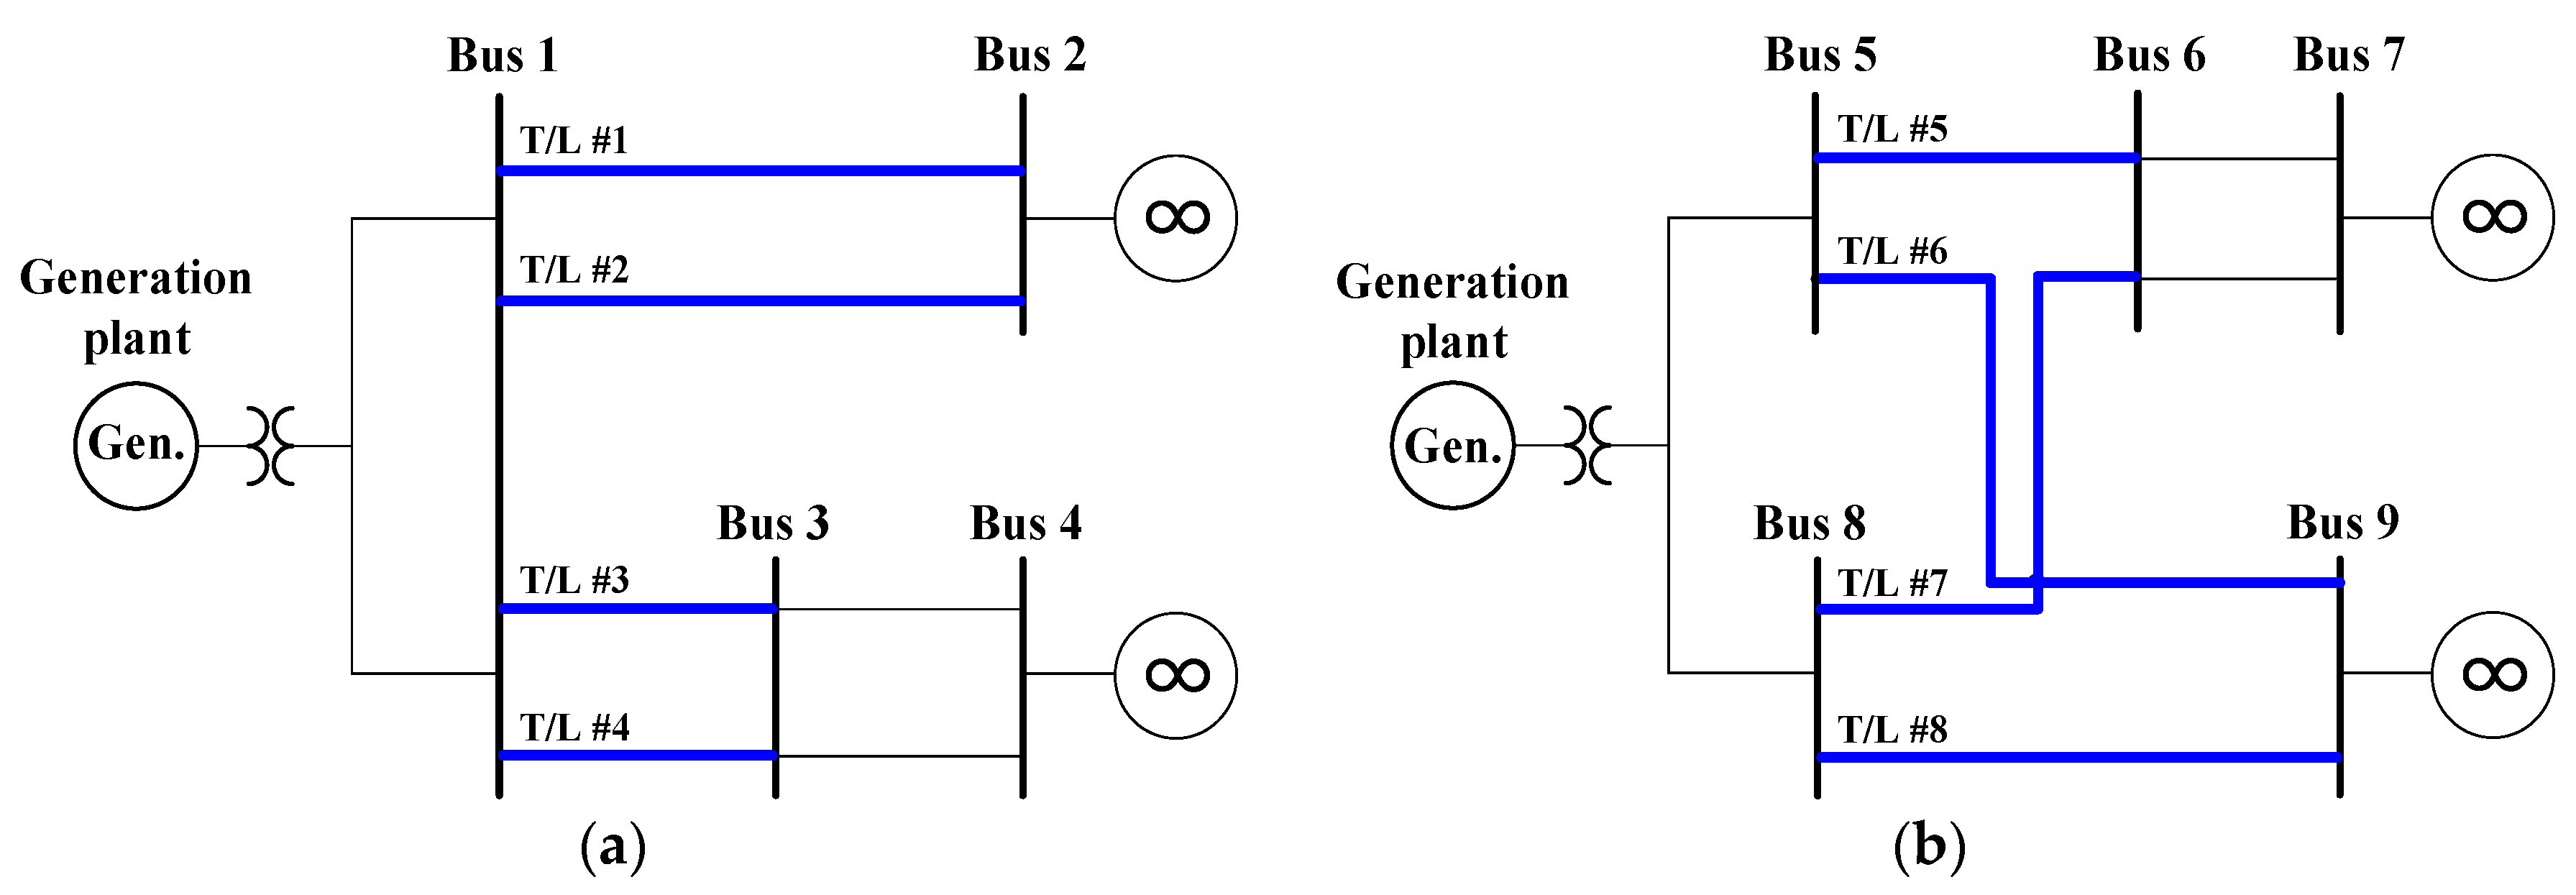
Figure 3.
Turbine-generator segments and electrical equivalent circuit: (a) Segments of the turbine-generator; (b) Current-source equivalent circuit for the synchronous generator.
Figure 3.
Turbine-generator segments and electrical equivalent circuit: (a) Segments of the turbine-generator; (b) Current-source equivalent circuit for the synchronous generator.

Figure 4.
Circuit-breaker operation sequence.
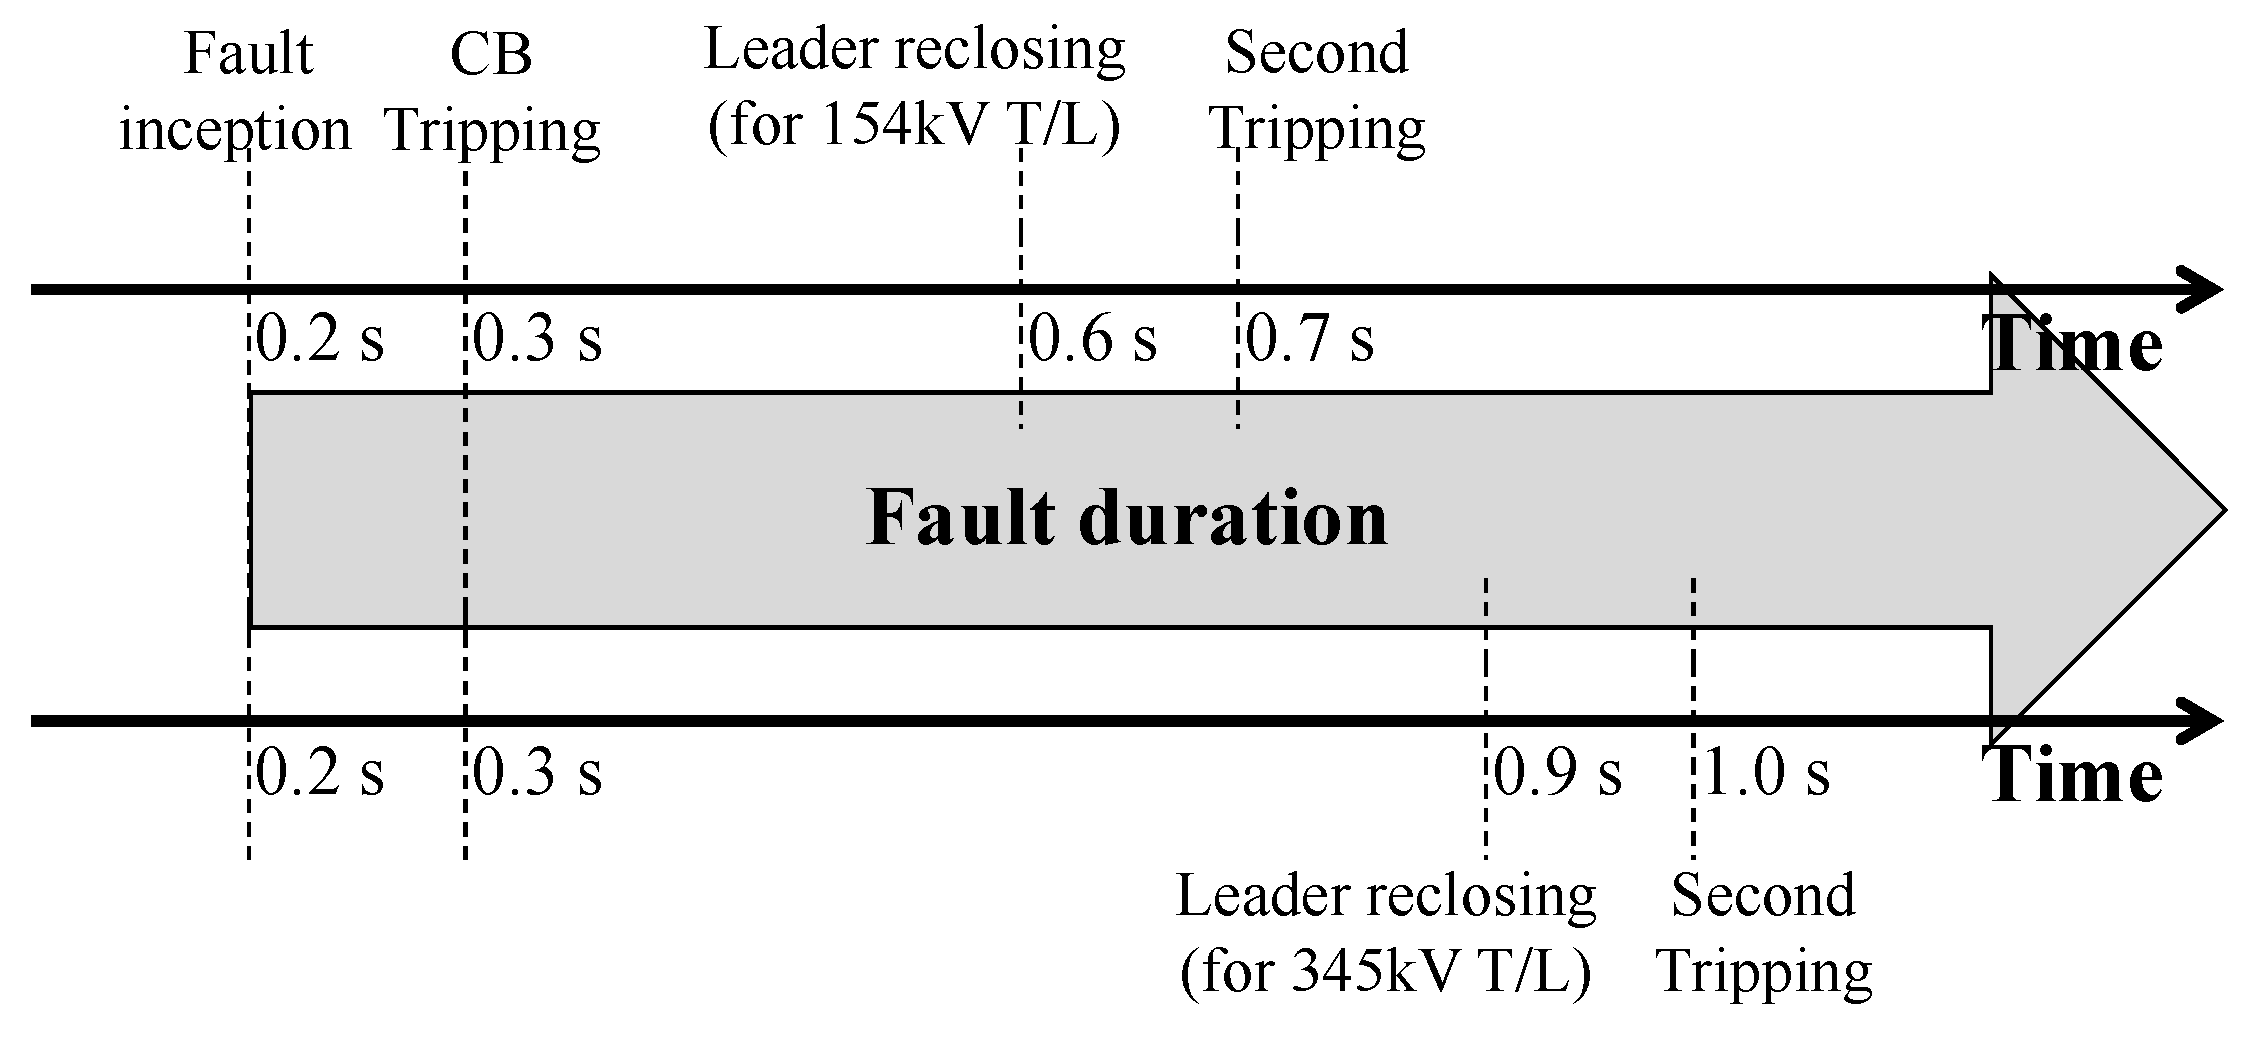
Figure 5.
LPB-GEN shaft torque vibration of the 154 kV generator and power output caused by circuit-breaker operation followed by the 3-phase fault: (a) Transient shaft torque for case 1-3 (T/L #3); (b) Transient shaft torque for case 3-2 (T/L #6); (c) Transient power output for case 1-3 (T/L #3); (d) Transient power output for case 3-2 (T/L #6).

Figure 6.
Flowchart of the proposed algorithm and the relationship between the DLL code and EMTP program: (a) Flowchart of the leader-end-reclosing algorithm for the permanent fault; (b) Request-participation relationship between the core code and device models in EMTP-RV [23].
Figure 6.
Flowchart of the proposed algorithm and the relationship between the DLL code and EMTP program: (a) Flowchart of the leader-end-reclosing algorithm for the permanent fault; (b) Request-participation relationship between the core code and device models in EMTP-RV [23].

Figure 7.
Circuit breaker operation signal and instantaneous shaft torque waveform: (a) for case 5-1 (10% of T/L #3); (b) for case 5-2 (83% of T/L #3); (c) for case 5-3 (84% of T/L #3); (d) for case 5-4 (90% of T/L #3).
Figure 7.
Circuit breaker operation signal and instantaneous shaft torque waveform: (a) for case 5-1 (10% of T/L #3); (b) for case 5-2 (83% of T/L #3); (c) for case 5-3 (84% of T/L #3); (d) for case 5-4 (90% of T/L #3).

Figure 8.
Circuit breaker operation signal and instantaneous shaft torque waveform: (a) for case 6-1 (10% of T/L #6); (b) for case 6-2 (87% of T/L #6); (c) for case 6-3 (88% of T/L #6); (d) for case 6-4 (90% of T/L #6).
Figure 8.
Circuit breaker operation signal and instantaneous shaft torque waveform: (a) for case 6-1 (10% of T/L #6); (b) for case 6-2 (87% of T/L #6); (c) for case 6-3 (88% of T/L #6); (d) for case 6-4 (90% of T/L #6).
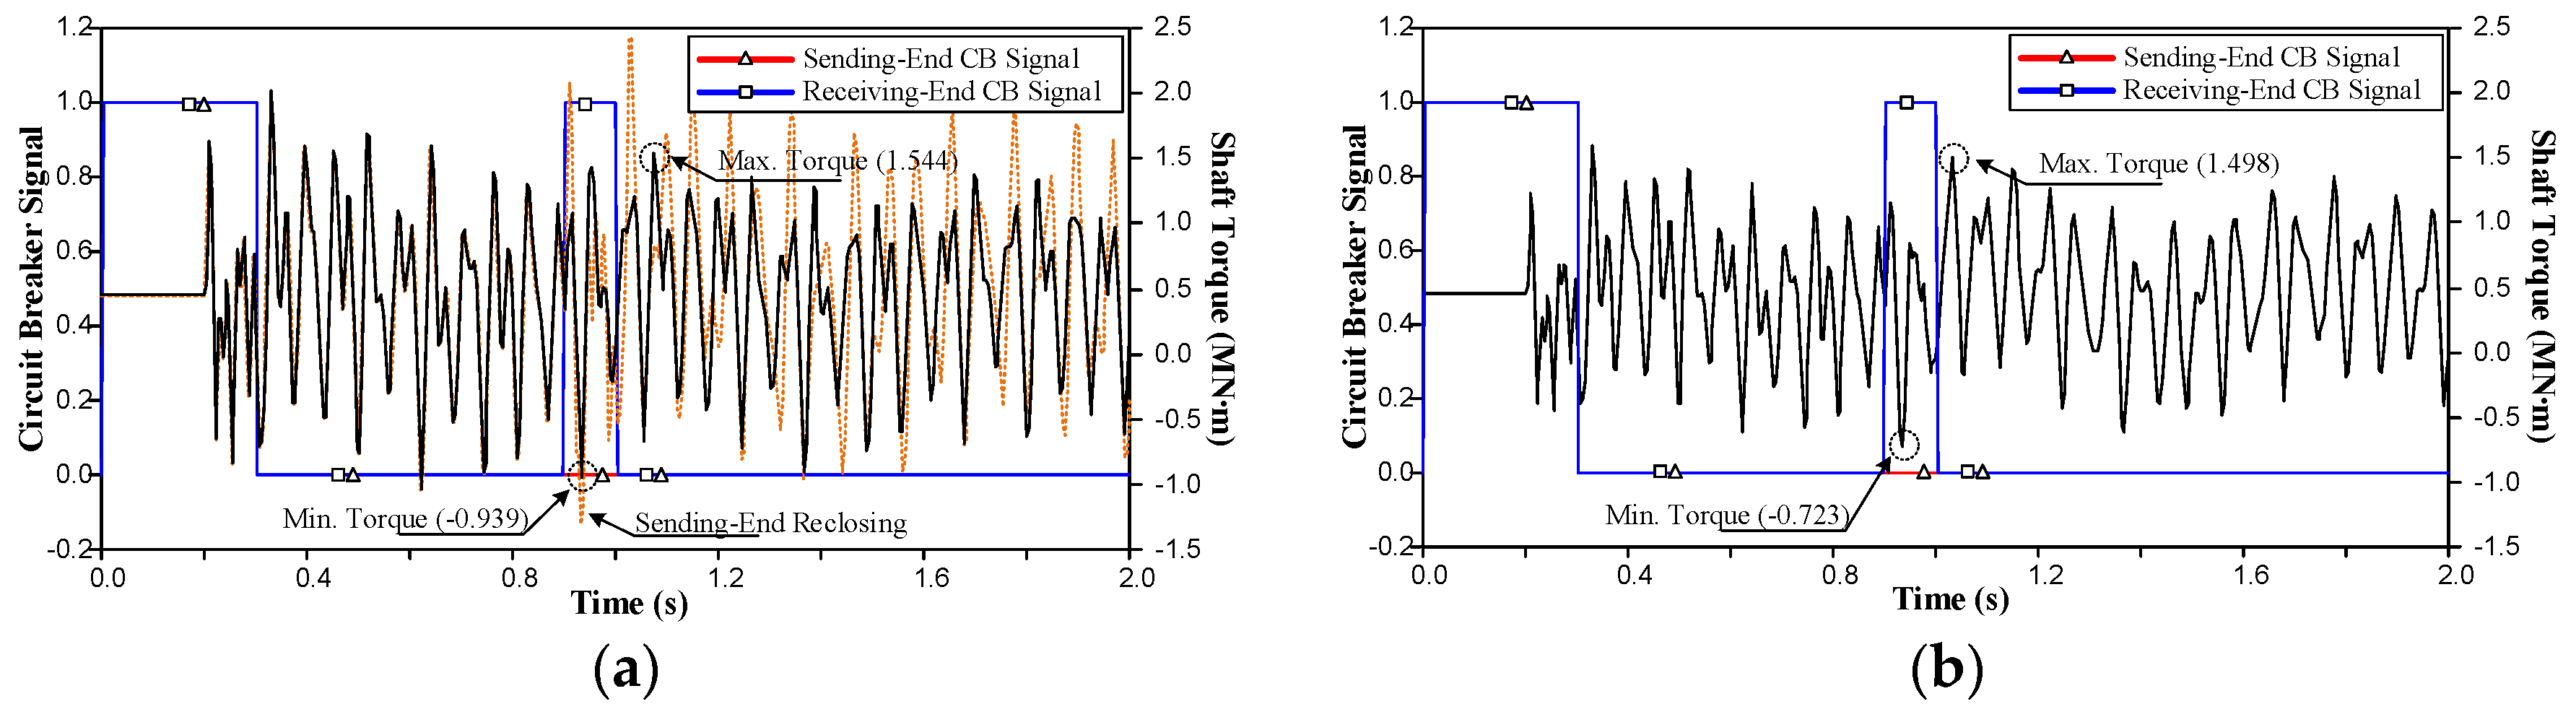

Table 1.
Simulation cases.
| Case | Voltage Level | Faulted Line | Fault Type | Fault Location | |
|---|---|---|---|---|---|
| 1 | 1-1 | 154 kV | T/L #1 | 3-phase permanent Fault | 10% 50% 90% of each T/L |
| 1-2 | T/L #2 | ||||
| 1-3 | T/L #3 | ||||
| 1-4 | T/L #4 | ||||
| 2 | 2-1 | T/L #1 | single-phase permanent Fault | ||
| 2-2 | T/L #2 | ||||
| 2-3 | T/L #3 | ||||
| 2-4 | T/L #4 | ||||
| 3 | 3-1 | 345 kV | T/L #5 | 3-phase permanent Fault | |
| 3-2 | T/L #6 | ||||
| 3-3 | T/L #7 | ||||
| 3-4 | T/L #8 | ||||
| 4 | 4-1 | T/L #5 | single-phase permanent Fault | ||
| 4-2 | T/L #6 | ||||
| 4-3 | T/L #7 | ||||
| 4-4 | T/L #8 | ||||
Table 2.
Simulation result according to the 3-phase fault.
| Fault Location [%] | Peak-to-Peak Shaft Torque [MNm] | |||||||
|---|---|---|---|---|---|---|---|---|
| Case 1-1 | Case 1-2 | Case 1-3 | Case 1-4 | |||||
| S | R | S | R | S | R | S | R | |
| 10 | 2.103 | 1.272 | 2.103 | 1.272 | 2.188 | 1.300 | 2.188 | 1.300 |
| 50 | 1.278 | 0.910 | 1.278 | 0.910 | 1.418 | 1.016 | 1.418 | 1.016 |
| 90 | 1.025 | 1.021 | 1.025 | 1.021 | 1.173 | 1.270 | 1.173 | 1.270 |
| Case 3-1 | Case 3-2 | Case 3-3 | Case 3-4 | |||||
| 10 | 3.801 | 2.539 | 3.655 | 2.564 | 3.739 | 2.483 | 3.596 | 2.517 |
| 50 | 2.710 | 1.922 | 2.603 | 1.874 | 2.543 | 1.817 | 2.440 | 1.760 |
| 90 | 2.322 | 2.151 | 2.211 | 2.005 | 2.239 | 2.327 | 2.120 | 2.171 |
Table 3.
Simulation result with respect to the single-phase fault.
| Fault Location [%] | Peak-to-Peak Shaft Torque [MNm] | |||||||
|---|---|---|---|---|---|---|---|---|
| Case 2-1 | Case 2-2 | Case 2-3 | Case 2-4 | |||||
| S | R | S | R | S | R | S | R | |
| 10 | 0.535 | 0.324 | 0.535 | 0.324 | 0.540 | 0.321 | 0.540 | 0.321 |
| 50 | 0.277 | 0.205 | 0.277 | 0.205 | 0.287 | 0.208 | 0.287 | 0.208 |
| 90 | 0.213 | 0.202 | 0.213 | 0.202 | 0.228 | 0.233 | 0.228 | 0.233 |
| Case 4-1 | Case 4-2 | Case 4-3 | Case 4-4 | |||||
| 10 | 0.937 | 0.588 | 0.903 | 0.570 | 1.068 | 0.672 | 1.016 | 0.648 |
| 50 | 0.482 | 0.338 | 0.453 | 0.330 | 0.502 | 0.351 | 0.453 | 0.325 |
| 90 | 0.364 | 0.328 | 0.364 | 0.373 | 0.367 | 0.321 | 0.351 | 0.349 |
Table 4.
Results of additional simulations according to the leader end.
| Fault Location [%] | Peak-to-Peak Shaft Torque [MNm] | |||
|---|---|---|---|---|
| T/L #3 of 154 kV System | T/L #4 of 154 kV System | |||
| S | R | S | R | |
| 81% of T/L | 1.186 | 1.154 | 1.186 | 1.154 |
| 82% of T/L | 1.183 | 1.164 | 1.183 | 1.164 |
| 83% of T/L | 1.181 | 1.173 | 1.181 | 1.173 |
| 84% of T/L | 1.179 | 1.183 | 1.179 | 1.183 |
| 85% of T/L | 1.178 | 1.194 | 1.178 | 1.194 |
| T/L #6 of 345 kV System | T/L #8 of 345 kV System | |||
| 85% of T/L | 2.224 | 2.161 | 2.114 | 2.013 |
| 86% of T/L | 2.226 | 2.192 | 2.114 | 2.041 |
| 87% of T/L | 2.229 | 2.223 | 2.116 | 2.070 |
| 88% of T/L | 2.231 | 2.255 | 2.116 | 2.103 |
| 89% of T/L | 2.234 | 2.289 | 2.117 | 2.137 |
Table 5.
Simulation cases for verification of the algorithm.
| Case | Fault Type | Transmission Line and “” | Fault Location [%] | |
|---|---|---|---|---|
| 5 | 5-1 | 3-Phase Permanent Fault | T/L #3 of the 154 kV System “” = 84% | 10 |
| 5-2 | 83 | |||
| 5-3 | 84 | |||
| 5-4 | 90 | |||
| 6 | 6-1 | 3-Phase Permanent Fault | T/L #6 of the 345 kV System “” = 88% | 10 |
| 6-2 | 87 | |||
| 6-3 | 88 | |||
| 6-4 | 90 | |||
© 2017 by the authors. Licensee MDPI, Basel, Switzerland. This article is an open access article distributed under the terms and conditions of the Creative Commons Attribution (CC BY) license (http://creativecommons.org/licenses/by/4.0/).
Share and Cite
MDPI and ACS Style
Cho, G.-J.; Park, J.-K.; Sohn, S.-H.; Chung, S.-J.; Gwon, G.-H.; Oh, Y.-S.; Kim, C.-H. Development of a Leader-End Reclosing Algorithm Considering Turbine-Generator Shaft Torque. Energies 2017, 10, 622. https://doi.org/10.3390/en10050622
AMA Style
Cho G-J, Park J-K, Sohn S-H, Chung S-J, Gwon G-H, Oh Y-S, Kim C-H. Development of a Leader-End Reclosing Algorithm Considering Turbine-Generator Shaft Torque. Energies. 2017; 10(5):622. https://doi.org/10.3390/en10050622
Chicago/Turabian StyleCho, Gyu-Jung, Ji-Kyung Park, Seung-Hyun Sohn, Se-Jin Chung, Gi-Hyeon Gwon, Yun-Sik Oh, and Chul-Hwan Kim. 2017. "Development of a Leader-End Reclosing Algorithm Considering Turbine-Generator Shaft Torque" Energies 10, no. 5: 622. https://doi.org/10.3390/en10050622
Note that from the first issue of 2016, this journal uses article numbers instead of page numbers. See further details here.