Article

Theoretical and Experimental Evaluation of the Temperature Distribution in a Dry Type Air Core Smoothing Reactor of HVDC Station

1
School of Electrical Engineering, Wuhan University, Wuhan 430072, China
2
Kunming Bureau of Extra-High Voltage Power Transmission Company, China Southern Power Grid, Kunming 650217, China
*
Author to whom correspondence should be addressed.
Energies 2017, 10(5), 623; https://doi.org/10.3390/en10050623
Submission received: 17 March 2017 / Revised: 19 April 2017 / Accepted: 26 April 2017 / Published: 3 May 2017
(This article belongs to the Section F: Electrical Engineering)

Abstract

:
The outdoor ultra-high voltage (UHV) dry-type air-core smoothing reactors (DASR) of High Voltage Direct Current systems are equipped with a rain cover and an acoustic enclosure. To study the convective heat transfer between the DASR and the surrounding air, this paper presents a coupled model of the temperature and fluid field based on the structural features and cooling manner. The resistive losses of encapsulations calculated by finite element method (FEM) were used as heat sources in the thermal analysis. The steady fluid and thermal field of the 3-D reactor model were solved by the finite volume method (FVM), and the temperature distribution characteristics of the reactor were obtained. Subsequently, the axial and radial temperature distributions of encapsulation were investigated separately. Finally, an optical fiber temperature measurement scheme was used for an UHV DASR under natural convection conditions. Comparative analysis showed that the simulation results are in good agreement with the experimental data, which verifies the rationality and accuracy of the numerical calculation. These results can serve as a reference for the optimal design and maintenance of UHV DASRs.

1. Introduction

Dry-type air-core smoothing reactors (DASR) are primary inductive devices used in ultra-high-voltage direct current (UHVDC) lines for their high linearity, low running-noise, and simple structures. DASRs function as harmonic filtration and short-circuit current limiters in an UHVDC system [1]. Temperature distribution and thermal stability are two critical parameters for long-term operation. For ultra-high-voltage (UHV) applications, the thermal stability and environmental protection requirements of DASRs are stringent. When a DASR is operated outdoors, a rain cover and an acoustic enclosure are used to protect it from aging caused by weather phenomena and increasing noise levels. Such installations limit the convective heat transfer between the DASR and the air and thus may cause overheating. If local overheating occurs, the device lifetime will be reduced. Therefore, the temperature distribution characteristics of UHV DASRs are critical for optimal design and temperature rise monitoring.
Early studies of reactors mainly focused on the electromagnetic environment, such as calculation, measurement and shielding of magnetic fields [2,3,4,5]. With the rapid development of numerical methods and computer performance, research on smoothing reactors is becoming more and more detailed, the loss and temperature distribution of reactor have also become research hotspots [6,7,8,9,10,11,12].
Conventionally, an empirical formula was often used to calculate the average temperature rise of DASRs, but the concept of average temperature rise was not clear. The highest temperature was likely to exceed the maximum allowable temperature of any insulating material used, when the average temperature meets the standard limit. The finite element method was used to calculate the temperature field distribution with the convection coefficient obtained by the Nusselt number [13]. However, the convection coefficient obtained by using the Nusselt number was also not accurate enough, and the calculated values and the measured values might have large differences.
DASRs dissipate heat through natural convection. The primary heat source consists of resistance losses and eddy current losses. Liu et al. [11] calculated the heat source of encapsulations and the temperature distribution in the reactor with a field-circuit and fluid-solid coupling model, and the simulation results agreed well with the test data. Wang et al. [12] studied the impact of structural parameters of the noise reducing cover on the temperature rise characteristics, and some optimization was conducted. The UHV DASR has a complex structure and encapsulations, which makes it difficult to establish and solve the three-dimensional temperature field model.
In recent years, coupling simulation of the temperature field of electric devices has attracted increasing attention from scholars, which could provide a frame of reference for research on UHVDC DASRs. A magnetothermal finite element method (FEM) was used to calculate the temperature rise of an extra-high-voltage GIS bus bar [14]. The solid-surface convection heat-transfer coefficients were calculated from the Nusselt number, and closely matched the measurements. A study combining computational fluid dynamics (CFD) with parallel computing was performed to analyze conjugate heat transfer in natural convection in dry-type transformers [15]. By CFD and with an electromagnetic coupled model, Smolka and Nowak incorporated a genetic algorithm into CFD to realize the shape optimization of coils and cooling ducts in dry-type transformers [16]. Li et al. [17] combined numerical and analytical calculations to determine the heat transfer coefficients on rotor surfaces, and calculated and analyzed the 3D temperature field of large hydro-generator rotor excitation windings. Ahn et al. [18] coupled thermal fields with electromagnetic and fluid fields, calculating the temperature rise with consideration for the temperature-dependent properties of the material and eddy loss. Deng et al. conducted temperature rise simulations of a five-encapsulation air-core reactor, examining the relationship between air velocity and hot-spot temperature rise under forced air-cooled conditions [19]. At present, for the temperature field calculation of DASR, most existing studies have used a 2D model, ignoring the changes in radial variation of temperature, which is different from reality.
The abovementioned studies have established a foundation for research on UHVDC DASRs. To accurately determine the 3-D temperature field distribution of a DASR with rain cover and acoustic enclosure, a finite volume method (FVM) was employed to calculate the fluid and thermal field by coupled analysis, thereby discerning the distribution properties of the temperature field. The results of simulations and tests can provide a reference for monitoring and supervising temperature rises and verifying the thermal stability of UHV DASRs.
±800 kV-UHVDC DASRs are selected as the research objects of this paper. According to the fundamental theory of numerical heat transfer, a mathematical model was established to solve the steady state of coupling fluid and thermal field. Section 2 describes the structure of the air-core reactor. The calculation model takes into account the impact of the border rain cover and acoustic enclosure. On the basis of heat sources and boundary conditions, the temperature and fluid fields inner reactor were calculated by using FVM. In Section 3, analysis of the temperature distributions of the reactor is provided, focusing on the axial and radial temperature distributions of the encapsulation. In Section 4, an optical fiber system is employed to test the temperature rise of a DASR. Comparison analysis revealed that the calculation and testing results were consistent, verifying the accuracy of the solution method. Finally, the conclusions are presented in Section 5.

2. Methods

2.1. Governing Equations

UHV DASRs dissipate heat through natural convection, and heat transfer between the reactor and air satisfies the heat convection equation. Air flow and heat transfer follow the fundamental physic rules: law of conservation of mass, momentum, and energy [20].
Air in the reactor could be considered as an incompressible fluid, and the flowing air satisfies the law of conservation of mass [20]:
( ρ u ) x + ( ρ v ) y + ( ρ w ) z = 0
where ρ is the density of the fluid, kg/m3, u, v, w are vectors of airflow velocity in Cartesian coordinates, m/s.
The fluid flow is determined by the law of momentum conservation, which satisfies the steady state conditions of the 3D Navier-Stokes equations [20]:
{ div ( u U ) = div ( υ grad u ) 1 ρ p x div ( v U ) = div ( υ grad v ) 1 ρ p y div ( w U ) = div ( υ grad w ) 1 ρ p z
where υ is the fluid kinematic viscosity, m2/s; U is the vectors of fluid velocity, m/s; p is the fluid pressure, in Pa.
Heat exchange of fluids satisfies the law of energy conservation [20]:
div ( U T f ) = div ( λ ρ c p grad T f ) + S T ρ
where λ is the thermal conductivity, W/(m·K); Cp is specific heat, J/(kg·K); ST is a fluid source term.
According to heat transfer theory, the boundary conditions of the three-dimensional steady temperature field in the reactor are [21]:
{ x ( λ x T s x ) + y ( λ y T s y ) + z ( λ z T s z ) + Q V = 0 T s n | A j = 0 h ( T s T f ) + λ T s n | A s = 0
where Ts, Tf is the solid and fluid temperature, K; λx, λy, λz are the thermal conductivity of materials in the x, y, and z direction, respectively, W/(m·K); QV is the heat generation rate of unit volume, W/m3; h is the heat transfer coefficient of the solid surface, W/(m2·K). Aj, As are separately the adiabatic surface and heat-dissipating surface.

2.2. Basic Parameters

A ±800 kV-DASR with rated inductance of 75 mH and rated current of 3125 A, is used as an example. For long time running, the maximum current is 3461 A. Moreover, the 2-h overload current can be up to 3795 A, and the very short time overcurrent can be 20 kA. Under normal operation, the rated loss, average temperature rise, and the hot-spot temperature rise should be less than 235 kW, 70 K, and 90 K, respectively.
The DASR was composed of a main body, an oblique support platform, a grading ring, and other connectors. The oblique support platform could increase the reactor’s antiseismic performance. The main body of the reactor consisted of 21 layers of coaxial encapsulations and other components, including spacers, a rain cover, an acoustic enclosure, a silencer, spider arms, and braces. Figure 1 depicts the main body and the model structure. The upper and lower spider arms were used as the inlet and outlet terminals of current in the encapsulation, bolstering the mechanical strength of the reactor. Formed by extrusions of unsaturated polyester, spacers were distributed radially in each encapsulation layer to transfer heat through natural convection cooling in the reactor. The winding wires in the encapsulation were bundled, lightweight, transposed aluminum cables coated with polyester films, which enable inter-turn insulation, thereby effectively reducing eddy current losses between parallel windings. Epoxy-glass was used for insulation between the windings.

2.3. Hypothetical Conditions

The main body of the ±800 kV-DASR presents a complex structure, with 21 encapsulation layers, thus exhibiting a great disparity between the height and the thickness. The encapsulation height was 3.85 m, and the maximal radial thickness was 38 mm, thereby making mesh generation more difficult during computation. Because the spider arms and braces were small and thin, their obstruction to cooling air was limited. Thus, the effect of the spider arms, braces, and spacers were ignored in modeling. The computational model was simplified to a 1/4 circumferential region to facilitate mesh generation. Subsequently, the coupling fluid and thermal field of DASR in natural convection was simulated. According to the convection structure and natural cooling method, the following hypothetical conditions were proposed:
(1)
This research focuses on the temperature rise in the encapsulation of the main body of the reactor. The calculation was aimed to examine the air flow and temperature distribution in the reactor.
(2)
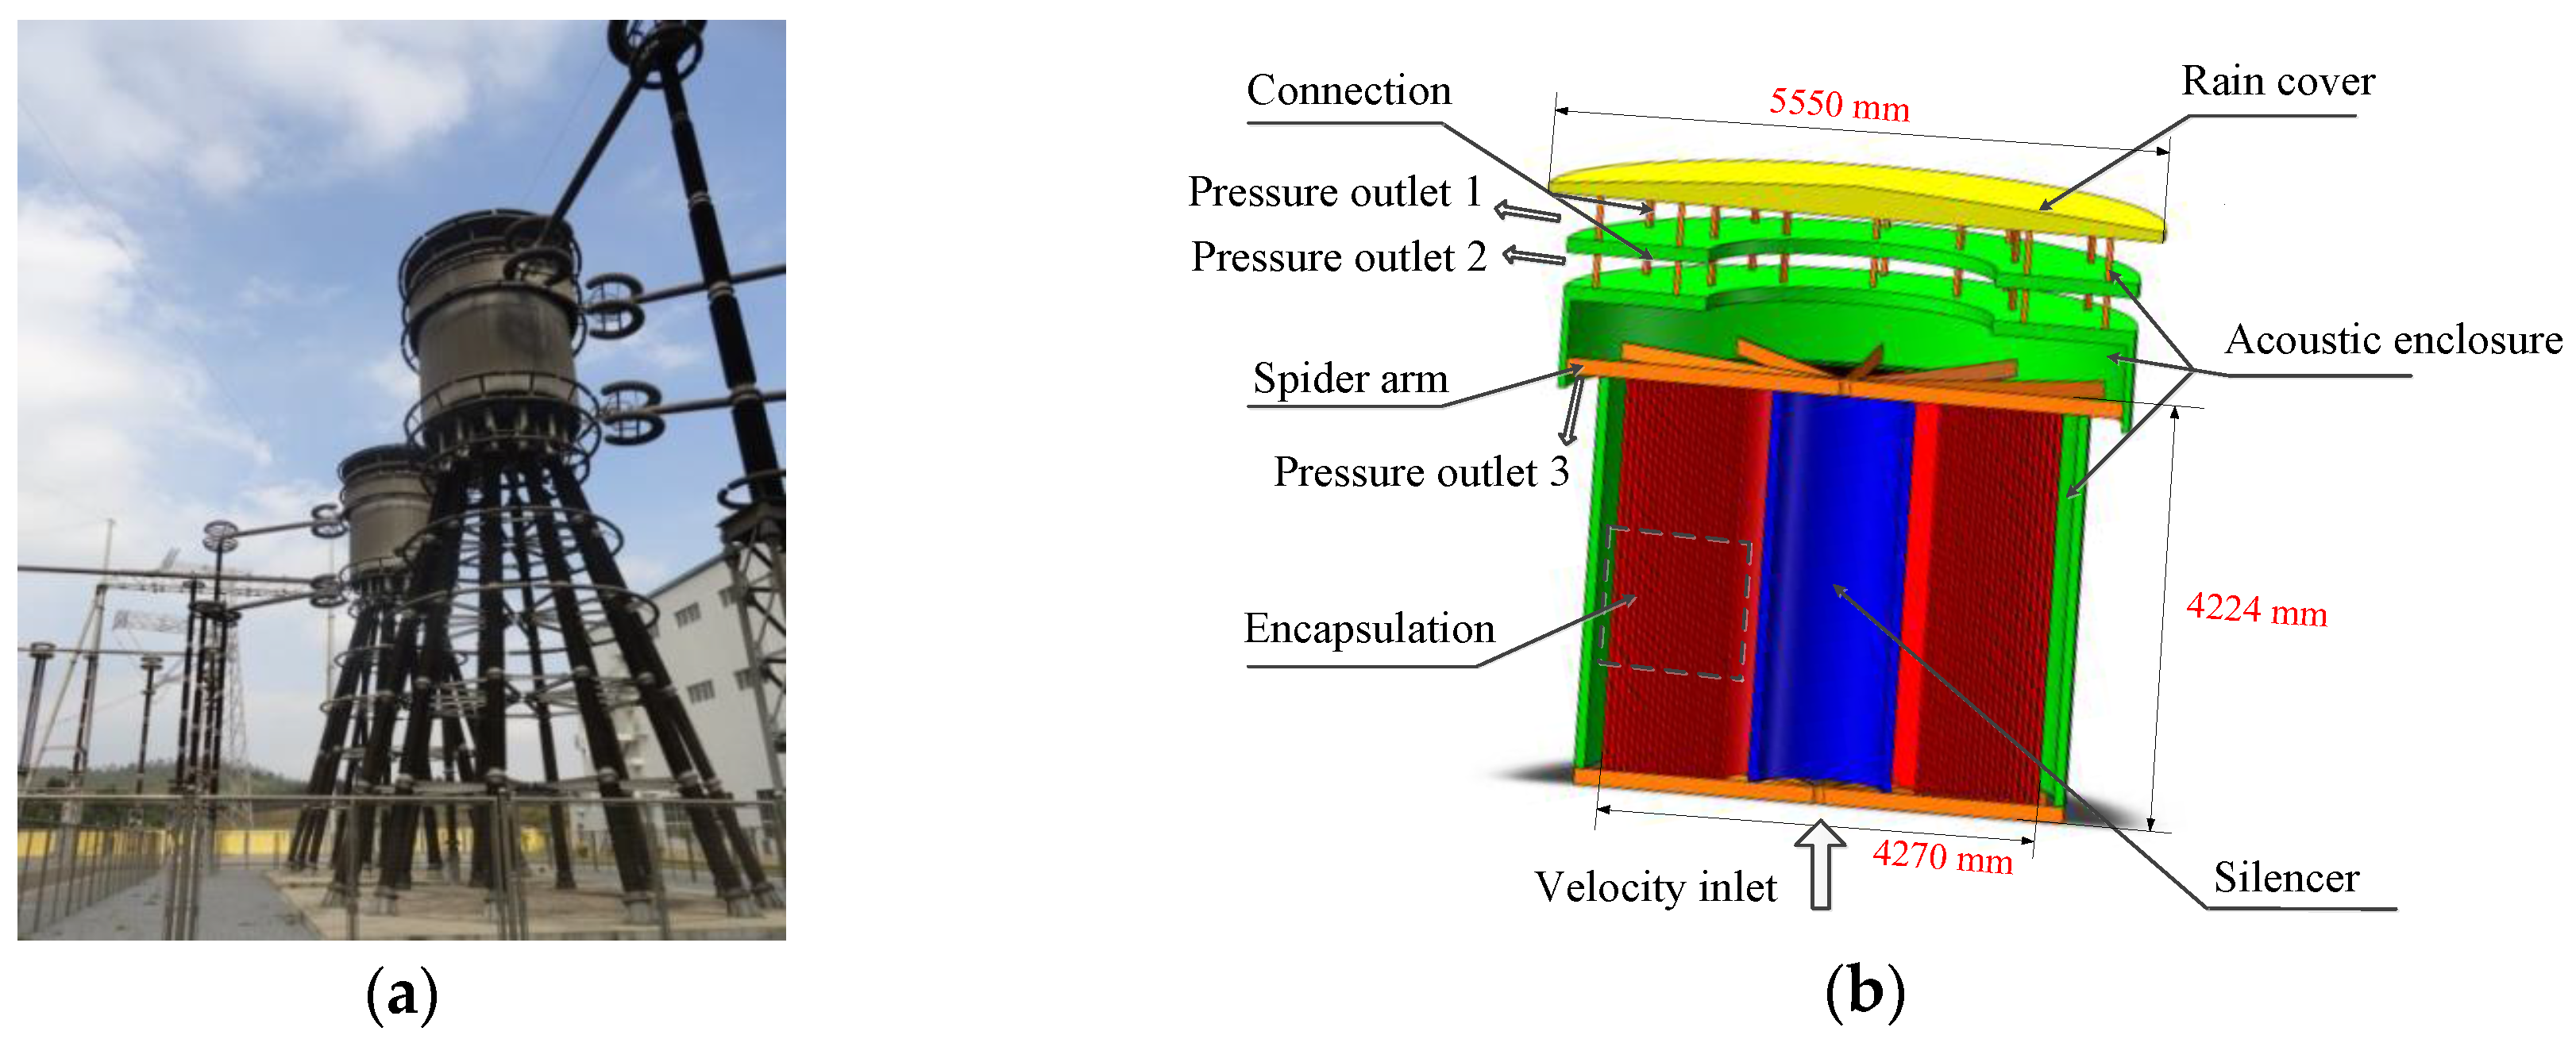
The effect of the braces, spider arms, and spacers were ignored in modeling. The structure of the reactor main body exhibited circumferential symmetry, which indicates that the symmetry plane of the encapsulation, rain cover, acoustic enclosure, and silencer of the calculation model are heat insulation surfaces.
(3)
As the temperature differences and heat radiation ratio were small, the encapsulation transferred inner heat primarily through convection and conduction. The outer surfaces of the rain cover and acoustic enclosure were air-cooled through convection and radiation heat transfer and have a surface emissivity of 0.9 [11].
(4)
The Reynolds number inside the silencer was represented as follows [20]:
R e = u d υ = 45 , 991 > 8000 ~ 12 , 000
where the internal diameter of acoustic enclosure d equals 1.2 m, air flow velocity u equals 0.65 m/s, and the kinematic viscosity of air υ equals 16.96 × 10⁻⁶ m2/s. Thus, a turbulence model was employed to determine the solution for the coupled fluid and thermal field of the reactor.
  • The encapsulation was regarded as an isotropic integral of materials, the parameters of the simulation were showed in Table 1 according to [19]. The equivalent volume heat density of the encapsulation was calculated using FEM.

2.4. Boundary Conditions

The boundary conditions of the coupled fluid and thermal field of the proposed ±800 kV-DASR were as follows:
(1)
The environment temperature during the testing process was 33.4 °C (306.55 K).
(2)
The air in the reactor was considered to be an incompressible fluid in natural convection. The pressure inlet boundary was the lower-end surface of the encapsulation and the acoustic enclosure. The three interfaces between the rain cover, acoustic enclosure and ambient air are set to be the pressure outlet boundary (Figure 1). The relative pressure of the pressure outlet boundary was 0 Pa and the inlet flow velocity was 0.65 m/s.
(3)
The natural convection equations of vertical flat and vertical cylindrical convection in heat transfer theory were used to calculate the convective heat transfer between the air and the outer surfaces of the rain cover and the acoustic enclosure [20]:
{ G r = g α V Δ T L 3 υ 2 N u = C ( G r P r ) n h = λ N u L
where Gr is the Grashof number; Nu is the Nusselt number; Pr is the Prandlt number; constant C and index n are determined by Gr value; g is the gravitational acceleration, m/s2; αV is the expansion coefficient, 1/K; υ is the kinematic viscosity of air, m2/s; ∆T refers to the temperature difference between the air and the wall, K; L is the characteristic length (i.e., height) of the acoustic enclosure, m; and h is the convective heat transfer coefficient, W/(m2·K).
The encapsulation layers were numbered incrementally from inside to outside as Layers 1–21. A DC of 3480 A was loaded, resistive losses of encapsulations are calculated by FEM, that are available to compute the equivalent volume heat density of each encapsulation, as shown in Table 2. Encapsulation Layer–3 exhibited a maximum equivalent volume heat density of 13,556.48 W/m3.

2.5. Grid Model

ANSYS ICEM software was employed to mesh the 1/4 circumferential model of this reactor model. The mesh generation followed the direction of the hypothetical flow of cooling air, and it was established by using structural grids. The grids of encapsulations are refined. The mesh model had 642,698 elements and 515,777 nodes. The simulation was performed on a high-performance server with a hex-core processor and 128 GB of memory. The mesh generation takes about 3 h and the calculation takes about 0.5 h.

3. Calculation Results

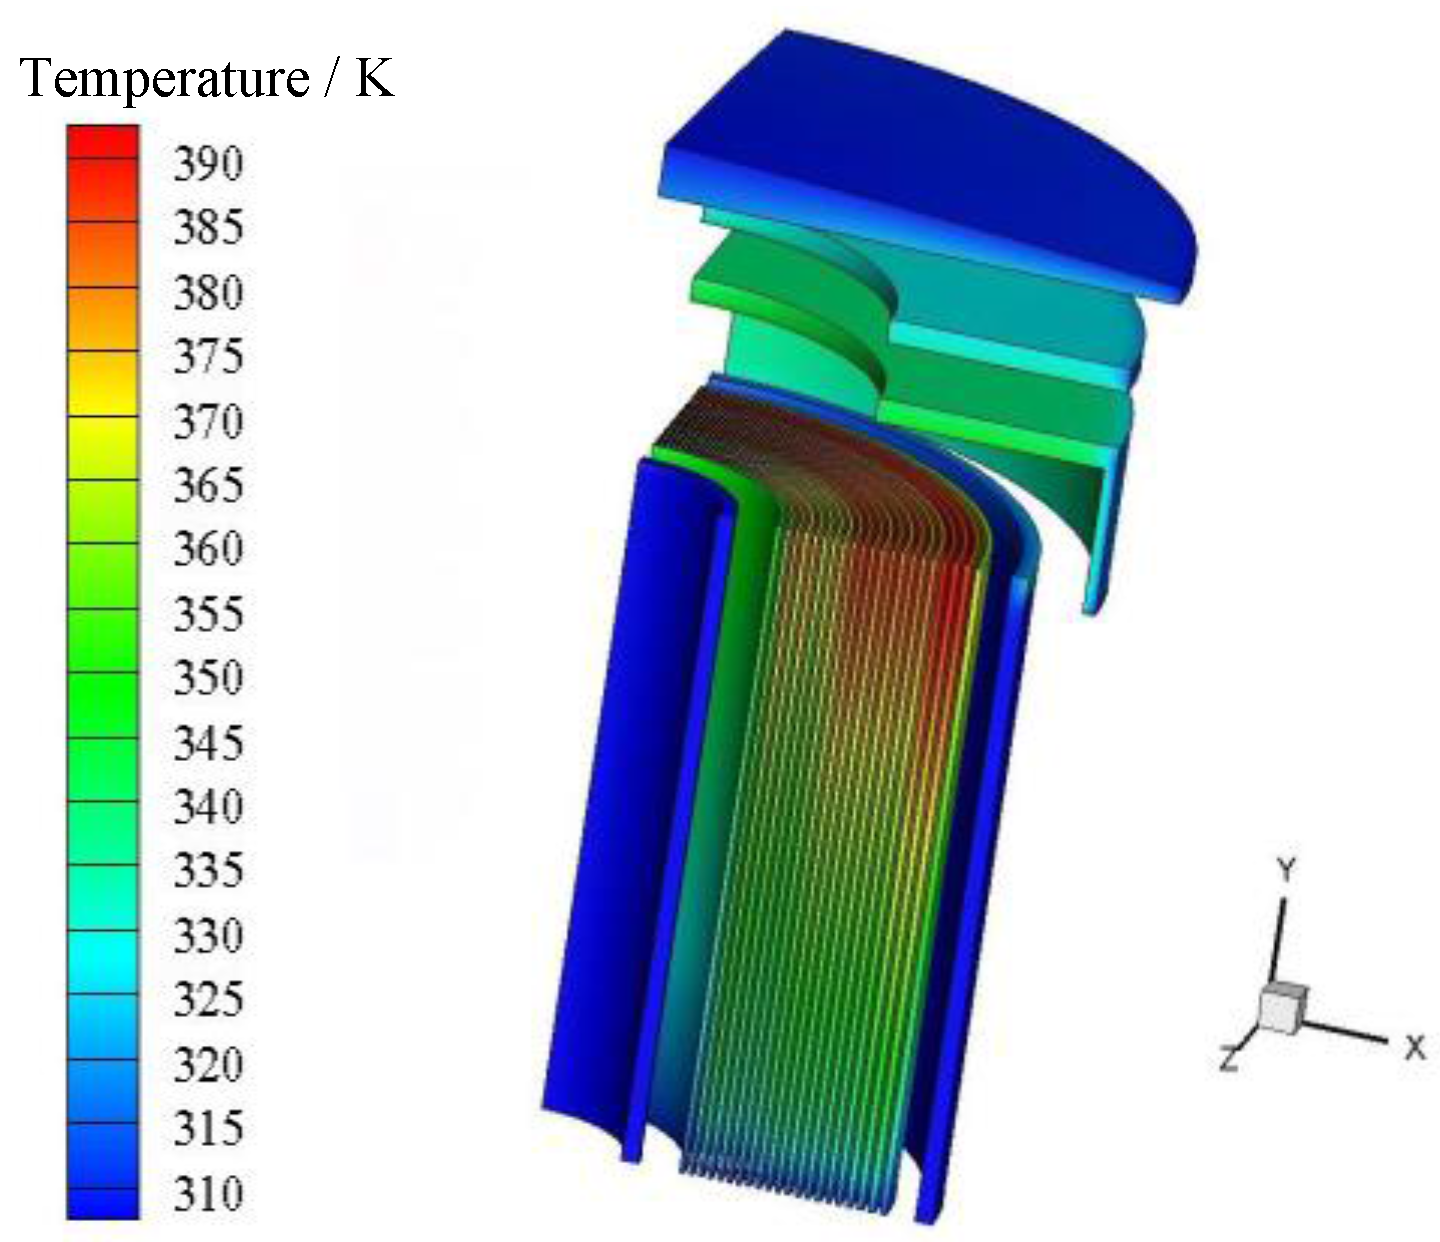
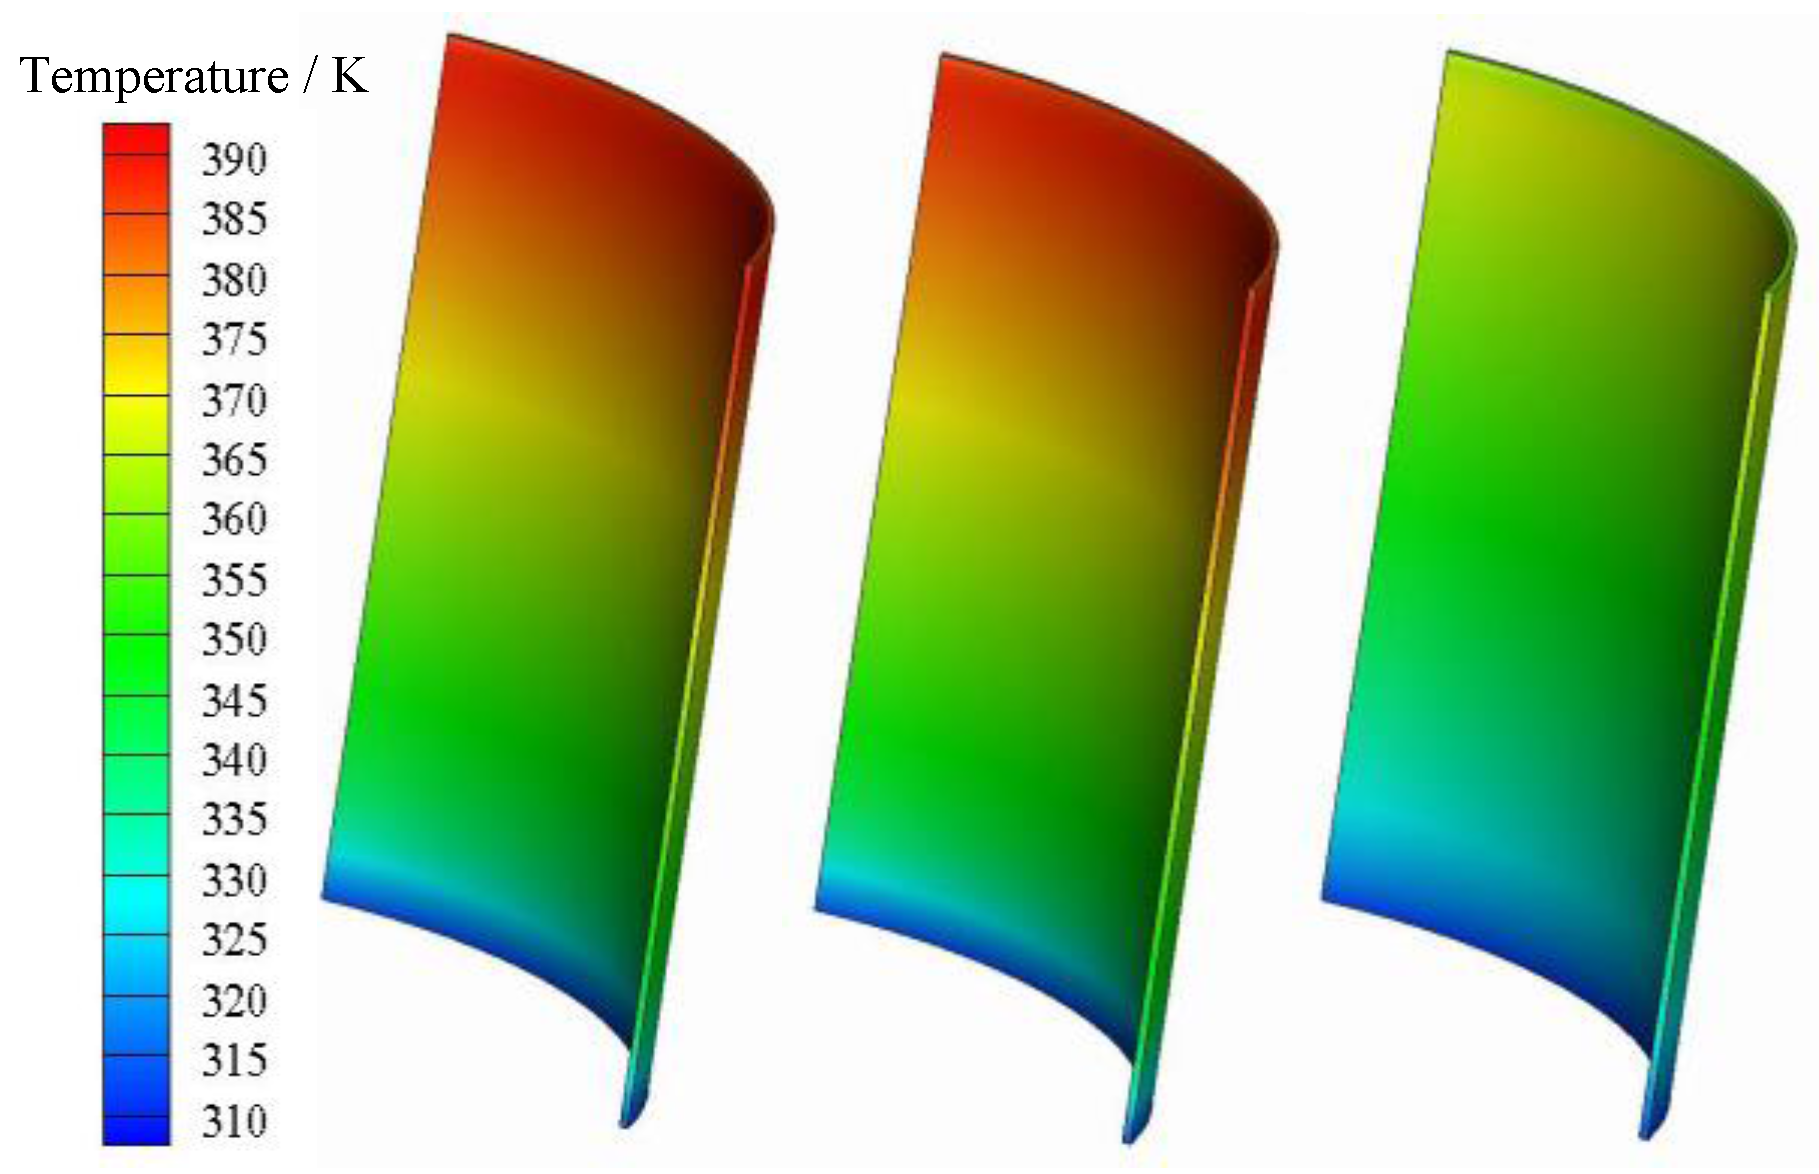
3.1. Analysis of the Temperature Field

Based on the mesh model, hypothetical conditions and boundary conditions, the coupling fluid and thermal field simulation for the ±800 kV-DASR is performed in FLUENT (ANSYS, Canonsburg, PA, USA). The temperature distribution is depicted in Figure 2. The highest temperature was 391.16 K, 18 cm away from the upper surface of Layer–18. The temperature rise was 84.61 K, lower than the standard requirement of 90 K under rated losses [1]. Figure 3 shows the temperature distribution of Layers 19–21.
Figure 2 and Figure 3 show that the temperature at the upper end of the encapsulation layers was higher than that of the middle and lower-end regions. Large ventilation quantity and low temperature rise were observed at the area where the silencer was installed. The upper ends of Layers 18–20 were heat concentrated areas. In addition, the thermal conditions of the reactor can be tested more effectively by monitoring the temperature rise in the internal encapsulation rather than by monitoring the temperature rise in the external rain cover and acoustic enclosure surface. Thus, compared with infrared methods, the optical fiber temperature measurement method was more suitable for supervising the temperature of UHV DASRs.

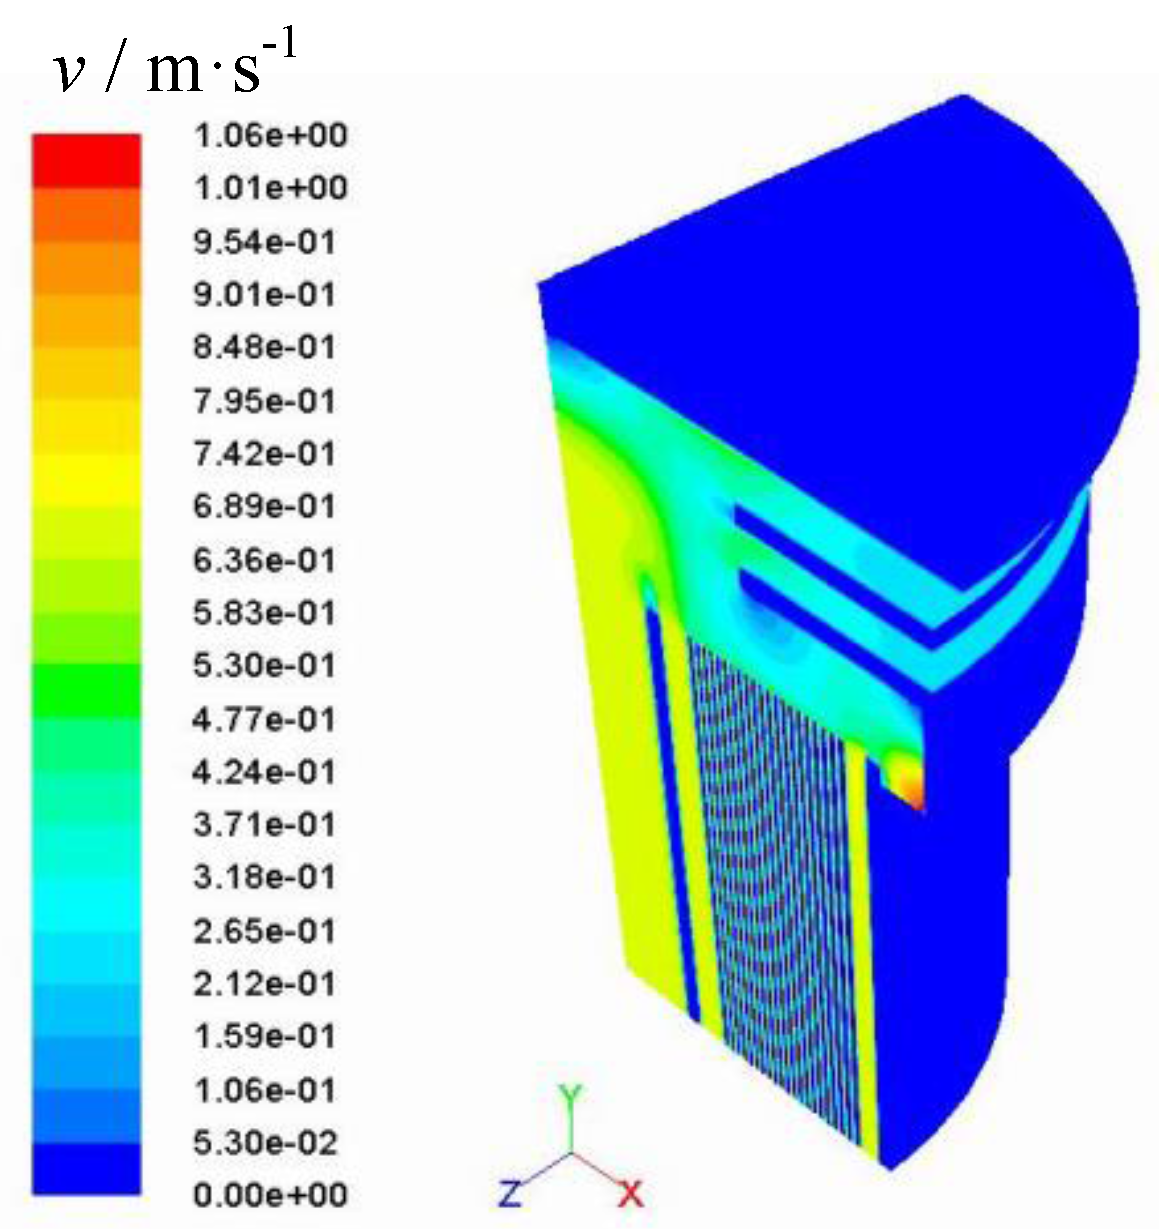
3.2. Analysis of the Fluid Field

Figure 4 reveals the air flow velocity of the reactor. The mass flow rate of the air inlet was 2.0769908 kg/s and the mass flow rate of air outlet was −2.0772743 kg/s, generating a net difference of −0.0002834797 kg/s. The convergence of the fluid mass conservation was satisfactory. Because of the absence of structures that hindered air flow, maximum velocity was observed at outlet 3 of the acoustic enclosure, followed by the flow velocity around the silencer and acoustic enclosure.
Changing the air flow velocity of the inlet, the relationship between the maximum hot-spot temperature rise and the flow velocity in the calculation domain was studied. Results are shown in Figure 5, which showed a nonlinear decrease. Within the range of 0.5 to 0.8 m/s, the inlet flow velocity and the ventilation quantity increased, whereas the maximum hot-spot temperature decreased.

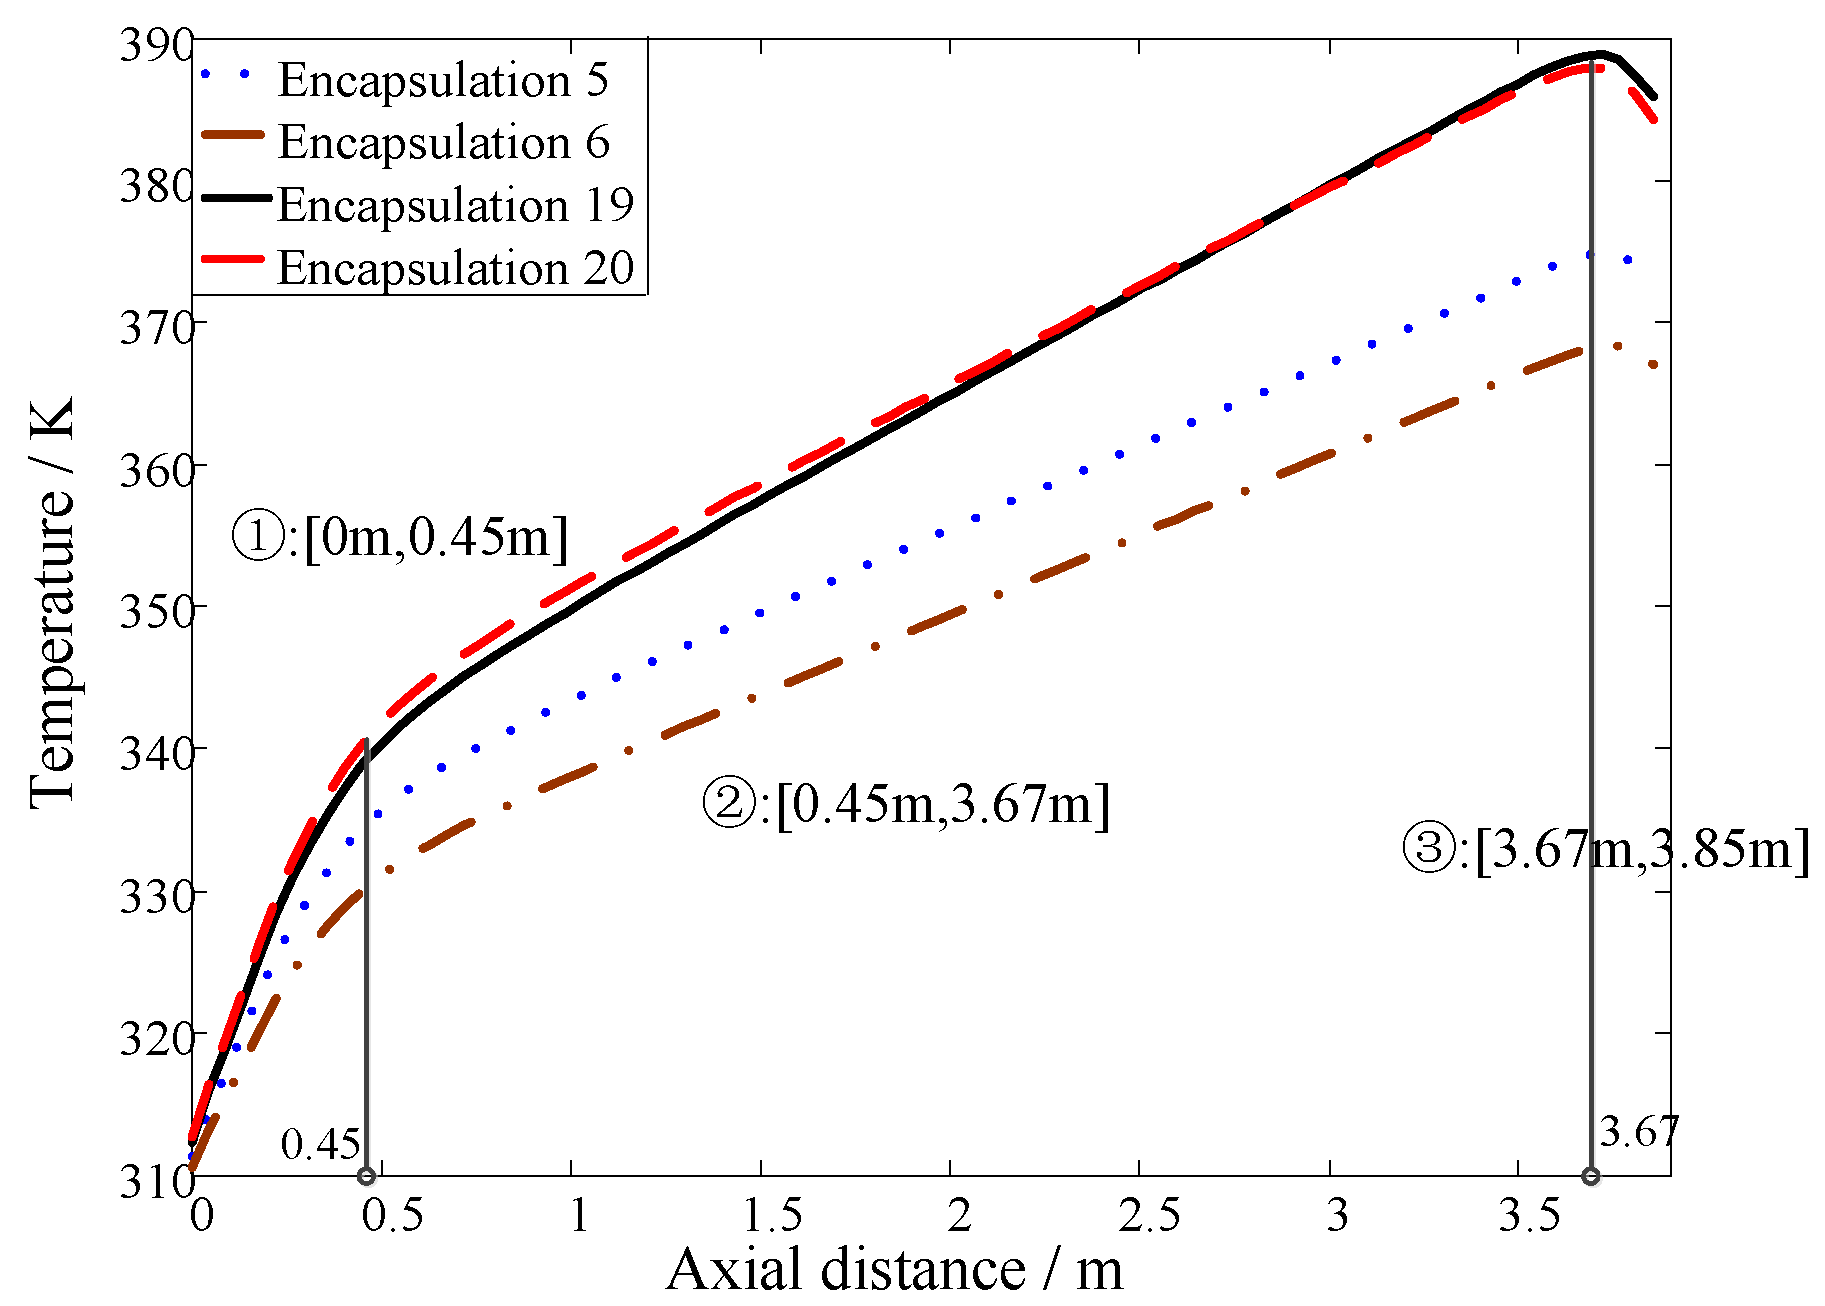
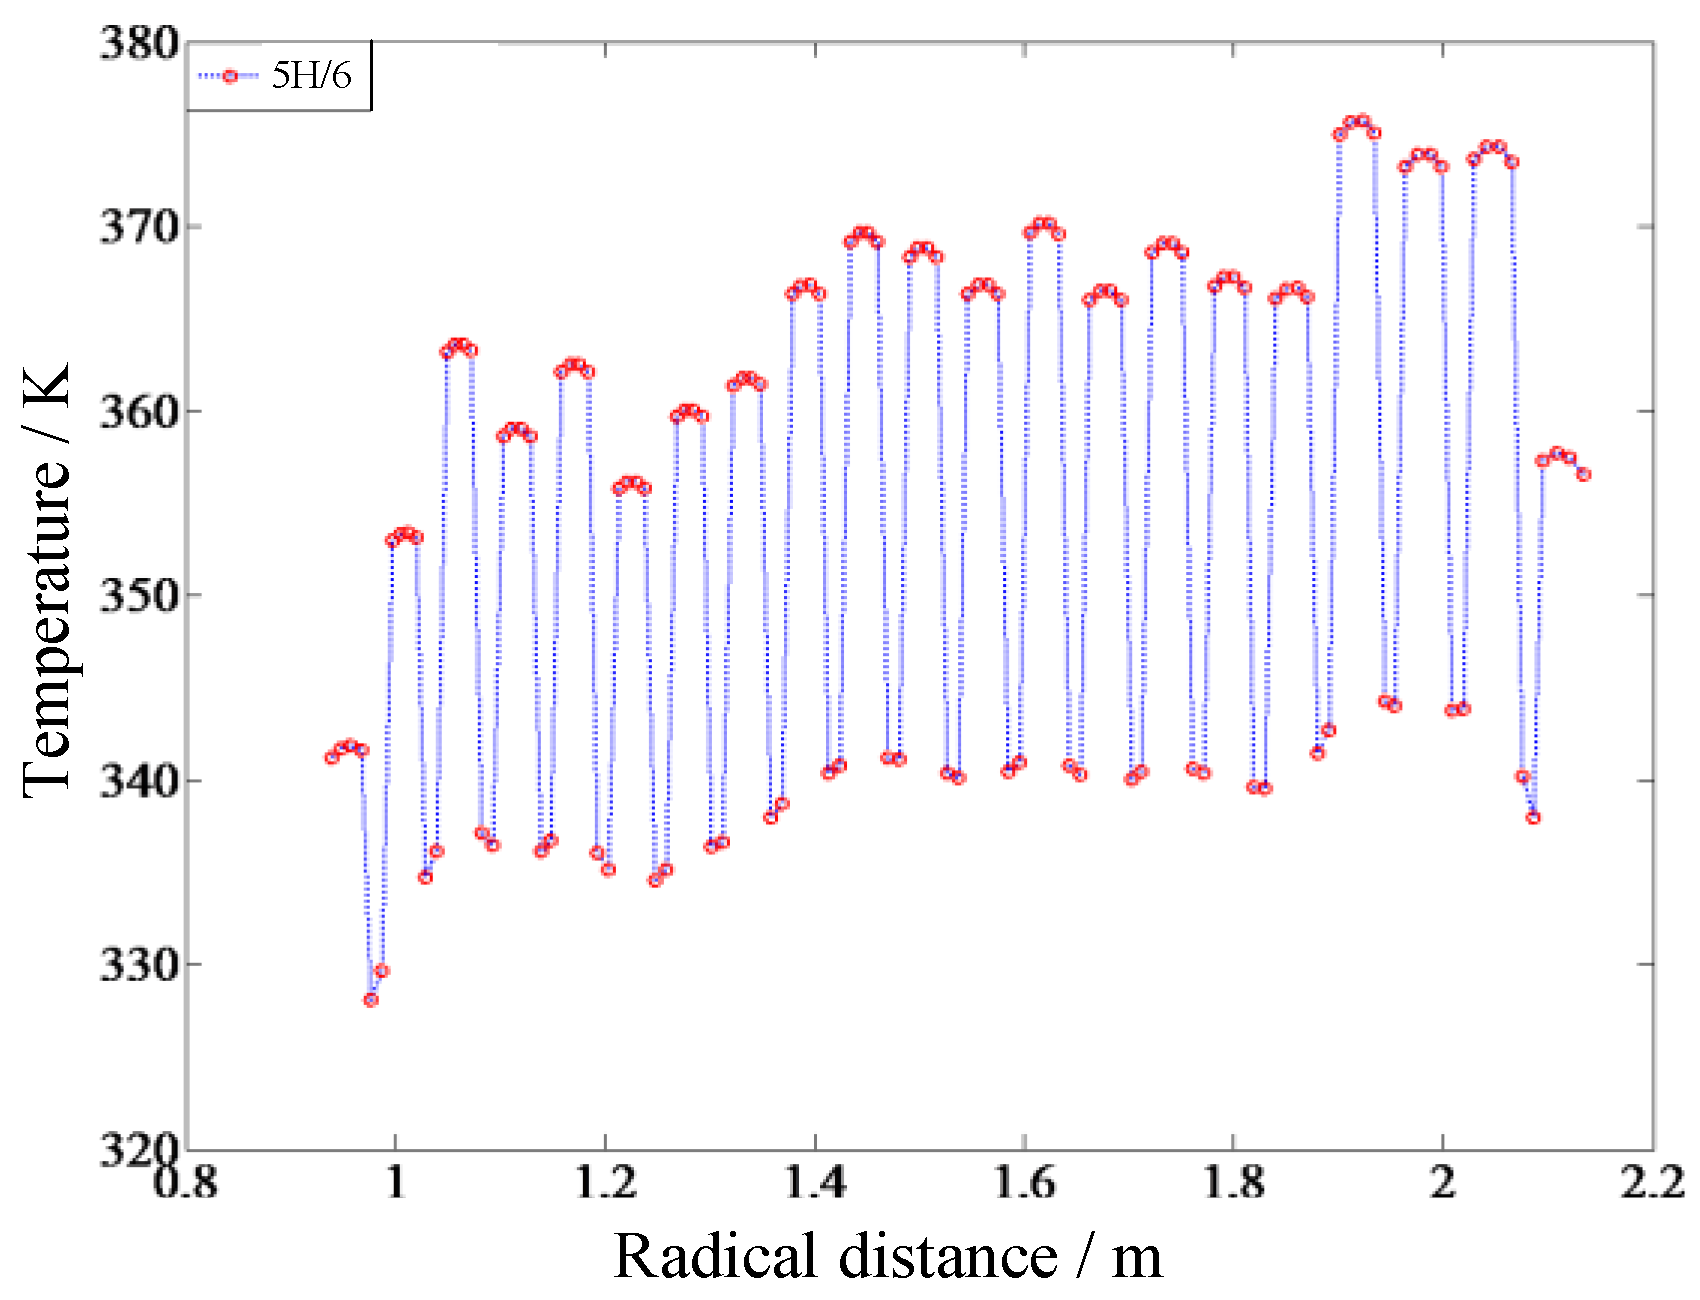
3.3. Distribution of the Encapsulation Temperatures

Axial paths for observation were established along the outer surface of the encapsulations. The axial temperature distribution in Layers 5, 6, 19, and 20 is shown in Figure 6.
As shown in Figure 6, the axial temperature distributions in different encapsulation layers presented identical tendencies, which could be divided into three areas according to the temperature rise rates. In the [0 m, 0.45 m] area, which is located at approximately 12% of the axial height of the lower-end encapsulation, the encapsulation was near the cooling air inlet, therefore, the turbulence of the air flow was not fully developed, thereby creating a weak convective heat transfer, and a high axial temperature rise rate was observed in this part of the encapsulation. In the [0.45 m, 3.67 m] area, which is located at approximately 84% of the axial height of the middle-end encapsulation, the air turbulence developed as the airway length increased. The enhanced convective heat transfer between the air and the encapsulation surfaces slowed the rise rate of the encapsulation axial temperature in this area. In the [3.67 m, 3.85 m] area, which is located at approximately 5% of the axial height of the upper-end encapsulation, the air in the airways flowed from the encapsulation and converged in the acoustic enclosure, strengthening the air heat conduction. The temperature at the encapsulation’s upper end demonstrated a decreasing tendency.
At the height of 5/6 of the encapsulation height H, a radial path was employed to observe the radial temperature distribution of encapsulations and airways. The path is from the inner diameter of Layer–1 (Rin = 0.94 m) to the external diameter of Layer 21 (Rout = 2.13 m). As shown in Figure 7, among all of the encapsulations, Layer–18 exhibited the highest temperature, followed by Layer–20. The hot region concentrated on the upper end of Layers 18–20. The radial thicknesses of the encapsulations and the airways were thin. The upper peaks represented the encapsulation temperatures, whereas the lower peaks represented the airway temperatures. The substantial difference between the thermal resistance of the encapsulations and the airway generated a considerable difference in temperatures.

4. Temperature Rise Test and Result Analysis

To verify the accuracy of the numerical calculation of the coupling fluid and thermal field, temperature rise testing on the DASR was conducted according to the IEC 60076-6 standards [22]. The steady temperature rise of the DASR under overloaded current was measured.

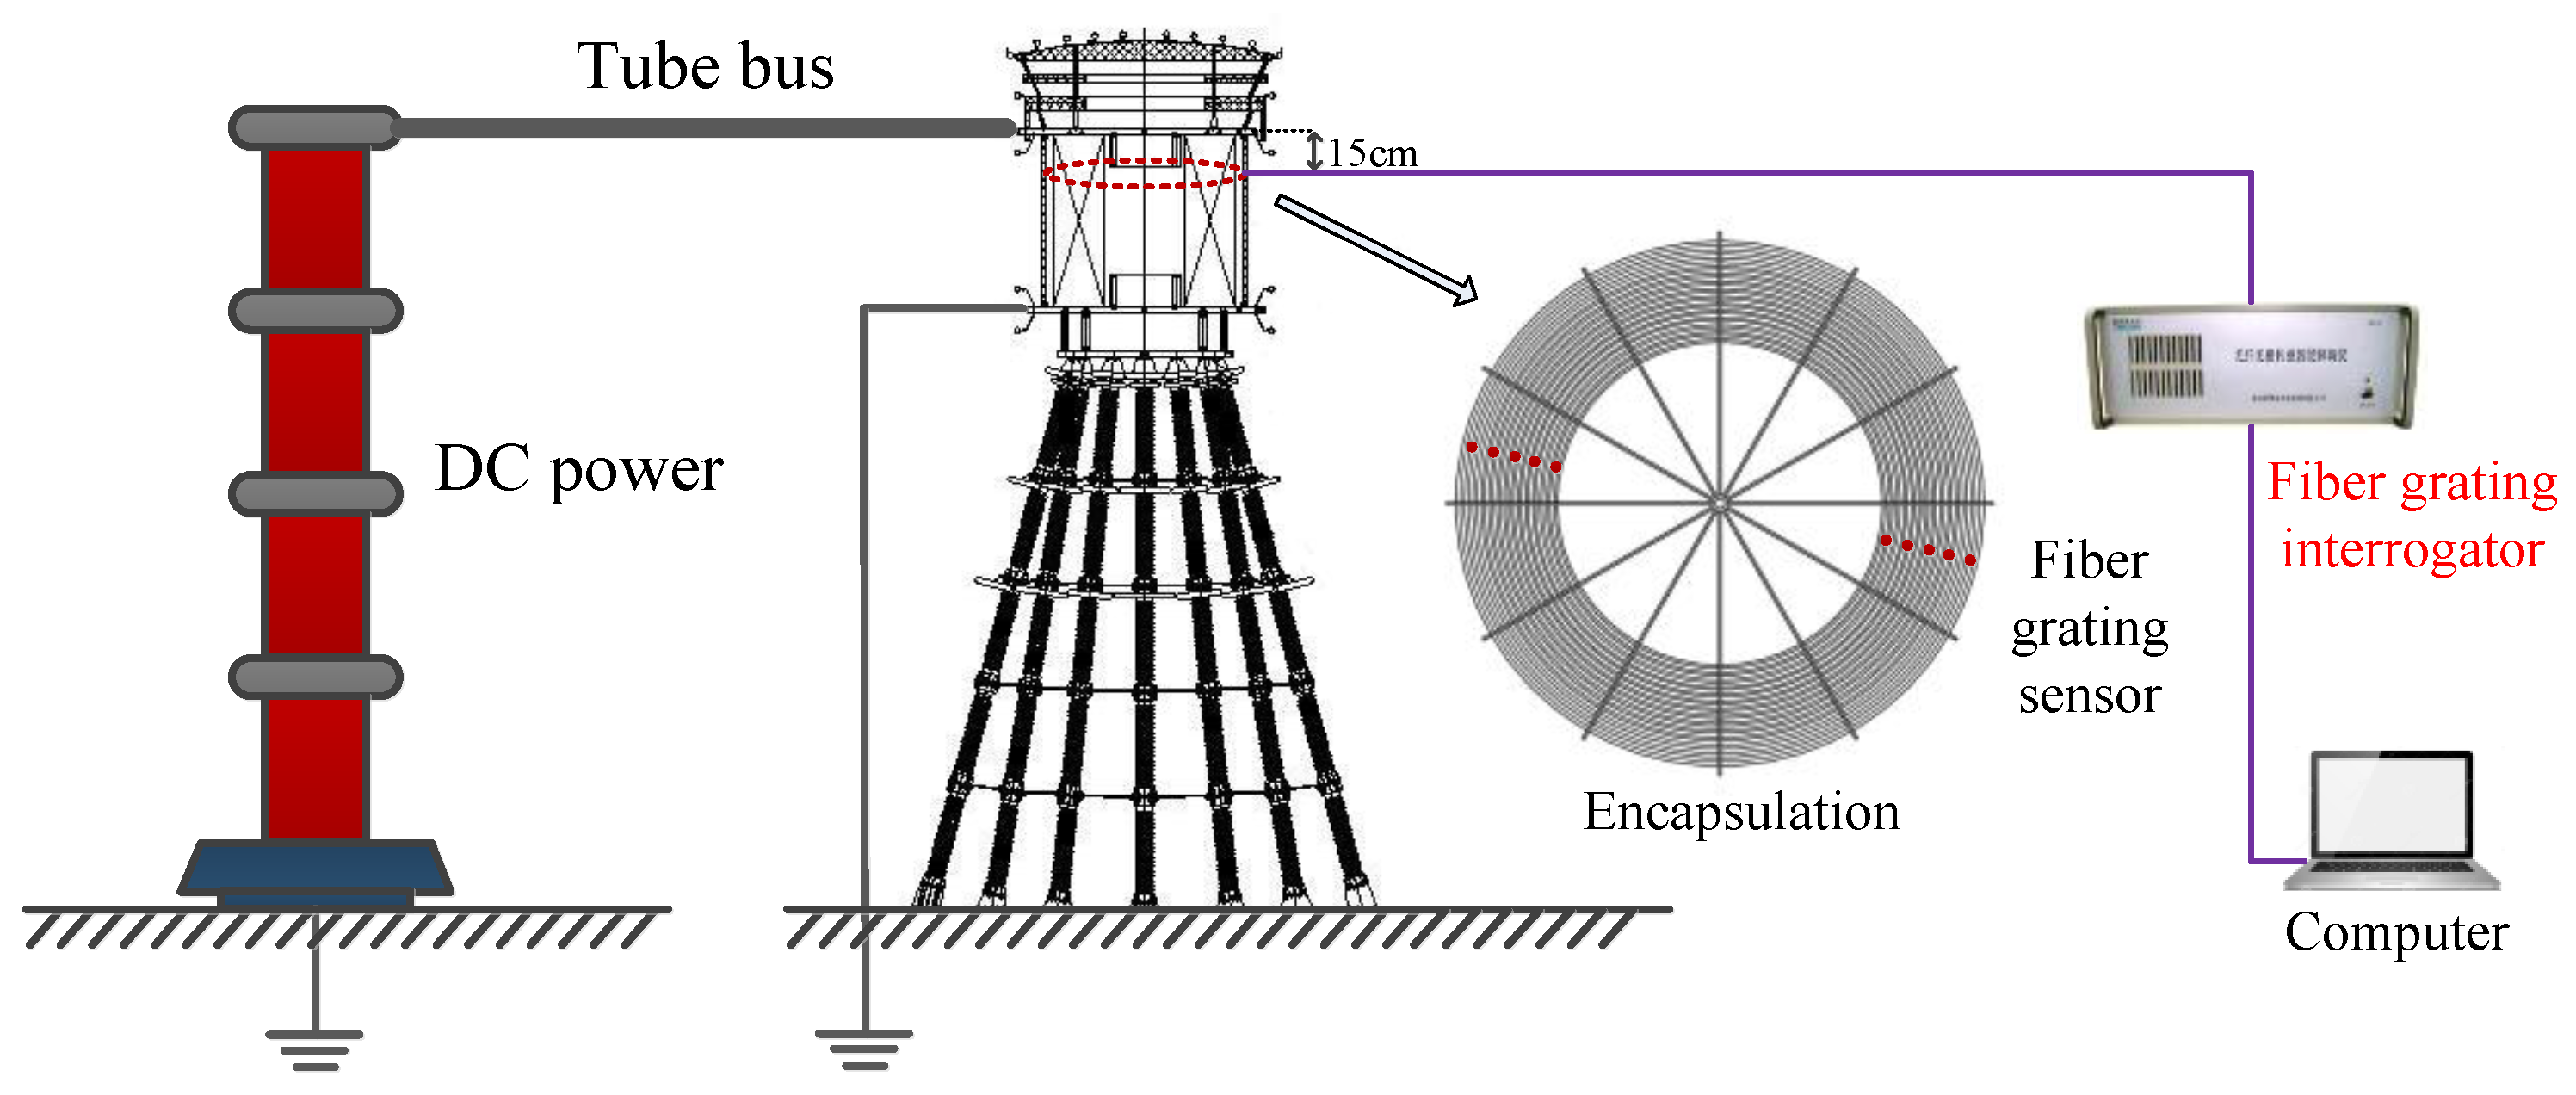
4.1. Testing Approaches

When an UHVDC converter station is operated normally, the DC flowing into the DASR, the resistance loss and harmonic loss induced by harmonic currents are heat sources for the reactor. However, loading mixed-frequency currents is not feasible in the testing process. According to the equivalent loss principle, mixed-frequency currents were converted to equivalent DC values.
In order to minimize the effect of a strong electromagnetic environment on the measurement results, a fiber optical sensor and fiber grating interrogator were employed to measure the reactor temperature in the temperature rise test. The scanning frequency of the FBG interrogator is 200 Hz. The range and the resolution of measurable optical wavelengths are 1525–1565 nm and 1 pm. The accuracy of measured wavelengths is ±3 pm.
The measuring range of the fiber grating sensor is −30–200 °C. In order to reduce the transmission losses of the fiber, the fusion point numbers of the fiber were reduced as much as possible. Thus, all the temperature measurement components and the arrangement of the reactor are made of the same fiber. The fiber used to transmit the signal on the reactor is all installed in the epoxy protection tube to protect it from mechanical damage. The encapsulation height H was 3.85 m. At a 15 cm distance from the outer upper-end surface of the encapsulation, 12 temperature measurement points were deployed evenly along the circumference. The testing schema and the deployed measurement points are shown in Figure 8. Fiber grating sensors were applied on the outer surfaces of Layers 1–20 and the inner surface of Layer–21. When the test began, continuous DC of 3480 A was loaded to induce the temperature rise. After approximately 2 h, the temperature rise stabilized. The temperature rise values of each encapsulation measurement point were then recorded and averaged. The meteorological conditions during the testing were as follows: air pressure of 101.2 kPa, an environment temperature of 33.4 °C (i.e., 306.55 K), a relative humidity of 60%, and a wind velocity of 0.1–1.2 m/s.

4.2. Test Results and Verification of the Calculation

Figure 9 shows the measured and simulation values of the temperature rise in the reactor. Examining the simulation and measured temperature rise values of the 21 encapsulations reveals that 2/3 of the encapsulations (i.e., 14 layers) had temperature differences controlled within 5 K. Layers 7–17 demonstrated favorable agreement between the simulation and measured values, yielding relative errors lower than 6%. The difference value did not exceed 6.19 K. The measured and simulation values for Layers–16 and Layers–20 differed substantially, presenting temperature differences higher than 10 K. The considerable difference was attributable to a simplified calculation model, and the errors were induced by environmental factors and measurements during the testing process. The simulation model ignored the effect of the spacers between the encapsulations on the temperature rise. However, in practice, spacers between airways cannot be evenly distributed along the radial direction and in the same quantity. Several measurement points on the encapsulations were near the spacers, which influenced the measurement results. The connectors between Layer–1 and the silencer and acoustic enclosure were ignored, thus exerting a certain effect on the temperature rise in Layer–1. In addition, the measured and simulation values for the remaining 18 encapsulations (6/7 of the total number) differed by less than 8.07 K, with relative errors lower than 7.5%. Regarding the correlation between the simulation and measured values [23], Pearson’s correlation coefficient was 0.79, suggesting a strong correlation, which indicates that the simulation value was in agreement with the measured value.

5. Conclusions

In this paper, the steady-state temperature field of an UHVDC DASR is analyzed. The studied ±800 kV-DASR has 21 encapsulations, and it is equipped with a rain cover and an acoustic enclosure when operated outdoors. A simulation model has been presented, taking the impact of these components on the air flow into account. Using the finite volume method, the fluid and temperature fields inside the DASR were obtained. Results show that the axial temperature distribution in the encapsulation can be divided into three distinct areas according to their rise rates. The hot region was concentrated on the outer encapsulations in the radial direction while the highest temperature rise was lower than the standard limits of 90 K [1]. The calculated results showed good agreement with the experimental data. The calculation model and methodology in this paper offer a foundation for supervising the temperature rise in such reactors and be applied to studying the fluid-solid coupling temperature field for other high voltage devices.

Acknowledgments

The authors would like to thank the reviewers of this paper for the useful comments.

Author Contributions

Xishan Wen, Yu Wang, Hailiang Lu, Zhuohong Pan and Xiaoyue Chen conceived and designed the calculations and experiments; Yu Wang, Xiaoyue Chen, Bin Chen and Zhipeng Jiang performed the calculations and experiments; Bin Chen, Zhipeng Jiang and Tuteng Chen analysed the data; Yu Wang, Xiaoyue Chen, Bin Chen wrote the paper.

Conflicts of Interest

The authors declare no conflict of interest.

Nomenclature

ρDensity of the fluid, kg/m3
x, y, zCartesian coordinates, m
u, v, wVectors of airflow velocity in Cartesian coordinates, m/s
υFluid kinematic viscosity, m2/s
pFluid pressure, Pa
λThermal conductivity, W/(m·K)
CpSpecific heat, J/(kg·K)
STFluid source term
TsSolid temperature, K
TfFluid temperature, K
λx, λy, λzThermal conductivity in x, y, and z direction, W/(m·K)
QVHeat generation rate of unit volume, W/m3
hHeat transfer coefficient of the solid surface, W/(m2·K)
AjAdiabatic surface
AsHeat dissipating surface
GrGrashof number
NuN usselt number
PrPrandlt number
gGravitational acceleration, m/s2
αVExpansion coefficient, 1/K;
υKinematic viscosity of air, m2/s
TTemperature difference between the air and the wall, K
LCharacteristic length (i.e., height) of the acoustic enclosure, m

References

  1. Dry-Type Air-Core Smoothing Reactors for HVDC Applications; GB/T 25092-2010; General Administration of Quality Supervision, Inspection and Quarantine of the People′s Republic of China, Standards Publishing House: Beijing, China, 2010. (In Chinese)
  2. Yu, Q.; Sebo, S.A. Accurate evaluation of the magnetic field strength of large substation air-core reactor coils. IEEE Trans. Power Deliv. 1998, 13, 1114–1119. [Google Scholar]
  3. Bottauscio, O.; Chiampi, M.; Manzin, A. Transient analysis of thin layers for the magnetic field shielding. IEEE Trans. Magn. 2006, 42, 871–874. [Google Scholar] [CrossRef]
  4. Conway, J.T. Inductance calculations for circular coils of rectangular cross section and parallel axes using Bessel and Struve functions. IEEE Trans. Magn. 2010, 46, 75–81. [Google Scholar] [CrossRef]
  5. Giaccone, L.; Ragusa, C.; Khan, O.; Manca, M. Fast magnetic field mode ling for shielding systems. IEEE Trans. Magn. 2013, 49, 4128–4131. [Google Scholar] [CrossRef]
  6. Burke, P.E.; Fawzi, T.H. Effect of eddy losses on design and modeling of air-cored reactors. IEEE Trans. Magn. 1991, 27, 5001–5003. [Google Scholar] [CrossRef]
  7. Xia, T.-W.; Cao, Y.D.; Jin, W.; Gao, Y.Z. The analysis of temperature field in dry air core reactor. High Volt. Eng. 1999, 25, 86–88. (In Chinese) [Google Scholar]
  8. Wei, X.-L. Study of Designing Theory for Large Air-Core Power Reactors; Harbin Institute of Technology: Harbin, China, 2002. (In Chinese) [Google Scholar]
  9. Nogawa, S.; Kuwata, M.; Miyagi, D.; Hayashi, T.; Tounai, H.; Nakau, T.; Takahashi, N. Study of eddy-current loss reduction by slit in reactor core. IEEE Trans. Magn. 2005, 41, 2024–2027. [Google Scholar] [CrossRef]
  10. Kurita, N.; Onda, K.; Nakanoue, K.; Inagaki, K. Loss estimation method for three-phase AC reactors of two types of structures using amorphous wound cores in 400-kVA UPS. IEEE Trans. Power Electron. 2014, 29, 3657–3668. [Google Scholar] [CrossRef]
  11. Liu, Z.-G.; Geng, Y.-S.; Wang, J.-H.; Chen, D.-G.; Wu, A.-B. Design and analysis of new type air-core reactor based on coupled fluid-thermal field calculation. Trans. China Electrotech. Soc. 2003, 18, 59–63. (In Chinese) [Google Scholar]
  12. Wang, Q.-W.; Chen, Q.-Y.; Zeng, M. A CFD-Taguchi combined method for numerical investigation of natural convection cooling performance of air-core reactor with noise reducing cover. Numer. Heat Transf. Part A 2009, 55, 1116–1130. [Google Scholar] [CrossRef]
  13. Dai, Z.-B. Loss Calculation and Temperature Field Research of Air Core Reactor; Shenyang University of Technology: Shenyang, China, 2012. (In Chinese) [Google Scholar]
  14. Kim, J.K.; Hahn, S.C.; Park, K.Y.; Oh, Y.H. Temperature rise prediction of EHV GIS bus bar by coupled magneto thermal finite element method. IEEE Trans. Magn. 2005, 41, 1636–1639. [Google Scholar]
  15. Ortiz, C.; Skorek, A.; Lavoie, M.; Benard, P. Parallel CFD analysis of conjugate heat transfer in a dry-type transformer. IEEE Trans Ind. Appl. 2009, 45, 1530–1534. [Google Scholar] [CrossRef]
  16. Smolka, J.; Nowak, A.J. Shape optimization of coils and cooling ducts in dry-type transformers using computational fluid dynamics and genetic algorithm. IEEE Trans. Magn. 2011, 47, 1726–1731. [Google Scholar] [CrossRef]
  17. Li, W.-L.; Zhang, Y.; Chen, Y.-H. Calculation and analysis of heat transfer coefficients and temperature fields of air-cooled large hydro-generator rotor excitation windings. IEEE Trans. Energy Convers. 2011, 26, 946–952. [Google Scholar]
  18. Ahn, H.M.; Kim, J.K.; Oh, H.Y.; Song, K.D.; Hahn, S.C. Multi-physics analysis for temperature rise prediction of power transformer. J. Electr. Eng. Technol. 2014, 9, 114–120. [Google Scholar] [CrossRef]
  19. Deng, Q.; Li, Z.-B.; Yin, X.-G.; Yuan, Z. Steady thermal field simulation of forced air-cooled colunm-type air-core reactor. High Volt. Eng. 2013, 39, 839–844. [Google Scholar]
  20. Tao, W.-Q. Numerical Heat Transfer, 2nd ed.; Xi’an Jiaotong University Press: Xi’an, China, 2001. (In Chinese) [Google Scholar]
  21. Ding, S.; Ge, Y.; Sun, Z.; Liu, H.; Guo, B. Calculation and analysis of fluid field and temperature field for high-altitude type doubly-fed wind generators. Proc. CSEE 2012, 32, 74–79. (In Chinese) [Google Scholar]
  22. International Electrotechnical Commission (IEC). International Standard Power Transformers–Part 6: Reactors; 60076–6; IEC: Geneva, Switzerland, 2007. [Google Scholar]
  23. Rand, W. Introduction to Robust Estimation and Hypothesis Testing; Academic Press: Cambridge, MA, USA, 2011. [Google Scholar]
Figure 1. Structural diagram of a reactor’s main body and calculation model: (a) ±800 kV-DASR; (b) the model structure.
Energies 10 00623 g001
Figure 2. Temperature distribution in the main body of the reactor.
Energies 10 00623 g002
Figure 3. Temperature distribution of Encapsulation Layers 19–21.
Energies 10 00623 g003
Figure 4. Air flow velocity (inlet velocity of 0.65 m/s).
Energies 10 00623 g004
Figure 5. Flow velocity and hot-spot temperature rise.
Energies 10 00623 g005
Figure 6. Axial temperature distribution in different encapsulation layers.
Energies 10 00623 g006
Figure 7. Radial temperature distribution at the height of 5/6H.
Energies 10 00623 g007
Figure 8. Schematic diagram of the temperature rise test.
Energies 10 00623 g008
Figure 9. Analysis of simulation and measured values of the temperature.
Energies 10 00623 g009
Table 1. Parameters of the simulation.
MaterialsAirEncapsulationEpoxy-Glass
Thermal conductivity/(W∙m1∙K1)0.024220.4
Density/(kg·m3)incompressible gas (density varies with temperature)27192000
Dynamic coefficient of viscosity/(kg∙m1∙s)1.7894 × 10−5--
Specific heat/(J kg−1·K−1)1006.43871535
Table 2. Equivalent volume heat density of the encapsulation.
Encapsulation Number1234567
Heat Density (W/m3)8505.7011,203.0713,556.4810,600.5212,238.3410,367.2111,991.10
Encapsulation Number891011121314
Heat Density (W/m3)11,135.4712,622.3912,850.7412,626.1311,083.7512,345.7610,682.18
Encapsulation Number15161718192021
Heat Density (W/m3)11,746.2611,235.4510,071.4711,282.7610,190.6310,118.618511.31

