
Methane Adsorption Rate and Diffusion Characteristics in Marine Shale Samples from Yangtze Platform, South China
by
Wei Dang
1,2, 
Jinchuan Zhang
1,2,*,
Xiaoliang Wei
1,2,
Xuan Tang
1,2,
Chenghu Wang
3,
Qian Chen
1,2 and
Yue Lei
1,2 1
School of Energy Resources, China University of Geosciences, Beijing 100083, China
2
Key Laboratory of Shale Gas Exploration and Evaluation, Ministry of Land and Resources, China University of Geosciences, Beijing 100083, China
3
Key Laboratory of Crustal Dynamics, Institute of Crustal Dynamics, China Earthquake Administration, Beijing 100085, China
*
Author to whom correspondence should be addressed.
Energies 2017, 10(5), 626; https://doi.org/10.3390/en10050626
Submission received: 6 January 2017
/
Revised: 13 April 2017
/
Accepted: 21 April 2017
/
Published: 4 May 2017
(This article belongs to the Special Issue Unconventional Natural Gas (UNG) Recoveries)
Abstract
:Knowledge of the gas adsorption rate and diffusion characteristics in shale are very important to evaluate the gas transport properties. However, research on methane adsorption rate characteristics and diffusion behavior in shale is not well established. In this study, high-pressure methane adsorption isotherms and methane adsorption rate data from four marine shale samples were obtained by recording the pressure changes against time at 1-s intervals for 12 pressure steps. Seven pressure steps were selected for modelling, and three pressure steps of low (~0.4 MPa), medium (~4.0 MPa), and high (~7.0 MPa) were selected for display. According to the results of study, the methane adsorption under low pressure attained equilibrium much more quickly than that under medium and high pressure, and the adsorption rate behavior varied between different pressure steps. By fitting the diffusion models to the methane adsorption rate data, the unipore diffusion model based upon unimodal pore size distribution failed to describe the methane adsorption rate, while the bidisperse diffusion model could reasonably describe most of the experimental adsorption rate data, with the exception of sample YY2-1 at high pressure steps. This phenomenon may be related to the restricted assumption on pore size distribution and linear adsorption isotherm. The diffusion parameters α and β/α obtained from the bidisperse model indicated that both macro- and micropore diffusion controlled the methane adsorption rate in shale samples, as well as the relative importance and influence of micropore diffusion and adsorption to adsorption rate and total adsorption increased with increasing pressure. This made the inflection points, or two-stage process, at higher pressure steps not as evident as at low pressure steps, and the adsorption rate curves became less steep with increasing pressure. This conclusion was also supported by the decreasing difference values with increasing pressures between macro- and micropore diffusivities obtained using the bidisperse model, which is roughly from 10−3 to 100, and 10−3 to 10−1, respectively. Additionally, an evident negative correlation between macropore diffusivities and pressure lower than 3–4 MPa was observed, while the micropore diffusivities only showed a gentle decreasing trend with pressure. A mirror image relationship between the variation in the value of macropore diffusivity and adsorption isotherms was observed, indicating the negative correlation between surface coverage and gas diffusivity. The negative correlation of methane diffusivity with pressure and surface coverage may be related to the increasing degree of pore blockage and the decreasing concentration gradient of methane adsorption. Finally, due to the significant deviation between the unipore model and experimental adsorption rate data, a new estimation method based upon the bidisperse model is proposed here.
1. Introduction
Increasing exploration activity and advanced technologies, such as horizontal drilling and hydraulic fracturing for gas shale, have stimulated basic research on gas transport properties in shale. Understanding the gas storage and transport properties in organic-rich shale, which is characterized by low porosity and low permeability, is very important to evaluate the gas transport properties. The source of the initial gas in place (GIP) in organic-rich shale is much more complicated than that in conventional gas reservoirs and coal [1,2], and the gas storage and transport mechanism—which can include gas adsorption, desorption, diffusion, and Darcy flow—also differ from those in conventional gas reservoirs and coal. Thus, the concepts and theories for conventional gas reservoirs and coal cannot be applied easily in gas shale.
Pore systems, which act as the storage space and transport pathway of gas molecules in organic-rich shale, significantly affect gas storage and transport behavior [3,4]. The pore structures of shale are highly heterogeneous, with the pore size mainly ranging from nanometer to micrometer-sized [5,6]. Previous research has reported that nanometer-sized pores, which are predominantly associated with organic matter and clay minerals [6,7,8], could provide larger surface areas and higher adsorption energy for gas molecule adsorption [9,10,11,12], while micrometer-sized pores—which are generally associated with inorganic minerals [6]—are more likely to connect with induced fractures for gas flow and transport [13,14]. For gas desorption, once external conditions, such as temperature and pressure changes, for example, and artificial fractures disturb the equilibrium, the free gas molecules in fractures and macropore networks flow from high-pressure zones to low-pressure zones, and then gas that adsorbed onto the surface of organic matter and clay minerals starts to desorb, inducing a concentration gradient between the bulk particles and their surface. In contrast, gas adsorption can be described as a process that the methane molecule diffuses from the void space in the sample cell into adsorption sites. Thus, the gas adsorption rate and diffusion behavior can be evaluated from methane adsorption isotherm experiments. Previous studies have noted that diffusion is a complex process of Knudsen diffusion (where molecule-wall collisions dominate), transitional diffusion (transport through physically adsorbed layers), and Fickian diffusion (where molecule collision dominates) [15,16].
Previous literature [3,14,16,17,18,19] has also reported that the gas adsorption rate and diffusion behavior in porous media can be estimated indirectly based on adsorption isotherm data and gas diffusion models, including the “unipore diffusion model” and the “bidisperse diffusion model”. Combined with the determination of adsorption isotherms to assess the gas adsorption capacity, adsorption rate data can be obtained. Then, the gas diffusion behavior can be interpreted and described by fitting the gas diffusion model to experimental adsorption rate data. Clarkson and Bustin [3] found that the adsorption and diffusion behavior of coals can be explained in terms of relative proportions of micro-, meso-, and macropores. The unipore diffusion model can reasonably describe the adsorption rate data of coals with a uniform micropore structure, while the bidisperse diffusion model is more suitable for coals with a more complicated pore structure. Some earlier literature that studied coal samples also discussed the effects of experimental conditions, including moisture content and pressure on gas adsorption kinetics and diffusion behavior [3,20,21,22]. Cui et al. [23] reported a clear negative correlation of micro- and macropore diffusivities with increasing pressure over a broad pressure range for CO2, CH4, and N2. However, an inverse correlation, in which the diffusivities increased with pressure, was also reported [22,24]. In addition to the pressure, the moisture content, which would reduce the pore radius and block pore throats, exhibited a negative effect on gas diffusivities [22].
However, compared to the extensive modelling research that has been conducted on coal [20,25,26,27,28,29], studies on the gas adsorption rate characteristics and diffusion behavior—as well as its influencing factors in shale—are very rare. Furthermore, rare research work has been performed on marine shale to investigate and analyze the varied adsorption rate behavior between different pressure steps. In an early study conducted on marine shale by Yuan et al. [16], only the adsorption rate data at lower pressure steps (1–3 MPa) from only one shale sample were reported, and the varied adsorption rate behaviors and gas diffusion behavior between different pressure steps were not discussed. Therefore, it is necessary and significant to study the methane adsorption rate and diffusion behavior on more organic-rich shale samples under a wider pressure range. In this study, experimental and modeling studies were conducted to investigate the methane adsorption rate characteristics and the diffusion behavior in four marine shale samples from the Cenye-1 well and the Yongye-2 well in the Yangtze Platform, Southern China. High-pressure methane adsorption isotherms were conducted to estimate the adsorption rate characteristics. The diffusion behavior of methane in organic-rich shale was then estimated indirectly by using the unipore diffusion model and bidisperse diffusion models to fit the experimental adsorption rate data. Based on this, the variations in diffusivities with pressure and surface coverage, as well as the varied methane adsorption rate behaviors between different pressure steps were discussed. It should be noted that, in this research, the pores developed in organic-rich shale were classified into macropores and micropores, which refer to micrometer- and nanometer-sized pores, respectively, instead of using the pore types that were classified by Sing [30]. Due to the inadequacy of the unipore model to explain the methane adsorption rate data, a new estimation method based upon bidisperse model for lost gas content, which is the quantity of gas lost during sample retrieval, was proposed here. By conducting a preliminary application of this method, we found that the modified curve fit method could give a better description for field desorbed gas data than the current Amoco curve fit method, and this method provides an alternative to the gas canister desorption data of shale or coal for lost gas content determination.
2. Diffusion Models
Two different types of diffusion models, including “unipore” and “bidisperse” diffusion pore models, were developed based on the pore structures of solid materials to describe the gas diffusion process in porous solids [21,31].
2.1. Unipore Diffusion Model
The “unipore” diffusion model, which is also known as the “parallel pore” model, was developed by Wheeler [32] for use with porous catalyst pellets that exhibit well-defined pore structures and has been applied to model the gas diffusion process and calculate the lost gas content of coal seams by some researchers [21,22,26,27]. This model assumes that the porous solid is interspersed with non-connecting cylindrical pores with identical radii, and the gas concentration at the surface of the spheres throughout the adsorption process is constant. According to the “unipore” model, the fraction of gas uptake as a function of time at a constant surface concentration is described by the equation [21,33]:
where is the total uptake at time t, is the total uptake at infinite time, t is the time, rp is the diffusion path length, and is the diffusion coefficient. D/, which refers to the effective diffusivities, can be obtained by using the above equation to fit the experimental adsorption rate data. For short times, t is less than 600 s or the fraction of gas adsorbed (Mt/) is less than 0.5, the above equation (Equation (1)) can be approximated to:
By using the unipore diffusion model to fit the experimental adsorption rate data of methane in coal samples, however, some researchers [26,34] found that the “unipore” model underestimates the time that is required for complete adsorption by an order of magnitude and is inadequate to describe diffusion processes for entire periods. This failure of the “unipore” model to describe the diffusion process was attributed to the restrictive assumption of a single pore size [25,26].
2.2. Bidisperse Diffusion Model
Therefore, a more sophisticated model, the “bidisperse” diffusion model, was developed by Ruckenstein et al. [31]. The basis for the “bidisperse” diffusion model is that a spherical particle comprises an agglomeration of many small microporous spheres with macropores around the microparticles [21,31]. This model assumes that the isotherm equation is a linear function of pressure and that a step change occurs in the concentration of gas on the adsorbent external surface [31]. The equations that describe the diffusion of gas into macro- and micro-spherical particles are provided in Equations (3) and (4), respectively [31]:
where Da is the macropore diffusivity, cm2/s; Di is the micropore diffusivity, cm2/s; is the macropore void fraction; is the micropore void fraction; ra is the distance from the macrosphere’s center, cm; Ca is the macropore fluid phase sorbate concentration, moles/cm3; Csa is the macropore adsorbed phase concentration, moles/cm2; n is the number of microspheres per unit macrosphere volume; Ri is the microsphere radius, cm; and t is the time, s.
where ri is the distance from the microsphere’s center, cm; Ci is the micropore fluid phase sorbate concentration, moles/cm3; and Csi is the micropore adsorbed phase concentration, moles/cm2.
The solutions of the above equations (Equations (3) and (4)) in terms of the fractional uptake were determined according to the boundary conditions that were applied by Ruckenstein et al. [31] and Smith and Williams [21]. However, these solutions are too complicated to easily fit the experimental adsorption rate data results. Therefore, a simplified solution was also provided by Ruckenstein et al. [31]. The diffusion and adsorption process in macropores is much faster than that in micropores, so the uptake process was separated into a two-stage process: a faster macropore diffusion stage and a slower micropore diffusion stage [31]. Therefore, the uptakes for the first and second stages can be shown by the equations:
where is the macropore uptake at time t; is the macropore uptake at infinite time; is the micropore uptake at time t; is the micropore uptake at infinite time; is the effective macropore diffusivity in cm2/s and is defined as ; is the effective micropore diffusivity in cm2/s and is defined as ; t is the time in s; is the macropore diffusivity in cm2/s; is the micropore diffusivity in cm2/s; and are the Henry’s law constants for macropore and micropore adsorption in cm3/cm2, respectively; and are the macropore and micropore surface areas in cm2/cm3, respectively; and are the macropore and micropore void fractions, respectively; and and are the macrosphere and microsphere radii in cm, respectively.
Hence, the total uptake at any time is the sum of the macrosphere uptake and microsphere uptake and may be provided as [31]:
where α is a dimensionless rate parameter, which is defined as /, and β is a dimensionless parameter, which is defined as /. Therefore, the bidisperse pore model can be summarized as:
As illustrated in Equations (1) and (8), the numerical diffusion models are very complicated and cannot be applied easily to fit the experimental results. Thus, the “unipore” and “bidisperse” diffusion models are programmed in MATLAB in this study, and the diffusion parameters can be obtained by applying the MATLAB program (R2015b, Mathworks, Natick, MA, USA) to fit the experimental results. The number of increments n was taken to be 100 in this study, although previous researchers have stated that values of n as low as 10 can produce reasonably accurate fitting [35,36].
3. Shale Samples and Experimental Methods
3.1. Shale Samples Preparation
In this study, a set of four marine shale core samples collected from the depth of about 1200 m in the peripheral regions of Sichuan basin in China were prepared for this experimental work. Among these shale samples, two were collected from lower Cambrian Niutitang shale intervals in CY-1 well, which was located in the northwest region of Guizhou province. The other two shale samples were collected from lower Silurian Longmaxi shale intervals in YY-2 well, which was located in northwest region of Hunan province. The detailed information of these shale samples were shown in Table 1. In China, shale from both the Niutitang and Longmaxi formations are the representative organic-rich marine shale intervals, and have been considered to be the major exploration and development targets of shale gas (Figure 1). Because of the similar tectonic movement in the peripheral regions of Sichuan basin and stable marine depositional environment, these two shale intervals in the Yangtze Platform are generally characterized by high TOC content, high thermal maturity, oil-prone organic matter, and high brittle minerals content throughout the whole Yangtze Platform [9,14]. Thus, the four marine shale samples used in this study could adequately represent the marine shales developed in other area.
Prior to the experiment, the shale samples were preprocessed to meet the experimental requirements. First, several rock flakes were collected from drilling core plug for scanning electronic microscopy (SEM, Su 8010, Hitachi, Tokyo, Japan) observation. Then, the shale samples were put into a ball mill pulverizer and crushed into powder with particle sizes from 80 mesh to 100 mesh (0.180 mm–0.150 mm) to facilitate the adsorption process of gases in the shale samples because gas can diffuse faster to the adsorption sites with smaller particles [34], so the equilibrium time is shorter compared to that of larger particles. Although the particle size may change the surface area for gas adsorption, the effect of particle size on gas diffusion can be neglected when the particle radius is greater than 0.1 mm according to previous studies [22,29,34]. Then, about 300 g of the powdered shale samples were prepared by placing shale in an evacuated desiccator for approximately 24 h at 100 °C to remove moisture. Previous studies [37,38] have shown that the paleotemperature of marine lower Cambrian Niutitang shale and lower Silurian Longmaxi shale in this area have reached as high as about 300 °C and 200 °C during late Mesozoic Era, respectively. Because of the irreversibility of organic matter thermal evolution, the temperature of 100 °C used here for drying is feasible. The sample processing was conducted in accordance with the Chinese standard MT/T1157-2011 [39].
3.2. Scanning Electronic Microscopy (SEM) Observations
A Gatan Ilion II milling system was used with an accelerating voltage of 6 keV for three hours to Ar-ion mill the rock flakes at the Key Laboratory of Shale Gas Exploration and Evaluation, Ministry of Land and Resources at the China University of Geosciences (Beijing). The milling process removed approximately 70 μm of surface material and eventually provided a fan-shaped and flat surface. A Hitachi Su 8010 scanning electron microscope (Hitachi, Tokyo, Japan) was used to observe the pores.
3.3. Methane Adsorption Isotherms and Adsorption Rate Measurements
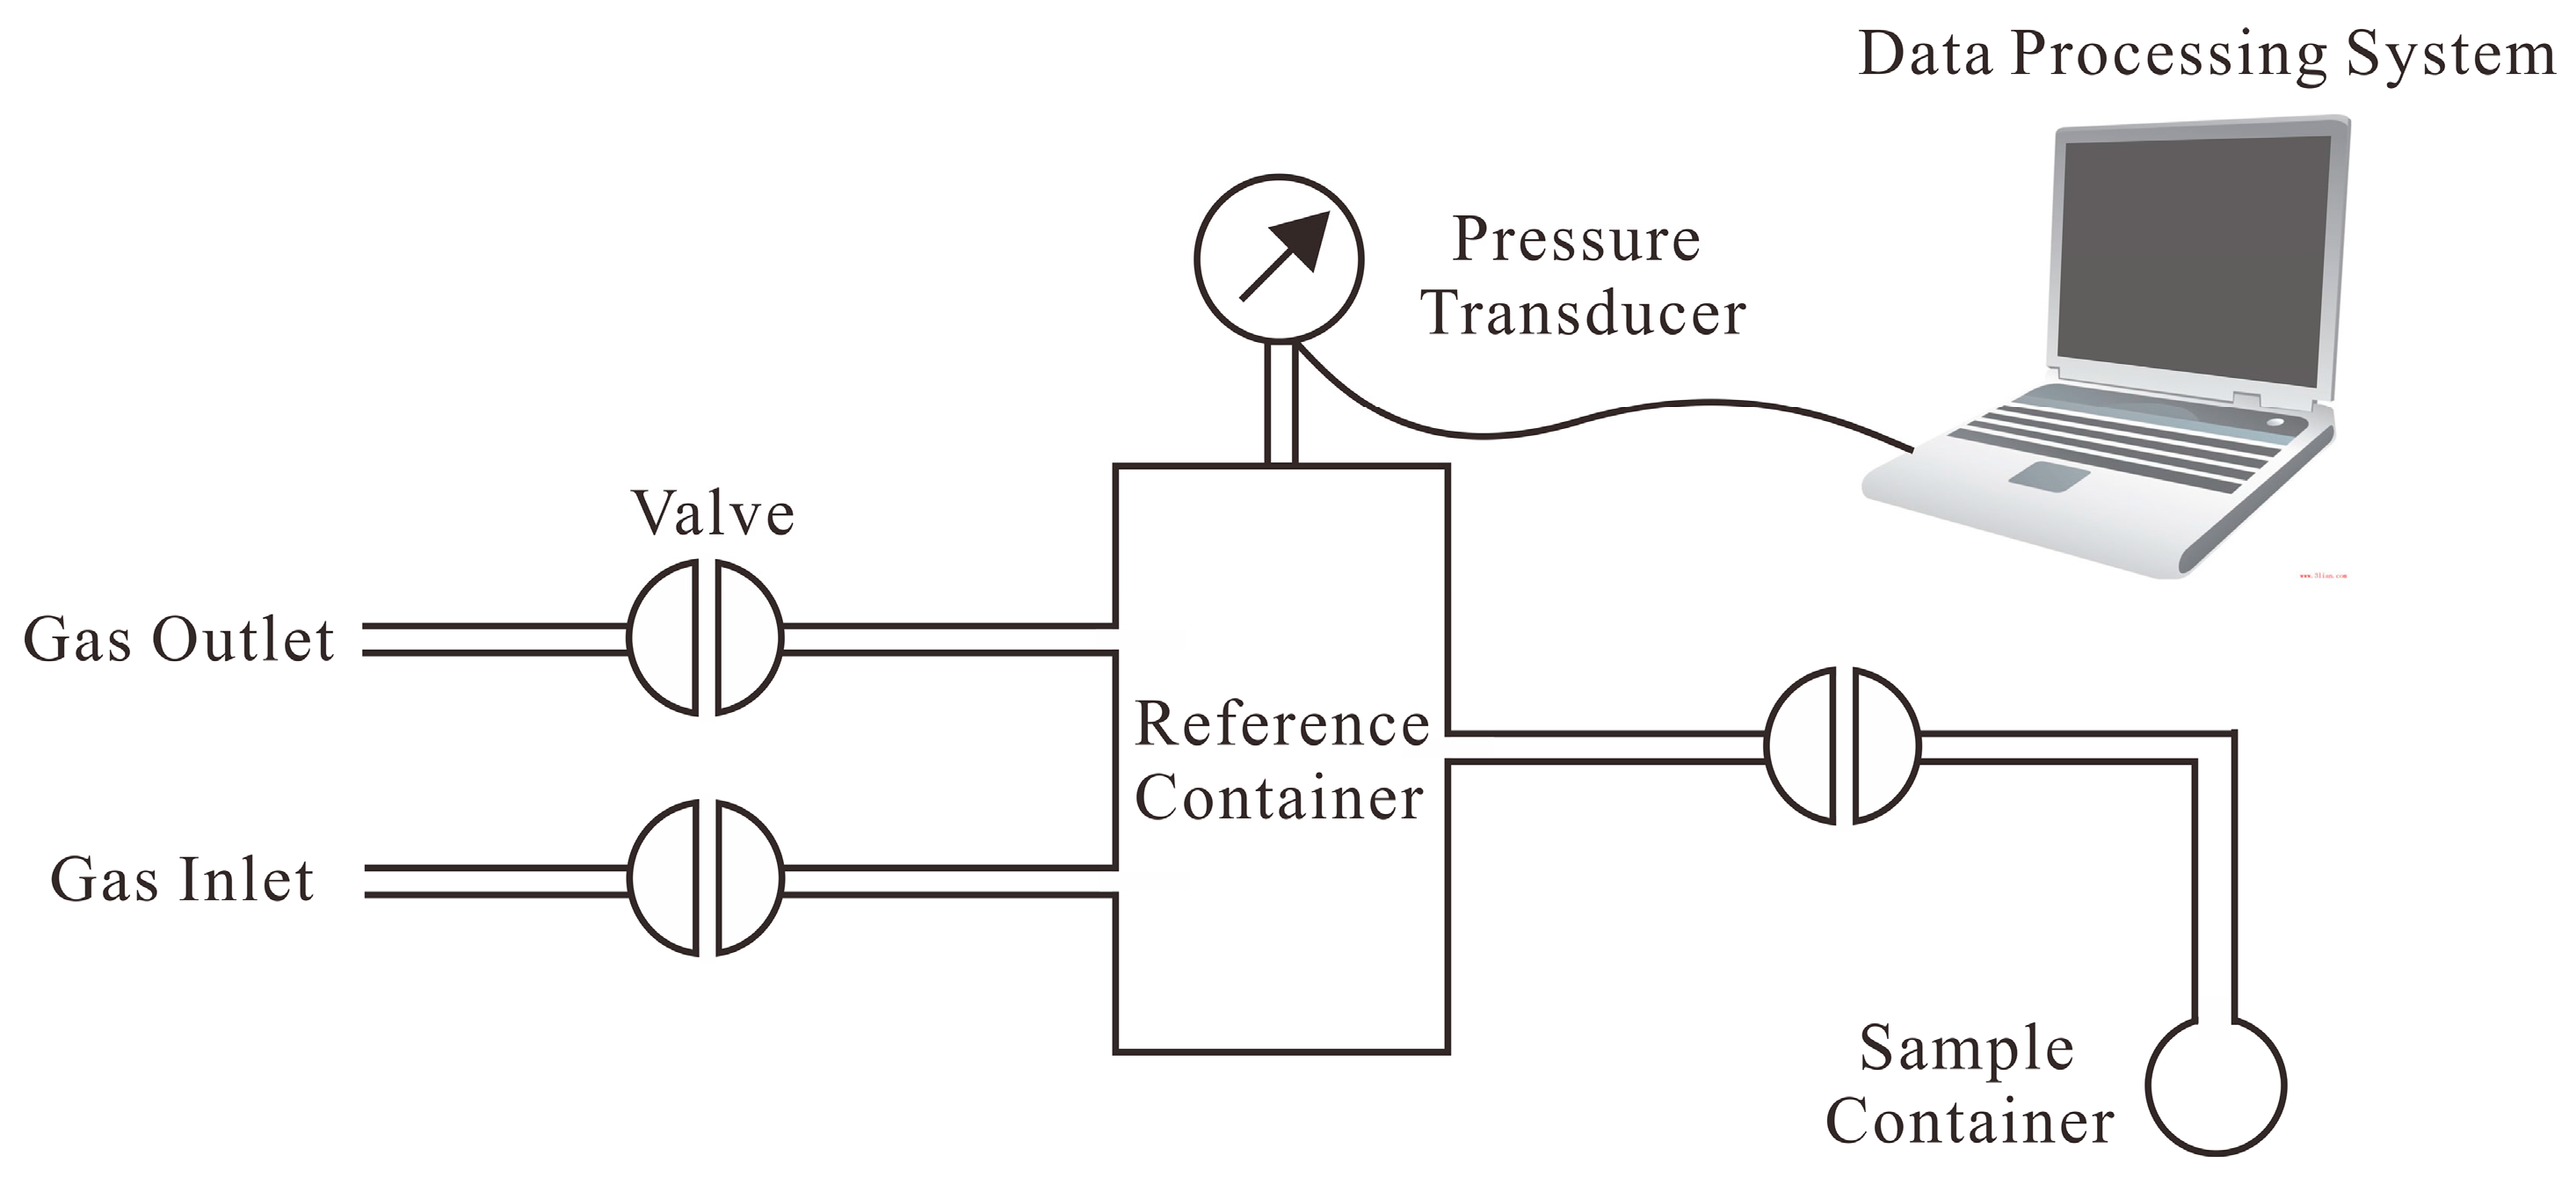
Methane adsorption isotherms were recorded at a temperature of 30 °C with pressures from 0 to 8 MPa by using a volumetric apparatus (Figure 2) at the Key Laboratory of Shale Gas Exploration and Evaluation, Ministry of Land and Resources at China University of Geosciences (Beijing, China). The volumetric method is based on mass balance principles and requires precise measurements of pressure, volume, and temperature. The instrument’s components, in terms of the volumetric method, have been documented in previous literature [11,40]. In this experiment, the main procedures can be summarized as follows: (1) the shale powder samples need to be degassed firstly by evacuation for 12 h at 100 °C; (2) leak testing should be conducted by using helium at 8 MPa for two hours, and the accepted leakage rate is less than 500 Pa/hour; (3) the void volume of the sample cell, which should be applied for the calculation of isotherms and methane adsorption amounts, was determined by helium expansion; and (4) remove the helium within the sample cell by evacuation and then perform the methane adsorption isotherm measurement. Then, the adsorption amount of methane at various pressures during the adsorption measurement was calculated through the equation [9,41]:
where is the adsorption amount of methane; Vtotal is the total amount of gas that is introduced into the sample cell; is the gas density, which can be calculated from the Institute of Standards and Technology WebBook (http://webbook.nist.gov/chemistry/fluid); and Vvoid is the void volume of the sample cell, which can be determined by helium expansion.
The characterization of gas adsorption is generally described through isotherms, i.e., the amount of adsorbate (methane) on the adsorbent as a function of pressure. The Langmuir equation is a model that relates the adsorption of gas molecules on a solid surface to gas pressure at a given temperature [40]. Assuming that methane adsorption in organic-rich shales follows the monolayer adsorbate theory, the methane adsorption experimental results can be modeled by the Langmuir isotherm equation [42]:
where V is the volume of adsorbed gas; VL is the Langmuir volume (the maximum adsorption capacity of the adsorbent); P is the gas pressure; and PL is the Langmuir pressure, at which the adsorbed gas content equals half the Langmuir volume. The value of PL can also be a measure of the isotherm curvature: the smaller the value of PL, the greater the initial slope of the isotherm [43]. A least-squares fit of methane adsorption isotherms based on the Langmuir model was applied to determine the Langmuir parameters, including VL and PL.
The methane adsorption rate and diffusion process can be estimated indirectly based on a previous study [17] by using adsorption isotherm data, and the pressure changes in the sample cell against time during the adsorption process of reaching equilibrium should be recorded to achieve the adsorption rate data, which can be used to calculate the diffusivities by fitting the diffusion model. In this study, pressure data against time were recorded at 1-s intervals for all pressure steps until the adsorption equilibrium was reached, and the adsorption rate data were plotted with the square root of the time in the X-axis and the fractionally-adsorbed Mt/M∞ in the Y-axis.
4. Experimental Results and Discussions
4.1. Pore Characteristics
Figure 3 shows the SEM observation results of the pores that developed in the measured shale samples. It is apparent from the Figure 3 that the shale samples in this study possesses large amounts of inter-particle and intra-particle pores ranging from micrometer to nanometer-sized (Figure 3a–c). Additionally, the nanometer-sized organic matter pores were also well formed in these over-mature shale samples (Figure 3d), and the pore structures of these marine shale samples are highly heterogeneous. Thus, both macro- and micropores were observed in measured shale samples according to this qualitative observation, and this observation is also the basis of using the bidisperse diffusion model for modelling study.
4.2. Methane Adsorption Isotherms
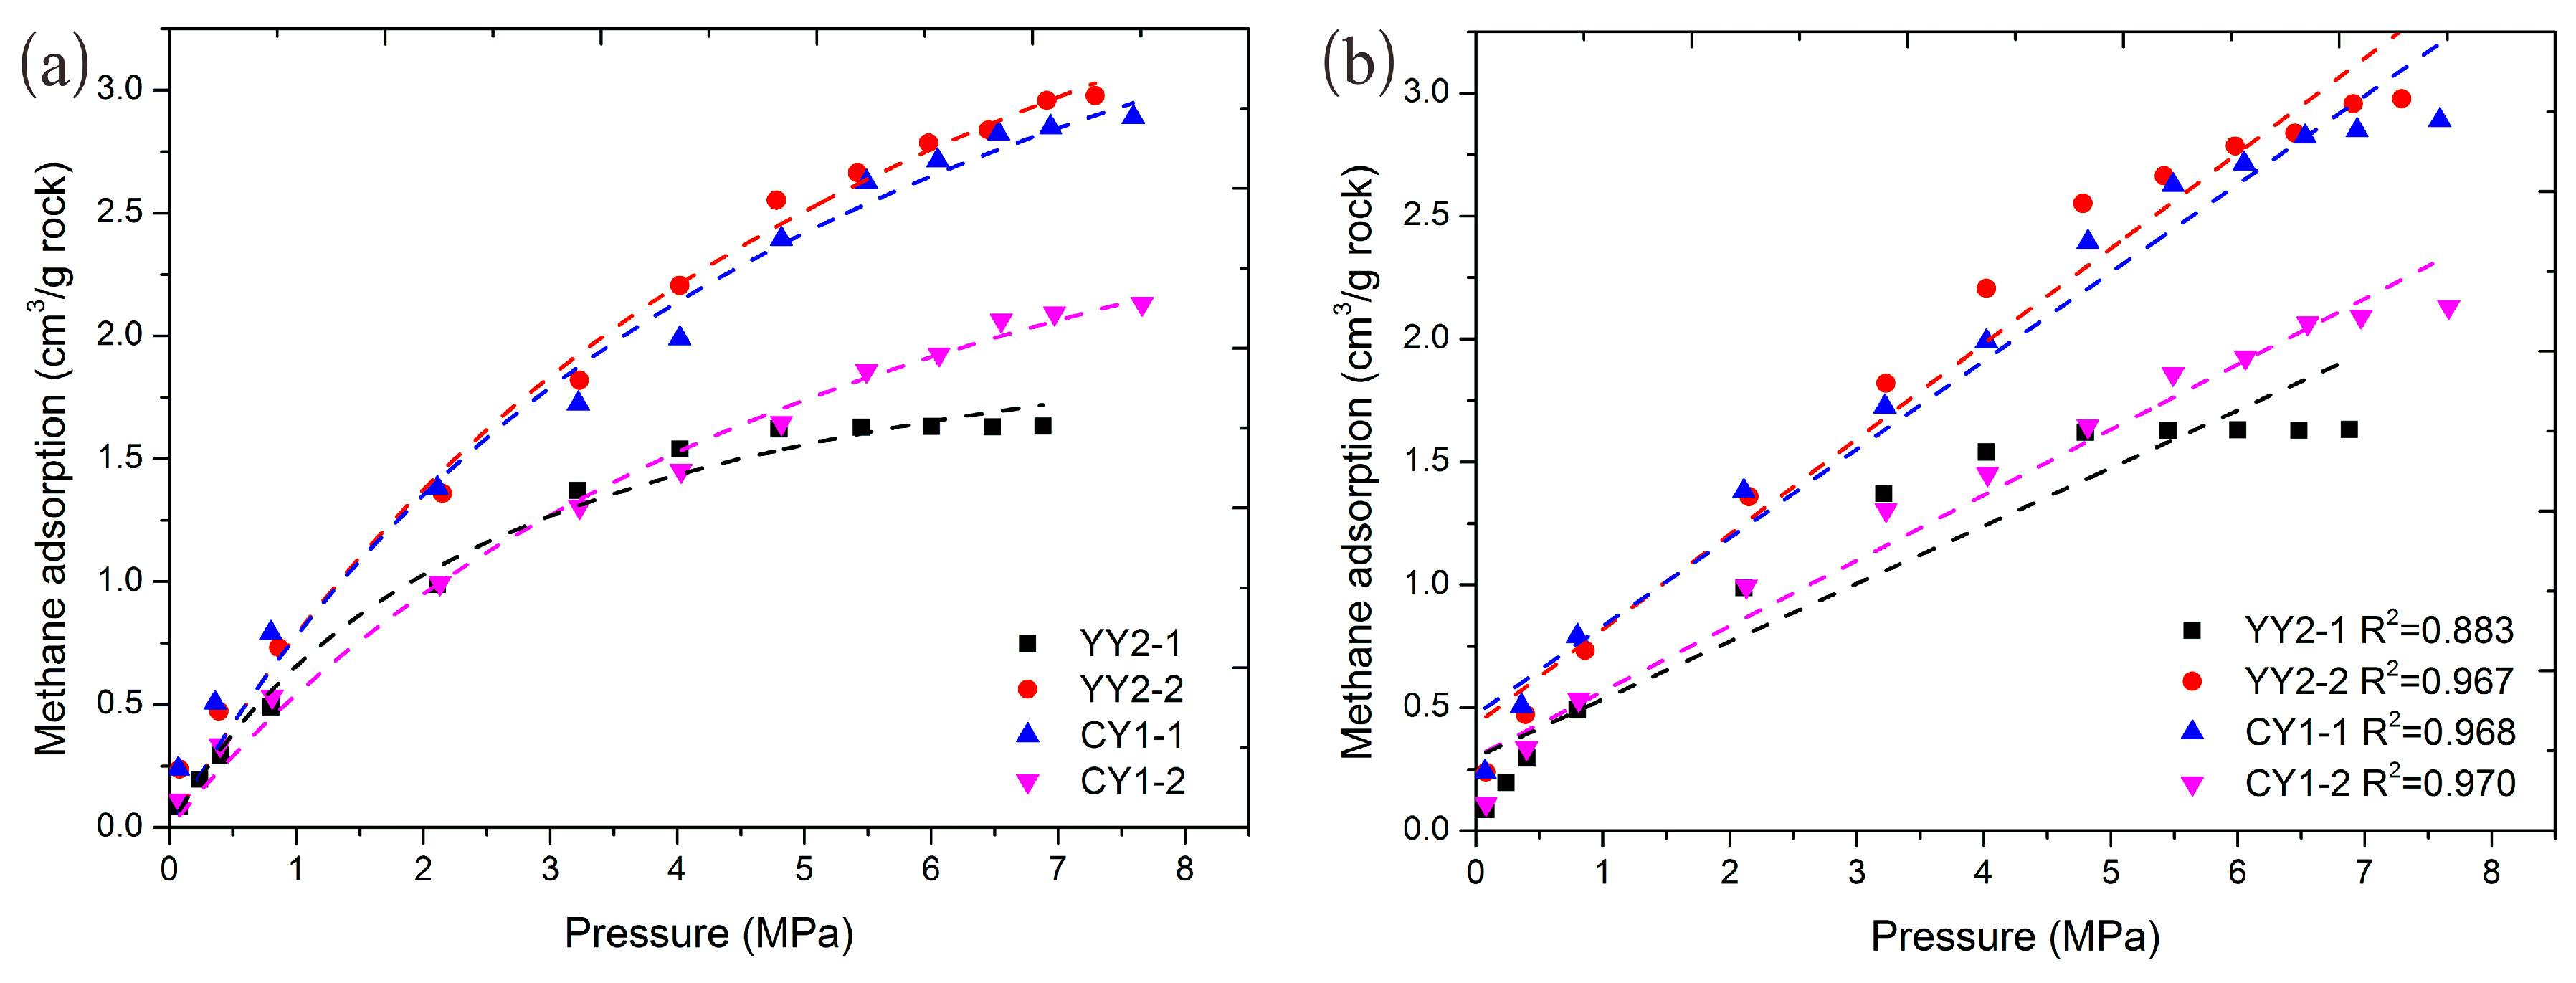
Experimental adsorption isotherms for shale samples were established according to the above experimental procedure. The corresponding measurement results are summarized in Table 2 and displayed in Figure 4. As illustrated in Figure 4, the methane adsorption isotherms for shale samples indicate that the adsorption trend followed Type I isotherm behavior. Generally, the trend of high-pressure methane adsorption isotherms showed a significant increase in the adsorption amount at low pressure and then flattened out into a plateau region at high pressure [40,44,45,46], which is believed to have been caused by the overlapping adsorption potentials between the walls of pores with similar diameters to the adsorbate molecules at low pressure and by the gradual formation of monolayers of methane molecules at high pressure [47]. In this study, however, the measured shale samples showed a steady increase and did not attain saturation at the final experimental pressure of about 7.5 MPa, with the exception of shale sample YY2-1, which exhibited a maximizing trend within the range of experimental pressures (Figure 4).
The experimental methane adsorption isotherms for the shale samples were fitted by using the Langmuir model, and good consistencies were observed between the calculated and experimental isotherms. The Langmuir parameters (VL and PL), which were obtained from the least-squares fit of methane adsorption isotherms, are listed in Table 3, with values ranging from 2.37 cm3/g to 5.55 cm3/g and 2.6105 MPa to 6.1741 MPa, respectively. According to previous studies [9,10,11,40,45,48,49,50,51], the Langmuir methane adsorption volume of organic-rich shale is controlled by a number of interior and external factors, including the shale matrix (heterogeneous mixture of organic and inorganic) and reservoir’s temperature and pressure. In particular, organic matter with a microporous structure is the dominant factor that controls the methane adsorption capacity of organic-rich shales. Additionally, previous studies have shown that the Langmuir pressure has a significant effect on gas desorption behavior during gas recovery, and the higher Langmuir pressure is, the higher amount of gas that can be recovered [52].
4.3. Methane Adsorption Kinetics
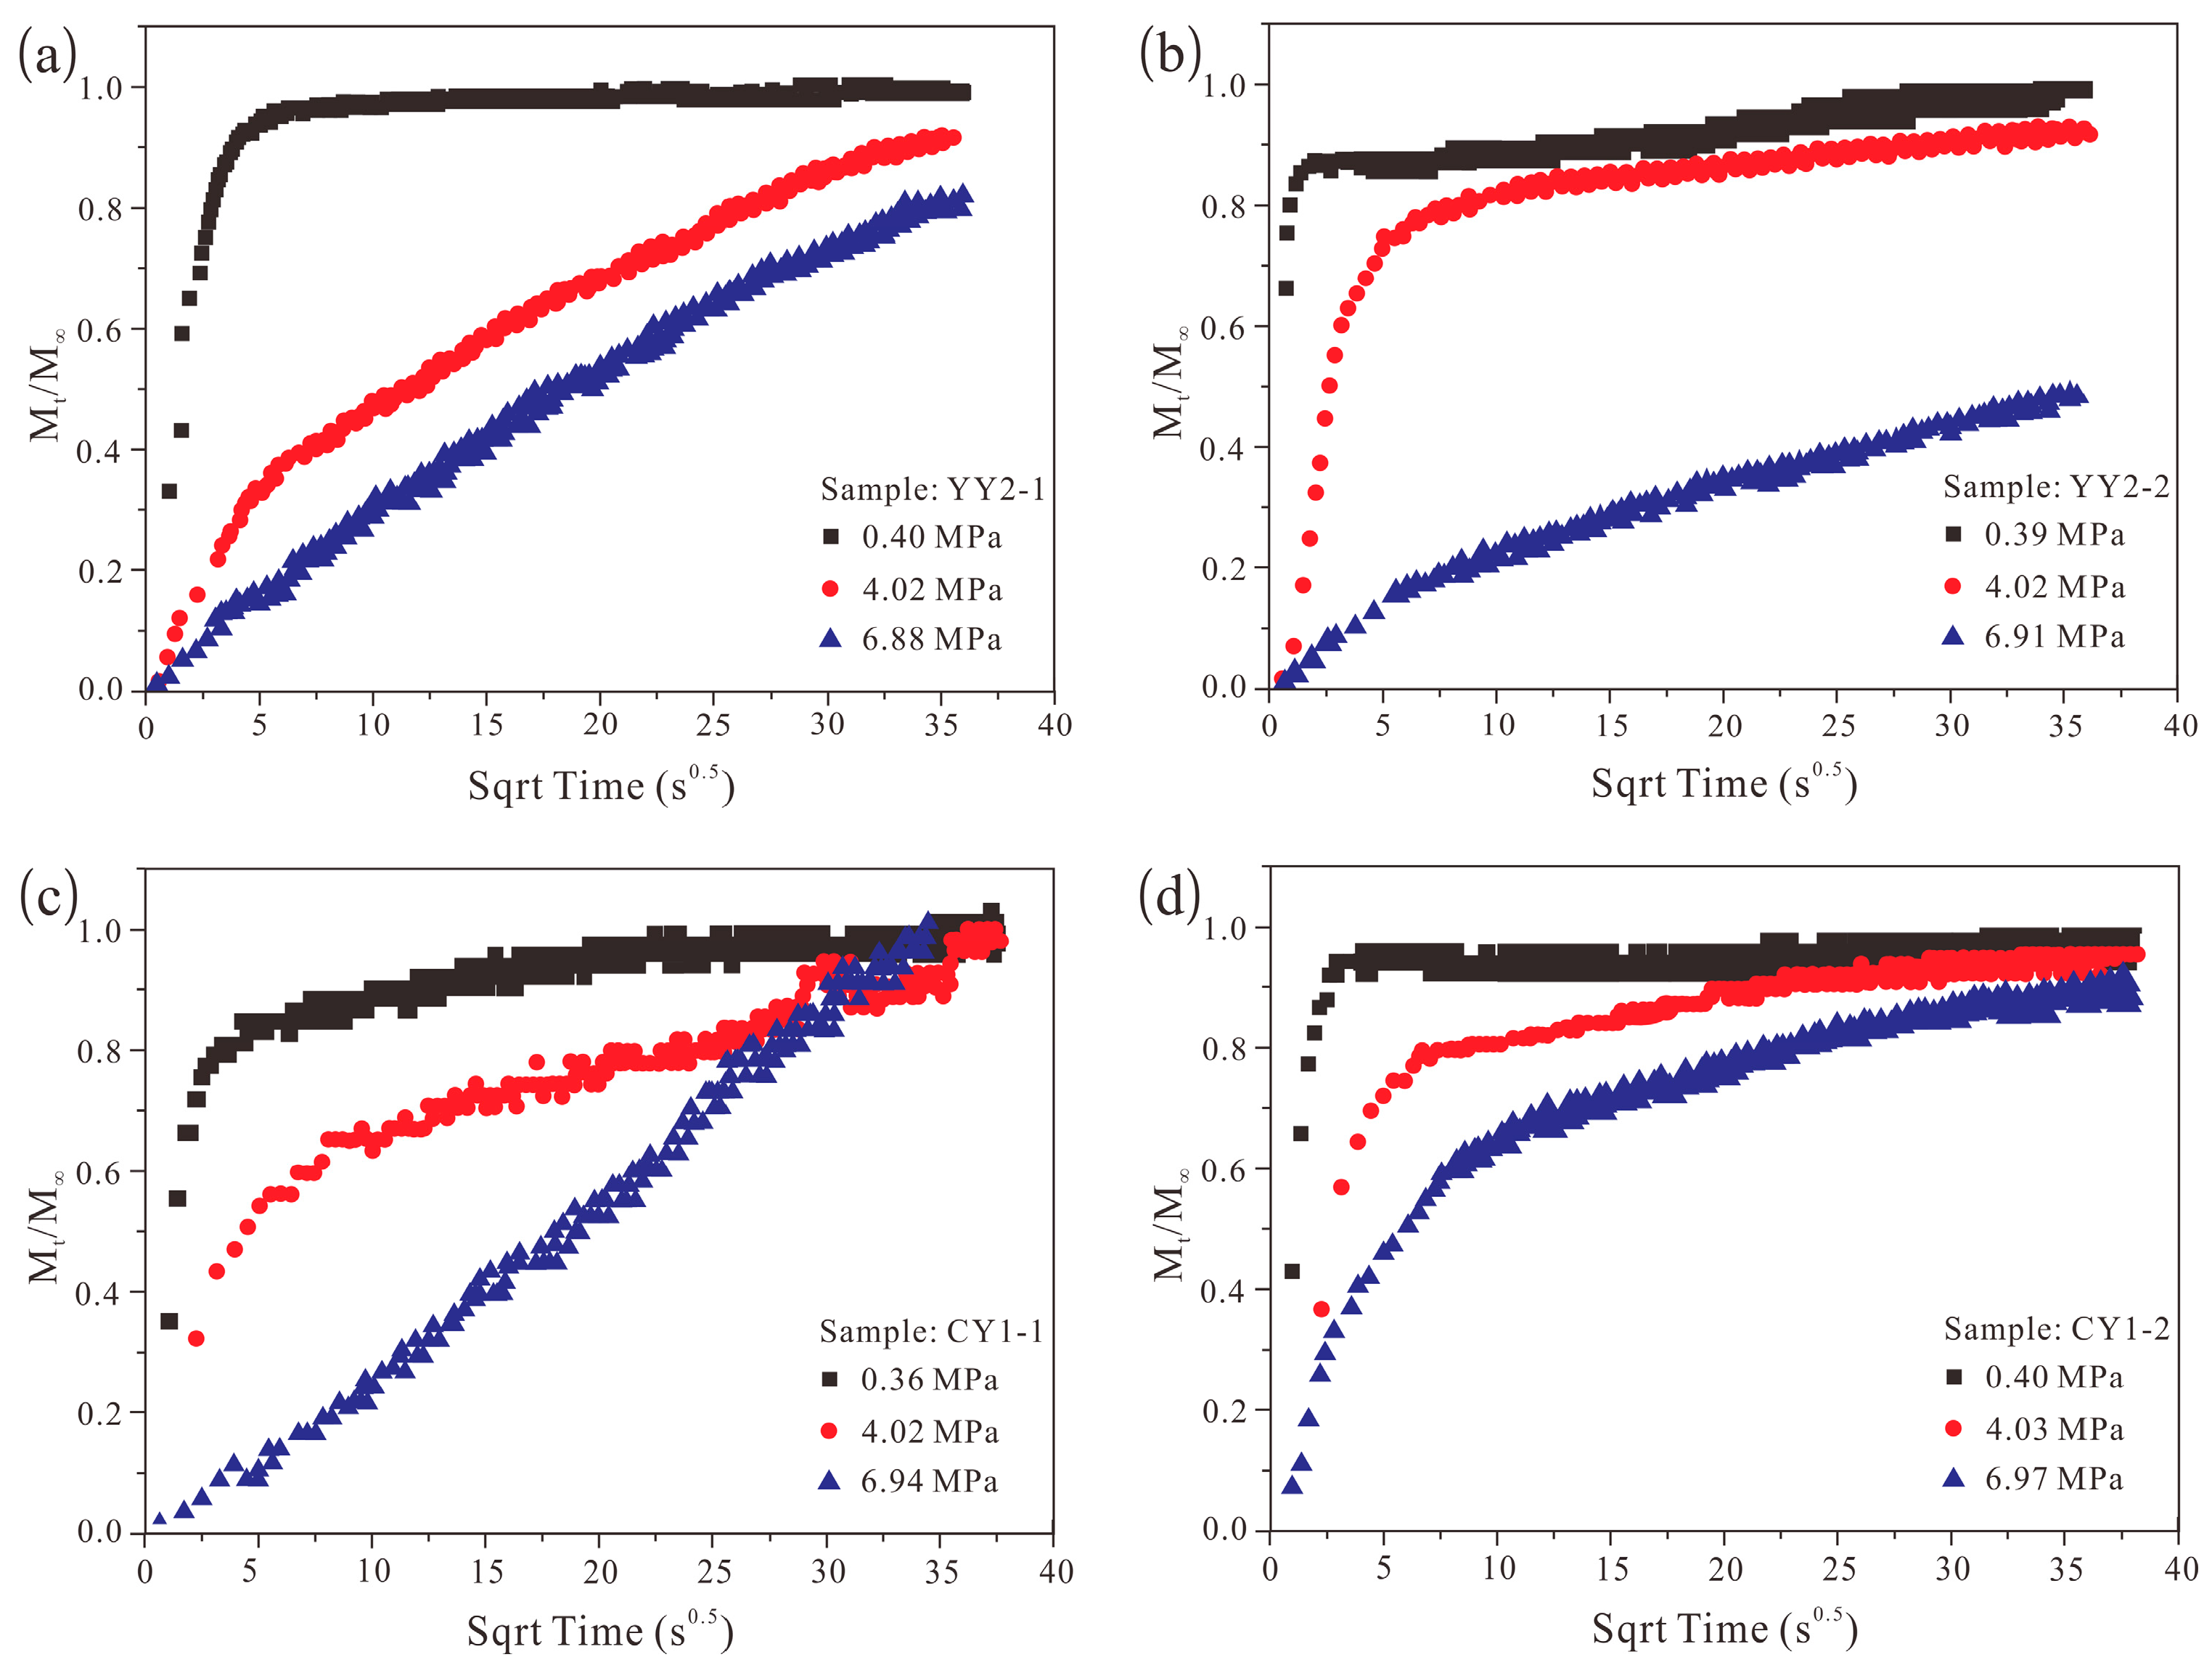
Unlike the measurement of methane adsorption isotherms, in which only the equilibrium pressure is required, the measurement of adsorption rates requires recording pressure changes at each pressure step in sample cell at any time. In this study, a total of 12 pressure steps were used to establish the methane adsorption isotherms for measured shale samples (Figure 4), and a large amount of methane adsorption rate data were recorded simultaneously for each pressure step under conditions considered to be relevant for methane storage in measured shale. To avoid repeating descriptions of similar curve trend under similar pressure ranges and improve comparative studies, seven pressure steps were selected for comparative study in this study, and three pressure steps, including ~0.4 MPa (low pressure step), ~4.0 MPa (medium pressure step), and ~7.0 MPa (high pressure step), were displayed graphically to show the adsorption rate curves, and Figure 5 shows that the experimental adsorption rate data of shale samples at three different pressure steps.
Similar to the trend of high-pressure methane adsorption isotherms, the methane adsorption rate curves at low pressure steps showed a significant increase in the fractional adsorption (Mt/M∞) at initial time range (~2.5 s0.5) and then flattening out into a plateau region, and were much steeper than those at medium and high pressure steps. Additionally, it can be easily observed from Figure 5 that only the shale sample CY1-1 reached methane adsorption equilibrium (Mt/M∞ = 1) for all three pressure steps within a current time range of 35 s0.5, while methane adsorption equilibrium of the other three shale samples was only reached at low pressure steps. Additionally, the inflection points (from the faster adsorption process at early time to the slower adsorption process at later time) of each adsorption rate curve tended to move downward from low pressure to high pressure steps. This phenomenon indicated that the methane adsorption under the lower pressure condition attained equilibrium much more quickly than that under medium and high pressure conditions. In other words, the pressure has a significant effect on methane adsorption rate and diffusion in organic-rich shale. Moreover, the existence of inflection points in adsorption rate curves also indicated that the methane diffusion process in organic-rich shale samples was a two-stage process (a faster macropore diffusion process at initial time and a slower micropore diffusion process at later time).
By comparing the adsorption rate curves at different pressure steps of four shale samples, we found that, the shape of adsorption rate curves at medium and high pressure steps differed significantly between different shale samples (Figure 5). For example, a two-stage adsorption process can be easily observed at medium and high pressure steps in shale sample CY1-2, while this phenomenon is less evident in adsorption rate curves at the same pressure step in the other three samples. Additionally, with increasing pressure steps, the inflection (from faster adsorption process at early time to slower adsorption process at later time) of adsorption rate curves at medium and high pressure steps are less evident when compared with adsorption rate curves at low pressure steps. This phenomenon may be related to the relative importance of macropore diffusion and micropore diffusion in single pressure steps, as well as the pore size distribution in different shale samples.
4.4. Methane Adsorption Rate Data: Application of Unipore Model
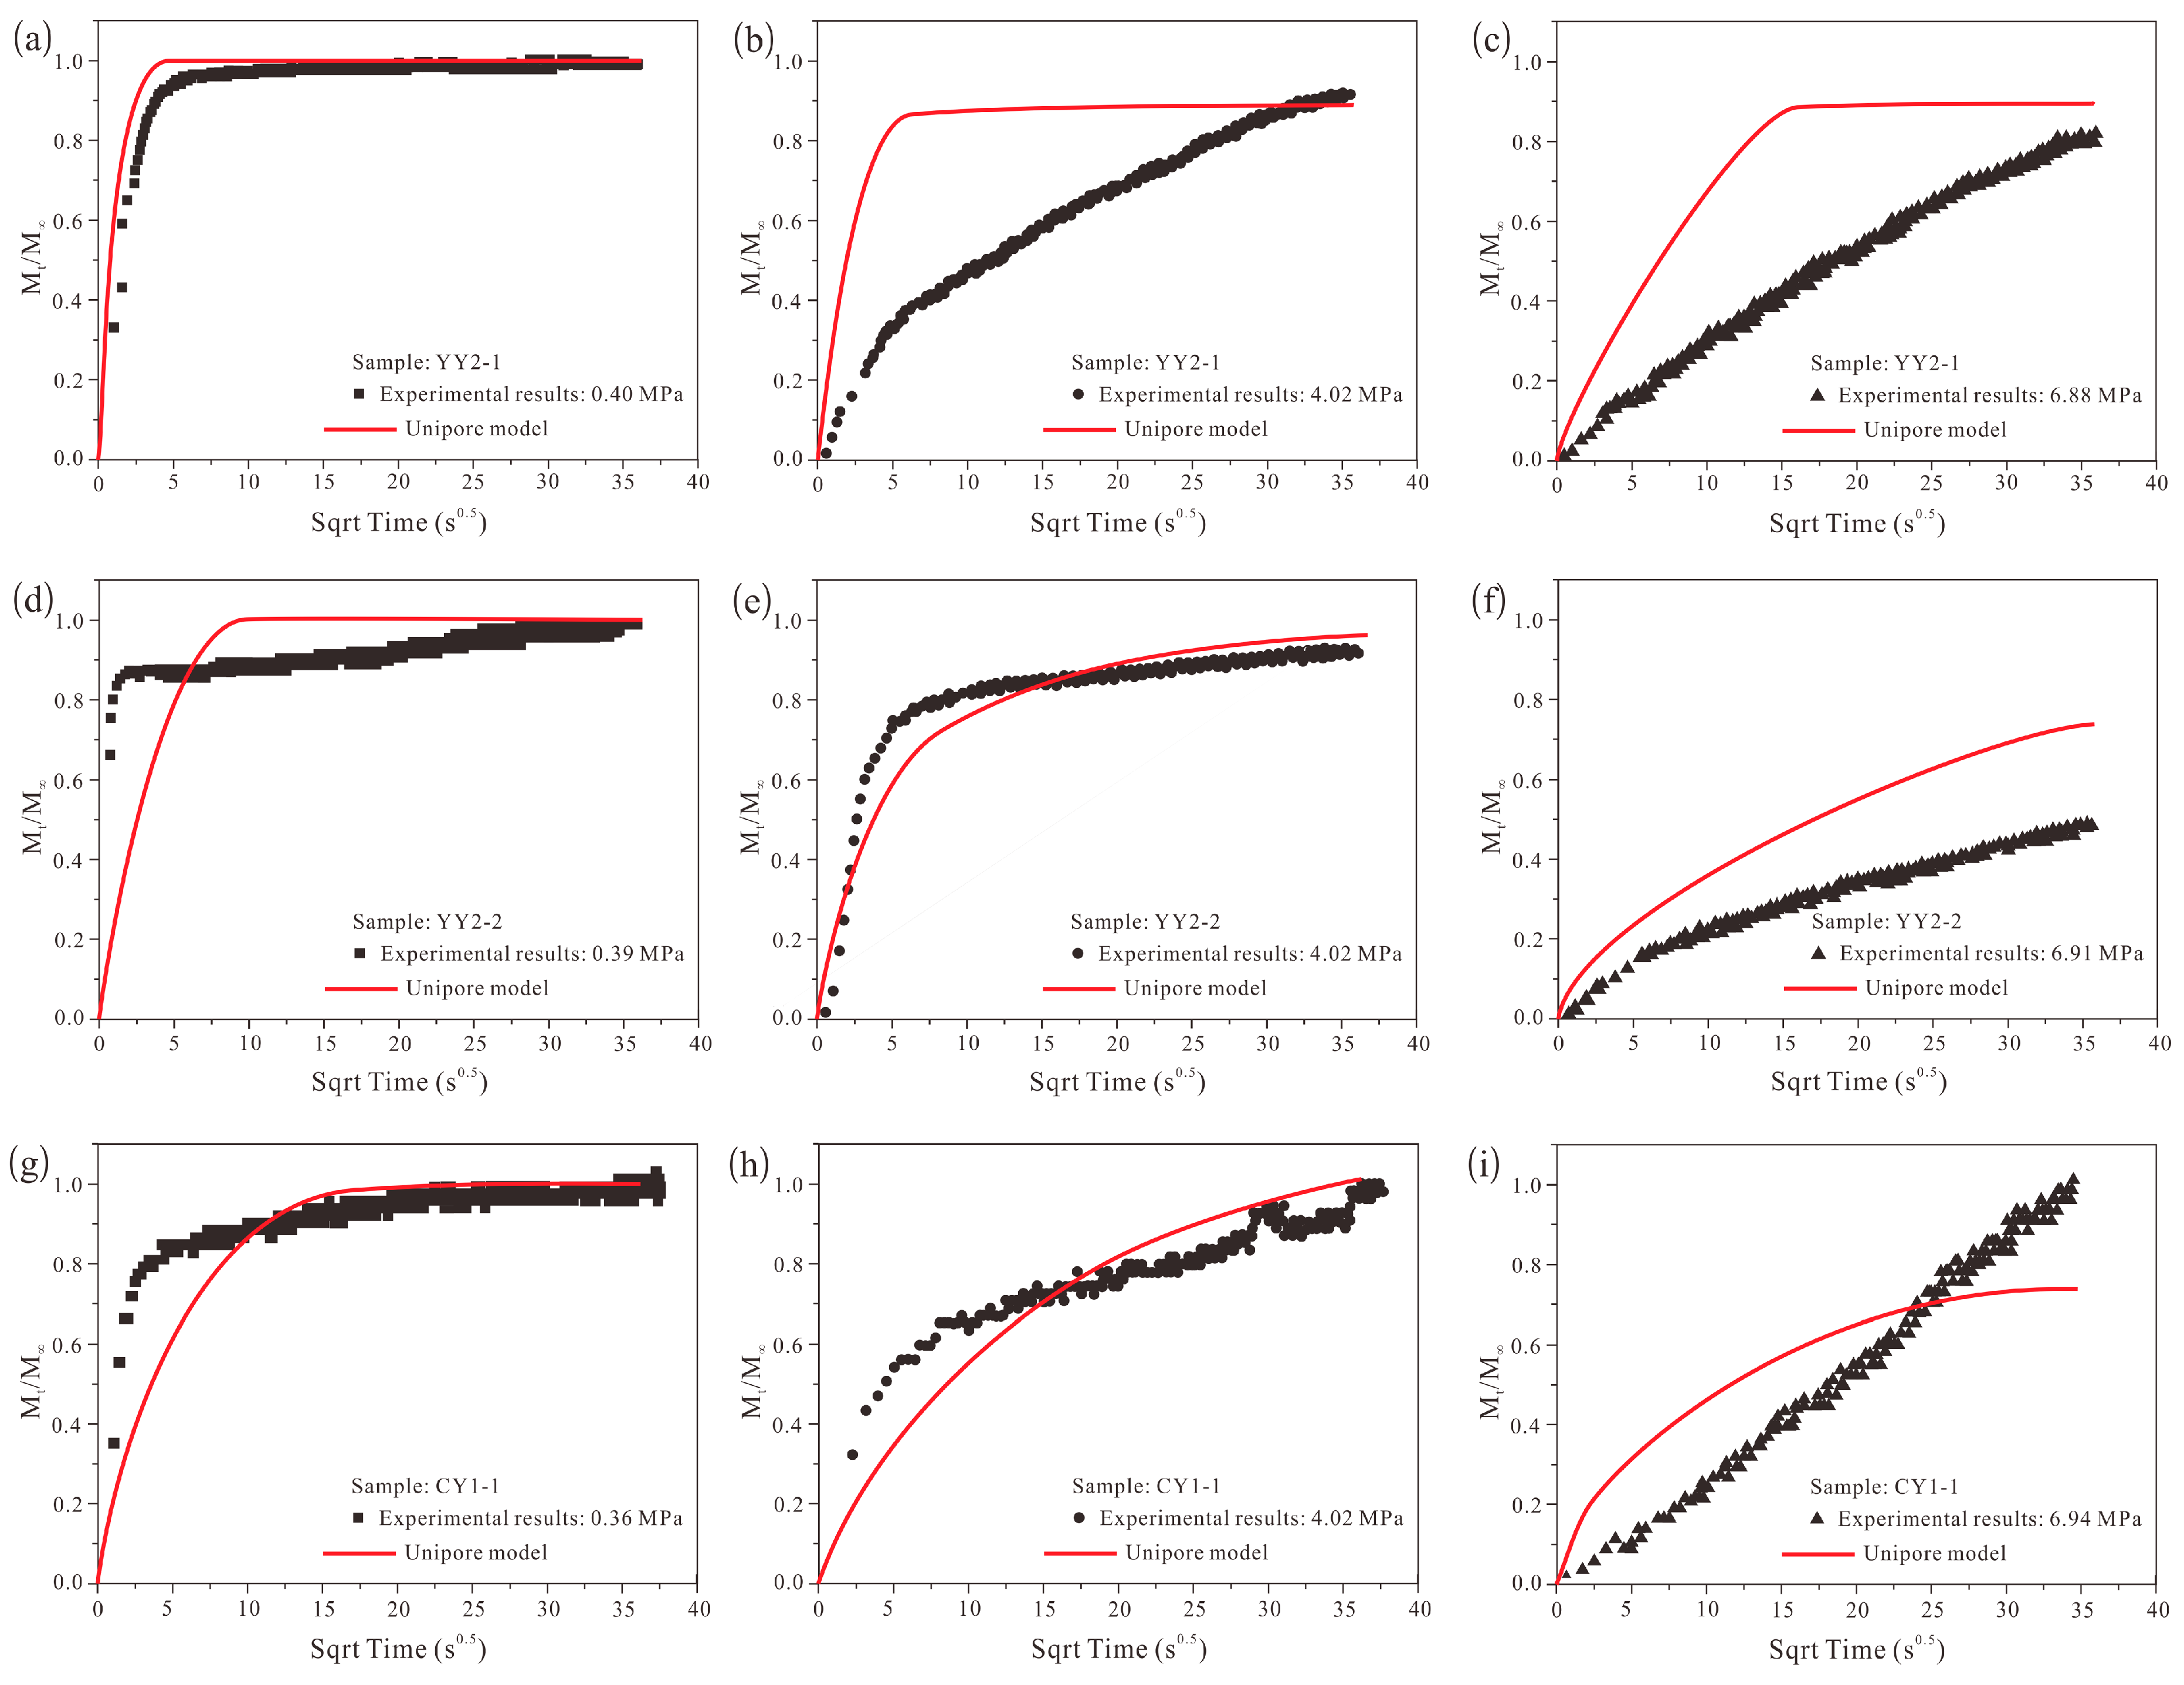
In this section, methane adsorption rate data at seven pressure steps on four dry shale samples have been modeled using the unipore diffusion model (Equation (1)), and three pressure steps of which were displayed (Figure 6), and the fitted diffusion parameters were summarized in Table 4. It can be easily observed that the unipore diffusion model failed to predict the adsorption rate data over the entire time range for all pressure steps of shale samples. However, Figure 6 also showed that the unipore diffusion model could still describe the initial adsorption rate data for some shale samples, such as sample CY1-2 at 0.40 MPa and 4.03 MPa. Similar observations have been reported by previous literature on coal samples [18,21,27]. For example, Smith and Williams [27] reported that the unipore diffusion model is valid only when the fractional uptake is less than 0.5 (Mt/M∞ ≤ 0.5), and significant deviations between the unipore diffusion model and experimental results would occur at larger Mt/M∞ values.
The failure of applying the unipore diffusion model to describe gas adsorption and diffusion processes over the entire time range in coal or shale samples has also been reported. For example, in an early study conducted by Clarkson and Bustin [3] on coal samples, they found that both analytical and numerical unipore models developed by themselves failed to predict the methane and carbon dioxide adsorption rate data over the entire time range. Previous studies [3,16] have shown that the gas adsorption rate behavior of coal or shale samples may be significantly affected by the pore size distribution and, thus, the sample which is homogeneous with respect to pore size distribution can be fitted well by the adsorption rate models based upon a unimodal pore structure. However, the pore size distribution in shale matrix is generally characterized by bimodal instead of unimodal characteristics [10,16,53,54,55,56], and from the analysis of SEM images (Figure 3), the pore size distribution of shale samples involved in this study are heterogeneous instead of homogeneous. Additionally, in the experimental approach used here, the gas concentration is not constant due to methane adsorption on the surface of shale powder sample throughout the single adsorption process (Figure 7). Thus, the unipore diffusion model based upon the restrictive assumption of unimodal pore volume distribution and constant gas concentration failed to describe the adsorption rate data over the entire time range of shale sample.
4.5. Methane Adsorption Rate Data: Application of Bidisperse Model
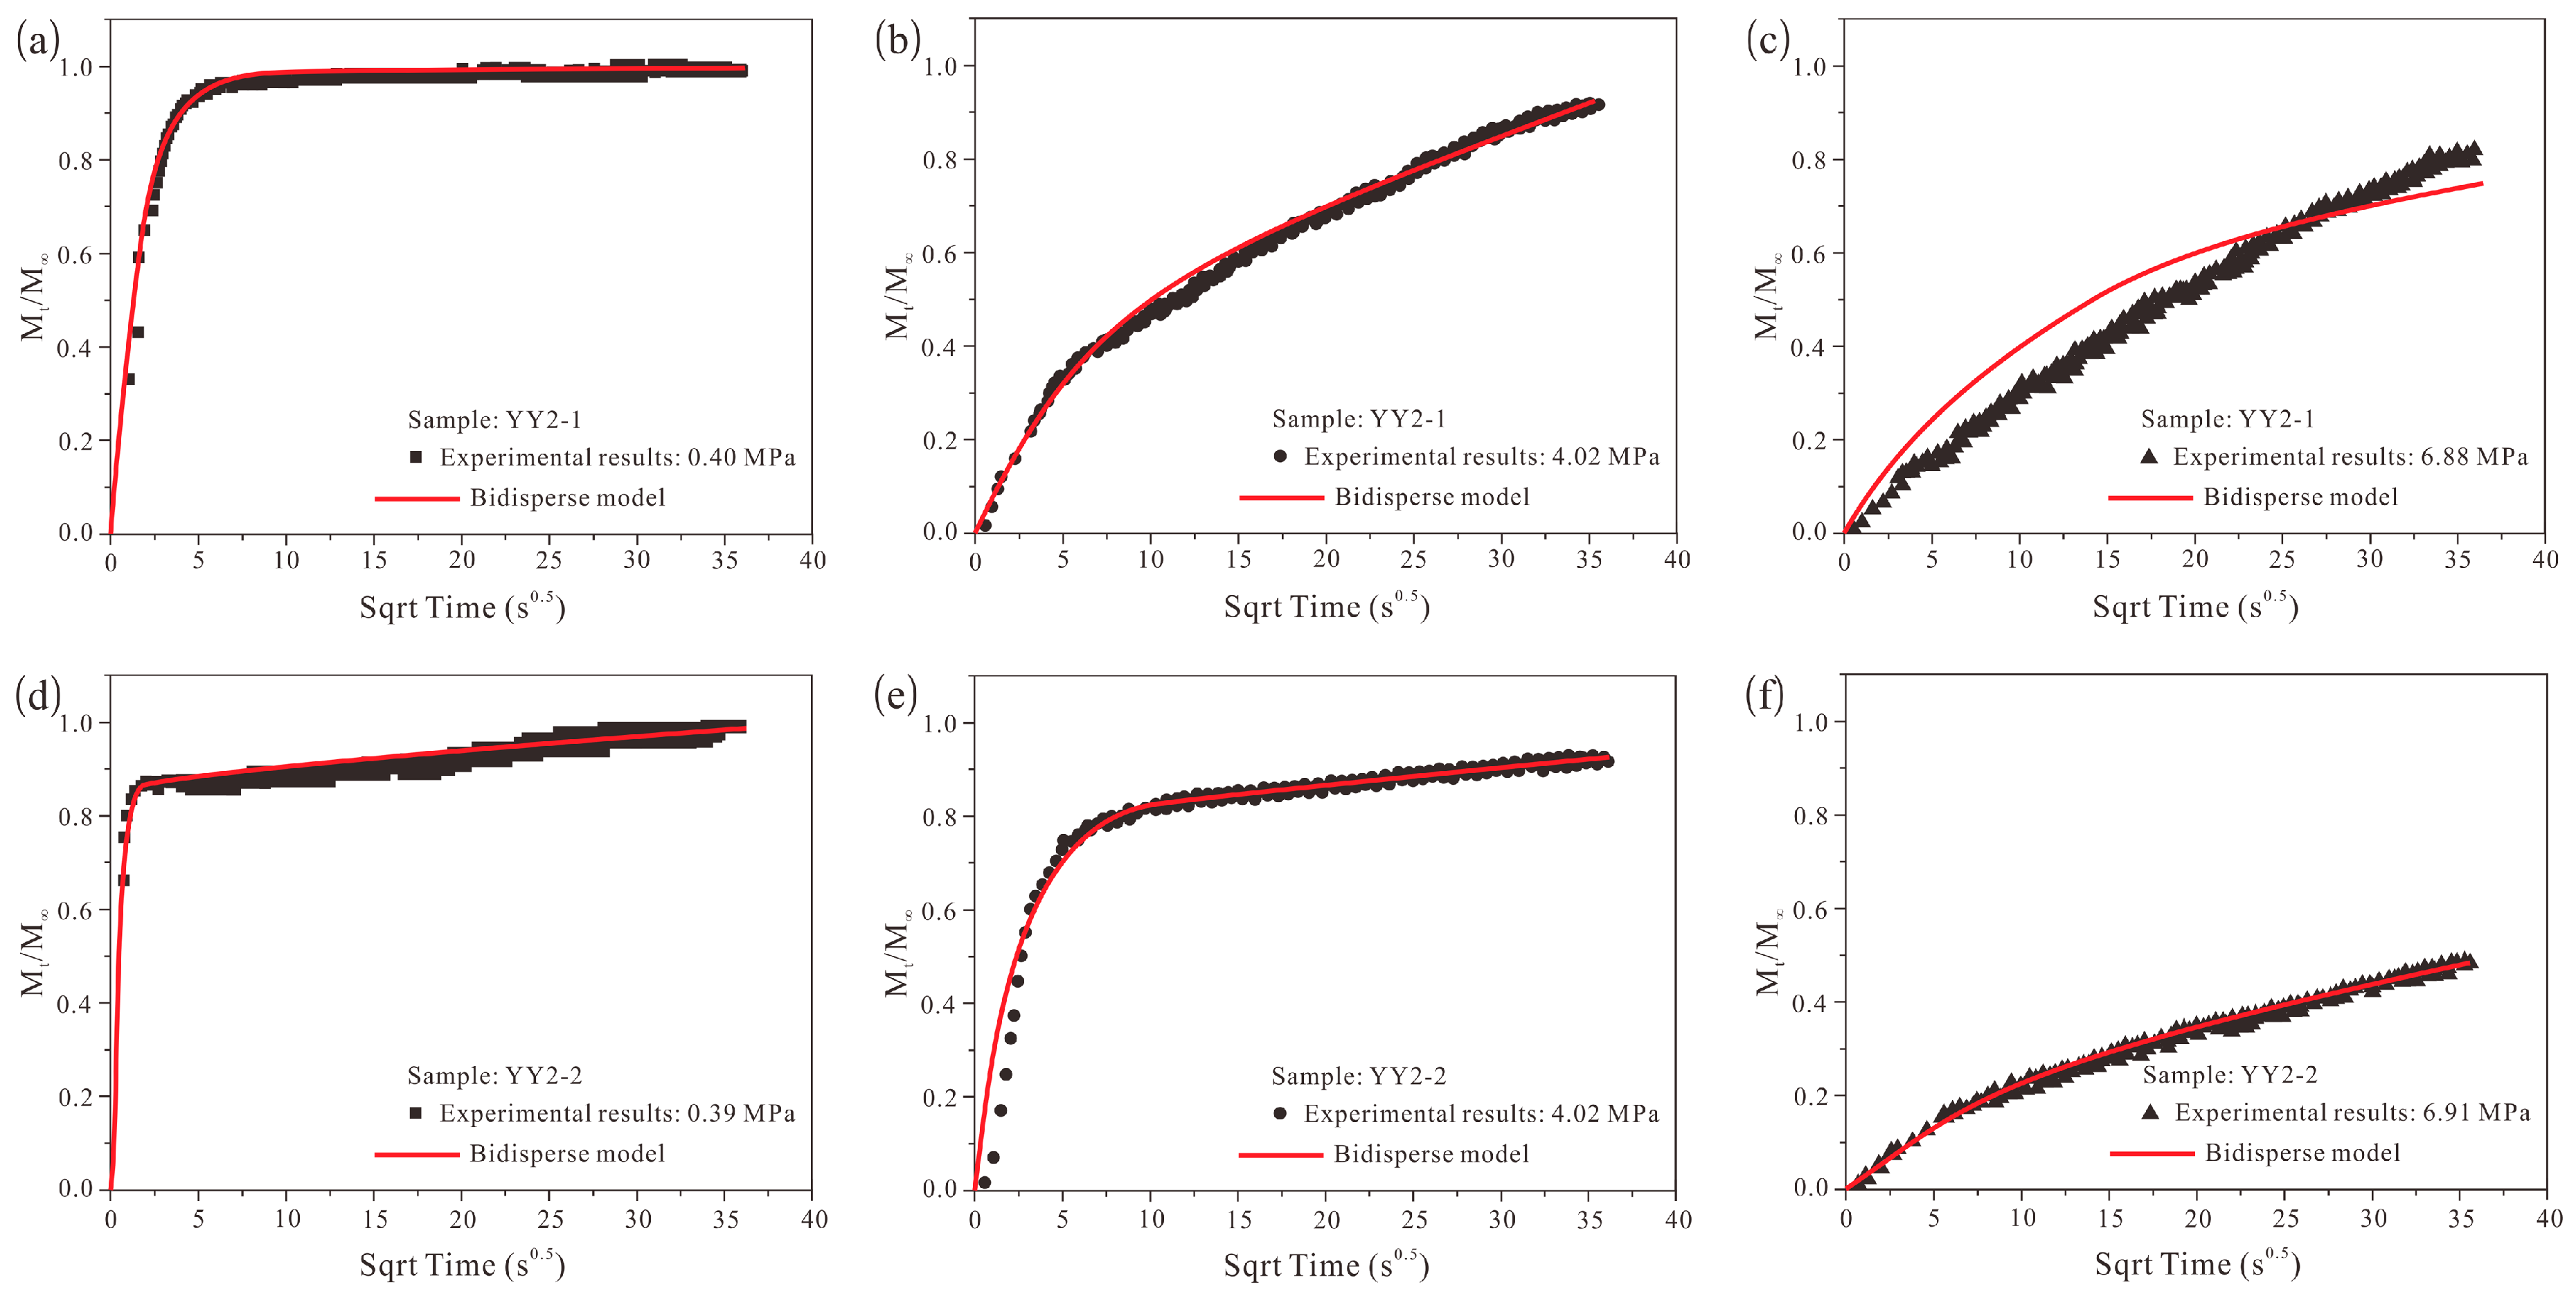
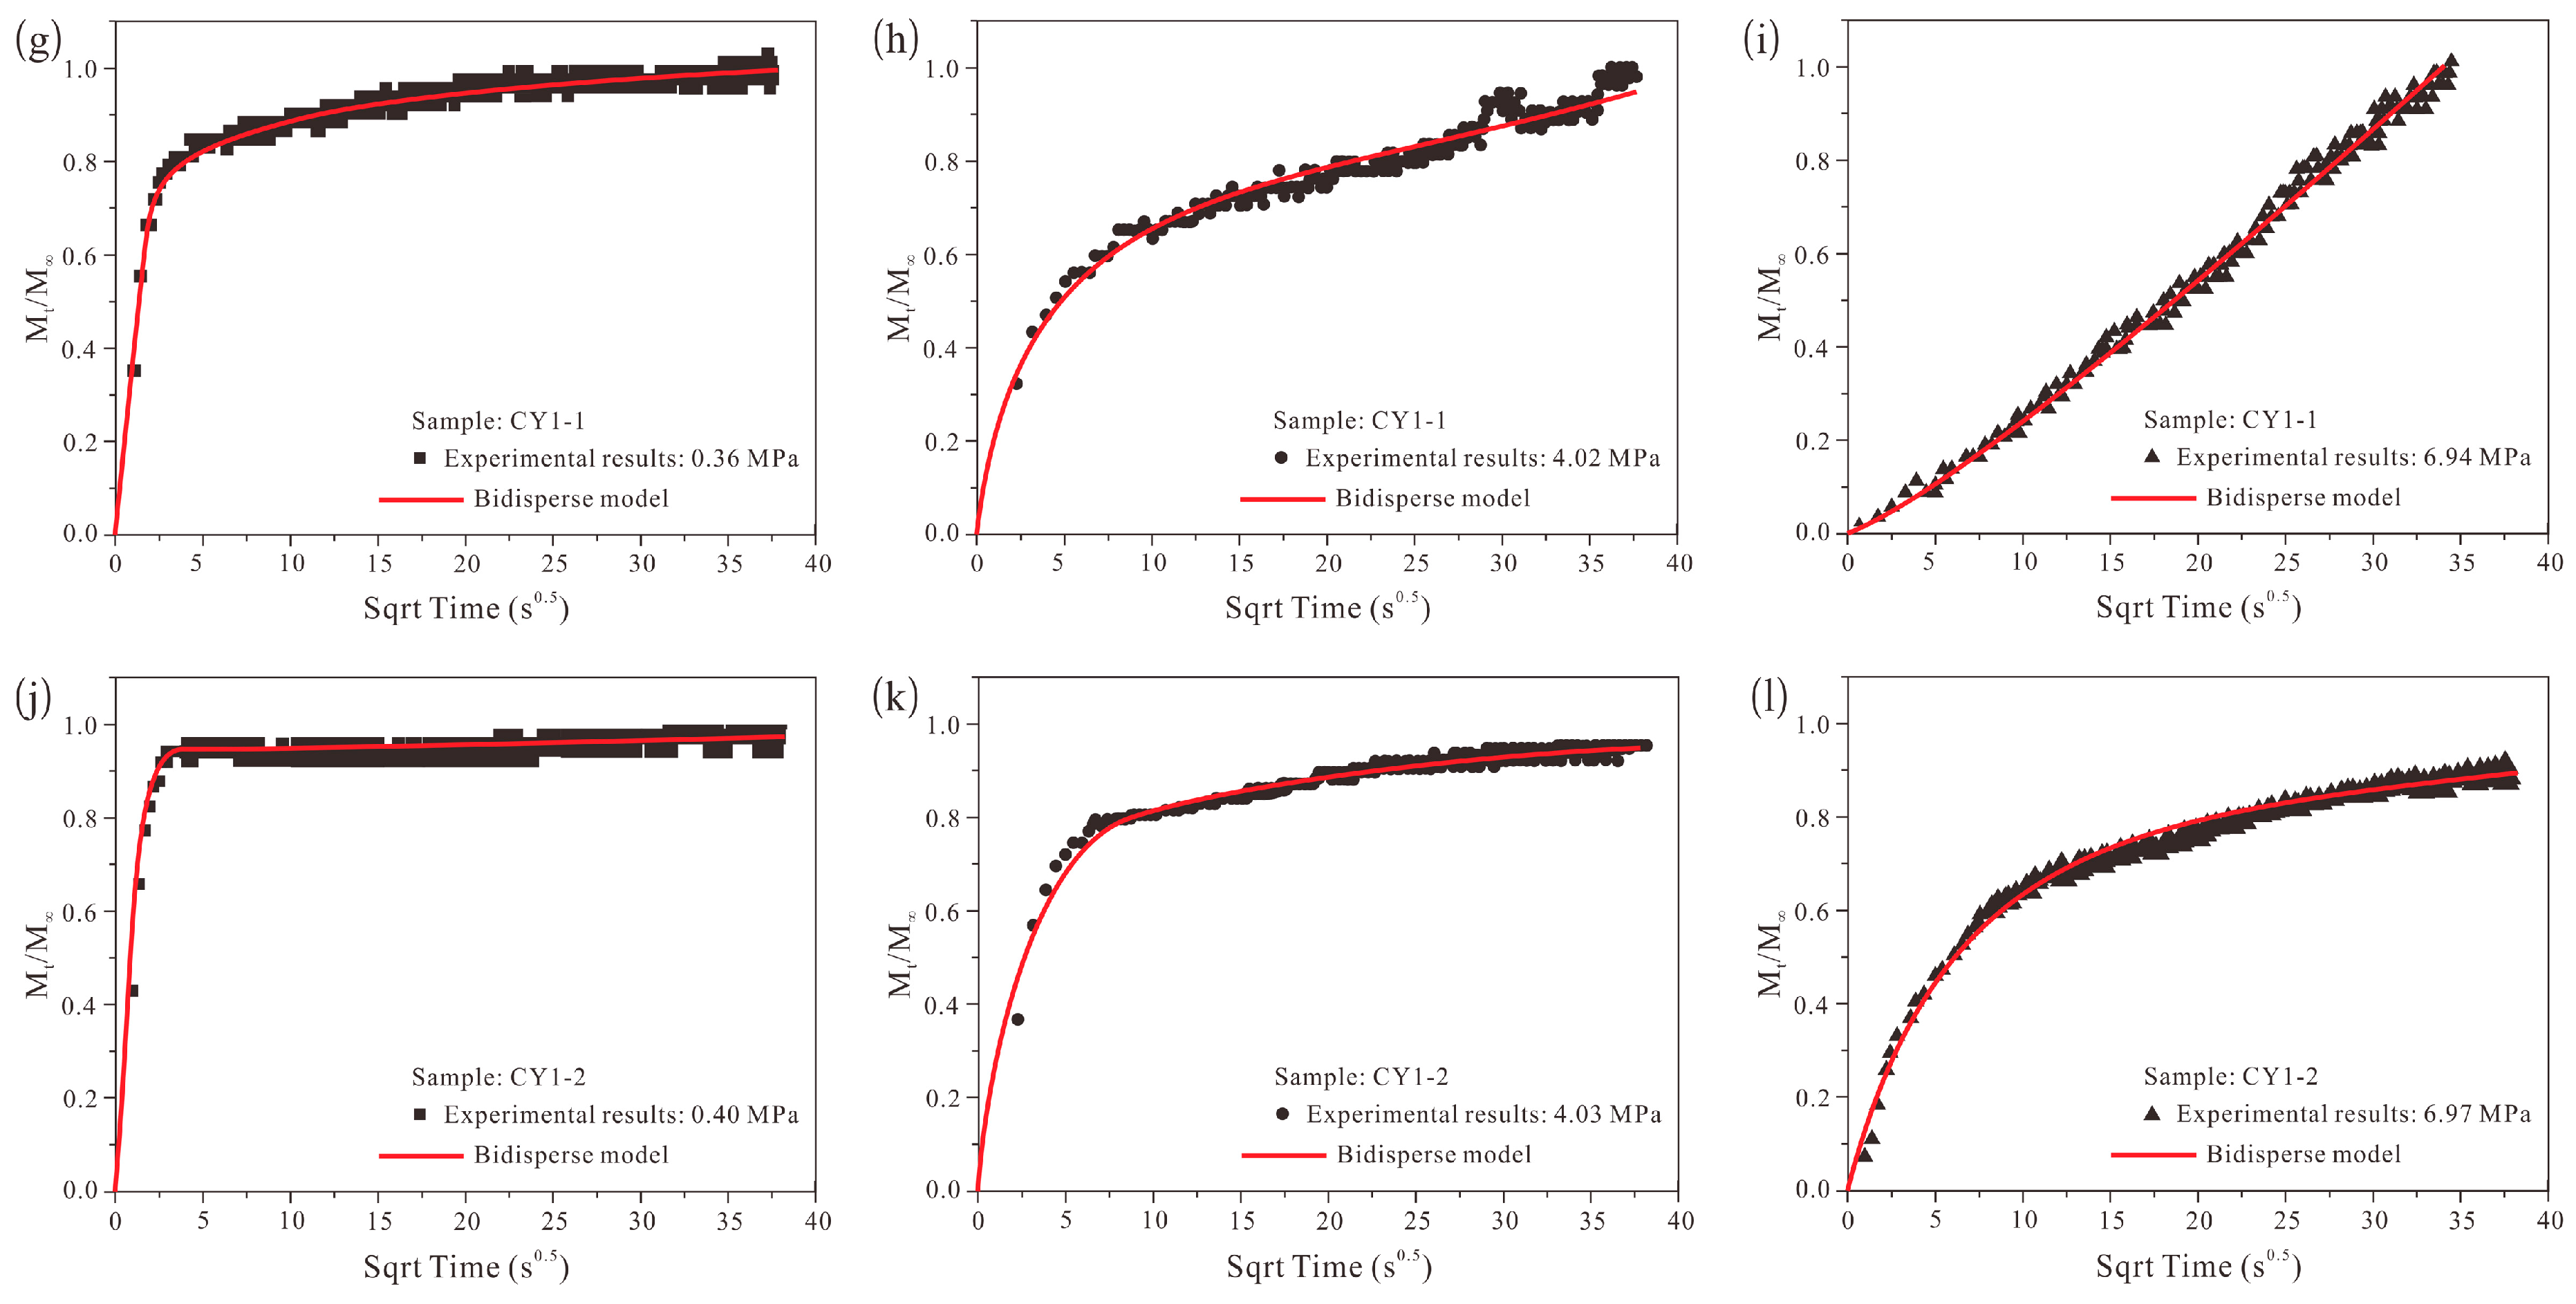
In this section, the bidisperse model was also applied to fit the methane adsorption rate data at the same seven pressure steps on four dry shale samples (Equation (8)), and three pressure steps of which were displayed (Figure 8), and the fitted diffusion parameters, including macropore diffusivities /, micropore diffusivities /, β/α, and α, are summarized in Table 5.
As illustrated in Figure 8, except for the adsorption rate curve of shale sample YY2-1 at high pressure step, the bidisperse diffusion model based upon bimodal pore structure could reasonably describe the methane adsorption rate data over the entire time range for all shale samples at each pressure step, indicating that methane diffusion in organic-rich shale is a two-stage process, with a faster macropore diffusion stage earlier and a micropore slower diffusion stage later. In fact, compared with several failed modelling reports on coal samples using the bidisperse model at high pressure [3,22], rare studies reported the failure of the bidisperse model to describe the gas adsorption rate data at high pressure in shale samples. In an early study conducted on lower Silurian shale in the Sichuan Basin of China by Yuan et al. [16], only the adsorption rate data at lower pressure steps were reported. As mentioned in Section 2.2, the bidisperse model assumed that the adsorption isotherm is a linear function of pressure for methane. In this study, it is apparent from Figure 4 that, when compared with three other adsorption isotherms which are near linear, the adsorption isotherm for shale sample YY2-1 is obviously non-linear, and this was considered to be the reason for the failed modelling using the bidisperse model at high pressure steps.
As we mentioned above, the unipore diffusion model failed to predict the methane adsorption process, so the diffusion parameters obtained by bidisperse model were applied here to describe the diffusion process although the modelling for sample YY2-1 at high pressure steps is not excellent. As shown in Table 5, the order of magnitude of macro- and micropore diffusivities is roughly from 10−3 to 100, and 10−3 to 10−1, respectively, and diffusivities are varied between different shale samples at the same pressure steps, this may be related to the different pore structure and matrix composition characteristics between different shale samples. The methane macro- and micropore diffusivities (Table 5) determined from adsorption rate data on dry shale samples are comparable in magnitude to those found by Yuan et al. [16]. Additionally, we found that the order of magnitude of diffusivities between macro- and micropore is almost the same at medium and high pressure steps, and the difference value between these two decreased with increasing pressures. For shale sample CY1-2 at high pressure step of 6.97 MPa, the macro- and micropore diffusivities are similar. This phenomenon may suggest that the relative importance of micropore diffusion to total adsorption increases with increasing pressures, and both micropore and macropore diffusion is significant for methane adsorption in shale samples.
In this study, the methane adsorption rate characteristics of coals were not studied. However, by comparing the published methane diffusivity data of coal samples [3,14,22,29], we found that there are discrepancies in the magnitude of diffusivities between coal and shale samples involved in this study, and both the unipore and bidisperse models reveal that methane diffusivities in shale samples are 2–4 orders of magnitude larger than that in coal samples. Compared with coals that are generally characterized by a large amount of nanometer-sized pores and relatively low amounts of micrometer-sized pores, the pore structure of over-mature marine shale is generally characterized by relatively small amounts of nanometer-sized pores and large amounts of mineral-associated micrometer-sized pores [14,16,57]. Additionally, previous researchers have pointed out that the nanometer-sized pores are the primary control upon gas adsorption, while the micrometer-sized pores likely serve as gas transport pathways [3,8,14]. This may be the reason why shale with lower methane adsorption capacity possesses higher gas diffusivity when compared with coal.
4.6. Effect of Pressure and Surface Coverage on Methane Diffusivity in Shale
In Section 4.2, the negative effect of pressure upon the adsorption rate curves have been clearly observed (Figure 5). To quantitatively determine the effect of pressure on methane diffusivities, the macro- and micropore diffusivities were determined from seven pressure steps of the adsorption isotherms by using bidisperse model. The results describing the variation in the value of diffusivity with pressure for shale samples are shown in Figure 9.
It is apparent that there is an evident negative correlation between macropore diffusivity and pressure lower than 3–4 MPa (Figure 9a), while the micropore diffusivity only showed a gentle decreasing trend with pressure (Figure 9b), with the exception of sample YY2-2 and CY1-1. According to Yuan et al. [16], the pressure dependency of diffusion variations between macro- and micropores may be related to the different diffusion mechanisms in pore types (Fickian diffusion in macropores and Knudsen diffusion in micropores). The negative correlation between methane diffusivity and pressure lower than 3–4 MPa may suggest that the diffusivity is not constant over the entire development process of the gas shale reservoir, and the ease with which methane diffusion in shale matrix improves with pressure reduction. The variation trends in diffusivity with pressure in this paper are consistent with other diffusivity results that have been reported in previous studies [3,16,23]. For example, Cui et al. [23] reported that the gas diffusivities decrease with increasing pressure lower than 3.6 MPa, and this finding appears to be comparable with our results.
In addition to the above observations, Nandi and Walker [34] found that there is no direct correlation between pressure and adsorption rate data when the pressure is lower than 2 MPa. Additionally, previous researchers [58] observed the positive correlation between gas diffusivity and pressure, and found that the gas diffusivity has a positive correlation with surface coverage (adsorbed volume). By plotting the variation in the value of diffusivity and adsorption isotherms, however, we found that there is a mirror image relationship between the variation in the value of macropore diffusivity and adsorption isotherms, the macropore diffusivity decreased with increasing adsorption volume or surface coverage, indicating the negative correlation between surface coverage and gas diffusivity (Figure 10). This observation is consistent with the reports by Pillalamarry et al. [28], while in opposition with the results mentioned above. Based on this, the reduction in methane diffusivity with pressure may be attributed to two reasons: (1) the degree of pore blockage by methane molecule increase with increasing surface coverage (adsorbed volume), making methane molecules difficult to diffuse into adsorption sites through pathways [59]; and (2) as methane diffuses into adsorption sites, the concentration gradient between bulk particles and their surfaces decrease with increasing pressures and adsorbed volume, slowing methane diffusion.
4.7. Analysis of Methane Adsorption Rate Behavior between Different Pressure Steps
As we mentioned above, considering the heterogeneous pore size distribution characteristics of shale, the two-stage gas diffusion process occurred in shale samples at each pressure step, which can be adequately described by the bidisperse model, is expected. However, we found in Figure 5 that the inflection points (from the faster adsorption process during the earlier time compared to the slower adsorption process during the later time) of adsorption rate curves at medium and high pressure steps are not evident when compared with adsorption rate curves at low pressure steps. In other words, the two-stage process in higher pressure steps is not as evident as in lower pressure steps.
Ruckenstein et al. [31] reported that the fitted parameter α (Table 4) represents the ratio of the time scales of diffusion processes that occurred in the macrospheres and microspheres, and can be expressed as
where tm is the order of magnitude of the time required for penetration of macrosphere by diffusion, and ti is the order of magnitude of the time required for penetration of microsphere by diffusion. Only when the value of α is less than 0.001, which indicates that the macropore diffusion is much faster than the micropore diffusion, does the adsorption rate behavior essentially occur in two stages. Additionally, Ruckenstein et al. [31] pointed out that the values of α ranging from 0.001 to 100 indicates that both macro- and micropore diffusion control the adsorption rate. Furthermore, Roberts and York [60] reported that the value of α is on the order of 0.1–1.0 clearly indicates that both macro- and micropore diffusion processes control the gas adsorption rate to equilibrium. As presented in Table 5, the order of the values of α obtained in this paper is roughly between 0.01 and 1.0, indicating that both macro- and micropore diffusion control the methane adsorption rate behaviors at each pressure step in all measured shale samples. Additionally, the positive correlation between pressure and the values of α in this study (Figure 11a) indicated an increase in the time required for penetration of macrosphere by diffusion with increasing pressure, or a decrease in the time required for the penetration of microspheres by diffusion with increasing pressure. In other words, the increasing values of α with increasing pressure indicated a decrease in the rate of macropore adsorption or diffusivity or an increase in the rate of micropore adsorption or diffusivity, which contrasted with the observations in Figure 9b. Thus, relative to the rate of micropore adsorption or diffusivity, only the significant decrease in the rate of macropore adsorption or diffusivity made the positive correlation between pressure and the values of α in this study possible. This was also supported by the above observations in Figure 9a, which shows the decrease in macropore diffusivity with increasing pressure. Therefore, although both macro- and micropore diffusion control the methane adsorption rate in each pressure step, the relative influence of macropore diffusion on the adsorption rate decreases with increasing pressure, while the relative influence of micropore diffusion on the adsorption rate is increasing. This conclusion was also supported by the similar or same order of magnitude between macro- and micropore diffusivities at medium and high pressure steps (Table 5).
Additionally, the values of (1/3)(β/α), as presented in Table 5, represents the ratio of micropore and macropore adsorption () at equilibrium (Mt/M∞ = 1.0), and small values of (1/3)(β/α) indicate negligible micropore adsorption while, for large values, the macropore adsorption is negligible [31]. Thus, the ratio of micropore and macropore adsorption () at adsorption equilibrium are obtained for each pressure step using the equation:
where is the methane adsorption amount in micropores at equilibrium, is the methane adsorption in macropores at equilibrium, and the values of β/α are obtained by fitting the bidisperse model to adsorption rate data. Figure 11b illustrated the positive correlation between pressures and the ratios of micropore and macropore adsorption for shale samples, reflecting the relative importance of micropore adsorption to total adsorption amount is increasing with increasing pressures. In other words, the adsorption sites in macropores are already, or almost, full at lower pressure steps, so less methane adsorption in macropores can occur at higher pressure steps. Therefore, the inflection points of adsorption rate behavior curves not being evident at higher pressure steps was attributed to two reasons: (1) the methane adsorption rate behaviors in these shale samples throughout the adsorption process is both macro- and micropore diffusion controlling, and the relative influencing of micropore diffusion on adsorption rate increased; and (2) the relative importance of micropore adsorption to total adsorption increased with increasing pressure steps. Additionally, previous studies [3,16] also have shown that the relative proportion of macro- and micropores have a significant effect on gas adsorption rate behavior, which may be the reason why the adsorption rate behavior curves of samples YY2-2, CY1-1, and CY1-2 at medium and high pressure steps are much steeper than that of sample YY2-1 at medium and high pressure steps (Figure 5). However, the specific reasons still need to be proved by other data.
4.8. Implications for Gas Shale Reservoir Characterization
The significant effect of pore structure on gas diffusion behavior in coal and shale has been well known. In this study, our observations are that the bidisperse diffusion model, which was based upon the bimodal pore size distribution characteristics, can adequately describe most of the adsorption rate data, while the unipore diffusion model based upon the unimodal pore size distribution failing, also indicates the significant effect of pore structure on gas diffusion. In the past several decades, some methods, including the USBM (United States Bureau of Mines) direct method, USBM modified direct method, Smith-Williams method, and the Amoco curve fit method, have been proposed based on the unipore diffusion model to estimate the lost gas content of coal or shale samples [17,61,62,63,64,65,66,67], and the primary difference among these methods exists in how these methods use the gas desorption data to estimate the lost gas content. For example, the USBM direct method only uses several early gas desorption data to estimate the lost gas content, while the Amoco curve fit method uses all of the gas desorption data to estimate the lost gas content. However, in this study, we found that the unipore diffusion model is inadequate for both early or all gas adsorption rate data (Figure 6). Thus, using the estimation methods based upon the unipore model may lead to errors in the lost gas content determination, especially for shale with heterogeneous reservoir characteristics. Based on this, developing a new lost gas content estimation method based upon some better models is necessary for improving the accuracy of estimation. Recently, two new modified bidisperse diffusion models incorporating the properties of gas diffusion behavior and the complicated pore size distribution characteristics in shale and coals were developed by Haghshenas et al. [19] and Li et al. [68], respectively. Although these models could better describe the entire adsorption rate data in shale or coal than the bidisperse model, these modelling equations, involving much more complicated mathematical processes, were difficult to apply in other gas adsorption or desorption data.
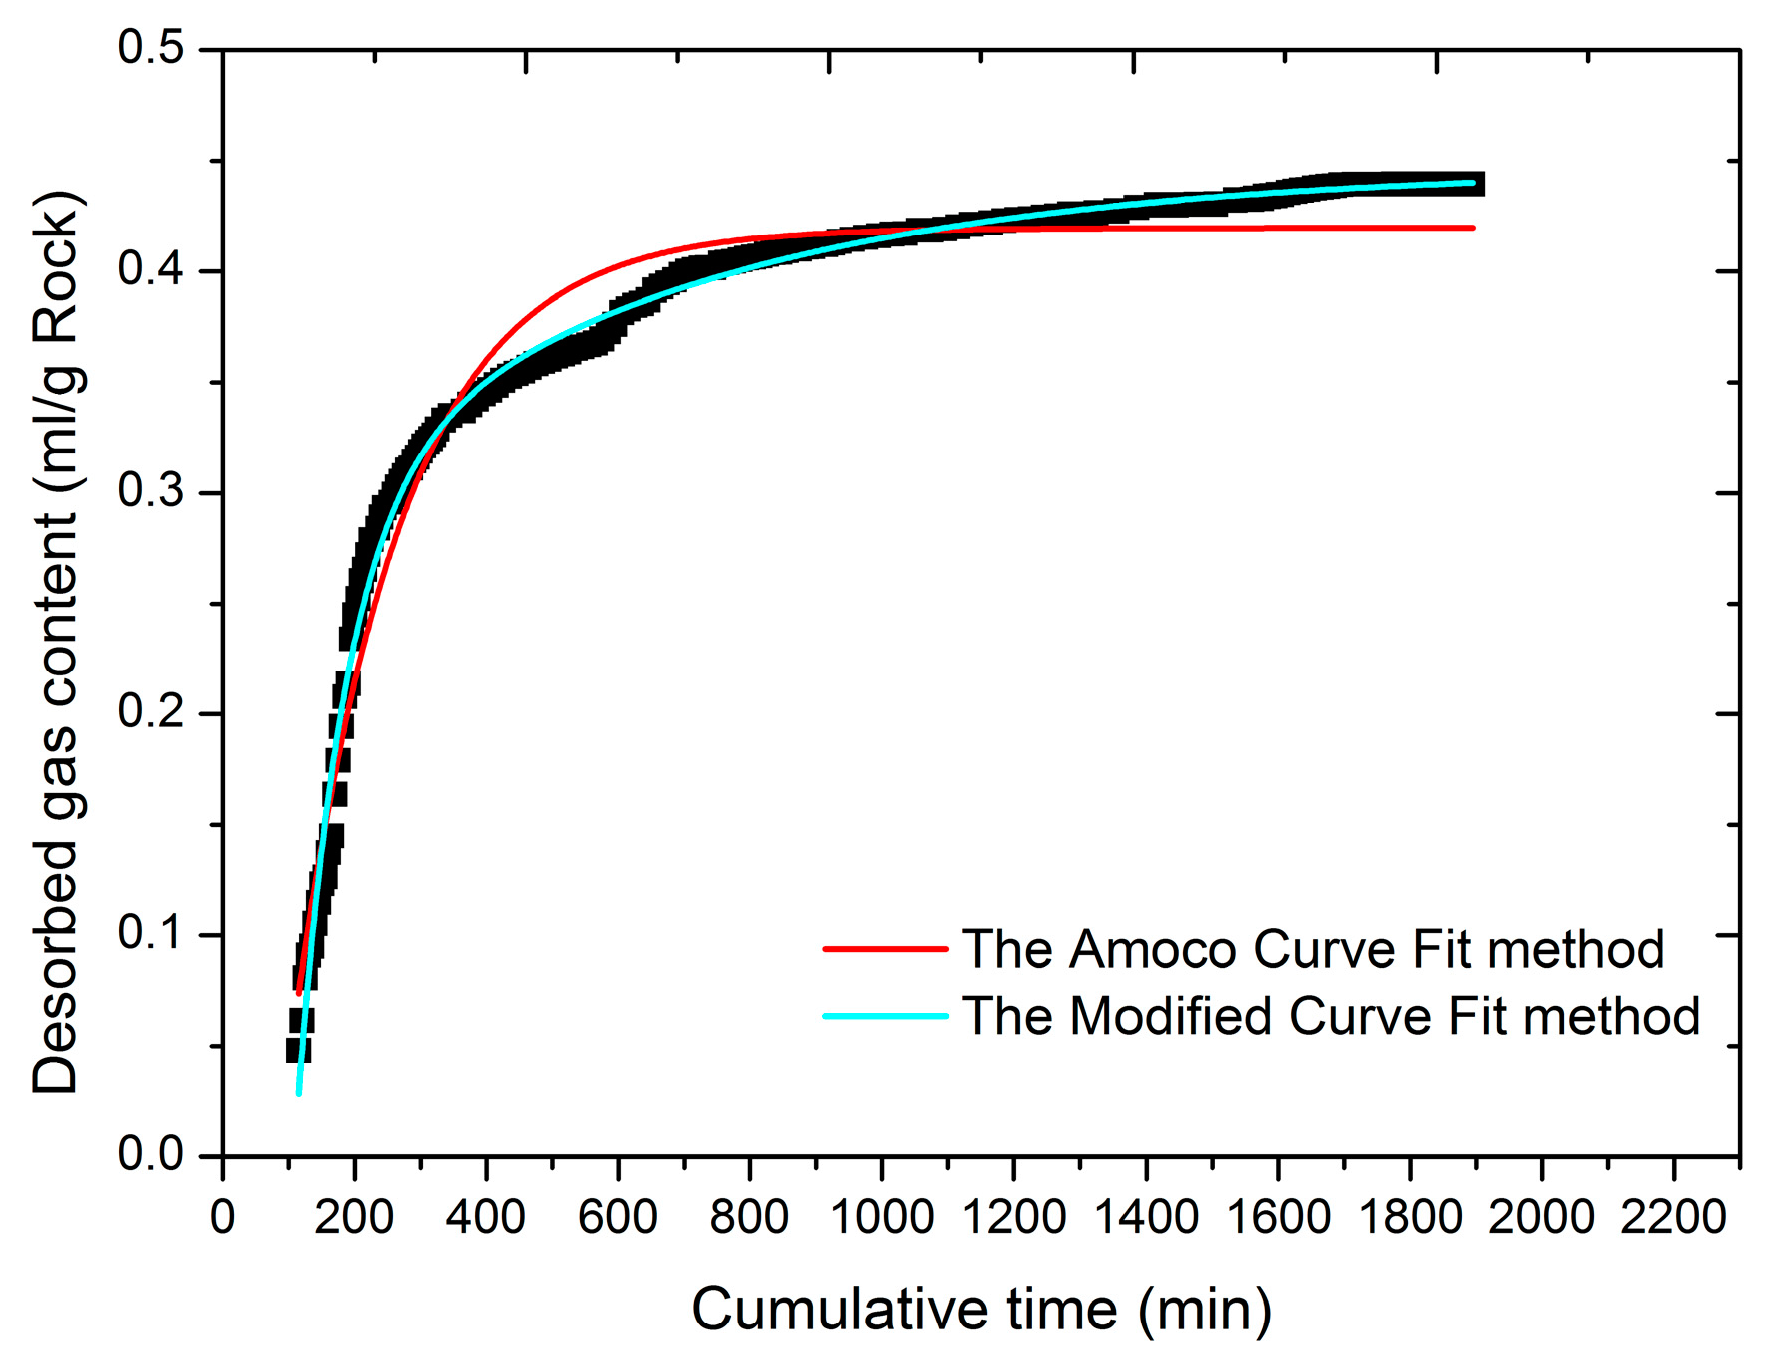
Therefore, in this study, our preferred method is to modify the current Amoco curve fit method [62] by replacing the unipore diffusion equation (Equation (1)) with the bidisperse diffusion equation (Equation (8)). For simplicity, only the first term in the infinite series in a new method was retained, and then the new lost gas content determination equation becomes:
where is the desorbed gas content at time t (mL/g rock), and is the sum of lost gas content and desorbed gas content (mL/g rock). is the lost gas content (mL/g rock). By fitting the above equation to all gas desorption data, the lost gas content can be obtained. From the theoretical viewpoint, the method proposed here may give a reasonable description for gas desorption data, and the estimation accuracy would be improved when compared with other methods based upon the unipore model. It is apparent from Figure 12 that this modified curve fit method could give a better description for field desorbed gas data than the current Amoco curve fit method. Additionally, this method is simpler and easy to apply in both field and laboratory studies. Given the limited space and the topic of this paper, however, the details about this method, including the establishing process, the practical application in gas content determination, and the comparison on estimation accuracy with other methods, will be discussed and still requires study in the future. Furthermore, this method may provide an additional and potential way for lost gas content determination.
5. Conclusions
The methane adsorption rate and diffusion characteristics of marine shale samples from Yangtze Platform in Southern China were investigated using the volumetric method. The unipore model and the bidisperse model were then used to model the methane adsorption rate data and to analyze the behavior of methane diffusion. Based on this, the following conclusions are made:
- (1)
- The unipore model failed to describe the methane adsorption rate data for all pressure steps, and the bidisperse model cannot perfectly model the methane adsorption rate data. However, using the bidisperse model is still justified even if some new diffusion models [19,68] involving a more complicated mathematical process and providing a better description were established.
- (2)
- There is an evident negative correlation between macropore diffusivity and pressure lower than 3–4 MPa, and when the pressure is greater than 5.5 MPa the macropore diffusivity is constant. However, the micropore diffusivity only showed a gentle decreasing trend with pressure. This finding indicated that methane diffusion could play a significant role in later stages of the development of shale gas reservoir. Additionally, the surface coverage or adsorption volume also negatively affected methane diffusivity in shale.
- (3)
- The order of magnitude of macro- and micropore diffusivities in measured marine shale are roughly from 10−3 to 100, and 10−3 to 10−1, respectively. In these shale samples, both macro- and micropores are significant for the methane adsorption rate and total adsorption in measured marine shale samples, and the relative influence and importance of micropore diffusion and adsorption to the adsorption rate and total adsorption increased with increasing pressure. This is because the adsorption sites in macropores become full with increasing pressure steps, so less methane adsorption in macropores can occur at higher pressure steps.
- (4)
- A new estimation method was proposed here based upon the bidisperse model for lost gas content estimation of shale or coal samples. From a theoretical viewpoint, the method proposed here may give a more accurate prediction of lost gas content than other methods based upon the unipore model, although further study is required.
Acknowledgments
This study was supported by the Research on Exploration and Demonstration of Shale Gas in Henan Province (151100311000), the National Natural Science Foundation (41574088), and Beijing Municipal Science and Technology Commission Major Project (Z141100003514004).
Author Contributions
Wei Dang and Jinchuan Zhang conceived and designed the experiments; Wei Dang, Xiaoliang Wei, and Yue Lei performed the methane adsorption rate experiments; Wei Dang, Jinchuan Zhang, Xuan Tang, Chenghu Wang, and Qian Chen analyzed the data, and Wei Dang wrote the paper.
Conflicts of Interest
The authors declare no conflict of interest.
References
- Curtis, J.B. Fractured shale-gas systems. AAPG Bull. 2002, 86, 1921–1938. [Google Scholar]
- Jarvie, D.M.; Hill, R.J.; Ruble, T.E.; Pollastro, R.M. Unconventional shale-gas systems: The Mississippian Barnett Shale of north-central Texas as one model for thermogenic shale-gas assessment. AAPG Bull. 2007, 91, 475–499. [Google Scholar] [CrossRef]
- Clarkson, C.R.; Bustin, R.M. The effect of pore structure and gas pressure upon the transport properties of coal: A laboratory and modeling study. 2. Adsorption rate modeling. Fuel 1999, 78, 1345–1362. [Google Scholar] [CrossRef]
- Clarkson, C.R.; Bustin, R.M. The effect of pore structure and gas pressure upon the transport properties of coal: A laboratory and modeling study. 1. Isotherms and pore volume distributions. Fuel 1999, 78, 1333–1344. [Google Scholar] [CrossRef]
- Reed, R.M.; Loucks, R.G. Low-thermal-maturity (<0.7% VR) mudrock pore systems: Mississippian Barnett Shale, southern Fort Worth Basin. GCAGS J. 2015, 4, 15–28. [Google Scholar]
- Chen, Q.; Zhang, J.; Tang, X.; Li, W.; Li, Z. Relationship between pore type and pore size of marine shale: An example from the sinian-cambrian formation, upper Yangtze region, South China. Int. J. Coal Geol. 2016, 158, 13–28. [Google Scholar] [CrossRef]
- Wang, F.P.; Reed, R.M. Pore Networks and Fluid Flow in Gas Shales. In Proceedings of the SPE Annual Technical Conference and Exhibition 2009, New Orleans, LA, USA, 4–7 October 2009. [Google Scholar]
- Schieber, J. Common Themes in the Formation and Preservation of Intrinsic Porosity in Shales and Mudstones-Illustrated with Examples across the Phanerozoic. In Proceedings of the SPE Unconventional Gas Conference, Pittsburgh, PA, USA, 23–25 February 2010. [Google Scholar]
- Tan, J.; Weniger, P.; Krooss, B.; Merkel, A.; Horsfield, B.; Zhang, J.; Boreham, C.J.; van Graas, G.; Tocher, B.A. Shale gas potential of the major marine shale formations in the Upper Yangtze Platform, South China, Part II: Methane sorption capacity. Fuel 2014, 129, 204–218. [Google Scholar] [CrossRef]
- Ross, D.J.K.; Bustin, R.M. The importance of shale composition and pore structure upon gas storage potential of shale gas reservoirs. Mar. Pet. Geol. 2009, 26, 916–927. [Google Scholar] [CrossRef]
- Gasparik, M.; Bertier, P.; Gensterblum, Y.; Ghanizadeh, A.; Krooss, B.M.; Littke, R. Geological controls on the methane storage capacity in organic-rich shales. Int. J. Coal Geol. 2014, 123, 34–51. [Google Scholar] [CrossRef]
- Passey, Q.R.; Bohacs, K.; Esch, W.L.; Klimentidis, R.; Sinha, S. From Oil-Prone Source Rock to Gas-Producing Shale Reservoir—Geologic and Petrophysical Characterization of Unconventional Shale Gas Reservoirs. In Proceedings of the International Oil and Gas Conference and Exhibition in China, Beijing, China, 8–10 June 2010; p. 131350. [Google Scholar]
- Chen, C.; Hu, D.; Westacott, D.; Loveless, D. Nanometer-scale characterization of microscopic pores in shale kerogen by image analysis and pore-scale modeling. Geochem. Geophys. Geosyst. 2013, 14, 4066–4075. [Google Scholar] [CrossRef]
- Meng, Z.; Liu, J.; Li, G. Experimental Analysis of Methane Adsorption-diffusion Property in High-maturity Organic-rich Shale and High-Rank Coal. Nat. Gas Geosci. 2015, 26, 1499–1506. [Google Scholar]
- Darabi, H.; Ettehad, A.; Javadpour, F.; Sepehrnoori, K. Gas flow in ultra-tight shale strata. J. Fluid Mech. 2012, 710, 641–658. [Google Scholar] [CrossRef]
- Yuan, W.; Pan, Z.; Xiao, L.; Yang, Y.; Zhao, C.; Connell, L.D.; Li, S.; He, J. Experimental study and modelling of methane adsorption and diffusion in shale. Fuel 2014, 117, 509–519. [Google Scholar] [CrossRef]
- Diamond, W.P.; Schatzel, S.J. Measuring the gas content of coal: A review. Int. J. Coal Geol. 1998, 35, 311–331. [Google Scholar] [CrossRef]
- Bhowmik, S.; Dutta, P. Adsorption rate characteristics of methane and CO2 in coal samples from Raniganj and Jharia coalfields of India. Int. J. Coal Geol. 2013, 113, 50–59. [Google Scholar] [CrossRef]
- Haghshenas, B.; Clarkson, C.R.; Aquino, S.D.; Chen, S. Characterization of Multi-Fractured Horizontal Shale Wells using Drill Cuttings: 2. Permeability/Diffusivity Estimation. J. Nat. Gas Sci. Eng. 2016, 32, 586–596. [Google Scholar] [CrossRef]
- Pan, Z.; Connell, L.D.; Camilleri, M.; Connelly, L. Effects of matrix moisture on gas diffusion and flow in coal. Fuel 2010, 89, 3207–3217. [Google Scholar] [CrossRef]
- Smith, D.M.; Williams, F.L. Diffusional Effects in the Recovery of Methane from Coalbeds. Soc. Pet. Eng. J. 1984, 24, 529–535. [Google Scholar] [CrossRef]
- Busch, A.; Gensterblum, Y.; Krooss, B.M.; Littke, R. Methane and carbon dioxide adsorption–diffusion experiments on coal: Upscaling and modeling. Int. J. Coal Geol. 2004, 60, 151–168. [Google Scholar] [CrossRef]
- Cui, X.; Bustin, R.M.; Dipple, G. Selective transport of CO2, CH4, and N2 in coals: Insights from modeling of experimental gas adsorption data. Fuel 2004, 83, 293–303. [Google Scholar] [CrossRef]
- Nandi, S.P.; Walker, P.L., Jr. Activated diffusion of methane from coals at elevated pressures. Fuel 1975, 54, 81–86. [Google Scholar] [CrossRef]
- Zhao, X. An Experimental Study of Methane Diffusion in Coal Using Transient Approach; University of Arizona: Tucson, AZ, USA, 1991; pp. 85–87. [Google Scholar]
- Smith, D.M.; Williams, F.L. Diffusion models for gas production from coal: Determination of diffusion parameters. Fuel 1984, 63, 256–261. [Google Scholar] [CrossRef]
- Smith, D.M.; Williams, F.L. Diffusion models for gas production from coals: Application to methane content determination. Fuel 1984, 63, 251–255. [Google Scholar] [CrossRef]
- Pillalamarry, M.; Harpalani, S.; Liu, S. Gas diffusion behavior of coal and its impact on production from coalbed methane reservoirs. Int. J. Coal Geol. 2011, 86, 342–348. [Google Scholar] [CrossRef]
- Nikolai, S.; Andreas, B.; Hans, B.; Bernd, K.; Yves, G. Assessing the Kinetics and Capacity of Gas Adsorption in Coals by a Combined Adsorption/Diffusion Method. In Proceedings of the SPE Annual Technical Conference and Exhibition, Denver, CO, USA, 5–8 October 2003. [Google Scholar]
- Sing, K.S. Reporting physisorption data for gas/solid systems with special reference to the determination of surface area and porosity (Recommendations 1984). Pure Appl. Chem. 1985, 57, 603–619. [Google Scholar] [CrossRef]
- Ruckenstein, E.; Vaidyanathan, A.S.; Youngquist, G.R. Sorption by solids with bidisperse pore structures. Chem. Eng. Sci. 1971, 26, 1305–1318. [Google Scholar] [CrossRef]
- Wheeler, A. Reaction rates and selectivity in catalyst pores. Adv. Catal. 1951, 3, 250. [Google Scholar]
- Carslaw, H.S.; Jaeger, J.C. Conduction of Heat in Solids, 2nd ed.; Clarendon Press: Oxford, UK, 1959. [Google Scholar]
- Nandi, S.P.; Walker, P.L. Activated diffusion of methane in coal. Fuel 1970, 49, 309–323. [Google Scholar] [CrossRef]
- Crank, J. A diffusion problem in which the amount of diffusing substance is finite. II. Diffusion with nonlinear absorption. Philos. Mag. 1948, 39, 140–149. [Google Scholar] [CrossRef]
- Mianowski, A.; Marecka, A. The isokinetic effect as related to the activation energy for the gases diffusion in coal at ambient temperatures. J. Therm. Anal. Calorim. 2009, 96, 285–292. [Google Scholar] [CrossRef]
- Zhang, J.; He, S.; Yi, J.; Zhang, B.; Zhang, S.; Zheng, L.; Hou, Y.; Wang, Y. Rock thermo-acoustic emission and basin modeling technologies applied to the study of maximum paleotemperatures and thermal maturity histories of Lower Paleozoic marine shales in the western middle Yangtze area. Acta Pet. Sin. 2014, 35, 58–67. [Google Scholar]
- Cao, H.-Y.; Zhu, C.-Q.; Qiu, N.-S. Maximum paleotemperature of main Paleozoic argillutite in the Eastern Sichuan Basin. Chin. J. Geophys. Chin. Ed. 2016, 59, 1017–1029. [Google Scholar]
- MT/T1157-2011, Determination of Equilibrium Moisture in coal Isotherm Adsorption Method. Available online: http://dbpub.cnki.net/grid2008/dbpub/detail.aspx?dbcode=SCSD&dbname=SCSD&filename=SCSDMT/T%201157-2011 (accessed on 5 January 2017).
- Ji, L.M.; Zhang, T.W.; Milliken, K.L.; Qu, J.L.; Zhang, X.L. Experimental investigation of main controls to methane adsorption in clay-rich rocks. Appl. Geochem. 2012, 27, 2533–2545. [Google Scholar] [CrossRef]
- Sudibandriyo, M.; Pan, Z.; Fitzgerald, J.E.; Robinson, R.L.; Gasem, K.A.M. Adsorption of Methane, Nitrogen, Carbon Dioxide, and Their Binary Mixtures on Dry Activated Carbon at 318.2 K and Pressures up to 13.6 MPa. Langmuir 2003, 19, 5323–5331. [Google Scholar] [CrossRef]
- Langmuir, I. The adsorption of gases on plane surfaces of glass, mica and platinum. J. Am. Chem. Soc. 1918, 40, 1361–1403. [Google Scholar] [CrossRef]
- Harpalani, S.; And, B.K.P.; Dutta, P. Methane/CO2 Sorption Modeling for Coalbed Methane Production and CO2 Sequestration. Energy Fuels 2006, 20, 1591–1599. [Google Scholar] [CrossRef]
- Bustin, R.; Clarkson, C. Geological controls on coalbed methane reservoir capacity and gas content. Int. J. Coal Geol. 1998, 38, 3–26. [Google Scholar] [CrossRef]
- Chareonsuppanimit, P.; Mohammad, S.A.; Robinson, R.L.; Gasem, K.A.M. High-pressure adsorption of gases on shales: Measurements and modeling. Int. J. Coal Geol. 2012, 95, 34–46. [Google Scholar] [CrossRef]
- Lu, X.C.; Li, F.C.; Watson, A.T. Adsorption Measurements in Devonian Shales. Fuel 1995, 74, 599–603. [Google Scholar] [CrossRef]
- Dutta, P.; Harpalani, S.; Prusty, B. Modeling of CO2 sorption on coal. Fuel 2008, 87, 2023–2036. [Google Scholar] [CrossRef]
- Chalmers, G.R.; Bustin, R.M. Lower Cretaceous gas shales in northeastern British Columbia, Part I: Geological controls on methane sorption capacity. Bull. Can. Pet. Geol. 2008, 56, 1–21. [Google Scholar] [CrossRef]
- Dang, W.; Zhang, J.; Huang, X.; Li, X.; Chen, Q.; Sun, R.; Xue, B.; Han, S. Main-controlling geological factors of gas-bearing property of continental shale gas: A case study of Member 3 of Shahejie Formation in western Liaohe sag. Acta Pet. Sin. 2015, 1516–1530. [Google Scholar]
- Ji, W.; Song, Y.; Jiang, Z.; Wang, X.; Bai, Y.; Xing, J. Geological controls and estimation algorithms of lacustrine shale gas adsorption capacity: A case study of the Triassic strata in the southeastern Ordos Basin, China. BMC Neurosci. 2014, 134, 1–9. [Google Scholar] [CrossRef]
- Rexer, T.F.T.; Benham, M.J.; Aplin, A.C.; Thomas, K.M. Methane Adsorption on Shale under Simulated Geological Temperature and Pressure Conditions. Energy Fuels 2013, 27, 3099–3109. [Google Scholar] [CrossRef]
- Chen, C.; Lin, D. Application of Isothermal Curves in Estimating Minable Resource of Coalbed Methane. J. China Univ. Min. Technol. 2005, 34, 679–682. [Google Scholar]
- Zhang, P.; Hu, L.; Meegoda, J.N.; Gao, S. Micro/Nano-pore Network Analysis of Gas Flow in Shale Matrix. Sci. Rep. 2015, 5, 13501. [Google Scholar] [CrossRef] [PubMed]
- Cao, T.; Song, Z.; Wang, S.; Cao, X.; Li, Y.; Xia, J. Characterizing the pore structure in the Silurian and Permian shales of the Sichuan Basin, China. Mar. Pet. Geol. 2015, 61, 140–150. [Google Scholar] [CrossRef]
- Ye, Z.; Chen, D.; Pan, Z. A unified method to evaluate shale gas flow behaviours in different flow regions. J. Nat. Gas Sci. Eng. 2015, 26, 205–215. [Google Scholar] [CrossRef]
- Chalmers, G.R.; Bustin, R.M.; Power, I.M. Characterization of gas shale pore systems by porosimetry, pycnometry, surface area, and field emission scanning electron microscopy/transmission electron microscopy image analyses: Examples from the Barnett, Woodford, Haynesville, Marcellus, and Doig unit. AAPG Bull. 2012, 96, 1099–1119. [Google Scholar] [CrossRef]
- Cao, T.; Song, Z.; Luo, H.; Liu, G. The Differences of Microscopic Pore Structure Characteristics of Coal, Oil shale and Shales and Their Storage Mechanisms. Nat. Gas Geosci. 2015, 26, 2208–2218. [Google Scholar]
- Charrière, D.; Pokryszka, Z.; Behra, P. Effect of pressure and temperature on diffusion of CO2 and CH4 into coal from the Lorraine basin (France). Int. J. Coal Geol. 2010, 81, 373–380. [Google Scholar] [CrossRef]
- Chen, Y.D.; Yang, R.T. Concentration dependence of surface diffusion and zeolitic diffusion. AIChE J. 1991, 37, 1579–1582. [Google Scholar] [CrossRef]
- Roberts, P.V.; York, R. Adsorption of Normal Paraffins from Binary Liquid Solutions by 5A Molecular Sieve. Ind. Eng. Chem. Process Des. Dev. 1967, 6, 516–525. [Google Scholar] [CrossRef]
- Kissell, F.N.; Mcculloch, C.M.; Elder, C.H.; Kissell, F.N.; Mcculloch, C.M.; Elder, C.H. The Direct Method of Determining Methane Content of Coal Beds for Ventilation Design; Report of Investigations RI7767; U.S. Bureau of Mines: Washington, DC, USA, 1973. [Google Scholar]
- Yee, D.; Seidle, J.P.; Hanson, W.B. Gas sorption on coal and measurement of gas content. Am. Assoc. Pet. Geol. 1993, 38, 203–218. [Google Scholar]
- Smith, D.M.; Williams, F.L. Direct method of determining the methane content of coal—A modification. Fuel 1984, 63, 425–427. [Google Scholar] [CrossRef]
- Mclennan, J.D.; Schafer, P.S.; Pratt, T.J.; Institute, G. A Guide to Determining Coalbed Gas Content; GRI-94-0396; Gas Research Institute: Chicago, IL, USA, 1995. [Google Scholar]
- Mcculloch, C.M.; Levine, J.R.; Kissell, F.N.; Deul, M.; Mcculloch, C.M.; Levine, J.R.; Kissell, F.N.; Deul, M. Measuring the Methane Content of Bituminous Coalbeds; Report of Investigations 8043; US Bureau of Mines: Washington, DC, USA, 1975; p. 22. [Google Scholar]
- Bertard, C.; Bruyet, B.; Gunther, J. Determination of desorbable gas concentration of coal (direct method). Int. J. Rock Mech. Min. Sci. Geomech. Abstr. 1970, 7, 43–65. [Google Scholar] [CrossRef]
- Chase, R. A Comparison of Methods Used for Determining the Natural Gas Content of Coalbeds from Exploratory Cores; METC/CR-79/18; US Department of Energy: Washington, DC, USA, 1979; p. 25. [Google Scholar]
- Li, Z.; Liu, D.; Cai, Y.; Shi, Y. Investigation of methane diffusion in low-rank coals by a multiporous diffusion model. J. Nat. Gas Sci. Eng. 2016, 33, 97–107. [Google Scholar] [CrossRef]
Figure 1.
Maps of the marine shale including lower Silurian and lower Cambrian shale in the Yangtze Platform, South China, and the locations of sampling well. Modified after Tan et al. [9].
Figure 1.
Maps of the marine shale including lower Silurian and lower Cambrian shale in the Yangtze Platform, South China, and the locations of sampling well. Modified after Tan et al. [9].
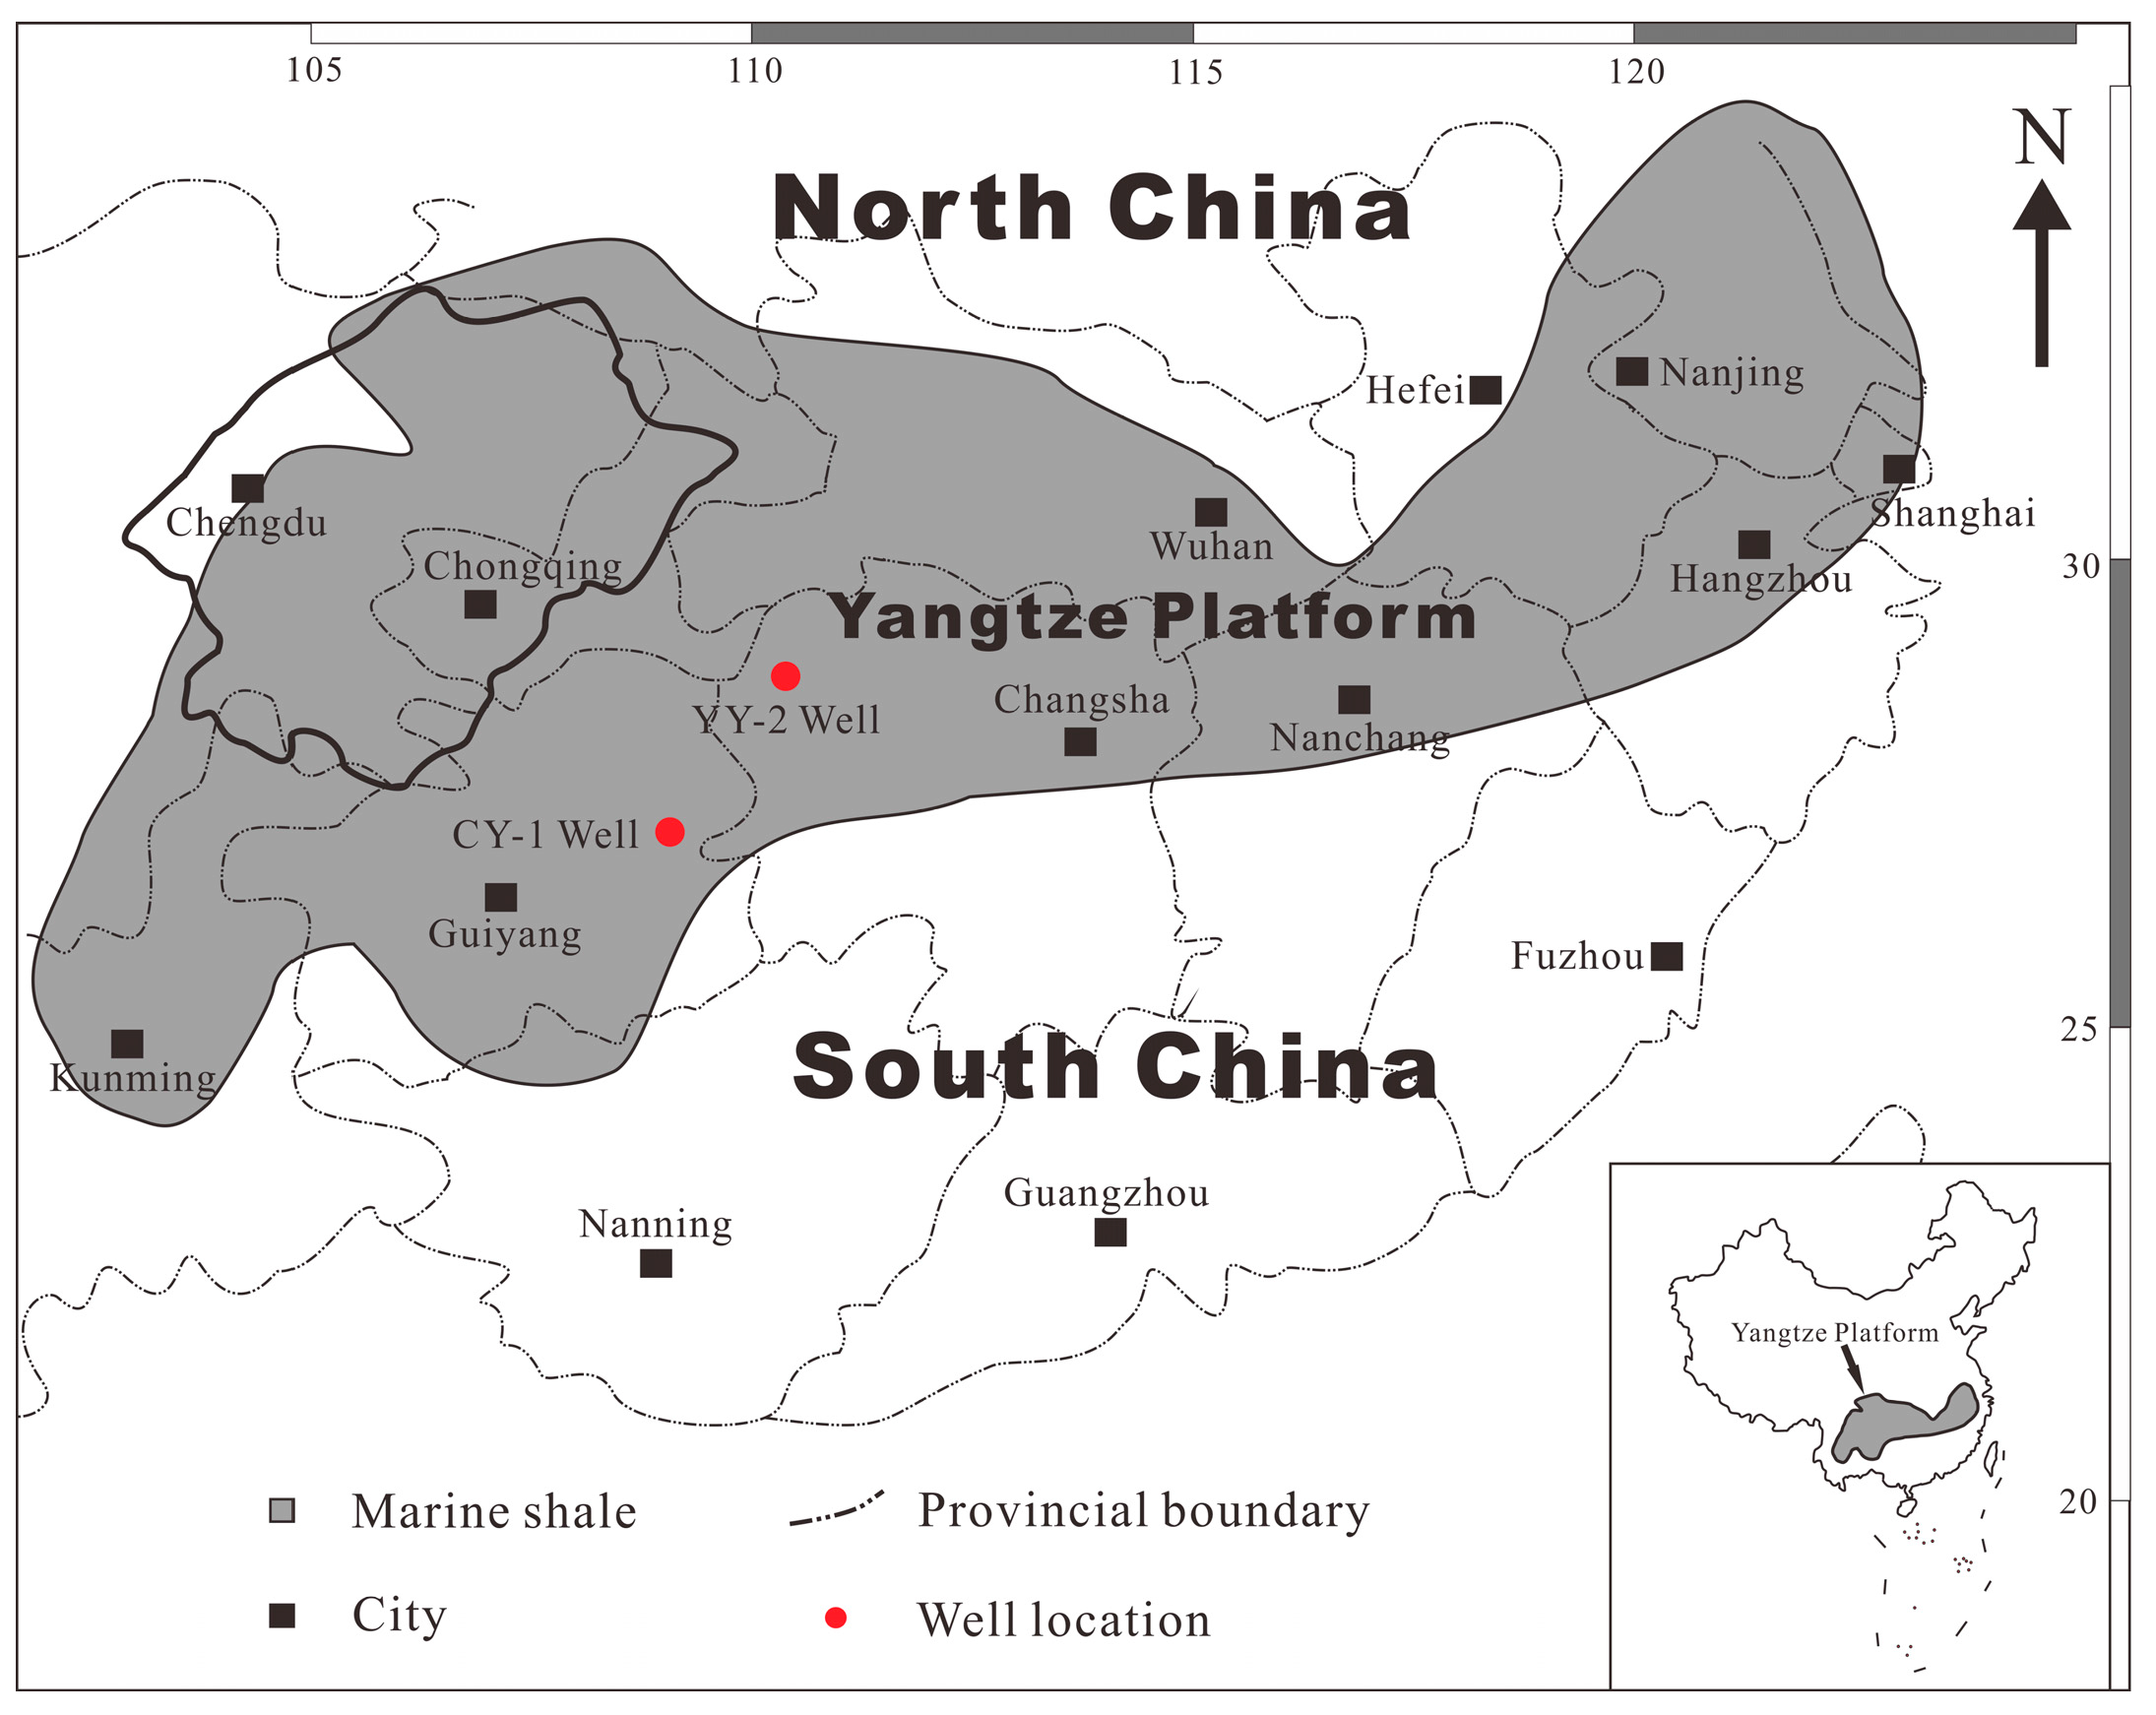
Figure 2.
Schematic diagram of the experimental set up for methane adsorption on shale.

Figure 3.
SEM images of the shale samples in this study, which show pores with different sizes. In this study, the macropores and micropores refer to micrometer-sized pores and nanometer-sized pores, respectively. (a) Intra-particle macropores in clay minerals; (b) Intra-particle macropores in clay minerals and inter-particle macropores between minerals; (c) Inter-particle micropores supported by pyrite corners; (d) The micropores in organic matter (OM) with complicated shape and inner structure.
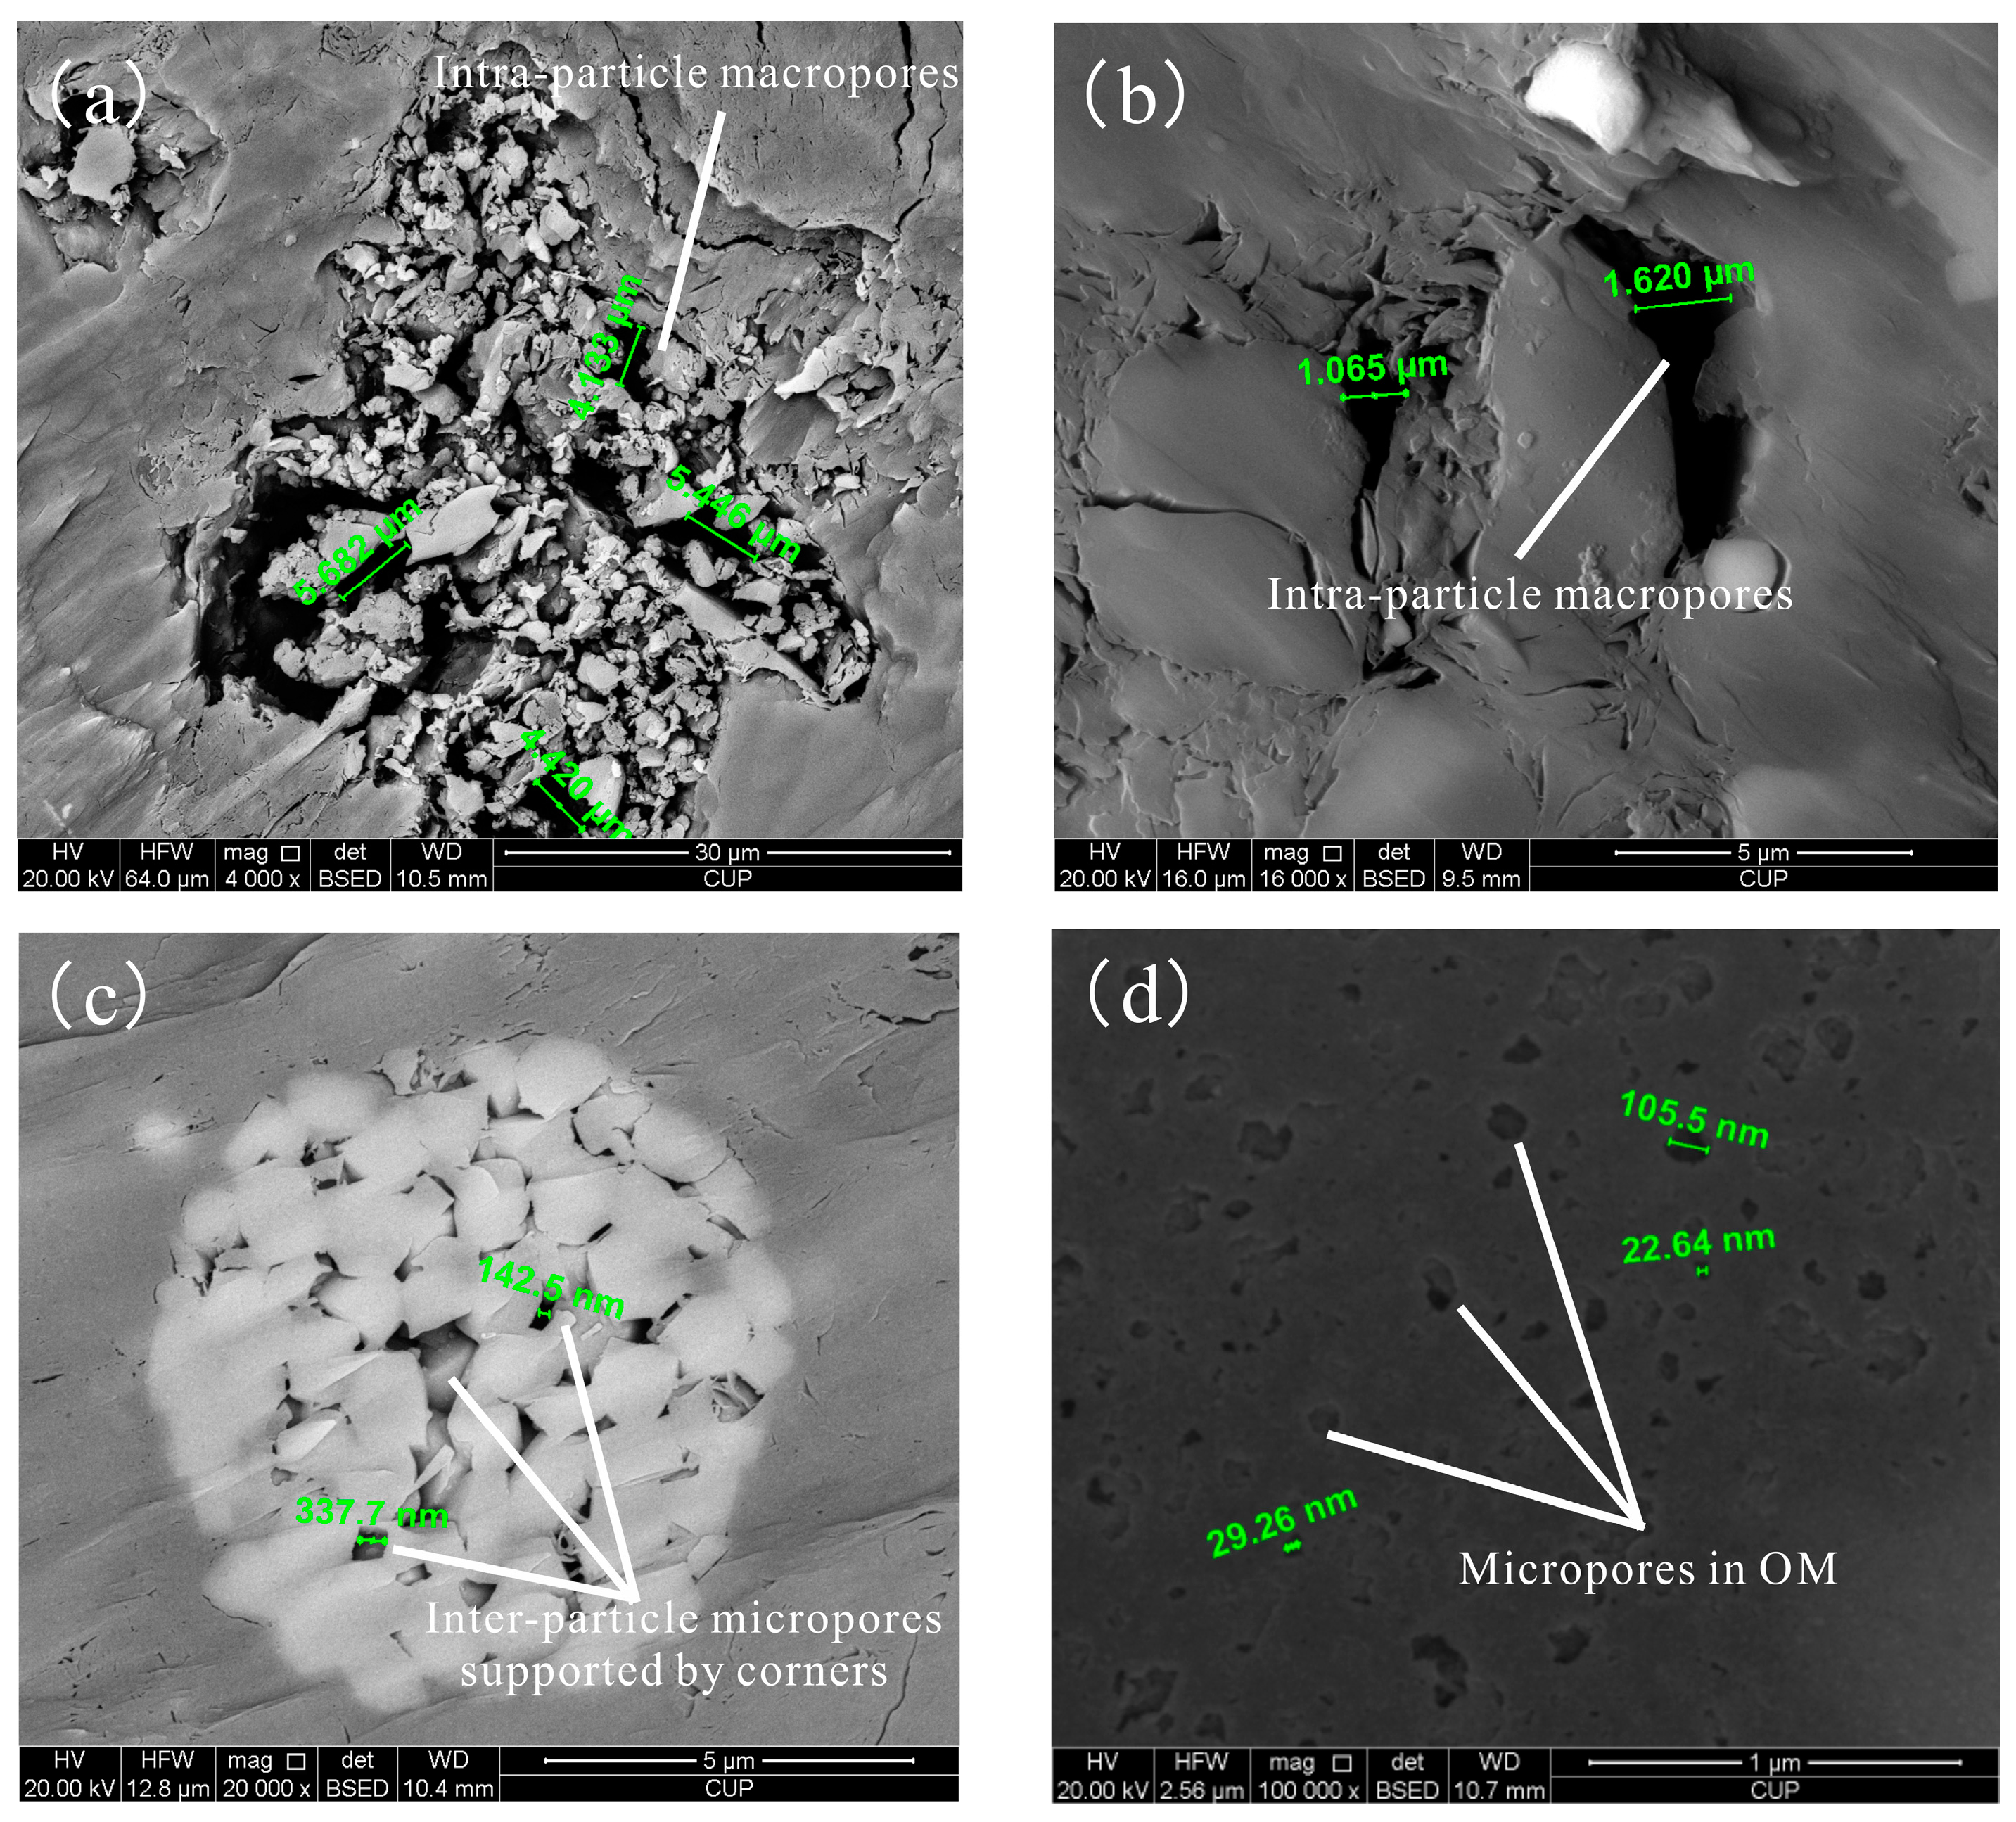
Figure 4.
(a) Methane adsorption isotherms for experimental shale samples at 30 °C. Points are measured values, and dash lines are the corresponding fitting lines based on Langmuir equation; (b) Straight line fit for experimental adsorption data, indicating that the isotherms of sample YY2-2, CY1-1, and CY1-2 are near linear with the value of R2 larger than 0.96, while the isotherms of sample YY2-1 are obviously non-linear with a lower value of R2.

Figure 5.
Experimental methane adsorption rate data for shale samples at three different pressures, showing that methane adsorption kinetics varied between different pressure steps and different shale samples. (a) Adsorption rate at pressure step 0.40 MPa was much higher than that at pressure steps of 4.02 MPa and 6.88 MPa, and was characterized by evident two-stage diffusion process; (b) Adsorption rate at both pressure steps of 0.39 MPa and 4.02 MPa were much higher than that at 6.91 MPa, and were characterized by evident two-stage diffusion process; (c) Adsorption rate gradually decrease with increasing pressure steps from 0.36 MPa to 6.94 MPa, and only adsorption rate curve at lower and medium pressure steps showed an evident two-stage process; (d) Adsorption rate gradually decrease with increasing pressure steps from 0.40 MPa to 6.97 MPa, and all of the three curves showed an evident two-stage process.

Figure 6.
The unipore model fitting of the experimental methane adsorption rates for shale samples at three different pressure steps, showing that the unipore model failed to predict the adsorption rate data over the entire time range for all pressure steps of measured shale samples. (a) Unipore model slightly underestimated the time required to reach adsorption equilibrium; (b–d) Unipore model significantly deviated from the experimental results and underestimated the time required to reach adsorption equilibrium; (e) Unipore model slightly deviated from the experimental results and underestimated the time required to reach adsorption equilibrium; (f–h) Unipore model significantly deviated from the experimental results and underestimated the time required to reach adsorption equilibrium; (i) Unipore model significantly deviated from the experimental results and overestimated the time required to reach adsorption equilibrium; (j–k) Unipore model could predict the initial experimental results and then start to deviated slightly, and underestimated the time required to reach adsorption equilibrium; (l) Unipore model slightly deviated from the experimental results and underestimated the time required to reach adsorption equilibrium.


Figure 7.
The variation in methane adsorption concentration with pressure for shale sample CY1-1 at a medium pressure step.
Figure 7.
The variation in methane adsorption concentration with pressure for shale sample CY1-1 at a medium pressure step.
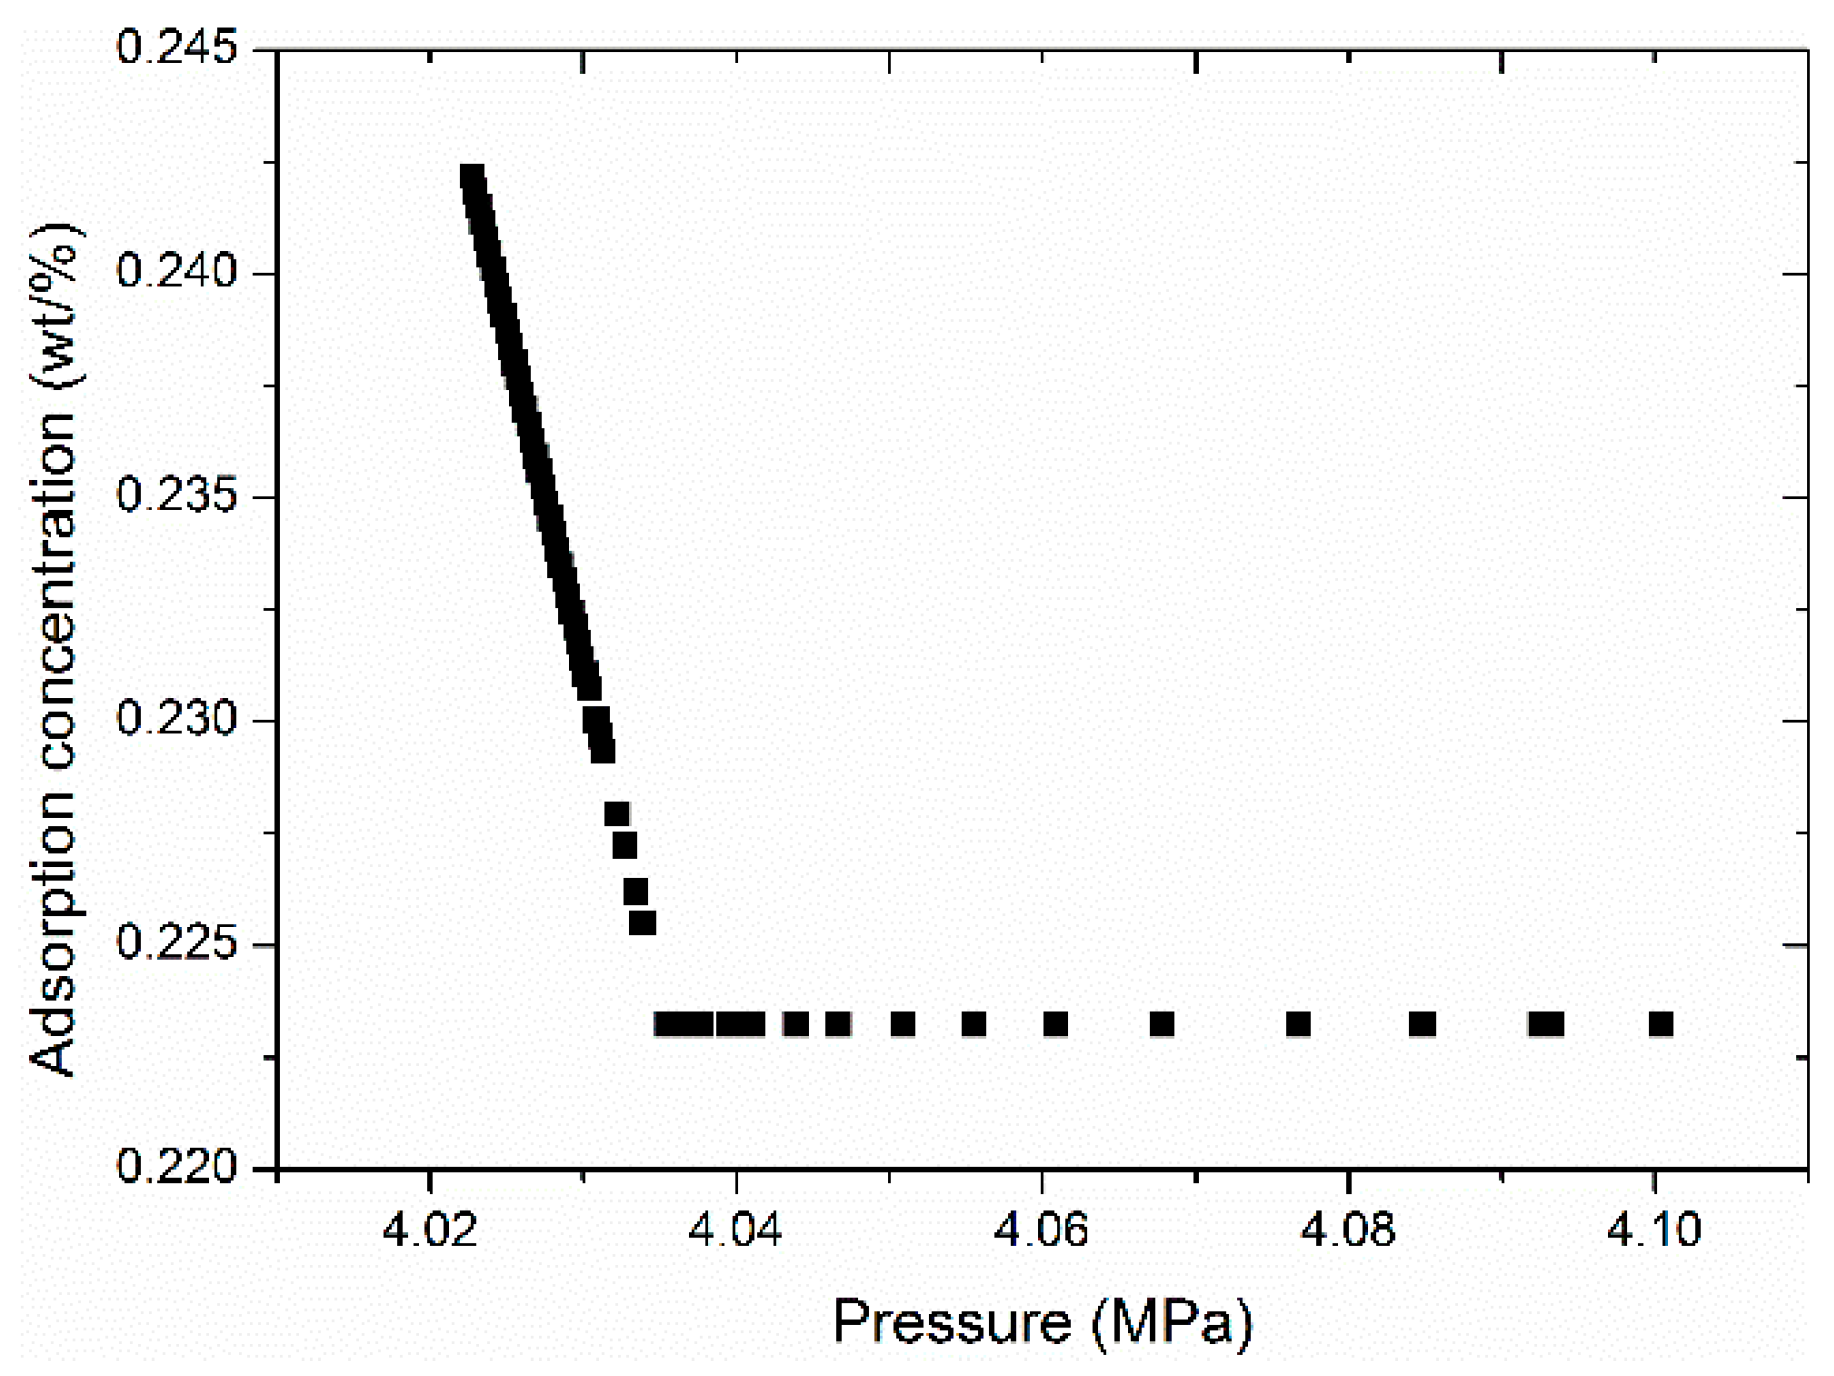
Figure 8.
The bidisperse model fitting of the experimental methane adsorption rates for shale samples at three different pressure steps. (a,b) Bidisperse model could reasonably describe methane adsorption rate data over the entire time range; (c) Bidisperse model slightly deviated the experimental results and overestimated the time required to reach adsorption equilibrium; (d–l) Bidisperse model could reasonably describe methane adsorption rate data over the entire time range.


Figure 9.
Variation in the macropore diffusivity (a) and micropore diffusivity (b) with pressure.
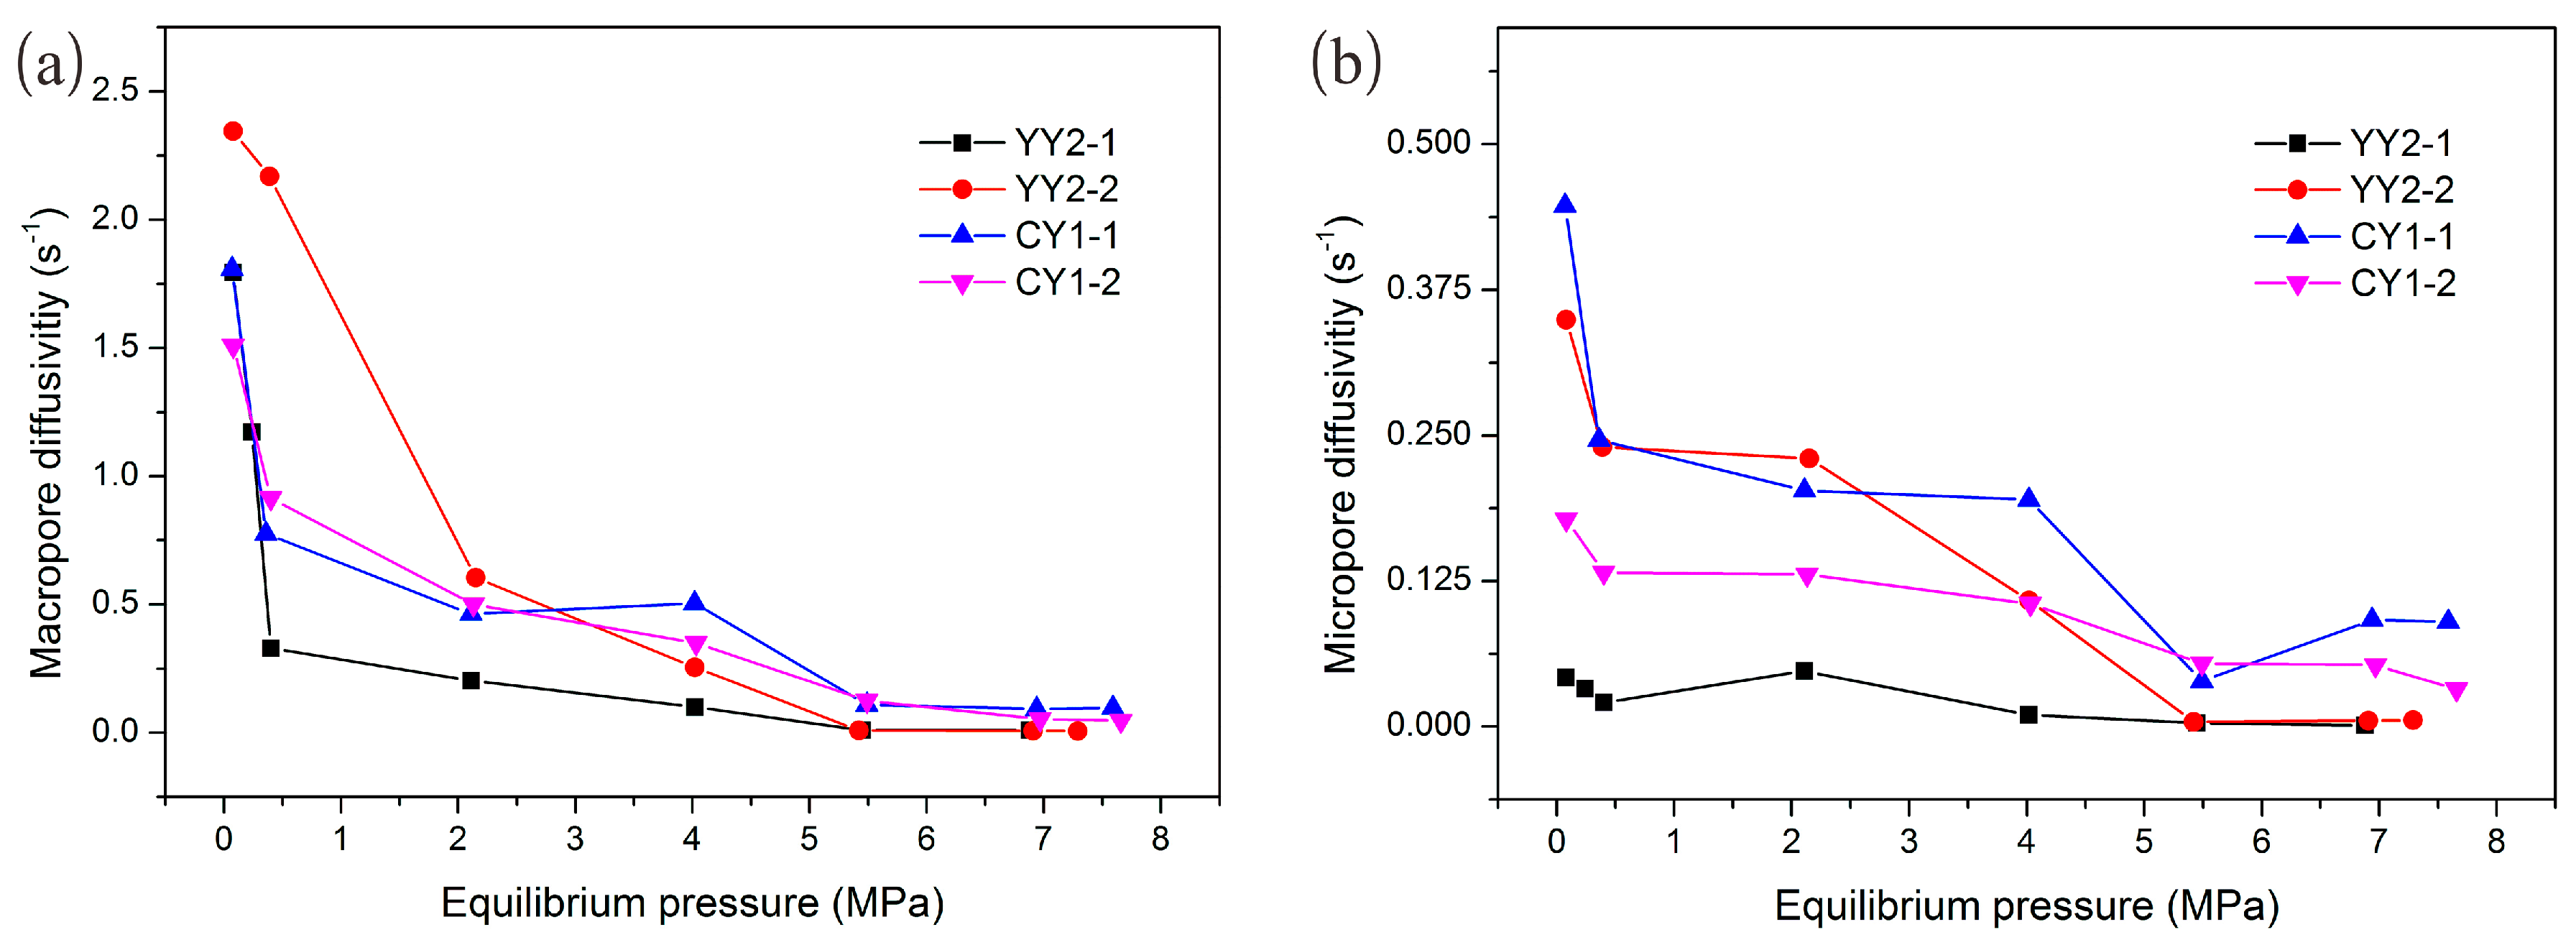
Figure 10.
The mirror image relationship between the variation in the macropore diffusivity and methane adsorption isotherm for all shale samples, indicating the negative correlation between surface coverage and gas diffusivity. (a–c) The negative correlations were evident at lower pressure steps and less evident at higher pressure steps; (d) The negative correlation were evident through the whole pressure steps. The grey line is a free-plot trend line to describe the general trend of macropore diffusivity with pressure.
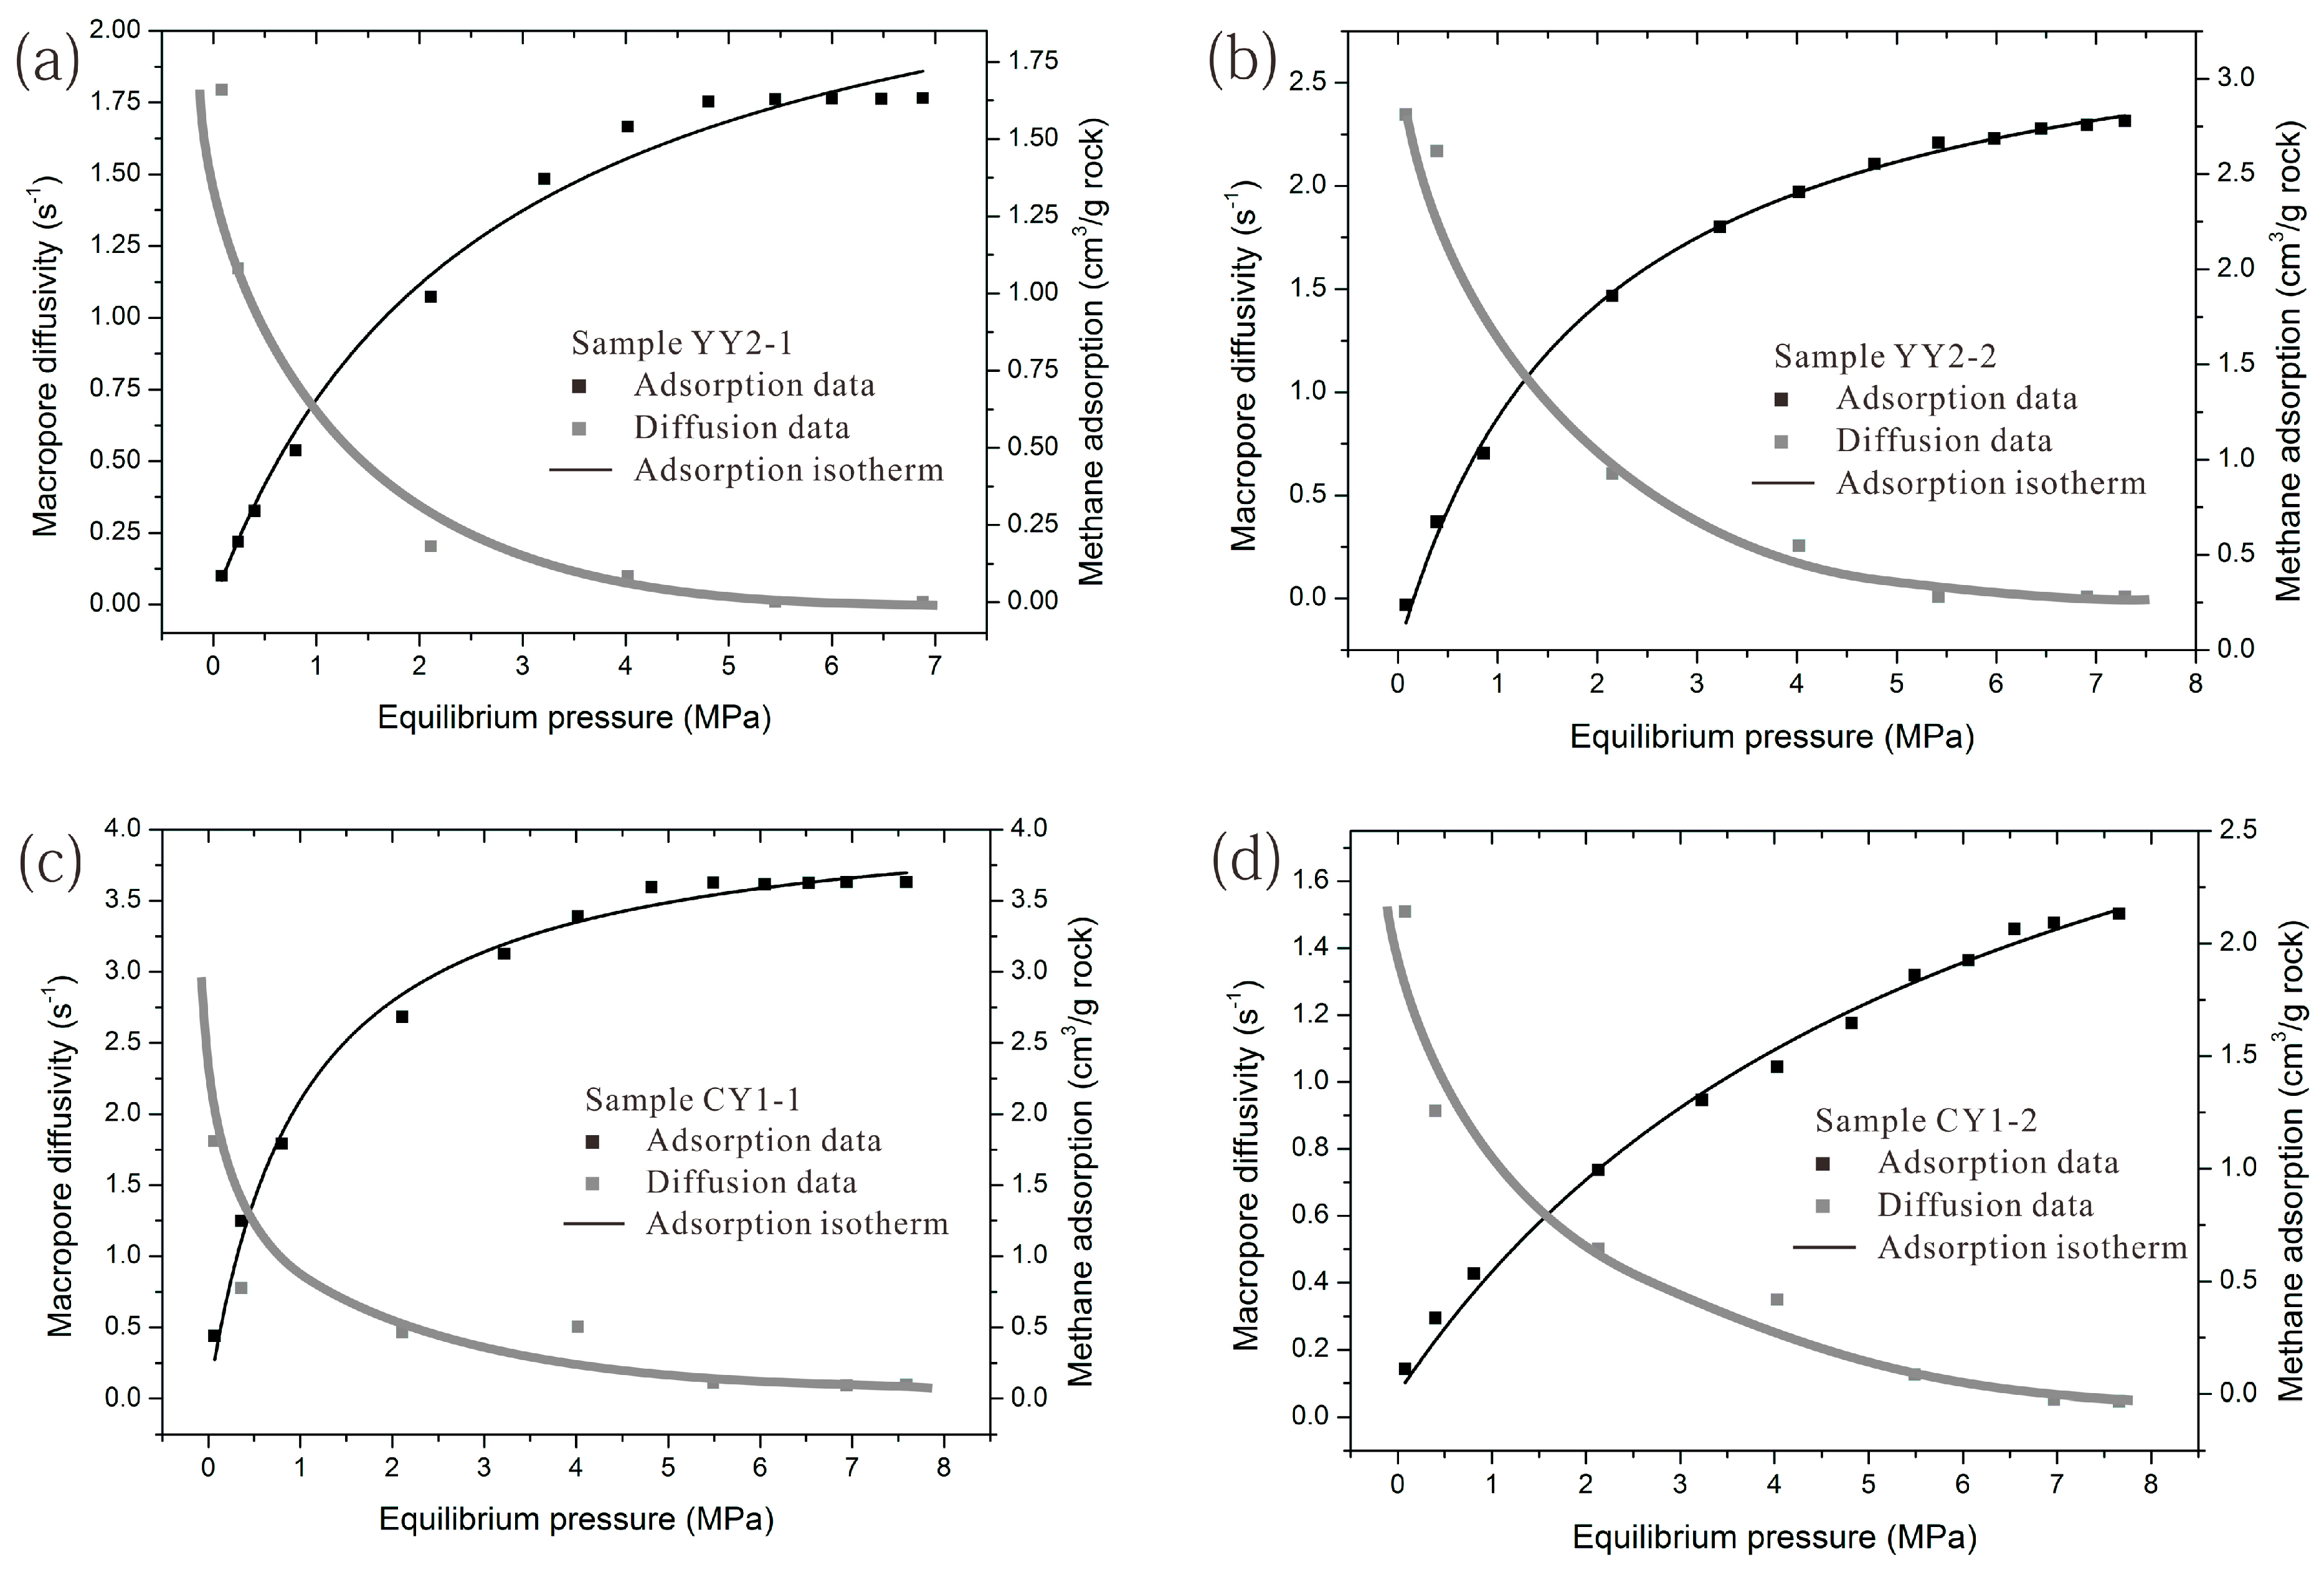
Figure 11.
Variation in the values of α (a) and the ratio of micropore and macropore adsorption (b) with equilibrium pressure.
Figure 11.
Variation in the values of α (a) and the ratio of micropore and macropore adsorption (b) with equilibrium pressure.
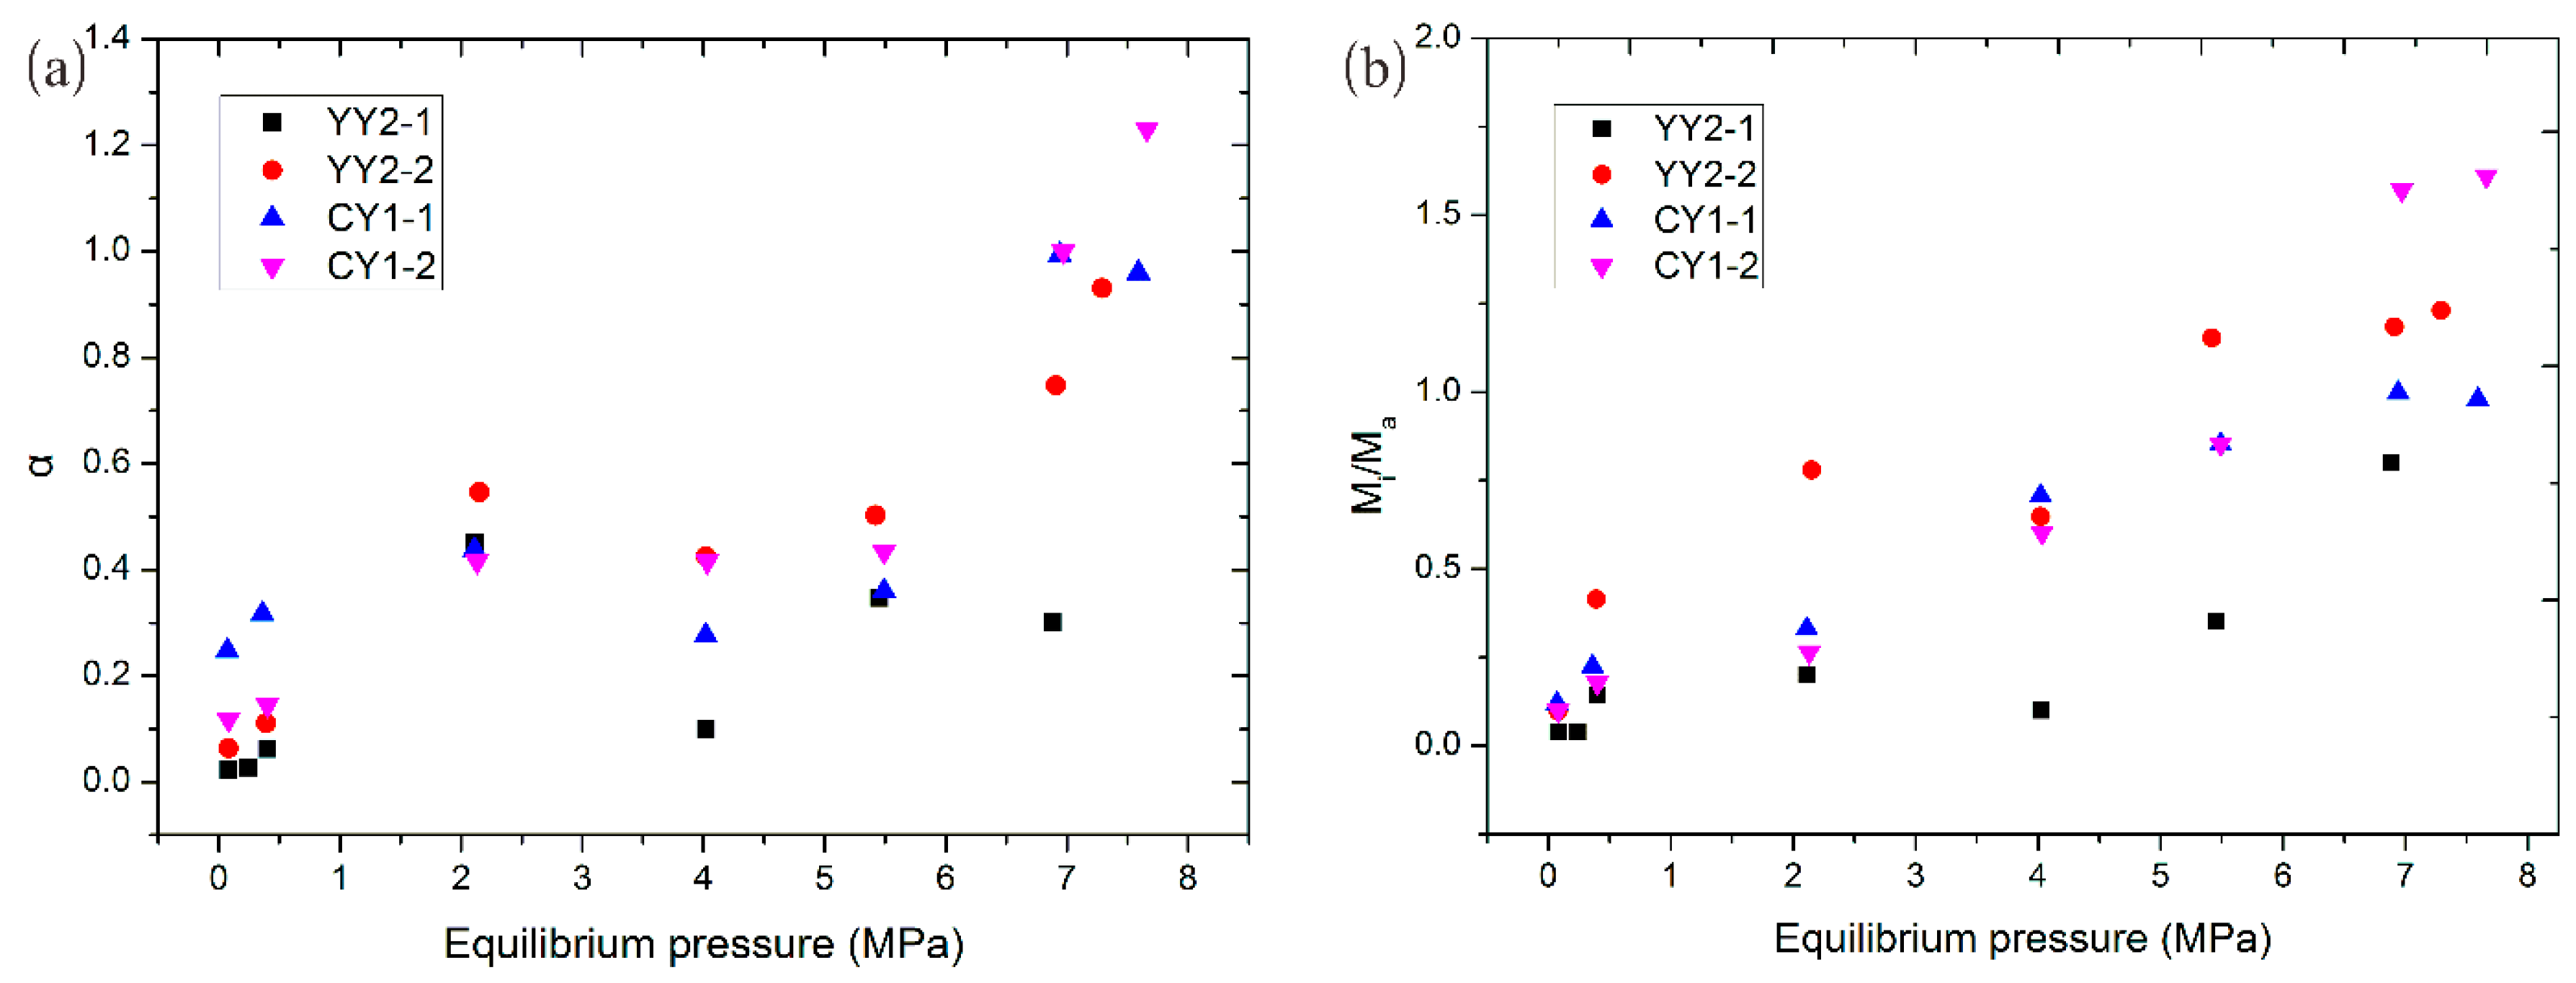
Figure 12.
Using an Amoco curve fit method and a modified curve fit method for lost gas content estimation of a shale sample collected in the MY-1 well in the Southern North China Basin. Solid points are the desorbed gas data that were collected from a drilling site, and solid lines are the corresponding fitting line.

Table 1.
The organic geochemistry and mineral compositions of shale samples involved in present study. TOC: Total organic carbon, I/S: Illite/Smectite.
Table 1.
The organic geochemistry and mineral compositions of shale samples involved in present study. TOC: Total organic carbon, I/S: Illite/Smectite.
| Sample | Organic Geochemistry | Mineral Compositions (%) | ||||||||
|---|---|---|---|---|---|---|---|---|---|---|
| TOC (%) | Ro (%) | Quartz | Feldspar | Pyrite | Carbonate | Total Clays | Illite | Chlorite | I/S | |
| YY2-1 | 1.76 | 2.68 | 57 | 5 | 1 | 2 | 35 | 16 | 9 | 10 |
| YY2-2 | 1.61 | 3.04 | 60 | 7 | 2 | 31 | 20 | 4 | 7 | |
| CY1-1 | 2.03 | 3.35 | 51 | 8 | 3 | 1 | 37 | 17 | 7 | 13 |
| CY1-2 | 2.54 | 3.61 | 54 | 5 | 1 | 2 | 38 | 21 | 5 | 12 |
Table 2.
Measured methane adsorption capacity for shale samples.
| YY2-1 | YY2-2 | CY1-1 | CY1-2 | ||||
|---|---|---|---|---|---|---|---|
| P (MPa) | V (cm3/g) | P (MPa) | V (cm3/g) | P (MPa) | V (cm3/g) | P (MPa) | V (cm3/g) |
| 0.08 | 0.0858 | 0.08 | 0.238 | 0.07 | 0.2391 | 0.08 | 0.1096 |
| 0.24 | 0.1961 | 0.39 | 0.473 | 0.36 | 0.5080 | 0.40 | 0.3368 |
| 0.40 | 0.2951 | 0.86 | 0.733 | 0.80 | 0.7920 | 0.81 | 0.5333 |
| 0.80 | 0.4921 | 2.15 | 1.359 | 2.11 | 1.3821 | 2.13 | 0.9943 |
| 2.11 | 0.9886 | 3.23 | 1.821 | 3.22 | 1.7253 | 3.23 | 1.3049 |
| 3.21 | 1.3717 | 4.02 | 2.206 | 4.02 | 1.9907 | 4.03 | 1.4517 |
| 4.02 | 1.5401 | 4.78 | 2.553 | 4.82 | 2.3945 | 4.82 | 1.6464 |
| 4.80 | 1.6220 | 5.42 | 2.664 | 5.49 | 2.6267 | 5.49 | 1.8582 |
| 5.45 | 1.6292 | 5.98 | 2.786 | 6.05 | 2.7142 | 6.06 | 1.9253 |
| 6.00 | 1.6311 | 6.45 | 2.838 | 6.53 | 2.8242 | 6.55 | 2.0644 |
| 6.48 | 1.6301 | 6.91 | 2.958 | 6.94 | 2.8501 | 6.97 | 2.0922 |
| 6.88 | 1.6322 | 7.29 | 2.978 | 7.59 | 2.8904 | 7.66 | 2.1312 |
Table 3.
Langmuir fitting results of methane adsorption for experimental shale samples.
| Sample | VL (MPa) | PL (cm3/g) | R2 |
|---|---|---|---|
| YY2-1 | 2.37 | 2.6105 | 0.98 |
| YY2-2 | 5.55 | 6.0731 | 0.99 |
| CY1-1 | 5.09 | 5.5414 | 0.99 |
| CY1-2 | 3.88 | 6.1741 | 0.99 |
Table 4.
The unipore diffusion model fitting parameters for the methane adsorption rate data at three pressure steps.
Table 4.
The unipore diffusion model fitting parameters for the methane adsorption rate data at three pressure steps.
| YY2-1 | YY2-2 | ||
| P (MPa) | D/ (s−1) | P (MPa) | D/ (s−1) |
| 0.08 | 1.5010 | 0.08 | 0.7717 |
| 0.24 | 1.1718 | 0.39 | 0.1801 |
| 0.40 | 0.1934 | 2.15 | 0.2958 |
| 2.11 | 0.2027 | 4.02 | 0.1030 |
| 4.02 | 0.0013 | 5.42 | 0.0122 |
| 5.45 | 0.0009 | 6.91 | 0.0068 |
| 6.88 | 0.00097 | 7.29 | 0.0061 |
| CY1-1 | CY1-2 | ||
| P (MPa) | D/ (s−1) | P (MPa) | D/ (s−1) |
| 0.07 | 0.9091 | 0.08 | 1.3207 |
| 0.36 | 0.1675 | 0.40 | 0.4327 |
| 2.11 | 0.2384 | 2.13 | 0.5001 |
| 4.02 | 0.0549 | 4.03 | 0.0821 |
| 5.49 | 0.0207 | 5.49 | 0.0601 |
| 6.94 | 0.0249 | 6.97 | 0.0129 |
| 7.59 | 0.0012 | 7.66 | 0.0013 |
Table 5.
The bidisperse diffusion model fitting parameters for the methane adsorption rate data at three pressure steps.
Table 5.
The bidisperse diffusion model fitting parameters for the methane adsorption rate data at three pressure steps.
| YY2-1 | YY2-2 | ||||||||
| P (MPa) | / (s−1) | / (s−1) | α | β/α | P (MPa) | / (s−1) | / (s−1) | α | β/α |
| 0.08 | 1.7948 | 0.0424 | 0.0236 | 0.1149 | 0.08 | 2.3453 | 0.3493 | 0.0636 | 0.2961 |
| 0.24 | 1.1718 | 0.0325 | 0.0277 | 0.1224 | 0.39 | 2.1688 | 0.2402 | 0.1107 | 1.2450 |
| 0.40 | 0.3297 | 0.0207 | 0.0628 | 0.4341 | 2.15 | 0.6042 | 0.2303 | 0.5467 | 2.3397 |
| 2.11 | 0.2027 | 0.0479 | 0.4514 | 0.6033 | 4.02 | 0.2551 | 0.1084 | 0.4251 | 1.9455 |
| 4.02 | 0.0994 | 0.0100 | 0.1003 | 0.3021 | 5.42 | 0.0083 | 0.0042 | 0.5030 | 3.4593 |
| 5.45 | 0.0091 | 0.0032 | 0.3477 | 1.0593 | 6.91 | 0.0068 | 0.0051 | 0.7475 | 3.5553 |
| 6.88 | 0.0097 | 0.0010 | 0.3015 | 2.4030 | 7.29 | 0.0062 | 0.0056 | 0.9309 | 3.6930 |
| CY1-1 | CY1-2 | ||||||||
| P (MPa) | / (s−1) | / (s−1) | α | β/α | P (MPa) | / (s−1) | / (s−1) | α | β/α |
| 0.07 | 1.8084 | 0.4472 | 0.2473 | 0.3609 | 0.08 | 1.5084 | 0.1780 | 0.1180 | 0.3006 |
| 0.36 | 0.7760 | 0.2462 | 0.3172 | 0.6744 | 0.40 | 0.9140 | 0.1325 | 0.1449 | 0.5334 |
| 2.11 | 0.4630 | 0.2028 | 0.4379 | 0.9939 | 2.13 | 0.5012 | 0.1307 | 0.4159 | 0.7941 |
| 4.02 | 0.5047 | 0.1947 | 0.2763 | 2.1202 | 4.03 | 0.3496 | 0.1054 | 0.4160 | 1.8073 |
| 5.49 | 0.1089 | 0.0392 | 0.3598 | 2.5593 | 5.49 | 0.1255 | 0.0545 | 0.4346 | 2.5593 |
| 6.94 | 0.0923 | 0.0917 | 0.9940 | 2.9949 | 6.97 | 0.0529 | 0.0529 | 1.0000 | 4.7118 |
| 7.59 | 0.0967 | 0.0901 | 0.9600 | 2.9400 | 7.66 | 0.0467 | 0.0321 | 1.2310 | 4.8324 |
© 2017 by the authors. Licensee MDPI, Basel, Switzerland. This article is an open access article distributed under the terms and conditions of the Creative Commons Attribution (CC BY) license (http://creativecommons.org/licenses/by/4.0/).
Share and Cite
MDPI and ACS Style
Dang, W.; Zhang, J.; Wei, X.; Tang, X.; Wang, C.; Chen, Q.; Lei, Y. Methane Adsorption Rate and Diffusion Characteristics in Marine Shale Samples from Yangtze Platform, South China. Energies 2017, 10, 626. https://doi.org/10.3390/en10050626
AMA Style
Dang W, Zhang J, Wei X, Tang X, Wang C, Chen Q, Lei Y. Methane Adsorption Rate and Diffusion Characteristics in Marine Shale Samples from Yangtze Platform, South China. Energies. 2017; 10(5):626. https://doi.org/10.3390/en10050626
Chicago/Turabian StyleDang, Wei, Jinchuan Zhang, Xiaoliang Wei, Xuan Tang, Chenghu Wang, Qian Chen, and Yue Lei. 2017. "Methane Adsorption Rate and Diffusion Characteristics in Marine Shale Samples from Yangtze Platform, South China" Energies 10, no. 5: 626. https://doi.org/10.3390/en10050626
Note that from the first issue of 2016, this journal uses article numbers instead of page numbers. See further details here.