
Design and Implementation of a Data Acquisition System for Combustion Tests
by
 , , and
María Teresa Miranda
, 
Irene Montero
,
Francisco José Sepúlveda
*,
José Ignacio Arranz
and
Carmen Victoria Rojas
Department of Mechanical Engineering, Energy and Materials, Industrial Engineering School, University of Extremadura, Avenue Elvas s/n, 06006 Badajoz, Spain
*
Author to whom correspondence should be addressed.
Energies 2017, 10(5), 630; https://doi.org/10.3390/en10050630
Submission received: 30 March 2017
/
Revised: 25 April 2017
/
Accepted: 27 April 2017
/
Published: 4 May 2017
(This article belongs to the Special Issue Thermo-Chemical Conversion of Waste Biomass)
Abstract
:In recent years, the biomass market has constantly increased. The pellet manufacture industry has started looking for new products, such as wastes from forest, agriculture, and agroindustrial residues, among others, with the potential to be used as biofuels. However, some of these wastes have some characteristics that make both the combustion process and operating and maintenance conditions of thermal equipment difficult. Thus, further research to optimize the performance and ensure the compliance of the maximum atmospheric levels is needed. In order to carry out these studies, the design and implementation of a supervision, control, and data acquisition system for a domestic pellet boiler was carried out, which makes obtaining further information about the performance of non-conventional biofuels possible. Thus, these biofuels, coming from different sources, underwent different working regimes, facilitating the understanding of the results and the correction of limiting elements. The results from initial tests were reliable and precise, coinciding with the check readings that were done with a thermometer and a combustion gas analyser. Under these conditions, the system designed constitutes a fundamental tool to examine thermal processes with alternative biofuels, with the objective of making the most of different biomass wastes as renewable energy sources.
1. Introduction
Biomass has experienced a significant resurgence as an energy source. The rise in fossil fuel price has been considerable, increasing the costs of thermal processes. Due to that fact, more and more countries promote the use of renewable energy sources. Pellets are one of the most used forms of biomass in domestic equipment, standing out due to their uniformity and their high bulk density, which allow their transportation and handling in automatic systems [1].
Between 2006 and 2012, worldwide pellet production increased from 7 to 19 million tons, reaching 28 million tons in 2015 [2]. This rise has implied wide diversity when it comes to the use of raw materials for pellet manufacture. The recent repeal of the standard UNE-EN 14961 [3], and its replacement by the norm UNE-EN ISO 17225 [4], makes the commercialization of woody pellets (and other kinds) possible for both industrial and domestic use and, therefore, implies an increase in the types of biomass wastes that might be used for this purpose. Similarly, the European market of biomass boilers has grown in the same way [5].
In recent years, research works concerning biomass densification have gone through two main research lines: the first one, focused on the study of mechanisms in order to optimize the densification process (moisture, pressure, temperature, etc.), and the second one, based on the combined use of different biomass wastes [6,7,8,9].
Even though pine sawdust pellets are still the most used ones, the pellet manufacture industry has started looking for new products, such as forest, agricultural, and agroindustrial wastes, or their combination [10]. These wastes have the potential to be used as biofuels, although some of them present some properties that make the combustion process and the operating conditions of the thermal equipment difficult. In these cases, a re-calibration is needed to make the most of the features and guarantee the fulfilment of the maximum atmospheric emission limits. Thus, the analysis of the performance of these biofuels is indispensable as a previous stage to their possible commercialization [11,12,13].
Thus, there are several research works about non-conventional pellet production and their subsequent use in combustion equipment. Miranda et al. [14] analysed the combustion of pomace and forest wastes in a 5.8-kW stove, observing that adding up the latter considerably improved the durability of the resulting mixture and helped to reduce the ash content in the densified product. Rabaçal et al. [15] analysed the combustion emissions of pine pellets, sawdust residues, and olive stones in a 22-kW boiler, concluding that the kind of pellet significantly affected the yield of the equipment, especially the emission of pollutants. Arranz et al. [16] compared the efficiency of three different types of commercial pellets and a laboratory-made one (made of forest wastes), pointing out the need of stripping the bark from these wastes previously, to reduce the final ash content. Lajili et al. [17] analysed the combustion of pellets that were manufactured with mixtures of wastes from oil mills and pine sawdust, concluding that air supply in the boiler has to adapt to the specific properties of the non-conventional pellets. Dias et al. [18] studied the combustion of four kinds of pellets with different nitrogen contents, observing that there was a significant correlation between them and NOx emissions. Mediavilla et al. [19] evaluated the ability of vine shoot and cork industry waste (and their combination) for pelletizing, checking the subsequent performance in a 17.5-kW boiler. Finally, they concluded that adding cork wastes improved the densification process, although physical properties of the pellets were worse. Verma et al. [20,21] analysed the yield of a boiler using woody, straw, sunflower husk pellets (among others), pointing out the importance of low ash contents to avoid slagging and fouling. Moya et al. [22] evaluated the combustion of ten types of pellets from forest crops and agricultural crops in a 50-kW stove, observing a different behavior in each case (lower residual mass in forest crop pellets and need to reduce CO and NOx emissions in some agricultural crop pellets).
Nevertheless, there are plenty of wastes to be analysed and problems to be solved, and new research works devoted to both the densification process and the subsequent use of these pellets in the corresponding thermal equipment are needed. In this case, the present work belongs to the latter research line.
In order to carry out these studies, some supervision actions, data acquisition, and control over the different elements that make up a combustion plant are needed. In that sense, the automatic control has played an important role in the advance of science and the field of engineering, being essential in many industrial operations to control any physical magnitudes. The aim of data acquisition systems is to interpret the values that rule the behaviour of a specific plant and, if there is a control stage, the decision-making to take steps concerning a specific order.
The development of these systems is part of the research focused on the use of new biofuels. Thus, Carvalho et al. [23] analysed the combustion of pellets from agricultural wastes, such as straw, maize, wheat bran, vineyard prunings, and hay, in a 15-kW boiler, controlling the fuel feeding and concluding that cleaning systems for the heat exchangers of the boilers that were fed with these kinds of pellets are needed in order to avoid efficiency loss. Carroll and Finnan [24] used a weight balance and an energy meter in the hot water circuit to assess the efficiency of the combustion process for six different types of pellets, concluding that the implementation of steps to reduce emissions or an advanced design of the boilers to fulfil the upper limits of emissions of the norm are needed. Kang et al. [25] carried out a test to assess the yield of a domestic pellet boiler by installing flow and temperature controllers. Schönnenbeck et al. [26] also used a balance under the boiler and hopper to quantify the fuel, analysing the combustion of mixtures of grape marc and wood pellets.
However, in most cases, the references consulted do not describe in detail the data acquisition system that the researchers used, whereas other references do not explain all of the information about the combustion process. That is the reason why, with the aim of being used for further research works, a supervision, control, and data acquisition system has been designed for a domestic pellet boiler, to obtain further information about the behaviour of different non-conventional biofuels from different sources and undergoing different working regimes, making the interpretation of results and the possible correction of limiting factors possible. This way, the system designed constitutes a useful and effective tool for research works with the aim of using non-conventional biofuels and their possible commercialization.
This research work shows the configuration of the system, the implementation of the data acquisition devices and the software used by the user (or customer), as well as the initial results of the tests that were carried out during the implementation of the facilities.
2. Materials and Methods
2.1. Description of the Combustion Plant
The plant consists of a multi-fuel boiler (Bioclass 9, Domusa Teknik, Errezil, País Vasco, Spain), with a maximum useful power of 9.4 kW and a 300-litre auxiliary tank. It is a class 3 modulating boiler, according to the norm UNE-EN 303-5:2013 [27], whose power was suitable for the installation.
The hydraulic part was built with 1/2′′ cooper pipes, isolated with a shell made of mineral wool, planning to install two traps for hot and cold water. In the same way, the boiler has a thermostatic valve (tared at 60 °C) that mixes impulsion and return water, with the aim of avoiding the entrance of excessively cold water into the heat exchanger.
As an energy dissipater element, a 6.6-kW air heater was placed on the roof of the building (AB 122/4, BTU, Alcorcón, Madrid, Spain), as well as an 8-L expanding pipe (8 CMF, Ibaiondo, Mungia, País Vasco, Spain) in order to absorb the increase in volume of the heat carrier fluid. Finally, an inertia tank (Cordivari, Pagliare TE, Italy), with a volume of 100 L, was installed to avoid continual starts and stops of the boiler. The installation was completed with a volumetric counter (Contor Group, Arad, Romania, at 10 L/pulse) and a valve (MC V3R-25, Salvador Escoda, Barcelona, Spain) to control the water getting through the air heater.
Concerning the sensors, seven probes were placed in different points of the hydraulic circuit, a thermocouple probe in the burner, and another probe for the fume temperature, as well as a LSU 4.9D lambda probe (Bosch, Abstatt, Germany) in the evacuation pipe to assess the percentage of O2 that is used during combustion.
Figure 1 shows the diagram of the installation.
2.2. Description of the Data Acquisition System
An intelligent system for registering and interpreting the different variables that were analysed (temperature, flow, etc.) is used which, in turn, detects and quantifies the operation of the main elements in the boiler. It is composed of a power supply with a 160 mA filter, five analog sensors that process four independent input signals each, and a module (eibPort) that contains a web server integrated to the user interface.
The communication protocol used is KNX [28], currently considered as the standard language worldwide for intelligent control and management of buildings (lightning, heating, security, etc.). It is a decentralized system that uses a twisted pair cable as a means of transmission (the same wire for both energy supply and control signals). All of the elements belong to automated products of ABB (Zurich, Switzerland), and were integrated in an electric panel for being set up in a DIN rail.
Thus, the system records the performance of four motors for two activity states (on/off). These motors are auger feeder (AF), burner cleaning system (BC), fume pass cleaning system (FP), and pump (P). For this purpose, a detector system for each motor, including a relay for each circuit, was designed. The pass of electricity during the operation of each motor excites the coil of the relay, allowing the precise analysis of the system. Concerning the fan (F), and due to the fact that it works constantly, the record of its working regime was carried out through a tachometer (PCE-151, PCE Ibérica, Albacete, Spain) and its corresponding software (Digital Tachometer v5.0, PCE Ibérica, Albacete, Spain, which quantifies the speed of the fan and provides a measure of the air flow supplied to the combustion process.
The system was completed with the design of a graphical user interface (GUI) that monitors the behaviour of all the variables processed, as well as allowing the interaction between some devices and the plant. The results obtained during the carrying out of the tests are internally stored as a previous step for the subsequent analysis with a spreadsheet.
2.3. Description of the Pellets
For the starting tests of the data acquisition system, three different pellets were used: a commercial one and two laboratory-made ones. The former was a 6-mm commercial pellet (COM) made of pine sawdust and with EN-Plus A1 certification. The latter were made of industrial wastes, using a pelletizer (MGL 200, Kovo Novak, Citonice, Czech Republic), with a 6-mm flat die. These wastes were granulometric separation powders from cork industries (LAB1) and eucalyptus sawdust (LAB2). Pre-treatment tasks were not necessary for these wastes, as they had suitable moisture and granulometry levels for densification (particle size under 3.15 mm and moisture under 10% wet basis) [29].
Table 1 shows the physical energy characterization of the pellets. Moisture tests were carried out by a balance (accuracy ±0.0001 g) and a stove (at 105 °C), according to the standard UNE-EN ISO 18134-2 [30]. Bulk density was determined by the standard UNE-EN ISO 17828 [31]. For ultimate analysis, an elemental analyser (Eurovector EA 3000, Eurovector SpA, Milan, Italy) was used according to the standards UNE-EN ISO 16948 and UNE-EN ISO 16994 [32,33]. For volatile matter and ash content percentages, an oven was used, achieving 900 and 550 °C, according to the standards UNE-EN ISO 18123 and UNE-EN ISO 18122, respectively [34,35]. Fixed carbon content was calculated by subtracting the latter percentages from 100. A high heating value (HHV) was obtained by using a calorimeter (IKA C2000 Basic, Ika-Werke GmbH&Co, Staufen, Germany), following the standard UNE-EN 14918 [36]. Durability tests were carried out according to the standard UNE-EN ISO 17831-1 [37], using a durabilimeter (BDM230, Mabrik, Barcelona, Spain).
Finally, low heating value (LHV, MJ/kg db) and energy density (DE, MJ/m3 wb) were determined through Equations (1) and (2):
With H being hydrogen content (db) and DB being bulk density (kg/m3, wb).
2.4. Description of the Tests at Start Up
Different tests, lasting for 2.5 h, were carried out for the three types of pellets. The working regime values that were selected for the boiler are shown in Table 2. Thus, the boiler worked using between 30% and 100% of its maximum power, so that this variation was recorded by the data acquisition system. Likewise, the working ratios of the fan were kept for each power level, determined by the manufacturer of the equipment for EN-Plus A1 pellets, and shown in Table 3.
Power graphics were obtained by using Equations (3) and (4), where Pf is the fuel power (kW), qf is the pellet consumption (kg/s), LHV is the low heating value for the biofuel (kJ/kg wb), Pu is the useful power for the boiler (kW), qw is the water flow (kg/s), cp,w is the specific heat of water (kJ kg−1 K−1), and ΔT is the temperature difference between the boiler inlet and outlet:
Finally, different equipment were used to calibrate the probes in the installation in order to check the right record of the data acquisition system during the combustion tests. In this way, a K-type digital thermometer (PCE-T390, PCE Ibérica, Albacete, Spain) and a combustion gas analyser (350 XL, Testo SE&Co.KGaA, Lenzkirch, Germany) were used.
2.5. Initial Calibration of the Boiler
For each kind of pellet, and with the aim of adapting the performance of the boiler to their different densities, an initial calibration was carried out to determine the amount of pellets that are placed in the burner after 200 feeding (or charge) movements of the auger feeder. This amount was weighed by using a weight balance (GFK, Adam Equipment, Milton Keynes, U.K.), and introduced in the control system of the boiler.
The initial calibration showed the following results: 1400, 1050, and 990 g for COM, LAB1, and LAB2 pellets, respectively.
3. Results and Discussion
The results of the present research work try to point out the importance of having a data acquisition system devoted to the research of non-conventional biofuels. That is the reason why, in the following sections, the information obtained and its corresponding interpretation are shown, with the aim of validating the designed system.
3.1. Analysis of the Performance of the Main Elements of the Boiler
Figure 2 shows the performance of some elements of the boiler during the combustion test of COM pellets, where 0 and 1 represented in the y-axis means that the corresponding element was off or on, respectively. It can be observed that the auger feeder was inactive during the first minutes, while the two cleaning systems were working (non-burned ash and soot removal in the burner and heat exchanger that comes from previous tests). Immediately after, the auger feeder put a prefixed amount of pellets in the burner and was inactive during the ignition stage. From then on (15 min), the feeding of pellets gradually increased (represented in the figure with a denser line).
The circulating pump stopped during the initial stage of the test, when water was heated and flowed due to natural convection. When water reached 60 °C, the thermostatic valve opened slightly and a small volume of water entered (pump on), repeating this operation two times. From then on, with a stable temperature, the pump worked continuously until the end of the test. The cleaning system of the burner did not work, as the prefixed amount of ash (6 kg) was not reached during the test. On the contrary, the cleaning system for fumes worked two times (at one and two hours after the beginning of the test). In this way, the system correctly registered the operation as specified in the control of the boiler (Table 2).
On the other hand, the performance of the elements in the boiler during the tests with LAB1 and LAB2 pellets were identical to the recorded one for COM pellets, when it comes to the fume and burner cleaning systems, as the length of the tests was not long enough to appreciate any difference because of the different bulk densities of the pellets.
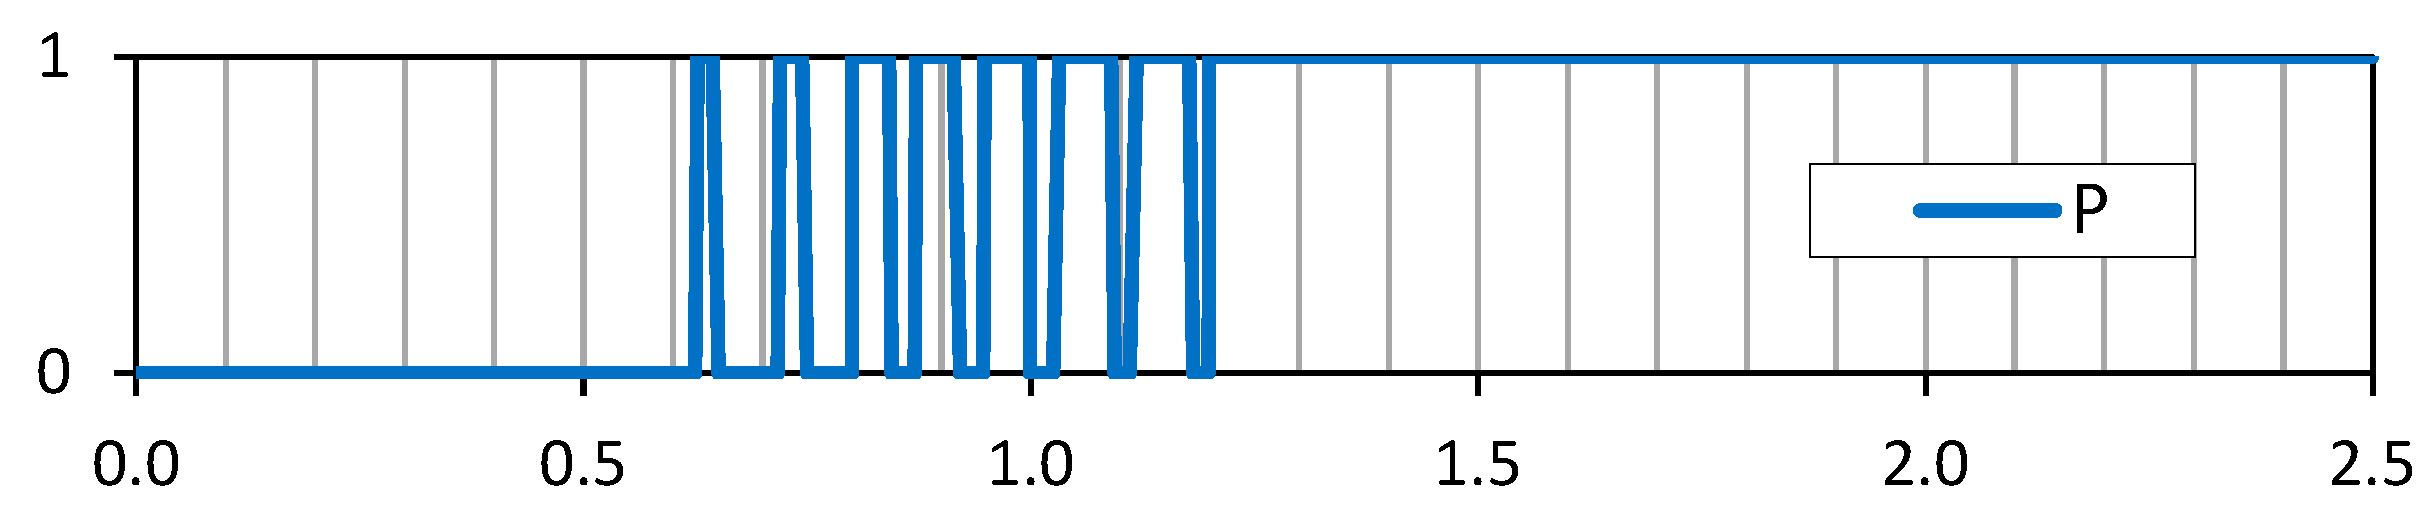
However, concerning the circulation pump, these similarities were not observed for LAB2 pellets (Figure 3). Even though the performance was similar to the other two pellets, starting between 0.6 and 0.7 h, a continuous starting and stop stage, lasting 0.6 h, took place for LAB2 pellets, when small water volumes were introduced to the boiler. With each entry, water temperature dropped below 60 °C, and the pump stopped until that temperature level was reached. This situation could be due to the lower heating value for this fuel compared to the other pellets, requiring larger amounts (longer periods) to increase the water temperature above the value of the thermostatic valve.
3.2. Analysis of the Fuel Feeding
The recording of the performance of the auger feeder enables the quantification of the fuel per unit of time and, according to its low heating value, the determination of the gross power of the system. The designed system is different from the ones that other authors followed, which install a weight balance under the boiler in order to quantify the fuel used during combustion tests [38,39]. Thus, the precise recording of the mobile elements of the boiler (when and how) is, by itself, an innovation, thoroughly studying how the intervention of these elements affects the performance of the equipment (excess air, atmospheric emissions, etc.). The information obtained might be useful for further research works dealing with the adaptation or modification of thermic equipment, with the aim of using non-conventional fuels (agriculture pellets, stones, husks, etc.).
Figure 4 shows the performance of the auger feeder during the combustion tests, focusing on the number of movements and the amount of fuel that it fed.
In the tests for LAB1 and LAB2 pellets, the auger feeder carried out 741 and 692 movements, respectively, whereas, for the COM pellets, 471 movements were conducted. This means that the control system of the boiler allowed its adaptation to low-density pellets (according to an initial calibration), increasing, as a consequence, the frequency of movements in order to adapt the corresponding amount to the maximum power. Concerning the feeding curves of the fuel, the slopes (mass flow) were practically the same during the ignition, power increase, and maximum power stages, slightly differing in the final stage of the tests.
The total amounts of pellets that were used for the combustion tests were 3.41, 3.89, and 3.43 kg for COM, LAB1, and LAB2 pellets. These values were similar among them, a circumstance that was also observed by other authors [26].
3.3. Analysis of the Performance of the Fan
As a previous step for the study of excess air, in the present work the performance of the fan was analysed. Figure 5 shows the working ratios of the boiler and the fan during the combustion of COM pellets (representing the percentage compared to its maximum power).
At the beginning of the test, the fan practically worked at 90% of its maximum capacity (2644 rpm), alternating high and low operating capacity periods during the ignition stage (the first 20 min). After that, and once the combustion started, it increased its working regime from 50% to 80%, when the boiler reached its maximum power. From then on, the fan lowered its regime to 64% of its maximum capacity (1920 rpm), maintaining it during the period when the boiler worked at maximum power and reducing it as the power of the boiler decreased and approached the set temperature. Likewise, three moments were recorded, when the fan worked at 90% for a short period, with a space of time between them of 45 min. This is a safety mechanism implemented in the control of the boiler. Its function is to avoid any gas accumulation at the burner when the boiler works at low power regimes (30–40%), which could generate small deflagrations in the boiler. Thus, the air circulation increases considerably.
In turn, the combined analysis of the performance of both the fan and the auger feeder made the representation of the modulation of the boiler during combustion possible, for steps that represented 10% of the nominal power of each of the equipment. The resulting chart agrees with the information in Table 3, where the performance of the fan is related to a working percentage for each power step of the boiler. This fact ratifies the right interpretation of the data acquisition system.
Concerning the performance of the fan during the combustion of LAB1 and LAB2 pellets—Figure 6 and Figure 7—the values that were recorded by the system followed the same pattern described for COM pellets. Thus, the fan operated at 64% of its capacity for the maximum power of the boiler during the central stage of the test, and reduced the air flow for lower powers.
3.4. Analysis of Oxygen Levels in Combustion Gases
Figure 8 shows the distribution of O2 concentrations in the flue for the three types of pellets. In this figure, three different zones can be observed. In the first zone, between the beginning until 0.8 h, there were more differences among the three tests, recording the lowest O2 values during the combustion of LAB1 pellets, followed by LAB2 and COM, finding the same order for the ignition, with 0.14, 0.16, and 0.20 h, respectively. In the second zone (between 0.8 and 1.5 h) the differences were also considerable, although, in this case, the lowest O2 values were for the combustion of COM pellets, followed by LAB2 and LAB1. In this same area, a sharp peak for LAB1 pellets was observed (over 20%) which means that the combustion was about to be extinguished, possibly due to a problem related to the fuel feeding (excessive or scarce fuel). Finally, in the third area (between 1.5 and 2.5 h) the changes in O2 levels were lower, obtaining similar average values.
Table 4 shows the average values for O2 concentrations, recorded during the combustion tests.
Thus, during the initial stage (ignition and increase in power of the boiler), LAB1 and LAB2 pellets showed higher oxygen consumption during combustion. Instead, during the central stage of the tests, when the boiler worked at maximum power, the highest oxygen consumption corresponded to COM pellets. This was an expected result, as the boiler was designed for this kind of pellet and a working regime at maximum power, obtaining in this stage the highest efficiency ratios.
3.5. Analysis of the Temperature and Power of the Boiler
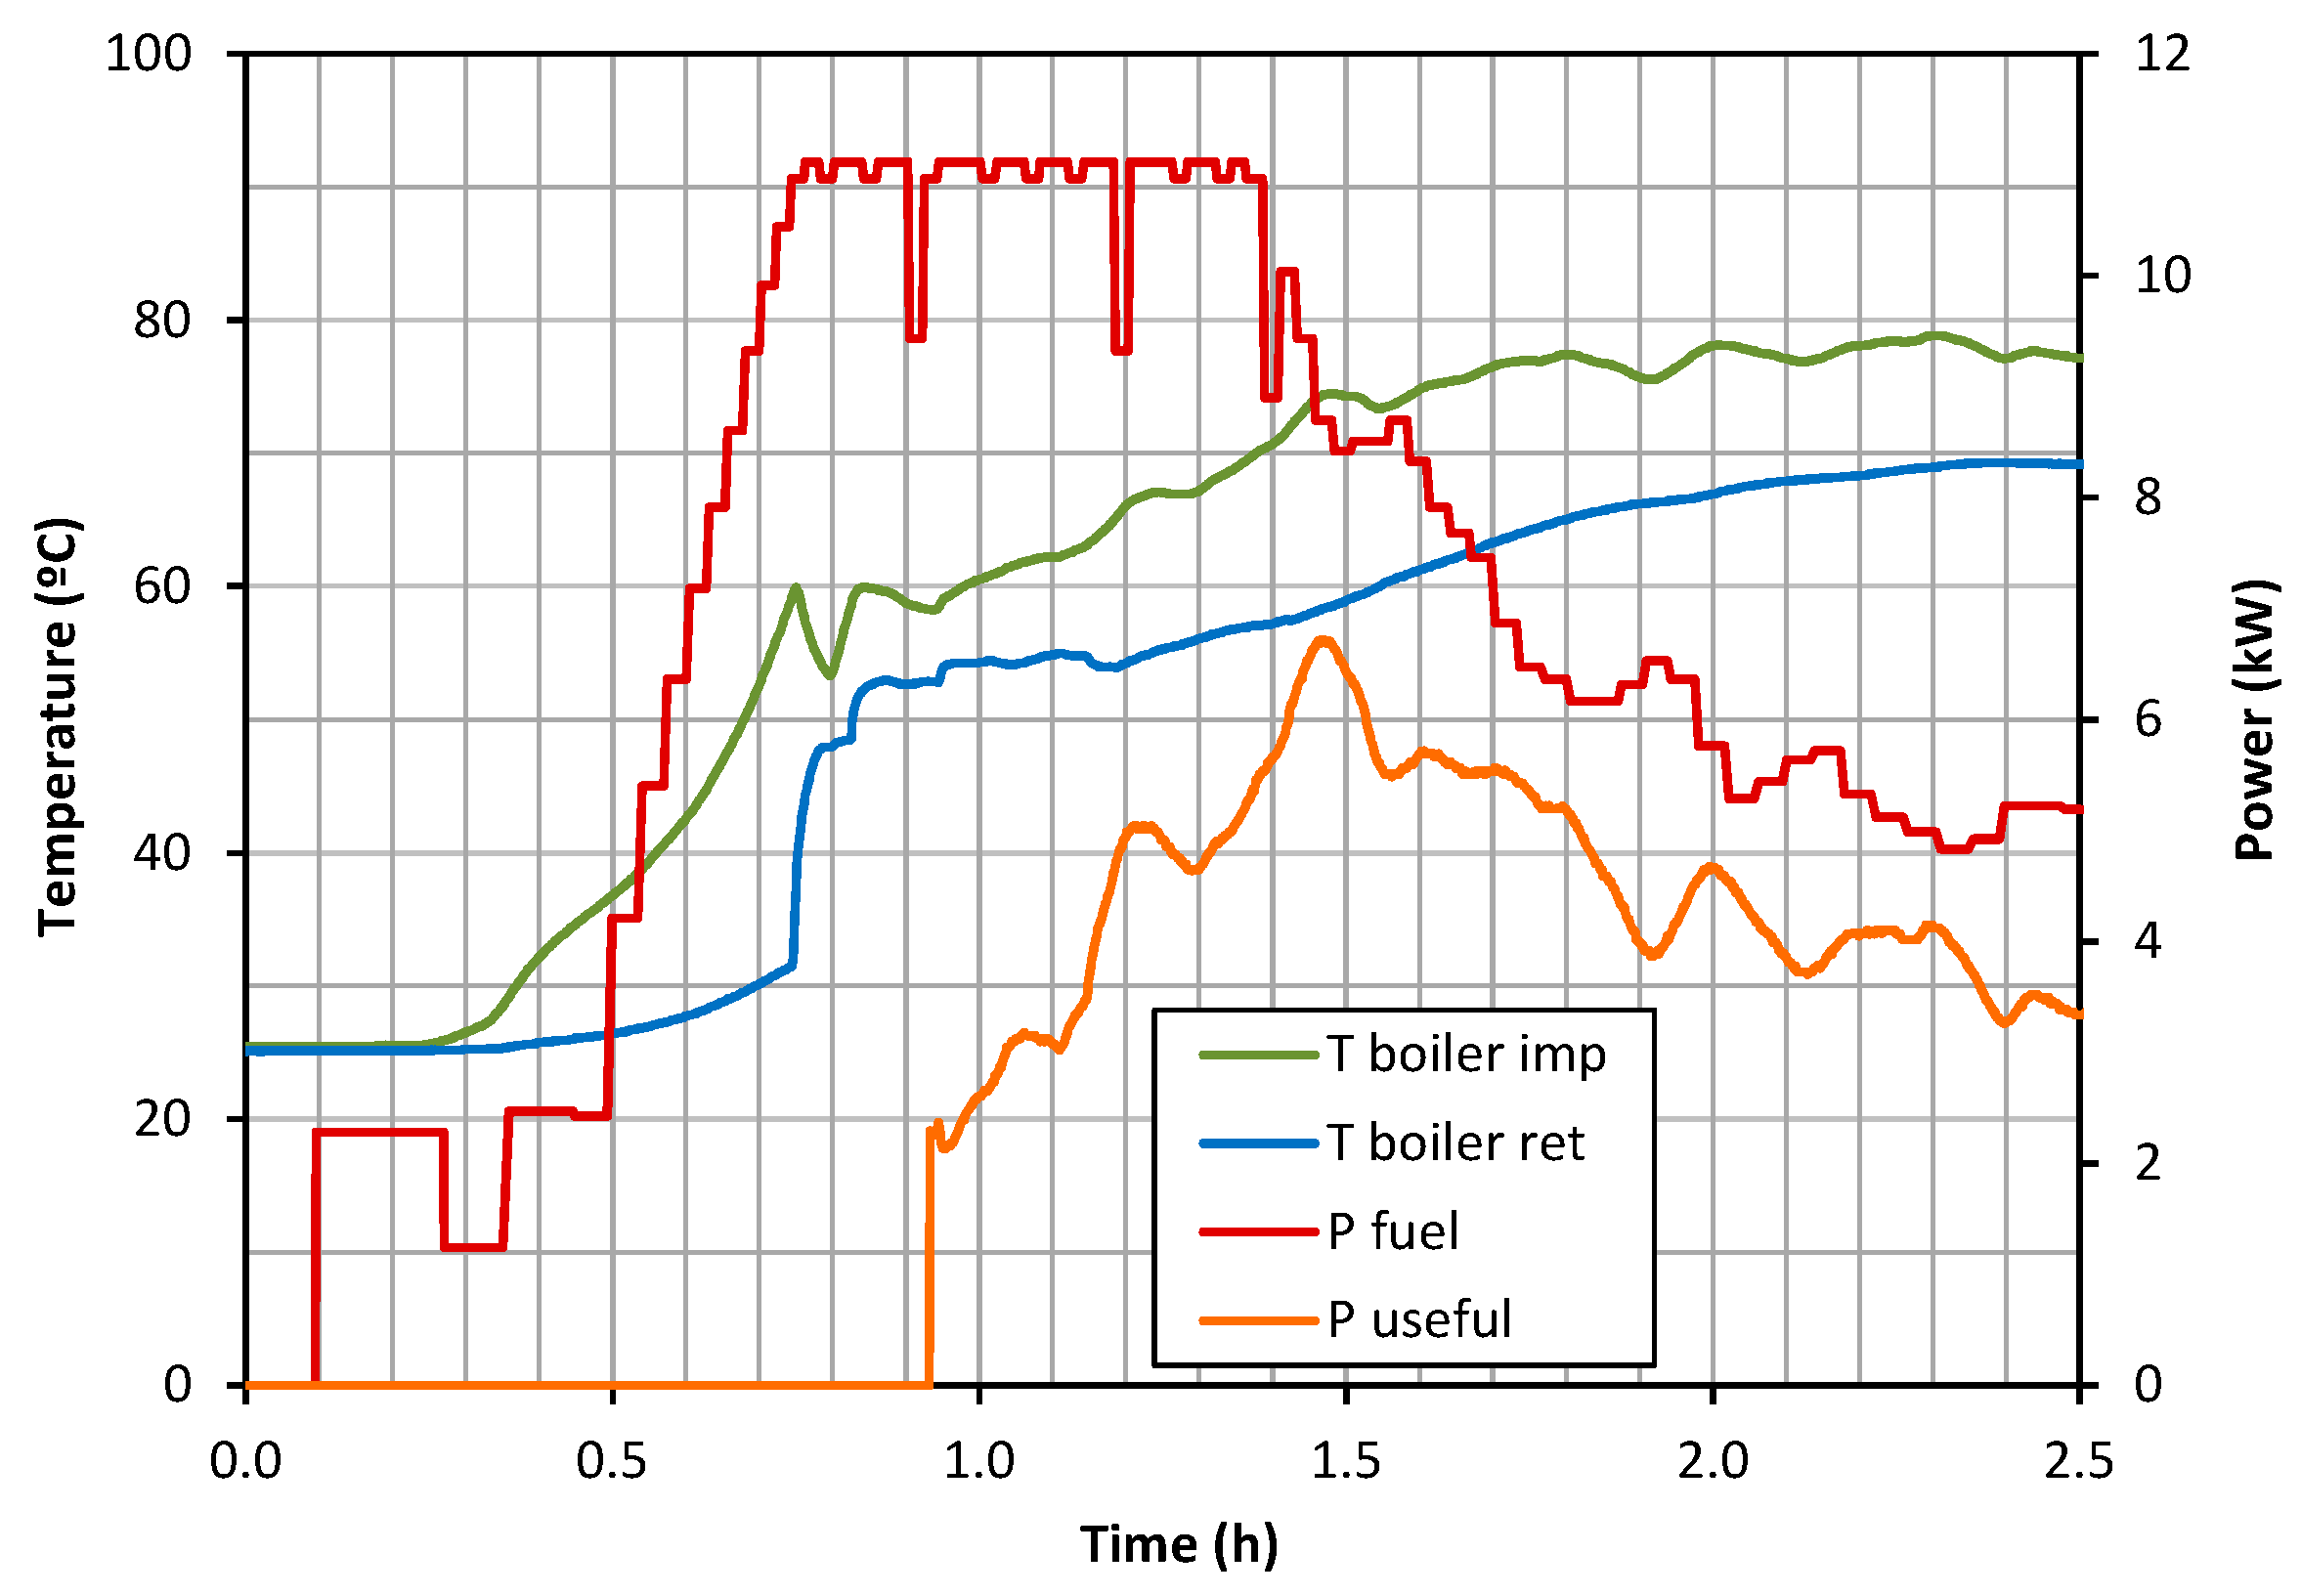
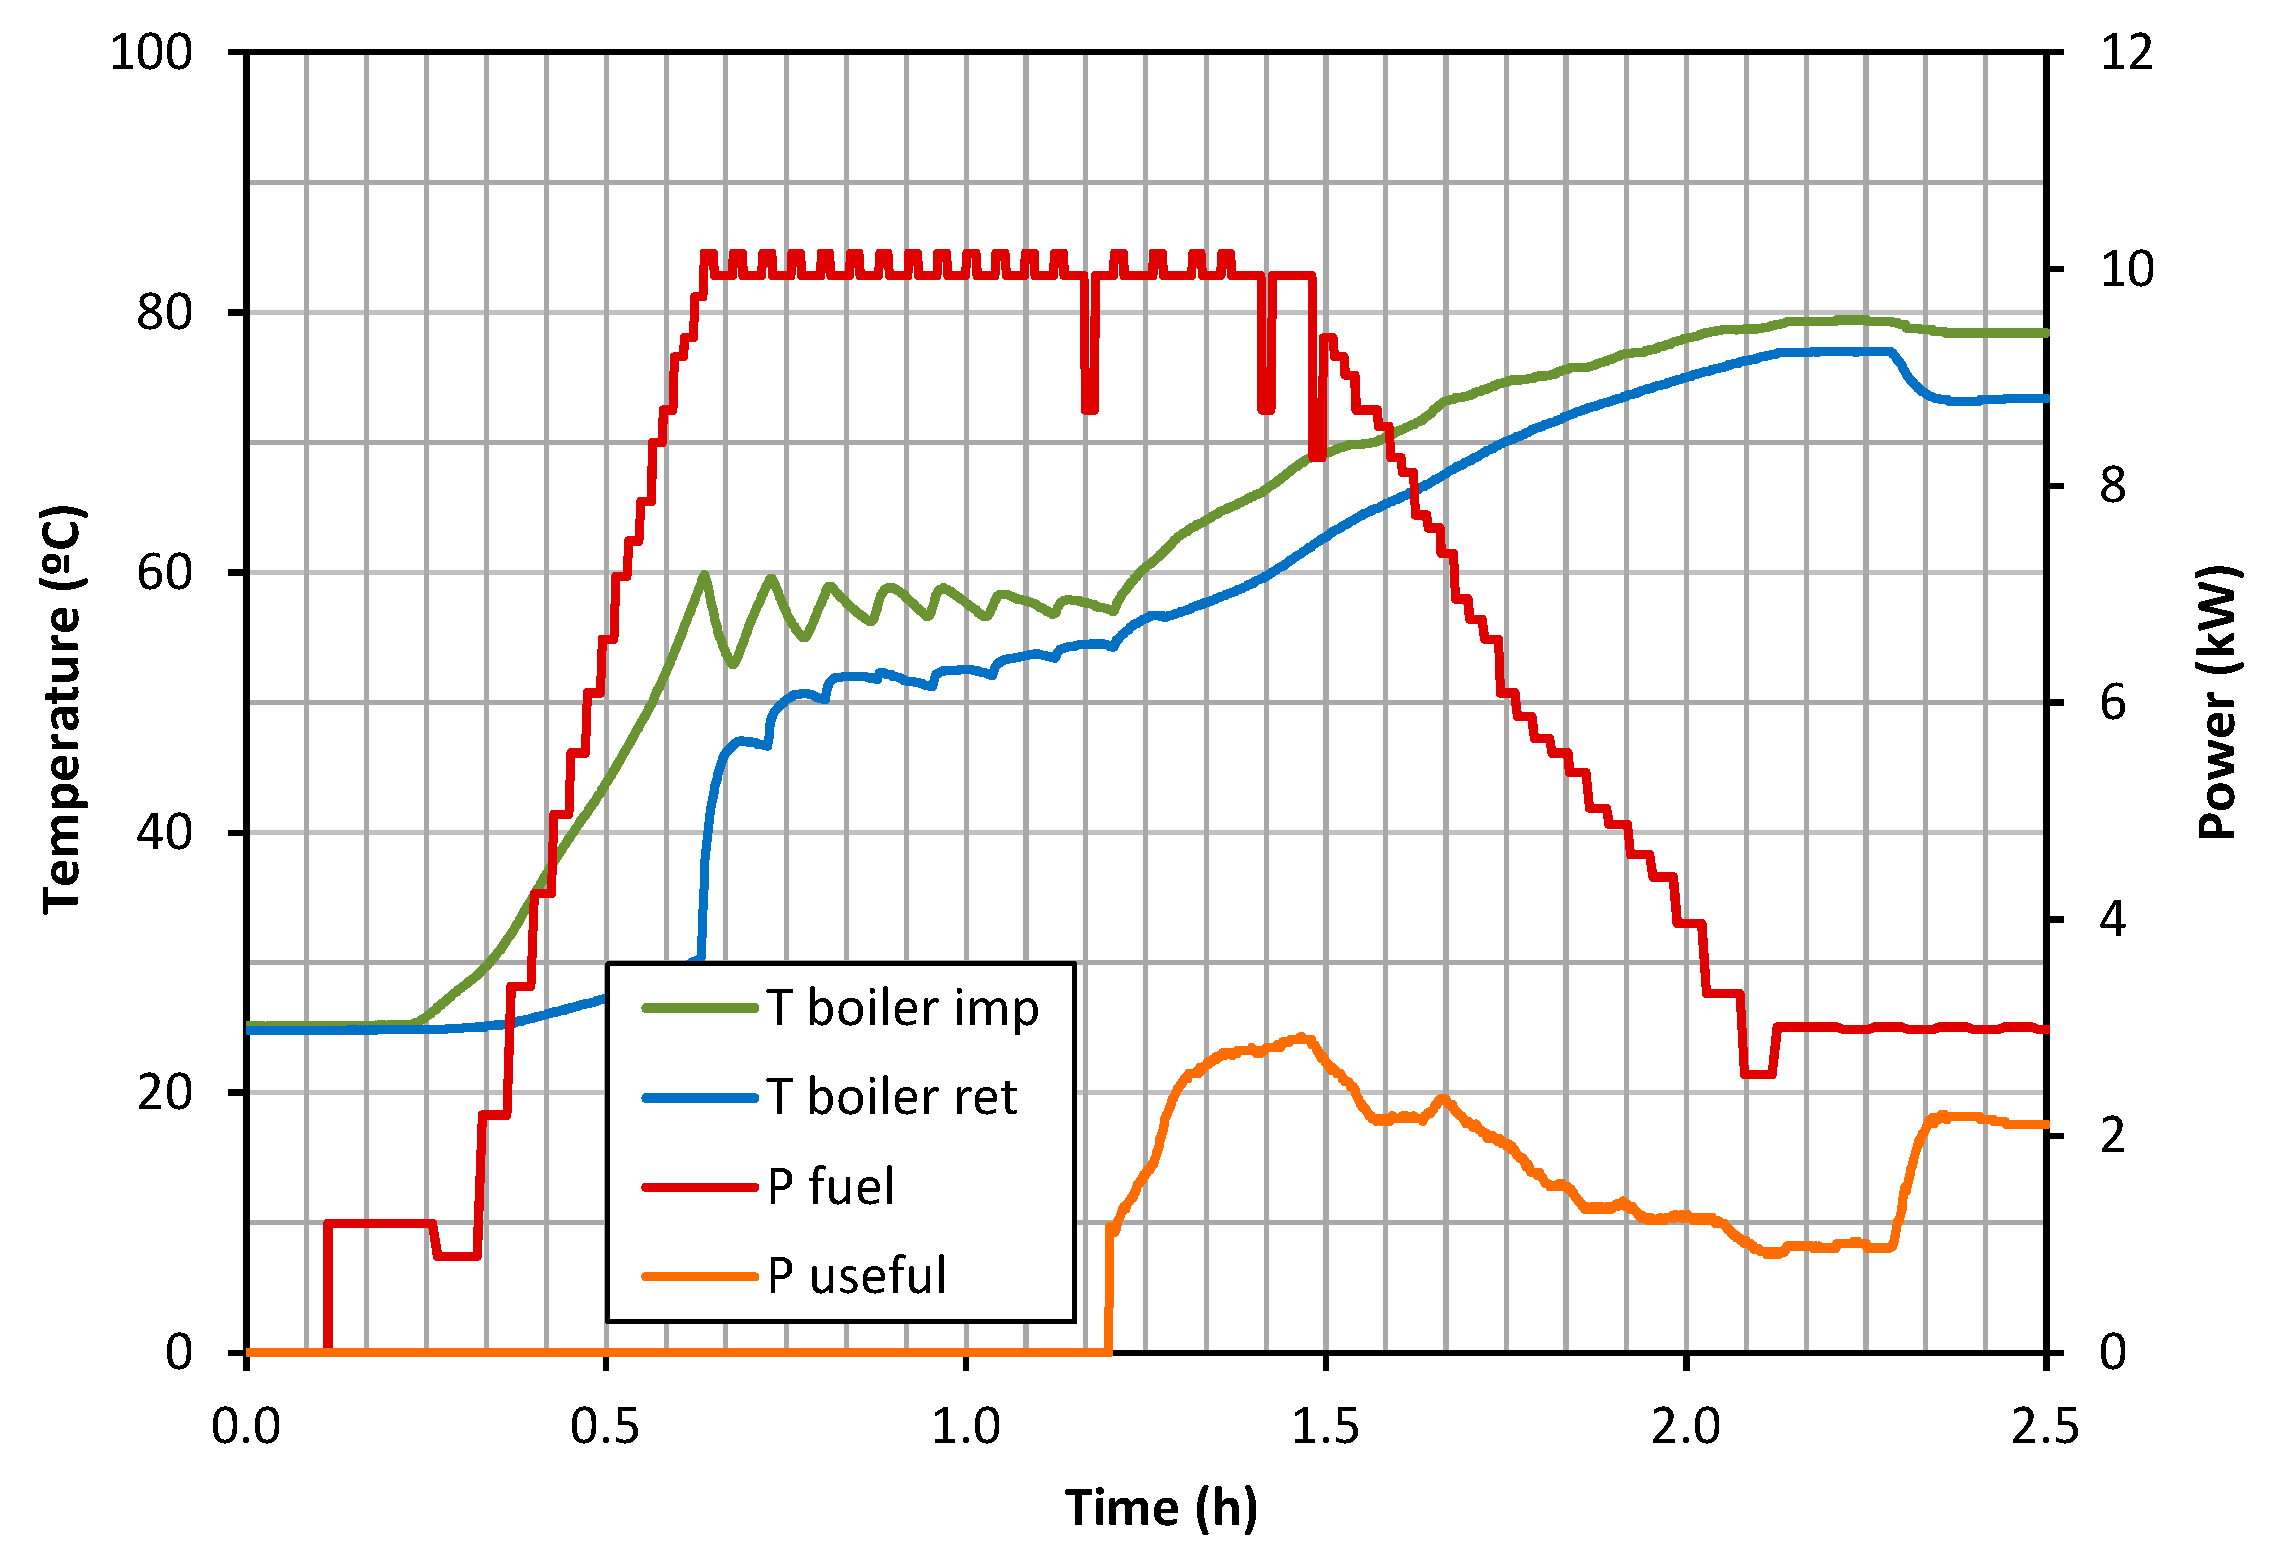
Figure 9 shows the graphic representation of gross power and useful power of the boiler during the combustion test with COM pellets. Once the maximum gross power was reached, the equipment maintained the working regime under the set temperature (80 °C in the inner tank of the boiler) reducing, from then on, the feeding of fuel and the gross power in a gradual way until the end of the test.
Figure 9 also shows the temperature distribution for input and return in the boiler. The useful power depends on the water flow and the difference in temperatures, representing it once the pump maintains a continuous working regime. Thus, the useful power increased up to 6.7 kW (1.46 h). From then on, the useful power decreased following the trend of the curve for the gross power. The peaks in this final stage of the test are due to the regulation and control system of the boiler, with values that are similar to the set temperature. Likewise, the gap between consecutive peaks in the two power curves can be observed. This is due to the thermal inertia of the system. Thus, an increase in pellet feeding (gross power) implies, after a short period, a higher ΔT in water and, therefore, in higher useful power of the boiler.
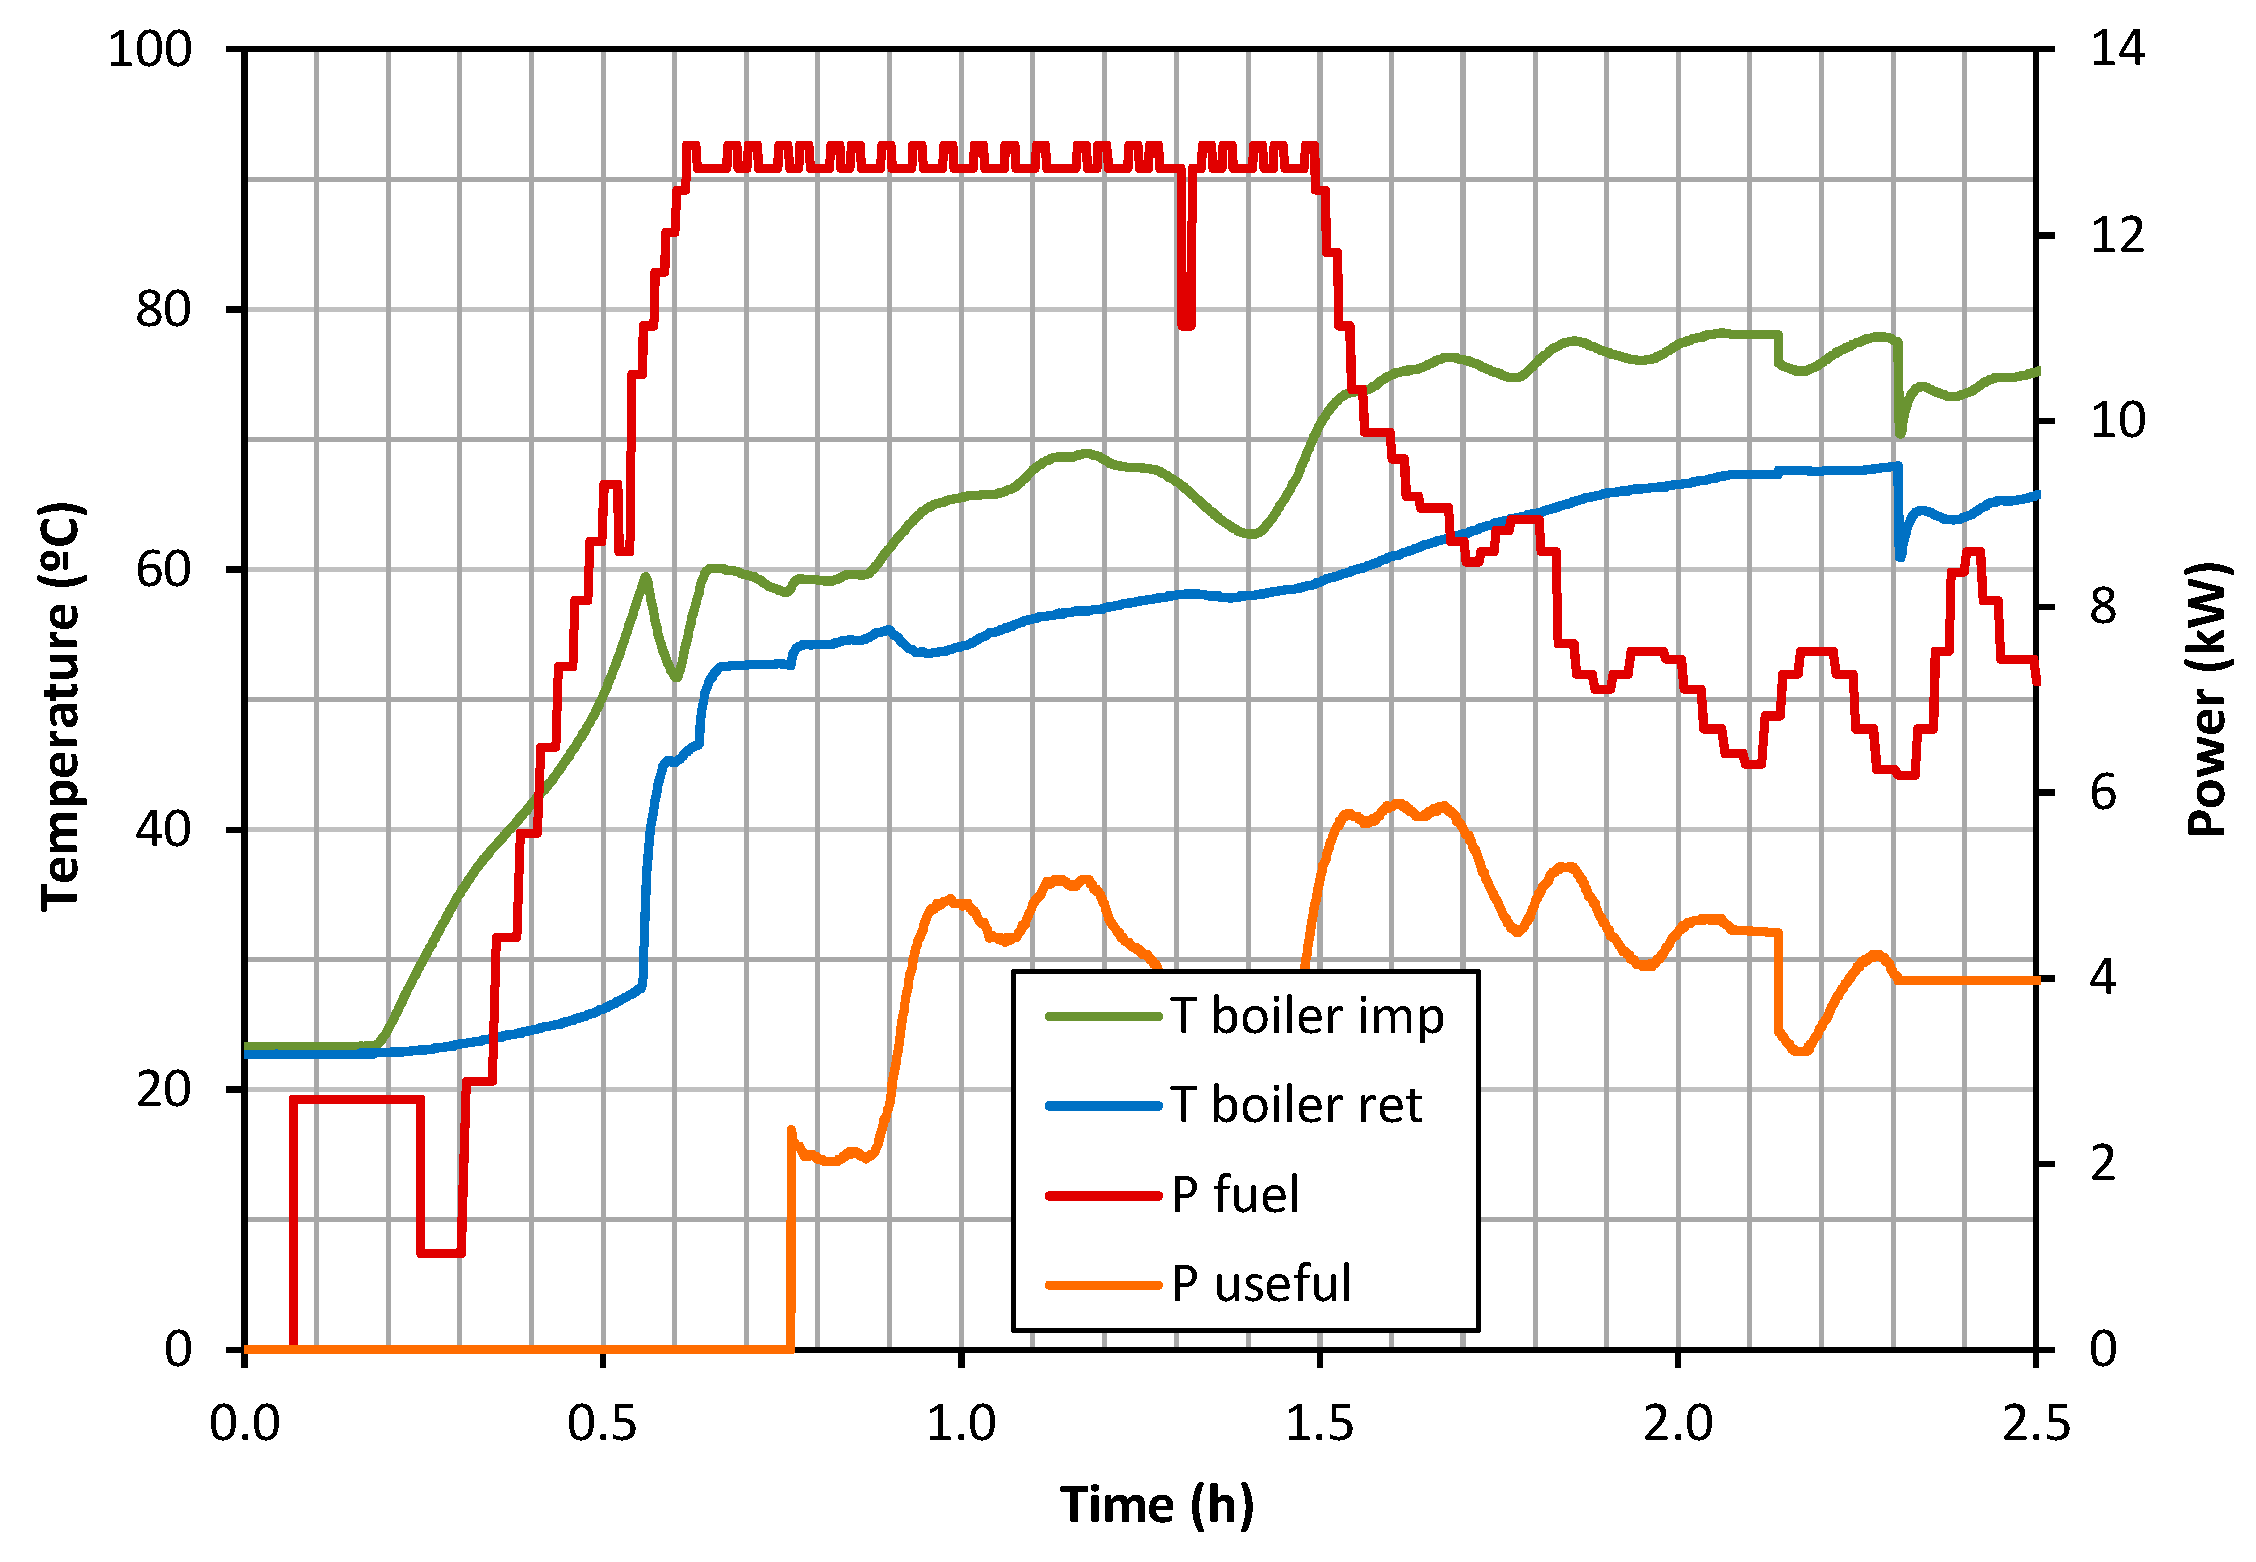
Figure 10 and Figure 11 show the records for water temperature, gross and net power of the boiler during combustion tests for LAB1 and LAB2 pellets. In both cases, and after a central period when the boiler worked at maximum power, the gross power decreased as the water temperature reached the set temperature (80 °C). This decrease was not the same in both cases, which indicates that the inner control of the boiler not only takes into account the water temperature, but also the rate of heating. It can be observed how the decrease in gross power was linear for LAB2 pellets, whereas for COM and LAB1 pellets there were continuous rises and drops during their combustion.
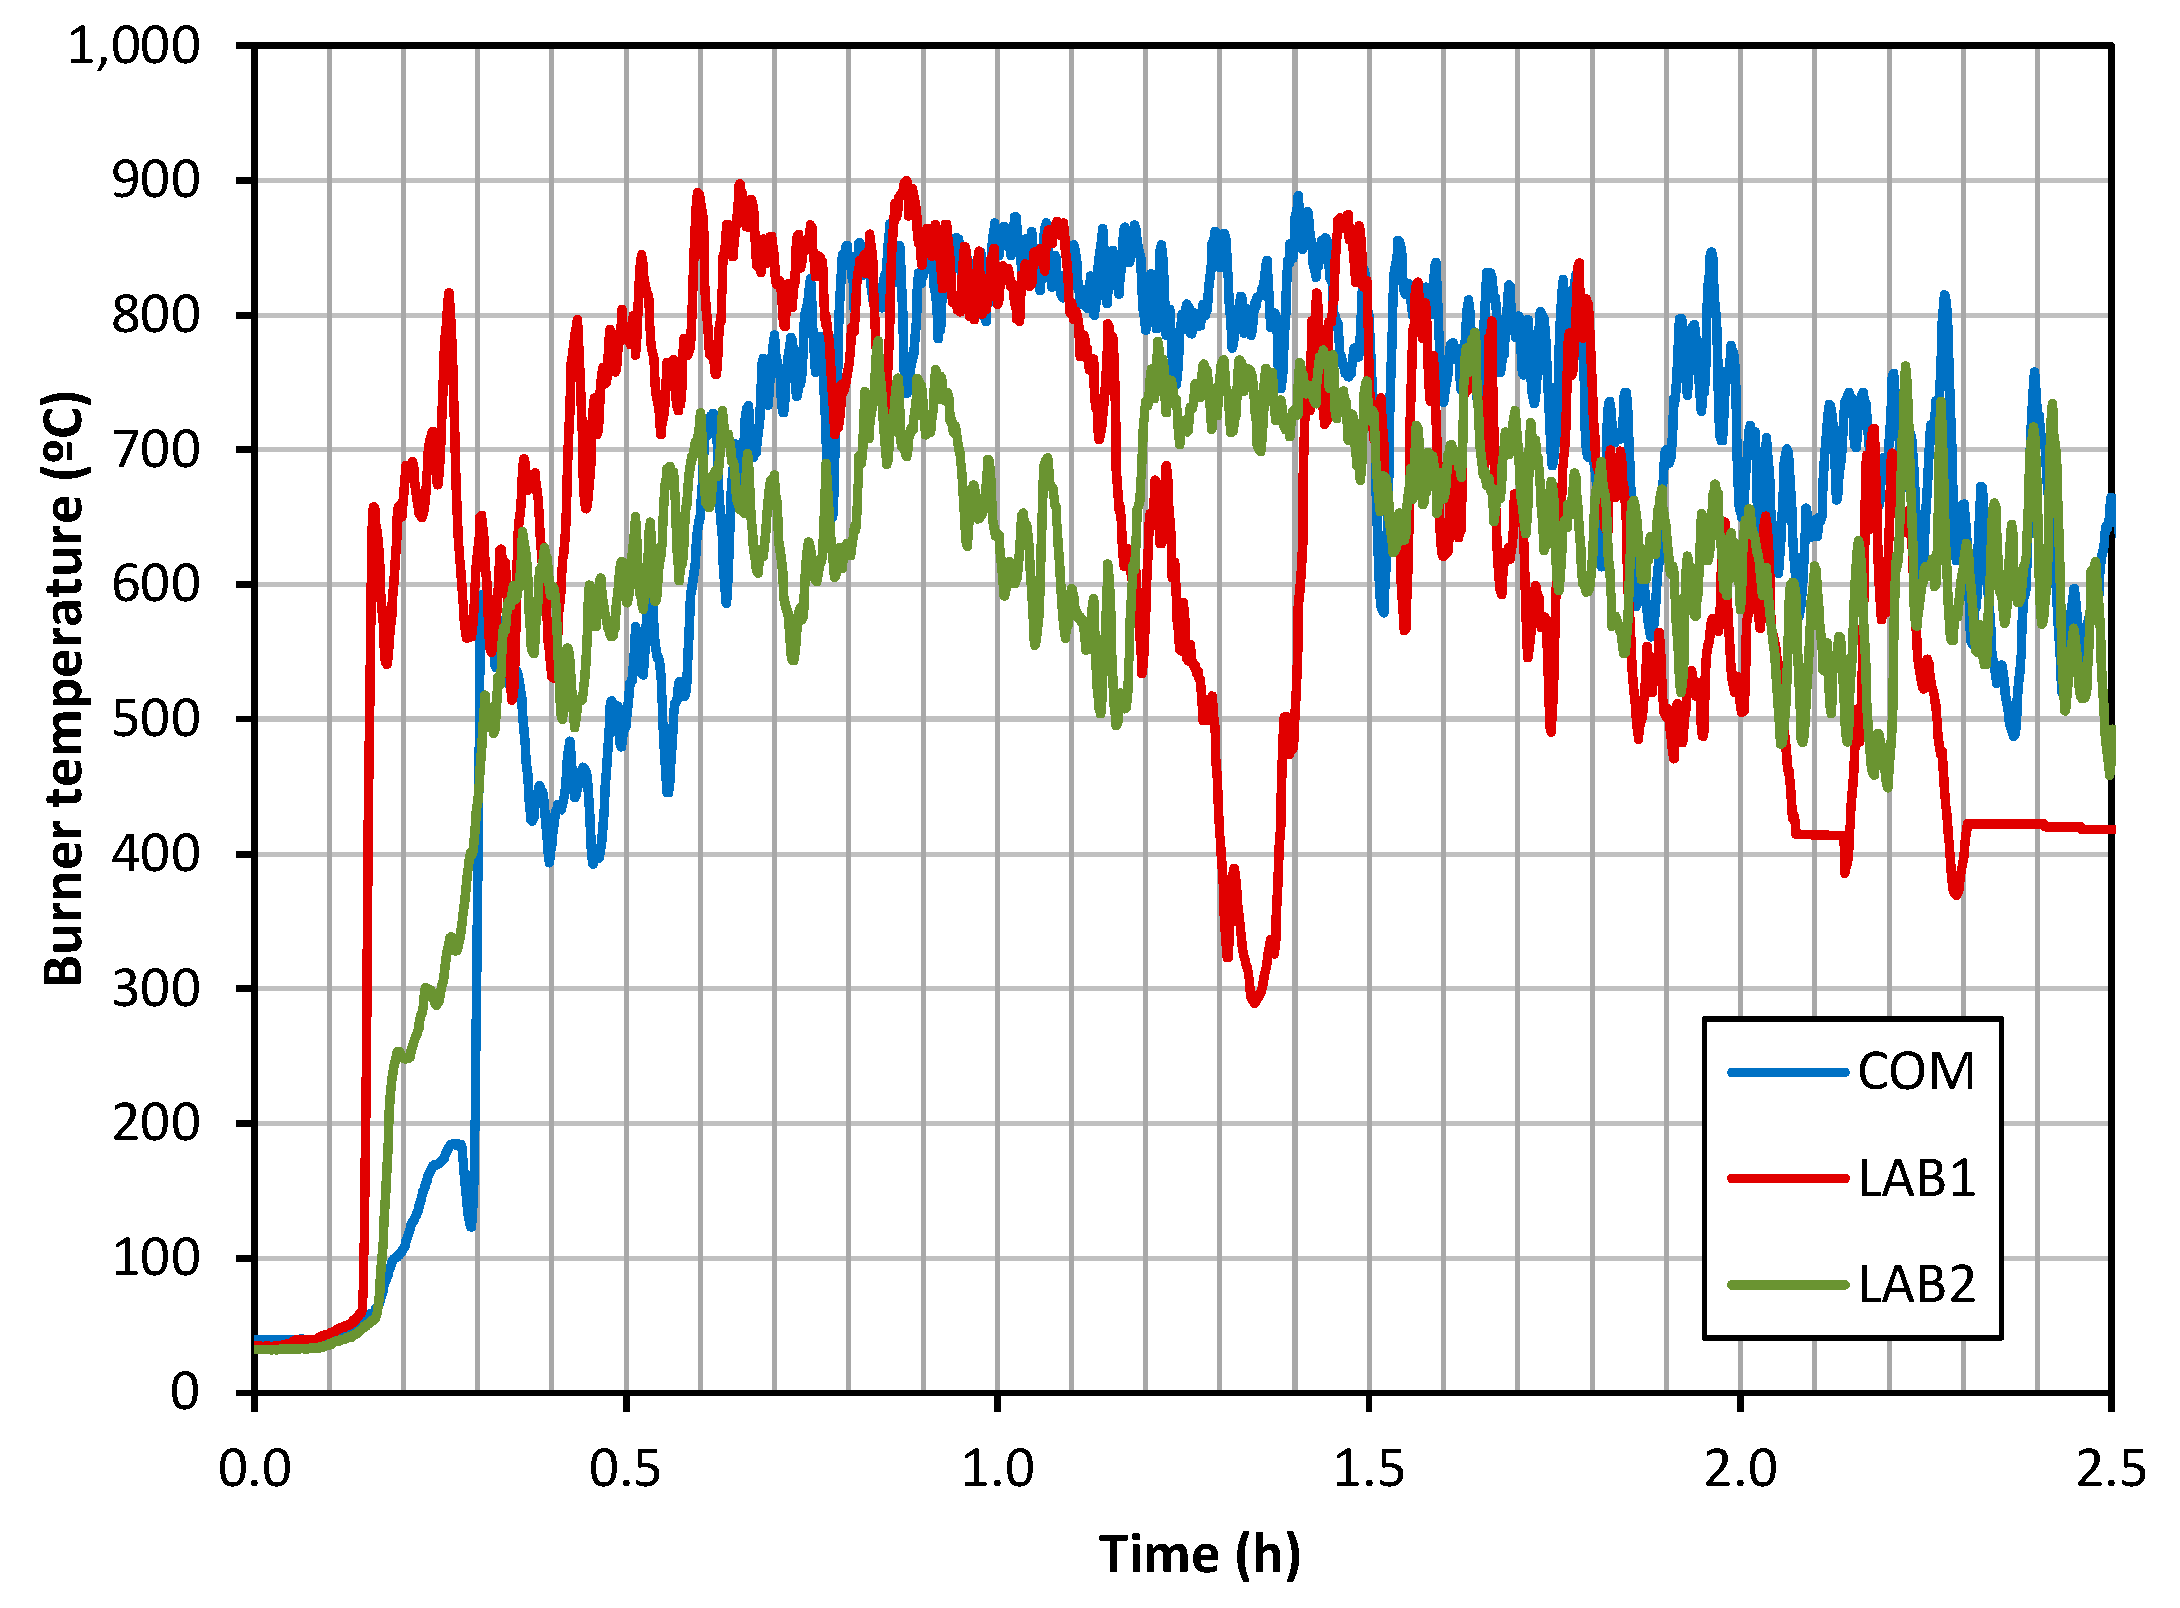
On the other hand, Figure 12 and Figure 13 show the temperature distribution in the flue and inside the burner, respectively. The fume temperature had a trend that was similar to the curves related to gross power (Figure 9, Figure 10 and Figure 11), reaching its maximum when the boiler worked at 100% of its capacity and decreasing when the water temperature was similar to the set temperature.
Moreover, the connection between these curves and the ones shown in Figure 8 was clear. The lowest peaks in the central stage for LAB1 and LAB2 tests (1.4 and 1.2 h, respectively) corresponded to lower temperature values in the burner and higher oxygen concentrations in the flue, which implies an incomplete combustion for these moments.
For further works, this system will be used to study the combustion process of different biofuels. Thus, the work will examine bulk density and heating power in order to obtain a certain useful power. Moreover, the analysis of incomplete combustion gases and the assessment of the performance of the equipment in extreme conditions will be carried out. One of these conditions will be the combustion of pellets with such a high ash level that it forces the frequent operation of the burner cleaning system.
In turn, from the ultimate analysis of the different biofuels and their corresponding stoichiometric chemical reactions, the excess air will be optimized through the adjustment of the fan operation, with the object of achieving higher combustion yields.
4. Conclusions
The most relevant findings in the present work were as follows:
- The implementation of a data acquisition system for the combustion tests in a pellet boiler exceeded expectations. The information was reliable and precise, coinciding with the check readings that were conducted with a thermometer and a combustion gas analyser.
- The system allowed a detailed interpretation of the different variables that were studied, as well as a comparison between different kinds of fuels and working regimes. The previous knowledge about how and when each element works provided a considerable amount of information about the thermic process.
- The system was versatile and accessible, as it allows the integration of new elements that complement the analysis of the combustion process (photo-luminescent cell of the burner, CO2 probes, probes for incomplete combustion emissions, etc.), laying the foundations of further studies about adaptation and modification of conventional equipment in multi-fuel boilers.
- Due to these reasons, this data acquisition system could be a basic tool to research thermic processes with alternative biofuels, with the aim of higher yields for these biomass wastes as renewable energies.
Acknowledgments
We would like to thank the Regional Government of Extremadura for the support to the research group (GR10151).
Author Contributions
Regarding the contribution of each author to the article, the original idea and work coordination are credited to María Teresa Miranda and Irene Montero. The analysis of data was carried out by Francisco José Sepúlveda, José Ignacio Arranz, and Carmen Victoria Rojas. Finally, the wording of the conclusions was made by Francisco José Sepúlveda.
Conflicts of Interest
The authors declare no conflict of interest.
References
- Duca, D.; Riva, G.; Foppa Pedretti, E.; Toscano, G. Wood pellet quality with respect to EN 14961–2 standard and certifications. Fuel 2014, 135, 9–14. [Google Scholar] [CrossRef]
- Food and Agriculture Organization of the United Nations. 2015 Global Forest Products Facts and Figures. (FAO). Available online: http://www.fao.org/3/a-i6669e.pdf (accessed on December 2016).
- Solid biofuels. In Fuel Specifications and Classes; UNE-EN 14961:2012; Spanish Association for Standardisation and Certification (AENOR): Madrid, Spain, 2012.
- Solid biofuels. In Fuel Specifications and Classes; UNE-EN ISO 17225:2014; Spanish Association for Standardisation and Certification (AENOR): Madrid, Spain, 2014.
- Míguez, J.L.; Morán, J.C.; Granada, E.; Porteiro, J. Review of technology in small-scale biomass combustion systems in the European market. Renew.Sustain. Energy Rev. 2012, 16, 3867–3875. [Google Scholar] [CrossRef]
- Stelte, W.; Holm, J.K.; Sanadi, A.R.; Barsberg, S.; Ahrenfeldt, J.; Henriksen, U.B. A study of bonding and failure mechanisms in fuel pellets from different biomass resources. Biomass Bioenergy 2011, 35, 910–918. [Google Scholar] [CrossRef]
- Nielsen, N.P.K.; Gardner, D.J.; Poulsen, T.; Felby, C. Importance of temperature, moisture content, and species for the conversion process of wood into fuel pellets. Wood Fiber Sci. 2009, 41, 414–425. [Google Scholar]
- Nielsen, N.P.K.; Holm, J.K.; Felby, C. Effect of fiber orientation on compression and frictional properties of sawdust particles in fuel pellet production. Energy Fuels 2009, 23, 3211–3216. [Google Scholar] [CrossRef]
- Serrano, C.; Monedero, E.; Lapuerta, M.; Portero, H. Effect of moisture content, particle size and pine addition on quality parameters of barley straw pellets. Fuel Process. Technol. 2011, 92, 699–706. [Google Scholar] [CrossRef]
- Nunes, L.J.R.; Matias, J.C.O.; Catalão, J.P.S. Energy recovery from cork industrial waste: Production and characterisation of cork pellets. Fuel 2013, 113, 24–30. [Google Scholar] [CrossRef]
- Zamorano, M.; Popov, V.; Rodríguez, M.L.; García-Maraver, A. A comparative study of quality properties of pelletized agricultural and forestry lopping residues. Renew. Energy 2011, 26, 3133–3140. [Google Scholar] [CrossRef]
- García-Maraver, A.; Popov, V.; Zamorano, M. A review of European standards for pellet quality. Renew. Energy 2011, 36, 3537–3540. [Google Scholar] [CrossRef]
- Liu, H.; Chaney, J.; Li, J.; Sun, C. Control of NOx emissions of a domestic/small-scale biomass pellet boiler by air staging. Fuel 2013, 103, 792–798. [Google Scholar] [CrossRef]
- Miranda, M.T.; Arranz, J.I.; Montero, I.; Román, S.; Rojas, C.V.; Nogales, S. Characterization and combustion of olive pomace and forest residue pellets. Fuel Process. Technol. 2012, 103, 91–96. [Google Scholar] [CrossRef]
- Rabaçal, M.; Fernandes, U.; Costa, M. Combustion and emission characteristics of a domestic boiler fired with pellets of pine, industrial wood wastes and peach stones. Renew. Energy 2013, 51, 220–226. [Google Scholar] [CrossRef]
- Arranz, J.I.; Miranda, M.T.; Montero, I.; Sepúlveda, F.J.; Rojas, C.V. Characterization and combustion behaviour of commercial and experimental wood pellets in South West Europe. Fuel 2015, 142, 199–207. [Google Scholar] [CrossRef]
- Lajili, M.; Jeguirim, M.; Kraiem, N.; Limousy, L. Performance of a household boiler fed with agropellets blended from olive mill solid waste and pine sawdust. Fuel 2015, 153, 431–436. [Google Scholar] [CrossRef]
- Dias, J.; Costa, M.; Azevedo, J.L.T. Test of a small domestic boiler using different pellets. Biomass Bionergy 2004, 27, 531–539. [Google Scholar] [CrossRef]
- Mediavilla, I.; Fernández, M.J.; Esteban, L.S. Optimization of pelletisation and combustion in a boiler of 17.5 kWth for vine shoots and industrial cork residue. Fuel Process. Technol. 2009, 90, 621–628. [Google Scholar] [CrossRef]
- Verma, V.K.; Bram, S.; Gauthier, G.; De Ruyck, J. Evaluation of the performance of a multi-fuel domestic boiler with respect to the existing European standard and quality labels: Part-1. Biomass Bioenergy 2011, 35, 80–89. [Google Scholar] [CrossRef]
- Verma, V.K.; Bram, S.; Gauthier, G.; De Ruyck, J. Performance of a domestic pellet boiler as a function of operational loads: Part-2. Bioenergy 2011, 35, 272–279. [Google Scholar] [CrossRef]
- Moya, R.; Rodríguez-Zúñiga, A.; Tenorio, C.; Valdez, J.; Valaert, J. Pellets evaluation made from tropical-climate agricultural and forestry crops of Costa Rica with a domestic stove. Waste Biomass Valorization 2015, 6, 1037–1046. [Google Scholar] [CrossRef]
- Carvalho, L.; Wopienka, E.; Pointner, C.; Lundgren, J.; Verma, V.K.; Haslinger, W.; Schmidl, C. Performance of a pellet boiler fired with agricultural fuels. Appl. Energy 2013, 104, 286–296. [Google Scholar] [CrossRef]
- Carroll, J.; Finnan, J. Emissions and efficiencies from the combustion of agricultural feedstock pellets using a small scale tilting grate boiler. Biosyst. Eng. 2013, 115, 50–55. [Google Scholar] [CrossRef]
- Kang, S.B.; Kim, J.J.; Choi, K.S.; Sim, B.S.; Oh, H.Y. Development of a test facility to evaluate performance of a domestic wood pellet boiler. Renew. Energy 2013, 54, 2–7. [Google Scholar] [CrossRef]
- Schönnenbeck, C.; Trouvé, G.; Valente, M.; Garra, P.; Brilhac, J.F. Combustion tests of grape marc in a multi-fuel domestic boiler. Fuel 2016, 180, 324–331. [Google Scholar] [CrossRef]
- Heating boilers. Part 5: Heating boilers for solid fuels, manually and automatically stoked, nominal heat output of up to 500 kW. In Terminology, Requirements, Testing and Marking; UNE-EN 303–5:2013; Spanish Association for Standardisation and Certification (AENOR): Madrid, Spain, 2013.
- A study by BSRIA. Available online: http://www.knx.org (accessed on December 2016).
- Van Loo, S.; Koppejan, J. Handbook of Biomass Combustion and Cofiring, 1st ed.; Twente University Press: Enschede, The Netherlands, 2003. [Google Scholar]
- Solid biofuels. Part 2: Total moisture. Simplified method. In Determination of Moisture Content. OVEN Dry Method; UNE-EN ISO 18134–2:2016; Spanish Association for Standardisation and Certification (AENOR): Madrid, Spain, 2016.
- Solid biofuels. In Determination of Bulk Density; UNE-EN ISO 17828:2016; Spanish Association for Standardisation and Certification (AENOR): Madrid, Spain, 2016.
- Solid biofuels. In Determination of Total Content of Carbon, Hydrogen and Nitrogen; UNE-EN ISO 16948:2015; Spanish Association for Standardisation and Certification (AENOR): Madrid, Spain, 2015.
- Solid biofuels. In Determination of Total Content of Sulfur and Chlorine; UNE-EN ISO 16994:2015; Spanish Association for Standardisation and Certification (AENOR): Madrid, Spain, 2011.
- Solid biofuels. In Determination of the Content of Volatile Matter; UNE-EN ISO 18123:2016; Spanish Association for Standardisation and Certification (AENOR): Madrid, Spain, 2016.
- Solid biofuels. In Determination of Ash Content; UNE-EN ISO 18122:2016; Spanish Association for Standardisation and Certification (AENOR): Madrid, Spain, 2016.
- Solid biofuels. In Determination of Calorific Value; UNE-EN 14918:2011; Spanish Association for Standardisation and Certification (AENOR): Madrid, Spain, 2011.
- Part 1: Pellets. In Determination of Mechanical Durability of Pellets and Briquettes; UNE-EN ISO 17831–1:2016; Spanish Association for Standardisation and Certification (AENOR): Madrid, Spain, 2016.
- Limousy, L.; Jeguirim, M.; Dutournié, P.; Kraiem, N.; Lajili, M.; Said, R. Gaseous products and particulate matter emissions of biomass residential boiler fired with spent coffee grounds pellets. Fuel 2013, 107, 323–329. [Google Scholar] [CrossRef]
- García-Maraver, A.; Zamorano, M.; Fernandes, U.; Rabaçal, M.; Costa, M. Relationship between fuel quality and gaseous and particulate matter emissions in a domestic pellet-fired boiler. Fuel 2014, 119, 141–152. [Google Scholar] [CrossRef]
Figure 1.
Schematic layout of the plant.
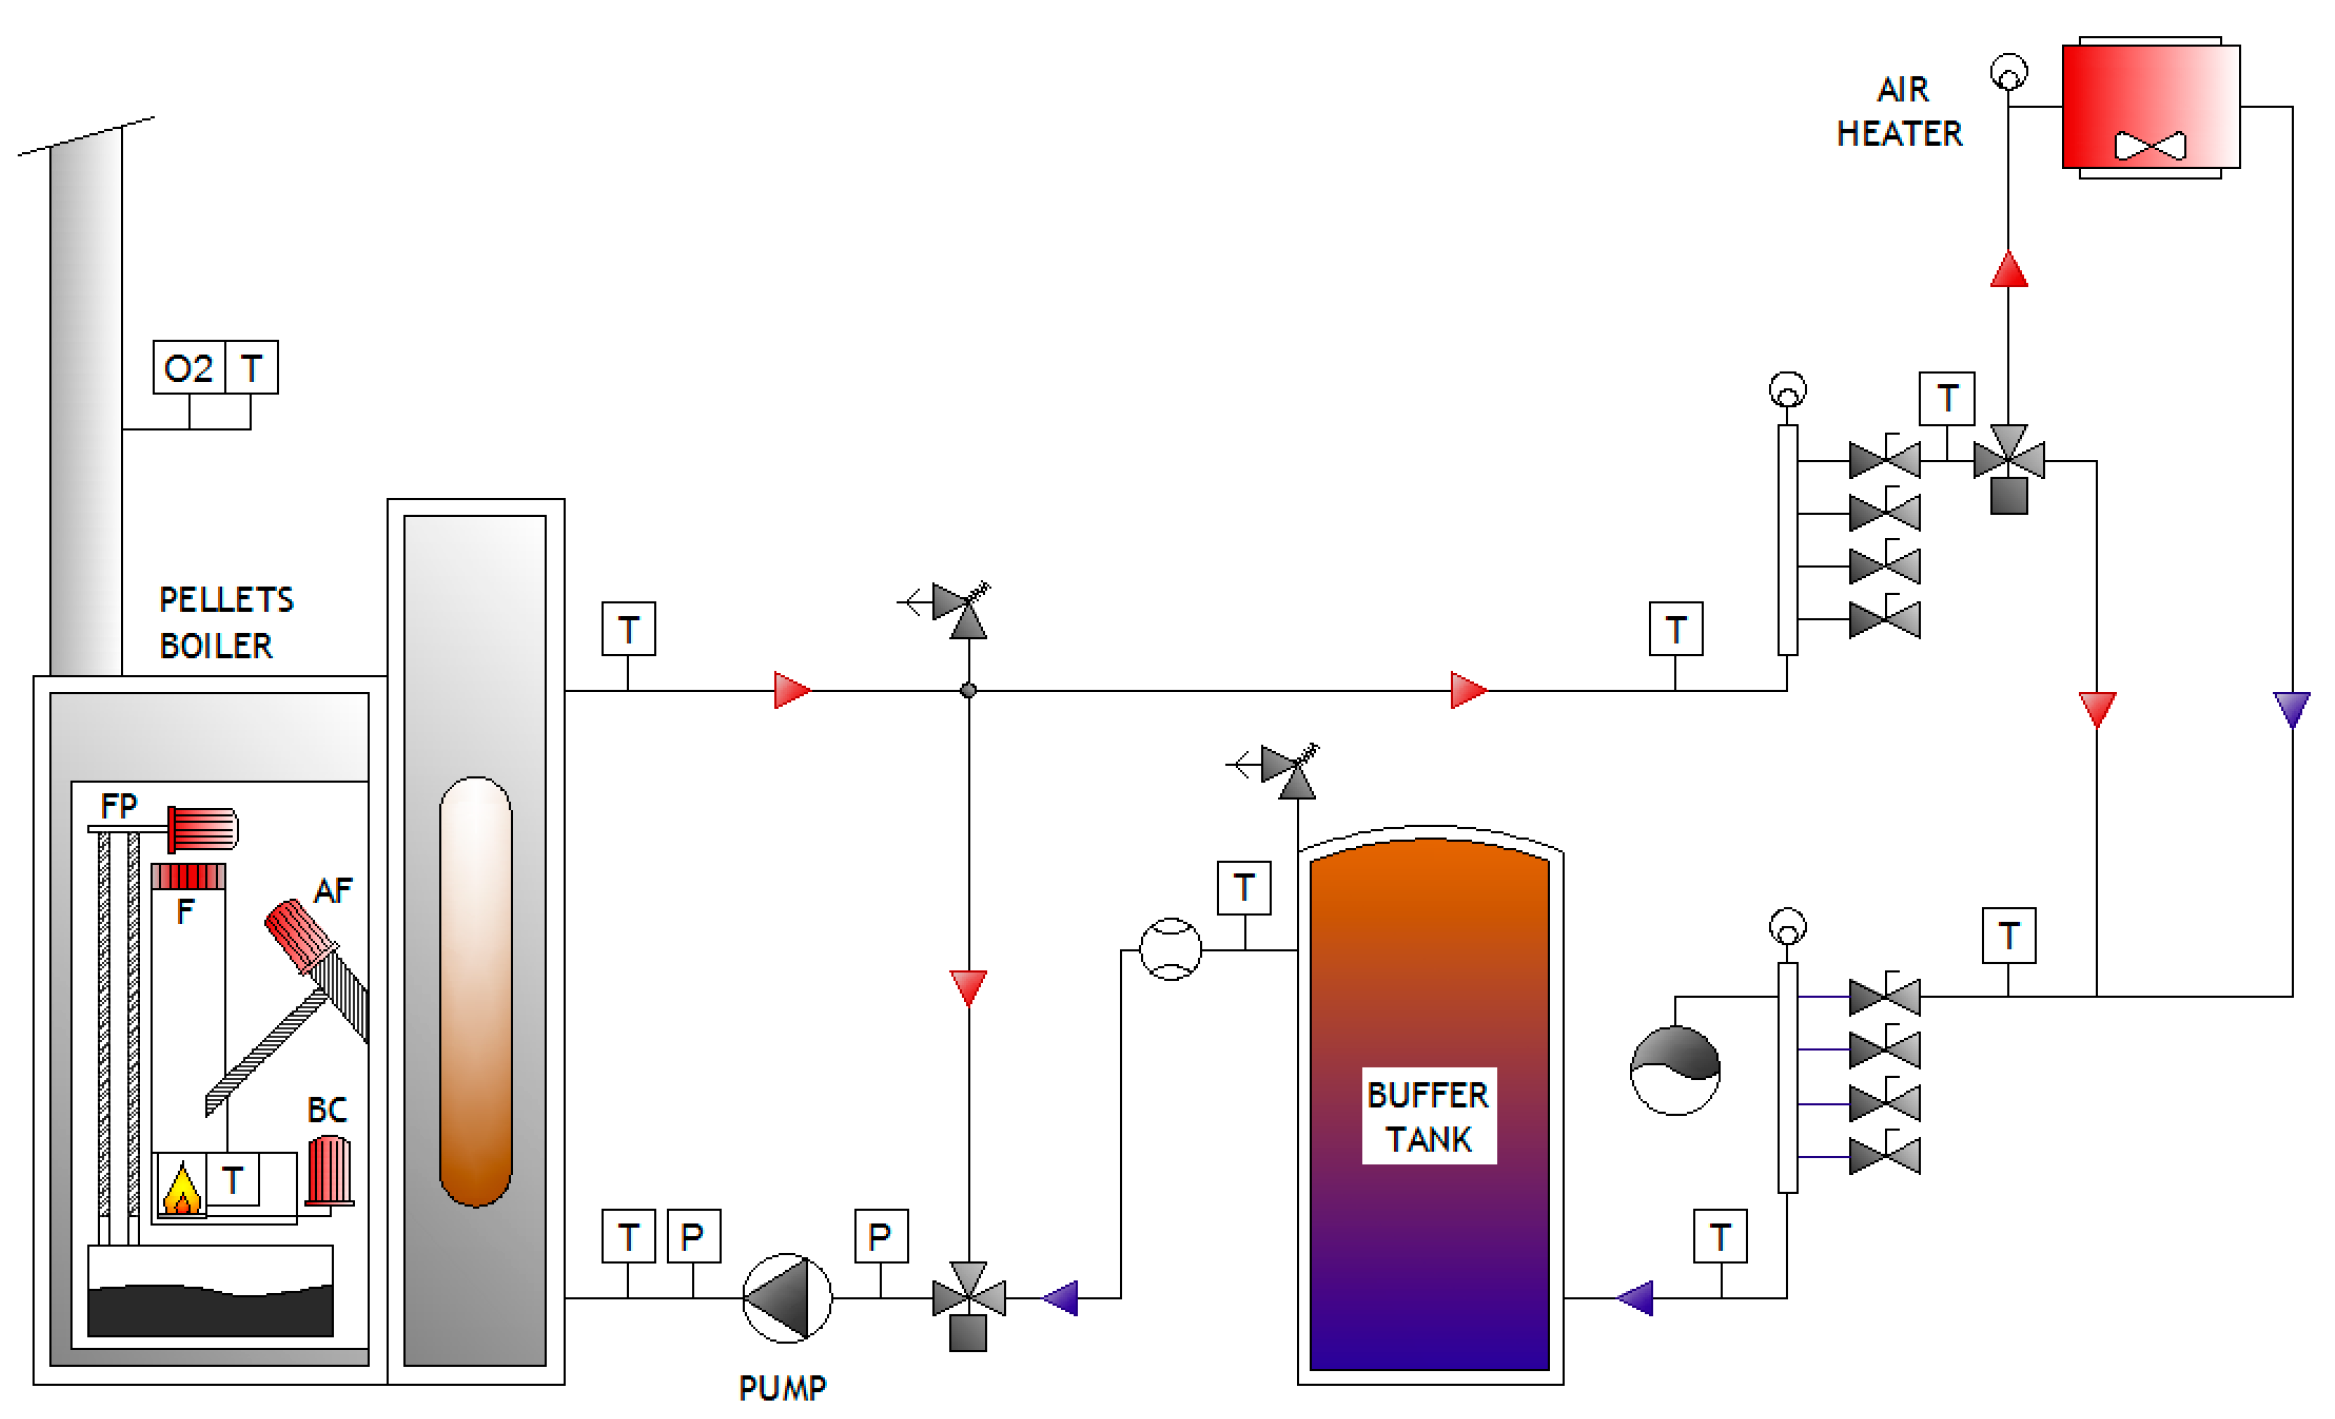
Figure 2.
Boiler operation elements during combustion test of COM pellets. (a) Auger feeder; (b) pump; (c) burner cleaning system; and (d) fume pass cleaning system.
Figure 2.
Boiler operation elements during combustion test of COM pellets. (a) Auger feeder; (b) pump; (c) burner cleaning system; and (d) fume pass cleaning system.
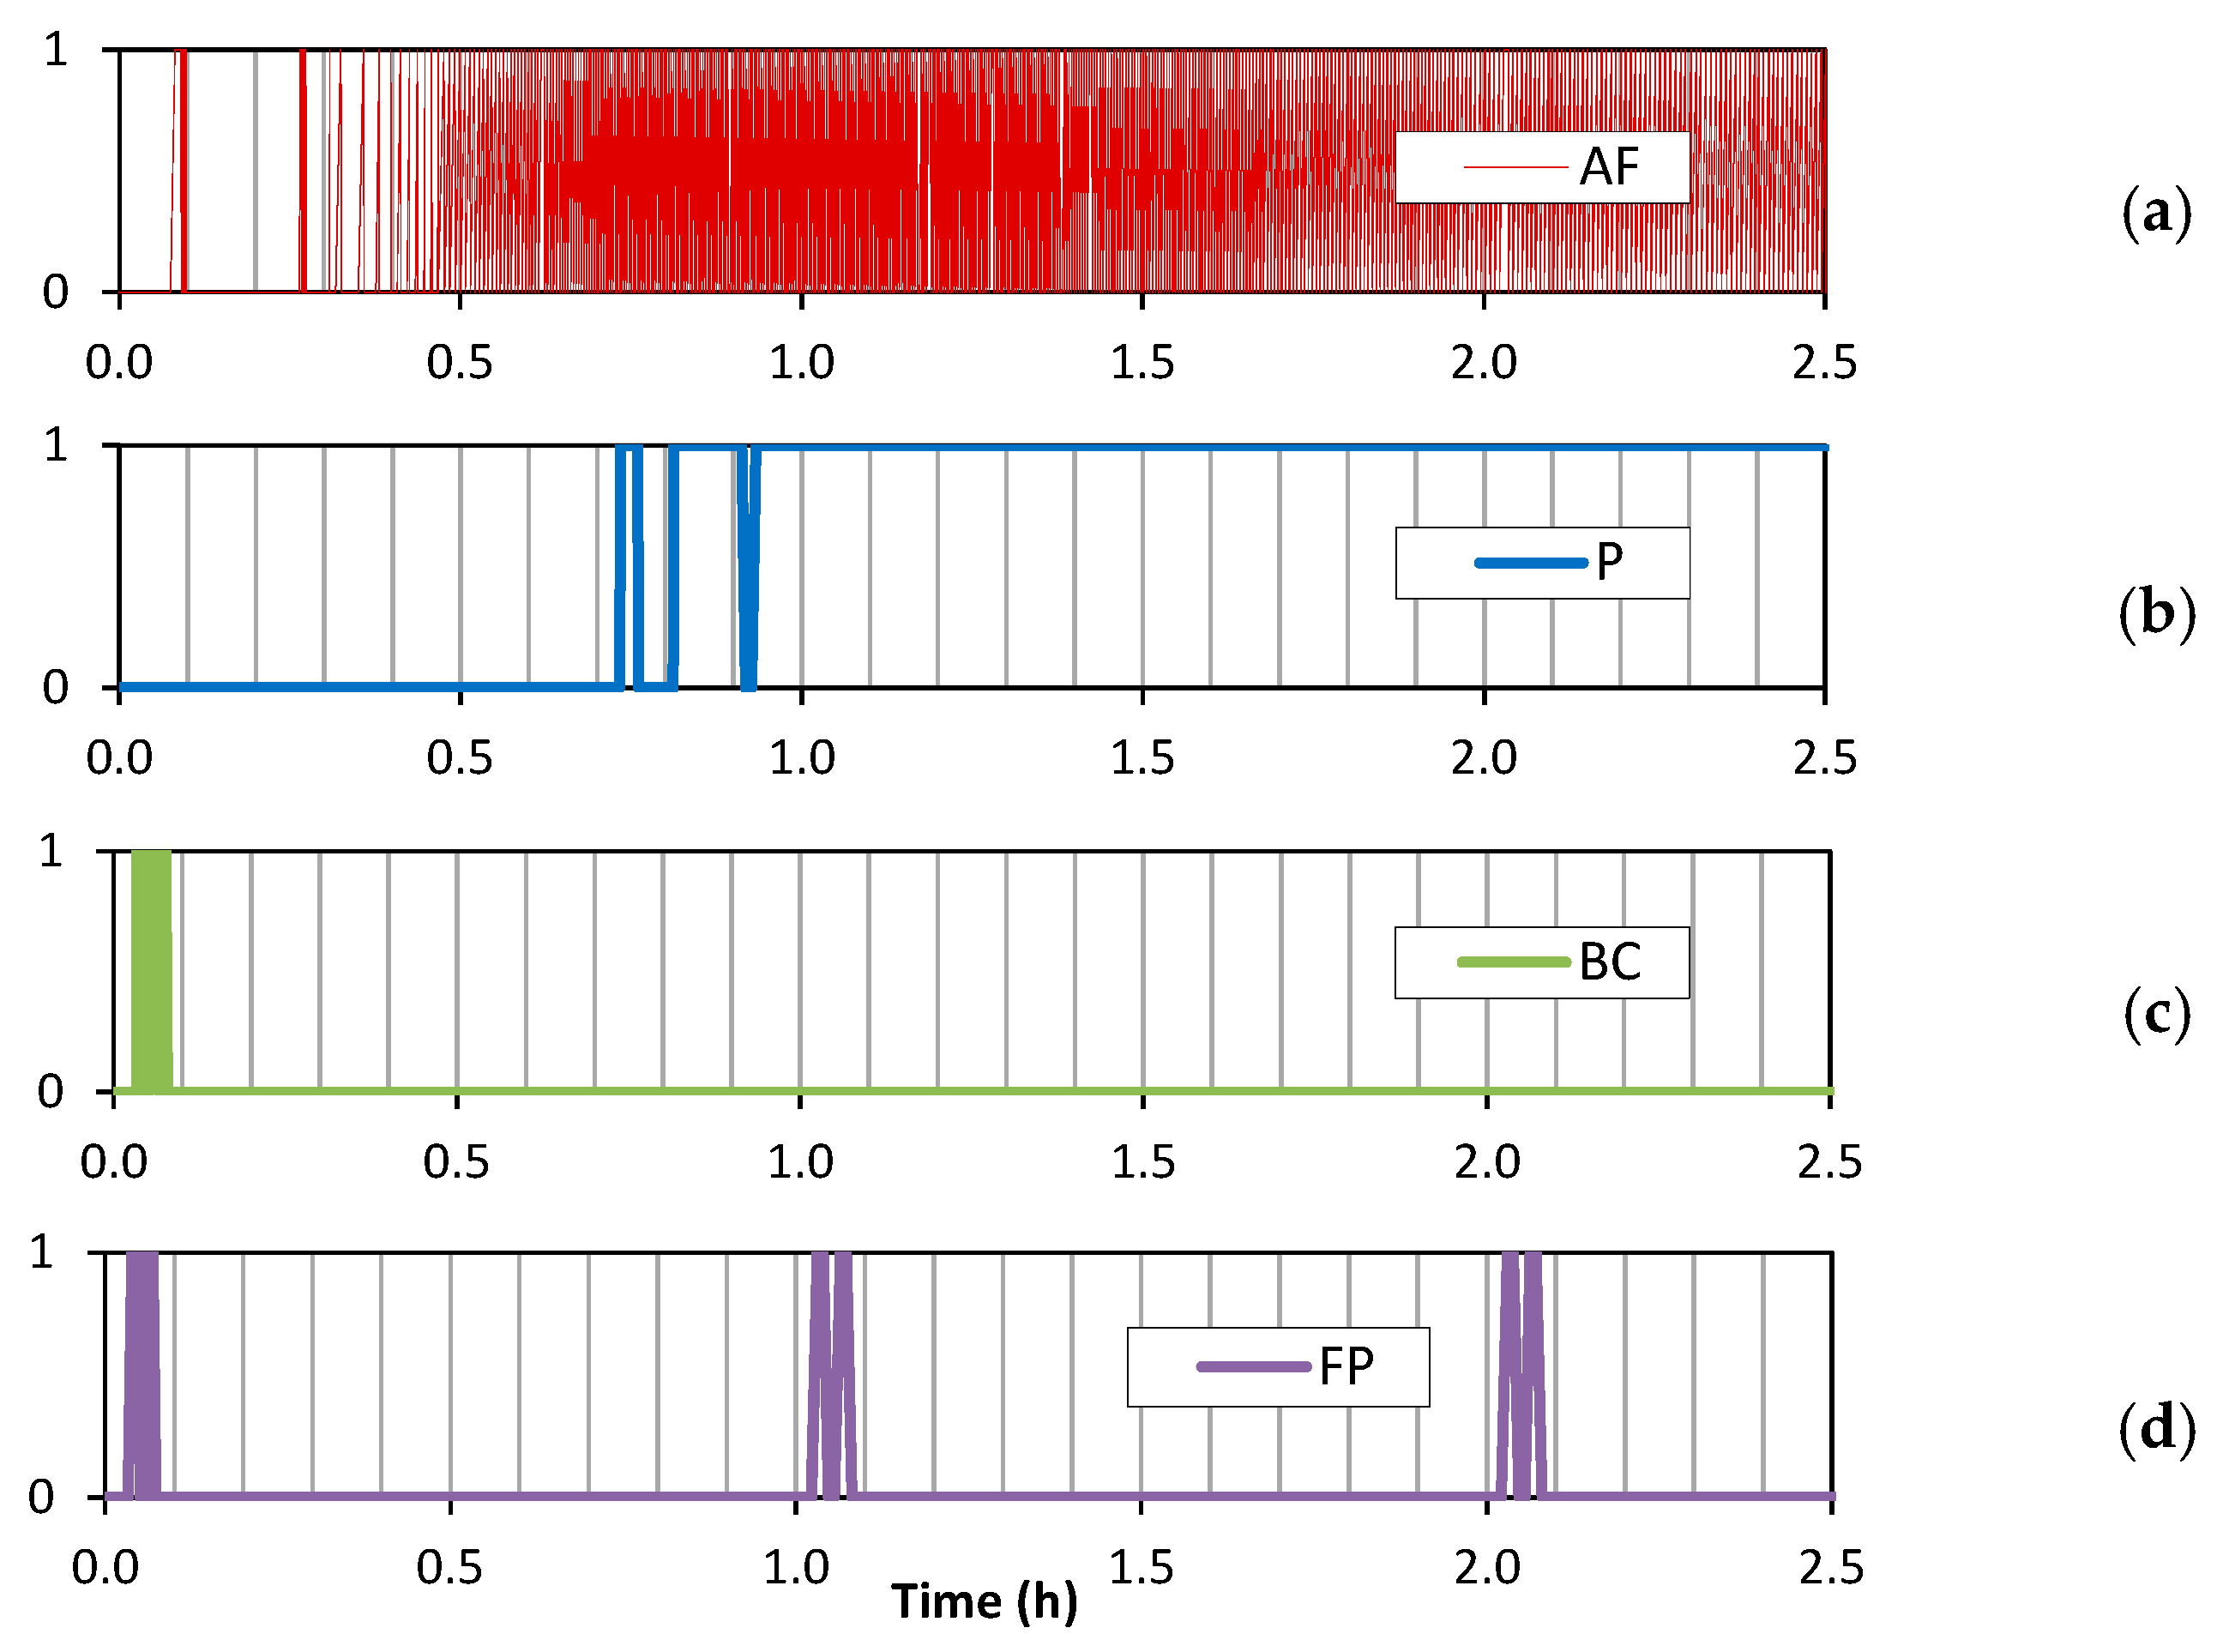
Figure 3.
Performance of the elements of the boiler during the combustion test for LAB2 pellets.

Figure 4.
Performance of the auger feeder during combustion tests.
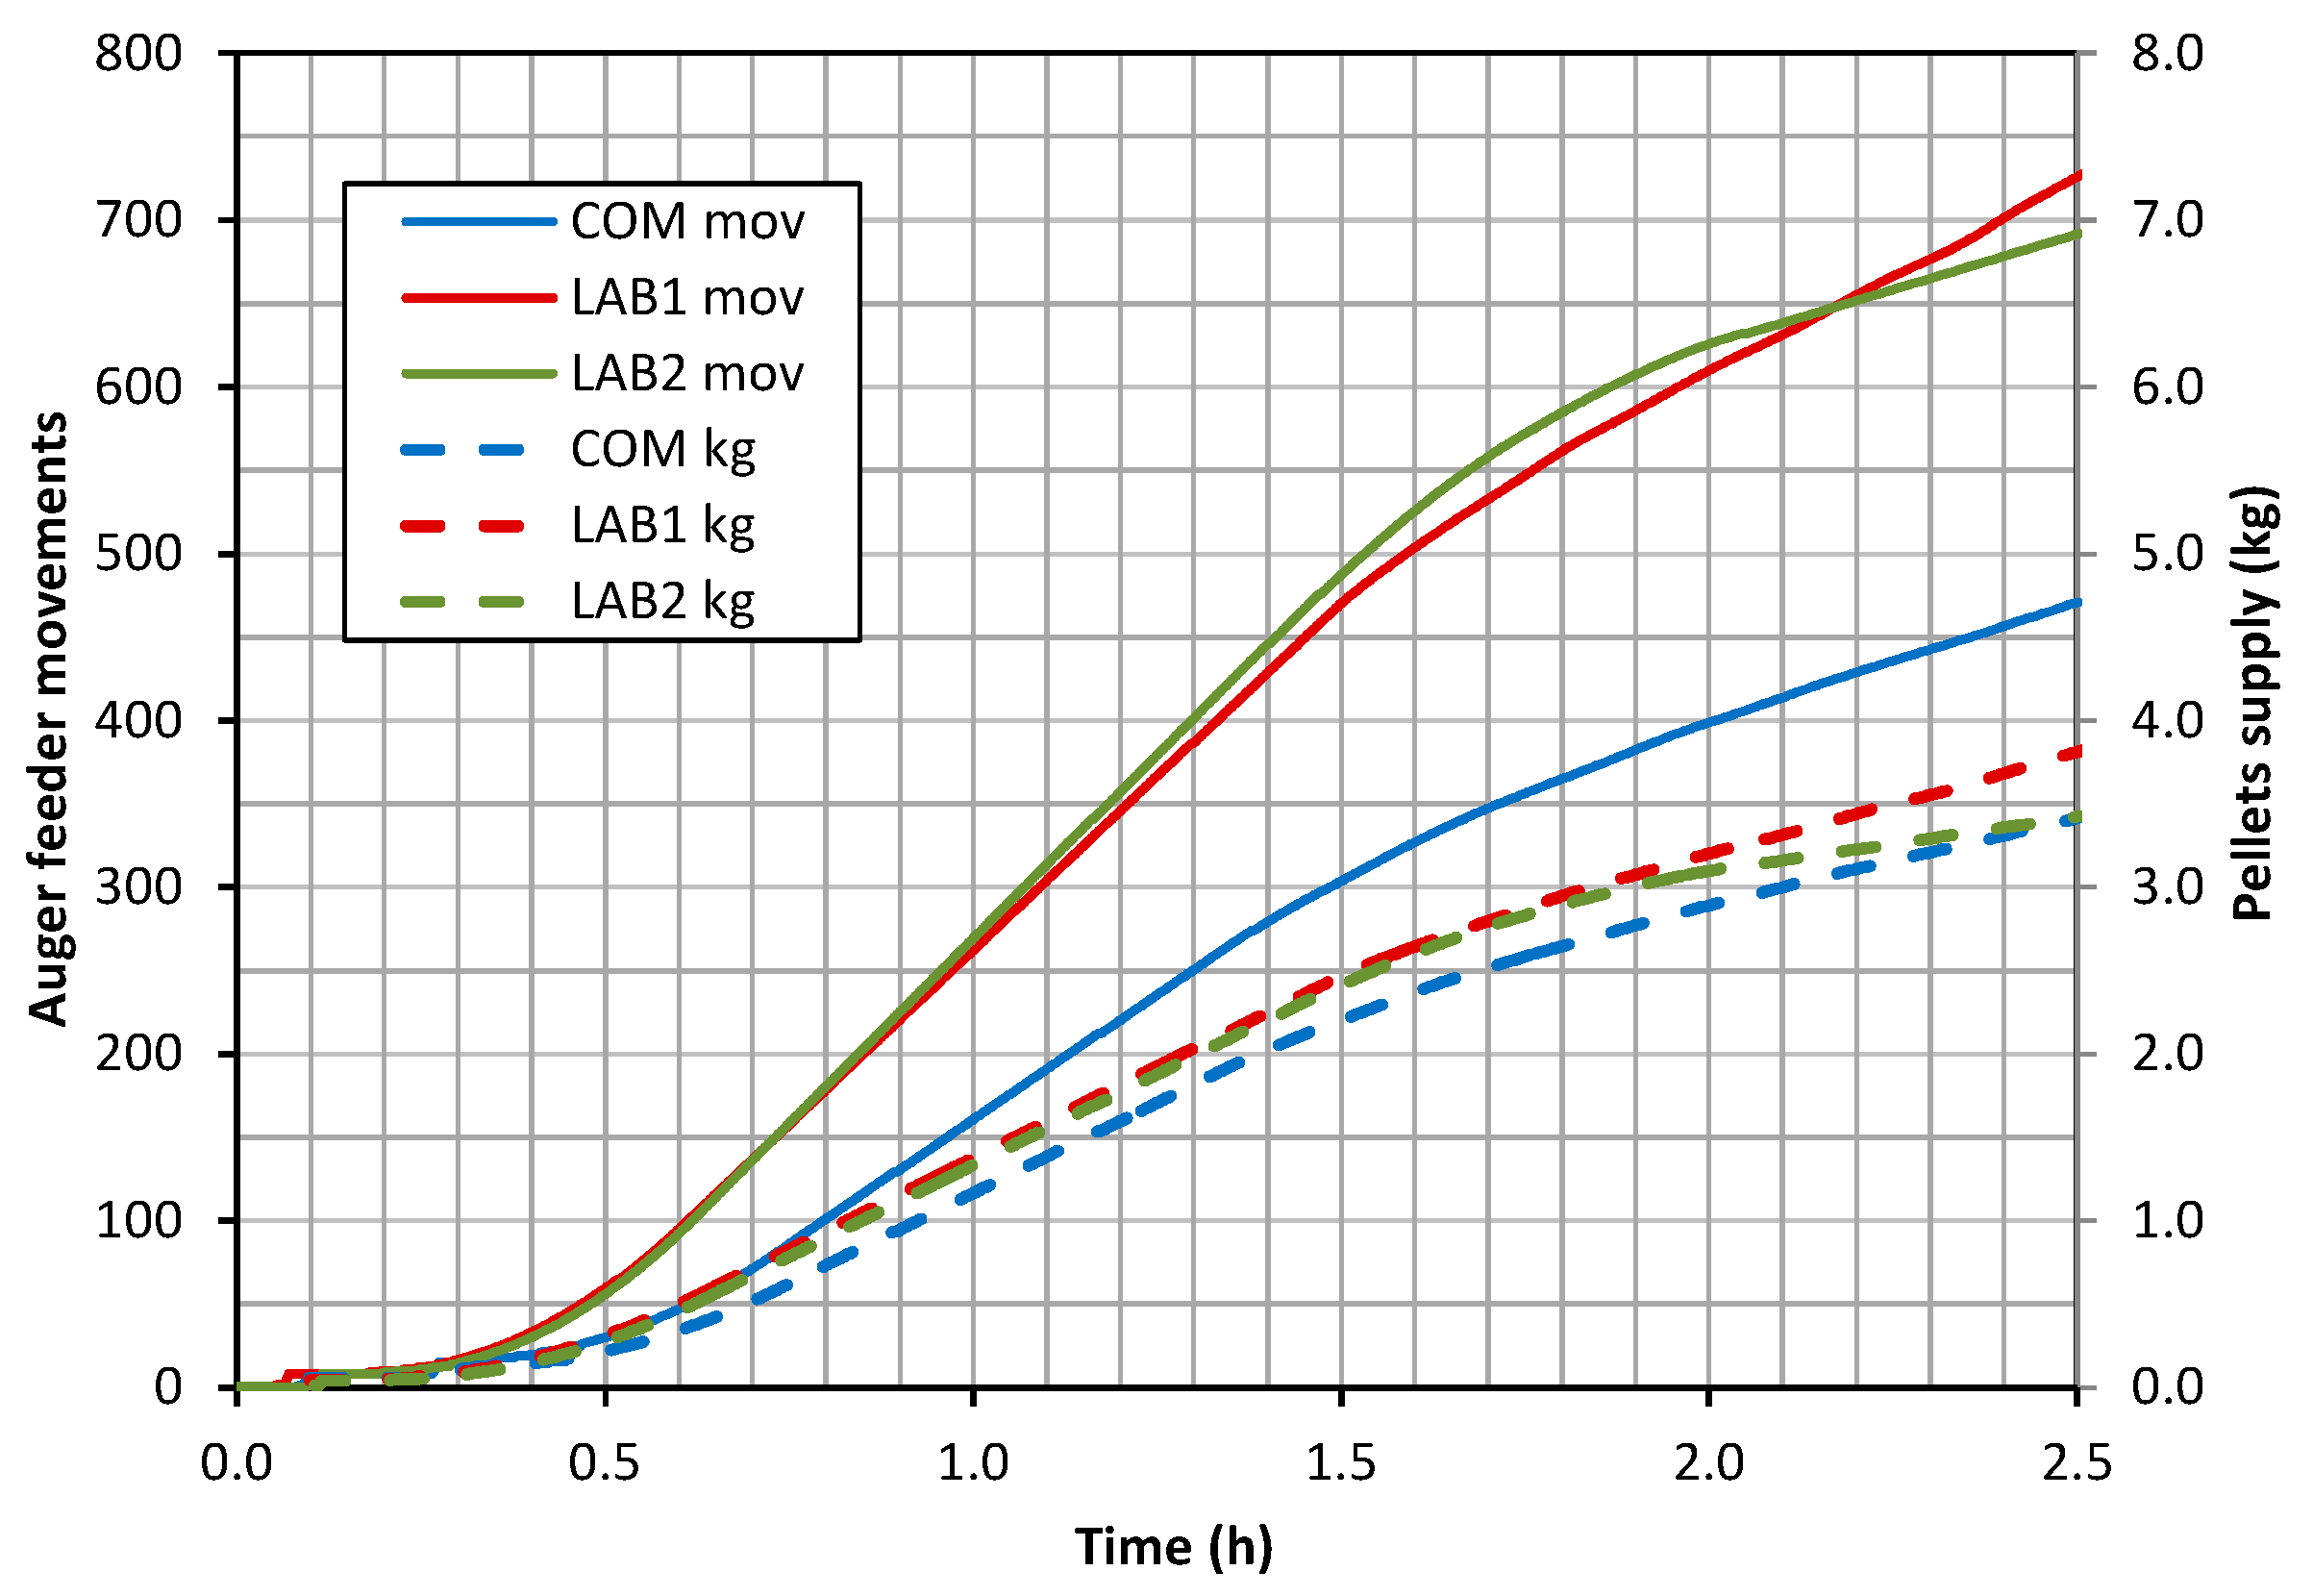
Figure 5.
Boiler modulation during the combustion test of COM pellets.
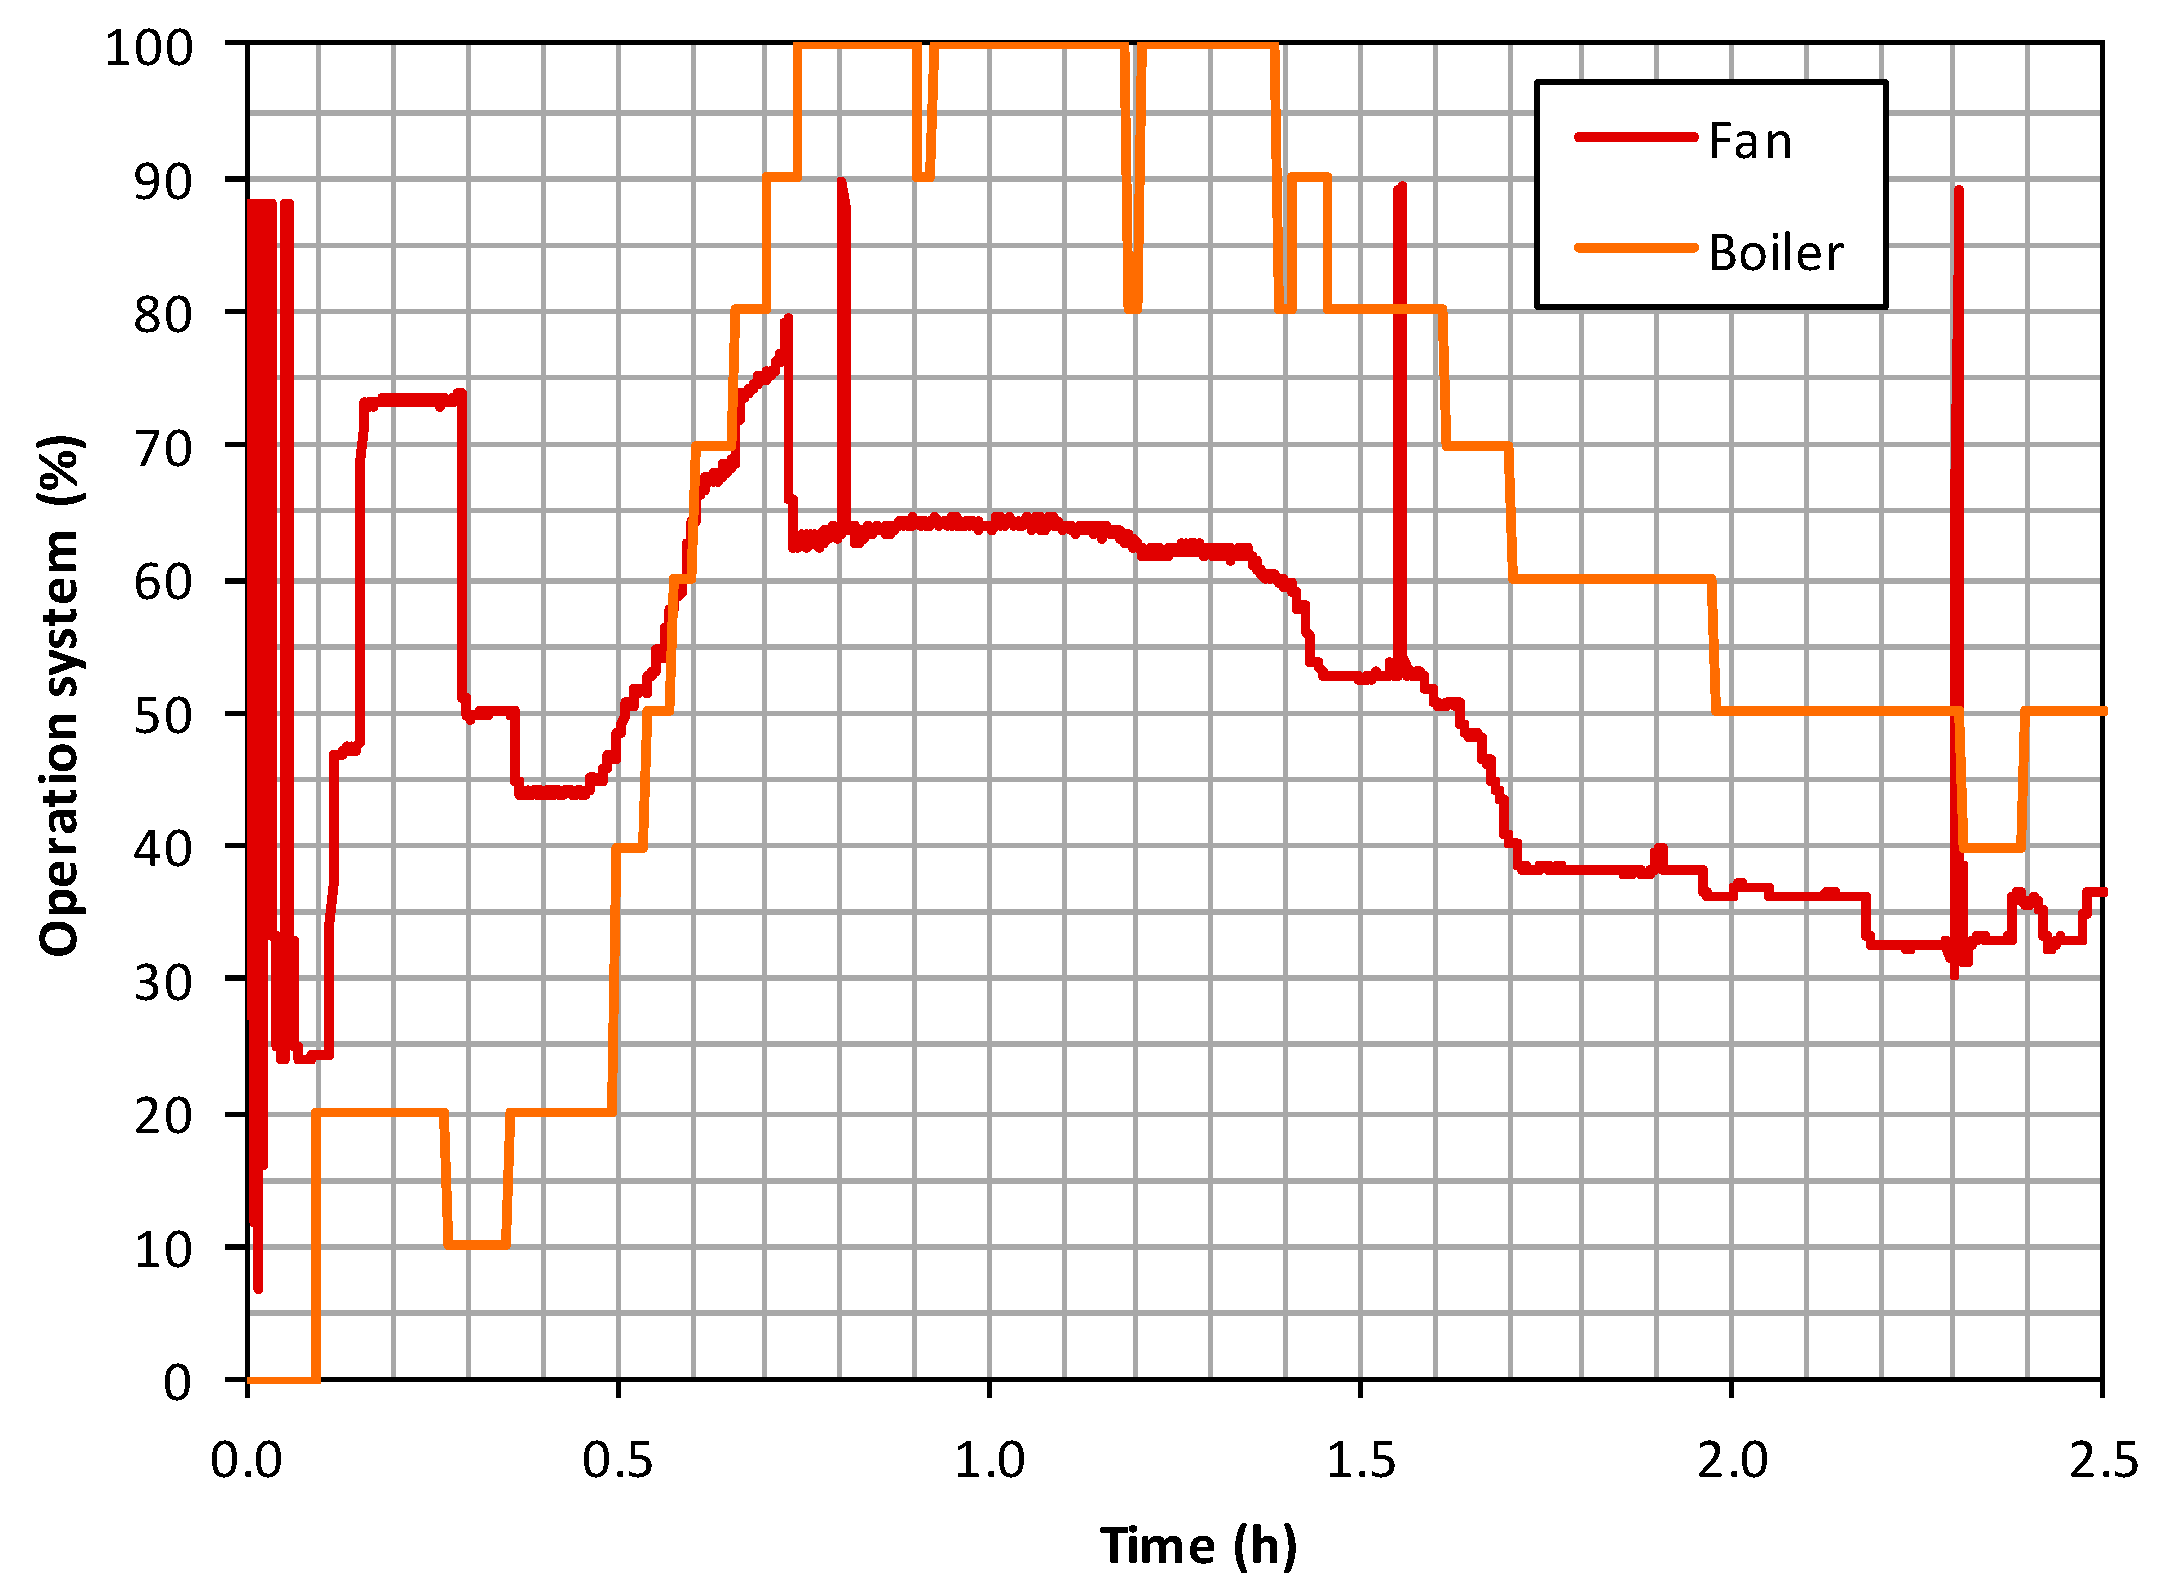
Figure 6.
Boiler modulation during combustion test of pellets LAB1.
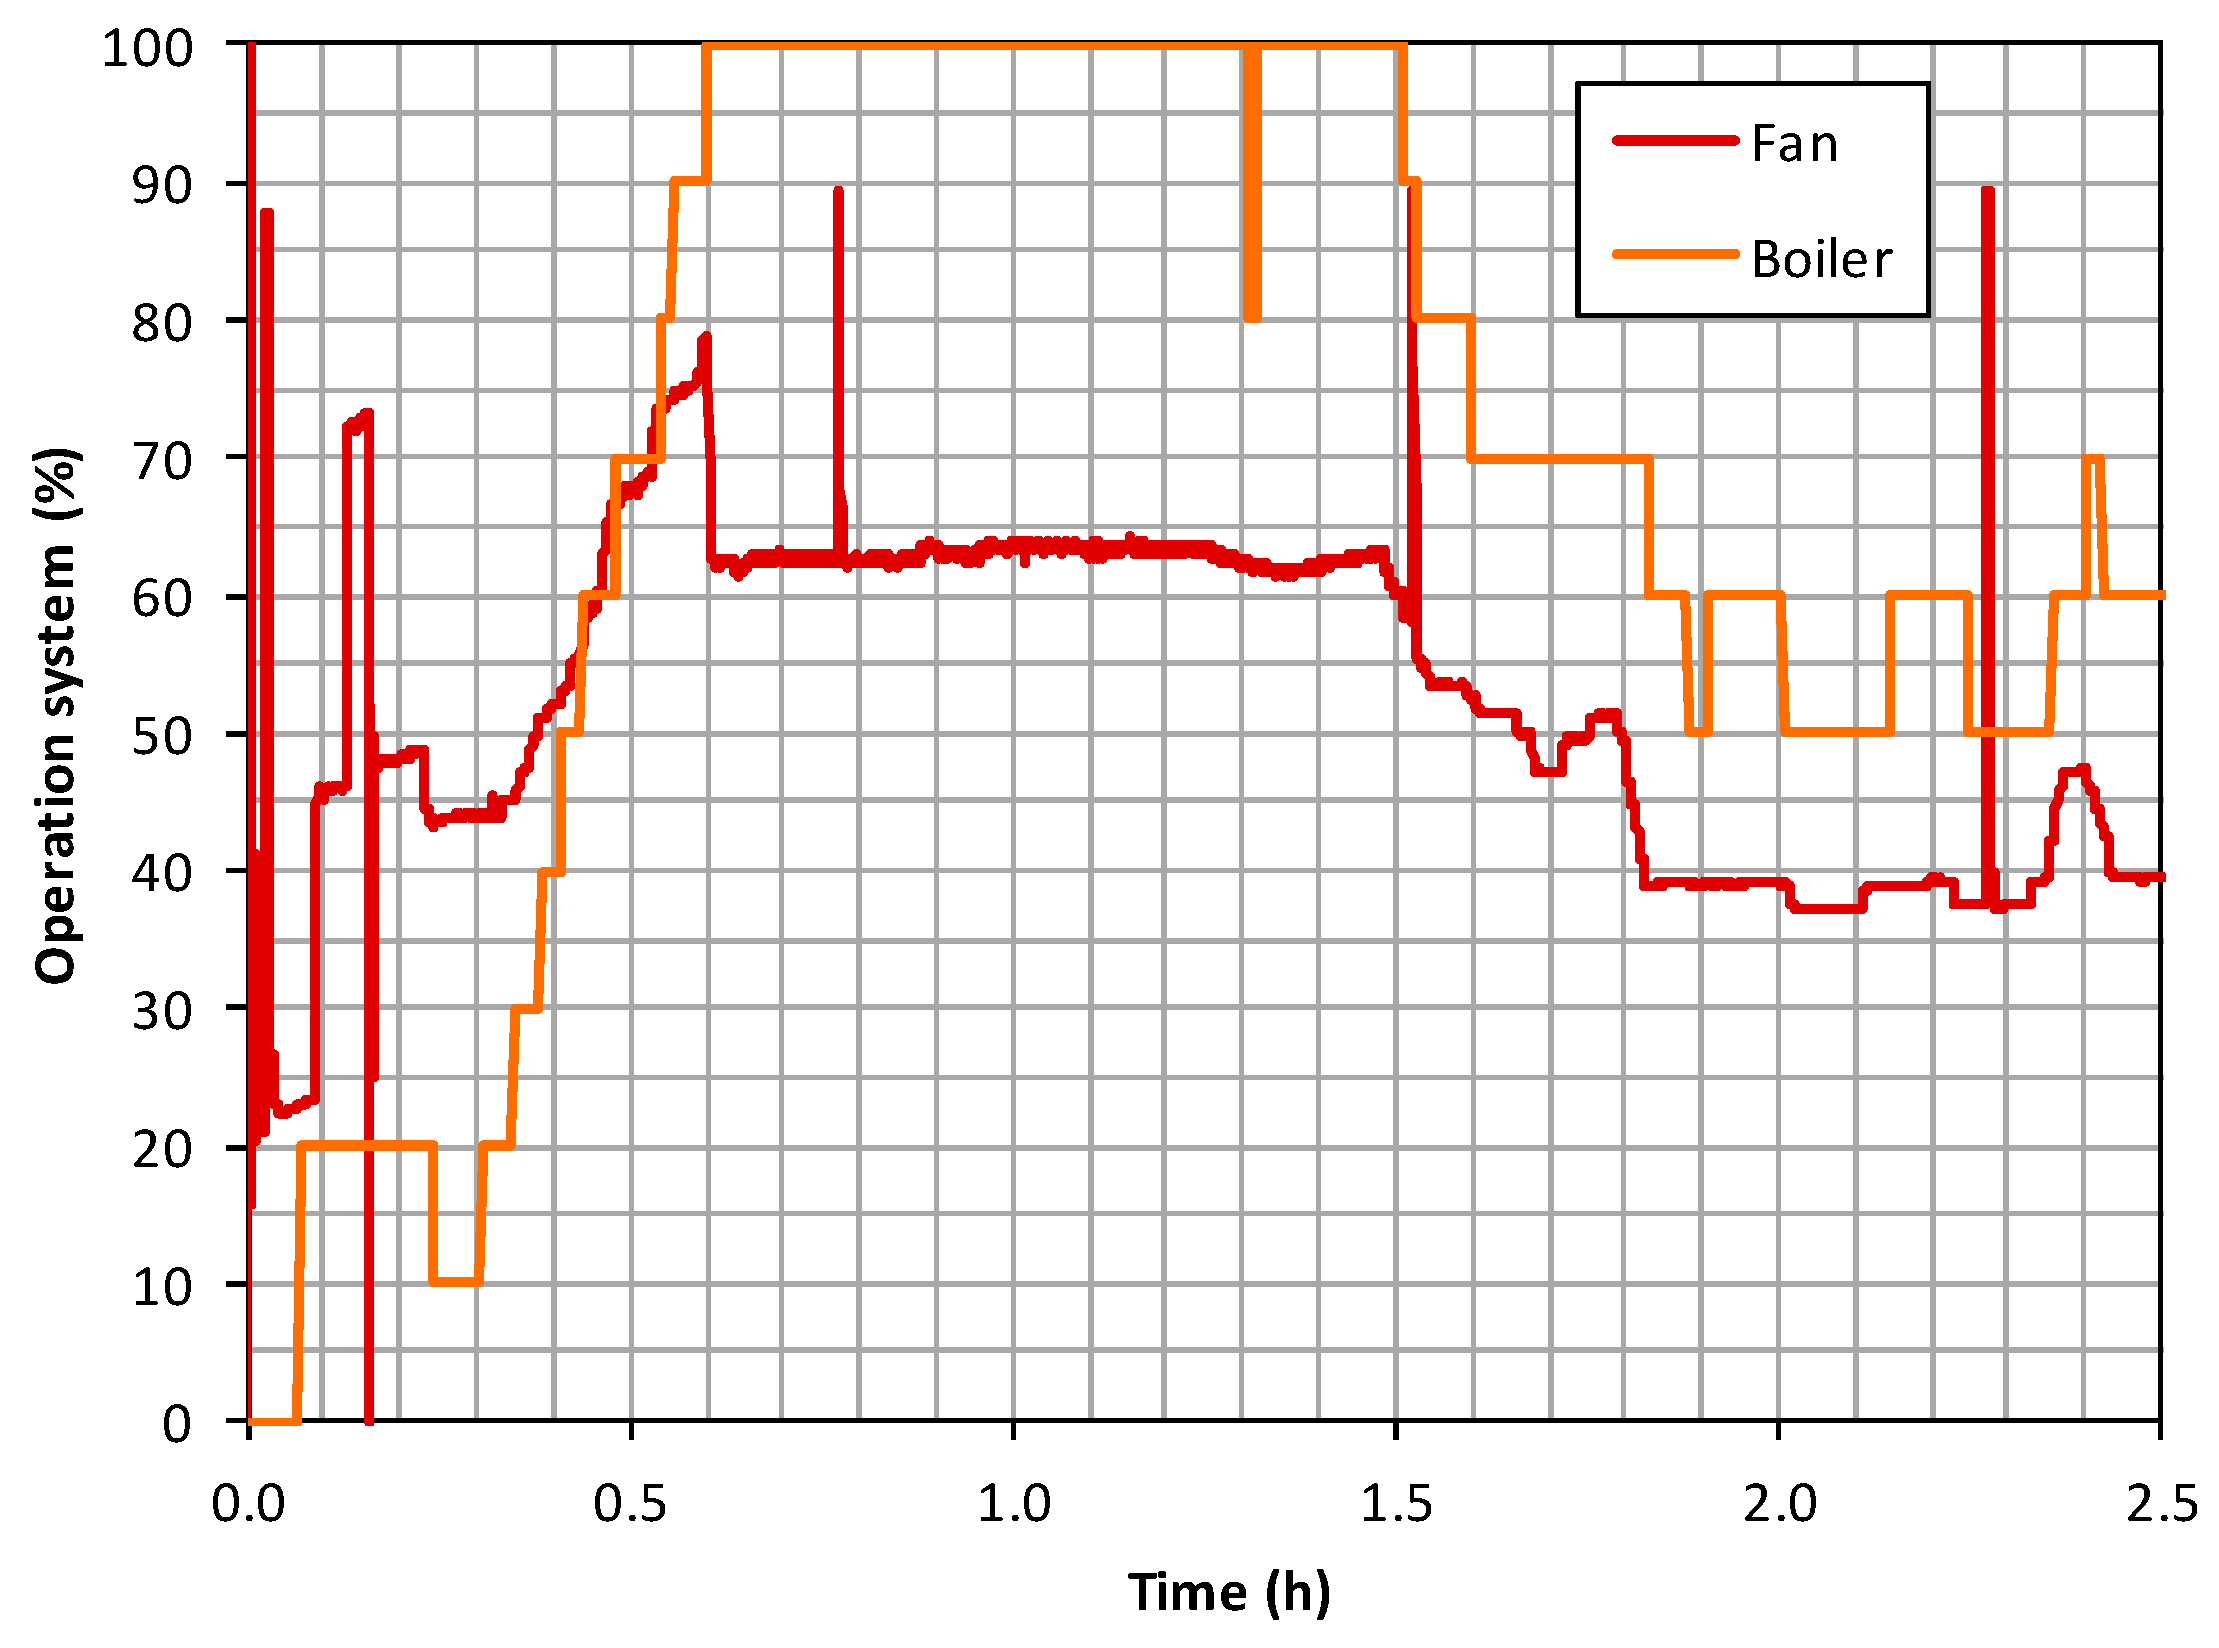
Figure 7.
Boiler modulation during combustion test of pellets LAB2.
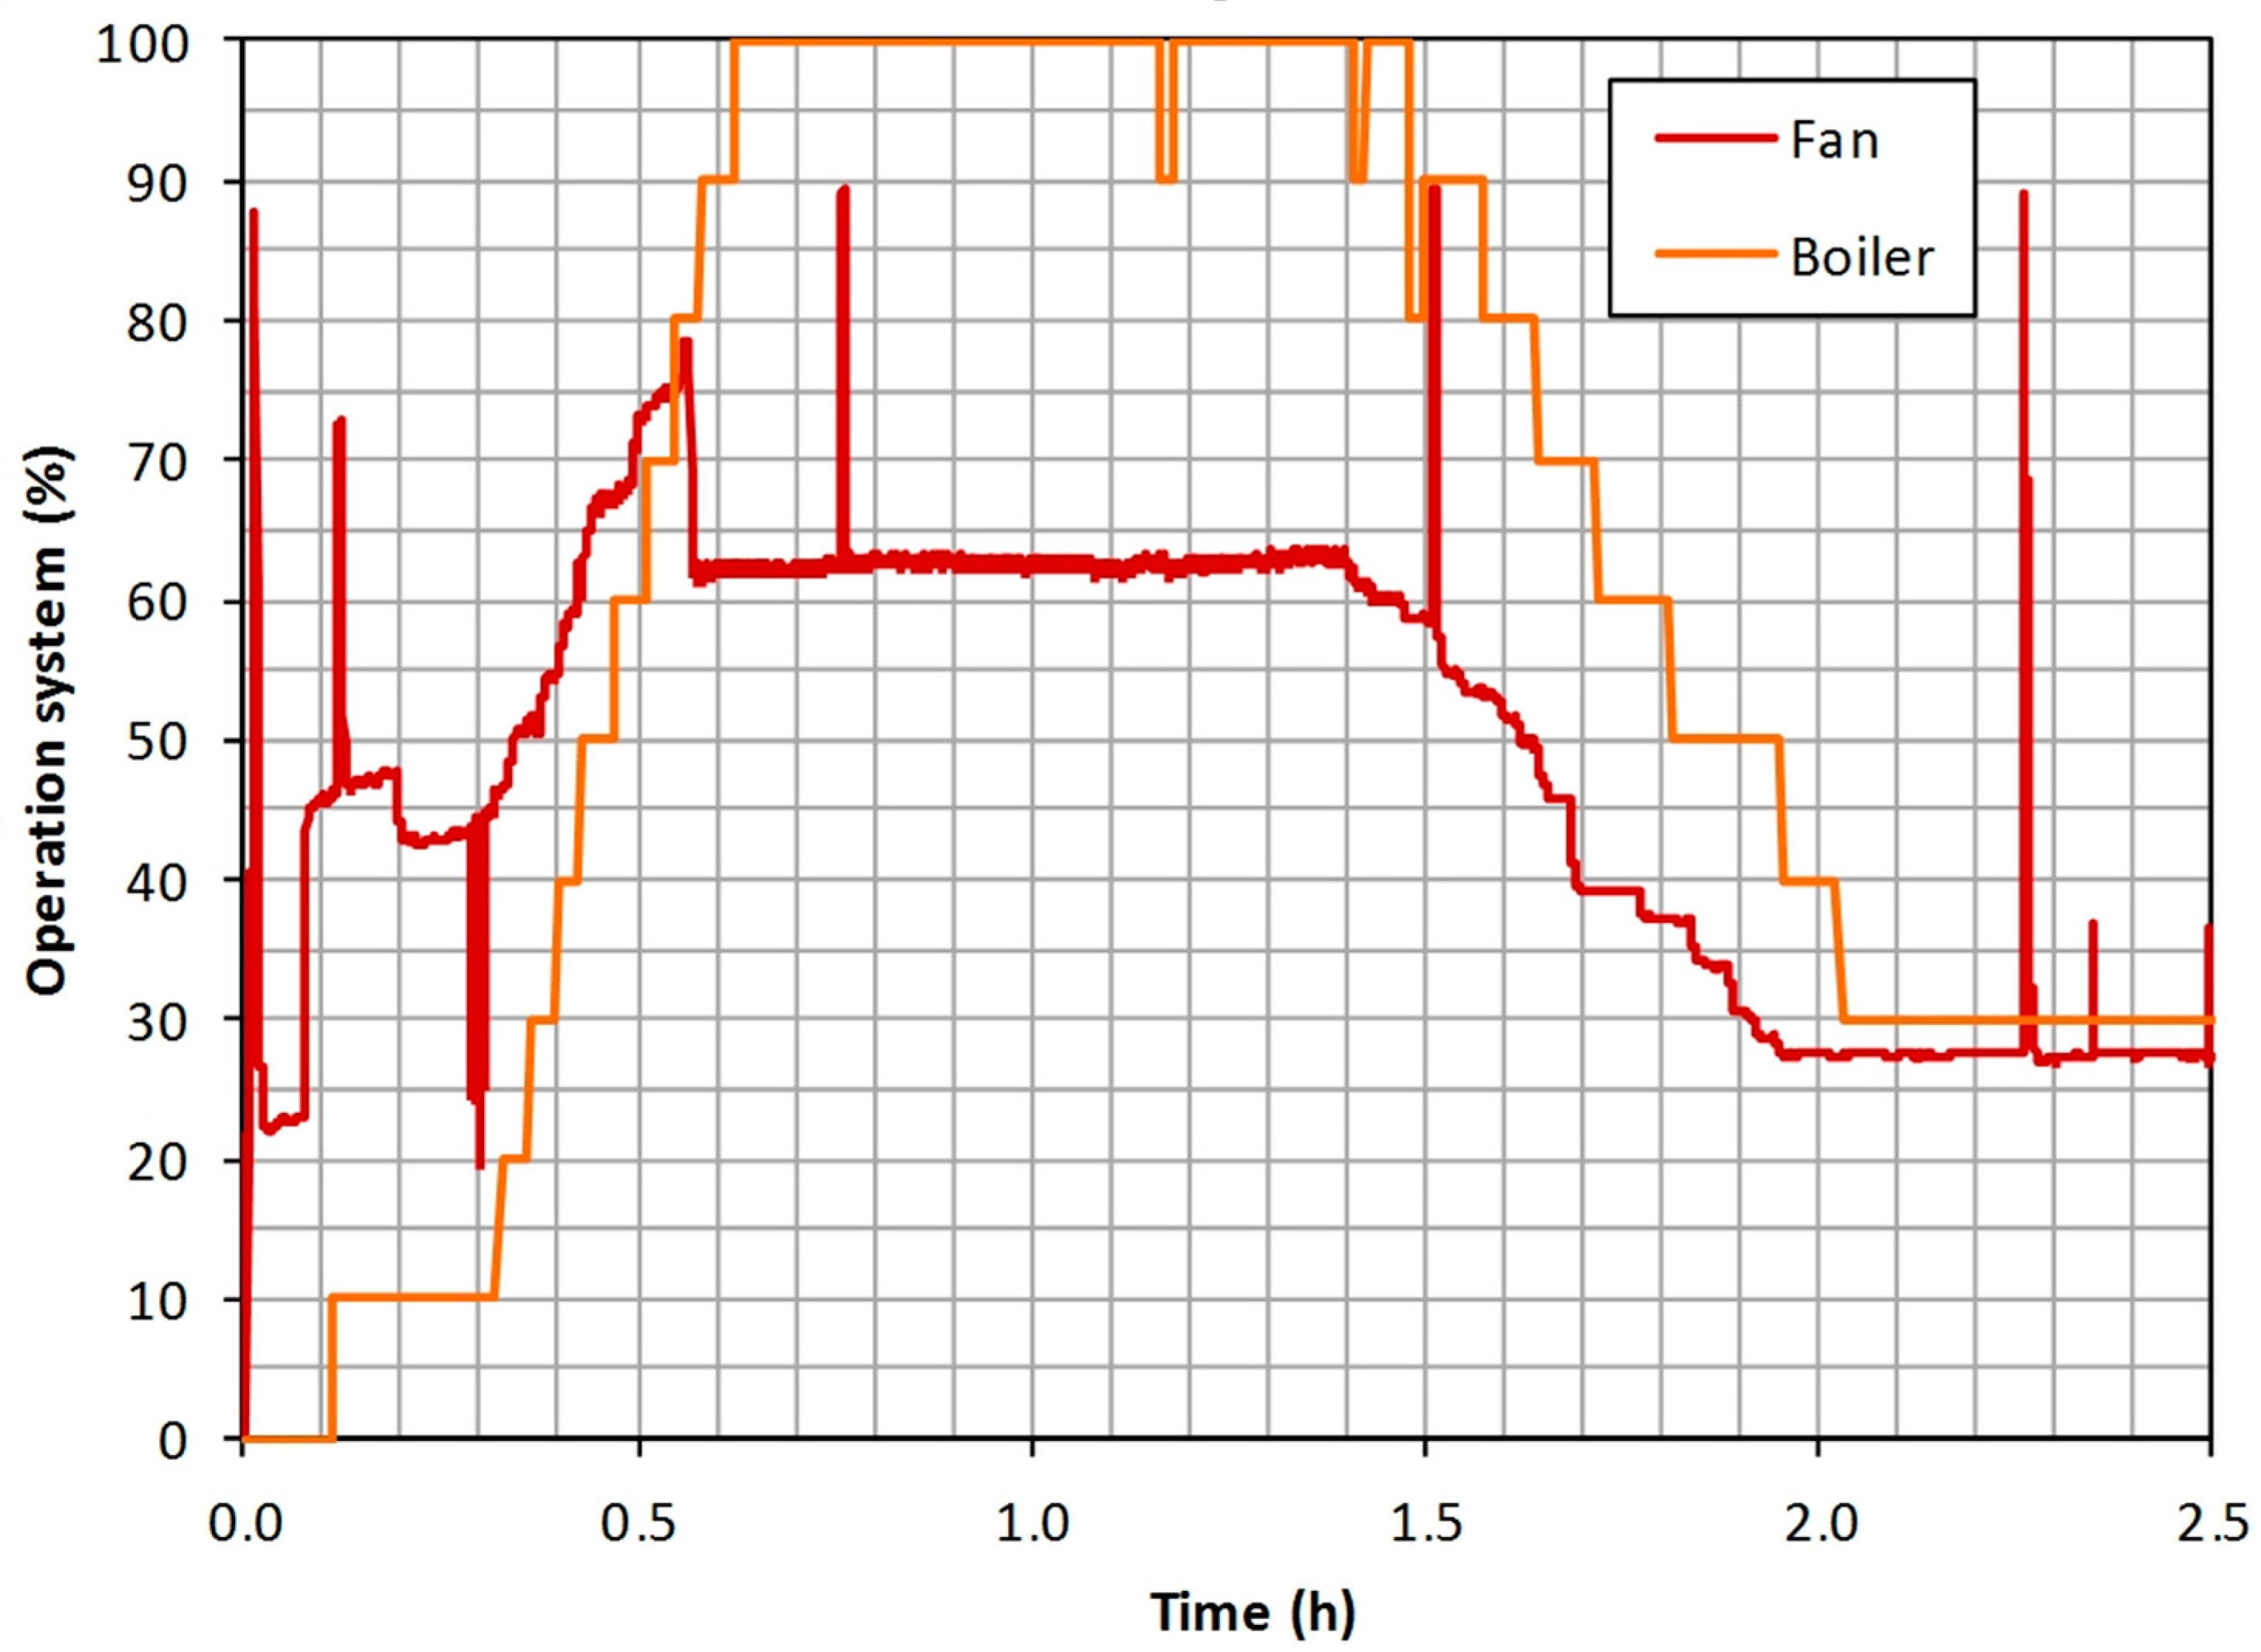
Figure 8.
Oxygen concentration in the flue gas.
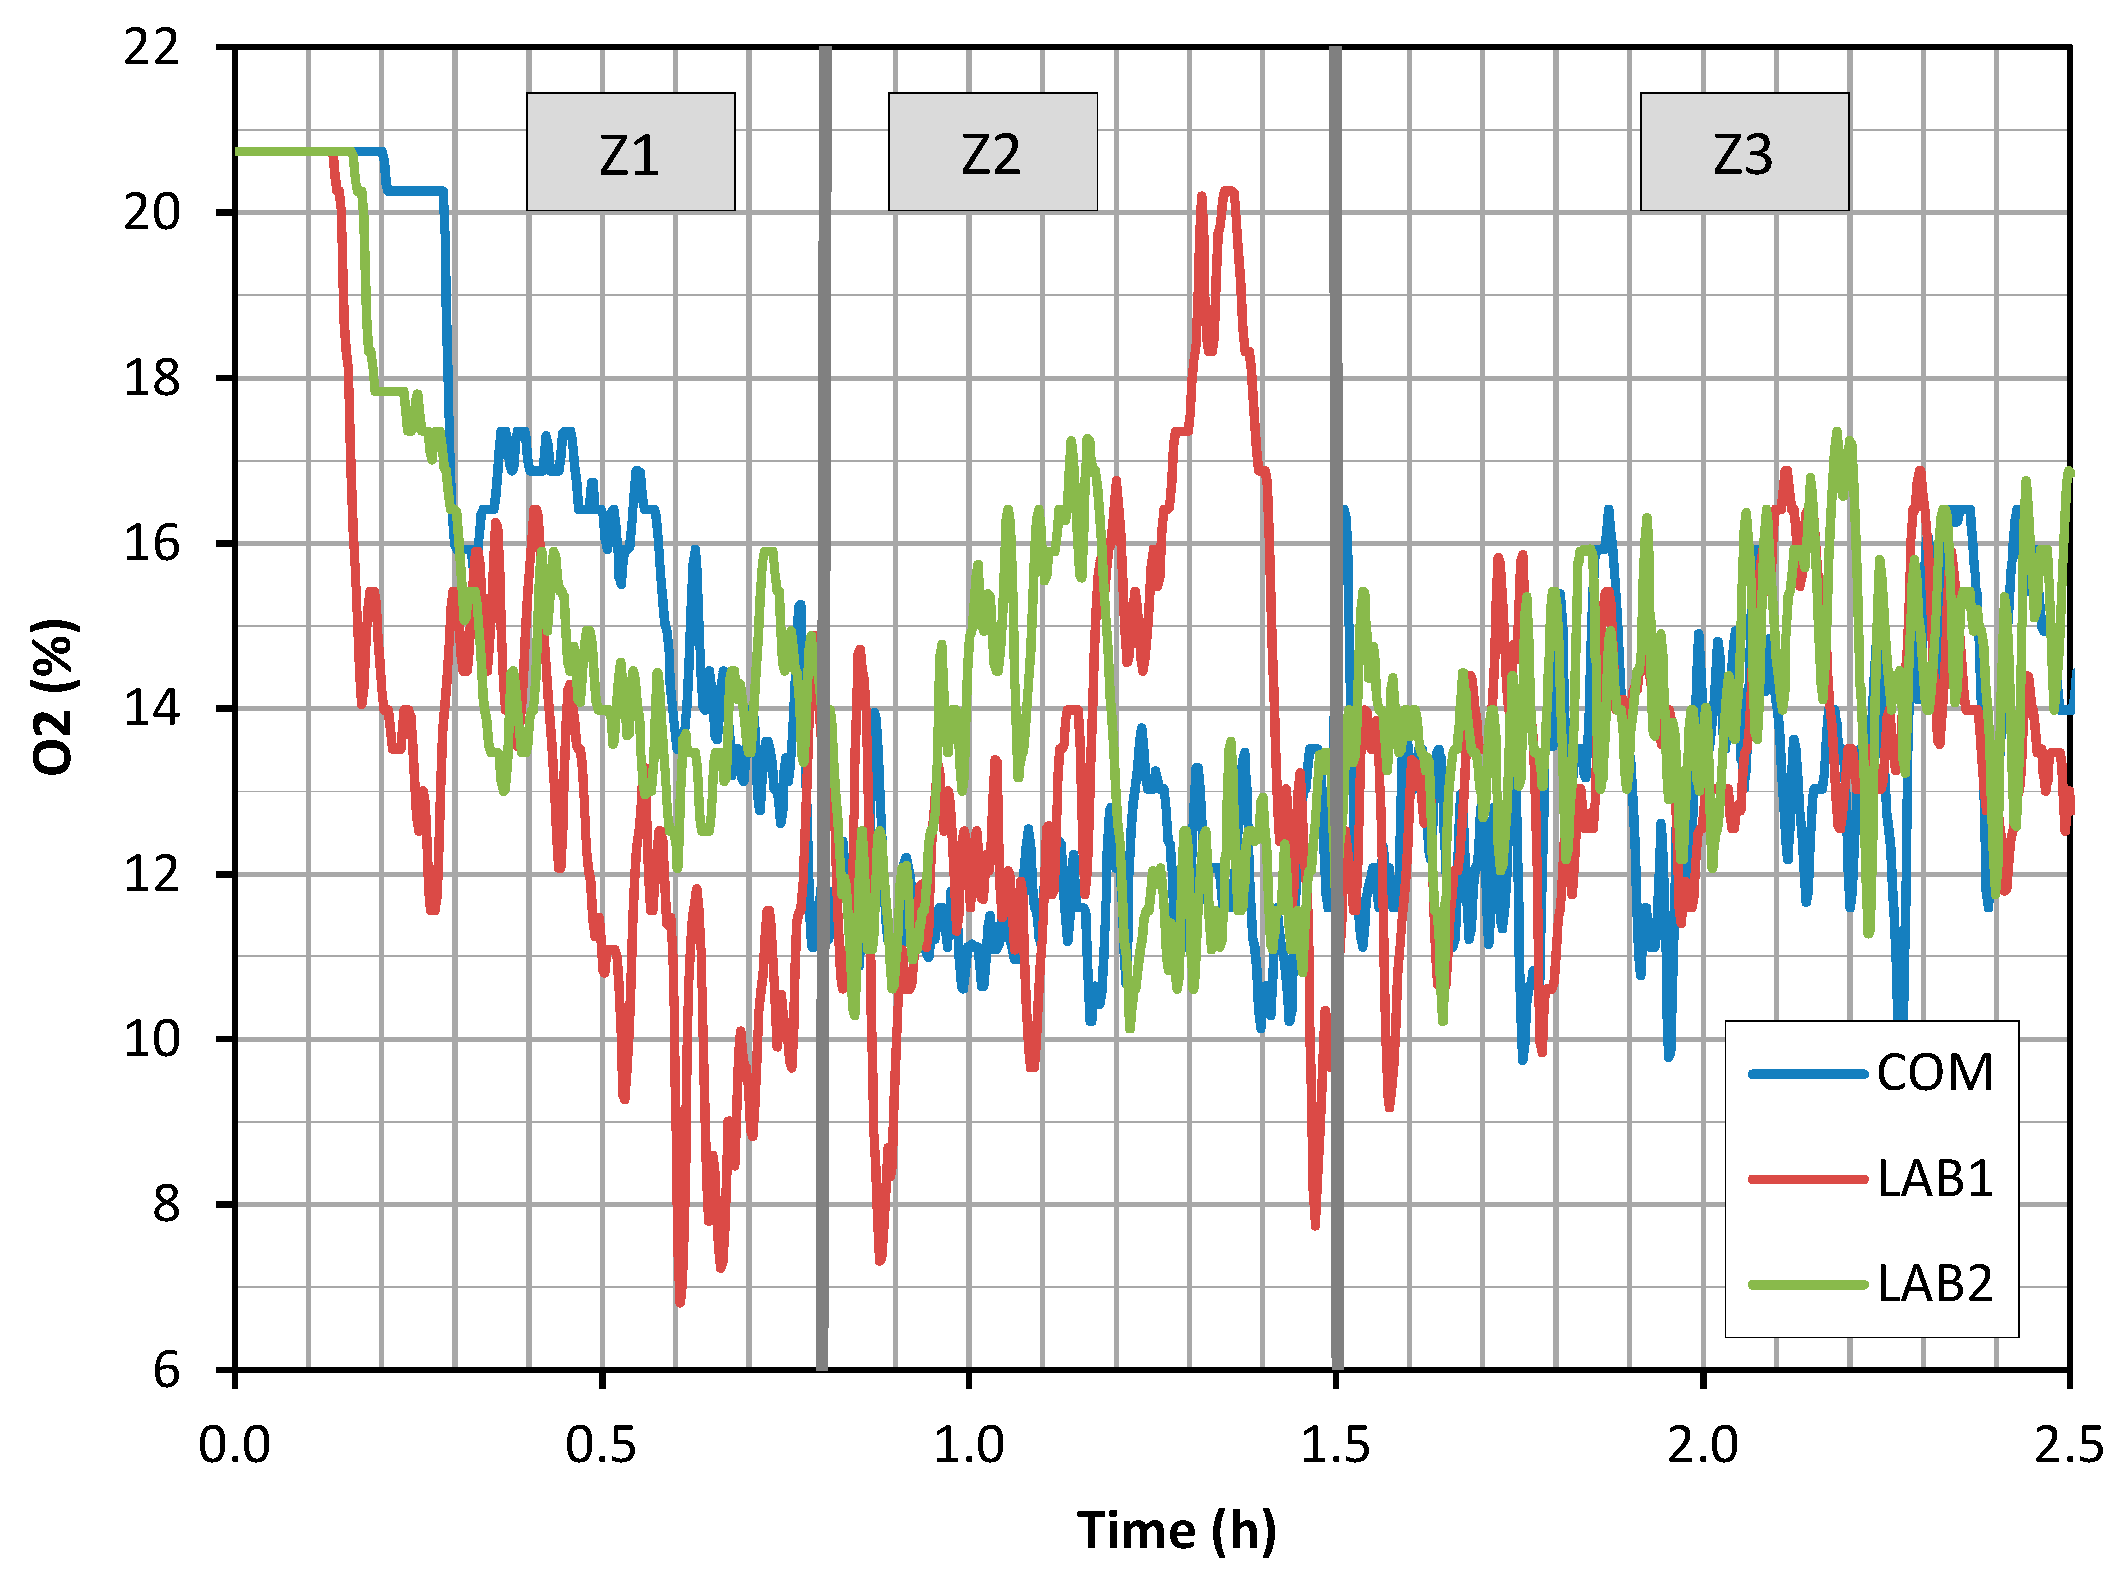
Figure 9.
Temperature and power during the combustion test of COM.

Figure 10.
Temperature and power during the combustion test of LAB1.

Figure 11.
Temperature and power during the combustion test of LAB2.

Figure 12.
Fume temperature during combustion tests.
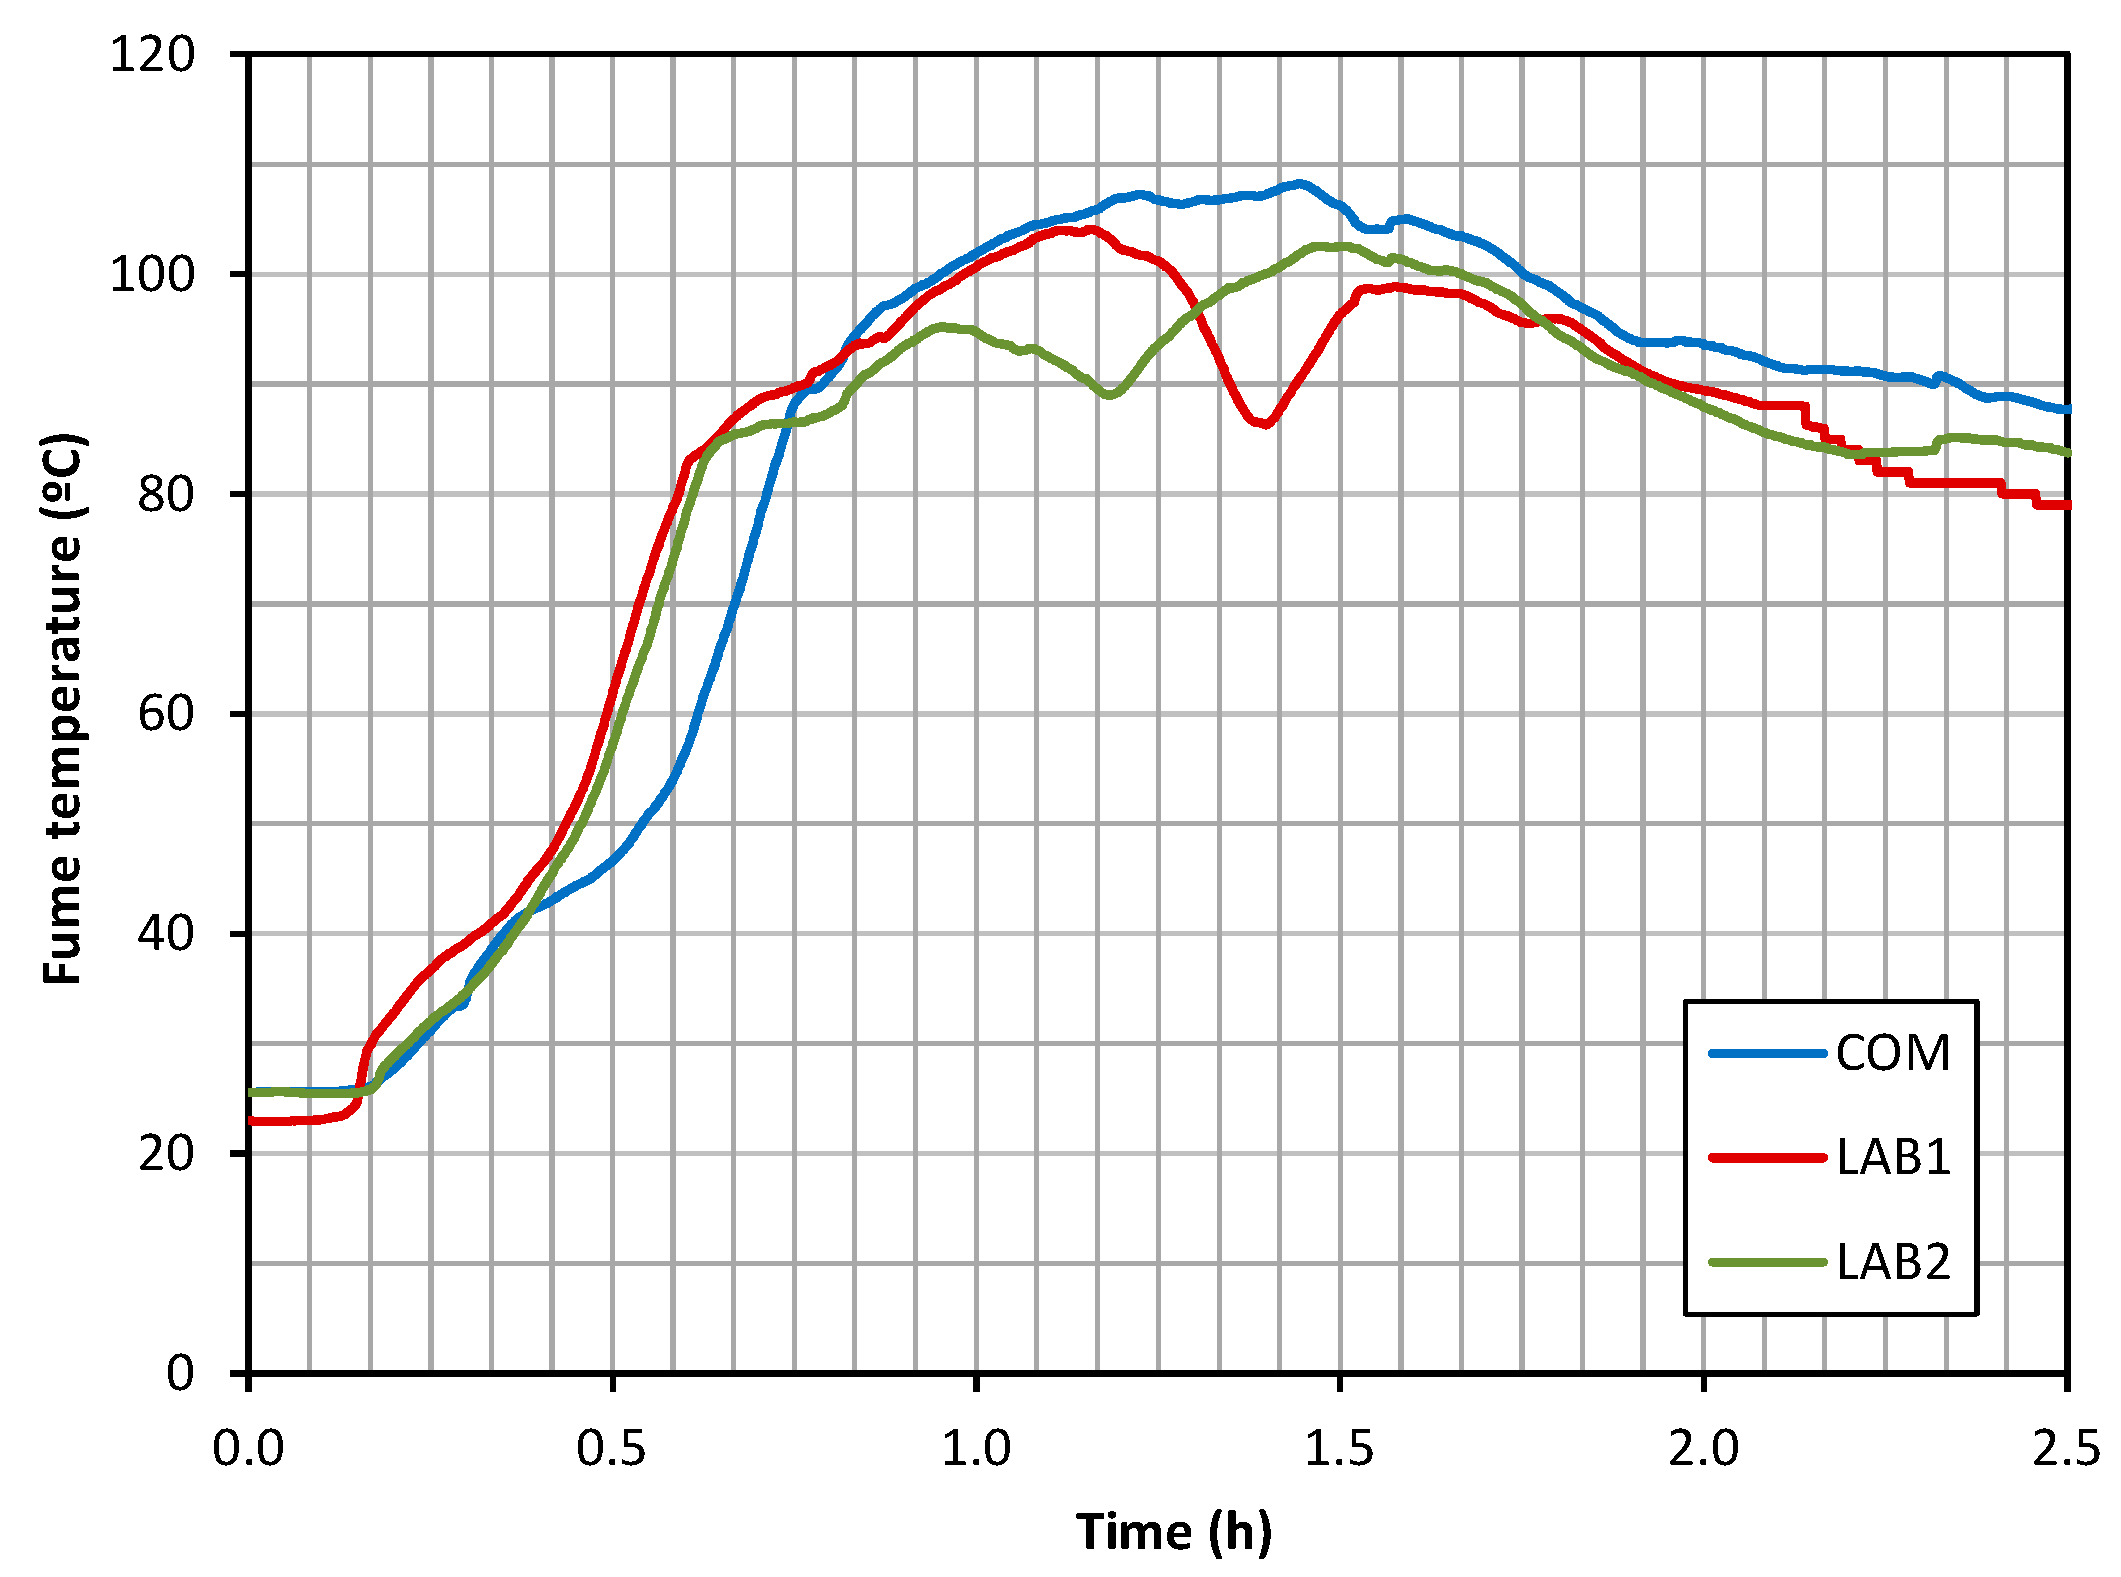
Figure 13.
Burner temperature during combustion tests.

Table 1.
Characterization of pellets.
| Property | COM | LAB1 | LAB2 |
|---|---|---|---|
| Moisture (% wb) | 8.0 | 8.0 | 8.5 |
| Bulk density (kg/m3 wb) | 750.6 | 705.1 | 560.0 |
| Durability (%) | 98.7 | 97.6 | 96.8 |
| C (% db) | 47.1 | 53.0 | 44.4 |
| H (% db) | 6.2 | 6.2 | 6.4 |
| N (% db) | 0.1 | 0.4 | 0.3 |
| S (% db) | 0.02 | 0.02 | 0.04 |
| Volatile matter (% db) | 84.0 | 78.7 | 78.3 |
| Ash (% db) | 0.5 | 4.1 | 1.2 |
| Fixed carbon (% db) | 15.5 | 17.2 | 20.5 |
| HHV (MJ/kg db) | 21.0 | 24.2 | 19.3 |
| LHV (MJ/kg wb) | 18.0 | 21.0 | 16.4 |
| Energy density (MJ/m3 wb) | 13,543.1 | 14,831.7 | 9,166.3 |
Table 2.
Variables of boiler operation.
| Property | Value |
|---|---|
| Minimum power (%) | 30.00 |
| Maximum power (%) | 100.00 |
| Set temperature (°C) | 80.00 |
| Minimum temperature of pump (°C) | 60.00 |
| Fume cleaning interval (min) | 60.00 |
| Fume cleaning time (s) | 10.00 |
| Burner cleaning interval (kg) | 6.00 |
| Fuel at maximum power (kg) | 2.20 |
| Fuel for ignition (kg) | 0.14 |
Table 3.
Modulation rates.
| Boiler Modulation (%) | Fan Operation (%) |
|---|---|
| 30 | 24 |
| 40 | 28 |
| 50 | 33 |
| 60 | 38 |
| 70 | 49 |
| 80 | 53 |
| 90 | 59 |
| 100 | 64 |
Table 4.
Mean values of concentrations of O2 during combustion tests.
| Zone | COM | LAB1 | LAB2 |
|---|---|---|---|
| 1 | 17.2 | 14.0 | 16.1 |
| 2 | 11.8 | 13.8 | 13.0 |
| 3 | 13.3 | 13.3 | 14.3 |
© 2017 by the authors. Licensee MDPI, Basel, Switzerland. This article is an open access article distributed under the terms and conditions of the Creative Commons Attribution (CC BY) license (http://creativecommons.org/licenses/by/4.0/).
Share and Cite
MDPI and ACS Style
Miranda, M.T.; Montero, I.; Sepúlveda, F.J.; Arranz, J.I.; Rojas, C.V. Design and Implementation of a Data Acquisition System for Combustion Tests. Energies 2017, 10, 630. https://doi.org/10.3390/en10050630
AMA Style
Miranda MT, Montero I, Sepúlveda FJ, Arranz JI, Rojas CV. Design and Implementation of a Data Acquisition System for Combustion Tests. Energies. 2017; 10(5):630. https://doi.org/10.3390/en10050630
Chicago/Turabian StyleMiranda, María Teresa, Irene Montero, Francisco José Sepúlveda, José Ignacio Arranz, and Carmen Victoria Rojas. 2017. "Design and Implementation of a Data Acquisition System for Combustion Tests" Energies 10, no. 5: 630. https://doi.org/10.3390/en10050630
Note that from the first issue of 2016, this journal uses article numbers instead of page numbers. See further details here.