Article

The Impact of Shading Type and Azimuth Orientation on the Daylighting in a Classroom–Focusing on Effectiveness of Façade Shading, Comparing the Results of DA and UDI

1
School of Architecture, Hongik University, 94 Wausan-ro, Mapo-gu, Seoul 02481, Korea
2
Digit, 12, Dongmak-ro 2-gil, Mapo-gu, Seoul 04071, Korea
3
School of Architecture, University of Illinois at Urbana-Champaign, Champaign, IL 61820, USA
*
Authors to whom correspondence should be addressed.
Energies 2017, 10(5), 635; https://doi.org/10.3390/en10050635
Submission received: 7 February 2017 / Revised: 4 April 2017 / Accepted: 25 April 2017 / Published: 10 May 2017
(This article belongs to the Special Issue Solar Energy Application in Buildings)

Abstract

:
There are many kinds of façade shading designs which provide optimal indoor daylighting conditions. Thus, considering combinations of different types of façade shading systems is an essential aspect in the optimization of daylighting in the building design process. This study explores (1) how the pattern and different characteristics are evaluated by varying façade shading types and considering their impact on daylighting metrics; and (2) the relative relationships between Daylight Autonomy (DA) and Useful Daylight Illuminance (UDI) with changes of the façade shading types, input parameters, and azimuth orientations. A typical high-school classroom has been chosen as a base model, and seven different façade shading types: vertical louver, horizontal louver, eggcrate louver, overhang, vertical slat, horizontal slat, and light shelf have been applied to eight azimuth orientations for the building. As tools for parametric design and indoor lighting analysis, Design Iterate Validate Adapt (DIVA)-for-Grasshopper has been used to obtain DA and UDI for comparison. Based on the simulation, (1) the effectiveness of the installation of façade shading compared to a non-shading case; and (2) design considerations for façade shading are presented. The result shows that there are some meaningful differences in DA and UDI metrics with the variation of orientation and façade shading types, although all cases of façade shading show some degree of decrease in DA and increase in UDI values. The types of shading devices which produce a dramatic decrease in DA values are the light shelf, horizontal slats, horizontal louvers, and eggcrate louvers. On the contrary, the types of shading devices which produce a dramatic increase in UDI values are the light shelf, horizontal slats, horizontal louvers, and eggcrate louvers. In the case of the vertical and vertical slat shading, the improvements of UDI values are significant in the east and west orientations. This demonstrates that the application and design of shading devices in certain façade orientations should be carefully considered for daylight control. Also, the results show that UDI explains relatively well the daylight performance in the case of the installation of a shading device.

1. Introduction

The design process plays an important role in developing sustainable buildings. In the case of different design processes, outcomes such as human comfort, reduction of energy consumption, and utilization of solar energy are of utmost importance. Thus, the design process should be highly valued, and with that, one of the most important aspects of the design process is analyzing the environmental effects surrounding building users [1]. To optimize the use of solar energy, fenestration also plays an important role, be it in terms of the view from the windows or daylighting and ventilation [2]. Daylighting, which occupies a large portion of environmental factors, can affect not only heating, ventilation, air-conditioning, and cooling [3,4], but also a building occupant’s health [5]. The study of the parameters affecting optimum utilization of energy and daylighting performance of buildings is essential for a more systematic and comprehensive building design [6,7]. Research relating to daylighting effects is ongoing. For example, there is research dealing with the relationship between daylighting and human comfort [8], human performance [9], and interaction between façade shading and ceiling geometry [10]. Utilizing daylight through fenestration and shading devices needs sufficient consideration, and measures should be taken to produce optimum solar energy in terms of maximizing utility and minimizing glare problems and cooling loads by solar radiation [11].
Combinations of external shading devices as in façade shading systems are essential aspects of the optimization of daylighting in building design [2]. A louver, which is one type of sunshade system, is mainly configured to acquire adequate solar radiation and control over lighting. For setting façade shading in a window system, there are many ways to analyze it, such as in terms of material and design variations. Moreover, façade shading has a great impact on both internal comfort and external beauty. There are various guidelines and research on façade shading prototype effectiveness [12,13,14,15] and maximizing visual performance by application of an advanced façade shading system [16]. Additionally, overheating problems [17] and glare [18] can be optimized with the application of a shading system. Normally, façade shading is designed manually, based on a designer’s experience and knowledge. However, there are additional ways to optimize façade shading supported by computer software such as simulation programs to achieve the best possible alternatives and design solutions in terms of daylight performance in buildings [19].
For daylighting design tools, Design Iterate Validate Adapt (DIVA)-for-Grasshopper/Rhino can be used to design a building envelope and façade shading [20]. In more recent times, utilizing digital technology based on hardware technology and algorithm development on a computer has been integrated into architectural projects, an approach which is known as parametric design [21,22]. Parametric design technology provides stepwise control for the architect in the generative design process to effectively use computational technology in performance-driven design processes [22]. Hence, parametric modeling is related to geometric information which includes several parameters [23,24], and it can manually or automatically modify parameters such as façade shading type, size, and angle, without reorganizing the entire model through an integrated process of performance analysis and simultaneous design synthesis [21].
In evaluating optimal façade shading with parametric design, there are several ways to evaluate daylighting metrics such as the through daylight factor, illuminance uniformity ratio, simplified daylight glare probability, Daylight Autonomy (DA), and Useful Daylight Illuminance (UDI) [25,26]. Currently, daylight performance metrics are moving away from the traditional daylight factor and building standards, and green building rating systems have instead moved toward climate-based daylighting such as DA and UDI [27]. These metrics can obtain realistic measurements with the aid of a validated dynamic daylight engine [27].
Although there have been studies on daylighting and its performance analysis in buildings, not much literature can be found on the effective use of façade shading for daylighting optimization. As a rule of thumb in the northern hemisphere, horizontal louvers are an effective shading type for southern exposure, while vertical louvers are for east- and west-facing sun control [28]. It is essential to calculate the impact of daylighting metrics based on the type, size, direction, etc. of the shading devices within the design process through a computer algorithm [29] for effective design solutions. Also, the Leadership in Energy and Environmental Design (LEED) version 4 daylight credit starts to consider DA as a climate-based analysis for the evaluation of lighting conditions [30], and to connect building occupants’ comfort, provide glare control, and minimize lighting energy usage [31].
In this research, two main objectives are explored. First, the pattern and different characteristics are evaluated by varying façade shading types and considering their impact on daylighting metrics. Various types of façade shadings, including vertical louver, horizontal louver, eggcrate louver, overhang, vertical louver slat, horizontal louver slat, and light shelf can be affected differently depending on the change in orientation and design. This research starts by analyzing the effect of façade shading types on daylighting using a parametric design tool. Secondly, the research compares and analyzes DA and UDI. There are two major differences between DA and UDI: (1) UDI concerns daylight illuminance in the range of 100 to 300 lux, which the DA range excludes, and which is considered effective even though the DA does not consider the range; (2) UDI perceives that a range over 2000 lux is undesirable and intolerable in terms of overlighting and glare. This study explores the changes in DA and UDI values with the application of various façade shading types and their characteristics of controlling the light condition. Ultimately, the research results can offer an organized façade shading design strategy through combined engineering technology and comprehensive understanding of manual façade shading design methods.

2. Methodology

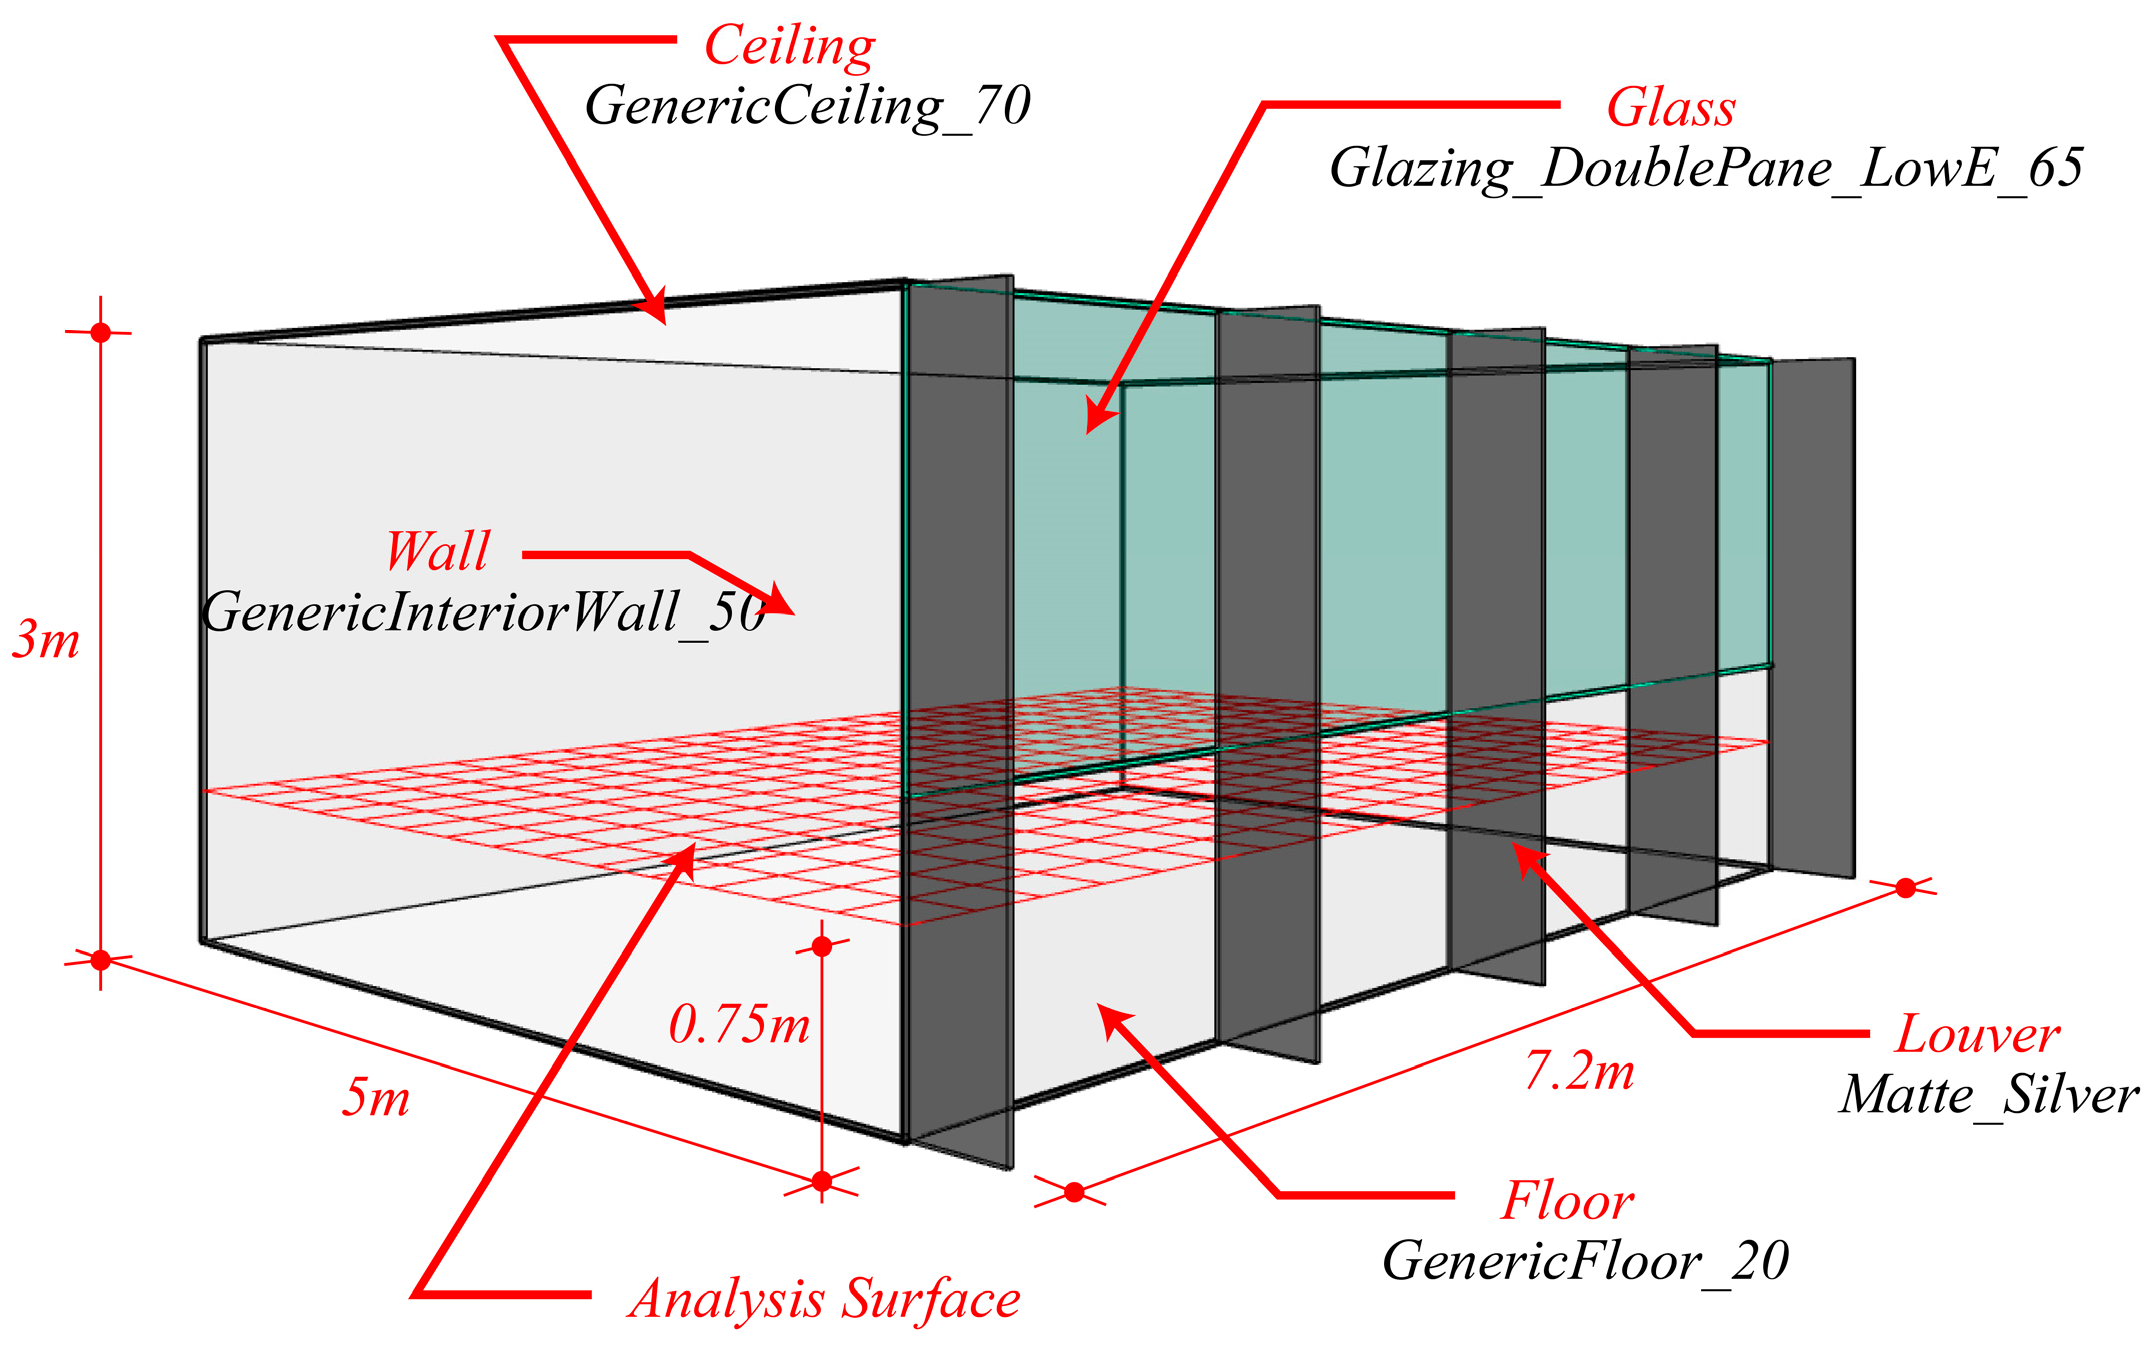
2.1. Basic Simulation Model

For simulation, a typical classroom space was used as a base model, which consisted of 5 m (16.4 ft) depth by 7.2 m (23.6 ft) width, with a floor-to-floor height of 3 m (9.8 ft), as shown in Figure 1. Input materials for the floor, wall, and ceiling were implemented as default values which are supported by DIVA in Table 1. The selected glazing type was 8 mm double-pane low-E glass. The analysis surface for the sensor nodes was set at the height of 0.75 m as the workplace height distance from the floor and divided into 70 modules, as shown in Figure 2. This simulation model does not consider any artificial lighting inside. The simulation was based on Incheon’s (South Korea, Latitude 37) weather data, which is classified as a warm continental climate/humid continental climate (Dwa) in the Köppen climate classification.

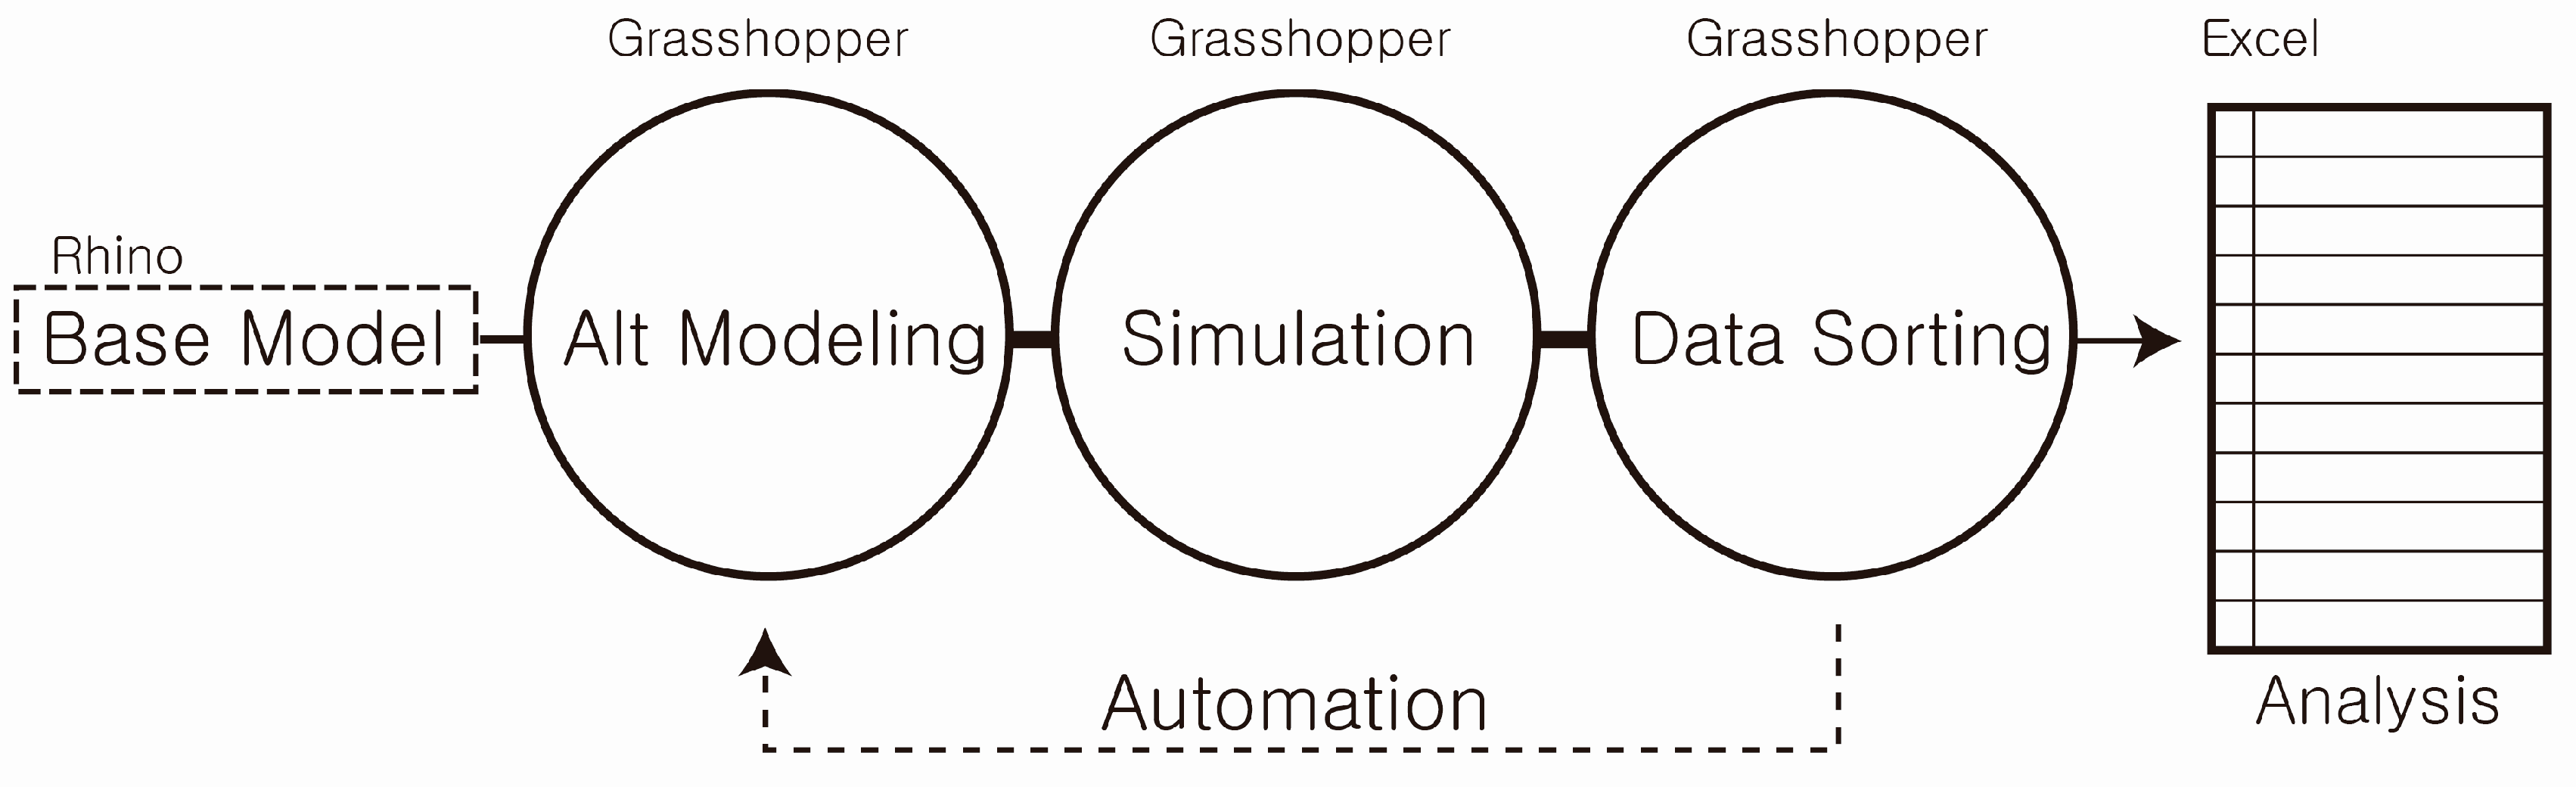
2.2. Simulation Program and Basic Concept

In this research, DA and UDI are used for the daylighting metrics. First, DA is conceived as annual daylight metrics, now commonly referred to as “dynamic daylight metrics” [26]. It is represented as a percentage of the annual daytime hours that a given point in a space is above a specified illumination level and at a threshold of 300 lux. Secondly, UDI is a modification of DA conceived by Mardaljevic and Nabil in 2005 [32,33]. UDI is defined as the annual occurrence of daylight illuminances across the work plane where the illuminances are within the range of 100–2000 lux, and are within a range considered “useful” by occupants [33]. The authors compare UDI as measuring excessive levels of illuminance which might cause glare, and which is ultimately targeted for a human factors-based metric, against DA, which is often used for minimizing artificial illuminance level [32,34].
As tools for parametric design and indoor lighting analysis, Grasshopper and DIVA are used [15] to devise alternatives by inputting different probable variations of façade shading types in relation to façade orientation. Grasshopper is a graphical algorithm editor that is a plug-in for Rhinoceros. Rhino (Rhinoceros) is a 3-dimensional (3D) Non-Uniform Rational Basis Spline (NURBS) modeler developed and distributed by McNeel. Grasshopper allows a designer or 3D modeler to program Rhino modeling. DIVA is one of Grasshopper’s add-ons, which helps Grasshopper to conduct sustainability simulations such as daylight using Radiance open source tools [35].
Grasshopper is an effective parametric tool, especially when calculating a large number of cases, in this case 1,400 tries. It is utilized to access the relationships between input and output parameters after constructing algorithms. DIVA is an add-on program of Grasshopper, which can be applied to analyze DA and UDI. Thus, the principle and procedure of the simulation process is shown in Figure 3. The base model is drawn in Rhino and this information transfer into Grasshopper and (1) alternative modeling; (2) simulation; and (3) data sorting is performed through automation.
For the simulation, an algorithm is created to make shading combinations with three parameters, and each alternative takes about five minutes of lighting environment simulation time. Each louver has 200 alternatives, requiring a total of 1000 minutes of simulation time. Thus, it is more time-efficient than adjusting the variables manually.

2.3. Façade Shading Types and Input Parameters

As simulation alternatives, seven façade shading types: vertical louver, horizontal louver, eggcrate louver, overhang, vertical louver slat, horizontal louver slat, and light shelf were tested. In addition, the louver variation parameters consisting of count (number of shading devices), depth, direction (orientation), and angle are shown in Table 2 and Table 3. There are vertical-installed façade shading types; vertical louver and vertical slat and horizontal façade shading types; horizontal louver and horizontal slat. The main difference between the vertical, horizontal, and eggcrate louver, and the overhang, vertical slat louver, horizontal slat louver and light shelf is that the former group has variation in the louver depth, whereas the latter group modifies the angle of the shading.
Façade shading changes are based on the modification of parameters such as count, depth, and angle. When determining the criteria, we changed the parameter for the louver design based on the DA and UDI values in each direction (orientation) per louver. More specifically, the input parameter’s variable ranges were selected so that the difference between the DA average value and the baseline value ranges from 2% to 30% in each azimuth orientation. The baseline DA value without shading is used as the common platform for the variation of each variable such as the angle, count, and depth. Therefore, each shading type has different parameter variable values. Accordingly, rather than comparing the absolute mean values between different shading types, we have applied the relative comparison within each shading for the main study. In terms of the number of sets, there are two types of parameters. There are eight different types of direction (orientation) and two parameters depending on shading type in terms of shape such as the angle, count, and depth. These make 25 cases in each direction (orientation) and total 200 combinations of variables in each façade shading type. In terms of UDI values, 100 to 2000 lux was set to compare the effectiveness of shading on daylight based on previous research [36,37,38].

3. Result and Discussions

In this section, the results based on the simulation will be presented. Most of the results show that the DA values decrease and UDI values increase with the installation of the shading system. In addition, basic descriptions and abbreviated terms that this paper uses are listed below.
-
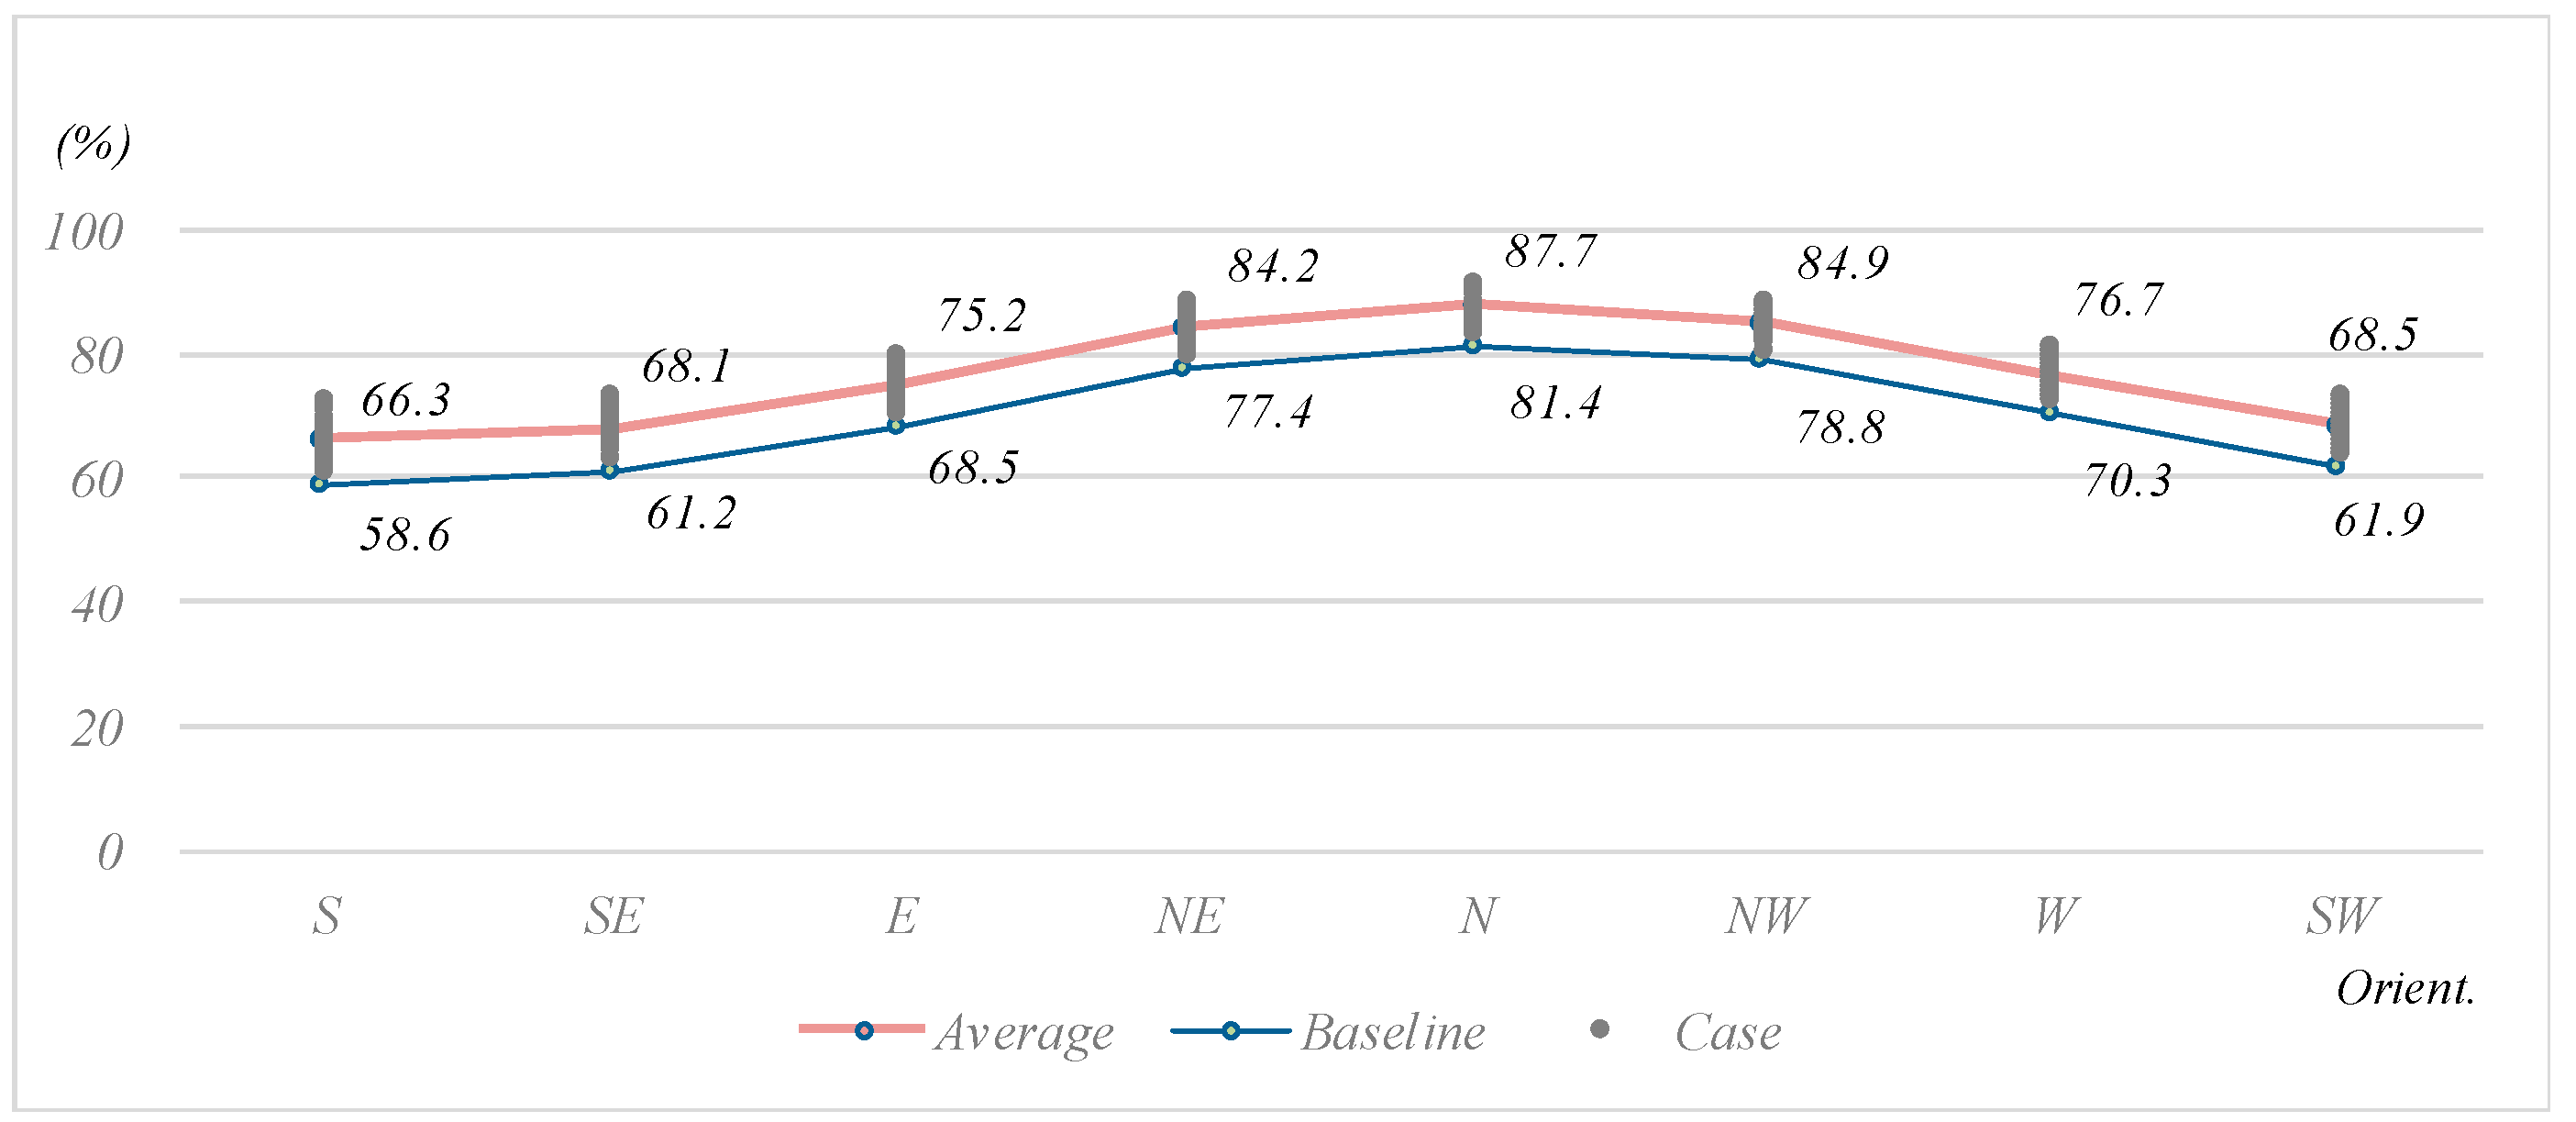
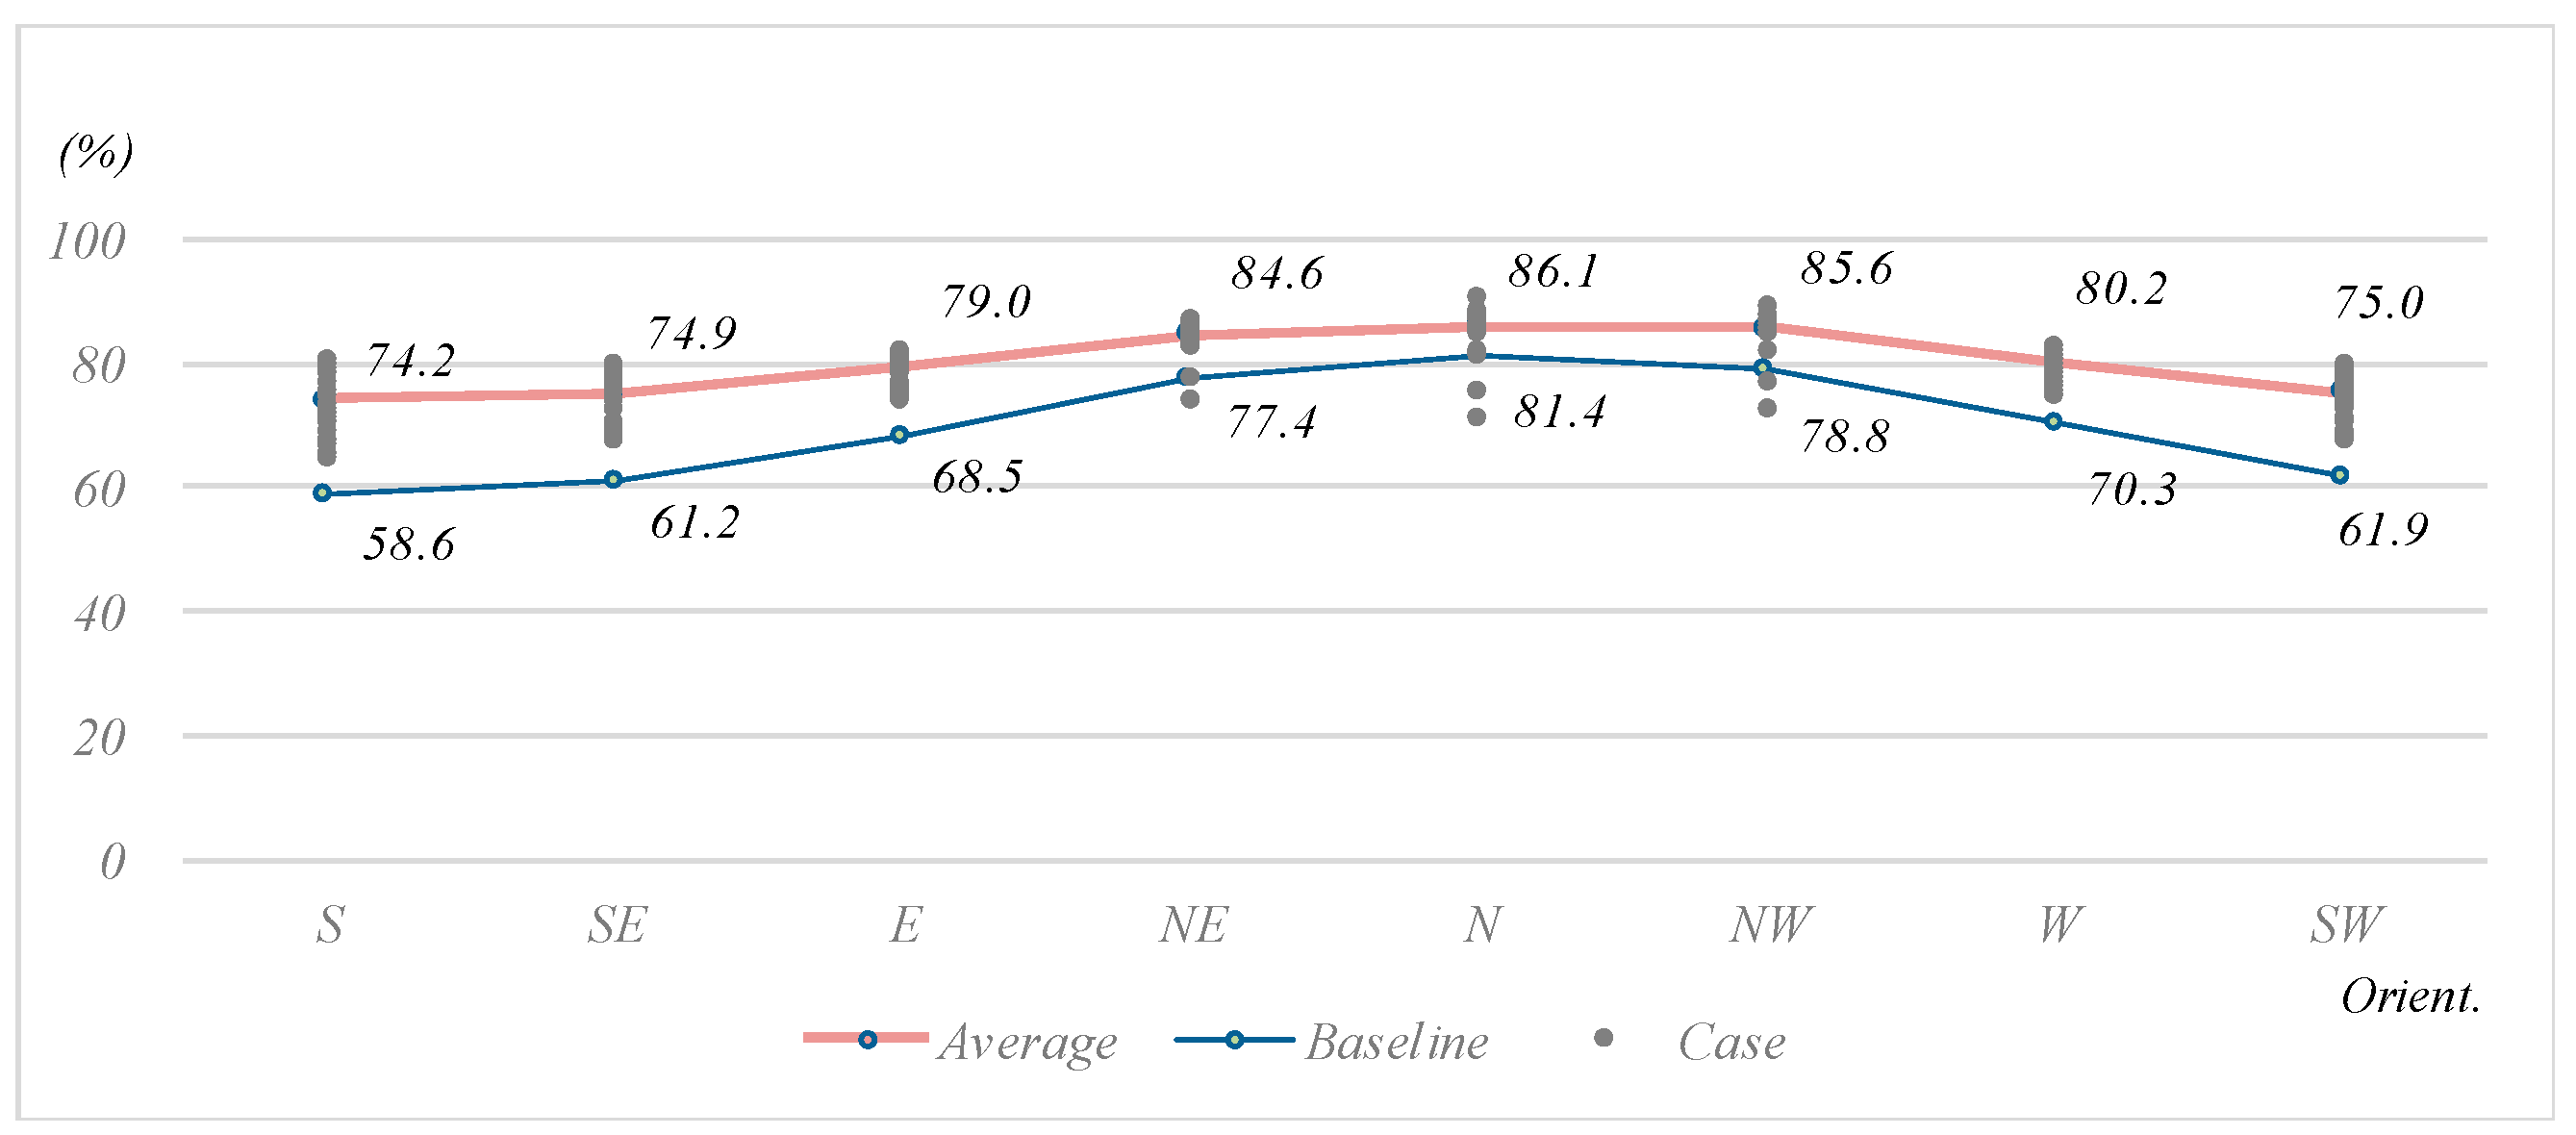
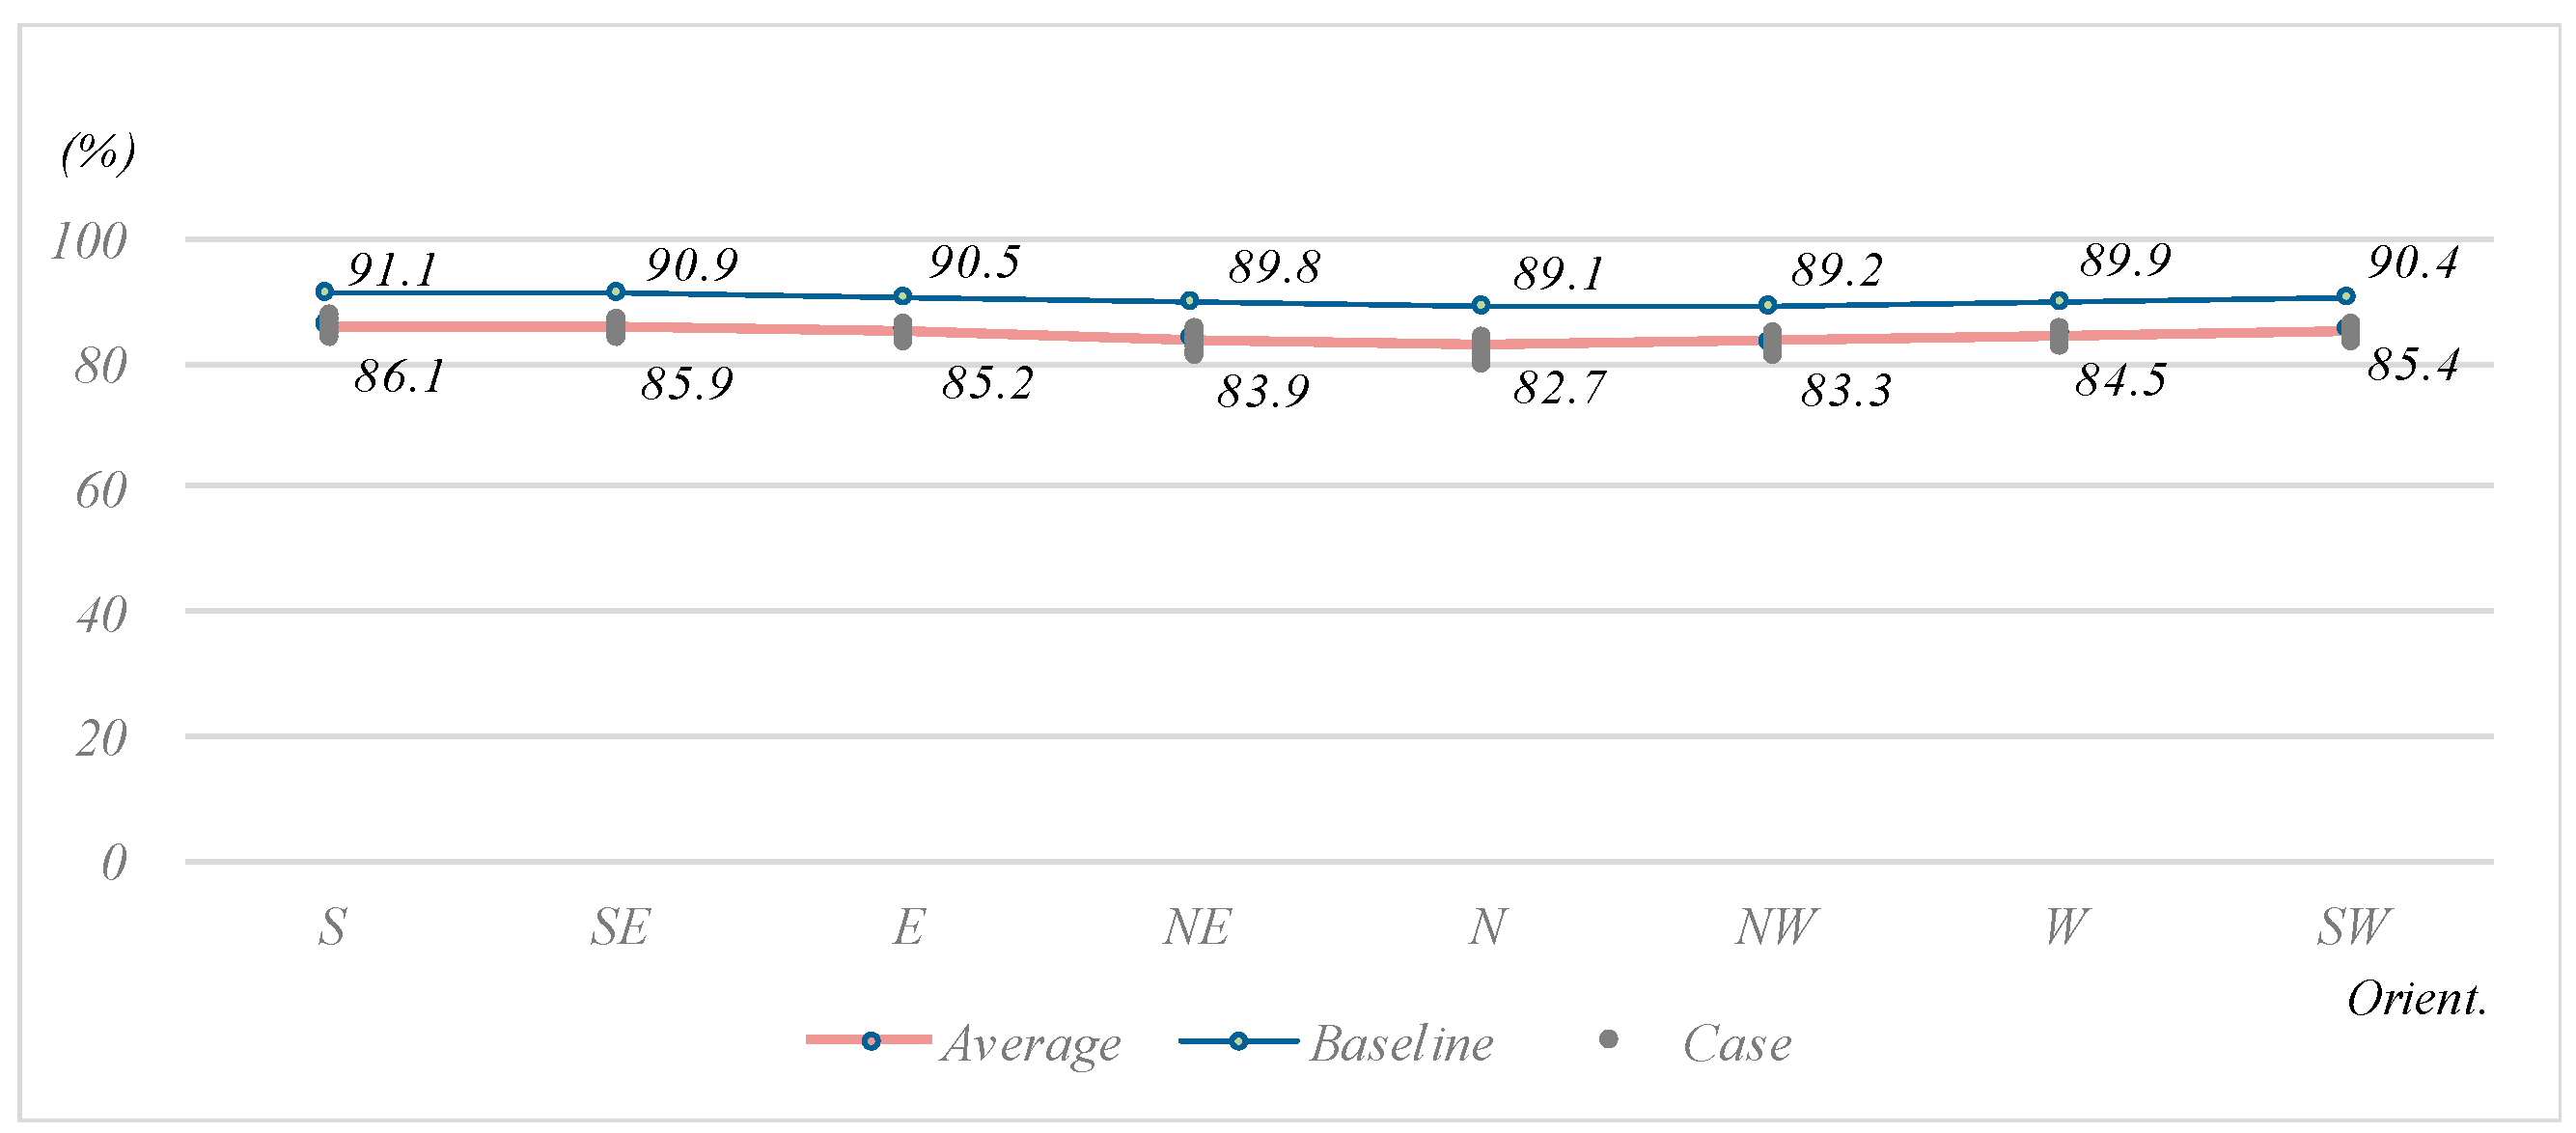
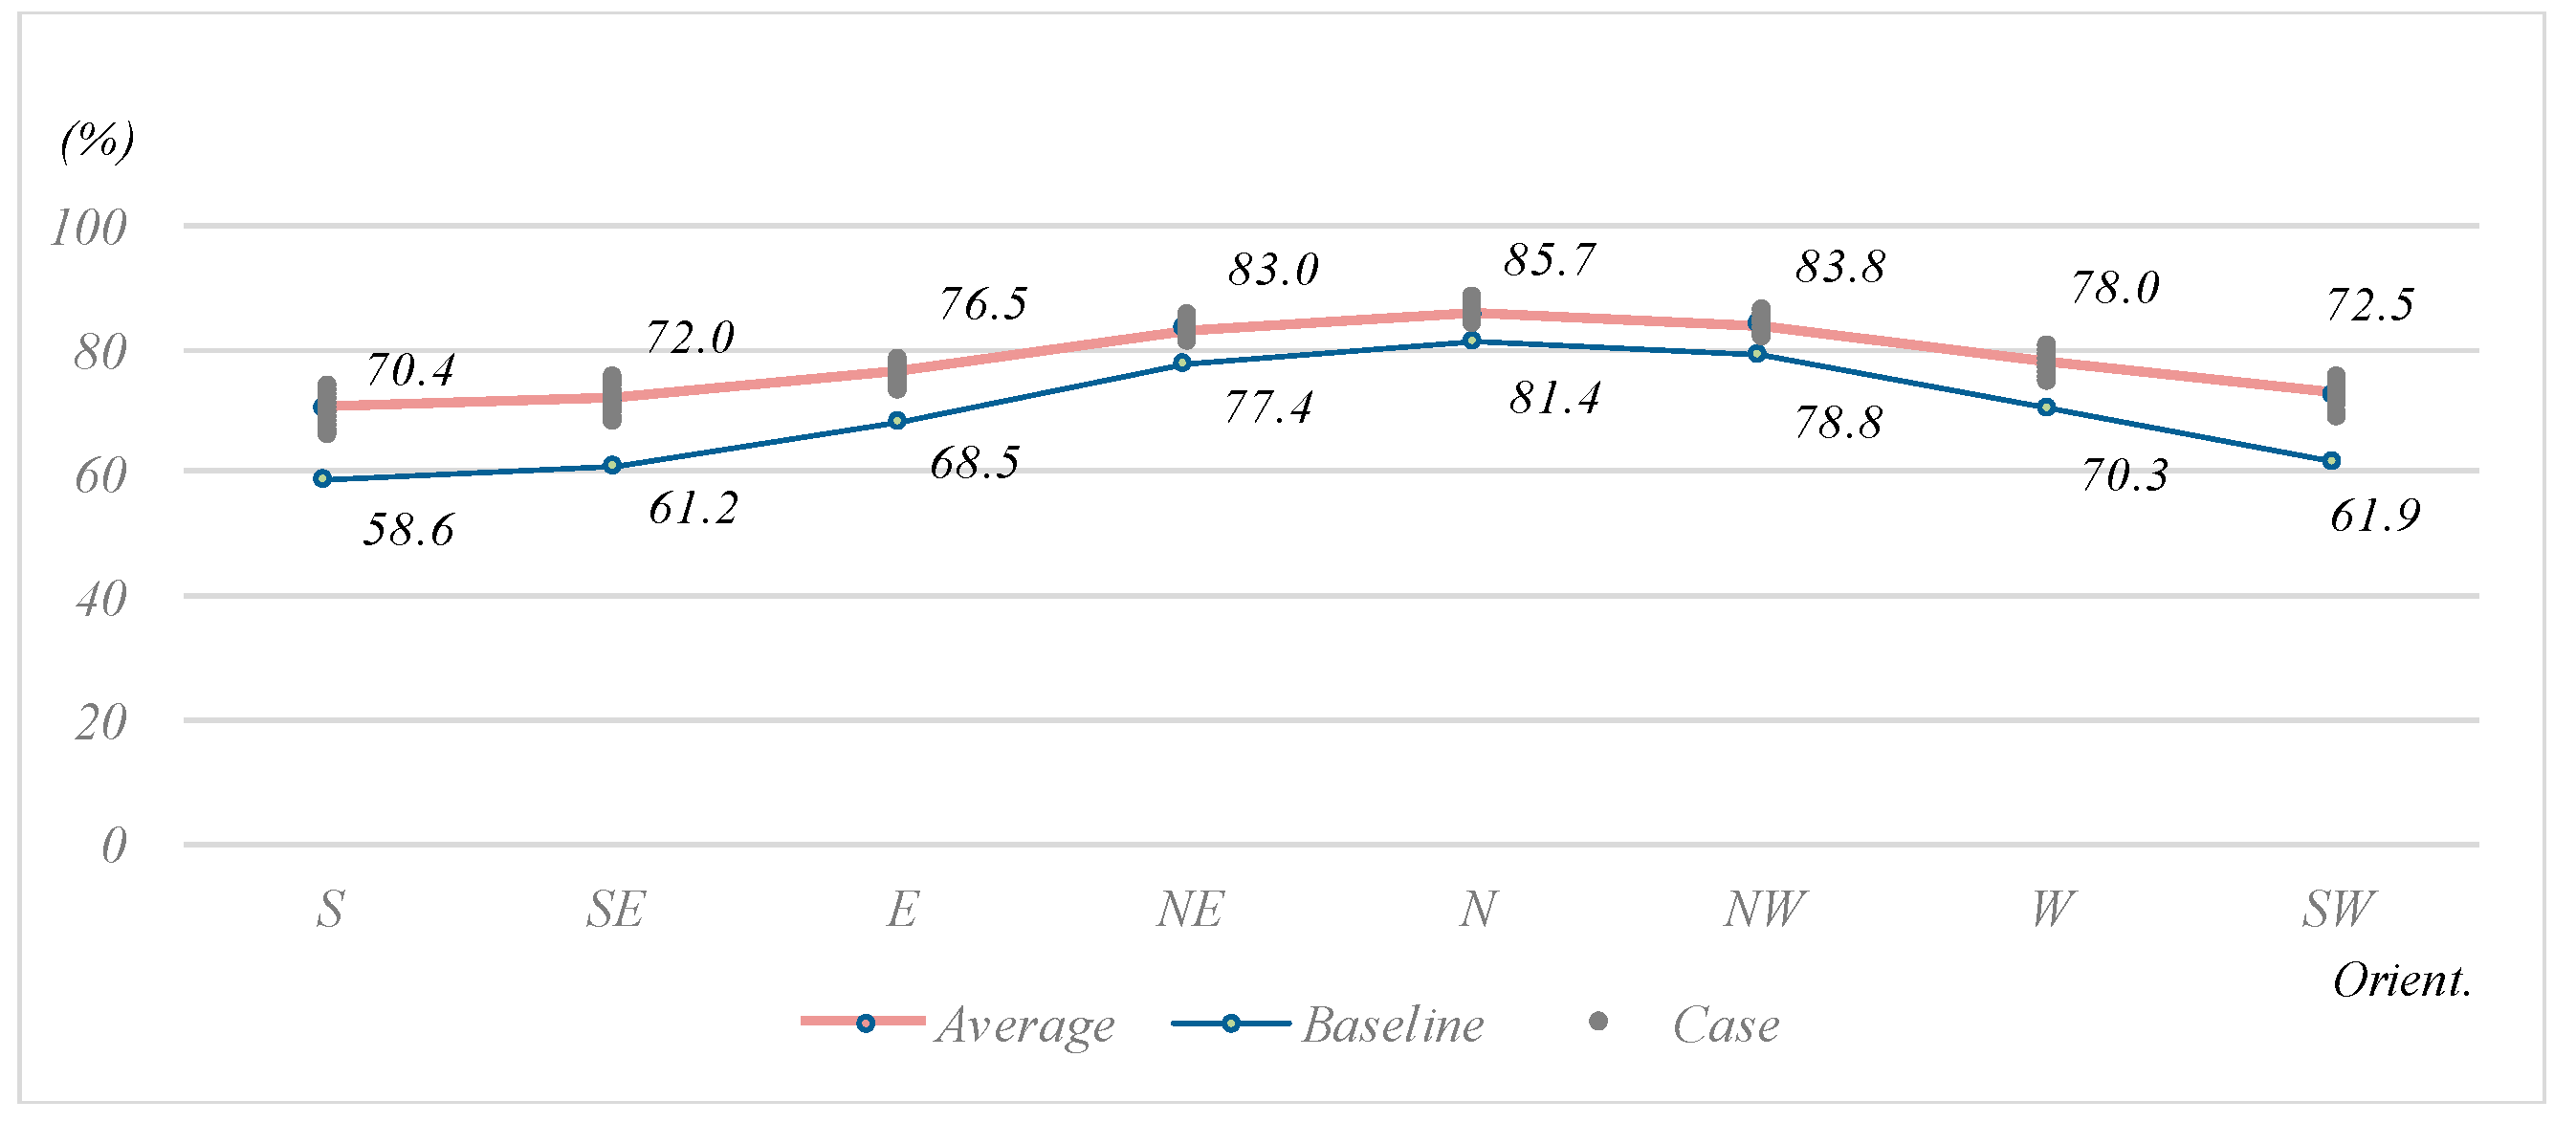
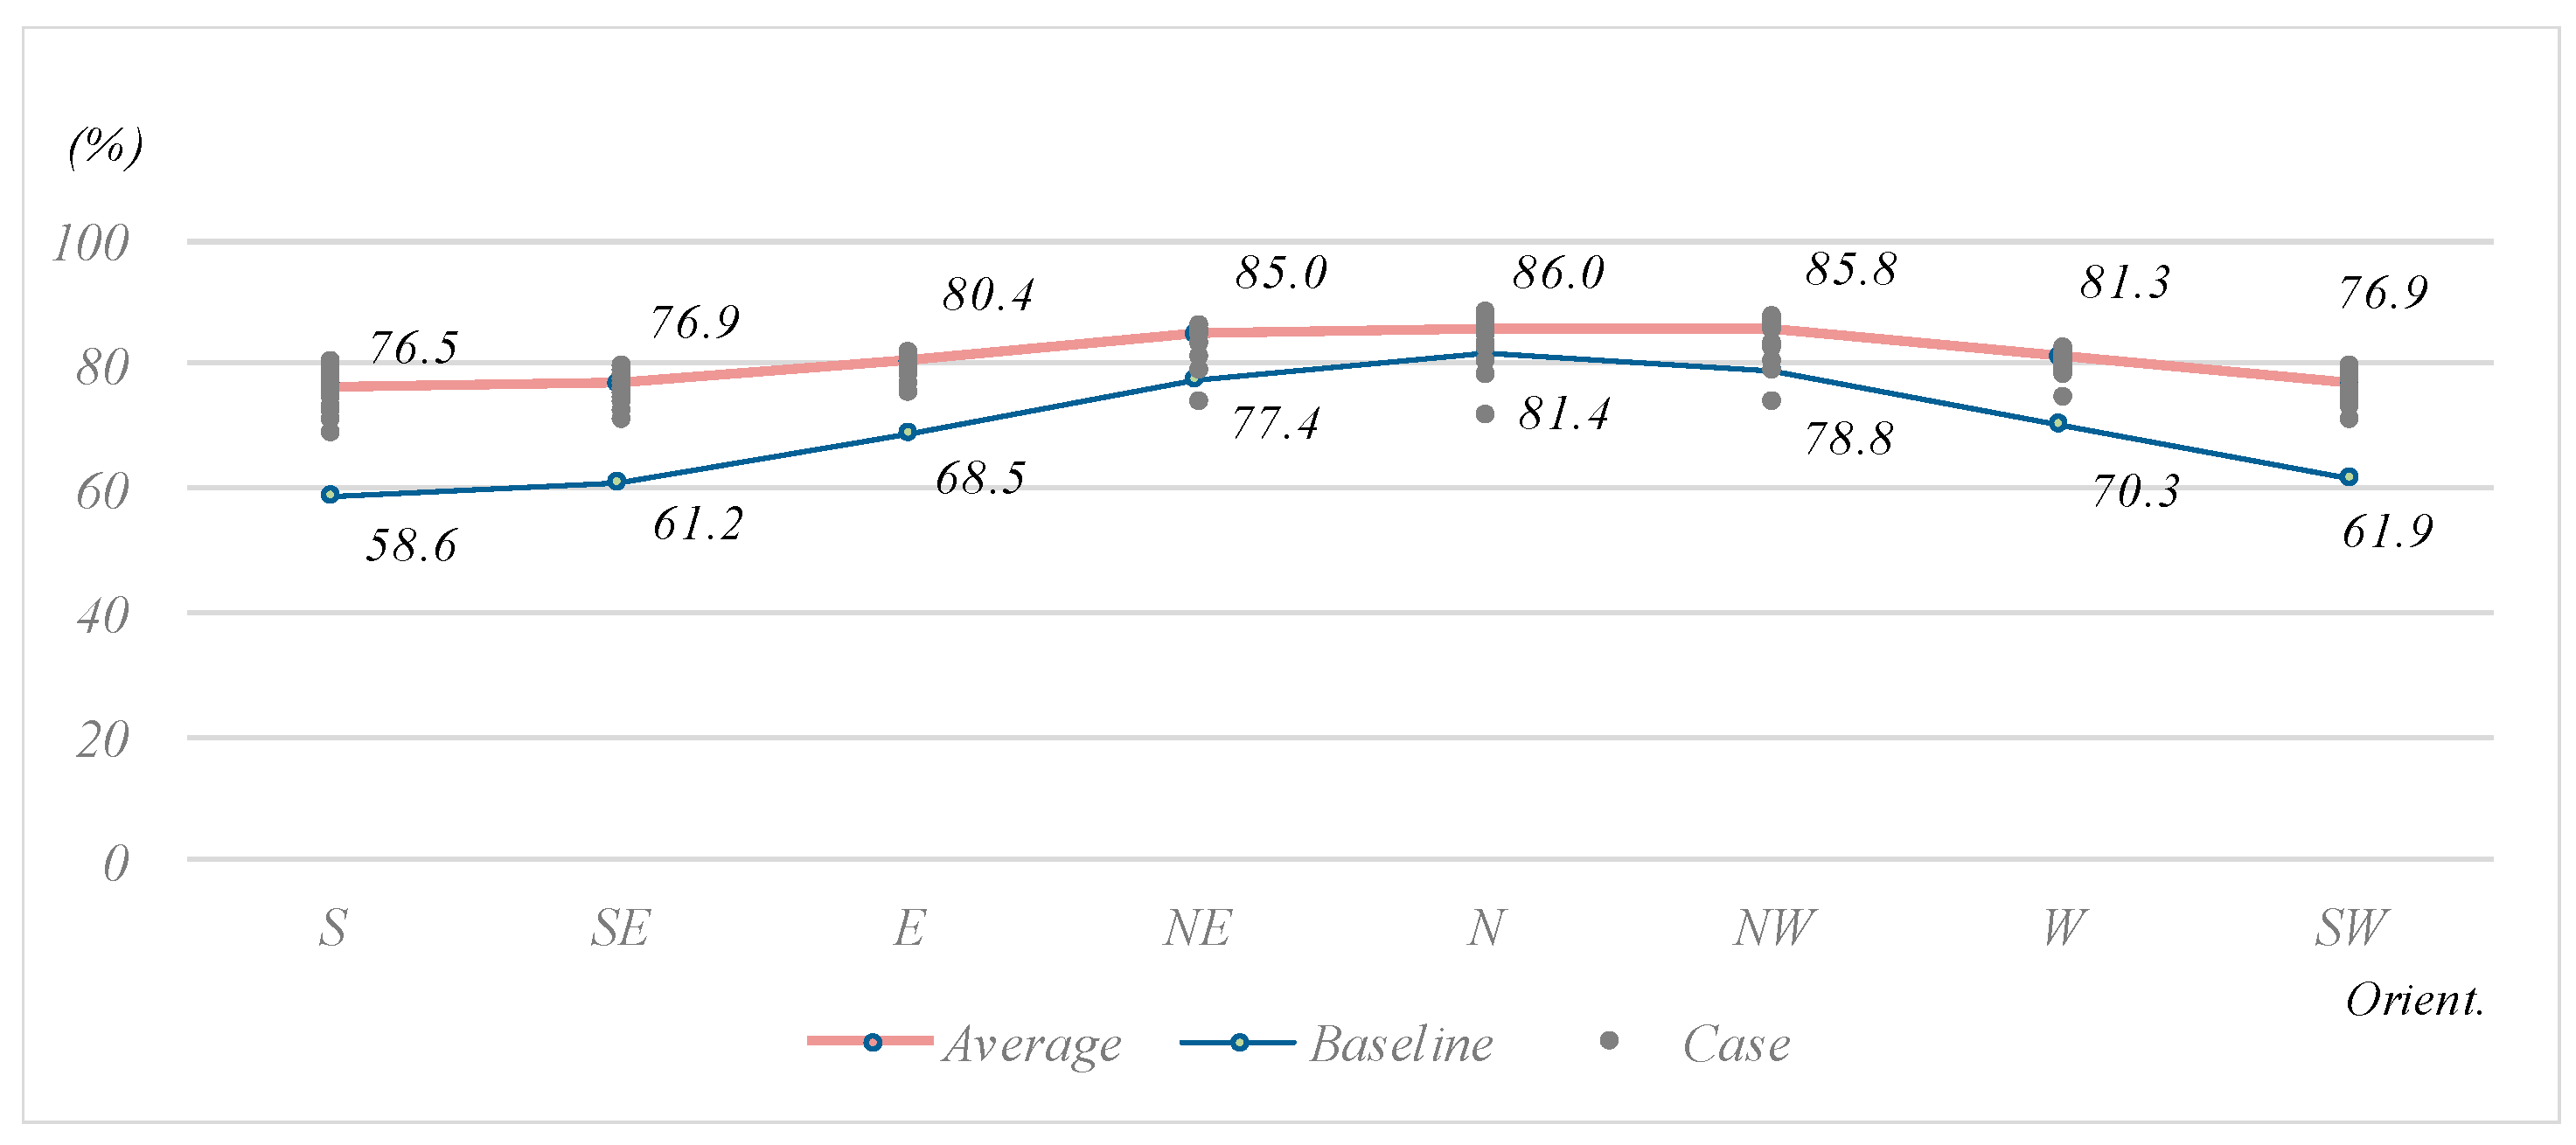
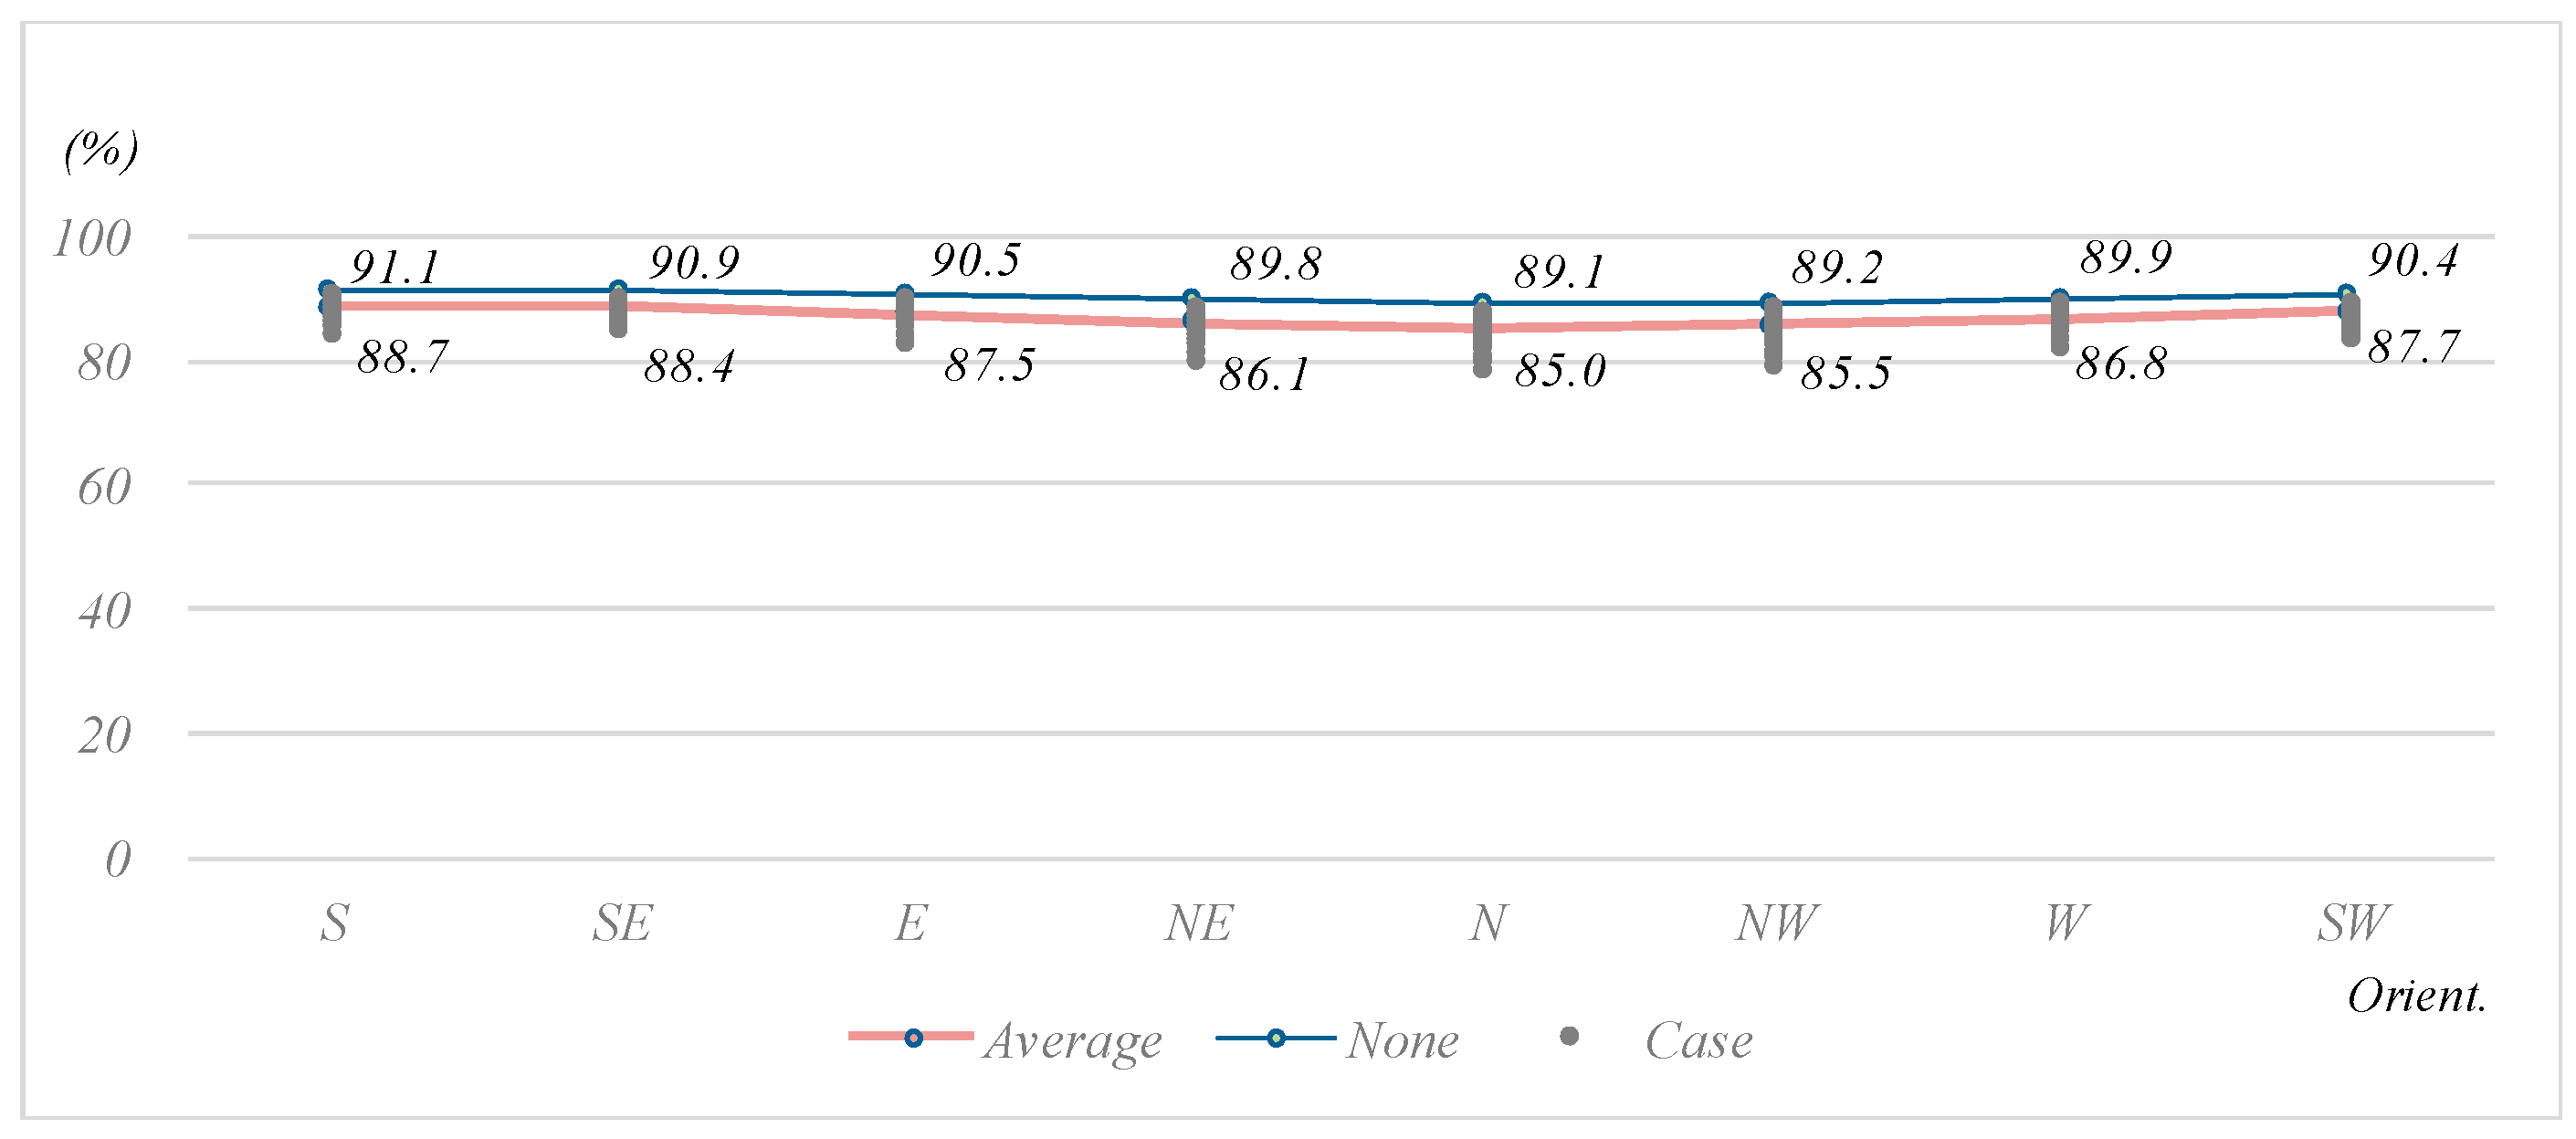
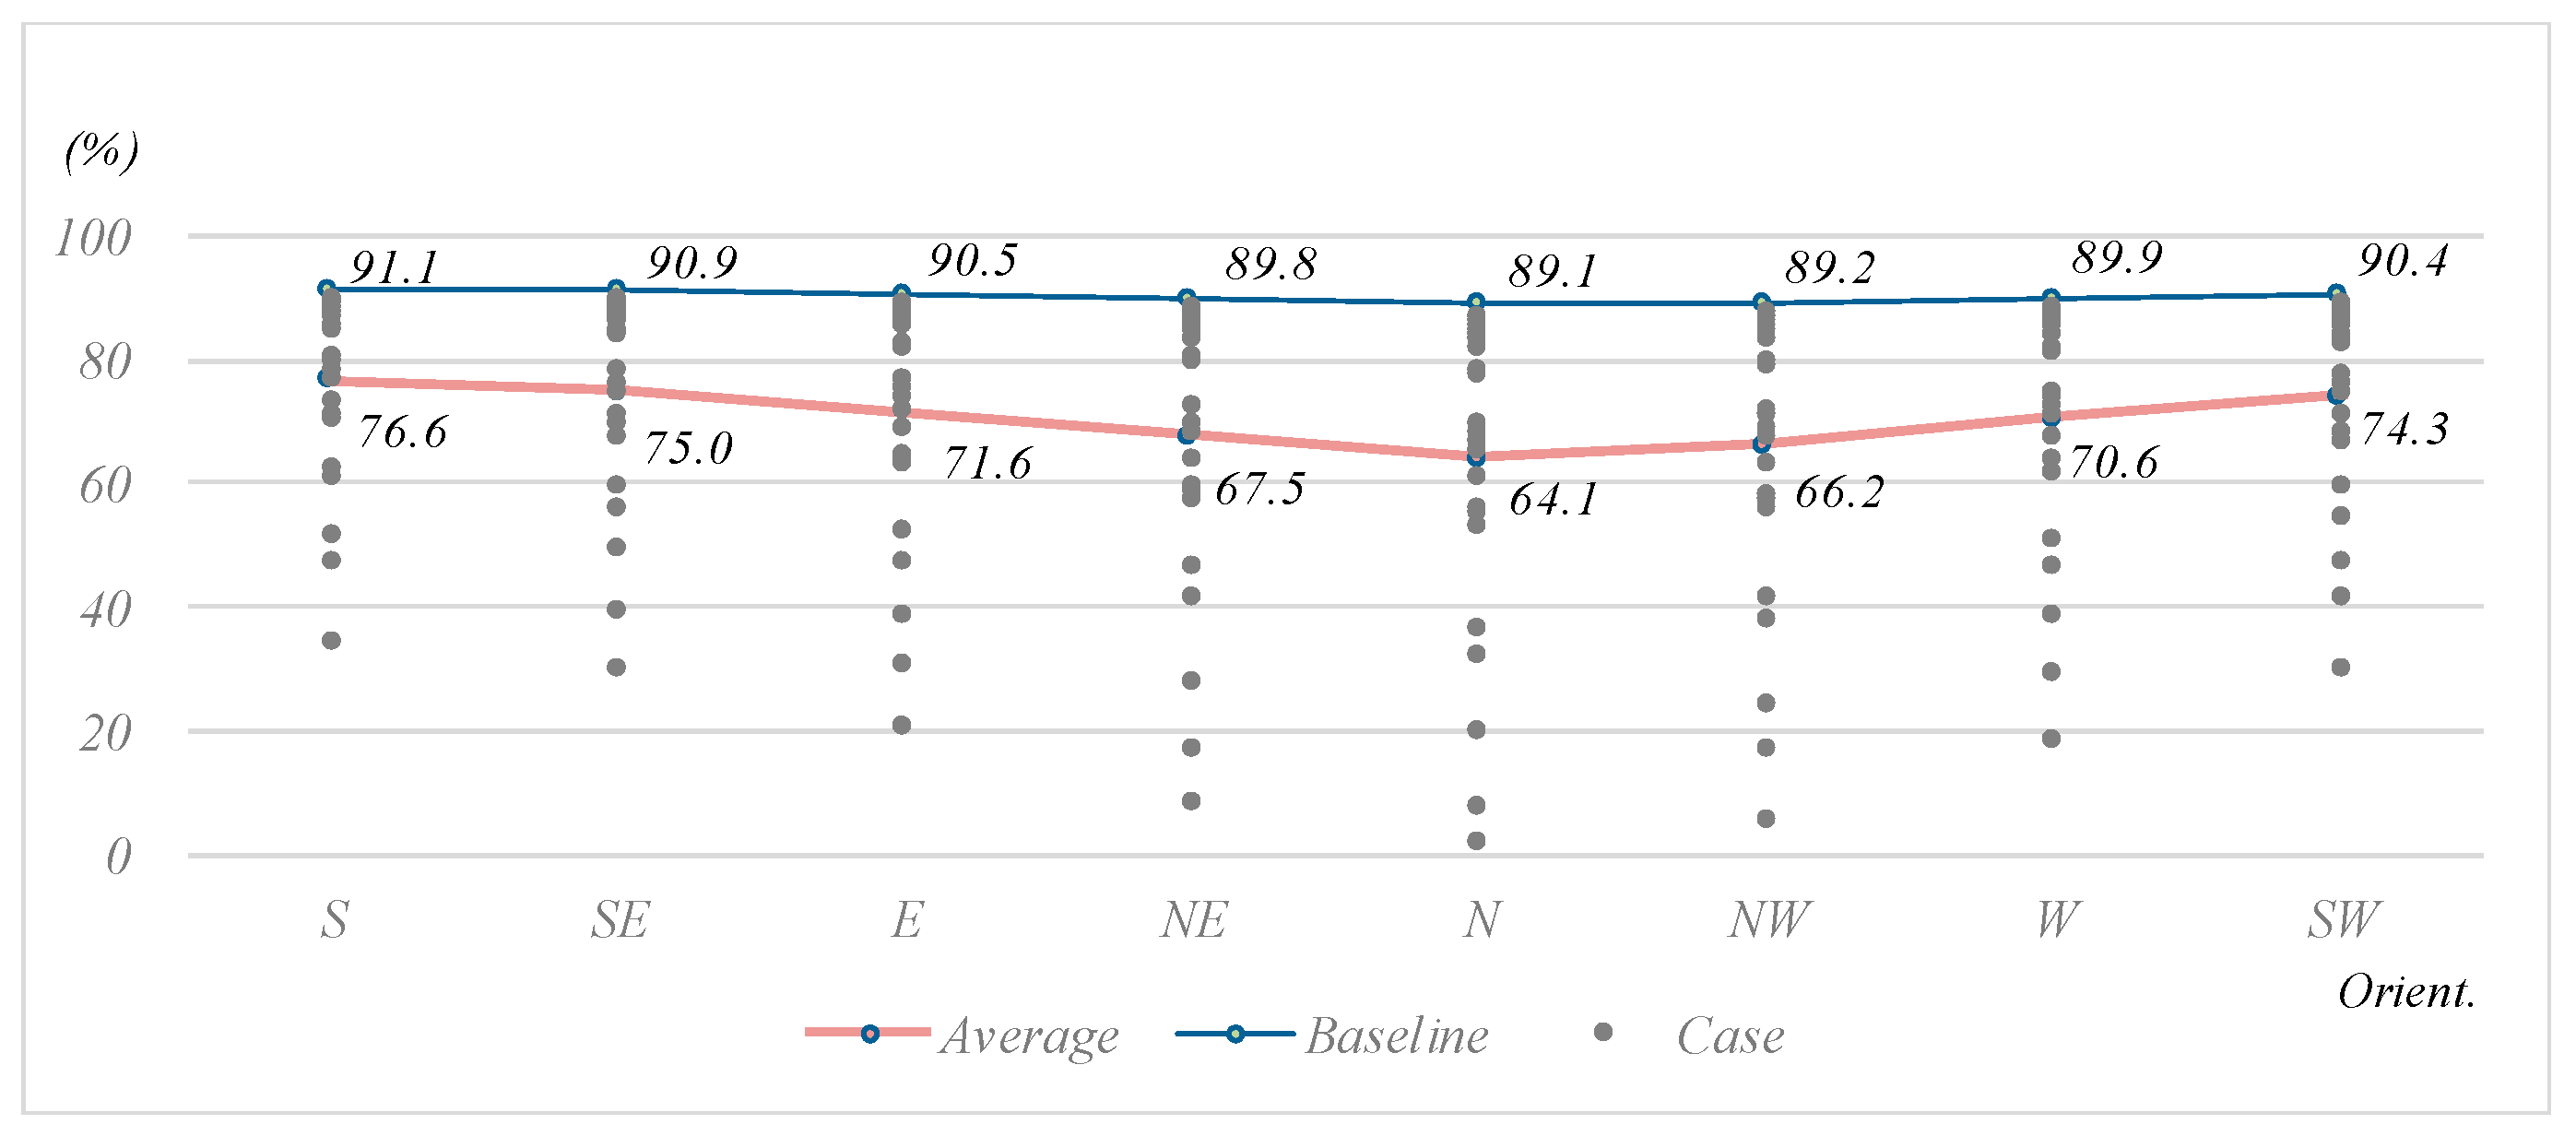
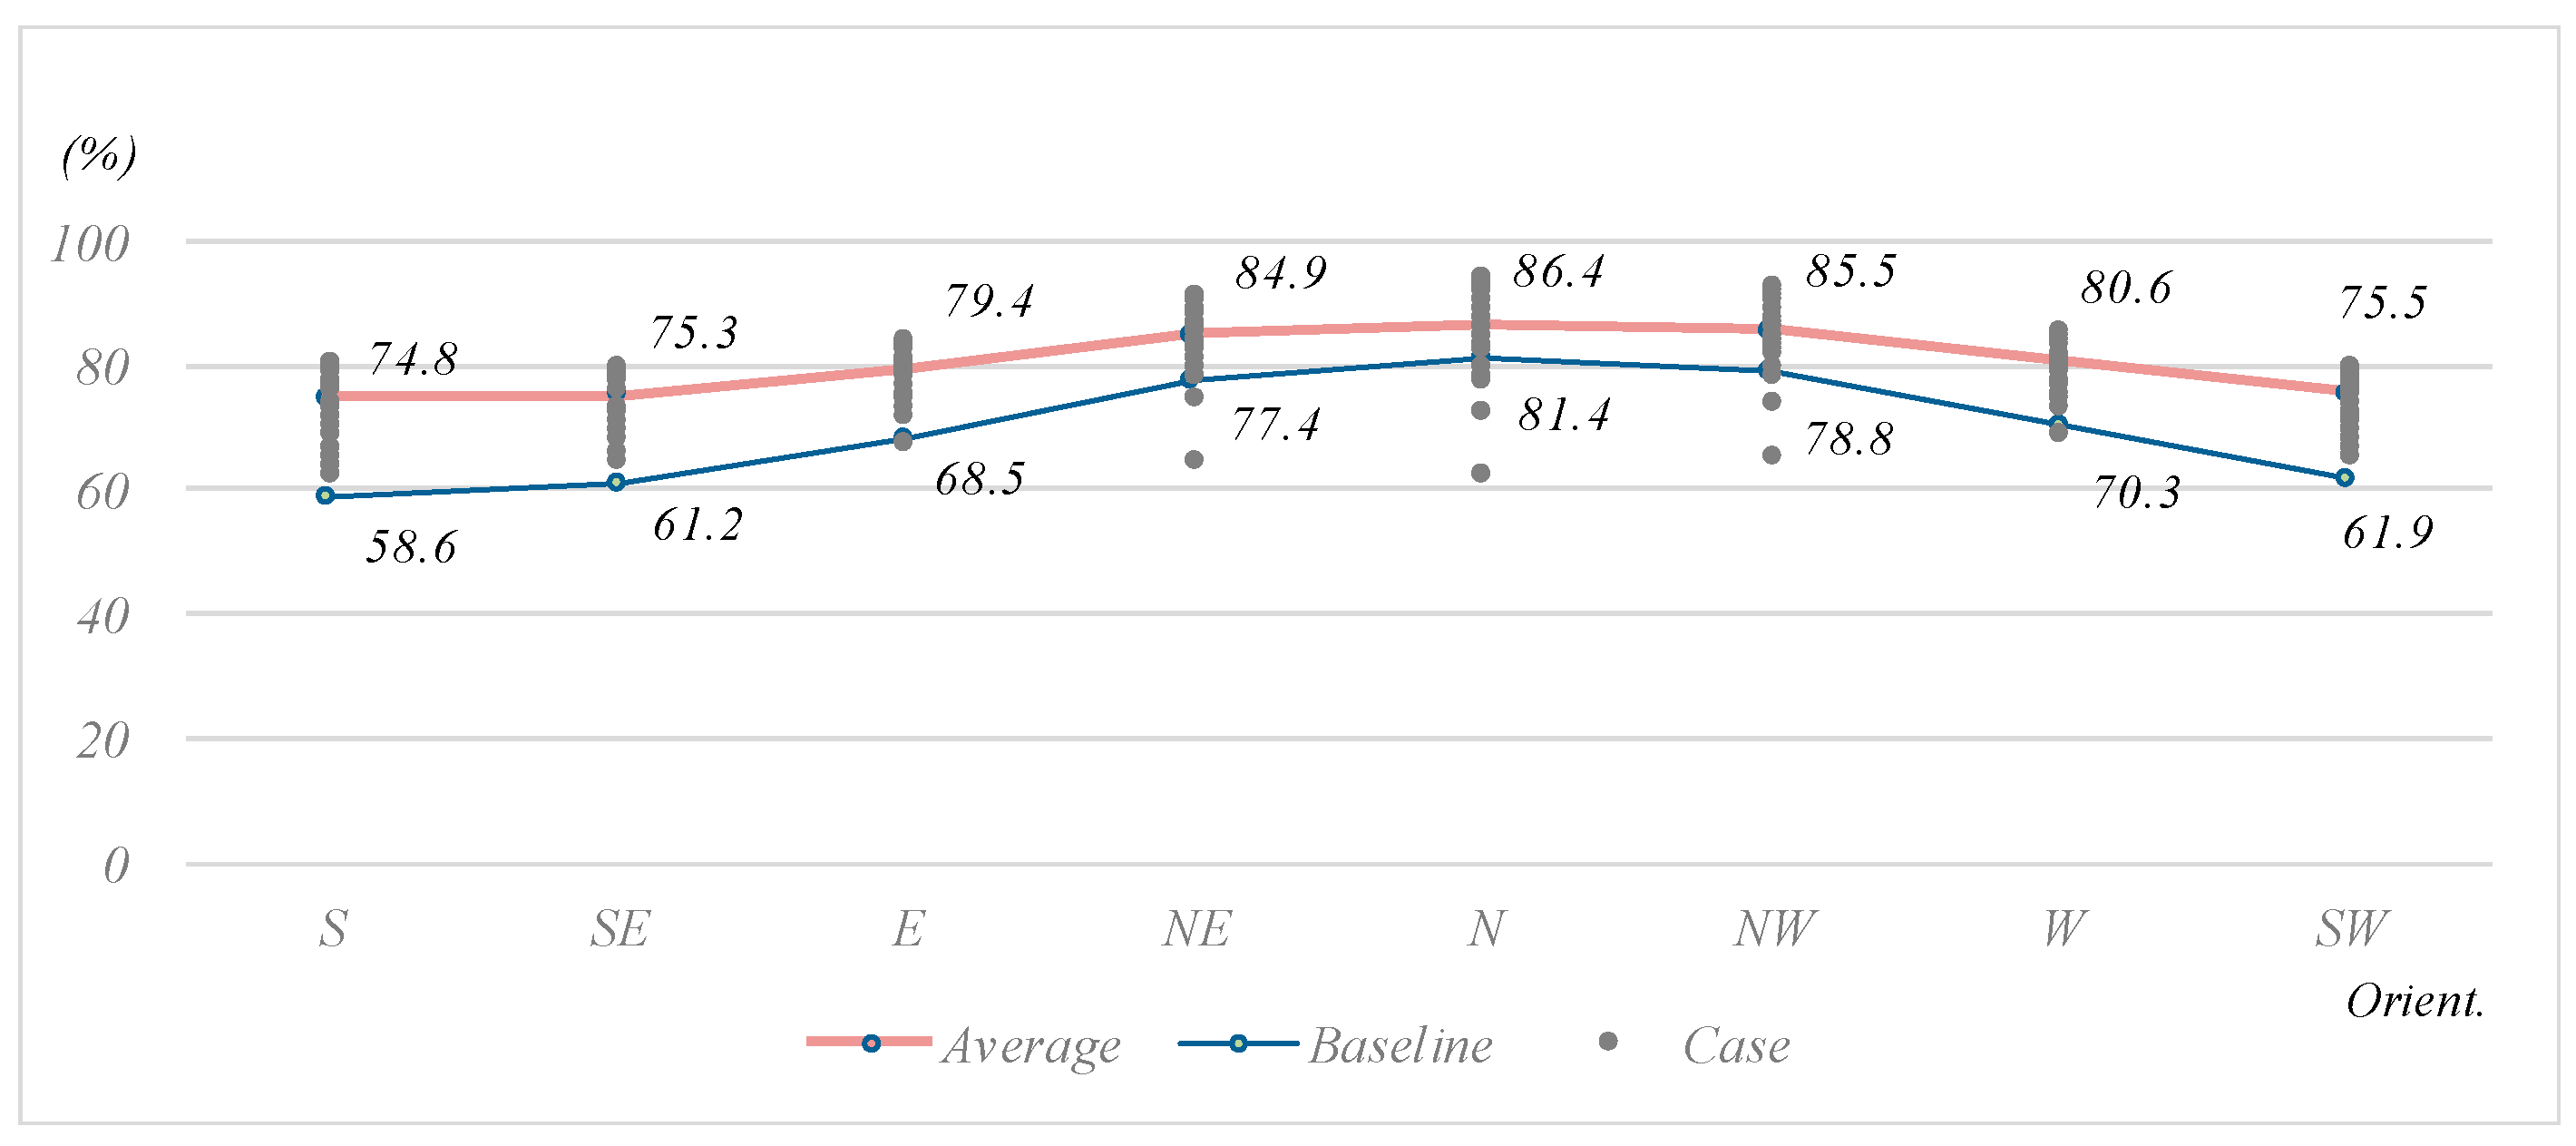
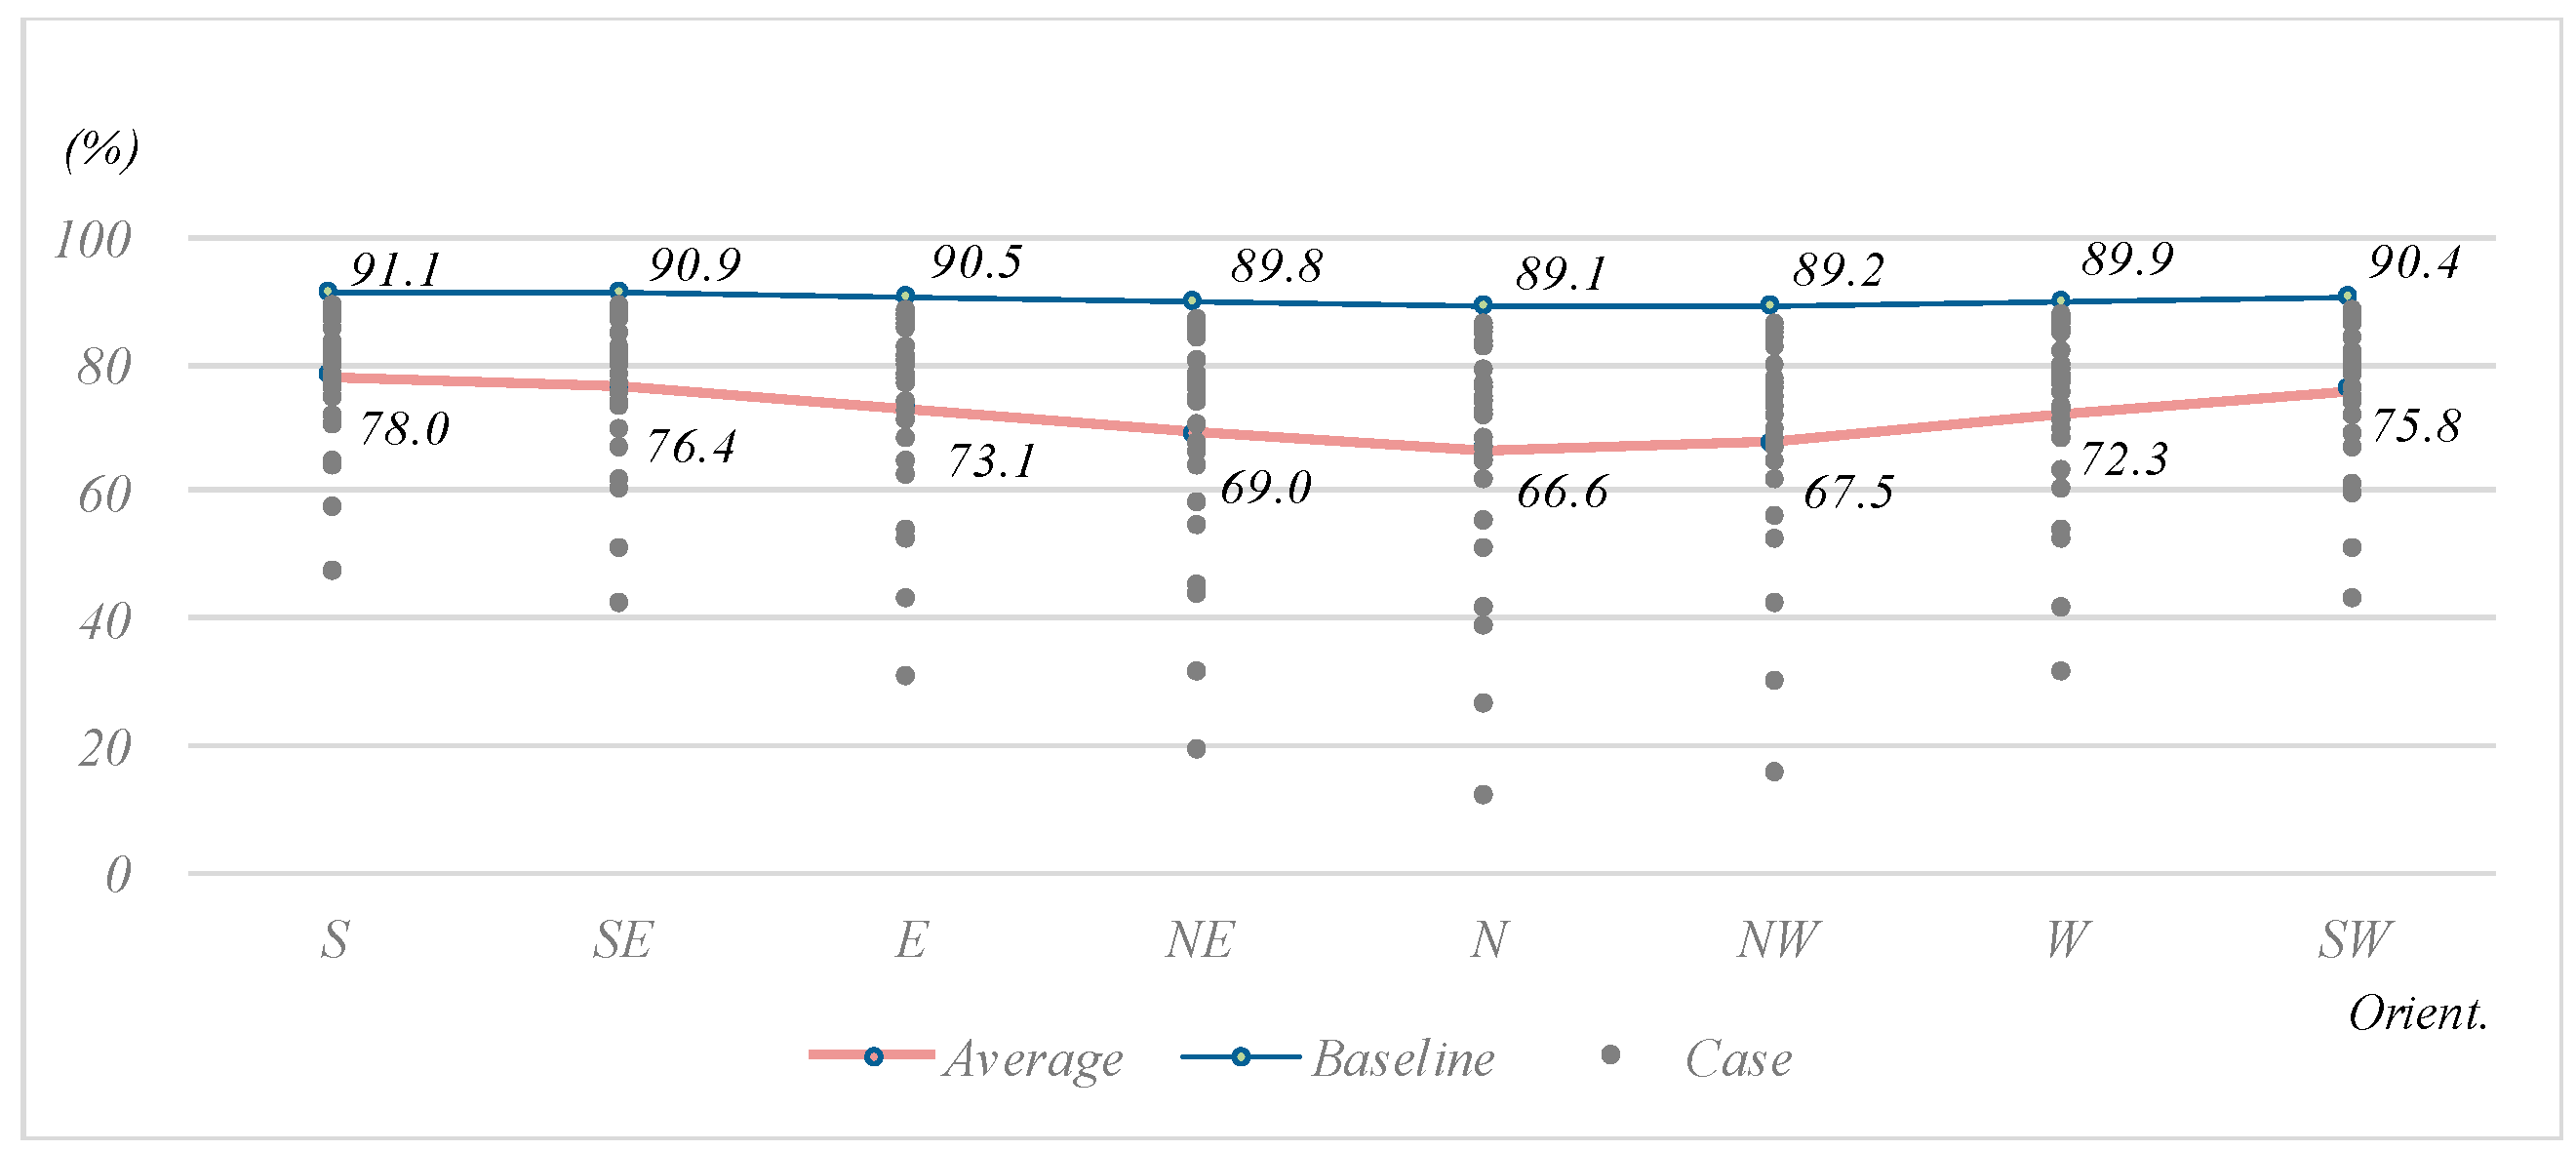
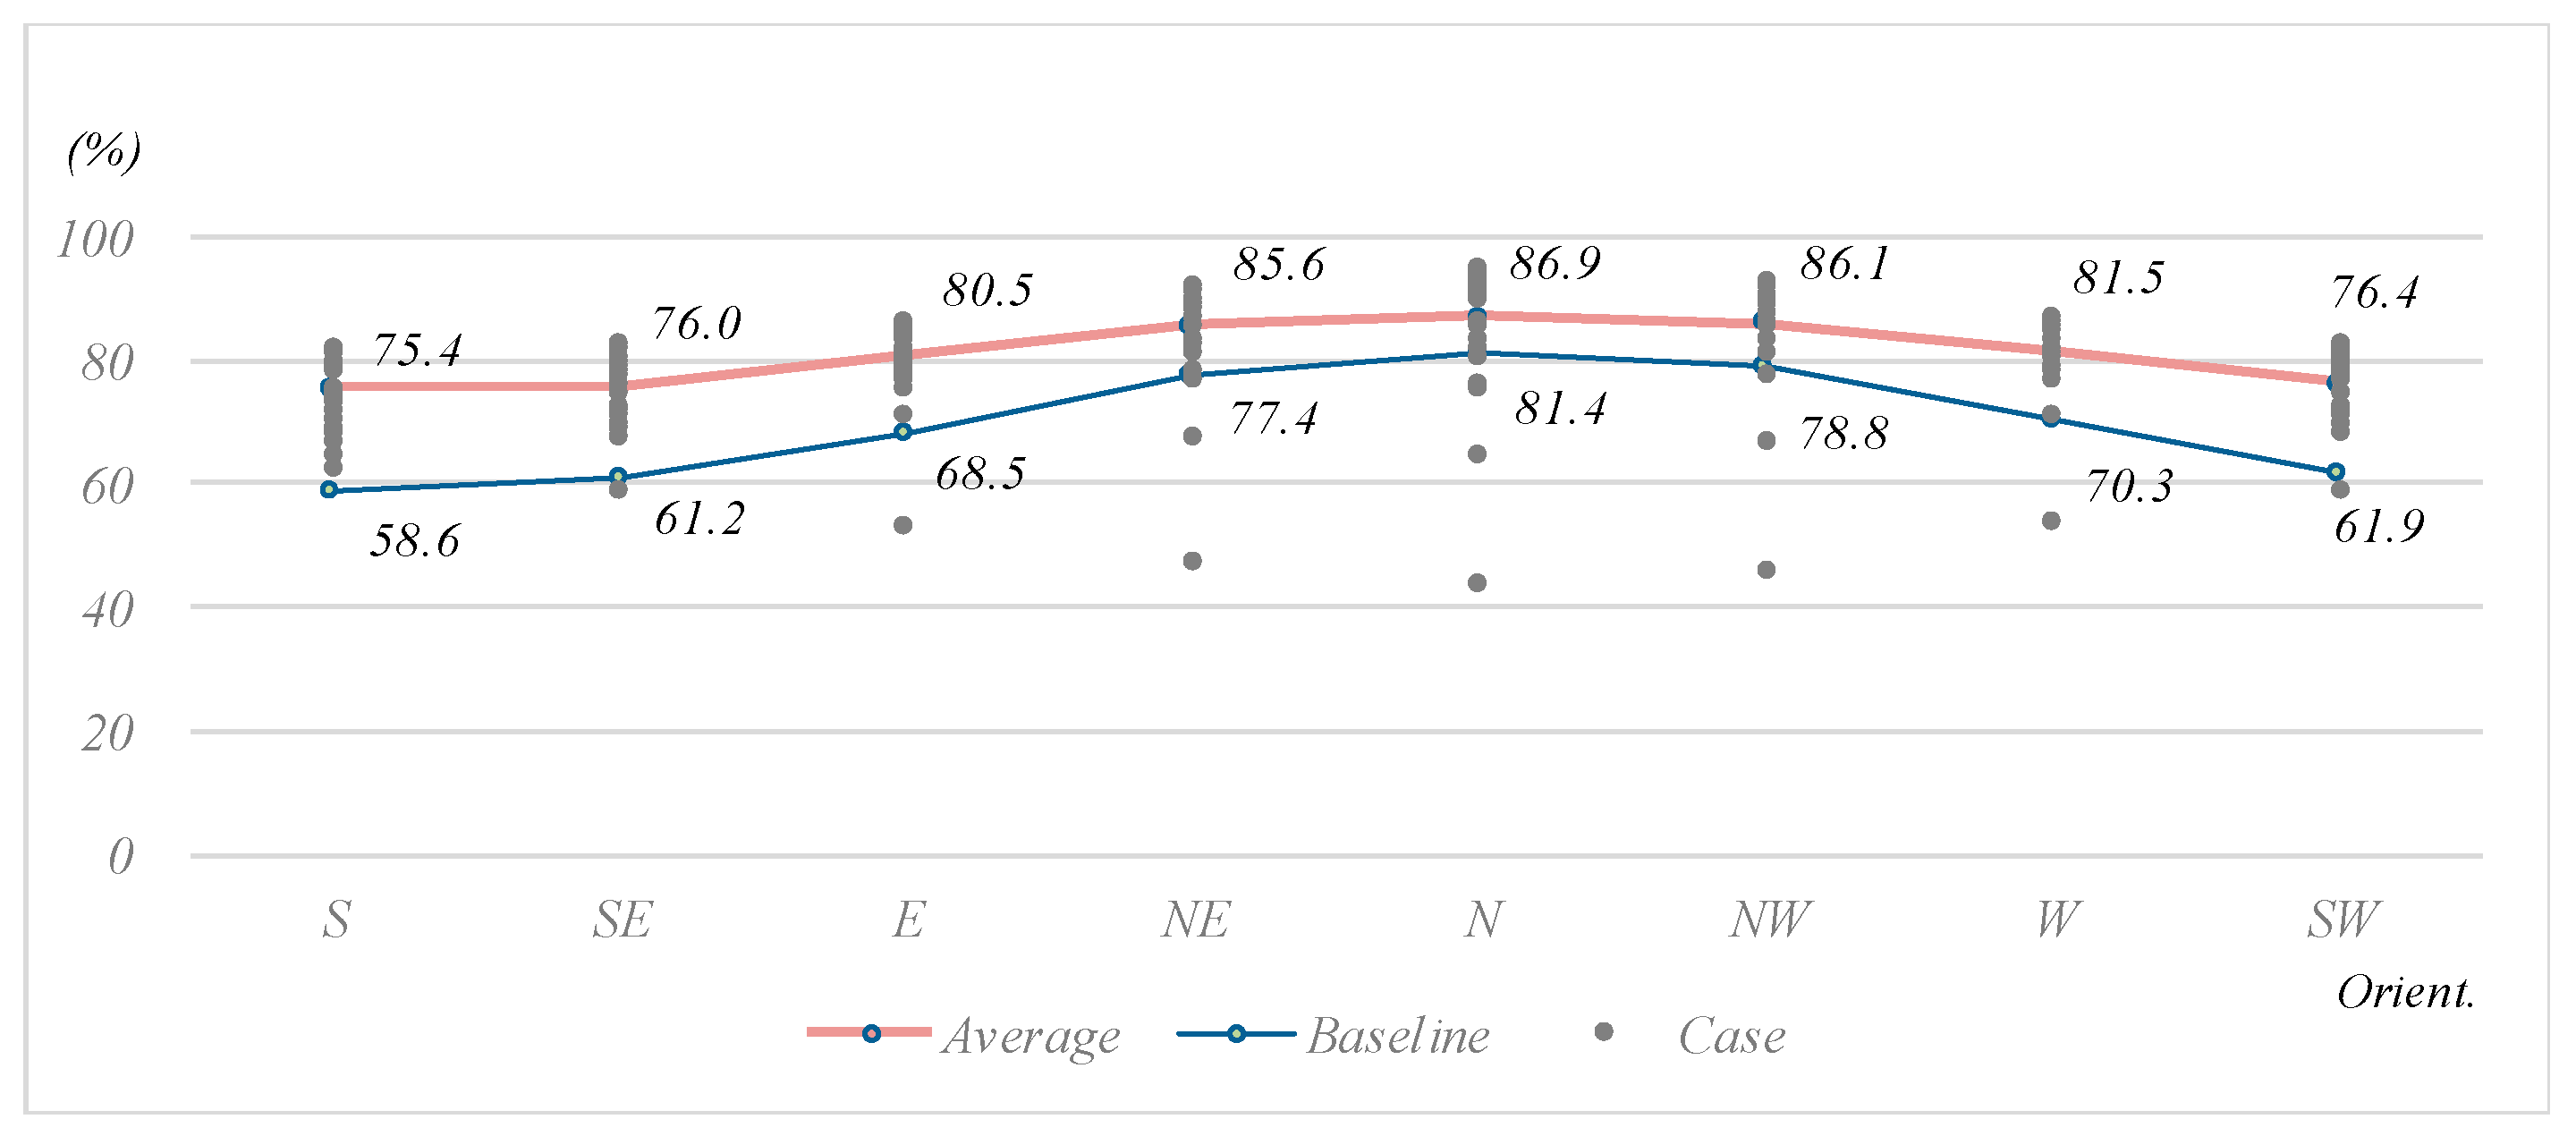
“Baseline”: the basic value of each simulation result without façade shading based on the azimuth orientation
-
“Case”: each 25 result values of each simulation based on the azimuth orientation and façade shading type
-
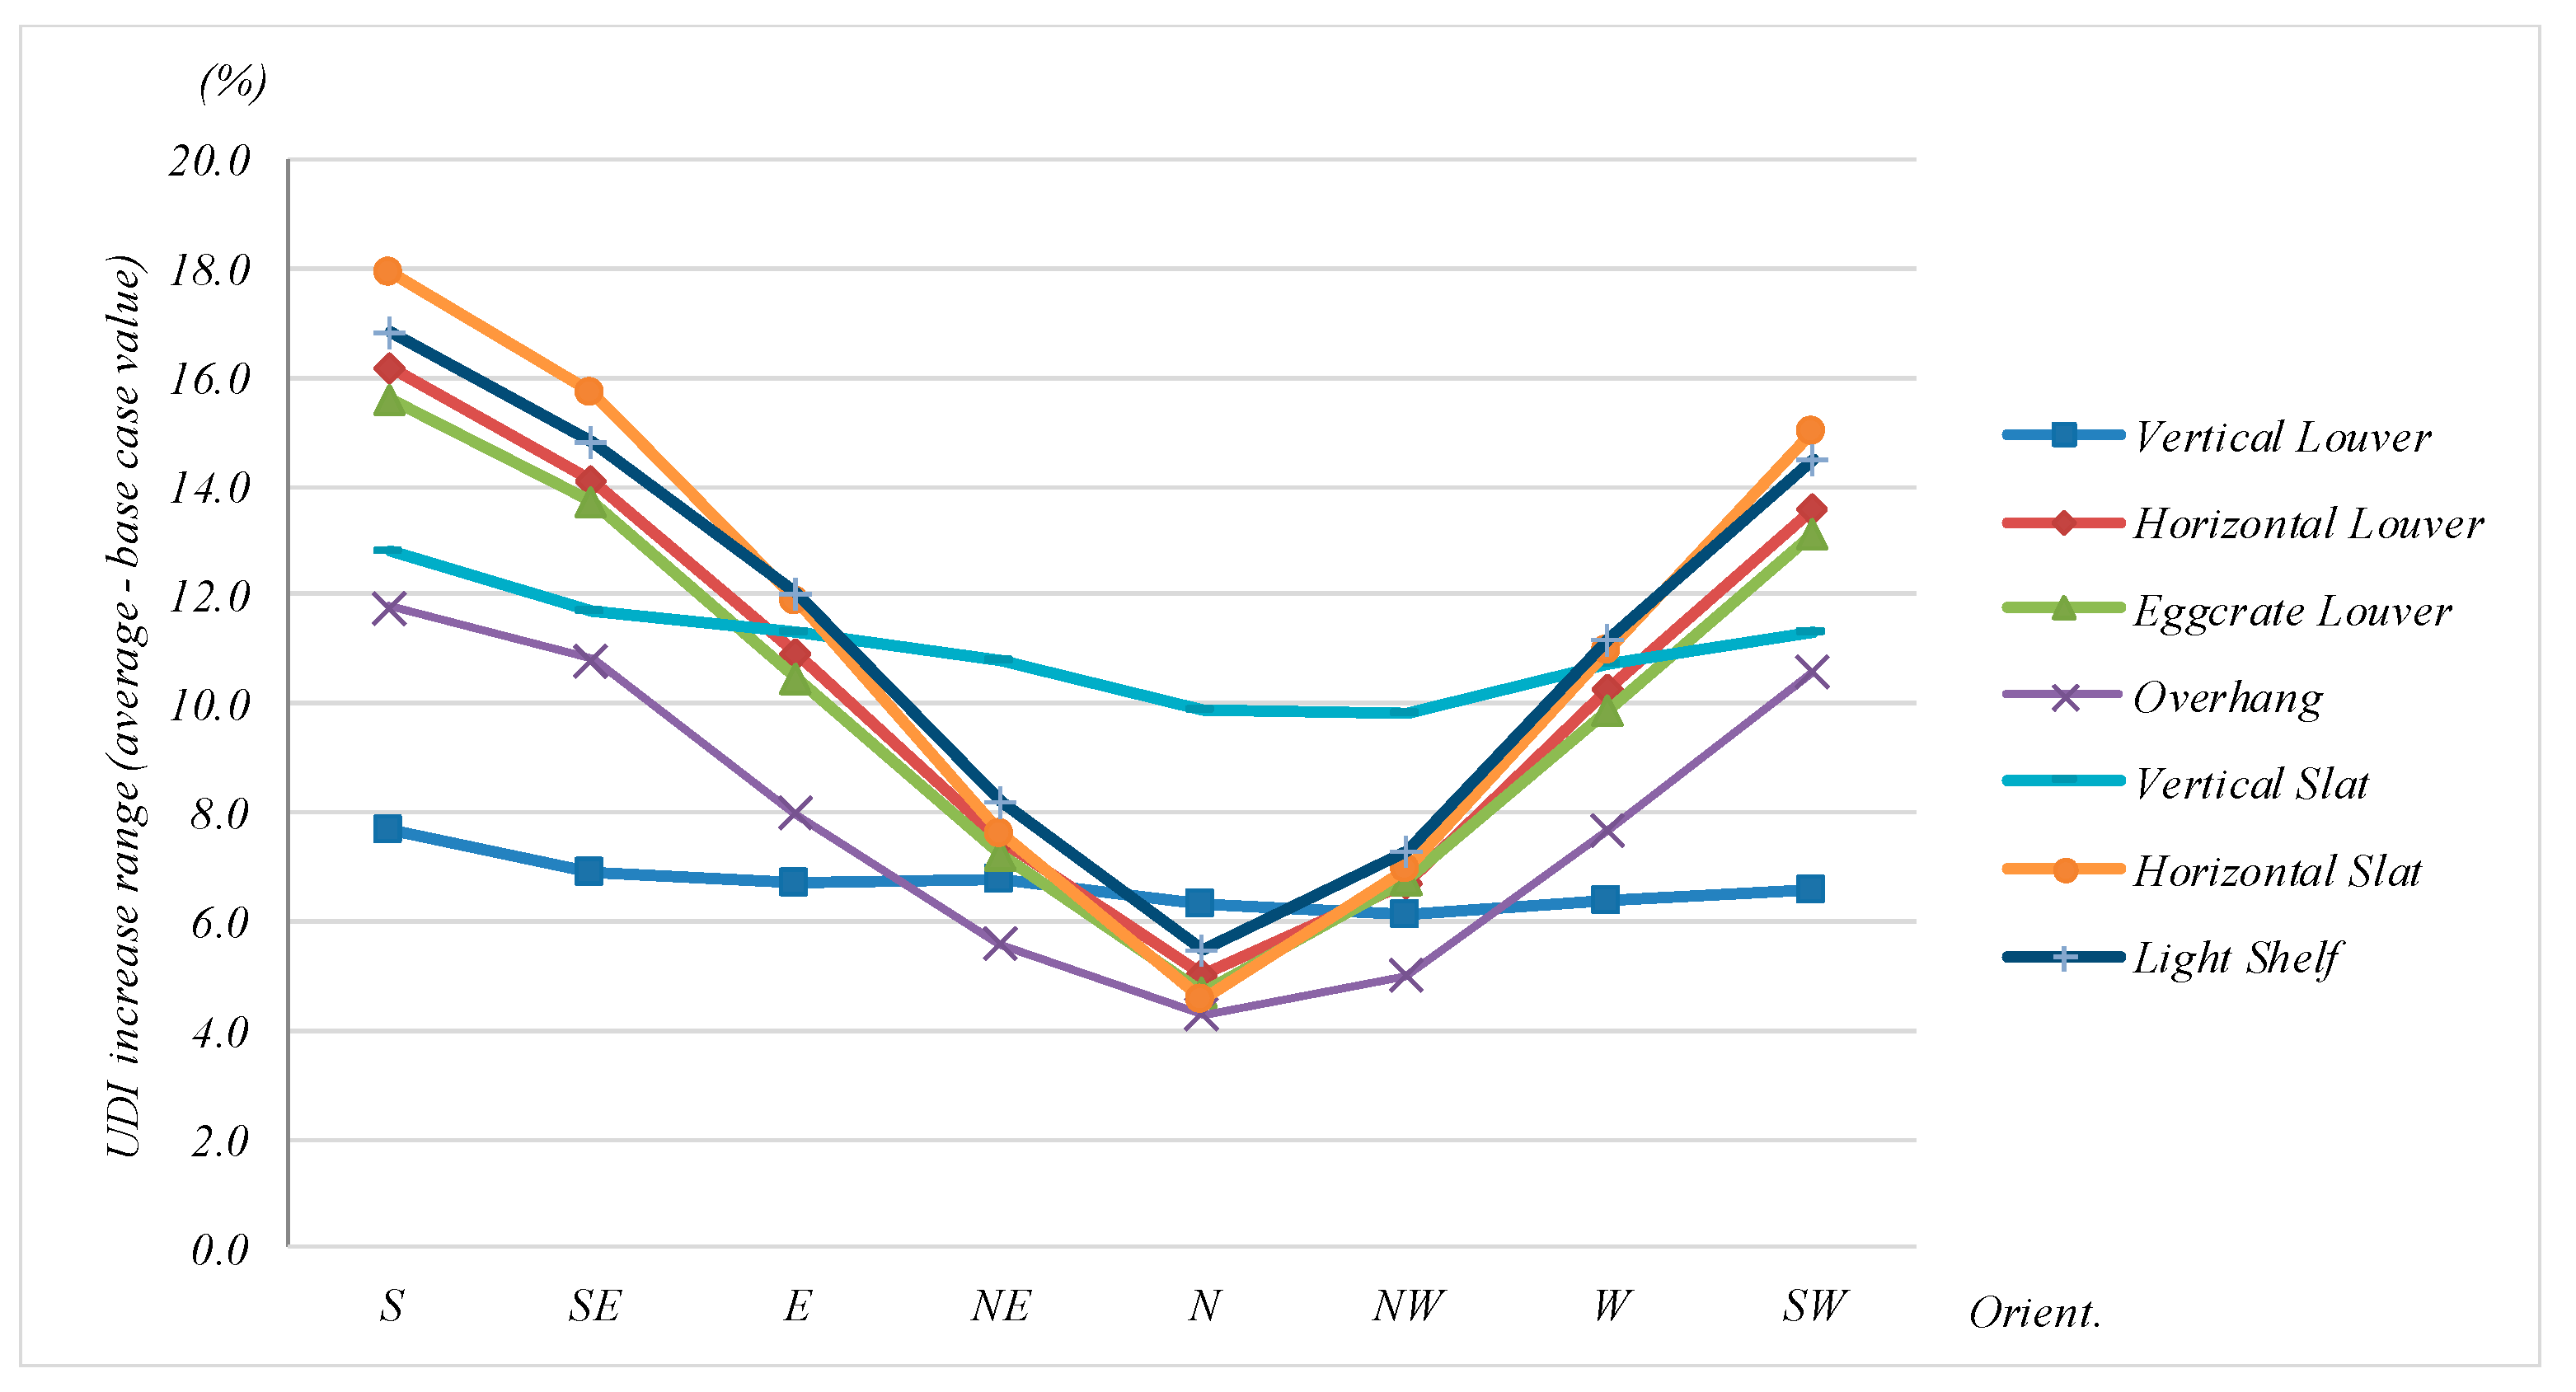
“Average”, “Ave”: the average value of each simulation “Case” based on the azimuth orientation and façade shading type
-
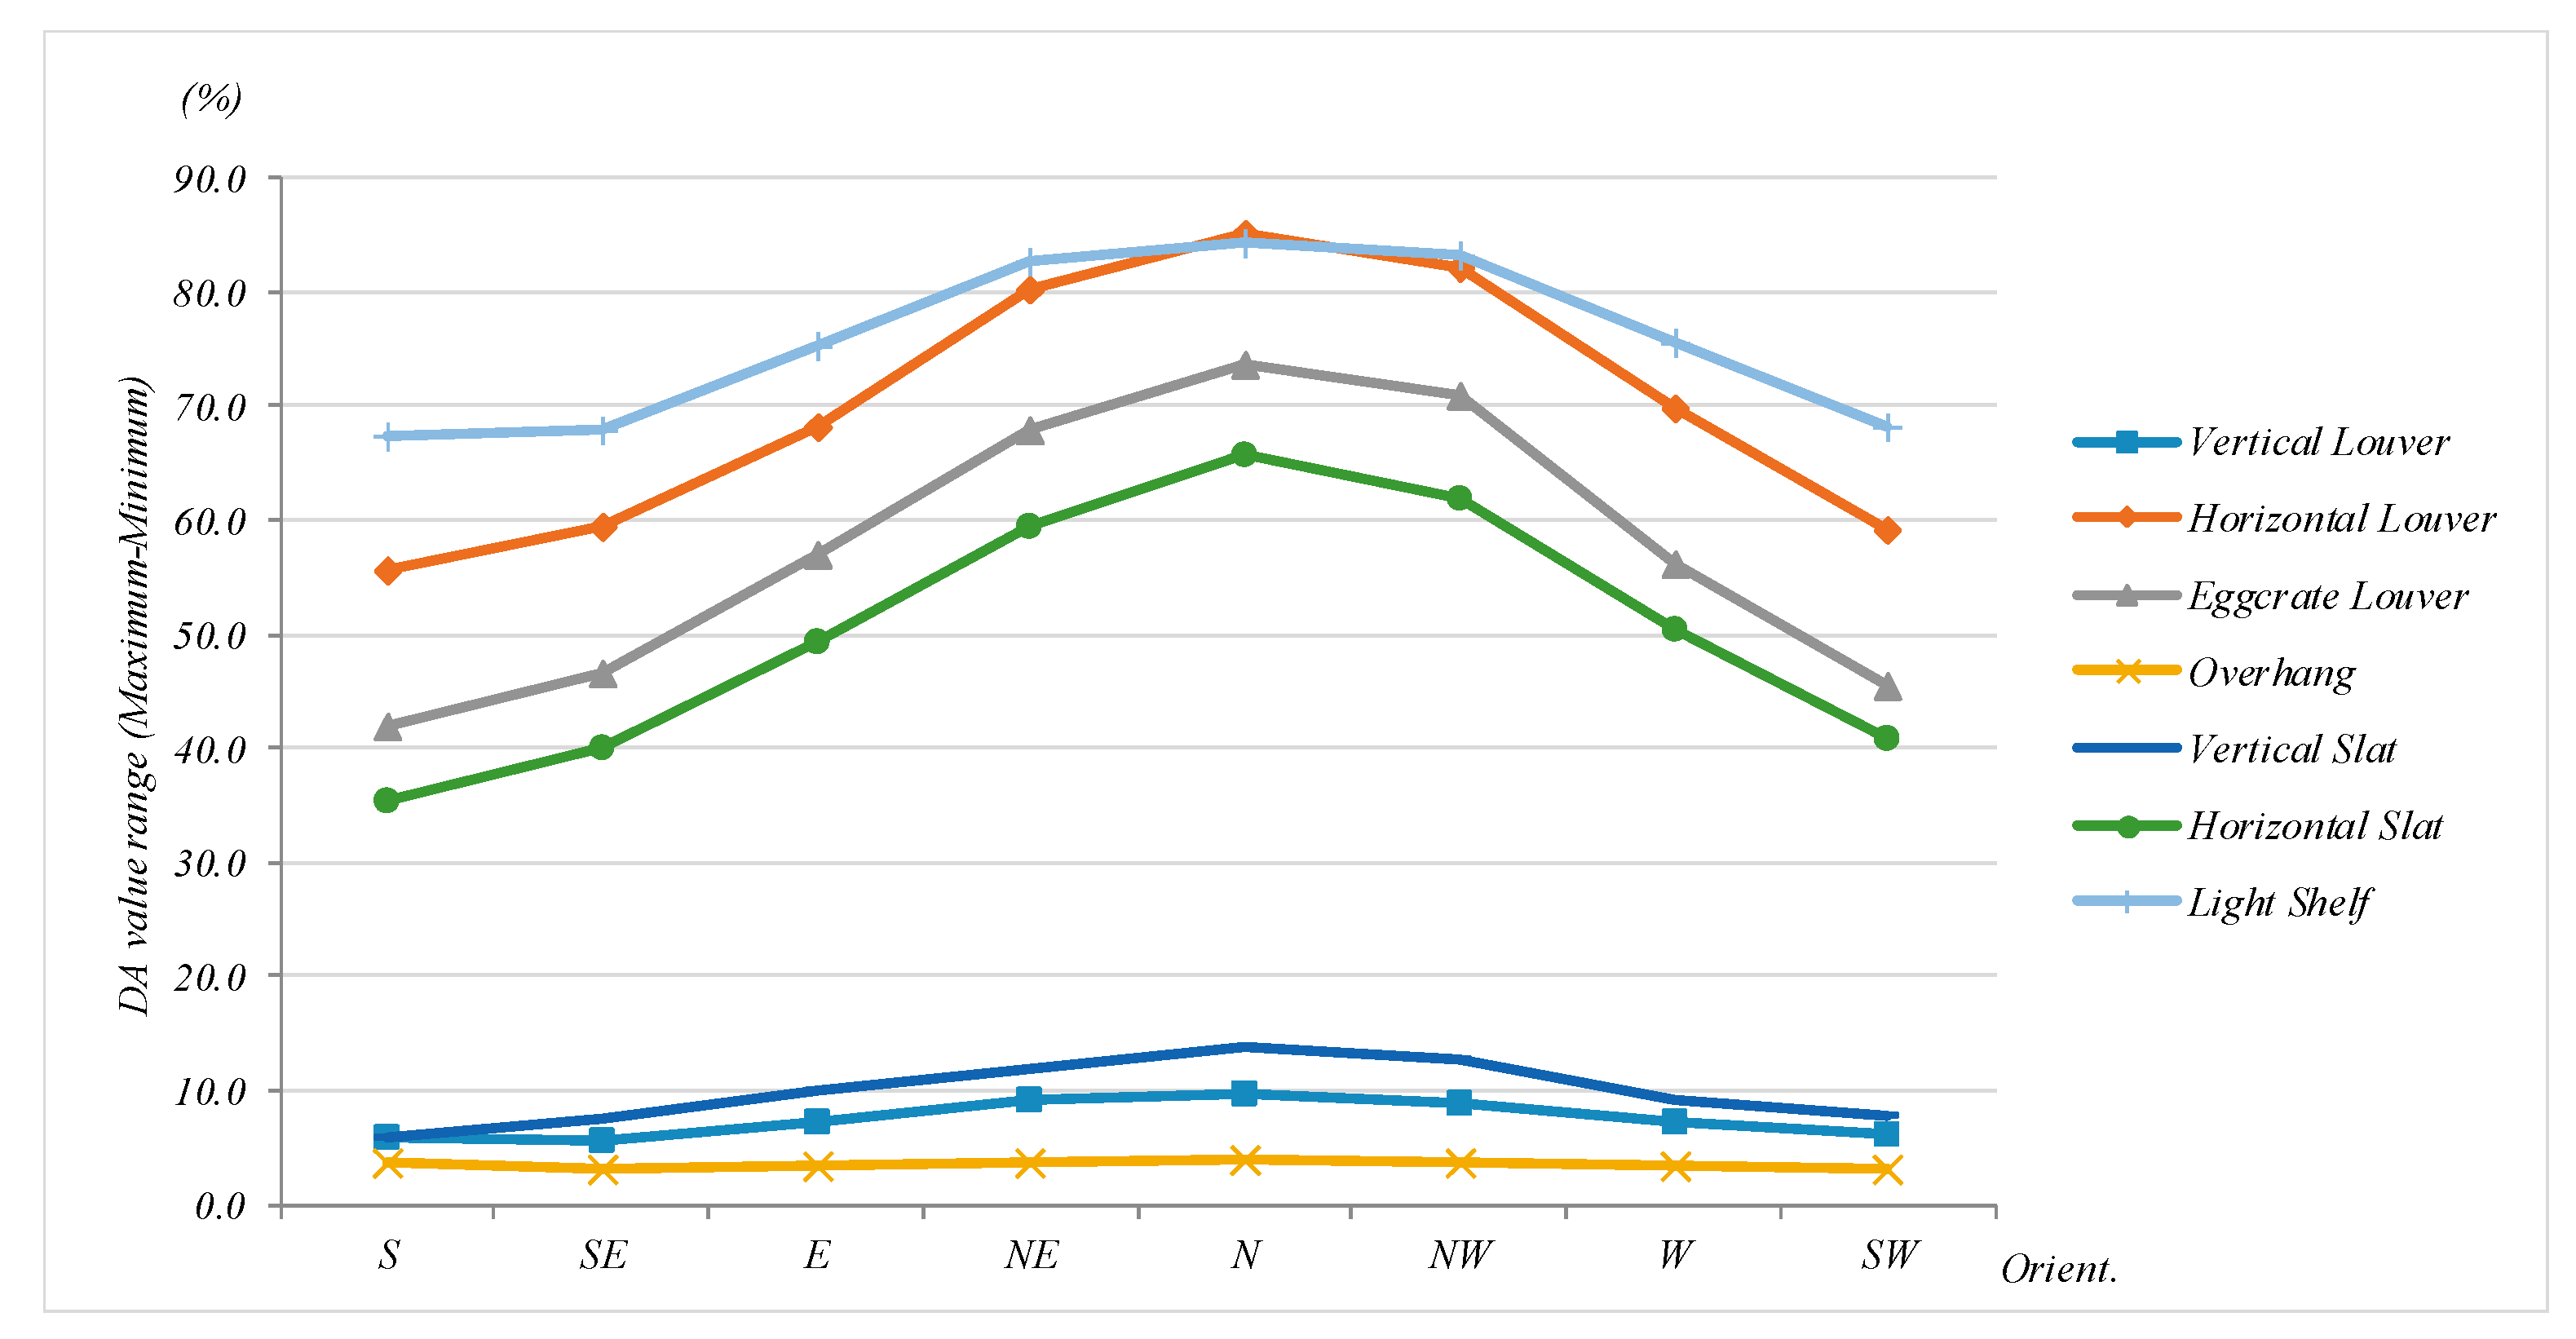
“Maximum”, “Max”: the maximum value of each simulation “Case” based on the azimuth orientation and façade shading type
-
“Minimum”: the minimum value of each simulation “Case” based on the azimuth orientation and façade shading type
-
“Range”: the difference between the “Maximum” and “Minimum” value
-
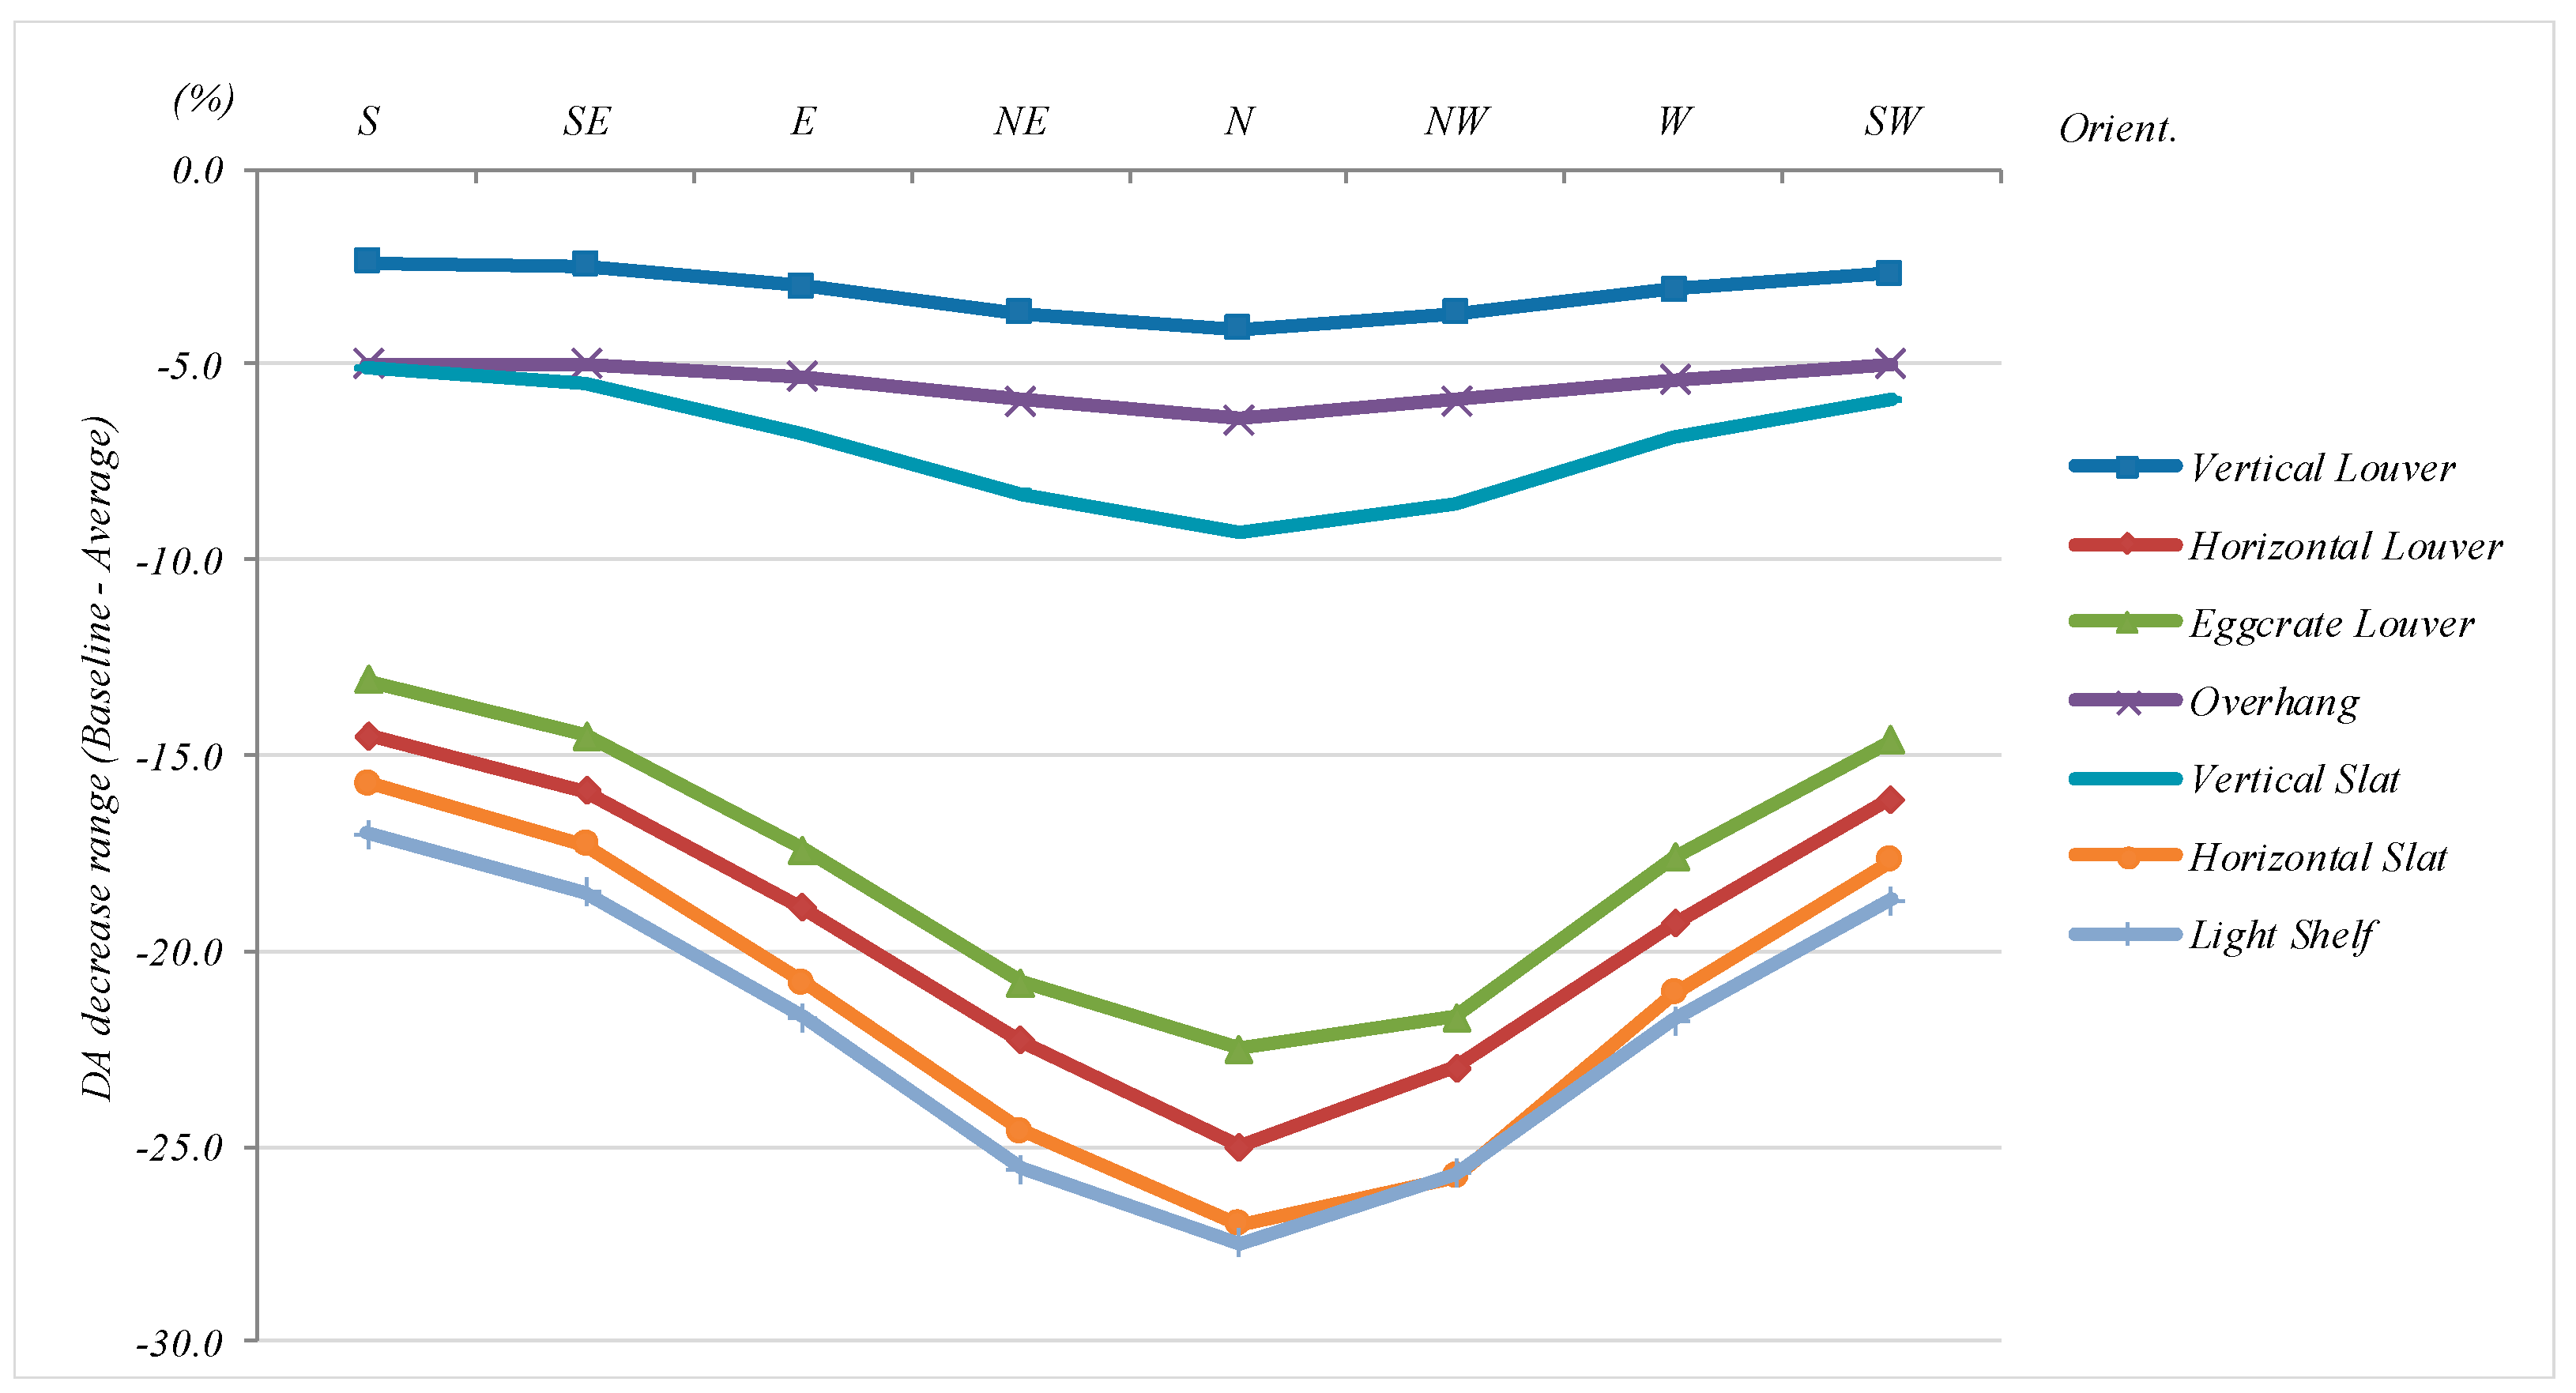
“Average-baseline”: the difference between the “Average” and “Baseline”
-
“Orient”: Azimuth orientation
These values are used to explain the inherent characteristics of each shading and azimuth orientation. The basic process for the analysis of the results is: (1) to compare the “Average” and “Baseline” (“Average-baseline”) which explains the relationship between DA and UDI in application of the shading system; and (2) to analyze “Range” which explains the sensitivity of the cases in modifying the shading system.

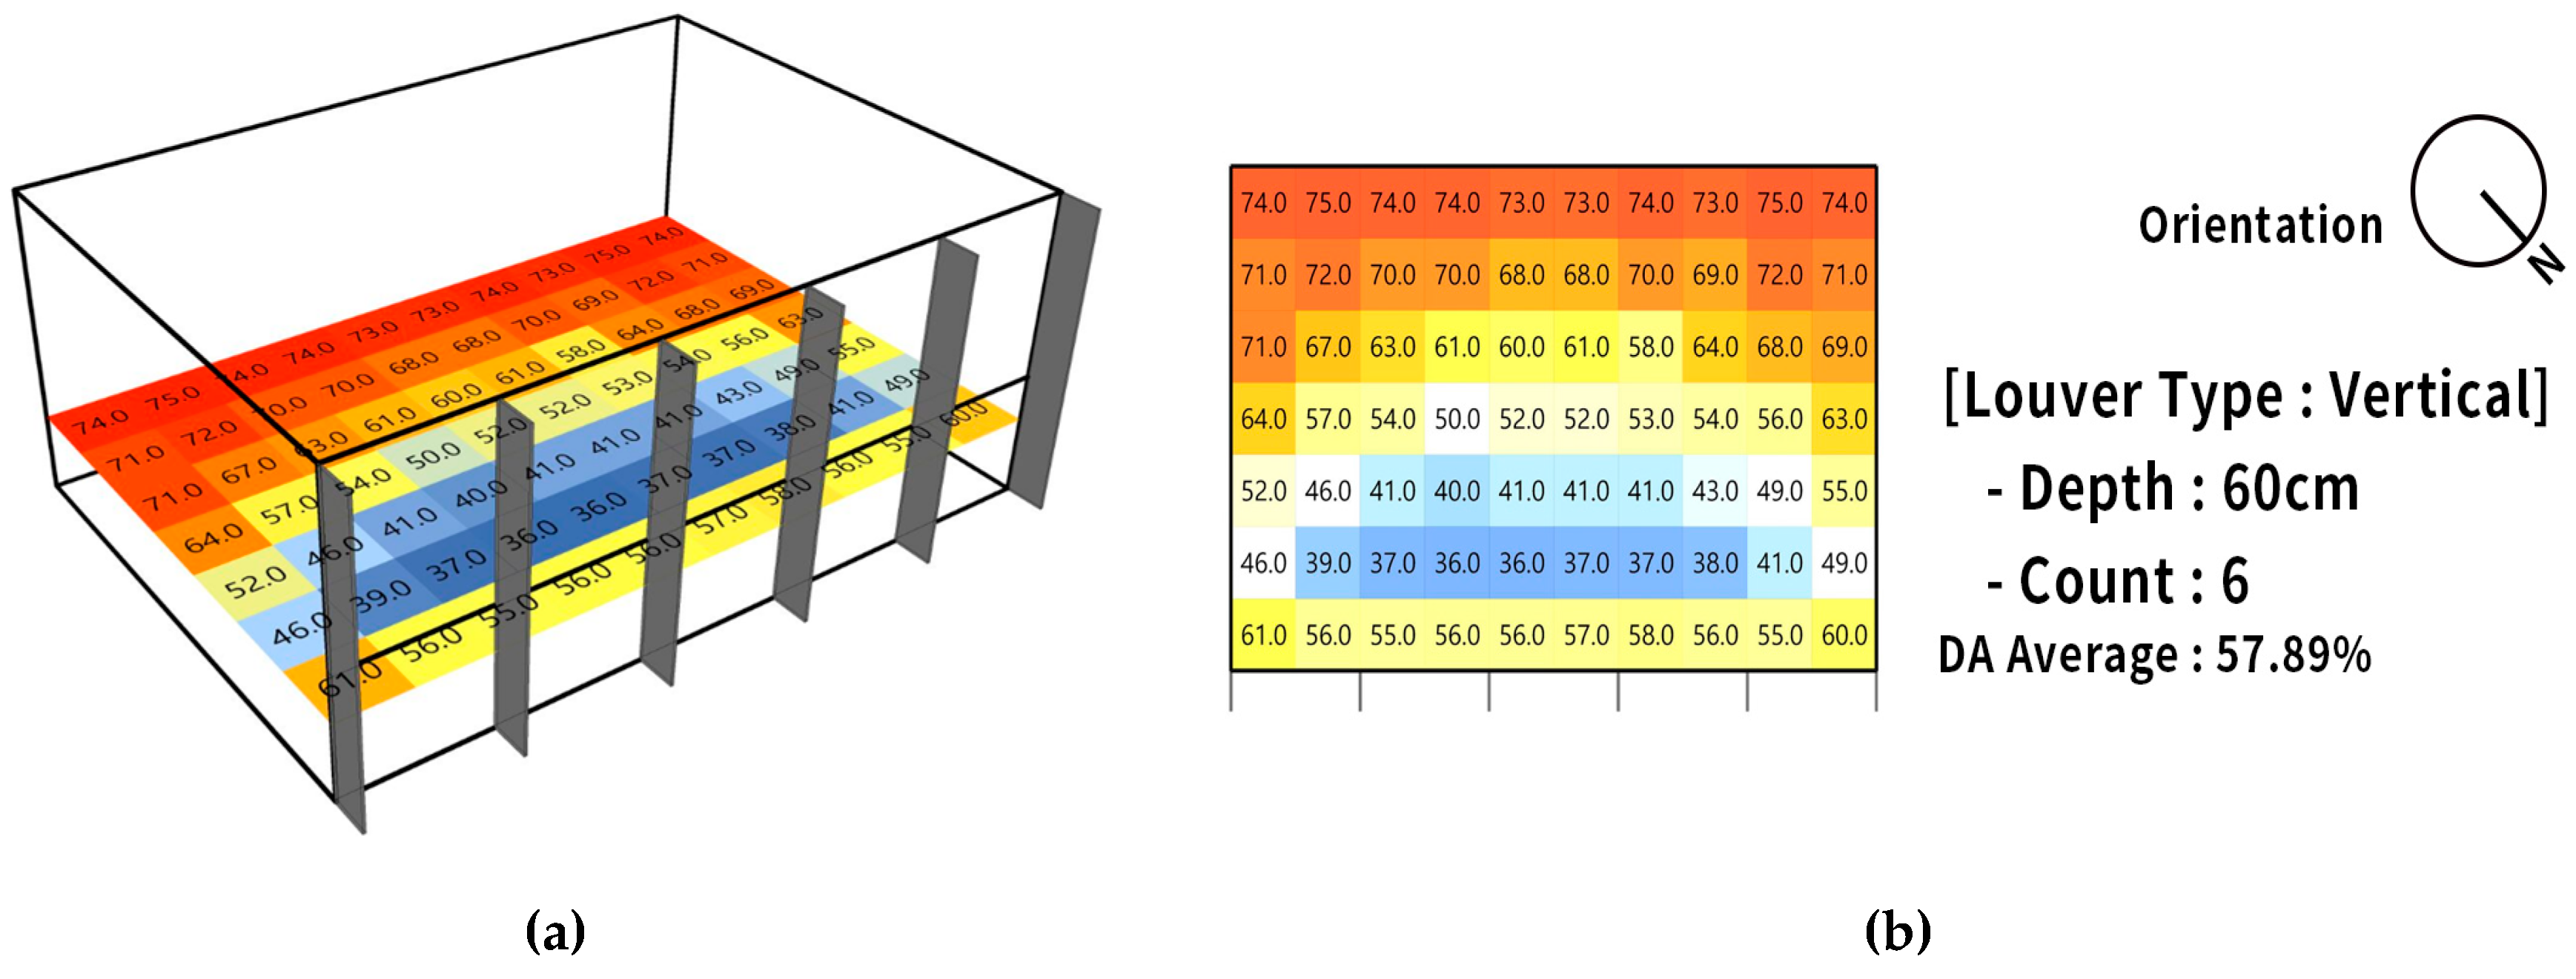
3.1. Vertical Louver

The simulation of the vertical louver was performed, and the results are shown in Figure 4 and Figure 5, and Table 4. The average values of DA with the vertical louver are consistent as a whole in every direction (85.0–88.7%). The average values of DA are reduced (2.4–4.1%) compared to the baseline cases without a louver. This implies that more indoor daylight levels of 100–2000 lux (UDI range) and less than 300 lux (out of DA range) are created with the installation of the vertical louver. On the contrary, the improved average values of UDI are relatively consistent compared with the baseline values. This means that the UDI values within the range of 100–2000 lux daylighting conditions increase. In terms of façade shading applications in façade orientation, the south improved the most (7.7%) compared to the baseline, while the northwest the least, the difference of which was 1.6%. Also, when the vertical louver was applied to the south, the value shows 1.2 times improvement than to the west. Furthermore, DA decreases and UDI increases as the depth and count increase.

3.2. Horizontal Louver

The simulation of the horizontal louver was performed, and the results are shown in Figure 6 and Figure 7, and Table 5. The average values of DA with the horizontal louver are the highest to the south (76.6%), and the values decrease further toward the north (64.1%). The average values of DA with the horizontal louver are less than the baseline values without a louver (14.5–25%). The difference between the maximum and minimum is large (55.5–85.1%) in each case, which implies that the louvers have a significant effect on the lighting environment. On the contrary, the average values of UDI in each azimuth orientation are following a changing trend of baseline values without the louver by having higher values when the orientation moves toward the north and lower values toward the south. The values improved compared to the baseline values and the improvement is highest to the south (16.2%). Also, when the horizontal louver is applied to the south, the value shows 1.57 times improvement than to the west. Furthermore, the DA value decreases and UDI value increases as the depth and count increase.

3.3. Eggcrate Louver

The simulation of the eggcrate louver was performed, and the results are shown in Figure 8 and Figure 9, and Table 6. The average values of DA with the eggcrate louver are highest to the south (71.3%) and decreasing to the north (56.8%). The average values of DA are less than the baseline values without a louver and the difference range is from 13.1% to 22.5%. The difference between the maximum and the minimum is large in each case of the eggcrate louver, which indicates that the façade shading affects the lighting environment. However, the average values of UDI with the eggcrate louver follow the trend of baseline values. The values improved compared to the baseline values, and the improvement is highest to the south (15.6%). Also, when the eggcrate louver is applied to the south, the value shows 1.58 times improvement than to the west. Furthermore, DA decreases and UDI increases as the depth and count increase.

3.4. Overhang

The simulation of the overhang was performed, and the results are shown in Figure 10 and Figure 11, and Table 7. The average DA values of the overhang are consistently high as a whole (82.7–86.1%), and the values are less than the baseline values without a louver (5–6.4%). On the contrary, the average UDI values with the overhang follow the trend of baseline values without a louver. The values are consistently better than the baseline (4.3–11.8%). This means that the values within the range of 100–2000 lux have risen. In terms of façade orientation, the values are better toward the south. The south shows the biggest improvement (11.8%). The improvement to the south is 1.53 times higher than to the west. Furthermore, the DA decreases and UDI increases as the depth and count increase.

3.5. Vertical Slat

The simulation of the vertical slat was performed, and the results are shown in Figure 12 and Figure 13, and Table 8. The average DA values with the vertical slat louver are consistently high as a whole (79.8–86%). The values with the louver decrease compared with the baseline values without a louver (5.1–9.3%). On the contrary, the average UDI values with the vertical slat louver follow the trend of baseline values without a louver. The values are consistently better than the baseline (9.8–12.8%). This means that the values in the range of 100–2000 lux have risen. In terms of façade orientation, the values are better further south, which shows the biggest improvement (12.8%). The improvement of the UDI value to the south is 1.2 times more than to the west. Furthermore, the slat angle perpendicular to the window shows the maximum DA value and the minimum UDI value.

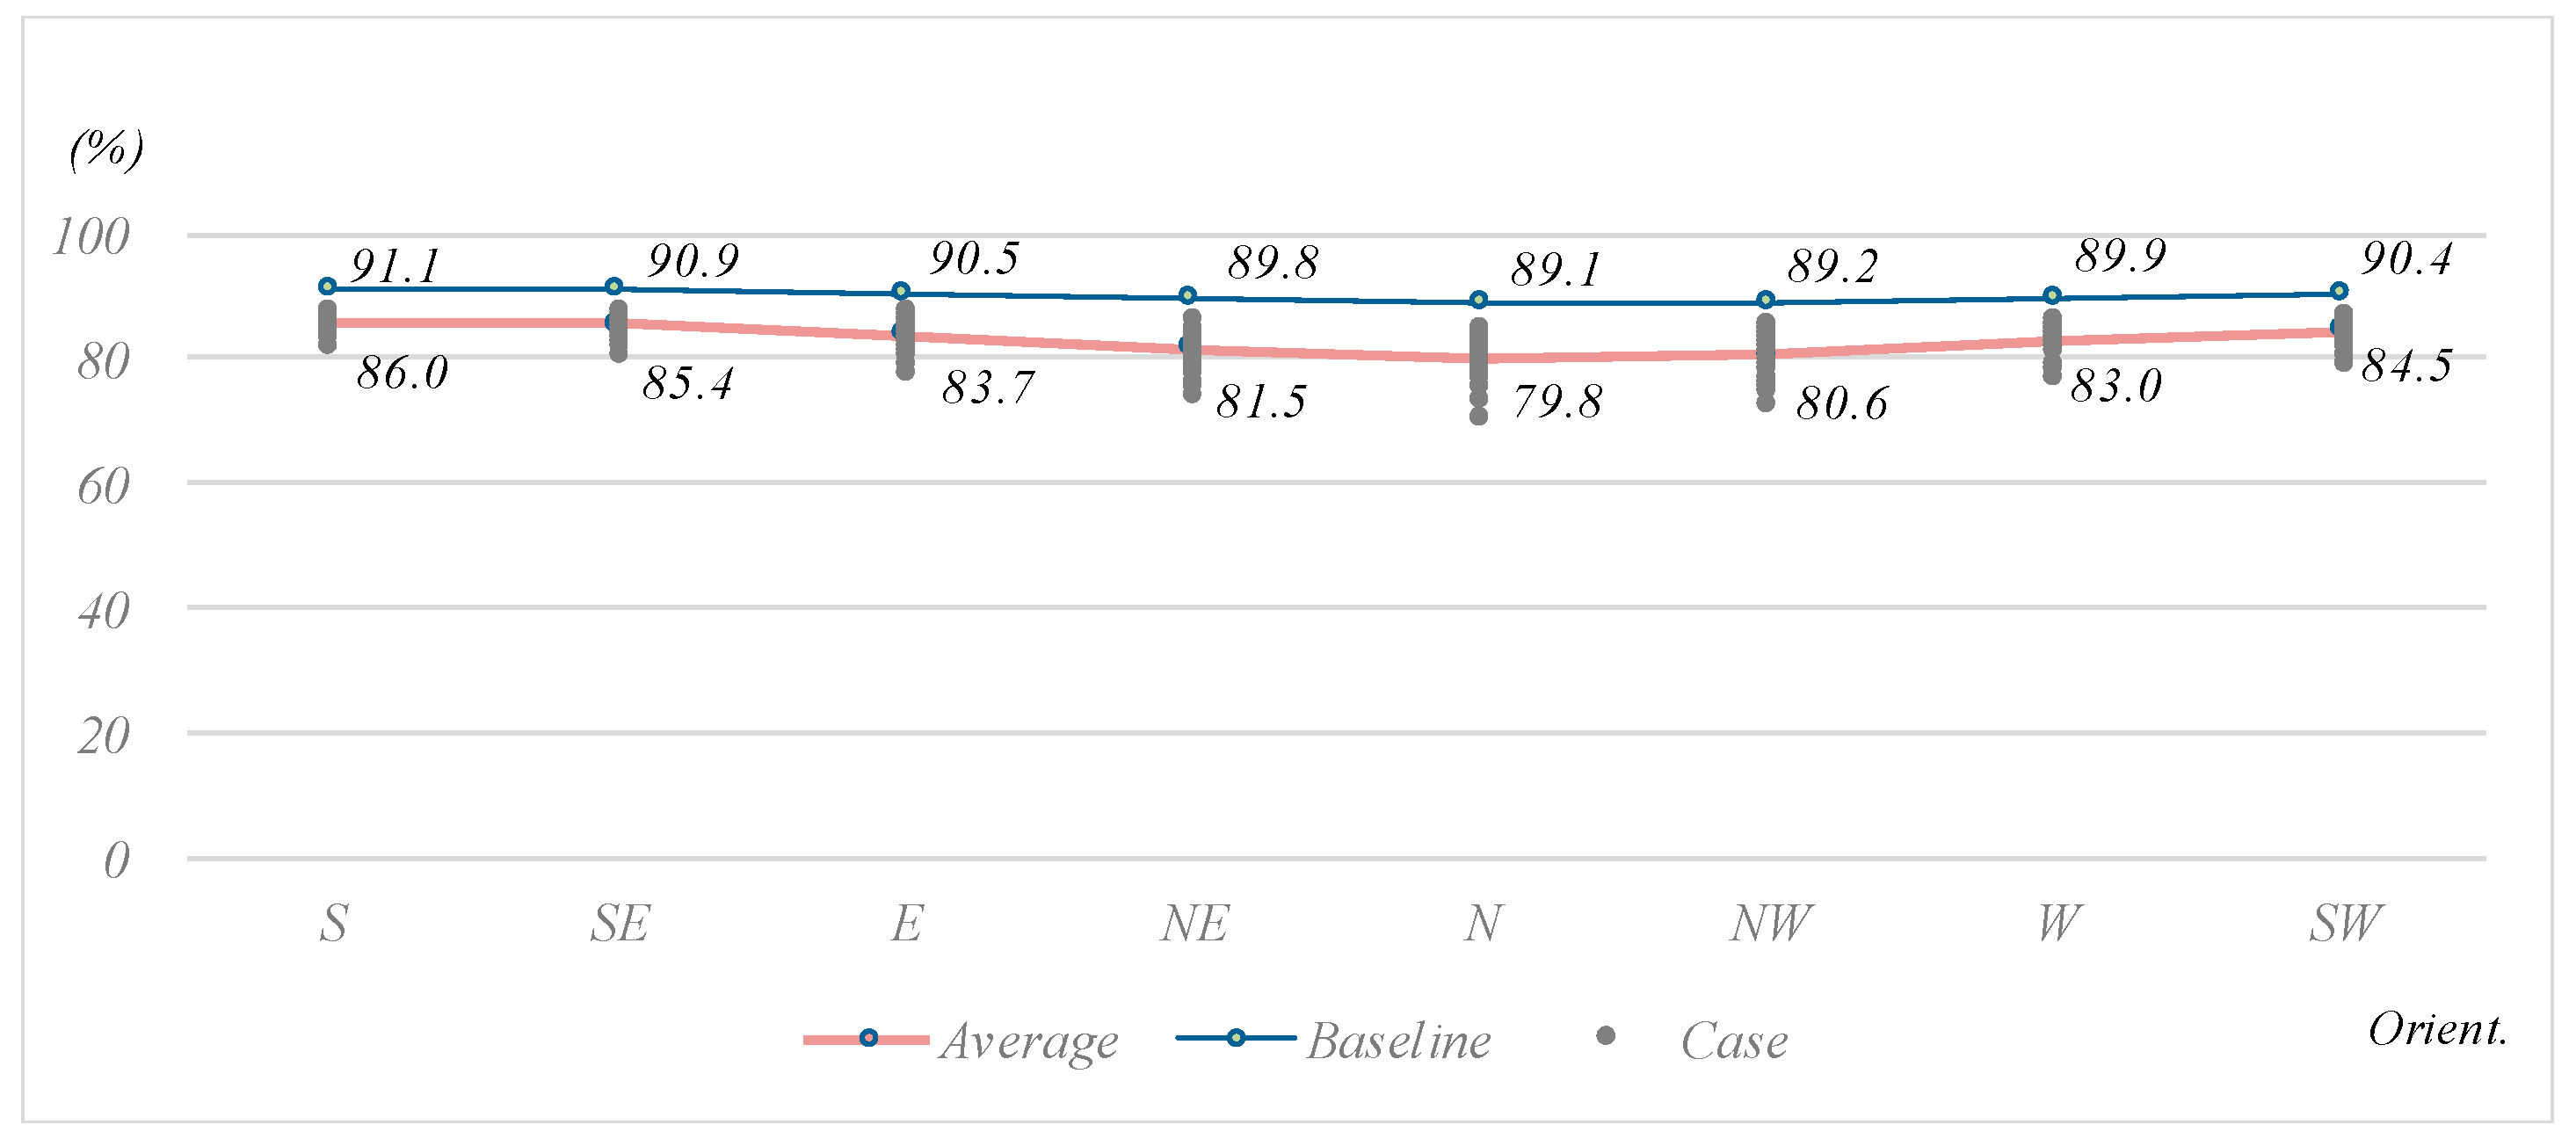
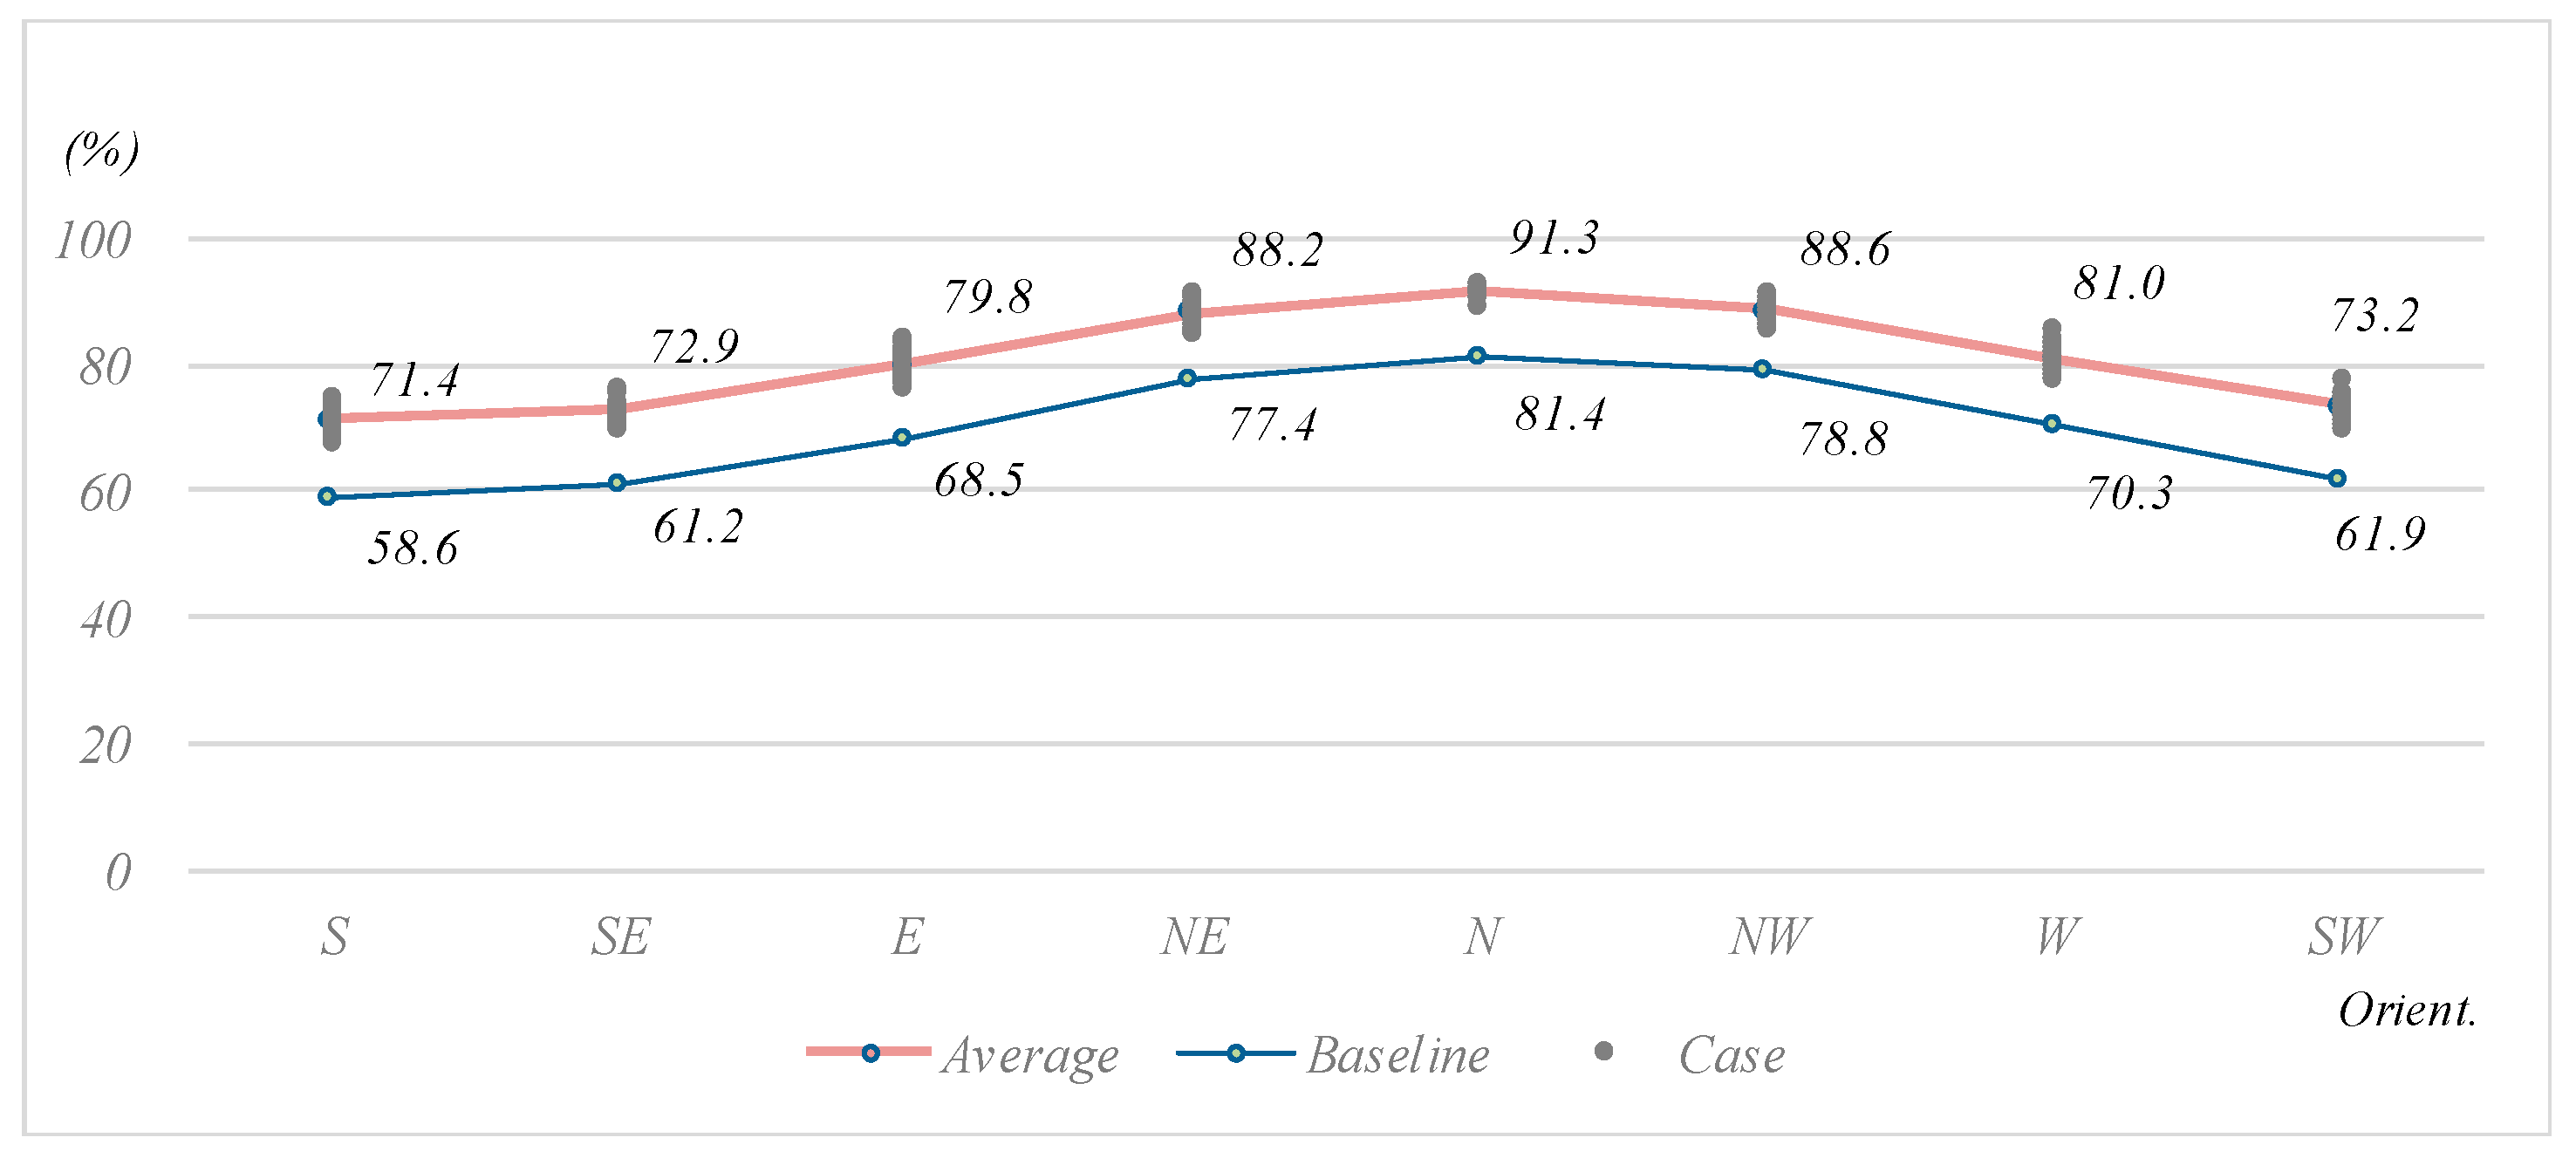
3.6. Horizontal Slat
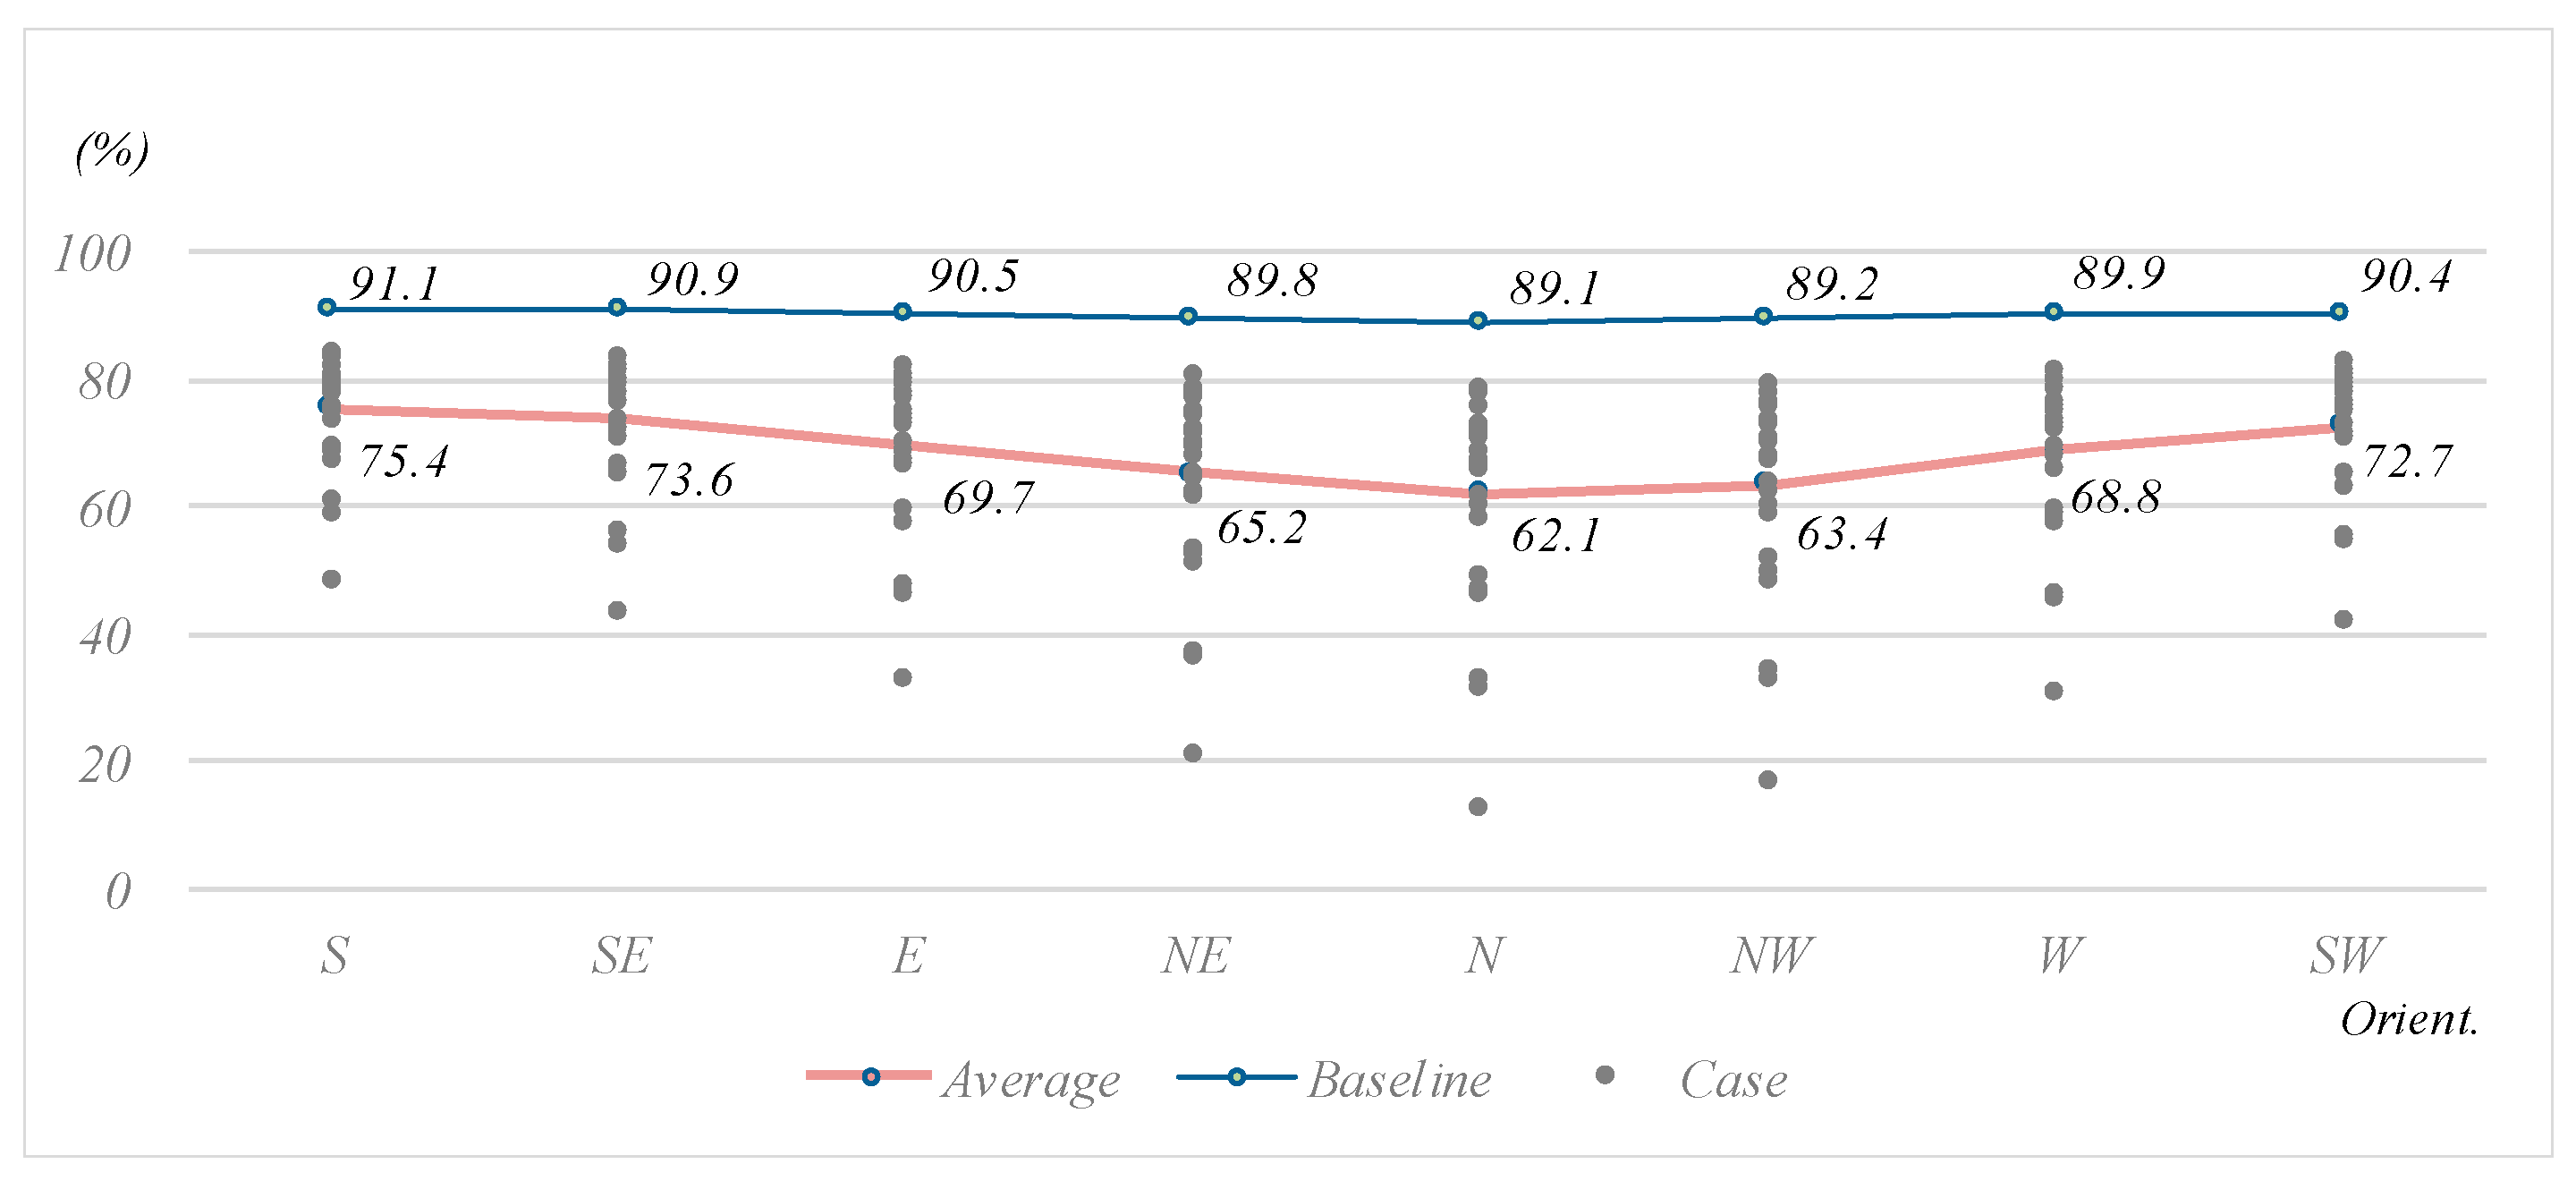
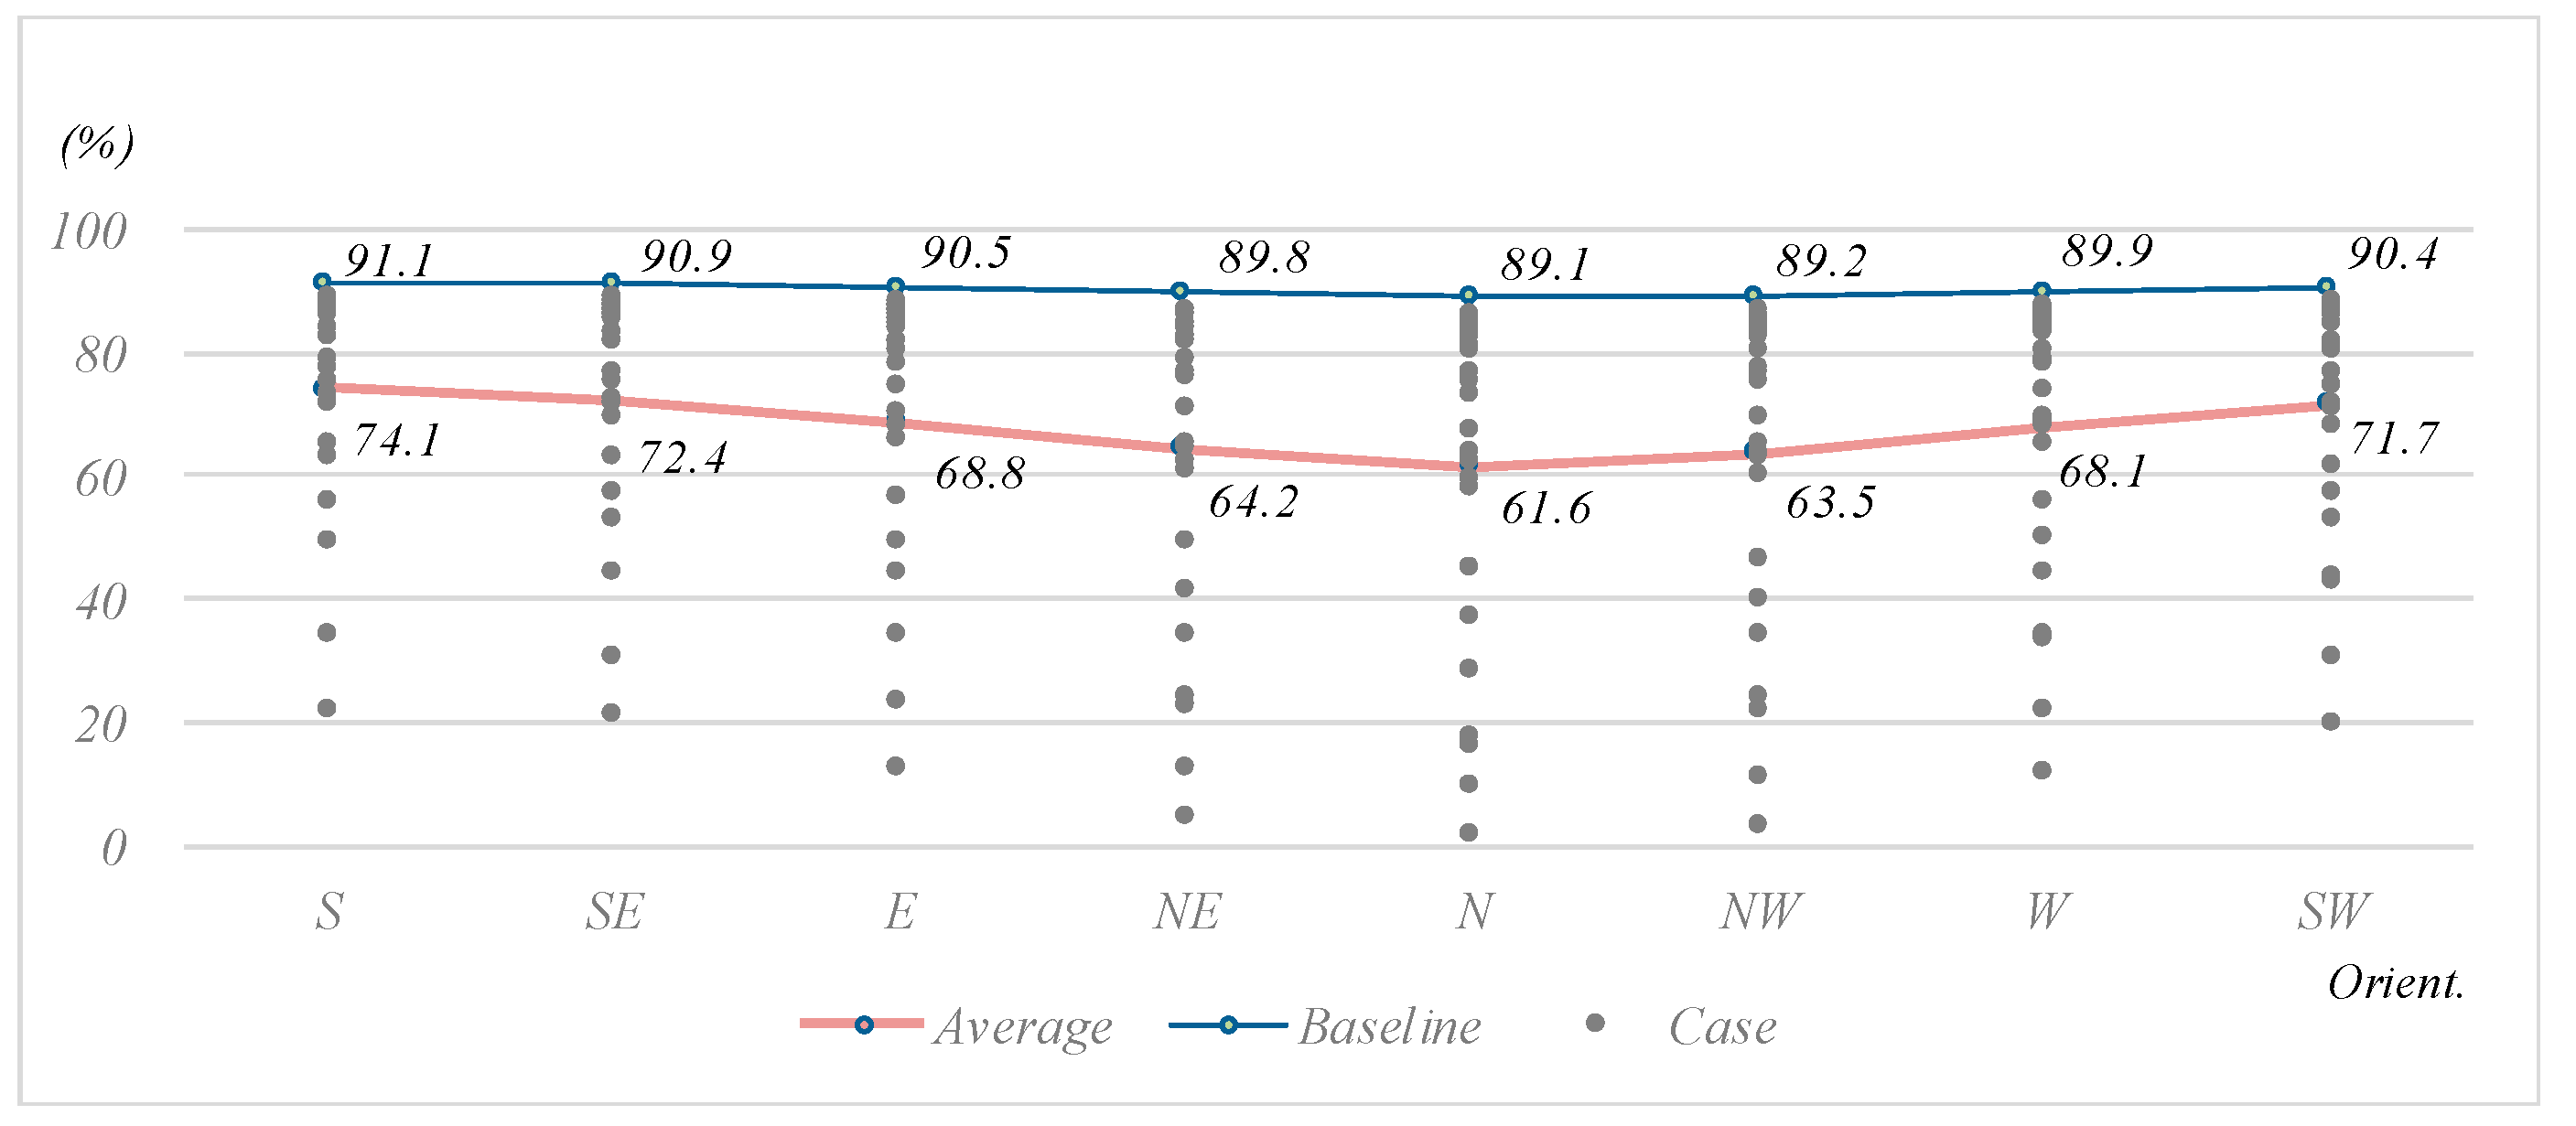
The simulation of the horizontal slat was performed, and the results are shown in Figure 14 and Figure 15, and Table 9. The average DA values with the horizontal slat louver are the highest (75.4%) to the south and the lowest (62.1%) to the north. The average DA values have decreased significantly compared with the baseline values without a louver (15.7–27%). The differences between the minimum and the maximum are large in each case (35.3–65.6%). On the contrary, the average values of UDI in each azimuth orientation are following the changing trend of baseline values without a louver by having higher values when the orientation moves toward the north and lower values when toward the south. The values are consistently better than the baseline (4.6–17.9%). The values increase and decrease moving toward the south and the north, respectively. The south shows the biggest improvement (17.9%) and the north produces the least (4.6%). The improvement of the UDI value to the south is 1.63 times more than to the west. Furthermore, the DA increases and UDI decreases as the angle of the slat approaches the solar altitude angle.

3.7. Light Shelf

The simulation of the light shelf was performed, and the results are shown in Figure 16 and Figure 17, and Table 10. The average DA values of the light shelf are the highest to the south (74.1%) and the lowest to the north (61.6%). The average DA values decreased compared with the baseline cases (17–27.5%). The differences between the minimum and the maximum values are large in each case (67.4–84.2%). This means that the light shelf affects the daylighting environment. The average UDI values of the light shelf follow the trend of the baseline values without a louver. The further south, the better the values are, which shows the biggest improvement (16.8%). The north is the opposite, with the lowest improvement (5.5%). The differences between the minimum and the maximum are large (19.6%–51.1%). The improvement of the UDI value to the south is 1.5 times more than to the west.

3.8. The Effectiveness of Façade Shading Installation Compared with the Non-Shading Case

Based on the simulation results of seven different shading types, the effectiveness of shading installation is compared with non-shading cases. The graphs shown in Figure 18 and Figure 19 describe the decreased average value or increased average value compared to the non-shading installation case (base case) in each DA and UDI. The DA values at the baseline of each azimuth orientation are between 89.1–90.9%, and the maximum difference was very small, within 1.8%. However, all cases with façade shading show decreased DA and increased UDI values. More specifically, the types of shading devices which produce a dramatic decrease in the DA values are the light shelf, horizontal slats, horizontal louvers, and eggcrate louvers. In the baseline case without façade shading, the DA values are greater than 89% in every direction. The DA values decrease with the application of shading devices, which means an indoor daylight level below 300 lux is created. The decrease of the DA values are small in the case of the vertical louver, overhang, and vertical slat. The differences of daylighting conditions, which decrease the DA values, are not large depending on these types of shading devices, which means that these shading devices controlling daylight below the level of 300 lux do not affect the indoor lighting environment.
On the contrary, in the case of the UDI, where 100–2000 lux light levels are measured, the measurement is made excluding excessive light inflow. Therefore, when the façade shading is installed, the UDI values improve compared with the baseline case without shading.
The types of façade shading which produce a dramatic increase in UDI values are horizontal slats, light shelf, horizontal louvers, and eggcrate. These façade shading types improve UDI performance when installed in the south orientation, but the value decreases in the east, north, and west orientations. The overhang type has a lower performance in improving UDI value compared with the other façade shading systems, except for the vertical louver. In the case of the vertical louver and vertical slat, the improvements of UDI values are significant in the east and west orientations. This demonstrates that the application and design of shading devices in certain façade orientations should be carefully considered for daylight control.

3.9. Design Considerations for Façade Shading Systems

Based on the simulation data (the differences between each maximum and minimum; maximum value − minimum value in DA and UDI results), the design consideration for façade shading systems is presented with the DA and UDI value range graphs shown in Figure 20 and Figure 21. In the case of the vertically installed façade shading, already known for its effectiveness of shading east and west exposures [39,40], the result shows that the vertical slat in particular has advantages in the UDI measurement compared to the other shading devices in the east, northeast, north, northwest, and west exposures. Also, the vertical louver and slat increased the UDI value evenly regardless of the azimuth orientation, which demonstrates that they are more effective in the east and west compared with the other shadings. In horizontally installed façade shading, known for being useful for installations in the south orientation, both the horizontal louver and slat and eggcrate louver have advantages in UDI values compared with the other shading types. The overhang type shows a relatively similar pattern between vertically and horizontally installed louver types considering the DA and UDI values. Lastly, the light shelf shows relatively peculiar characteristics because it has a different style of shading properties based on the material’s reflectance, and it also shows the greatest value in terms of fluctuation between the maximum and minimum scale. Thus, careful consideration for selecting suitable properties such as depth, angle, and azimuth orientation should be implemented. Furthermore, in most cases, there might be a chance to solve overlight problems, such as glare, in not only the south, east, and west, but also in the north, since the installation of façade shading decreases DA and increases UDI in all orientations.
In summary, the shading types which have the least impact on increasing the UDI value are vertical louvers, overhang, and vertical slats in the order of magnitude of the improved values. The variations of the DA values are large in the case of the light shelf, horizontal louvers, eggcrate louvers, and horizontal slats. The variations of the DA values are small in the overhang, vertical louver, and vertical slat. The variations of the UDI values are large in the case of the light shelf, horizontal louvers, eggcrate louvers, and horizontal slats. The variations of the UDI values are small in the overhang, vertical slat, and vertical louver.

4. Conclusions

This study reveals some meaningful differences between DA and UDI metrics with the variation of the orientation and façade shading types. Although all cases of façade shading show some degree of decrease in DA and increase in UDI values, the results show the characteristics of controlling the light. The DA only considers the conditions of 300 lux or more, whereas the UDI considers the conditions between 100 and 2000 lux. The decrease of DA creates the environment of 300 lux or less. At the same time, the increase of UDI creates the environment of 100 to 300 lux.
In particular, the types of shading devices which produce a dramatic decrease in the DA values are the light shelf, horizontal slats, horizontal louvers, and eggcrate louvers. On the contrary, the types of shading devices which produce a dramatic increase in the UDI values are the light shelf, horizontal slats, horizontal louvers, and eggcrate louvers. In the case of the vertical louver and vertical slat, the improvements of the UDI values are significant in the east and west orientations.
This study also finds that the effectiveness of shading devices using DA values are not sufficient enough because they only use daylight levels of more than 300 lux, whereas for indoor lighting conditions, i.e., 100–300 lux of the daylight level, the excessive daylight level needs to be considered. It is known that UDI is effective in terms of shading performance evaluation [38]. This study re-confirms the effectiveness of UDI in the case of Incheon (South Korea, Latitude 37), South Korea. Namely, the DA conditions are only for lights with 300 lux or more, so that the values of DA are higher without a shading device than with. However, in the case of UDI, where the range of the minimum and maximum values is defined as 100–2000 lux, UDI is effective when excessive daylight needs to be controlled by shading devices.
Although the criteria may vary in certain environments, a minimum of 300 lux in illuminance level is generally recommended for classrooms, based on the IESNA (Illuminating Engineering Society of North America) guide [41]. At the DA condition (above 300 lux), when the classroom is illuminated sufficiently, the electric lighting use can be reduced and lead to energy saving. Additional effects when DA and UDI are used together include the facts that DA provides energy saving related data and UDI provides data on useful daylight range (minimum lighting source and glare possibility). Therefore, when the two metrics are used together, it can help to examine both the amount of energy and useful daylight at the same time.
Considering that LEED encourages using climate-based analyses such as DA, this comparison between DA and UDI in the change of shading and azimuth orientation might justify reconsideration for shading devices and their rating systems. To explain, the analytic technique for daylight analysis changes from static to dynamic conditions such as DA and UDI, and it is shown that there are huge differences in the DA and UDI values in the application of façade shading when we use those daylight metrics.
This study has a certain degree of limitations. It suggests simulation results based on weather data of a specific location, therefore it may not be applied to all the cases. Since, UDI thresholds are set as 2000 lux based on the default value of the DIVA program setting, the UDI threshold of 2000 lux is used in this experiment. However, if the threshold is set differently i.e., 2500 or 3000 lux, the value and trend of the result graph can vary. Therefore, the interpretation may be different depending on the location, building type, or the threshold setting, which should be considered in future studies. Also, the input shading parameter values were selected based on the minimum 2% or maximum 30% DA range in each azimuth orientation. Therefore, it is relatively difficult to compare and prove the effectiveness of the respective shading types, and this study focused on the relative comparison within each shading, rather than comparing the absolute mean values between different types of shading. Thus, the results may vary depending on the parameter variations selected for each shading type. Nevertheless, with these simulation techniques and methods, a designer and an engineer can establish more detailed metrics for daylight availability measurement as well as realize the inherent benefits of each shading system on human comfort.

Acknowledgments

This research was supported by the Basic Science Research Program through the National Research Foundation of Korea (NRF) funded by the Ministry of Science, ICT & Future Planning (NRF-2014R1A1A1002268). This work was also supported by the 2017 Hongik University Research Fund.

Author Contributions

Kyung Sun Lee conceived and designed the experiments; Kyung Sun Lee performed the experiments; Kyung Sun Lee and Jae Wook Lee analyzed the data; Ki Jun Han contributed reagents/materials/analysis tools; Kyung Sun Lee and Jae Wook Lee wrote the paper.

Conflicts of Interest

The authors declare no conflict of interest. The funding sponsors had no role in the design of the study; in the collection, analyses, or interpretation of data; in the writing of the manuscript, and in the decision to publish the results.

References

  1. Lee, K.S.; Lee, J.; Lee, J.S. Low-energy design methods and its implementation in architectural practice: Strategies for energy-efficient housing of various densities in temperate climates. J. Green Build. 2013, 8, 164–183. [Google Scholar] [CrossRef]
  2. Wong, N.H.; Istiadji, A.D. Effect of external shading devices on daylighting penetration in residential buildings. Light. Res. Technol. 2004, 36, 317–330. [Google Scholar] [CrossRef]
  3. Crawley, D.B.; Lawrie, L.K.; Winkelmann, F.C.; Buhl, W.F.; Huang, Y.J.; Pedersen, C.O.; Glazer, J. EnergyPlus: Creating a new-generation building energy simulation program. Energy Build. 2001, 33, 319–331. [Google Scholar] [CrossRef]
  4. Lee, J.W.; Jung, H.J.; Park, J.Y.; Lee, J.B.; Yoon, Y. Optimization of building window system in Asian regions by analyzing solar heat gain and daylighting elements. Renew. Energy 2013, 50, 522–531. [Google Scholar] [CrossRef]
  5. Boubekri, M. Daylighting, Architecture and Health; Routledge: London, UK, 2008. [Google Scholar]
  6. Lam, J.C.; Li, D.H. An analysis of daylighting and solar heat for cooling-dominated office buildings. Sol. Energy 1999, 65, 251–262. [Google Scholar] [CrossRef]
  7. Lopez-Besora, J.; Serra-Coch, G.; Coch, H.; Isalgue, A. Daylight Management in Mediterranean Cities: When Shortage Is Not the Issue. Energies 2016, 9, 753. [Google Scholar] [CrossRef]
  8. Heschong, L.; Wright, R.L.; Okura, S. Daylighting impacts on human performance in school. J. Illum. Eng. Soc. 2002, 31, 101–114. [Google Scholar] [CrossRef]
  9. Boubekri, M.; Hull, R.B.; Boyer, L.L. Impact of window size and sunlight penetration on office workers’ mood and satisfaction a novel way of assessing sunlight. Environ. Behav. 1991, 23, 474–493. [Google Scholar] [CrossRef]
  10. Freewan, A.A.; Shao, L.; Riffat, S. Interactions between louvers and ceiling geometry for maximum daylighting performance. Renew. Energy 2009, 34, 223–232. [Google Scholar] [CrossRef]
  11. Sullivan, R.; Lee, E.S.; Selkowitz, S. A Method of Optimizing Solar Control and Daylighting Performance in Commercial Office Buildings; LBL-32931; Lawrence Berkeley Laboratory: Berkeley, CA, USA, 1992. [Google Scholar]
  12. ASHRAE Handbook, Fundamentals; American Society of Heating and Refrigerating and Air Conditioning Engineers, Inc.: New York, NY, USA, 1997. Available online: https://www.ashrae.org/resources--publications/bookstore/handbook-online (accessed on 15 December 2016).
  13. Palmero-Marrero, A.I.; Oliveira, A.C. Effect of louver shading devices on building energy requirements. Appl. Energy 2010, 87, 2040–2049. [Google Scholar] [CrossRef]
  14. Kim, S.Y. Contribution of Horizontal Louvers to the Daylight Distribution in a Large Multipurpose Hall. Archit. Res. 2003, 5, 29–36. [Google Scholar]
  15. Datta, G. Effect of fixed horizontal louver shading devices on thermal performance of building by TRNSYS simulation. Renew. Energy 2001, 23, 497–507. [Google Scholar] [CrossRef]
  16. Kim, J.T.; Kim, G. Advanced external shading device to maximize visual and view performance. Indoor Built Environ. 2010, 19, 65–72. [Google Scholar]
  17. Kuhn, T.E.; Bühler, C.; Platzer, W.J. Evaluation of overheating protection with sun-shading systems. Sol. Energy 2001, 69, 59–74. [Google Scholar] [CrossRef]
  18. Lee, J.H.; Moon, J.W.; Kim, S. Analysis of Occupants’ Visual Perception to Refine Indoor Lighting Environment for Office Tasks. Energies 2014, 7, 4116–4139. [Google Scholar] [CrossRef]
  19. Park, C.S.; Augenbroe, G.; Messadi, T. Daylighting optimization in smart facade systems. In Proceedings of the Eighth International IBPSA Conference, Eindhoven, The Netherlands, 11–14 August 2003. [Google Scholar]
  20. Jakubiec, J.A.; Reinhart, C.F. DIVA 2.0: Integrating daylight and thermal simulations using Rhinoceros 3D, Daysim and EnergyPlus. Proceedings of Building Simulation 2011, Sydney, Australia, 14–16 November 2011; Volume 20, pp. 2202–2209. [Google Scholar]
  21. Dino, I. Creative design exploration by parametric generative systems in architecture. METU J. Fac. Archit. 2012, 29, 207–224. [Google Scholar]
  22. Yoon, Y.B.; Manandhar, R.; Lee, K.H. Comparative study of two daylighting analysis methods with regard to window orientation and interior wall reflectance. Energies 2014, 7, 5825–5846. [Google Scholar] [CrossRef]
  23. Pitts, G.; Datta, S. Parametric modelling of architectural surfaces. In CAADRIA 2009: Between Man and Machine-Integration, Intuition, Intelligence, Proceedings of the 14th International Conference on Computer Aided Architectural Design Research in Asia, Yunlin, Taiwan, 22–25 April 2009; National Yunlin University of Science and Technology: Yunlin, Taiwan, 2009; pp. 635–644. [Google Scholar]
  24. Caldas, L.G.; Norford, L.K. A design optimization tool based on a genetic algorithm. Autom. Constr. 2002, 11, 173–184. [Google Scholar] [CrossRef]
  25. Ho, M.C.; Chiang, C.M.; Chou, P.C.; Chang, K.F.; Lee, C.Y. Optimal sun-shading design for enhanced daylight illumination of subtropical classrooms. Energy Build. 2008, 40, 1844–1855. [Google Scholar] [CrossRef]
  26. Reinhart, C.F.; Mardaljevic, J.; Rogers, Z. Dynamic daylight performance metrics for sustainable building design. Leukos 2006, 3, 7–31. [Google Scholar]
  27. Reinhart, C.; Rakha, T.; Weissman, D. Predicting the daylit area-a comparison of students assessments and simulations at eleven schools of architecture. Leukos 2014, 10, 193–206. [Google Scholar] [CrossRef]
  28. Robinson, A.; Selkowitz, S. Tips for Daylighting with Windows; No. LBNL-6902E; Ernest Orlando Lawrence Berkeley National Laboratory: Berkeley, CA, USA, 2013. [Google Scholar]
  29. Lee, K.S.; Han, K.J.; Lee, J.W. Feasibility Study on Parametric Optimization of Daylighting in Building Shading Design. Sustainability 2016, 8, 1220. [Google Scholar] [CrossRef]
  30. Illuminating Engineering Society of North America (IESNA). IES Spatial Daylight Autonomy (sDA) and Annual Sunlight Exposure (ASE); LM-83-12; IESNA Lighting Measurement: New York, NY, USA, 2012. [Google Scholar]
  31. Al-Ghamdi, S.G.; Bilec, M.M. Life-cycle thinking and the LEED rating system: Global perspective on building energy use and environmental impacts. Environ. Sci. Technol. 2015, 49, 4048–4056. [Google Scholar] [CrossRef] [PubMed]
  32. Nabil, A.; Mardaljevic, J. Useful daylight illuminance: A new paradigm for assessing daylight in buildings. Light. Res. Technol. 2005, 37, 41–57. [Google Scholar] [CrossRef]
  33. Nabil, A.; Mardaljevic, J. Useful daylight illuminances: A replacement for daylight factors. Energy Build. 2006, 38, 905–913. [Google Scholar] [CrossRef]
  34. Reinhart, C.F.; Weissman, D.A. The daylit area–Correlating architectural student assessments with current and emerging daylight availability metrics. Build. Environ. 2012, 50, 155–164. [Google Scholar] [CrossRef]
  35. Website of Solemma. Available online: http://www.solemma.net/DIVA-for-Rhino/DIVA-for-Rhino.html (accessed on 9 March 2017).
  36. Mardaljevic, J. Examples of climate-based daylight modelling. In Proceedings of the CIBSE National Conference 2006: Engineering the Future, Oval Cricket Ground, London, UK, 21–22 March 2006. [Google Scholar]
  37. Mohsenin, M.; Hu, J. Assessing daylight performance in atrium buildings by using Climate Based Daylight Modeling. Sol. Energy 2015, 119, 553–560. [Google Scholar] [CrossRef]
  38. Manzan, M. Genetic optimization of external fixed shading devices. Energy Build. 2014, 72, 431–440. [Google Scholar] [CrossRef]
  39. Maleki, B.A. Shading: Passive cooling and energy conservation in buildings. Int. J. Tech. Phys. Probl. Eng. (IJTPE) 2011, 3, 72–79. [Google Scholar]
  40. O’Brien, W.; Kapsis, K.; Athienitis, A.K. Manually-operated window shade patterns in office buildings: A critical review. Build. Environ. 2013, 60, 319–338. [Google Scholar] [CrossRef]
  41. Rea, M.S. The IESNA Lighting Handbook: Reference & Application; Illuminating Engineering Society of North America: New York, NY, USA, 2000. [Google Scholar]
Figure 1. Base model.
Energies 10 00635 g001
Figure 2. Simulation grid analysis. (a) 3-dimensional view of the grid analysis; (b) Plan view of the grid analysis.
Energies 10 00635 g002
Figure 3. Simulation process.
Energies 10 00635 g003
Figure 4. Daylight Autonomy (DA) result in the vertical louver.
Energies 10 00635 g004
Figure 5. Useful Daylight Illuminance (UDI) result in the vertical louver.
Energies 10 00635 g005
Figure 6. DA result in the horizontal louver.
Energies 10 00635 g006
Figure 7. UDI result in the horizontal louver.
Energies 10 00635 g007
Figure 8. DA result in the eggcrate louver.
Energies 10 00635 g008
Figure 9. UDI result in the eggcrate louver.
Energies 10 00635 g009
Figure 10. DA result in the overhang.
Energies 10 00635 g010
Figure 11. UDI result in the overhang.
Energies 10 00635 g011
Figure 12. DA result in the vertical slat.
Energies 10 00635 g012
Figure 13. UDI result in the vertical slat.
Energies 10 00635 g013
Figure 14. DA result in the horizontal slat.
Energies 10 00635 g014
Figure 15. UDI result in the horizontal slat.
Energies 10 00635 g015
Figure 16. DA result in the light shelf.
Energies 10 00635 g016
Figure 17. UDI result in the light shelf.
Energies 10 00635 g017
Figure 18. DA value decrease range (the differences between the average and baseline values) comparison by façade shading type.
Energies 10 00635 g018
Figure 19. UDI value increase range (the differences between the baseline and average values) comparison by façade shading type.
Energies 10 00635 g019
Figure 20. DA value range (the differences between the maximum and minimum values) comparison by façade shading type.
Energies 10 00635 g020
Figure 21. UDI value range (the differences between the maximum and minimum values) comparison by façade shading type.
Energies 10 00635 g021
Table 1. Combination of input parameters for façade shading/window type.
No.Input MaterialsMaterial Name in Design Iterate Validate Adapt (DIVA) Material Properties *
1WallGenericInteriorWall_50Purely diffuse reflector with a standard wall reflectivity * of 50%
2CeilingGenericCeiling_70Material for typical ceilings, as suggested by Illuminating Engineering Society document titled IES LM-83-12: 70% [30]
3WindowGlazing_DoublePane_LowE_65Visual transmittance *: 65%
Visual transmissivity *: 71%
4FloorGenericFloor_20Purely diffuse reflector with a standard floor reflectivity of 20%; Material Type: Opaque
5Façade shadingMatte_SilverDefault material for standard external venetian blind slats and curtain wall frames, reflectivity of 52%
* Reflectance: uniform diffuse reflection is applied; * Transmittance: the fraction of incident light, or other radiation, that passes through a substance; * Transmissivity: the measure of the capacity of a material to transmit radiation (the ratio of the amounts of energy transmitted and received); * Material properties’ definitions from material.rad file in DIVA.
Table 2. Façade shading types.
1. Vertical Louver
Parameter: Count, Depth, Direction
2. Horizontal Louver
Parameter: Count, Depth, Direction
Energies 10 00635 i001 Energies 10 00635 i002
3. Eggcrate Louver
Parameter: Count, Depth, Direction
4. Overhang
Parameter: Count, Depth, Direction
Energies 10 00635 i003 Energies 10 00635 i004
5. Vertical Slat Louver
Parameter: Count, Angle, Direction
6. Horizontal Slat Louver
Parameter: Count, Angle, Direction
Energies 10 00635 i005 Energies 10 00635 i006
7. Light Shelf
Parameter: Depth, Angle, Direction
Energies 10 00635 i007
Table 3. Input parameters. North (N), North-West (NW), West (W), South-West (SW), South (S), South-East (SE), East (E), North-East (NE).
TypeParametersVariablesNumber of VariationsTotal Number of Variations
Vertical LouverCount34567 5200
Depth (cm)4050607080 5
DirectionNNWWSWSSEENE8
Horizontal LouverCount23456 5200
Depth (cm)2030405060 5
DirectionNNWWSWSSEENE8
Eggcrate LouverCount23456 5200
Depth (cm)2025303540 5
DirectionNNWWSWSSEENE8
OverhangCount56789 5200
Depth (cm)7090110130150 5
DirectionNNWWSWSSEENE8
Vertical SlatCount1416182022 5200
Angle (degree)−30−1501530 5
DirectionNNWWSWSSEENE8
Horizontal SlatCount678910 5200
Angle (degree)−15−7.507.515 5
DirectionNNWWSWSSEENE8
Light ShelfDepth (10 cm)911131517 5200
Angle (degree)−30−1501530 5
DirectionNNWWSWSSEENE8
Table 4. Vertical louver DA/UDI results.
DAUDI
Orient.Base LineMax.Ave.Min.RangeAve.-Base LineBase LineMax.Ave.Min.RangeAve.-Base Line
S91.1 *90.5 *88.7 *84.75.8−2.458.672.766.361.211.5 *7.7 *
SE90.990.488.484.8 *5.6−2.561.273.568.163.69.96.9
E90.590.087.582.87.2−368.580.175.270.99.26.7
NE89.889.086.179.99.1−3.777.488.584.280.18.46.8
N89.188.185.078.39.8 *−4.1 *81.4 *91.4 *87.7 *83.8 *7.66.3
NW89.288.485.579.58.9−3.778.888.784.981.17.66.1
W89.989.186.881.97.2−3.170.381.676.772.69.06.4
SW90.489.787.783.56.2−2.761.973.568.564.59.06.6
* The highest value in each index.
Table 5. Horizontal louver DA/UDI results.
DAUDI
Orient.Base LineMax.Ave.Min.RangeAve.-Base LineBase LineMax.Ave.Min.RangeAve.-Base Line
S91.1 *90.1 *76.6 *34.6 *55.5−14.558.680.774.862.518.216.2 *
SE90.990.075.030.559.5−15.961.279.975.365.114.814.1
E90.589.571.621.268.3−18.968.584.479.468.116.310.9
NE89.888.667.58.480.2−22.377.491.784.965.226.57.5
N89.187.664.12.585.1 *−25 *81.4 *94.3 *86.4 *62.931.4 *5
NW89.288.066.26.082.0−2378.892.785.565.727.06.7
W89.988.870.619.169.7−19.370.385.680.669.2 *16.410.3
SW90.489.574.330.459.1−16.161.979.975.565.614.313.6
* The highest value in each index.
Table 6. Eggcrate louver DA/UDI results.
DAUDI
Orient.Base LineMax.Ave.Min.RangeAve.-Base LineBase LineMax.Ave.Min.RangeAve.-Base Line
S91.1 *89.3 *78.0 *47.3 *42−13.158.680.674.26515.615.6 *
SE90.989.176.442.446.7−14.561.279.974.967.512.413.7
E90.588.473.131.457−17.468.582.17974.27.910.5
NE89.887.16919.267.9−20.877.487.284.674.113.17.2
N89.186.266.612.673.6 *−22.5 *81.4 *90.5 *86.1 *71.7 *18.8 *4.7
NW89.286.567.515.770.8−21.778.889.285.672.716.56.8
W89.987.772.331.556.2−17.670.383.280.275.289.9
SW90.488.575.843.145.4−14.661.980.1756812.113.1
* The highest value in each index.
Table 7. Overhang DA/UDI results.
DAUDI
Orient.Base LineMax.Ave.Min.RangeAve.-Base LineBase LineMax.Ave.Min.RangeAve.-Base Line
S91.1 *87.7 *86.1 *84.1 *3.6−558.674.470.466.18.3 *11.8 *
SE90.987.385.984.23.1−561.275.57268.47.110.8
E90.586.685.283.33.3−5.368.578.876.573.55.38
NE89.885.683.981.83.8 *−5.977.485.78381.34.45.6
N89.184.482.780.34.1−6.4 *81.4 *88.8 *85.7 *84.4 *4.44.3
NW89.285.183.381.33.8 *−5.978.886.883.8824.85
W89.98684.582.73.3−5.470.380.47875.25.27.7
SW90.486.785.483.63.1−561.975.972.569.16.810.6
* The highest value in each index.
Table 8. Vertical slat DA/UDI results.
DAUDI
Orient.Base LineMax.Ave.Min.RangeAve.-Base LineBase LineMax.Ave.Min.RangeAve.-Base Line
S91.1 *88.1 *86.0 *82.2 *5.9−5.158.675.271.467.77.512.8 *
SE90.988.1 *85.480.77.4−5.561.276.672.969.27.411.7
E90.587.583.777.69.9−6.868.584.779.876.58.2 *11.3
NE89.886.081.574.012.0−8.377.491.688.285.46.210.8
N89.184.879.870.913.9 *−9.3 *81.4 *92.7 *91.3 *89.5 *3.29.9
NW89.285.480.672.712.7−8.678.891.388.686.15.29.8
W89.986.783.077.49.3−6.970.385.781.077.78.010.7
SW90.487.284.579.47.8−5.961.977.673.269.97.711.3
* The highest value in each index.
Table 9. Horizontal slat DA/UDI results.
DAUDI
Orient.Base LineMax.Ave.Min.RangeAve.-Base LineBase LineMax.Ave.Min.RangeAve.-Base Line
S91.1 *84.2 *75.4 *48.9 *35.3−15.758.680.676.569.311.317.9 *
SE90.983.673.643.540.1−17.361.28076.971915.7
E90.582.369.732.949.4−20.868.582.180.475.46.711.9
NE89.880.565.221.159.4−24.677.486.78574.212.57.6
N89.178.862.113.265.6 *−27 *81.4 *88.9 *86 *72.2 *16.7 *4.6
NW89.279.463.417.462−25.878.888.185.873.914.27
W89.981.268.830.850.4−21.170.38381.375.27.811
SW90.482.972.74240.9−17.761.980.176.971.38.815
* The highest value in each index.
Table 10. Light shelf DA/UDI results.
DAUDI
Orient.Base LineMax.Ave.Min.RangeAve.-Base LineBase LineMax.Ave.Min.RangeAve.-Base Line
S91.1 *89.7 *74.1 *22.3 *67.4−1758.682.675.462.9 *19.616.8 *
SE90.989.472.421.468.0−18.561.282.776.059.023.614.8
E90.588.668.813.475.3−21.768.586.480.553.532.912
NE89.887.464.24.882.6−25.677.492.585.647.844.78.2
N89.186.661.62.484.2 *−27.5 *81.4 *95.2 *86.9 *44.151.1 *5.5
NW89.287.063.53.983.1−25.778.893.386.146.147.27.3
W89.988.068.112.475.6−21.870.387.581.553.933.611.2
SW90.488.771.720.568.1−18.761.983.276.459.323.914.5
* The highest value in each index.

