
Study on the Characteristic Decomposition Components of DC SF6-Insulated Equipment under Positive DC Partial Discharge

1
State Key Laboratory of Power Transmission Equipment & System Security and New Technology, Chongqing 400000, China
2
Chongqing Power Company, Chongqing 400000, China
*
Author to whom correspondence should be addressed.
Energies 2017, 10(5), 640; https://doi.org/10.3390/en10050640
Submission received: 15 March 2017
/
Revised: 24 April 2017
/
Accepted: 28 April 2017
/
Published: 5 May 2017
(This article belongs to the Special Issue Selected Papers from 2016 IEEE International Conference on High Voltage Engineering (ICHVE 2016))
Abstract
:Pulses with different amplitudes occur when an inner partial discharge fault exists in SF6-gas-insulated DC high-voltage electrical equipment. SF6 decomposes following complex physical and chemical processes. Discussing and quantifying the mathematical relationship of pulse discharge quantities to SF6 decomposition component characteristics is helpful to evaluate and predict the insulation fault severity and development trends in SF6-insulated DC equipment. Numerous simulation experiments on SF6 decomposition under positive DC partial discharge were performed on a needle-plane model. The DC partial discharge quantities of pulses are obtained, and decomposition characteristics based on the mechanism of SF6 decomposition are analyzed. Results show that generation, effective generation rate and concentration ratio c(SO2F2 + SOF4)/c(SOF2 + SO2) of components increase with partial discharge severity, and the first two act in the following order: SOF4 > SOF2 > SO2F2 > SO2 > CF4 when the discharge quantity level is higher than 238,957 pC. Finally, a coefficient matrix illustrates the mathematical effects of pulses with different discharge quantities on different SF6 decomposition components. The pulses whose discharge quantity is higher than 50 pC have obvious promotion effects on the formation of decomposition components, whereas the pulses whose discharge quantity lower than 50 pC decrease the positive promotion effects that large discharge pulses have on decomposition components. The higher the effective generation rates are, the greater the partial discharge severity is, and their change laws provide a new method to evaluate and predict insulation fault severity and development trends in DC SF6-insulated equipment with high reliability and detection stability.
1. Introduction
SF6 is widely used as a gaseous dielectric in gas insulation power transmission and transformation equipment for its excellent arc-interrupting ability and insulation performance [1,2,3,4]. However, SF6 can decompose into SO2F2, SOF2, SOF4, SO2 and CF4 under different forms of electrical discharges due to the different types of insulation faults existing in SF6-gas-insulated high-voltage electrical equipment, no matter whether DC equipment (such as DC gas insulated transmission line and DC gas insulated switchgear, which are new equipment for electrical energy transmission) [5,6,7,8] or AC equipment [9,10,11,12,13,14] is involved. DC partial discharge (PD) pulses with different amplitude lead to deterioration of the insulating qualities of gas or SF6-gas-insulated equipment, further corrode the internal parts of equipment, and seriously affect DC equipment operation safety [12,13]. Normally, a PD (AC PD or DC PD) in SF6 is described as a low temperature plasma discharge with energy ranging from 10−3 to 10−2 J per pulse and discharge quantity ranging from 10 to 105 pC [5]. However different from AC PD, DC PD pulses present densely and persistently without phase difference. The magnitudes of positive DC PD on needle-plane electrodes are non-uniform and large, and larger than the magnitudes of negative PD that occurs in AC or negative DC under same conditions, whereas the repetition rate is much lower. The difference may be due to the electron initiation that mainly occurs via field-enhanced collision detachment of negative ions for positive DC PD or via field emissions from the point electrode for negative PD [15].
Many methods for insulation fault diagnosis have been realized by PD detection, whereas the method of Decomposed Components Analysis (DCA) is a better one due to the stable chemical properties and the characteristics unaffected by electromagnetic environment interference compared with the ultra-high-frequency electromagnetic wave detection (UHF), pulse current or other methods based on physical theories. The method has attracted wide attention in the literature [12,13,14,16] under AC PD or overheating fault [17] conditions, where the generation, generation rate and characteristic component’s concentration ratio were proposed to build SF6 insulation fault information for identification of the fault severity of electrical equipment. On the other hand basic SF6 decomposition mechanisms under DC PD were just simply mentioned by a few scholars (mainly by Van Brunt [8,15,18,19] and Casanovas [6,20]) and are insufficient for fault type and fault severity identification in SF6-gas-insulated DC gas equipment. Van Brunt has proposed the generation rates of SOF4, SO2F2 and SOF2 range from 5.92 to 8.60 nmol/J, 1.29 to 4.51 nmol/J and 1.28 to 5.20 nmol/J, respectively, under positive DC PD when gas pressures range from 114 to 300 kPa, corresponding to a power dissipation range from 0.054 to 4.3 W and discharge currents ranging from 1.5 to 64 μA [8]. Casanovas has proposed the generation of SO2F2, SOF4, SOF2 and S2F10 are different and influenced by gas pressure, current intensity and electrode material under AC or negative DC PD conditions [20]. In addition, Van Brunt [8], Casanovas [6], Derdouri [21] and some scholars mentioned in [5] proposed the generation of decomposition components increases with accumulating discharge quantity. Few studies have focused in details on the characteristics of SF6 decomposition under positive DC PD and the mathematical relationship between discharge quantities and SF6 decomposition components generation rate, which are essential for the identification.
Therefore, in our experiments, as insulation fault diagnosis is strongly dependent on the reliability of gas detection results and the relationship between discharge quantities and characteristics of gas decomposition, SOF4, SO2F2, SOF2, SO2 and CF4 are chosen as the characteristic decomposition components. This is due to their high concentrations and stable chemical characteristics compared with the other gases under DC PD in SF6-insulated equipment. The discharge quantities at different levels, and the generation and generation rates of SOF4, SO2F2, SOF2, SO2, and CF4 with extended discharge times were obtained and studied. A mathematical coefficient matrix was proposed to illustrate the different promotion effects of discharge quantities on SF6 decomposition components, which can be used as a criterion to evaluate and predict the insulation fault severity and development trend. The method using gas detection provides a new way to realize fault diagnosis and ensure the running stability of DC SF6-insulated equipment.
2. Experiments
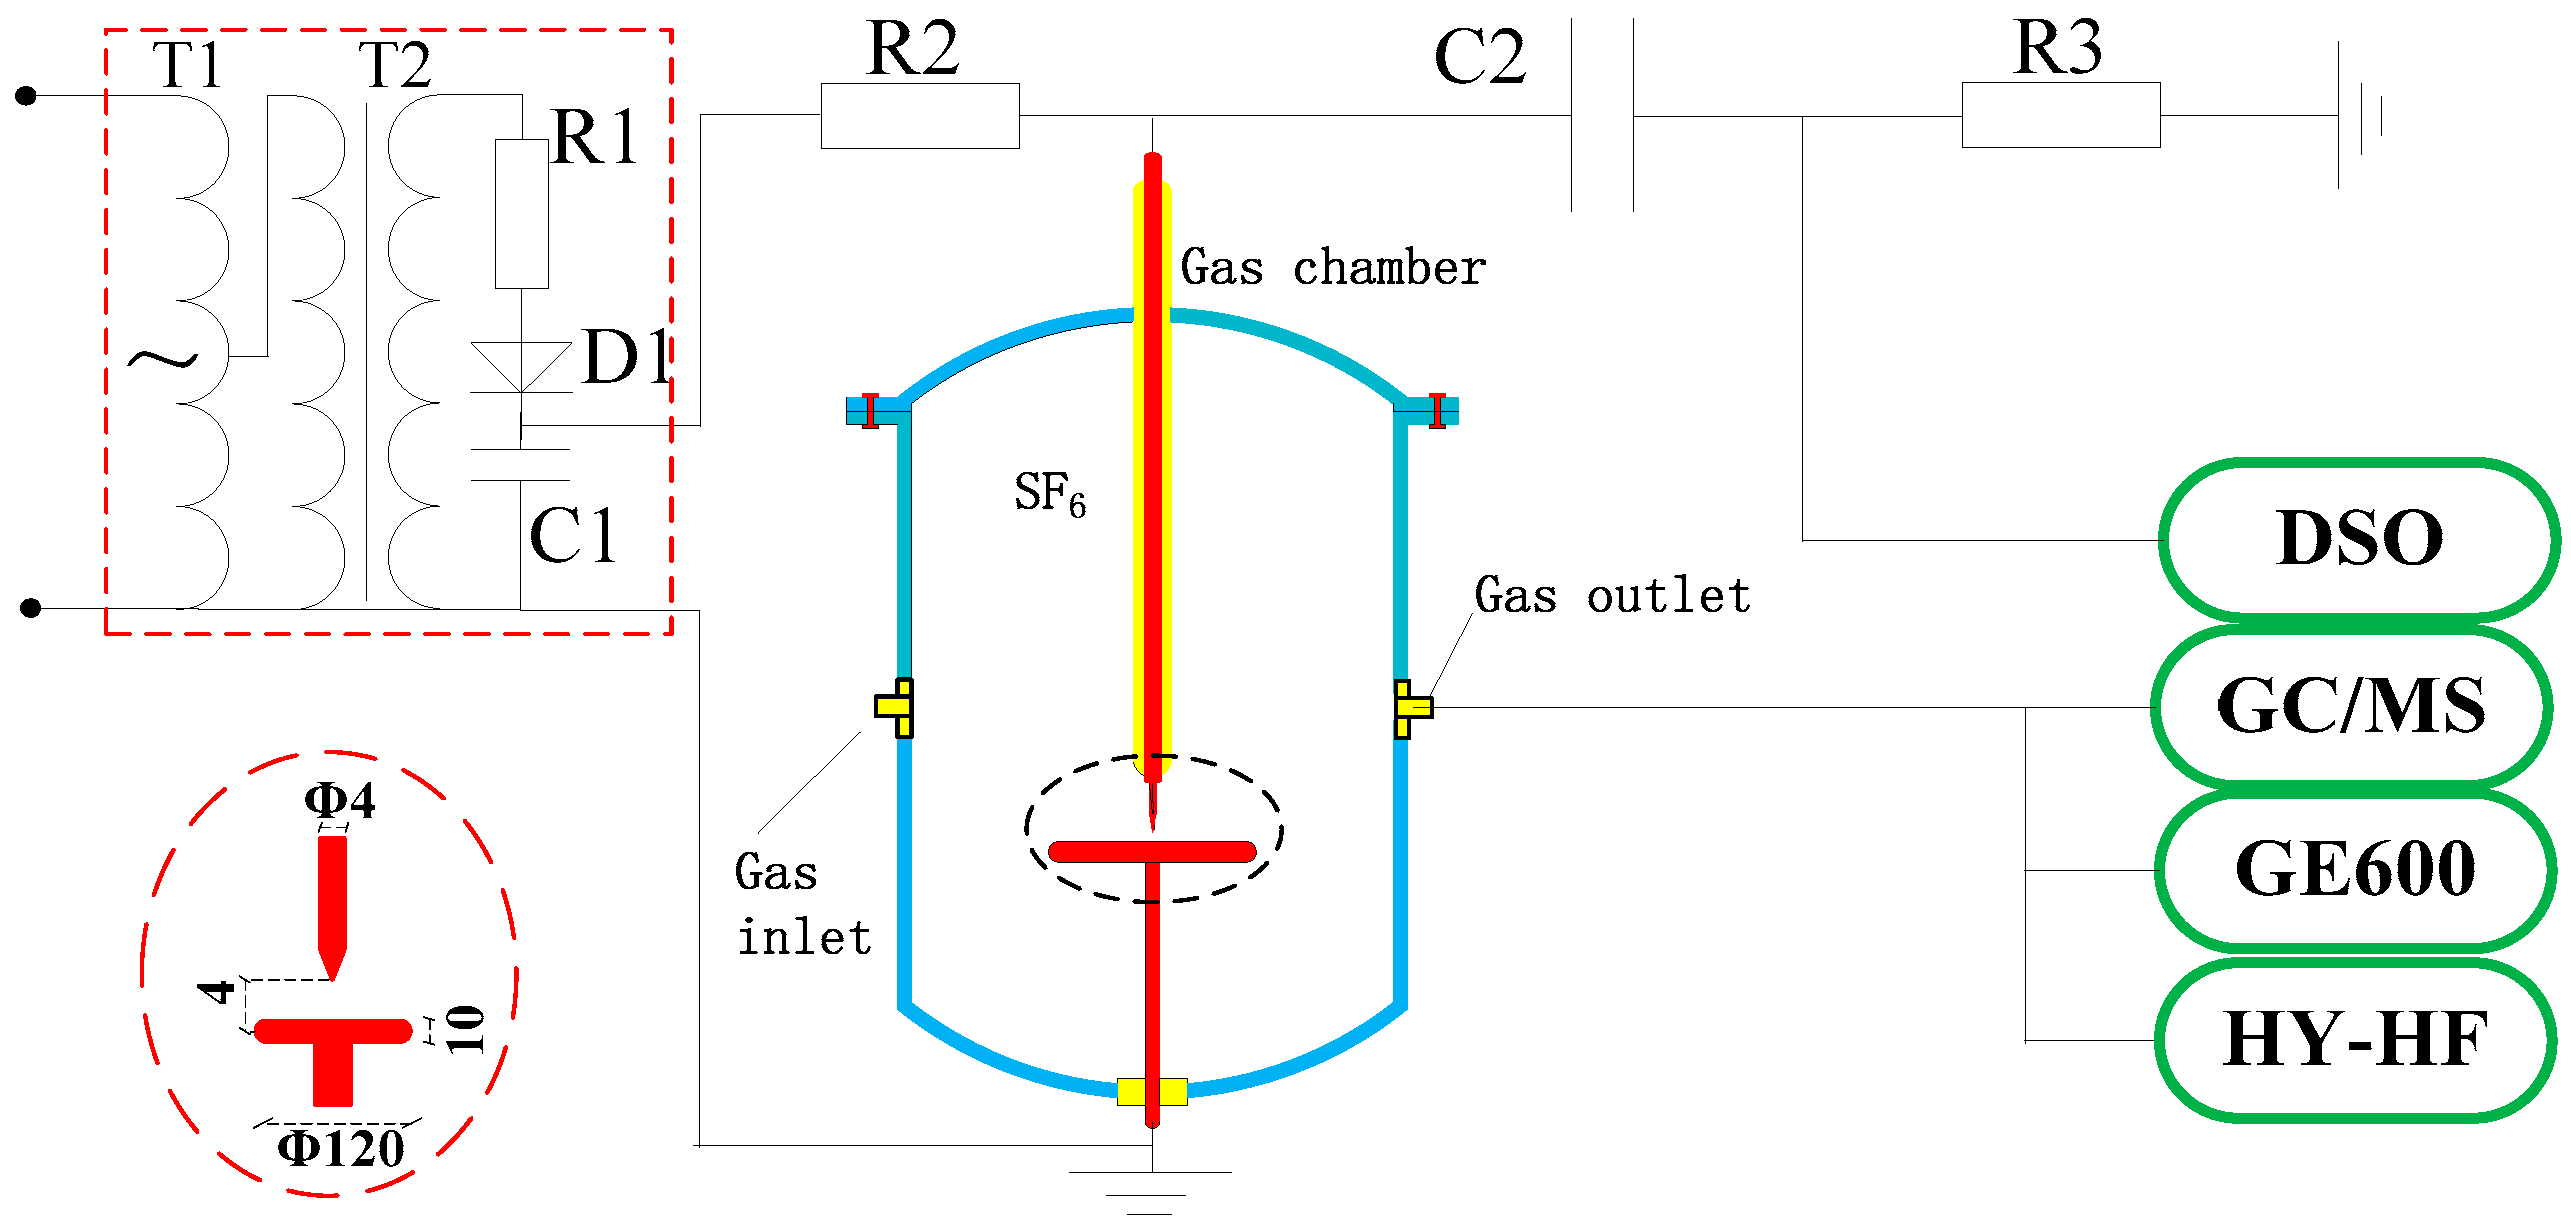
The SF6 decomposition experiment platform is shown in Figure 1. The high-voltage DC power supply is composed of a voltage regulator (T1, input: 220 V, output: 0–250 V), non-partial discharge testing transformer (T2, 10 kVA/50 kV), water resistance (R1, >10 MΩ), high-voltage silicon stack (D1, 100 kV/5 A), and filter capacitance (C1, 0.1 μF). When the DC voltage is applied on the needle-plane electrode, a PD pulse current is generated. According to the PD pulse detection method in IEC 60270, the pulses signal passes through the coupling capacitance (C2, 2023 pF) and non-inductive resistor (R3, 50 Ω). The signals are displayed and stored in a digital oscilloscope (7100XL, WavePro, New York, NY, USA; analog band: 1 GHz; sample rate: 20 GHz; storage depth: 48 MB), and finally turned into discharge quantity signals by the calibrating pulse (generated by an impulse correction generator). The concentration of decomposition components is detected by GC (CP-3800, Varian, Milpitas, CA, USA) and GC/MS. The gas chamber volume is 15 L. The needle-plane electrode is stainless steel with an electrode distance of 4 mm, a needle diameter of 4 mm, a needle tip curvature radius of 0.3 mm, a cone closed angle of 30°, a plate diameter of 120 mm, and a thickness of 10 mm. The needle-plane model is used to simulate the most common metal protrusion fault in the SF6 electrical equipment.
Before the experiment, the chamber wall and needle-plane electrodes should be cleaned with ethanol to avoid the influence of impurities and residual decomposition products from preceding experiments on the experiment results. The H2O and O2 concentration in the SF6 should be lower than 50 ppmv and 1000 ppmv in the main chamber of an operating SF6 insulated apparatus, respectively, for the requirements in IEC60480-2005 and IEC60376-2005. The gas temperature should be 25 ± 3 °C and then the chamber is filled with pure SF6 (99.999% purity) to 0.2 MPa. The experiment lasts for six hours, and PD signals and decomposition component concentrations are detected six times (i.e, the sampling interval is 1 h) using a sampling time of 1 s, and PD signal sample rate is 25 Ms/s.
3. Results and Discussion
Four voltages (22.75, 29.25, 35.75 and 42.25 kV) were set in the experiments to obtain different PD strengths (PD severity). The PD inception voltage of the needle-plane electrode was 20.5 kV.
3.1. Positive DC Partial Discharge
The generation of SF6 decomposition components not only relates to the PD pulse’s total discharge quantity (representing PD strength or discharge energy), but is also related to the promotion efficiency that pulses exert on the components. The promotion efficiency would not be same, no matter whether the pulses with different discharge quantities affect the same decomposition components or the pulses with the same discharge quantity affect different decomposition components. Van Burnt [18] proposed that PD pulse amplitudes are widely distributed, and most of them have a low discharge quantity, whereas few of them have a high discharge quantity.
Then, not only the final effect on the decomposition of pulses have on components could be studied, but also the specific relationship between PD discharge quantity and the generation law of SF6 decomposition components could be analyzed in depth. Then all pulses could be layered into several classes according to their different discharge quantity value (representing their discharge strength). However, the more classes that are layered, the more specific the relationship that could be obtained will be, but the difficulty of analysis is increased. Therefore, to simplify the amount of analysis, four classes were chosen: lower than 50 pC, 50–100 pC, 100–150 pC and more than 150 pC respectively, and all pulse promotion efficiencies in one class on one kind of decomposition component were assumed the same. In addition, the pulses whose discharge quantity has higher than 150 pC were classified into three classes to obtain more specific pulse distribution information, that is 150–200 pC, 200–400 pC and more than 400 pC. Finally, the pulse number and single pulse discharge quantity in class i were marked as Ni and Qi, respectively, and their average values in six classifications were marked as ( and . Their average values in different classes were marked as , , , , , , , , , , and , respectively. Furthermore, was used to present the sum of to and was the sum of to , and was . The results are listed in Table 1.
As shown in Table 1, as the experiment voltage increased from 22.75 kV to 42.25 kV: (1) , and increased sharply, increased about three-fold. increased first and then decreased. (2) , , , , , and increased gradually, and increased by approximately 32 times. (3) , , , , and increased firstly then decreased. (4) and under the same experiment voltage conditions increased firstly and then decreased. As also shown in Table 1, the pulse discharge quantity and pulse number in different classes varied with the experimental voltage, and , as a key parameter of SF6 decomposition, was used here to present the PD strength or fault severity, then the four PD strengths were presented as 238,957, 443,476, 641,815 and 718,343 pC, respectively.
Positive DC PD pulses of the needle-plane model are dense and stable and their energy supplied for SF6 decomposition per unit time are similar, although with heterogeneous amplitudes, so per unit time would not change much.
3.2. Generation of SF6 Characteristic Decomposition Components
The decomposition process of SF6 under positive DC PD is a complex physical and chemical process, which involves collision, ionization, excitation, and composition of different types of particles [22,23,24,25,26,27]. The process affects PD number, PD strength and final concentration of SF6 decomposition components.
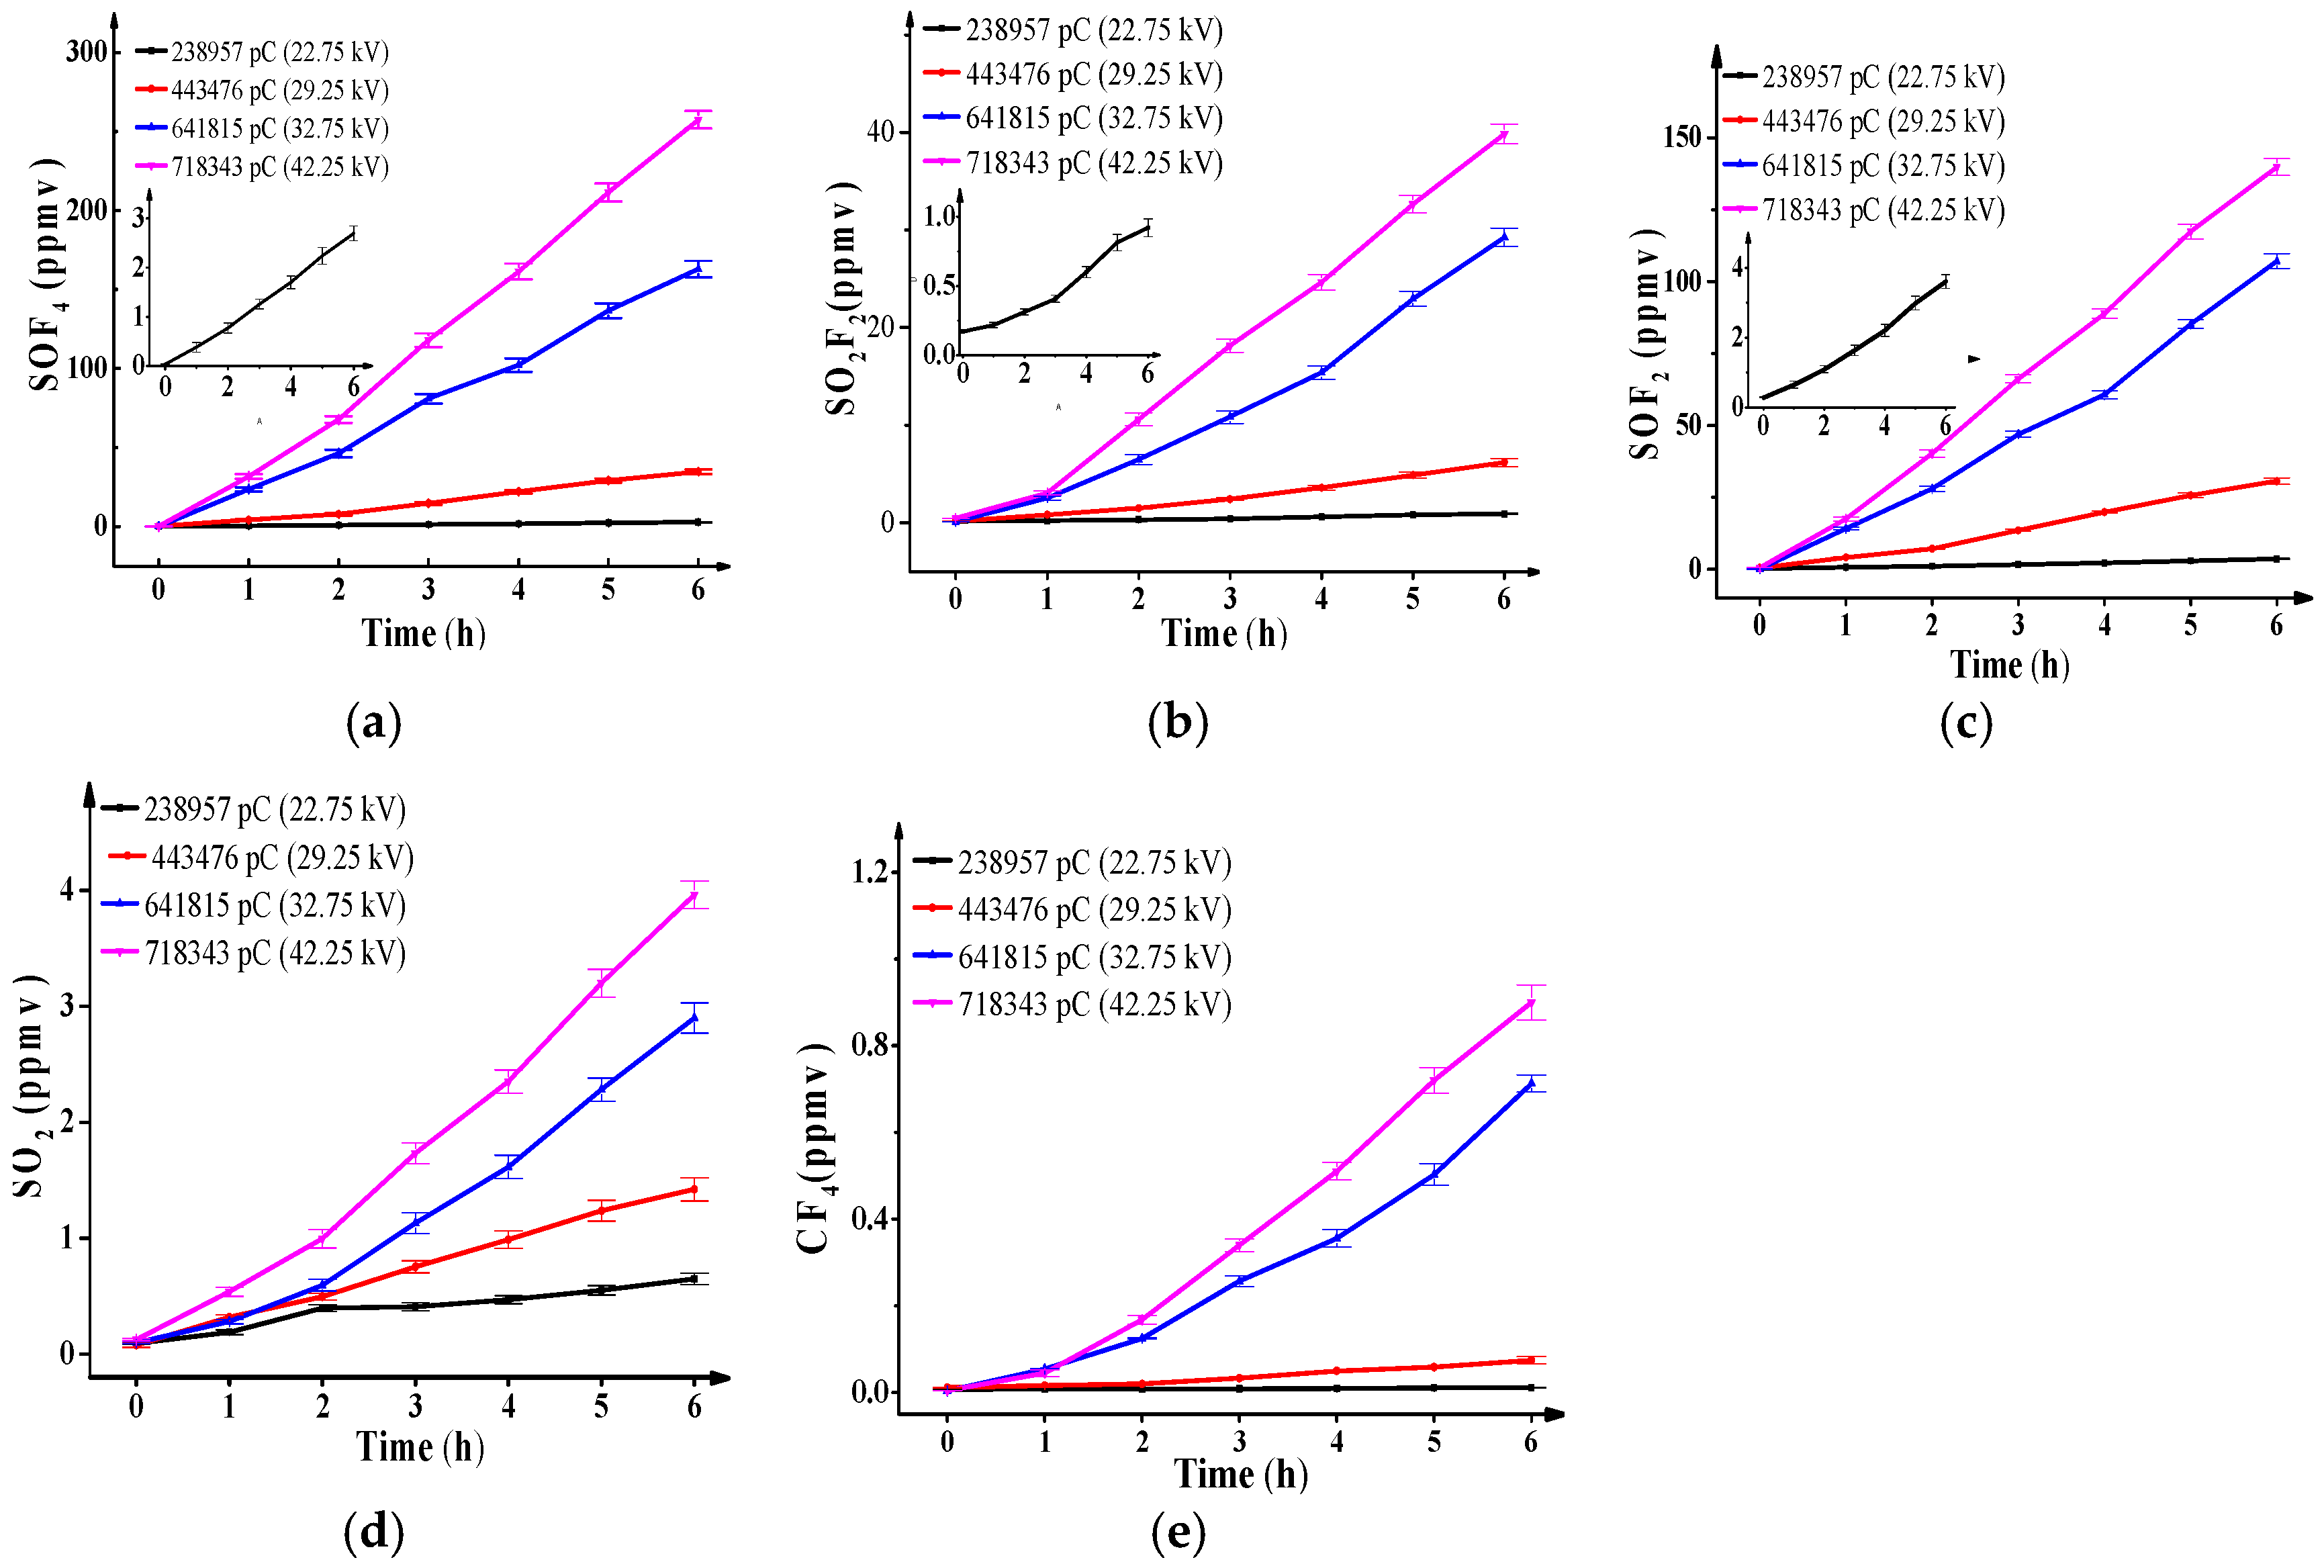
Figure 2 shows the concentration of SO2F2, SOF4, SOF2, SO2 and CF4 against discharge quantities and discharge time. The results are as follows: (1) when the experiment voltage is certain, that is, when the total discharge quantity is certain, the concentration of all decomposition components increases linearly with the discharge time. (2) The concentration of all decomposition components increases with the discharge quantity level, and the concentration order is: SOF4 > SOF2 > SO2F2 > SO2 > CF4 when the total discharge quantity is higher than 238,957 pC. SOF4 is the most significant one. Similar results also presented in [8].
According to the bond dissociation energy [28], the dissociation energy of the F-SFX bond is 343.5, 389.1, 286.2, 339.3, 224.7, and 391.6 kJ/mol when the factor x is 5, 4, 3, 2, 1, and 0, respectively, For the SFx decomposed from SF6, and the small x corresponds to a greater electron energy. The reactions are given by Equations (1) and (2) [18]:
As the experimental voltage increases, the ionization intensity of PD gradually strengthens, and pulses with large amplitudes gradually appear (e.g., > 150 pC), and the total discharge quantity gradually increases. Furthermore, the number of electrons with high energy gradually increases as well. Therefore, F, SF5, SF4, SF3, SF2, SF, and S gradually appear, and their generation increases. Similarly, free radicals, such as O and OH, increase as well. Their decomposition reactions are listed in Equations (3)–(5) [8,18,19], the bond energy of O=O is 499 kJ/mol, and H-OH is 498.4 kJ/mol [28].
The generation of characteristic SF6 decomposition components can be analyzed as follows:
(1) SOF4
Van Brunt proposed that upon discharge most parts of low-fluorine sulfur in the ionization area combined into SF6 molecules with F, and only a smaller part of them combined into oxyfluorides with O, or OH [8]. This process is irreversible. SOF4 is generated from the reactions of SF5, SF4, and O, OH as shown in (6)–(8) [8,18,19], stands for reaction rate coefficient. The k estimated under negative DC PD or 298 k, respectively, is not a real value of the positive DC discharge, but can provide a reference value due to the similar reaction conditions, such as reaction temperature, reactant, and energy level afford to gas decomposition and no catalyst used in reaction. Then, the rate coefficients in Reactions (9) and (11)–(17) are reference values too for the similar reason. The higher the is, the easier is it for the reaction to proceed if all other reaction conditions are same, and the higher the concentrations of reactants are:
When the total discharge quantity is 238,957 pC, the maximum discharge quantity of a single pulse is only 176 pC, is approximately 74% of the total discharge quantity , is approximately 91% of the total pulse number . Then, the average energy of electrons is not high, SF5 and SF4 are abundant whereas SF3 and SF2 are scarce. Furthermore, O2 and H2O are scarce in relation to SF6 (approximately 10−6 times), then few O=O, H-OH are broken off and few O, OH generates, so naturally the concentration of SOF4 is extremely low, and less than 3 ppmv at the end of experiment.
On the contrary, when the total discharge quantity increases to 718,343 pC, is 619 pC, is approximately 69% of , and is approximately 53% of . The average energy of electrons increases quickly, and which leads to more broken bonds and greater generation of O and OH as indicated in Reactions (6)–(8). The concentration of SOF4 increases sharply and is up to 257 ppmv at the end of the experiment.
(2) SO2F2
SO2F2 is mainly generated from the combination of SOF4 and H2O in the main gas chamber [19] as indicated by Reaction (9):
Given the restrictions of the extremely low hydrolysis rate and water concentration in the reaction, the concentration of SO2F2 is lower and less than 1 ppmv at the end of the experiment, it is much lower than the concentration of SOF4 when is not high. However, as increases to 718,343 pC, large amounts of SF3 and SF2 are generated under high-energy electrons collisions and combine with O2 in main gas chamber into SO2F2 as Reactions (10) and (11) indicate [8]. The reaction rate is high, then, the concentration of SO2F2 increases rapidly and is close to 40 ppmv at the end of the experiment. The generation depends on the amount of SF3 and SF2 generated in the reaction, but it is still far lower than that of SOF4. The consumptions in Reaction (9) are negligible for the low rate coefficients:
(3) SOF2
SF5 in the ionization area is not stable and easily combines into SF6 with F atoms. SF4 is relatively stable and combines into SOF2 with OH and H2O as Reactions (12) and (13) show [18,19]:
When increases, SF3, SF2, O, and OH increase and their modes of combination change as indicated in Reactions (14)–(16) [18,19]. Strong ionization corresponds to great active particle energy. Then the concentration of SOF2 can increase sharply up to 140 ppmv at the end of the experiment, which is higher than that of SO2F2 but still lower than that of SOF4.
(4) SO2
Similar to the hydrolysis of SOF4 shown in Reaction (17) [19], SOF2 diffuses to the main gas chamber and combines with gaseous water to form SO2. Meanwhile, SO2 continues to react with H2O in the chamber and generates H2SO3 [19]. Nevertheless, given the extremely low hydrolysis rate of SO2 and little consumption, the final concentration of SO2 is still low (less than 4 ppmv) at the end of the experiments:
(5) CF4
CF4 is formed from C and F atoms [13], as shown in Reaction (19):
where, F atoms from the decomposition of SF6 are sufficient, but the amount of C atoms, part of them released from the metal vapor in discharge area on the needle electrode surface or decomposed from impurities in the SF6 gas (such as trace CO2 or trace C2F6), is extremely limited. Furthermore, the metal vapor is hard to heat with the collision energy of negative ions on the positive electrode. Thus, the concentration of CF4 is low and near zero. When the discharge quantity increases from 238,957 pC to 718,343 pC, the collision of higher-energy negative ions crashing onto the metal electrode surface enhances the gasification process of metal and breaks more impurity molecule bonds, then more C atoms are released, and CF4 generation improves. However, it is still the lowest one among all SF6 decomposition components. The concentration of CF4 reflects the PD strength well.
The above analysis show that the increase of the concentrations of SOF4, SO2F2, and SOF2 with PD quantity are more significant than that of SO2 and CF4. The change trend can be used to distinguish the degree of PD strength or PD severity. However, the conclusions are only applicable to a situation where the gas moisture concentration is extremely low and SOF4 cannot easily be hydrolyzed.
3.3. Generation Rates of SF6 Characteristic Decomposition Components
The generation of SF6 decomposition components is the cumulative result of the decomposition in a certain discharge time under a certain discharge quantity. However, a long time will be needed to distinguish PD strength by observing the change trends of component generation. The observation of the change of generation rate law of components per unit time appears more therefore efficient, to reflect the influence of the discharge quantity on SF6 decomposition component generation in real time and objectively, the absolute generation rate and effective generation rate are proposed for this purpose in this paper. The respective mathematical formulas are written as Equations (20) and (21) [29]. The effective generation rate has greater statistical significance and contains more information:
where indicates a sampling interval, which is 1 h, is the difference between adjacent concentrations, and is the initial concentration of decomposition components in new SF6.
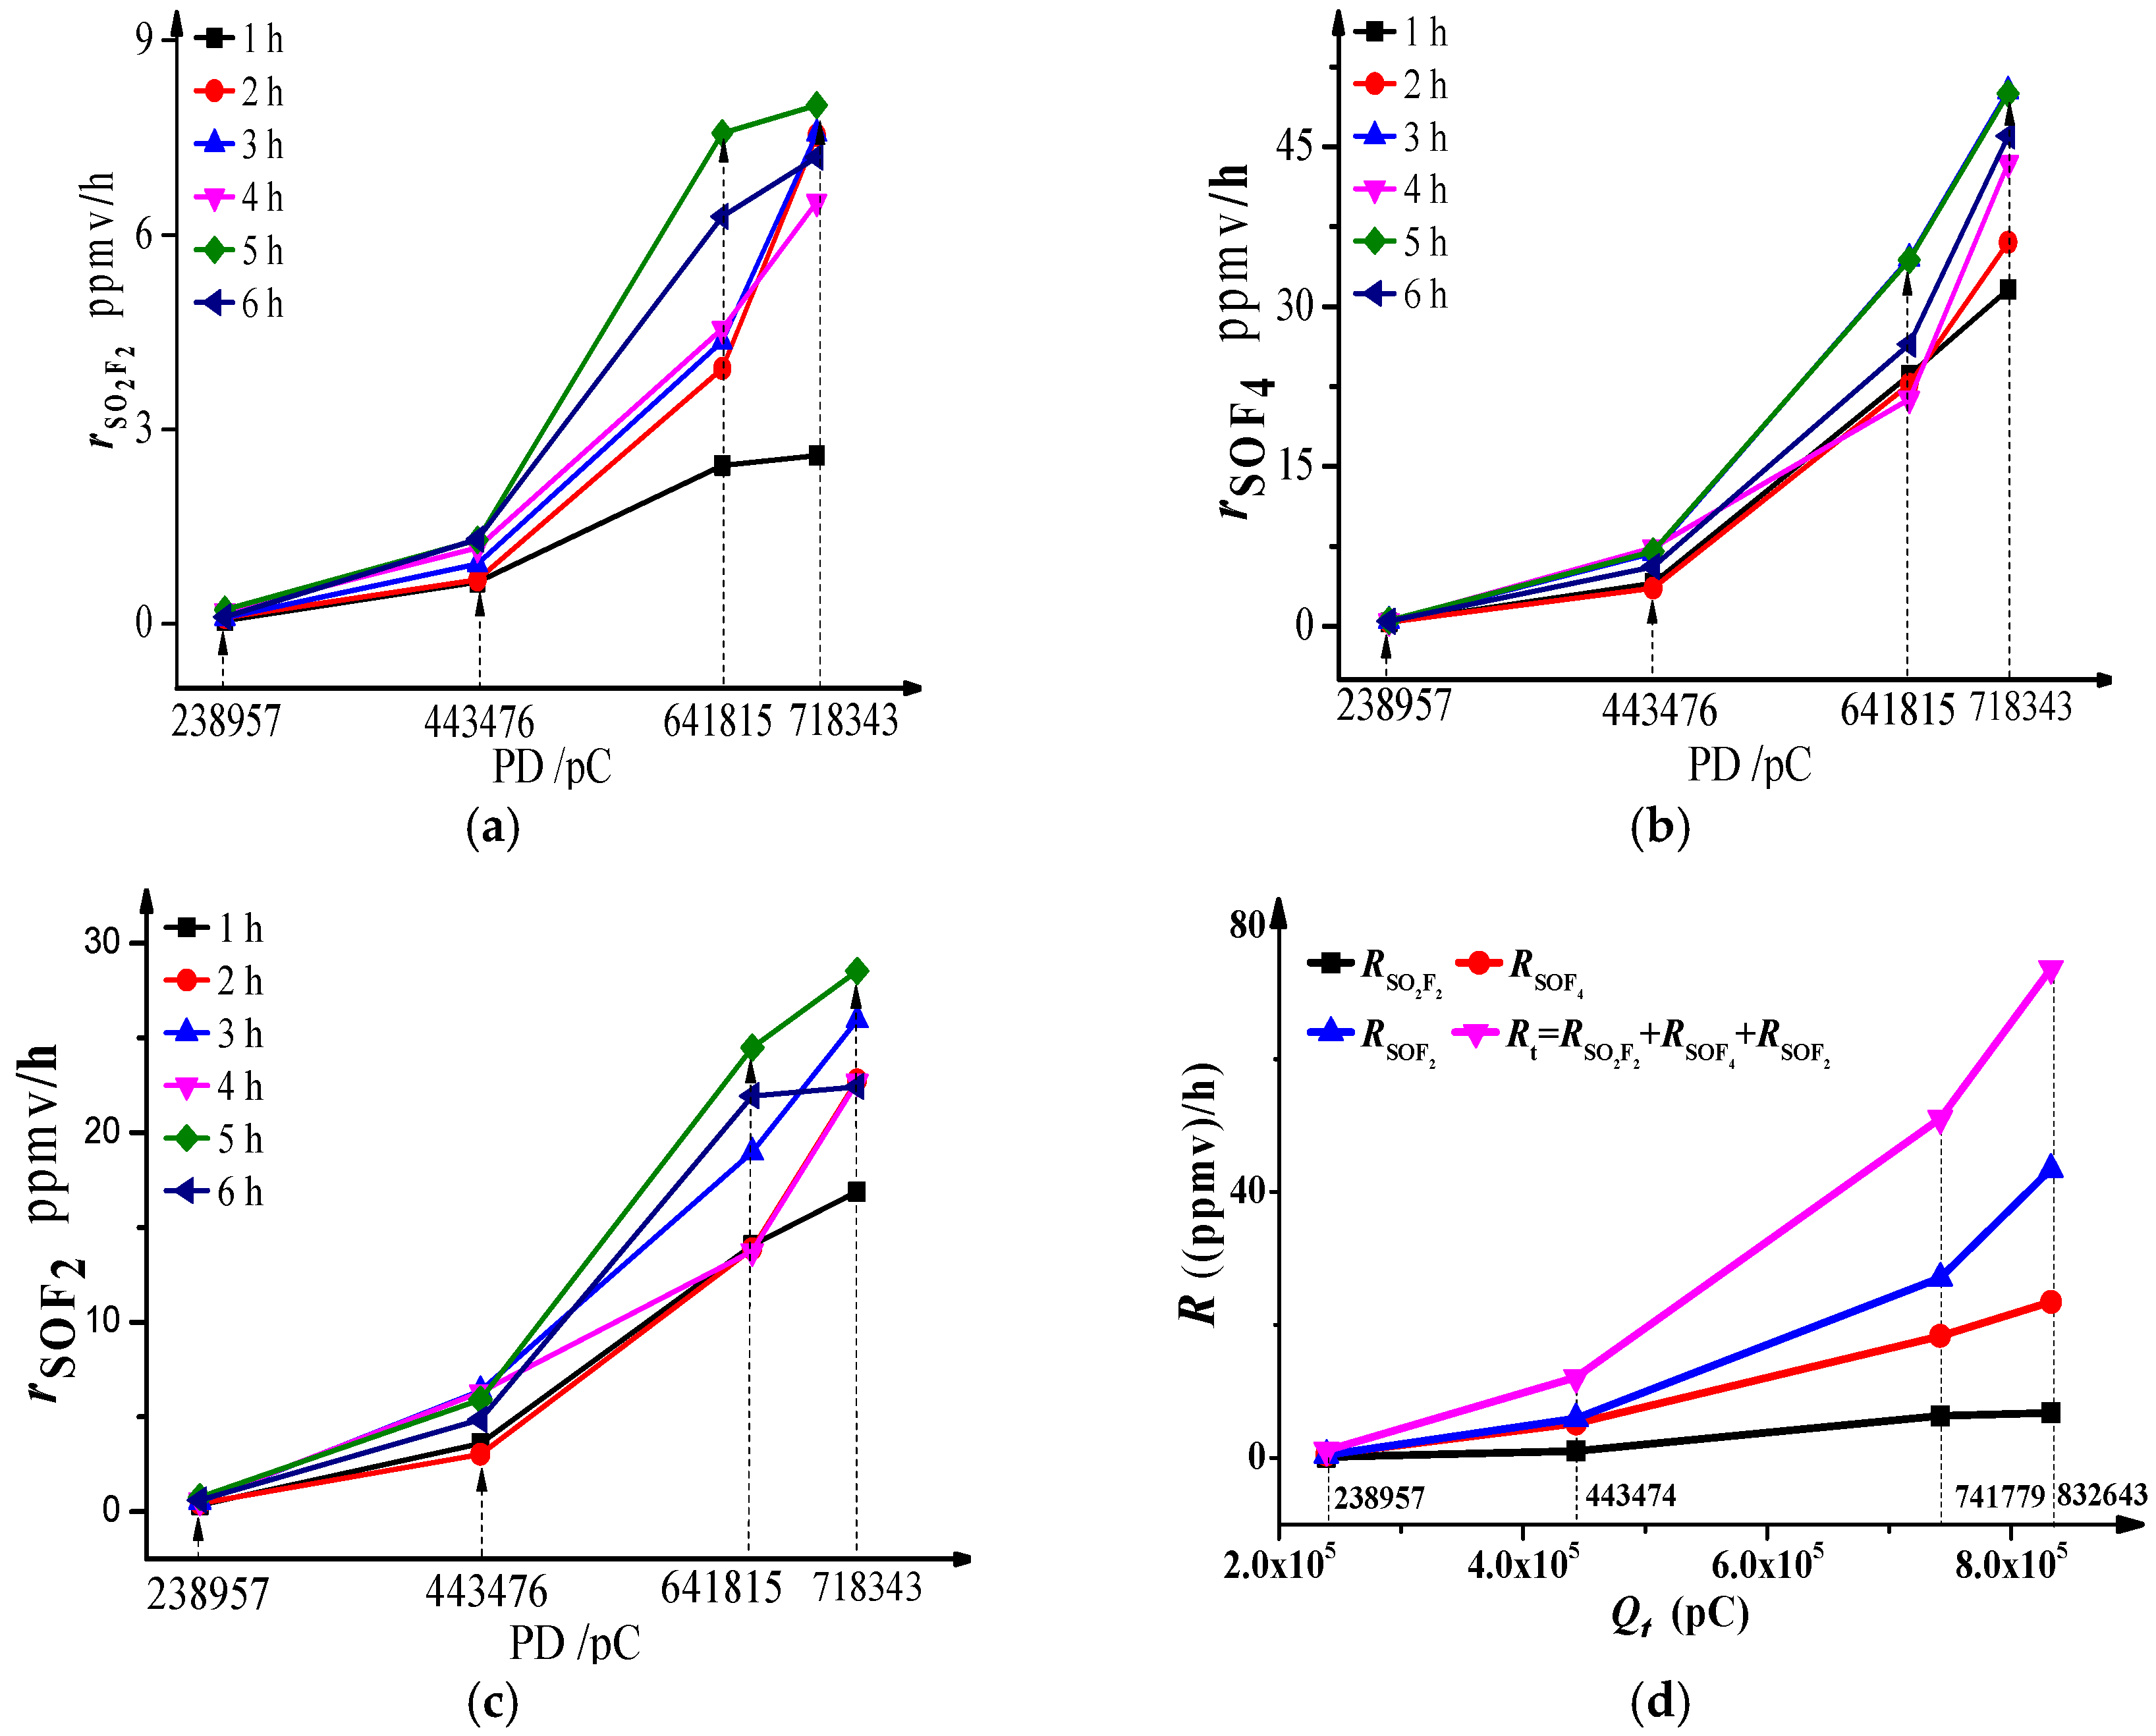
The mathematical relationship between the absolute generation rates and effective generation rates of SOF4, SOF2, and SO2F2 against discharge quantity are shown in Figure 3. The results indicate: (1) whatever the total discharge quantity level is, the absolute generation rates of SO2F2, SOF4 and SOF2 fluctuate around a certain value after 1 h, whereby the values of the three components are 7.36, 45.14 and 24.47 ppmv/h, respectively, when is 718,343 pC, and the fluctuations (variance) are 0.5, 5.22 and 2.41 ppmv/h. The lower the voltage is, the smaller the sum of the fluctuation of the three components is. (2) As shown in Figure 3d, the effective generation rates of SOF4 increase dramatically against total discharge quantity whereas the effective generation rates of SOF2 and SO2F2 do not increase so much. That means the effective generation rate order is: when is greater than 238,957 pC. This is similar to the generation order of decomposition components. Van Brunt proposed similar conclusions in [8].
As mentioned in Table 1, when the voltage is relatively low, the pulse discharge quantities are small, and most of them are lower than 100 pC, so the total discharge quantity per unit time would not change much. However, as the voltage increases, the pulse amplitudes increase inhomogeneously, and the discharge quantities distribute widely from 50 pC to 619 pC, and the total discharge quantity fluctuates to some degree, so naturally, the generation rates of decomposition components fluctuate too. The smaller the difference of discharge quantity between the discharge pulses, the smaller a fluctuation sum we have. Meanwhile, when the total discharge quantity is low, few active O and OH particles are generated, so SF4 tends to spread into the ionization area periphery to react with H2O to generate SOF2 rather than to generate SOF4, and the concentration of SOF2 is slightly higher than that of SOF4, whereas, when the total discharge quantity grows, SF4 and SF5 tend to react with O and OH to form SOF4, and the reaction amount is more than that of SF3 and SF2 reacting with O and OH, because the low-amplitude pulses and low-energy electrons are still a majority, and the concentration of SF4 is the highest among the low-fluorine sulfur species. Therefore, the generation and generation rate of SOF4 are higher than that of SOF2. Furthermore, the consumption of SOF4 and SOF2 in hydrolysis reactions is small and has little influence on the final generation. Then, the concentration of their hydrolysis products SO2F2 and SO2 are lower than those of SOF4 and SOF2 respectively. When the discharge quantity is high, SF3 and SF2 prefer to react with O atoms than O2 due to their different activities; the generation and generation rate of SOF2 are higher than that of SO2F2.
Actually, the change of main generation way of SOF4, SOF2 and SO2F2 is the main reason for the nonlinear increase of effective generation rates when the discharge quantities increase. The change trend of effective generation rate can be used to distinguish PD strength.
3.4. Concentration Ratios of SF6 Characteristic Decomposition Components
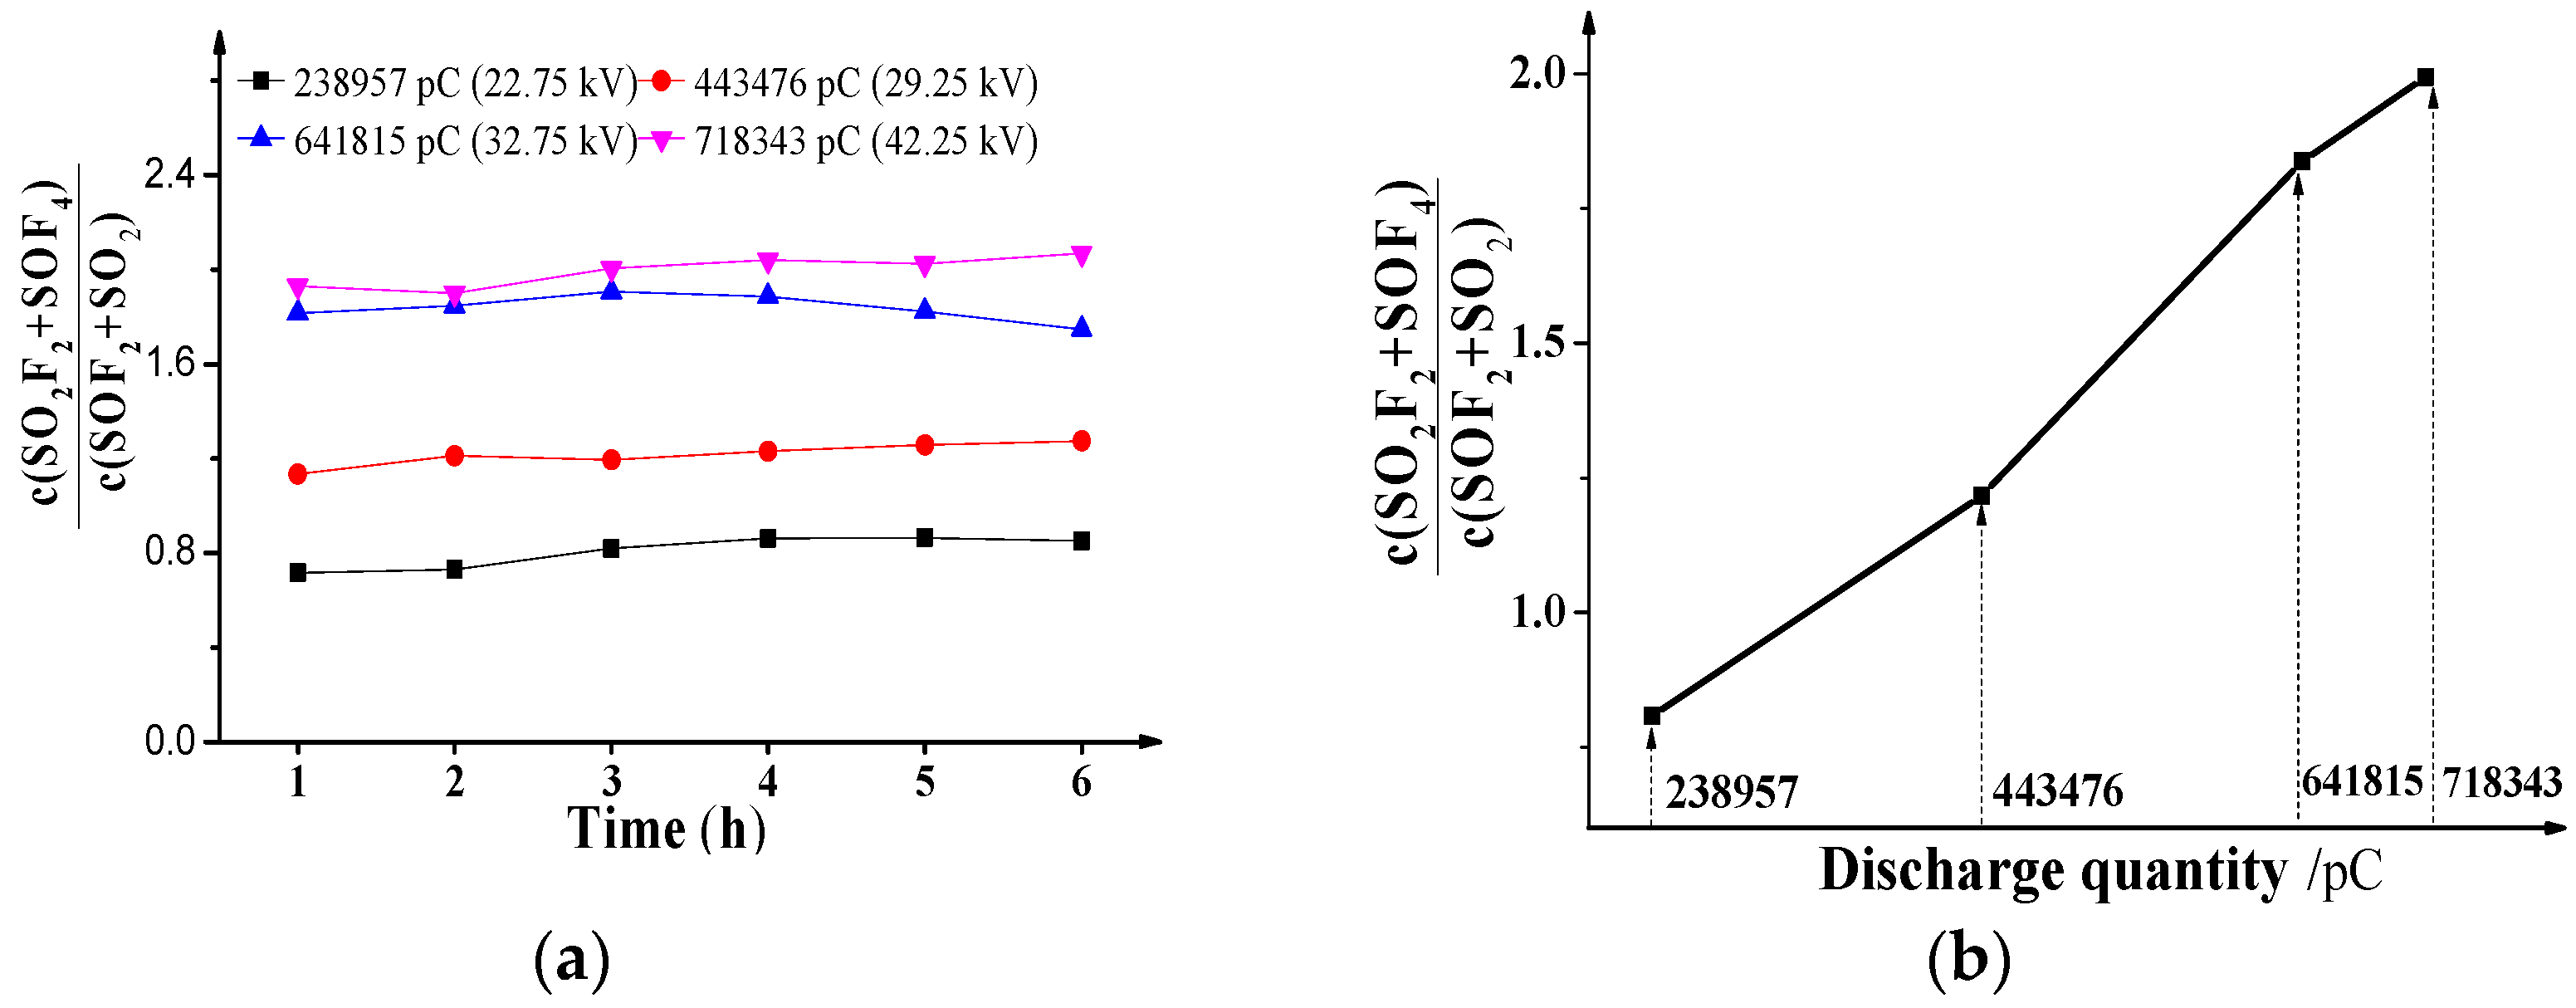
Some studies have focused on the concentration ratios of SF6 characteristic decomposition components to present PD recognition, such as c(SO2F2)/c(SOF2) in [14], c(CF4)/c(CO2), c(SO2F2 + SOF2)/c(CF4 + CO2) in [13]. Unfortunately, there are no studies on the characteristic concentration ratios of SF6 decomposition components and their physical significance under positive DC PD conditions. Therefore, the concentration ratio c(SO2F2 + SOF4)/c(SOF2 + SO2) was selected as a characteristic to figure out the relationship between the ratios and DC PD quantities. For the ratio, SOF4 and SO2F2, SOF2 and SO2 are counted as a whole due to their stable chemical properties in “dry” SF6 and their role as reactants or as products in hydrolysis reactions. Moreover, the characteristic concentration ratios are independent of the chamber volume comparing generation and effective generation rate. Then the ratios selected to present the discharge faults can improve the PD recognition accuracy.
From the concentration data of SO2F2, SOF4, SOF2 and SO2 under different voltages in Figure 2, the effects of positive DC PD discharge quantity on the characteristics concentration ratios c(SO2F2 + SOF4)/c(SOF2 + SO2) are shown in Figure 4a, and the ratio values in Figure 4b are the means of the values in Figure 4a.
As shown in Figure 4a, no matter what the discharge quantity is, the ratio c(SO2F2 + SOF4)/c(SOF2 + SO2) does not change much with the extended discharge time, and the values are about 0.8075, 1.2174, 1.8373 and 1.9940, respectively. As show in Figure 4b, the values of c(SO2F2 + SOF4)/c(SOF2 + SO2) increase with the positive DC discharge quantity in an approximately linear manner, which means the discharge quantity has a positive effect on the ratios.
Naturally, the reasons can be attributed to decomposition as shown in Section 3.3. The effective generation rate order is when is greater than 238,957 pC, and the ratios increase with the discharge quantity as seen Figure 3d, which means the positive effect on SOF4 and SO2F2 is more than that on SOF2 and SO2, respectively. Then, the values of c(SO2F2 + SOF4)/c(SOF2 + SO2) are greater than 1. Moreover, the greater the positive effect is, the higher the ratios are, and the concentration ratio is closely related to the discharge quantity.
3.5. Quantification of the Promotion Effects of Discharge Quantities on SF6 Decomposition Components
The effective generation rates of decomposition of the components present are the accumulative promotion effects of the pulse discharge quantities in all classes. Then, as mentioned in Section 3.1, all pulses were divided into four classes, and the promotion efficiency of all pulses in one class on a certain decompose component were assumed to be same. The mathematical relationship of effective generation rate, discharge quantities and promotion coefficients of one kind of decomposition component under a certain experimental voltage is presented as Equation (22), taking SO2F2 as an example:
where is the promotion effect coefficient of pulses in different classes that affect SO2F2, and is the effective generation rate of SO2F2. In accordance with that analogy, all coefficient equations of other components can be listed as in Equation (23):
SO2F2, SOF4, SOF2, and SO2 are numbered for component , as 1, 2, 3, and 4, respectively. , , , and are numbered for total discharge quantity , as 1, 2, 3, 4, respectively, and is the promotion effect coefficient of the total discharge quantity of class on the component . By that analogy, the equation matrix of four experiment voltages could be established and the coefficient matrix be calculated as well (matrix Equation (24)):
Then, as shown in the matrix, the coefficient matrix basically takes the order of , which indicates that when the total discharge quantity increases from to , the pulses whose discharge quantities are higher than 50 pC have promoting effects on the same decomposition component. Higher discharge quantities lead to greater promotion effects on SO2F2, SOF4, SOF2, and SO2. When , which means the pulses whose discharge quantities are lower than 50 pC decrease the positive promotion effects on decomposition components. There are several reasons for this: numerous free low-energy electrons generated in low-amplitude pulses cannot break gas chemical bonds, but they can easily react with active molecules or free radicals (such as SF4, SF3, SF2, O, OH, generated in strong discharges). Then, comparing the high-energy electrons generated in high-amplitude pulses, then they finally form low-energy and inactive negative ions, or react with positive ions to form neutral or stable molecules (e.g., SF6) [8]. These reactions inhibit the combination of low fluorine sulfides with O and OH to generate SOF2, SOF4, SO2F2, etc., but decrease the positive promotion effects that large discharge pulses have on components.
Meanwhile, the coefficient matrix takes the order of , which indicates that the pulses in the same discharge quantity class have different promoting effects on different decomposition components. The promotion effects take the following order: , which is consistent with the order of generation and the effective generation rates mentioned in Section 3.2 and Section 3.3. Therefore, the results of the coefficient matrix are consistent with the actual situation and reveal the substantial effects of PD severity on SF6 decomposition components from a mathematical viewpoint.
Therefore, when partial discharges occur in a piece of equipment under a certain voltage, the total discharge quantities of the four classes and their proportion with respect to can be deduced by the effect coefficient matrix and effective generation rate of four types of components in Equation (23). Then, the fault severity can be deduced preliminarily by their discharge quantity. However, the interval discharge quantity of classes in this paper is slightly large, and the assumption that the promotion effect coefficients of pulses in one class on one component are the same seems oversimple and crude, therefore, the diagnosis results may not inaccurate, and more classes must be layered to obtain detailed coefficients. Furthermore, H2O, O2, gas temperature, gas pressure, adsorbents or other influencing factors that could affect the concentration of components should be considered, therefore, more experiments should be performed to obtain more statistical data to get a real and accurate coefficient matrix, which should be helpful for obtaining more accurate and detailed discharge information and reliable judgments on fault severity diagnosis. The coefficient matrix mentioned in this work only offers one method for further research on the use of SF6 decomposition characteristics to diagnose fault severity.
4. Conclusions
The characteristic decomposition components of SF6 in DC SF6-insulated equipment under positive DC partial discharge are discussed in this paper. First, the concentration data of SO2F2, SOF4, SOF2, SO2, and CF4 and the discharge quantities with extended discharge time were obtained in detail under different voltages. The results show that the generation and effective generation rate of decomposition components increase with the total discharge quantity which was defined to present PD strength. The generation order is: SOF4 > SOF2 > SO2F2 >SO2 > CF4 when the total discharge quantity is higher than 238,957 pC. The main reasons are due to the reactions of SFx, O and OH which are generated by the collision of higher energy electrons. SOF4 always is the most significant one, and for characteristic concentration ratio c(SO2F2 + SOF4)/c(SOF2 + SO2), it does not change much with the extended discharge time, but increases with the total discharge quantity in an approximately linear manner. The generation, generation rate and concentration ratios are related to discharge quantity and PD strength. Finally, a coefficient matrix is proposed to quantify the relationship and the promotion effect coefficients of the pulses in four classes on SOF4, SOF2, SO2F2, and SO2. A higher discharge quantity corresponds to greater promotion effects. The pulses whose discharge quantity is higher than 50 pC have positive promotion effects, whereas the pulses whose discharge quantity lower than 50 pC decrease the positive promotion effects that large discharge pulses have on decomposition components.
Then, based on the SF6 decomposition mechanisms with increasing discharge quantity, the change trend of concentrations of SOF4, SOF2, SO2F2, SO2 and CF4 in this paper reflect the PD strengths significantly, and the mathematical relationship between discharge quantities and decomposition component generation that is obtained in the experiments is helpful for PD identification. Their change laws provide a new method to evaluate and predict the insulation fault severity and development trend in DC SF6-insulated equipment with high reliability and detection stability.
Acknowledgments
The research work has been funded by National Natural Science Foundation of China (51537009 and 51177181), the Special Projects for Science and Technology Programme of Chongqing Province (CSTC2013JJB90002), and The authors thank the granting agency sincerely.
Author Contributions
Tang Ju and Min Liu conceived and designed the experiments; Min Liu, Xin Liu, Qiang Yao and Yulong, Miao performed the experiments and analyzed the data; Min Liu and Xin Liu contributed towards materials and analysis, Finally, Min Liu and Xin Liu, rote the paper, revised and improved the paper.
Conflicts of Interest
The authors declare no conflict of interest.
References
- Benato, R.; Brunello, P.; Fellin, L. Thermal Behavior of EHV Gas-Insulated Lines in Brenner Pass Pilot Tunnel. IEEE Trans. Power Deliv. 2010, 25, 2717–2725. [Google Scholar] [CrossRef]
- Benato, R.; Napolitano, D. Reliability Assessment of EHV Gas Insulated Transmission Lines: Effect of redundancies. IEEE Trans. Power Deliv. 2008, 23, 2174–2181. [Google Scholar] [CrossRef]
- Renato, R.; Di Mario, C.; Koch, H. High capability applications of Long Gas Insulated Lines in Structures. IEEE Trans. Power Deliv. 2007, 22, 619–626. [Google Scholar]
- Benato, R.; Brunello, P.; Carlini, E.M.; Di Mario, C.; Fellin, L.; Knollseisen, G.; Laußegger, M.; Muhr, M.; Paolucci, A.; Stroppa, W.; et al. Italy-Austria GIL in the New Planned Railway Galleries Fortezza-Innsbruck under Brenner Pass. e i Elektrotech. Inform. 2006, 123, 551–558. [Google Scholar] [CrossRef]
- Chu, F.Y. SF6 decomposition in gas-insulated equipment. IEEE Trans. Dielectr. Electr. Insul. 1986, 21, 693–725. [Google Scholar] [CrossRef]
- Casanovas, A.M.; Casanovas, J.; Lagarde, F.; Belarbi, A. Study of the decomposition of SF6 under DC negative polarity corona discharges (point-to-plane geometry): Influence of the metal constituting the plane electrode. J. Appl. Phys. 1992, 72, 3344–3354. [Google Scholar] [CrossRef]
- Chen, J.; Davidson, J.H. Electron density and energy distributions in the positive DC Corona: Interpretation for Corona-enhanced chemical reactions. Plasma Chem. Plasma Process. 2002, 22, 199–224. [Google Scholar]
- Van Brunt, R.J. Production Rates for Oxyfluorides SOF2, SO2F2, and SOF4 in SF6 Corona Discharges. J. Res. Natl. Bur. Stand. 1985, 90, 229–253. [Google Scholar] [CrossRef]
- Tang, J.; Liu, X.; Rao, X.J.; Zeng, F.P.; Yao, Q.; Miao, Y.L. Decomposition Characteristics of SF6 under different spark energies. IEEE Trans. Electr. Insul. 2016, 23, 3346–3354. [Google Scholar] [CrossRef]
- Ding, W.D.; Li, G.J.; Ren, X.; Yan, X.L.; Li, F.; Zhou, W.W.; Wang, F. A comparison of SF6 decomposition characteristics under corona with point-to-plane electrode defect and spark with floating potential defect. IEEE Trans. Electr. Insul. 2016, 22, 3278–3289. [Google Scholar] [CrossRef]
- Han, D.; Lin, T.; Zhang, G.Q.; Liu, Y.L.; Yu, Q. SF6 Gas Decomposition Analysis under Point-to-plane 50 Hz AC Corona Discharge. IEEE Trans. Electr. Insul. 2016, 22, 799–805. [Google Scholar] [CrossRef]
- Tang, J.; Liu, F.; Zhang, X.; Meng, Q.; Zhou, J. Partial Discharge Recognition through an Analysis of SF6 Decomposition Products Part 1: Decomposition Characteristics of SF6 under Four Different Partial Discharges. IEEE Trans. Dielectr. Electr. Insul. 2012, 19, 29–36. [Google Scholar] [CrossRef]
- Tang, J.; Liu, L.; Meng, Q.; Zhang, X.; Tao, J. Partial Discharge Recognition through an Analysis of SF6 Decomposition Products Part 2: Feature Extraction and Decision Tree-based Pattern Recognition. IEEE Trans. Dielectr. Electr. Insul. 2012, 19, 37–44. [Google Scholar] [CrossRef]
- Tang, J.; Liu, L.; Zhang, X.; Ren, X.; Fan, M. Characteristics of the Concentration Ratio of SO2F2 to SOF2 as the Decomposition Products of SF6 under Corona Discharge. IEEE Trans. Plasma Sci. 2012, 40, 56–62. [Google Scholar] [CrossRef]
- Van Brunt, R.J.; Misakian, M. Mechanisms for inception of dc and 60-Hz ac corona in SF6. IEEE Trans. Electr. Insul. 1982, 17, 106–120. [Google Scholar] [CrossRef]
- Tang, J.; Zeng, F.; Zhang, X.; Sun, H.; Yao, Q.; Miao, Y. Correlation Analysis between Formation Process of SF6 Decomposed Components and Partial Discharge Qualities. IEEE Trans. Dielectr. Electr. Insul. 2013, 20, 864–875. [Google Scholar] [CrossRef]
- Zeng, F.; Tang, J.; Zhang, X.; Sun, H.; Yao, Q.; Miao, Y. Study on the Influence Mechanism of Trace H2O on SF6 Thermal Decomposition Characteristic Components. IEEE Trans. Electr. Insul. 2015, 22, 766–774. [Google Scholar] [CrossRef]
- Van Brunt, R.J. Physics and Chemistry of Partial Discharge and Corona. IEEE Trans. Dielectr. Electr. Insul. 1994, 1, 761–784. [Google Scholar] [CrossRef]
- Van Brunt, R.J.; Herron, J.T. Fundamental Processes of SF6 Decomposition and Oxidation in Glow and Corona Discharges. IEEE Trans. Electr. Insul. 1990, 25, 75–94. [Google Scholar] [CrossRef]
- Belarbi, A.; Pradayrol, C.; Casanovas, J.; Casanovas, A.M. Influence of discharge production conditions, gas pressure, current intensity and voltage type, on SF6 dissociation under point–plane corona discharges. J. Appl. Phys. 1995, 77, 1398–1406. [Google Scholar] [CrossRef]
- Derdouri, A.; Casanovas, J.; Hergli, R.; Grob, R.; Mathieu, J. Study of the decomposition of wet SF6, subjected to 50 Hz ac corona discharges. J. Appl. Phys. 1989, 65, 1852–1857. [Google Scholar] [CrossRef]
- Yang, J.; Zhao, L.; Zhou, H.; Huang, J.; Zhang, C.; Ren, M. Simulation Study of Streamer Discharge Mechanism under Non-uniform Electric Field in SF6 Gas and Its Transient Products. Insul. Mater. 2015, 48, 44–55. [Google Scholar]
- Christophorou, L.G.; Olthoff, J.K. Electron interactions with SF6. J. Phys. Chem. Ref. Data 2000, 29, 267–330. [Google Scholar] [CrossRef]
- Christophorou, L.G.; Olthoff, J.K. Electron attachment cross sections and negative ion states of SF6. Int. J. Mass Spectrom. 2001, 205, 27–41. [Google Scholar] [CrossRef]
- Fu, Y.W.; Yang, A.J.; Wang, X.H. Theoretical study of the neutral decomposition of SF6 in the presence of H2O and O2 in discharges in power equipment. J. Phys. D Appl. Phys. 2016, 49, 385203. [Google Scholar] [CrossRef]
- Tang, J.; Rao, X.J.; Zeng, F.P.; Cai, W.; Cheng, L.; Zhang, C.H. Influence mechanisms of trace H2O on the generating process of SF6 spark discharge decomposition components. Plasma Chem. Plasma Process. 2017, 37, 325–340. [Google Scholar] [CrossRef]
- Xuan, J.; Luo, Z.; Zhao, L.; Jiang, J.; Gao, X. Diagnosis of electron energy and comparative effects of OH, O, O3 on NO oxidation in pulsed corona discharge. Spectrosc. Spectr. Anal. 2012, 32, 1157–1161. [Google Scholar]
- Luo, Y. Handbook of Bond Dissociation Energy; Science Press: Beijing, China, 2005. [Google Scholar]
- Liu, F.; Tang, J.; Liu, Y. Mathematical Model of Influence of Oxygen and Moisture on Feature Concentration Ratios of SF6 Decomposition Products. In Proceedings of the General Meeting of the IEEE Power & Energy Society General Meeting, San Diego, CA, USA, 22–26 July 2012. [Google Scholar]
Figure 1.
SF6 DC PD decomposition simulation experimental system.

Figure 2.
Concentrations of SF6 decomposition components vary with discharge time and discharge quantity. (a) SOF4; (b) SO2F2; (c) SOF2; (d) SO2; (e) CF4.
Figure 2.
Concentrations of SF6 decomposition components vary with discharge time and discharge quantity. (a) SOF4; (b) SO2F2; (c) SOF2; (d) SO2; (e) CF4.

Figure 3.
Absolute generation rate and effective generation rate. (a) ; (b) ; (c) ; (d) R.

Figure 4.
Influence of PD on c(SO2F2 + SOF4)/c(SOF2 + SO2) (a) Influence of PD time (b) Influence of PD quantity.
Figure 4.
Influence of PD on c(SO2F2 + SOF4)/c(SOF2 + SO2) (a) Influence of PD time (b) Influence of PD quantity.

Table 1.
Discharge Quantities and Pulse Number of Positive DC PD.
| Voltage (kV) | 22.75 | 29.25 | 35.75 | 42.25 |
|---|---|---|---|---|
| Parameter | ||||
| 238,957 | 443,476 | 641,815 | 718,343 | |
| 5262 | 8593 | 10,097 | 6635 | |
| 45 | 52 | 68 | 109 | |
| 176 | 190 | 581 | 619 | |
| 56,813/2254 | 241,760/5721 | 86,526/1856 | 12,700/549 | |
| 120,011/2537 | 158,910/2563 | 331,544/6620 | 207,442/2569 | |
| 55,715/435 | 26,334/221 | 137,770/1131 | 294,514/2377 | |
| 6418/36 | 16,472/88 | 81,768/478 | 188,221/1095 | |
| - | - | 3356/10 | 12,801/39 | |
| - | - | 851/2 | 2665/6 |
© 2017 by the authors. Licensee MDPI, Basel, Switzerland. This article is an open access article distributed under the terms and conditions of the Creative Commons Attribution (CC BY) license (http://creativecommons.org/licenses/by/4.0/).
Share and Cite
MDPI and ACS Style
Liu, M.; Tang, J.; Liu, X.; Yao, Q.; Miao, Y. Study on the Characteristic Decomposition Components of DC SF6-Insulated Equipment under Positive DC Partial Discharge. Energies 2017, 10, 640. https://doi.org/10.3390/en10050640
AMA Style
Liu M, Tang J, Liu X, Yao Q, Miao Y. Study on the Characteristic Decomposition Components of DC SF6-Insulated Equipment under Positive DC Partial Discharge. Energies. 2017; 10(5):640. https://doi.org/10.3390/en10050640
Chicago/Turabian StyleLiu, Min, Ju Tang, Xin Liu, Qiang Yao, and Yulong Miao. 2017. "Study on the Characteristic Decomposition Components of DC SF6-Insulated Equipment under Positive DC Partial Discharge" Energies 10, no. 5: 640. https://doi.org/10.3390/en10050640
Note that from the first issue of 2016, this journal uses article numbers instead of page numbers. See further details here.