
Research on the Optimal Charging Strategy for Li-Ion Batteries Based on Multi-Objective Optimization
by
Haitao Min
1, 
Weiyi Sun
1,
Xinyong Li
1,
Dongni Guo
2,
Yuanbin Yu
1,*,
Tao Zhu
1 and
Zhongmin Zhao
3 1
State Key Laboratory of Automotive Simulation and Control, Jilin University, Changchun 130022, China
2
China First Automobile Work shop Group Corporation Research and Development Center, Changchun 130011, China
3
China First Automobile Work shop Bus and Coach Co., Ltd., Changchun 130033, China
*
Author to whom correspondence should be addressed.
Energies 2017, 10(5), 709; https://doi.org/10.3390/en10050709
Submission received: 6 March 2017
/
Revised: 21 April 2017
/
Accepted: 12 May 2017
/
Published: 17 May 2017
(This article belongs to the Collection Electric and Hybrid Vehicles Collection)
Abstract
:Charging performance affects the commercial application of electric vehicles (EVs) significantly. This paper presents an optimal charging strategy for Li-ion batteries based on the voltage-based multistage constant current (VMCC) charging strategy. In order to satisfy the different charging demands of the EV users for charging time, charged capacity and energy loss, the multi-objective particle swarm optimization (MOPSO) algorithm is employed and the influences of charging stage number, charging cut-off voltage and weight factors of different charging goals are analyzed. Comparison experiments of the proposed charging strategy and the traditional normal and fast charging strategies are carried out. The experimental results demonstrate that the traditional normal and fast charging strategies can only satisfy a small range of EV users’ charging demand well while the proposed charging strategy can satisfy the whole range of the charging demand well. The relative increase in charging performance of the proposed charging strategy can reach more than 80% when compared to the normal and fast charging dependently.
1. Introduction
Electric vehicles have been the new development point of the motor industry because of the advantages of zero pollution and high energy efficiency [1,2,3]. Li-ion batteries with high energy density, good life cycle performance, and low self-discharge rate [4,5,6,7] are being more widely used in electric vehicles. However, the Li-ion battery charging strategy has become the bottleneck of their application, due to the slow charging speed and uncertain effects on battery life. Li-ion battery charging optimization technology has become one of the central difficult issues [8].
Many studies have researched the charging techniques and topologies, such as constant current (CC), constant voltage (CV), and constant current constant voltage (CC-CV). One of the most commonly used charging strategy is the CC-CV charging [9,10,11]. In a CC-CV charging process, the battery is first charged with constant current, and when the battery voltage reaches the cut-off value, the battery is charged with constant voltage. However, the constant voltage process extends the charging time. Much effort has been made to carry out a better charging algorithm. Gao [12] proposed a boundary-curve based optimum charging current strategy. The temperature rise and polarization voltage were used to obtain the boundary curves during the charging process. The charging time was decreased and battery capacity was increased. In [13], a constant polarization-based fuzzy-control charging pattern was proposed, while charging strategy was shortened, no obvious temperature rise was observed. Chen [14] proposed a duty-varied voltage charging strategy that can dynamically detect and track the suitable duty of the charging pulse.
Multistage constant current (MCC) charging is another widely researched charging method, which has the advantage of faster charging speed and better battery charging performance [15,16,17,18,19,20]. As illustrated in Figure 1, the entire charging process of MCC charging consists of a certain number of constant current charging processes. When the preset switching condition is reached, the charging process moves into the next charging stage until all the charging stages are completed. According to the switching condition, the MCC charging strategy can be divided into two categories: voltage-based MCC (VMCC) charging and state of charge (SOC)-based MCC (SMCC) charging. The research on MCC charging mostly focuses on the optimization of the charging current of each stage. In [17], a Taguchi-based algorithm is presented and orthogonal arrays are implemented to determine the optimal charging current pattern. Another paper [18] combined the Taguchi method and battery SOC estimation technology and proposed an SOC-based MCC charging strategy. Wang [19] regarded the problem as a combinatorial optimization problem, and proposed a PSO-based fuzzy-controlled method to search for the optimal pattern of the charging currents. In [20], an Ant Colony System algorithm was used to select the optimum charging current among five charging stages. In [21], the whole charging process was divided into ten parts according to SOC, and the ILP algorithm is adopted to solve the optimization problem.
The charging time, charged capacity and energy loss are the most common concerns regarding performance in battery charging [22,23]. The traditional EV charging strategy can mainly be classified as normal charging or fast charging. For normal charging, the charging time can be hours and is usually used for an overnight charge, and fast charging is usually chosen when there is a demand for a short charging time. However, in daily uses, people have different charging requirements for overnight charging and fast charging. An optimal charging strategy should be able to provide different charging currents according to the different charging demands of the users. As a main contribution of this paper, an optimal charging strategy that can satisfy different charging demands of the EV users is proposed based on the MOPSO algorithm. Also, a simulation model of the VMCC charging algorithm is proposed to simulate the charging process of the VMCC charging strategy. As another contribution of this paper, the influence of charging parameters such as the charging cut-off voltage and the number of charging stages are discussed.
The rest of this paper is organized as follows. Section 2 establishes the Li-ion battery equivalent circuit model (ECM) and thermal model, studies the estimation of the battery model parameter and proposes the simulation model of the VMCC charging. Section 3 introduces the experimental setup and conducts the battery parameter estimation experiment. Section 4 formulates the multi-objective optimization problem. The MOPSO algorithm and the searching procedure are described in detail in Section 5. In Section 6, the influence of charging stage number, charging cut-off voltage and weight factors of different charging goals are discussed and experiments are carried out to verify the performance of the proposed charging strategy. Finally, Section 7 concludes this paper.
2. Li-Ion Battery Modeling and VMCC Simulation
2.1. Battery Equivalent Circuit Model
To optimize the charging currents of the VMCC charging procedure, an accurate and reliable battery model must be formulated when using model-based methods. The ECM (equivalent circuit model) approach uses the circuit elements to represent the electrochemical phenomena inside the battery to avoid the lengthy electrochemical process calculation while still capturing the dynamic performance of the battery [24,25]. In general, an ECM with one or two Resistance-Capacitance (RC) blocks without the parasitic branch is a common choice and for the batteries that have an obvious hysteresis phenomenon, a hysteresis model is also included [26]. In this paper, only the charging process is considered, so the one RC block model without the hysteresis model is chosen.
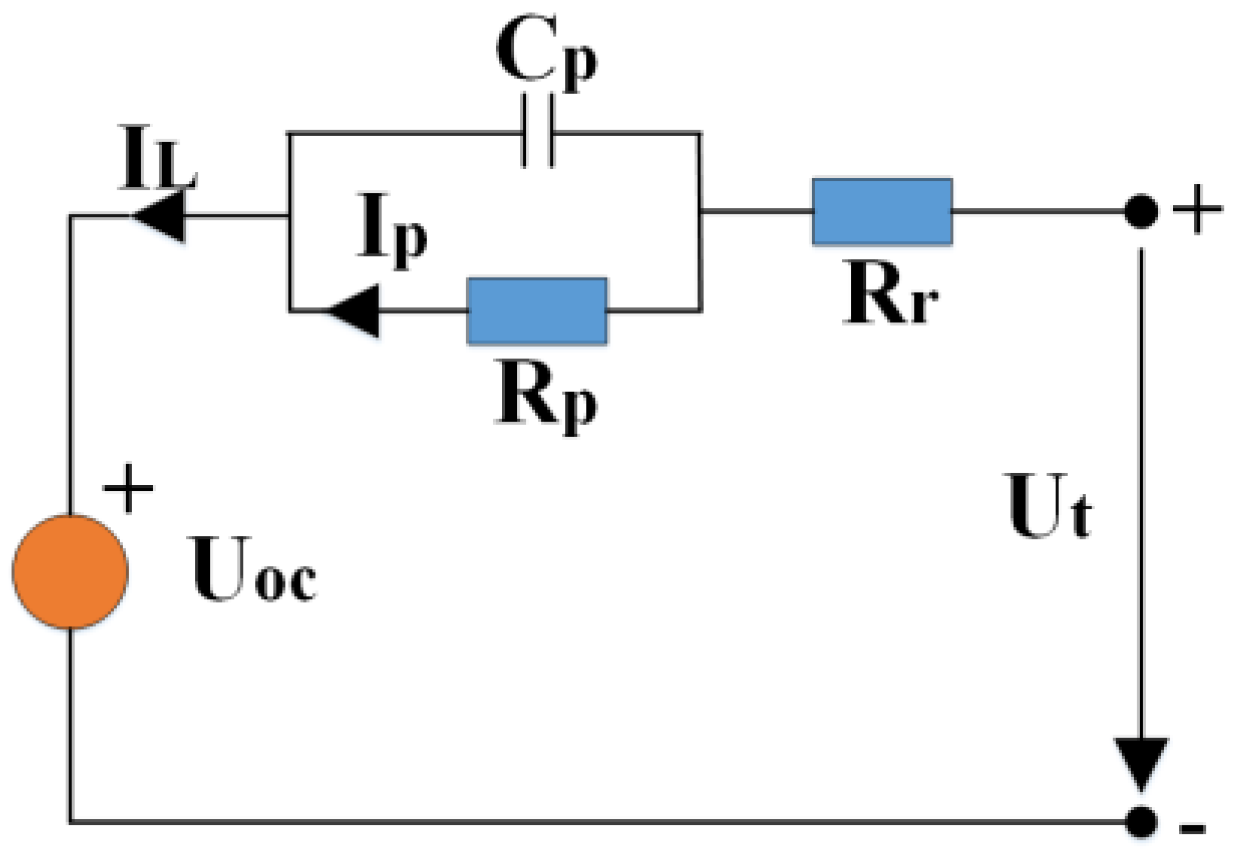
A one-RC network based ECM is shown in Figure 2. is the battery open circuit voltage (OCV); is the battery terminal voltage; is the battery load current (assumed positive for discharging and negative for charging) and is the outflow current of . is the ohmic resistance which represents the electrical resistance in the battery during the accumulation and dissipation of charge in the electrical double-layer; is the voltage across . is the polarization resistance; and is the polarization capacity. The RC network consisted with and describes the mass transport effects and dynamic voltage performances of the battery. The polarization voltage on and is represented as .
According to the battery model, we have:
The discrete format can be written as:
where and is are values of and at the k-th step, respectively. is the time constant of the circuit and is the sampling time.
All the parameters of the battery model are the function of SOC, which is defined as:
where denotes battery SOC at time t, denotes the initial value of battery SOC (defined as 0 in this paper for the charging condition), is the rated capacity of the battery and η is the current efficiency, which is assumed to be 1 in this paper.
The energy loss of the battery can be calculated as:
2.2. Battery Parameter Estimation
The Least Square estimation method is used to estimate the battery parameter. Define the voltage difference between the terminal voltage and the OCV as:
From Equation (1), can be calculated as:
According to Equations (1) and (6), the system transform function can be calculated as:
Setting the sampling time as 1 s and considering the slow variation of the battery parameter, the following relationship can be defined:
The difference equation form of Equation (7) can be written as:
where , , , .
Define the following equation:
Then, for n sets of sampled data, the following equations can be written:
where , , . Then the least square method can be employed to estimate the battery parameter according to the following equation:
2.3. Battery Thermal Model
The value of the ECM components depends on SOC and battery temperature, so the battery thermal model is necessary for the prediction of battery voltage. The battery thermal model is consistent with thermal generation and thermal transfer. In this paper, the heat generation process of the battery is attributed to the ohmic heat and the inner battery temperature is assumed to be uniform. The thermal model of the battery is computed as:
where is the heat generated from the ohmic resistance; , is the battery mass, is the heat capacity of the battery; T is the battery temperature and is the ambient temperature; is the heat conduction coefficient between the battery and the ambience.
The discrete format of Equation (13) can be written as:
2.4. Simulation of the VMCC Charging Strategy
A simulation model of the VMCC charging strategy is established to simulate the charging process of the battery under the VMCC charging process. The charging time, charged capacity and energy loss of the VMCC charging process can be acquired directly from the simulation. The flow chart of the simulation is shown in Figure 3 and the pseudo code of the VMCC charging strategy are shown in Algorithm 1.
| Algorithm 1. Pseudo code of the VMCC charging strategy. |
VMCC (n, k,,,,, , ).
2: charging step update: k = k + 1 3: SOC update: SOC(k) = SOC(k − 1) + 4: if thend 5: break 6: end if 7: battery parameters update: , 8: 9: charging time update: 10: charged capacity update: 11: polarization voltage update: 12: battery terminal voltage update: 13: energy loss update: 14: temperature update: 15: if then 16: stage number update: n = n + 1 17: if n + 1 > then 18: break 19: else 20: charging current update: 21: end if 22: end if 23: Output , and |
3. Experimental Setup and Battery Parameter Estimation
3.1. Experimental Setup
The experimental setup consists of (1) a LiFePO4 test battery (Bak, Shenzhen, China); (2) a Chroma 72001 battery (Chroma ATE, Taoyuan, China) test system; (3) a host computer; and (4) a thermal chamber (ENVAN, Shanghai, China). The nominal voltage of the battery is 3.2 V, the recommended charging voltage is 3.65 V. The nominal capacity is 2.5 Ah. The Chroma 72001 battery test system is used to charge and discharge the battery with a maximum voltage of 5 V and a maximum current of 20 A with an accuracy of 1 mV voltage and 10 mA current. The thermal chamber is used to maintain the environmental temperature of the experiments. The experimental data such as current and voltage are measured by the Chroma 72001 and recorded by the host computer.
3.2. Battery Parameter Estimation
The pulse current charging profile is executed in 20 °C, 25 °C, 30 °C, 35 °C and 40 °C respectively to estimate the battery charging parameter under different temperature. The current pattern and corresponding battery terminal voltage under the temperature of 25 °C is shown in Figure 3a. Figure 3b shows the comparison of the voltage response between the experiment and simulation. The absolute error is also shown in Figure 3b. It can be seen that the simulated results coincide well with the experimental results. Figure 4 is the estimated battery parameter under the temperature of 25 °C.
4. Multi-Object Optimization Problem Formulation
4.1. Problem Formulation
The aim of this paper is to get a balanced charging performance between charging time, charged capacity and energy loss. These charging performances can be divided into two types: the smaller the better for charging time and energy loss, the larger the better for charged capacity. In order to unify the two different types of problem, the concept of uncharged capacity (UCP) is adopted, which is defined as follows:
The charged capacity is calculated as:
where is the charging current of the battery.
So, the multi-objective optimization problem can be formulated as:
4.2. Constraint Conditions
It should be noted that the maximum current for the battery used in this paper is 2 C (C rate, defined as a charge or discharge rate equal to the capacity of a battery divided by 1 h), so the maximum charging current is set as 2 C. Since the voltage limit of each stage is the same, if the charging current of the present stage is greater than that of the previous stage, the rise of battery polarization voltage and ohmic voltage will immediately make the battery terminal voltage higher than the cut-off voltage, so the charging current of the present stage should not exceed the previous stage. The current interval of 0.01 C is used in this paper and the minimum charging current is set as 0.1 C. Considering the overnight charging condition as the longest charging time, the charging time is constrained to be less than ten hours. The uncharged capacity is constrained to be less than 20% of the rated battery capacity considering the driving range and more than 10% of the rated battery capacity considering the battery cycling life [27,28].
According to the above statement, the constraint conditions can be expressed as:
5. MOPSO Based MCC Optimization
5.1. Multi-Object Optimization
As for the problem of multi-objective optimization (MOO), there is not a global best solution that would be optimal for all the objectives simultaneously, so a compromised solution must be found. The MOPSO algorithm is proposed by Coello et al. [29] in 2004 to solve the multi-objective optimization problem and has been widely researched and applied [30,31,32]. Here, the MOPSO is employed because of its high searching ability and low time complexity [29]. In the MOPSO algorithm, every particle is a potential global optimum which has a fitness value evaluated by the object function.
According to the fitness value, the local best value and the global best value is used to guide the direction of the particles’ movement. However, in the problem of MOO, the optimal value cannot be decided directly as different objects conflict with each other. To solve this problem, the Pareto Envelope and grid-making technique is introduced to the MOPSO algorithm and an external repository is used to keep a historical record of the nondominated vectors found along the search process. The detailed optimization procedure is summarized by the following steps.
- Step 1
- Particle initialization. An m-size population with random positions and zero velocities is generated. The position of the i-th particle is represented as and the velocity of the i-th particle is represented as , where n is the dimension of the search space.
- Step 2
- Evaluate the particles according to the simulation result of the MCC charging strategy.
- Step 3
- Store the nondominated particles in the repository (REP) and update the REP.
- Step 4
- Update the speed and velocity of each particle according to the following equations:where and denote the current and previous velocities in the n-th dimension, respectively. is the current position of the i-th particle in dimension n while is its previous position; is the inertia weight. is the cognitive learning factor, is the social learning factor. and are two random numbers in the range [0, 1]. is the local best value and is the global best value chosen from the repository.To determine , the explored objectives are meshed with hypercubes, and a fitness value is assigned to the hypercubes containing more than one particle with the following function:where, is the number of particles located in the i-th hypercube.Then is selected by applying a roulette-wheel selection.
- Step 5
- Convergence determination. Compare the average fitness value of the current particle swarm with the previous particle swarm; if the difference is less than the threshold value α, the search procedure is terminated.
- Step 6
- Repeat the steps from Step 2 to Step 5 until the best point is found or a fixed number of iterations has been reached.
5.2. Parameter Setting
To make the searching procedure work effectively, proper parameters of the algorithm should be chosen. As for the number of the particles, the more particles used in the search procedure, the less steps of iterations are required. However, too many particles would increase the burden of computation. In this research, the number of particles is chosen as 100 to ensure good convergence and accuracy. The maximum iteration number is set as 200 and the inertia weight is set as 0.7; the constants Λ1 and Λ2 are set as 1.6 and 1.5 respectively and the grid number is chosen as 10.
5.3. Multi-Objective Decision Making
To get a balanced charging strategy, a compromised solution should be chosen from the resulted Pareto set. To address this issue, the weighted metric method is adopted in this paper. Since the three objects are in different units and scales, they are first normalized to be between 0 and 1 with the following equation:
where is the value of the k-th object, is the normalized vale and and is the minimum and maximum value respectively.
Then the weighted objective function can be written as:
where is the weight factor of charging time, is the weight factor of uncharged capacity and is the weight factor of energy loss.
6. Results and Discussion
6.1. Impact of Stage Numbers
Optimizations of three, five and seven charging stages are conducted to analyze the influence of charging stage numbers. The Pareto sets of the optimization result are shown in Figure 5. From the distribution of the Pareto set in Figure 6a, it is clear that there is not an optimal solution for all the three objectives. From Figure 5b,c, it can be observed that charging time is in conflict with uncharged capacity and energy loss. In Figure 5d, the Pareto set is a single point, which means the uncharged capacity and energy loss are both optimal in this point.
It can be observed from Figure 5b that as the stage number increases, the Pareto set moves towards the origin—both the optimized charging time and uncharged capacity decrease. The decrease is relatively large when the stage number increases from three to five while the difference between stage number of five and seven is not apparent. From Figure 5c, it can be seen that the optimization results are almost the same while stage number of three and five have a slightly better performance than stage number of seven. This is because the increase in the charging stage number augments the average charging current. This relationship can be further confirmed in Figure 5d. In Figure 5d, the optimization result is a single point and as the stage number increases, the energy loss decreases while the uncharged capacity stays the same. According to the former analysis, the charging stage number is chosen as five in this paper.
6.2. Impact of Cut-Off Voltage
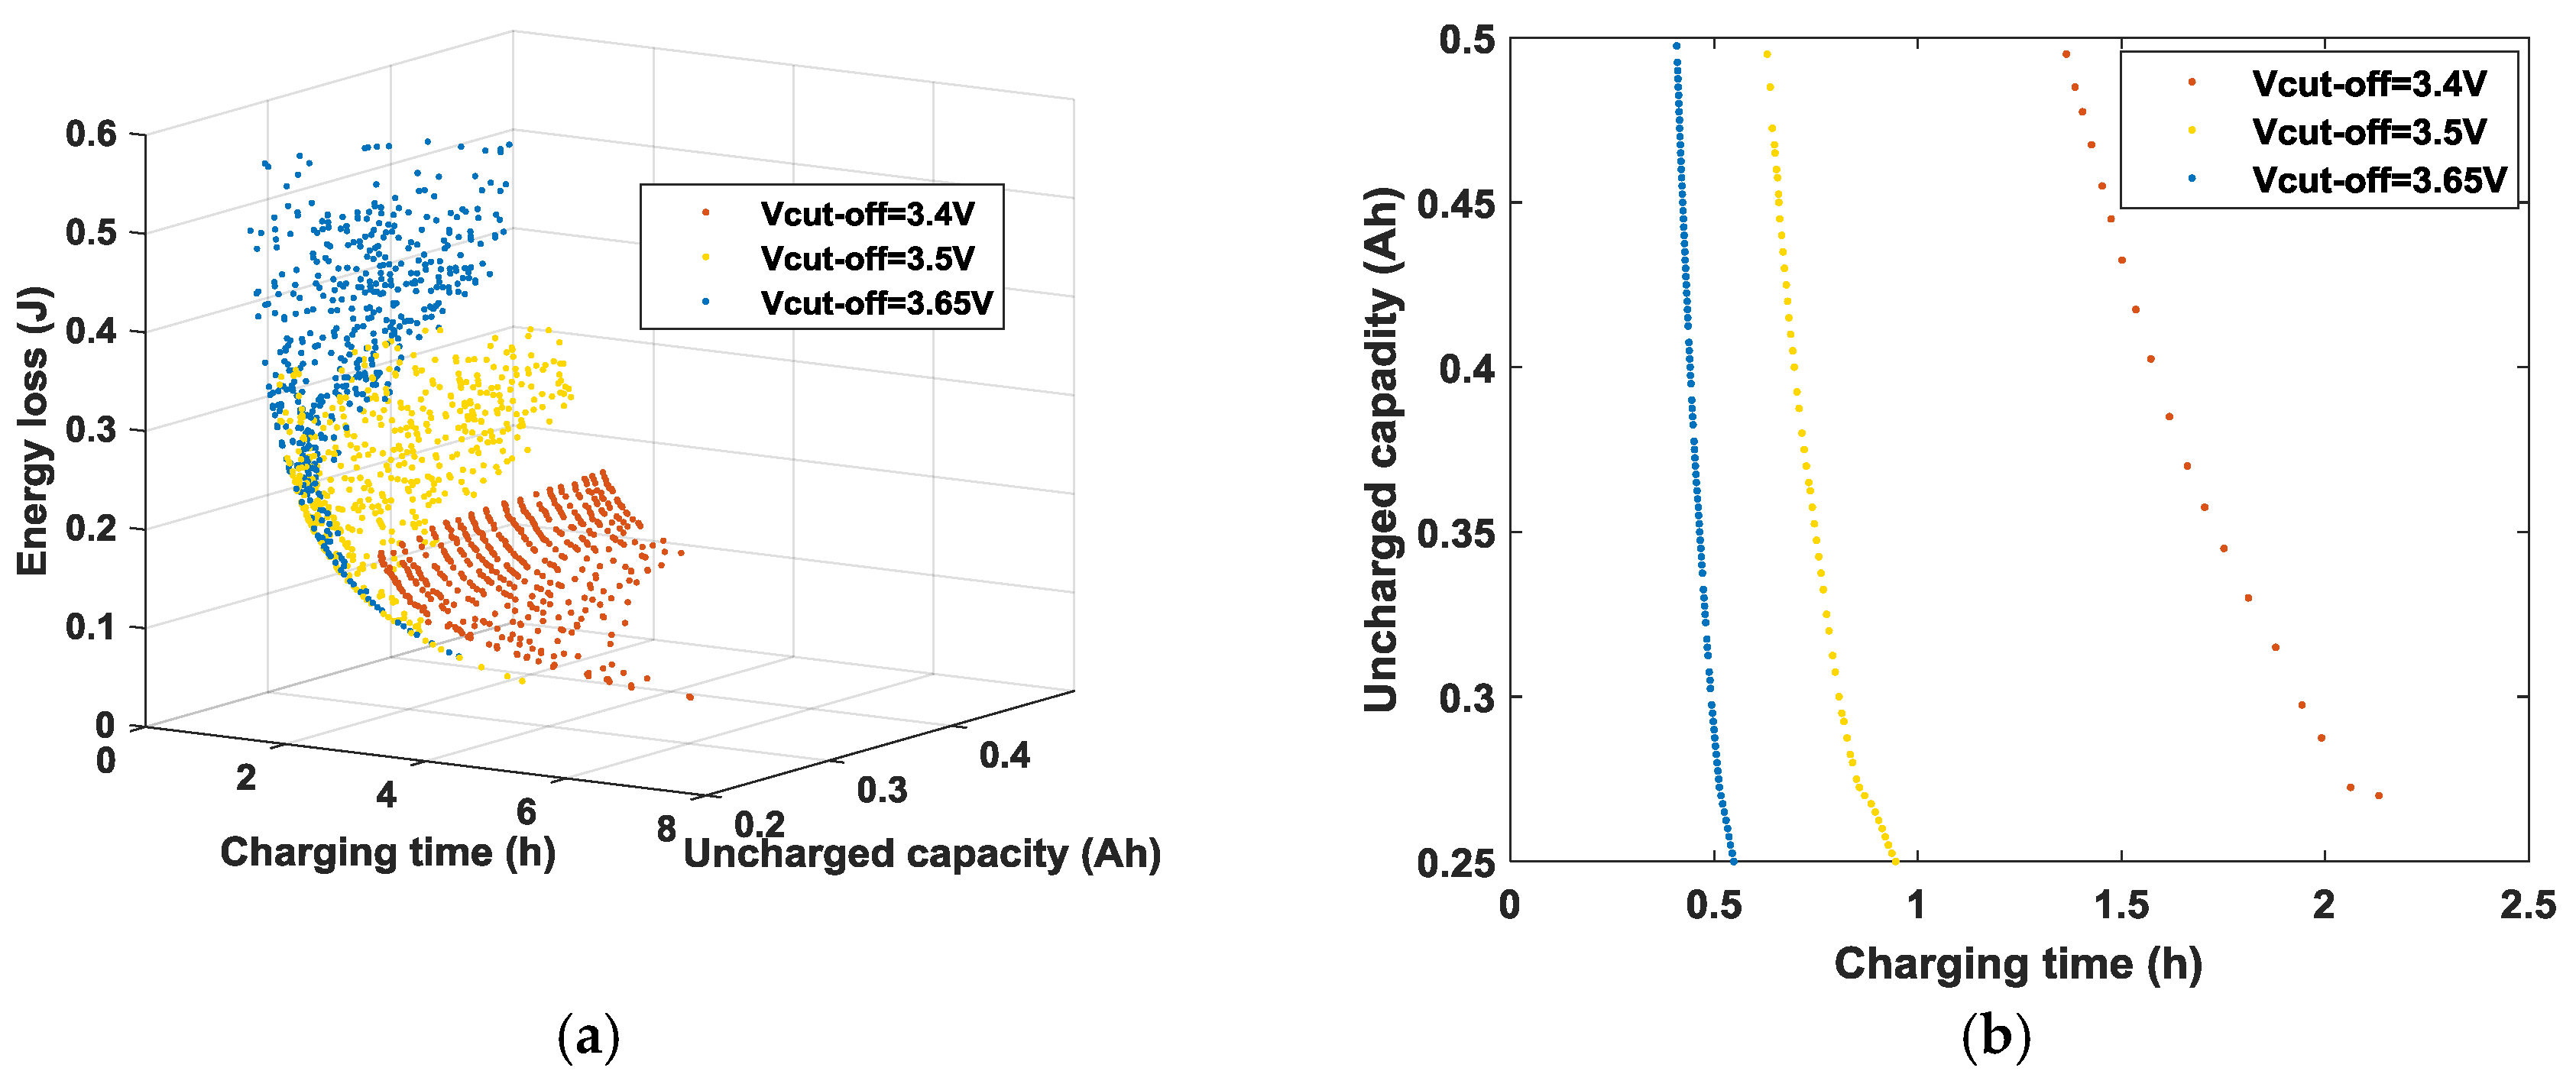
The effect of cut-off voltage on the charging performance is studied. To charge the battery to the target capacity, the cut-off voltage must be higher than the corresponding OCV, so the low-level cut-off voltage is set as 3.4 V. The high-level cut-off voltage is set as the manufacture’s recommended voltage, which is 3.65 V. The medium-level cut-off voltage is set as 3.5 V. The resulted Pareto set is shown in Figure 6.
It can be observed in Figure 6a,c that a higher cut-off voltage leads to a smaller charging time and a higher energy loss. However, the difference of energy loss for the same charging time is relatively small. From the optimization result in Figure 6b, it can be concluded that the cut-off voltage affects the charging time largely and a higher cut-off voltage also leads to a smaller uncharged capacity. In Figure 6d, the Pareto set of 3.65 V and 3.5 V coincide with each other and is better than the result of 3.4 V. In this paper, the manufacture’s recommended cut-off voltage is used.
6.3. Impact of Weight Factors
According to the former analysis, a five stage VMCC charging strategy with the cut-off voltage of 3.65 V is chosen as the final charging strategy. The distribution of the resulted Pareto set is shown in Figure 7a. It can be found that the shortest charging time is 0.43 h (marked with “*”), where the corresponding charging current is . The smallest uncharged capacity is 0.25 Ah (marked with “”), where the corresponding charging current is ; The smallest energy loss is 0.061 J (marked with “”), where the corresponding charging current is .
The resulted Pareto set provides all the possible optimal solutions for the five stage VMCC charging strategy. In actual usages, a compromised solution should be chosen from the Pareto set according to the specific charging demand. In this paper, the weight metric factor method is adopted to decide the optimal solution. To study the influence of weight factor, the charging performance under three different is compared, where (the weight factor of charging time) is set as 0.4, 0.6 and 0.8, (the weight factor of uncharged capacity) and (the weight factor of energy loss) is set to be equal.
The charging current, SOC and energy loss performance under different weight factors are shown in Figure 7b–d. Figure 7b shows that high values of result in high values of charging current in the first CC stage. In other words, as more emphasis is put on charging time, a larger charging current in the first CC stage is required to shorten the charging time. Figure 7c shows the performance of SOC. It is observed that by increasing , more emphasis is put on uncharged capacity and a smaller uncharged capacity is acquired. It should also be noted that, as increases further, the uncharged capacity does not decrease accordingly. This is caused by the constraint condition of the minimum uncharged capacity. Figure 7d is the performance of energy loss. As expected, high values of result in lower energy loss as more emphasis is put on energy loss, which means a higher efficiency.
6.4. Experimental Comparison with the Traditional Charging Strategies
Experimental comparisons of the proposed charging strategy with the traditional charging strategies are carried out. Without loss of generality, the traditional EV charging strategy is classified as normal charging and fast charging. For normal charging, the charging strategy is defined as CC-CV charging with the CC stage current of 0.3 C and for fast charging, the charging strategy is defined as CC-CV charging with the CC stage current of 2.0 C. The concept of user satisfaction is adopted here to evaluate the charging performance of the optimized charging strategy, which is defined as:
For the calculation of the weight factor ω, is set to change from 0.1 to 0.9 with the interval of 0.1 while is equal to . According to the definition of , it is easy to see that the larger the value of , the better the charging performance satisfies the users’ charging demand. Figure 8 shows the experimental comparisons of the proposed charging strategy with the traditional normal and fast charging strategies. It can be observed that, for the traditional normal charging strategy, the charging performance is good when the charging demand for charging time is low; however, as the demand for the charging time increases, the charging performance descends linearly. Conversely, for the traditional fast charging strategy, the charging performance is good when the charging demand for charging time is high, and as the demand for the charging time decreases, the charging performance decreases linearly. It can be concluded that the traditional normal and fast charging strategies only satisfy a small range of the charging demand. On the other hand, it can be seen that the proposed charging strategy always performs well no matter how the charging demand changes, which means the proposed charging strategy satisfies the whole range of the charging demand well.
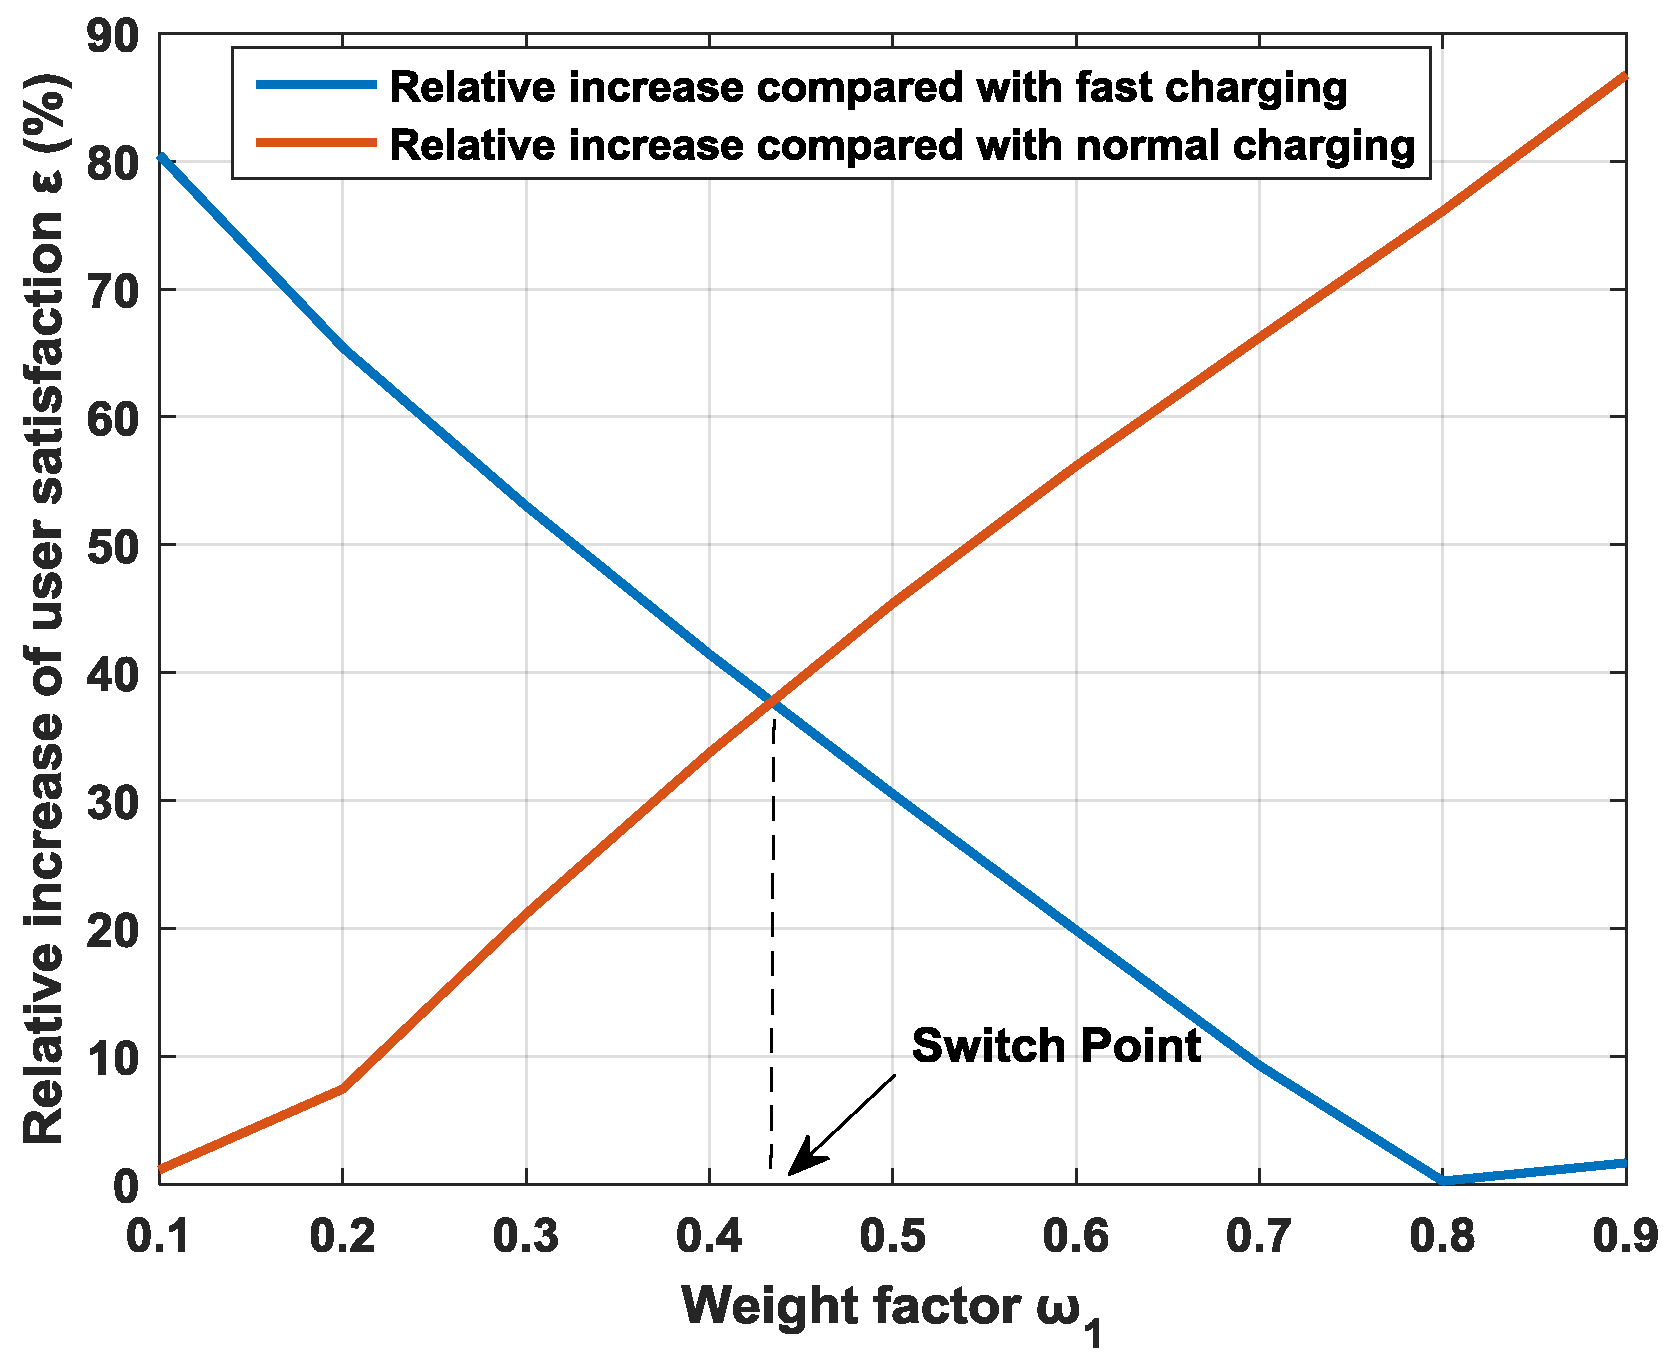
Figure 9 shows the relative increase in user satisfaction (represented with ) of the proposed charging strategy compared with the traditional normal and fast charging strategies. It can be seen that the increase can reach more than 80% when the proposed charging strategy is compared with the normal and fast charging strategies independently. In actual usage, when a short charging time is needed, the EV users may choose fast charging and otherwise the normal charging is used. In Figure 9, the “Switch point” is defined as the intersection of the “Fast charging” line and the “Normal charging” line. For ideal conditions, normal charging is used when is smaller than the switch point and fast charging is used otherwise. In this case, the relative increase in charging performance of the proposed charging strategy can still reach almost 40%, which shows the advantage of the proposed charging strategy.
7. Conclusions
An optimal battery charging strategy is proposed to satisfy the different charging demands of EV users for charging time, charge capacity and energy loss based on multi-objective optimization technology. The battery equivalent circuit model is adopted, and the least square method is used to estimate the battery parameters through a pulse current charging experiment. A VMCC simulation model is proposed and the MOPSO algorithm is used to solve the multi-objective optimization problem. The impacts of the charging stage number, charging cut-off voltage and weight factors of different charging goals are investigated in detail. We found that as the charging stage number increases, a better optimization result is achieved; however, when the stage number is greater than five, the increase in charging performance is not evident. Thus, a charging stage number of five is chosen. The analysis of charging cut-off voltage shows that the use of higher charging cut-off voltage benefits the charging performance and the manufacture’s recommended charging cut-off voltage is used. The impacts of different weight factor combinations are also studied and a compromised optimal charging strategy is chosen based on the analysis result. Finally, an experimental comparison of the proposed charging strategy with the traditional EV charging strategies are performed. The comparison results show that the traditional normal and fast charging strategies can only satisfy a small range of charging demand while the proposed charging strategy satisfies the whole range of charging demand well. The relative increase in charging performance of the proposed charging strategy can reach more than 80% when compared to normal and fast charging.
Acknowledgments
The authors gratefully acknowledge the financial support from the National Natural Science Foundation of China (No. 51107052).
Author Contributions
Weiyi Sun and Haitao Min were responsible for overall article structure, design and writing; Xinyong Li contributed to the battery experiments; Yuanbin Yu contributed to the literature review and the funding support; Dongni Guo contributed to the analysis; Tao Zhu helped to rearrange the paper structure; Zhongmin Zhao provided lots of comments in the process of revision.
Conflicts of Interest
The authors declare no conflict of interest.
References
- Wang, D.; Guan, X.H.; Wu, J.; Li, P.; Zan, P.; Xu, H. Integrated energy exchange scheduling for multimicrogrid system with electric vehicles. IEEE Trans. Smart Grid 2016, 7, 1762–1774. [Google Scholar] [CrossRef]
- Gan, L.; Ufuk, T.; Steven, H.L. Optimal decentralized protocol for electric vehicle charging. IEEE Trans. Power Syst. 2011, 28, 940–951. [Google Scholar] [CrossRef]
- Pellegrino, G. Performance comparison between surface-mounted and interior PM motor drives for electric vehicle application. IEEE Trans. Ind. Electron. 2013, 59, 803–811. [Google Scholar] [CrossRef]
- Ansean, D.; Gonzalez, M.; Garcia, M.V. Evaluation of LiFePO4 batteries for electric vehicle applications. IEEE Trans. Ind. Appl. 2015, 2, 1855–1863. [Google Scholar] [CrossRef]
- Rahimi-Eichi, H.; Ojha, U.; Baronti, F.; Chow, M. Battery management system: An overview of its application in the smart grid and electric vehicles. IEEE Ind. Electron. Mag. 2013, 7, 4–16. [Google Scholar] [CrossRef]
- Lin, H.T.; Liang, T.J.; Chen, S.M. Estimation of battery state of health using probabilistic neural network. IEEE Trans. Ind. Inform. 2013, 9, 679–685. [Google Scholar] [CrossRef]
- Valle, B.D.; Wentz, C.T.; Sarpeshkar, R. An area and power-efficient analog Li-ion battery charger circuit. IEEE Trans. Biomed. Circuits. Syst. 2011, 5, 131–137. [Google Scholar] [CrossRef] [PubMed]
- Rahimi-Eichi, E.H.; Ojha, U.; Baronti, F.; Chow, M. Evaluation of acceptable charging current of power li-ion batteries based on polarization characteristics. IEEE Ind. Electron. 2014, 61, 6844–6851. [Google Scholar] [CrossRef]
- Hoffart, F. Proper care extends li-ion battery life. Power Electron. Technol. Mag. 2008, 34, 24–28. [Google Scholar]
- Hua, C.C.; Lin, M.Y. A study of charging control of lead-acid battery for electric vehicles. In Proceedings of the 2000 IEEE International Symposium on Industrial Electronics, Cholula, Puebla, Mexico, 4–8 December 2000; pp. 135–140. [Google Scholar]
- Abousleiman, R. Charge Capacity versus Charge Time in CC-CV and Pulse Charging of Li-Ion Batteries. Available online: http://papers.sae.org/2013-01-1546/ (accessed on 12 May 2017).
- Gao, Y.; Zhang, C. An optimal charging strategy of lithium-ion batteries based on polarization and temperature rise. In Proceedings of the IEEE Conference and Expo Transportation Electrification Asia-Pacific (ITEC Asia Pacific ’14), Beijing, China, 31 August–3 September 2014. [Google Scholar]
- Jiang, J.; Zhang, C.J. An optimal charging method for Li-ion batteries using a fuzzy-control approach based on polarization properties. IEEE Trans. Veh. Technol. 2013, 62, 3000–3009. [Google Scholar] [CrossRef]
- Chen, L.R. Design of duty-varied voltage pulse charger for improving Li-ion battery-charging response. IEEE Trans. Ind. Electron. 2009, 56, 480–487. [Google Scholar] [CrossRef]
- Ikeya, T. Multi-step constant-current charging method for electric vehicle, valve-regulated, lead/acid batteries during night time for load leveling. J. Power Sources 1998, 75, 101–107. [Google Scholar] [CrossRef]
- Ikeya, T. Multi-step constant-current charging method for an electric vehicle nickel/metal hydride battery with high energy efficiency and long cycle life. J. Power Sources 2002, 105, 6–12. [Google Scholar] [CrossRef]
- Liu, Y.H.; Luo, Y.F. Search for an optimal rapid-charging pattern for Li-ion batteries using the Taguchi approach. IEEE Trans. Ind. Electron. 2010, 57, 3963–3971. [Google Scholar] [CrossRef]
- Vo, T.T.; Chen, X; Shen, W. New charging strategy for lithium-ion batteries based on the integration of Taguchi method and state of charge estimation. J. Power Sources 2015, 273, 413–422. [Google Scholar] [CrossRef]
- Zhang, C.P.; Wen, J.P.; Zhang, W.G. A PSO-Based fuzzy-controlled searching for the optimal charge pattern of li-ion batteries. IEEE Trans. Ind. Electron. 2015, 62, 2983–2993. [Google Scholar] [CrossRef]
- Liu, Y.H.; Teng, J.H.; Lin, Y.C. Search for an optimal rapid charging pattern for lithium-ion batteries using Ant Colony System algorithm. IEEE Trans. Ind. Electron. 2005, 52, 1328–1336. [Google Scholar] [CrossRef]
- Dung, L.R.; Yen, J.H. ILP-based algorithm for Lithium-ion battery charging profile. Proceeding of the 2010 IEEE International Symposium on Industrial Electronics (ISIE), Bari, Italy, 4–7 July 2010; pp. 2286–2291. [Google Scholar]
- Hu, X.; Li, S.; Peng, H. Charging time and loss optimization for LiNMC and LiFePO4 batteries based on equivalent circuit models. J. Power Sources 2013, 239, 449–457. [Google Scholar] [CrossRef]
- Abdollahi, A.; Han, X.; Avvari, G.V. Optimal battery charging, part I: Minimizing time-to-charge, energy loss, and temperature rise for OCV-resistance battery model. J. Power Sources 2016, 303, 388–398. [Google Scholar] [CrossRef]
- Ceraolo, M.; Lutzemberger, G.; Huria, T. Experimentally Determined Models for High-Power Lithium Batteries. Available online: http://papers.sae.org/2011-01-1365/ (accessed on 12 May 2017).
- Roscher, M.A.; Assfalg, J.; Bohlen, O.S. Detection of utilizable capacity deterioration in battery systems. IEEE Trans. Veh. Technol. 2011, 60, 98–103. [Google Scholar] [CrossRef]
- Hu, X.; Li, S.; Peng, H. A comparative study of equivalent circuit models for Li-ion batteries. J. Power Sources. 2012, 198, 359–367. [Google Scholar] [CrossRef]
- Moura, S.J.; Fathy, H.K.; Callaway, D.S. A stochastic optimal control approach for power management in plug-in hybrid electric vehicles. IEEE Trans. Contr. Syst. Technol. 2008, 19, 545–555. [Google Scholar] [CrossRef]
- Kum, D.; Peng, H.; Bucknor, N.K. Optimal energy and catalyst temperature management of plug-in hybrid electric vehicles for minimum fuel consumption and tail-pipe emissions. IEEE Trans. Contr. Syst. Technol. 2013, 21, 14–26. [Google Scholar] [CrossRef]
- Coello, C.A.; Pulido, G.T.; Lechuga, M.S. Handling multiple objectives with particle swarm optimization. IEEE Trans. Evol. Comput. 2004, 8, 256–279. [Google Scholar] [CrossRef]
- Chamaani, S.; Mirtaheri, S.A.; Abrishamian, M.S. Time-domain design of UWB Vivaldi antenna array using multi-objective particle swarm optimization. IEEE Antennas Wirel. Propag. Lett. 2010, 9, 666–669. [Google Scholar] [CrossRef]
- Shen, Y.; He, Z.; Liu, D. Optimization of fuel consumption and emissions for auxiliary power unit based on multi-objective optimization model. Energies 2016, 9, 90. [Google Scholar] [CrossRef]
- Liu, D.; Wang, Y.; Shen, Y. Electric vehicle charging and discharging coordination on distribution network using multi-objective particle swarm optimization and fuzzy decision making. Energies 2016, 9, 186. [Google Scholar] [CrossRef]
Figure 1.
Voltage-based MCC charging strategy.
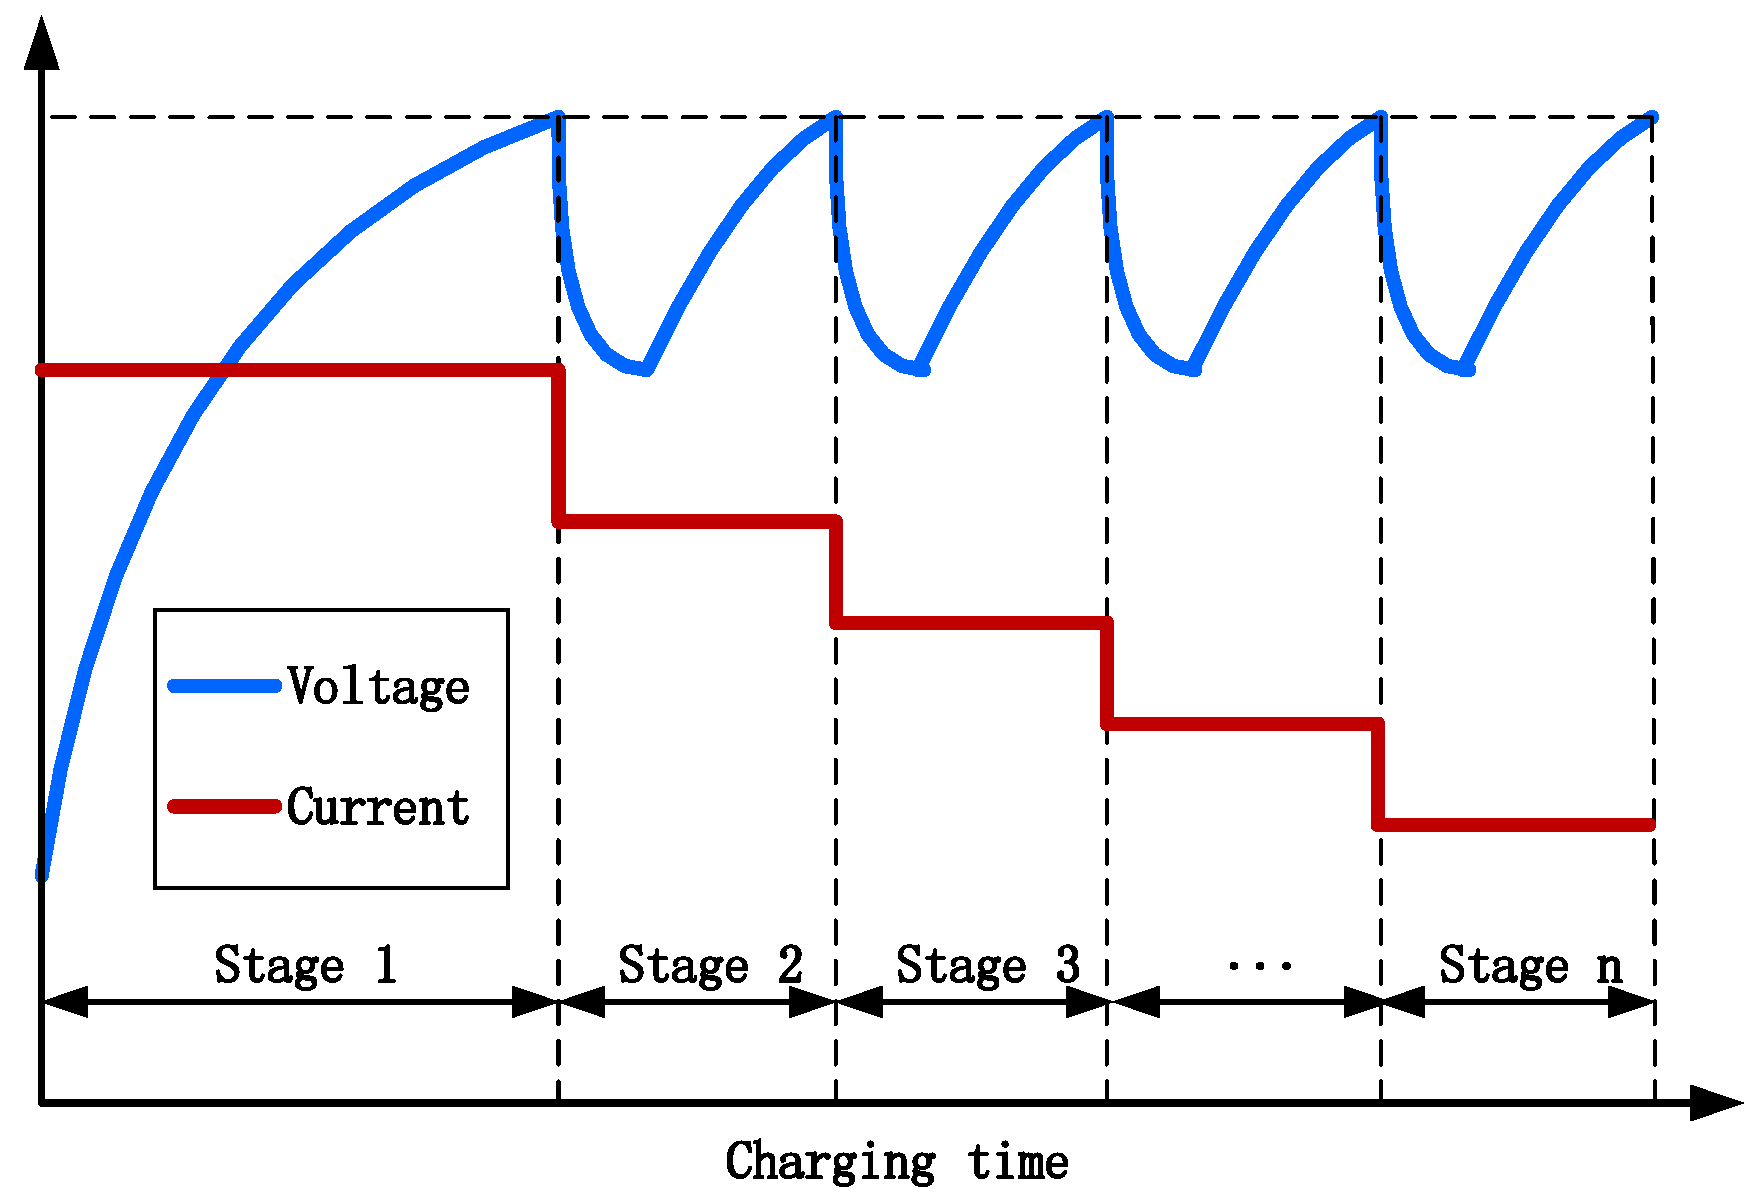
Figure 2.
One RC-branch ECM.

Figure 3.
Battery parameter estimation; (a) Pulse current charging profile; (b) Comparison of the simulated and experimental results.
Figure 3.
Battery parameter estimation; (a) Pulse current charging profile; (b) Comparison of the simulated and experimental results.
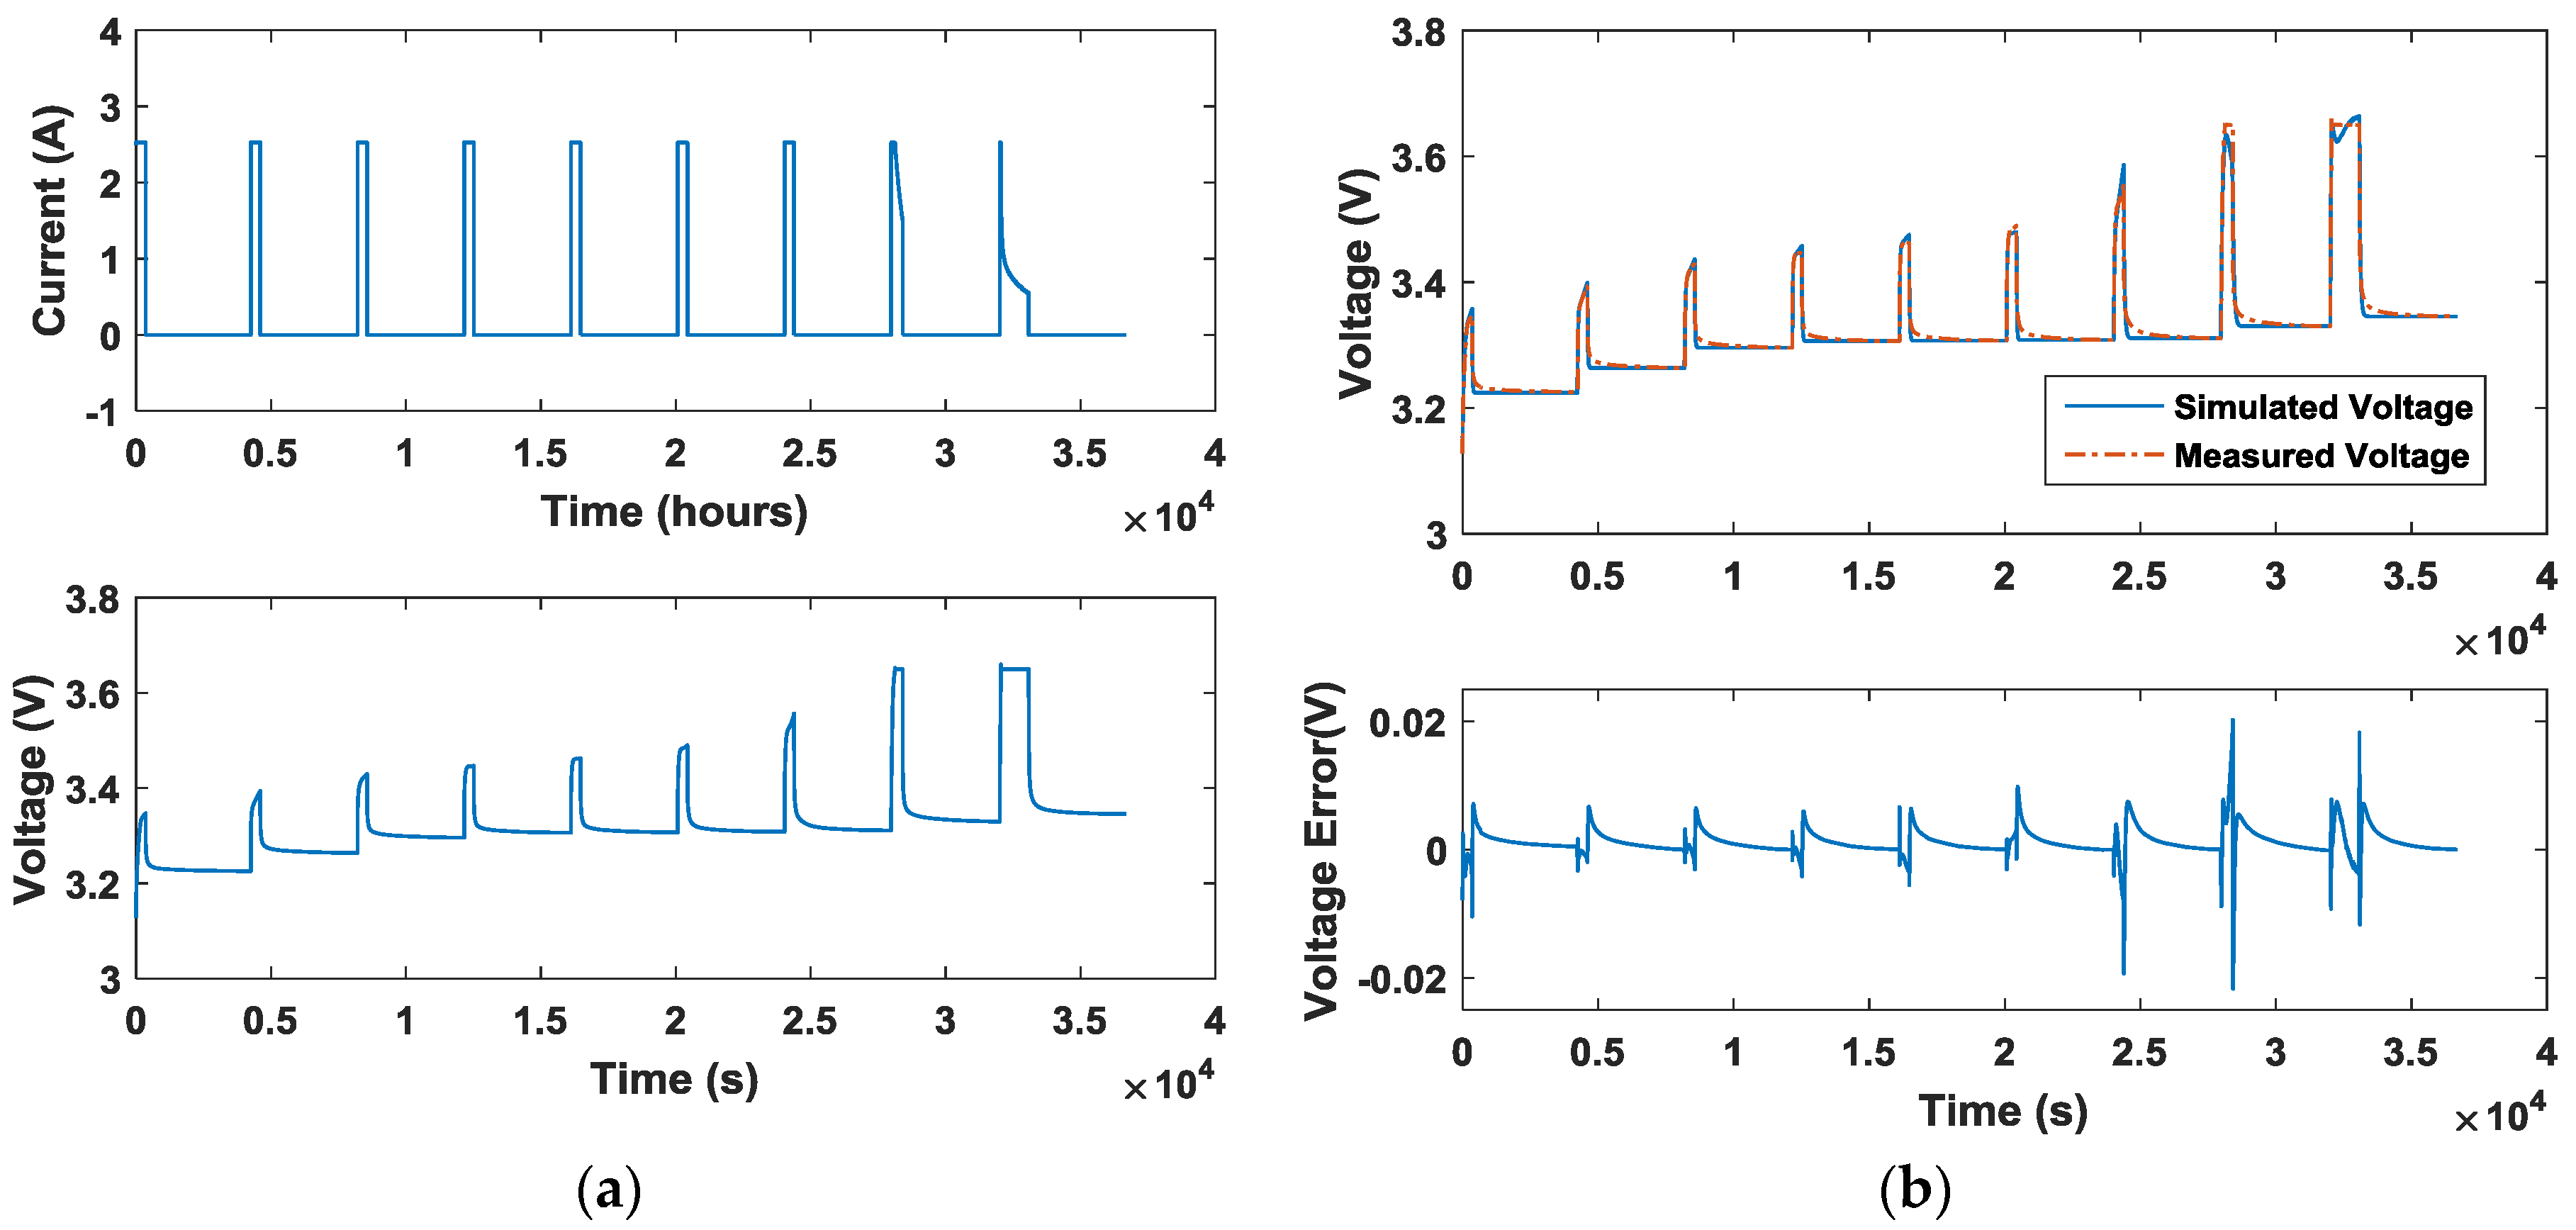
Figure 4.
Battery parameter under 25 °C.
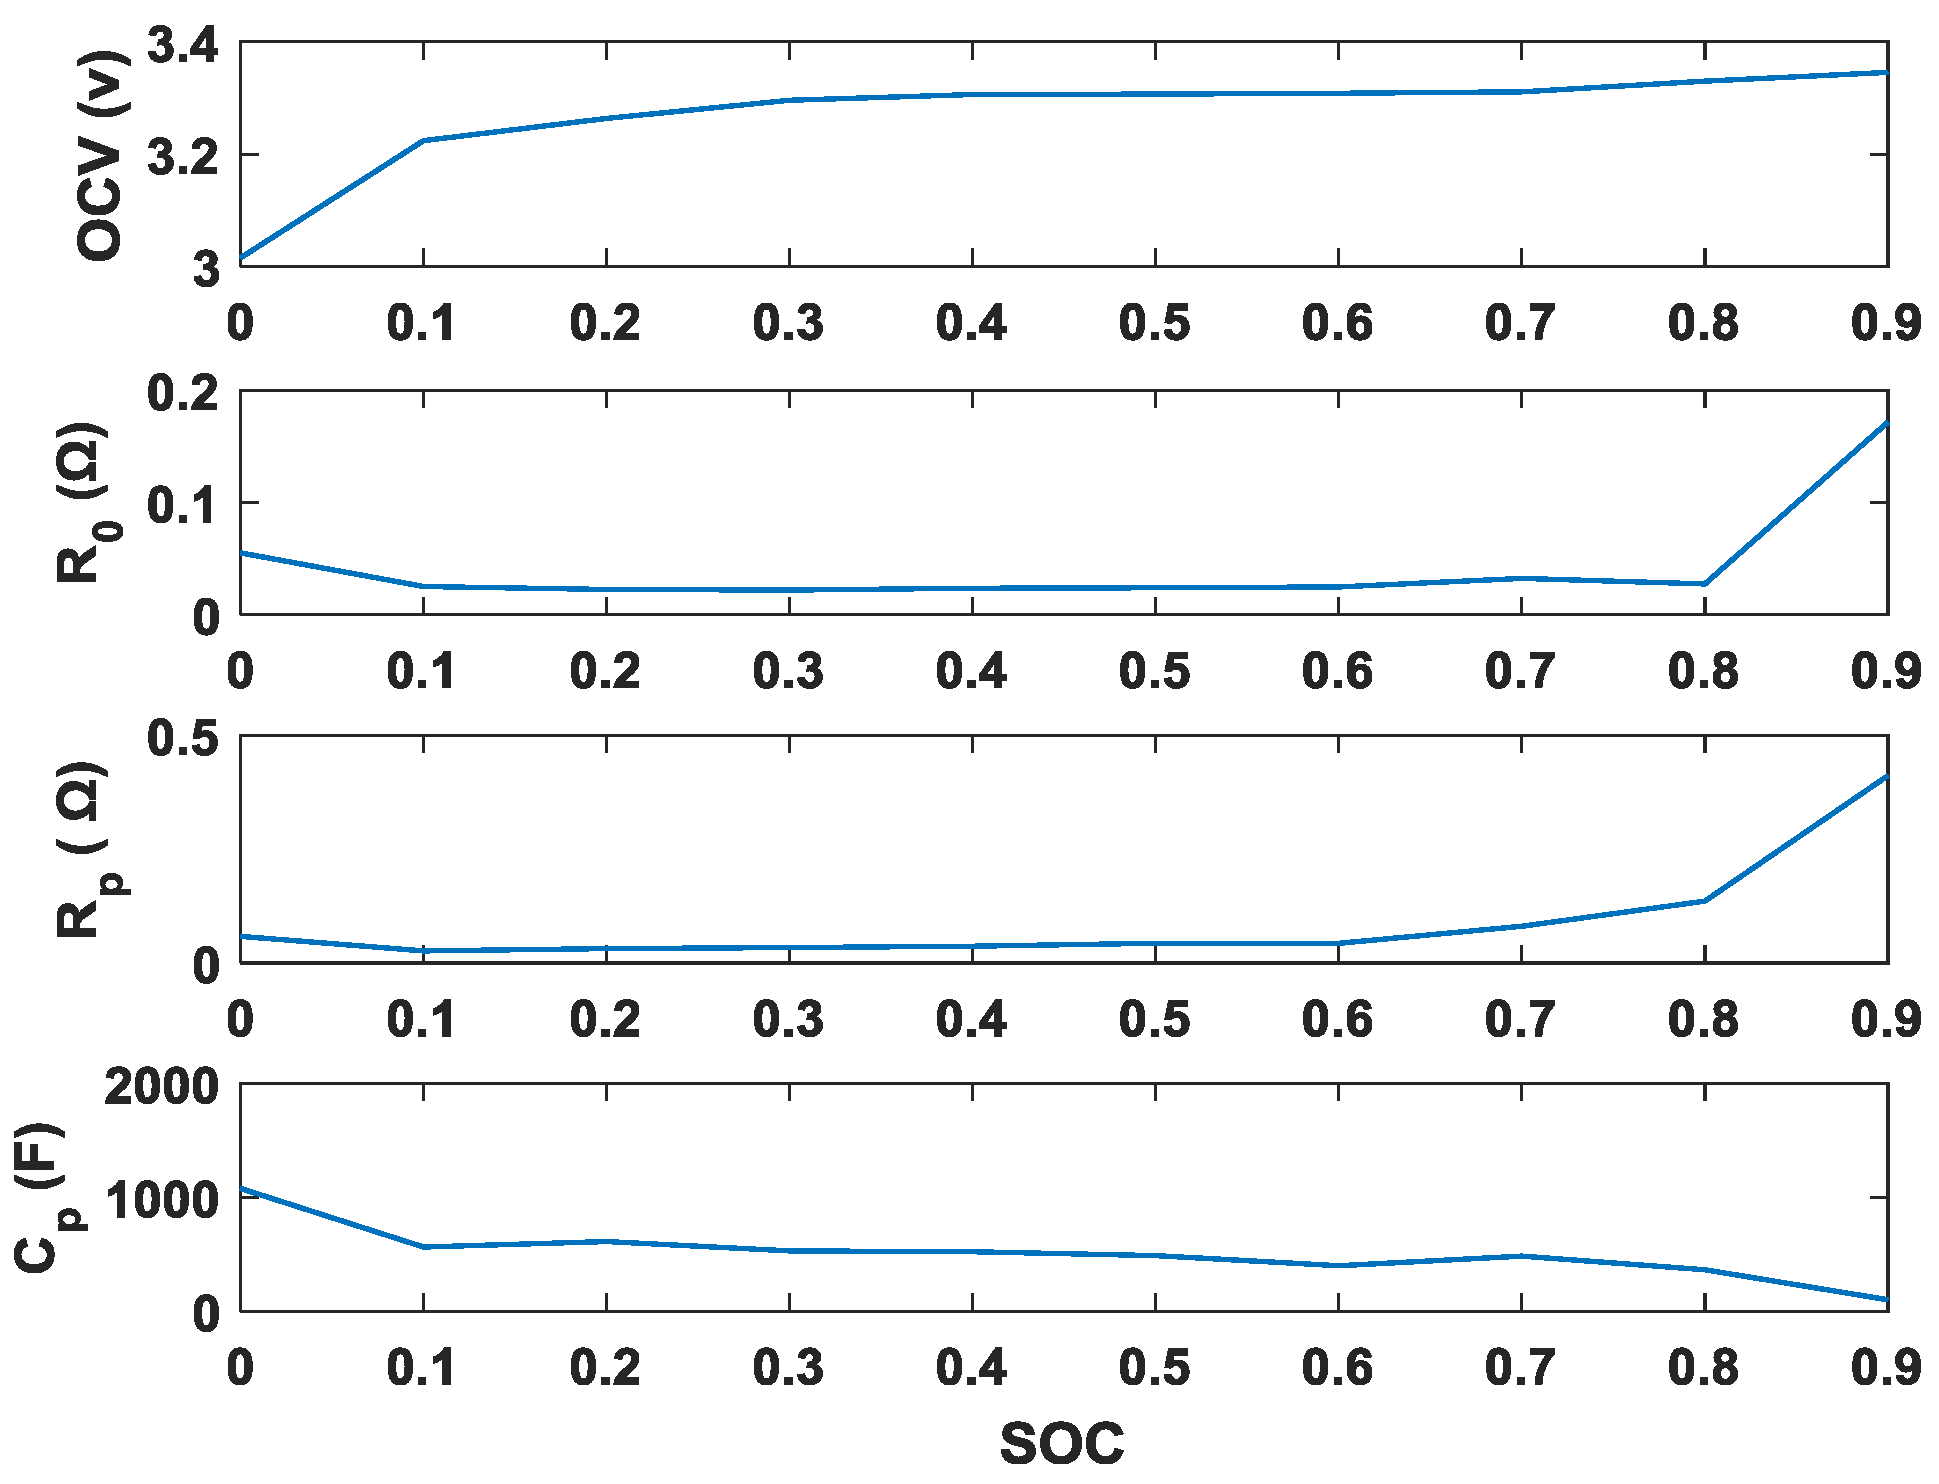
Figure 5.
Simulation result under different charging stage numbers. (a) Pareto set of charging time, uncharged capacity and energy loss; (b) Pareto set of charging time and uncharged capacity; (c) Pareto set of charging time and energy loss; (d) Pareto set of uncharged capacity and energy loss.
Figure 5.
Simulation result under different charging stage numbers. (a) Pareto set of charging time, uncharged capacity and energy loss; (b) Pareto set of charging time and uncharged capacity; (c) Pareto set of charging time and energy loss; (d) Pareto set of uncharged capacity and energy loss.
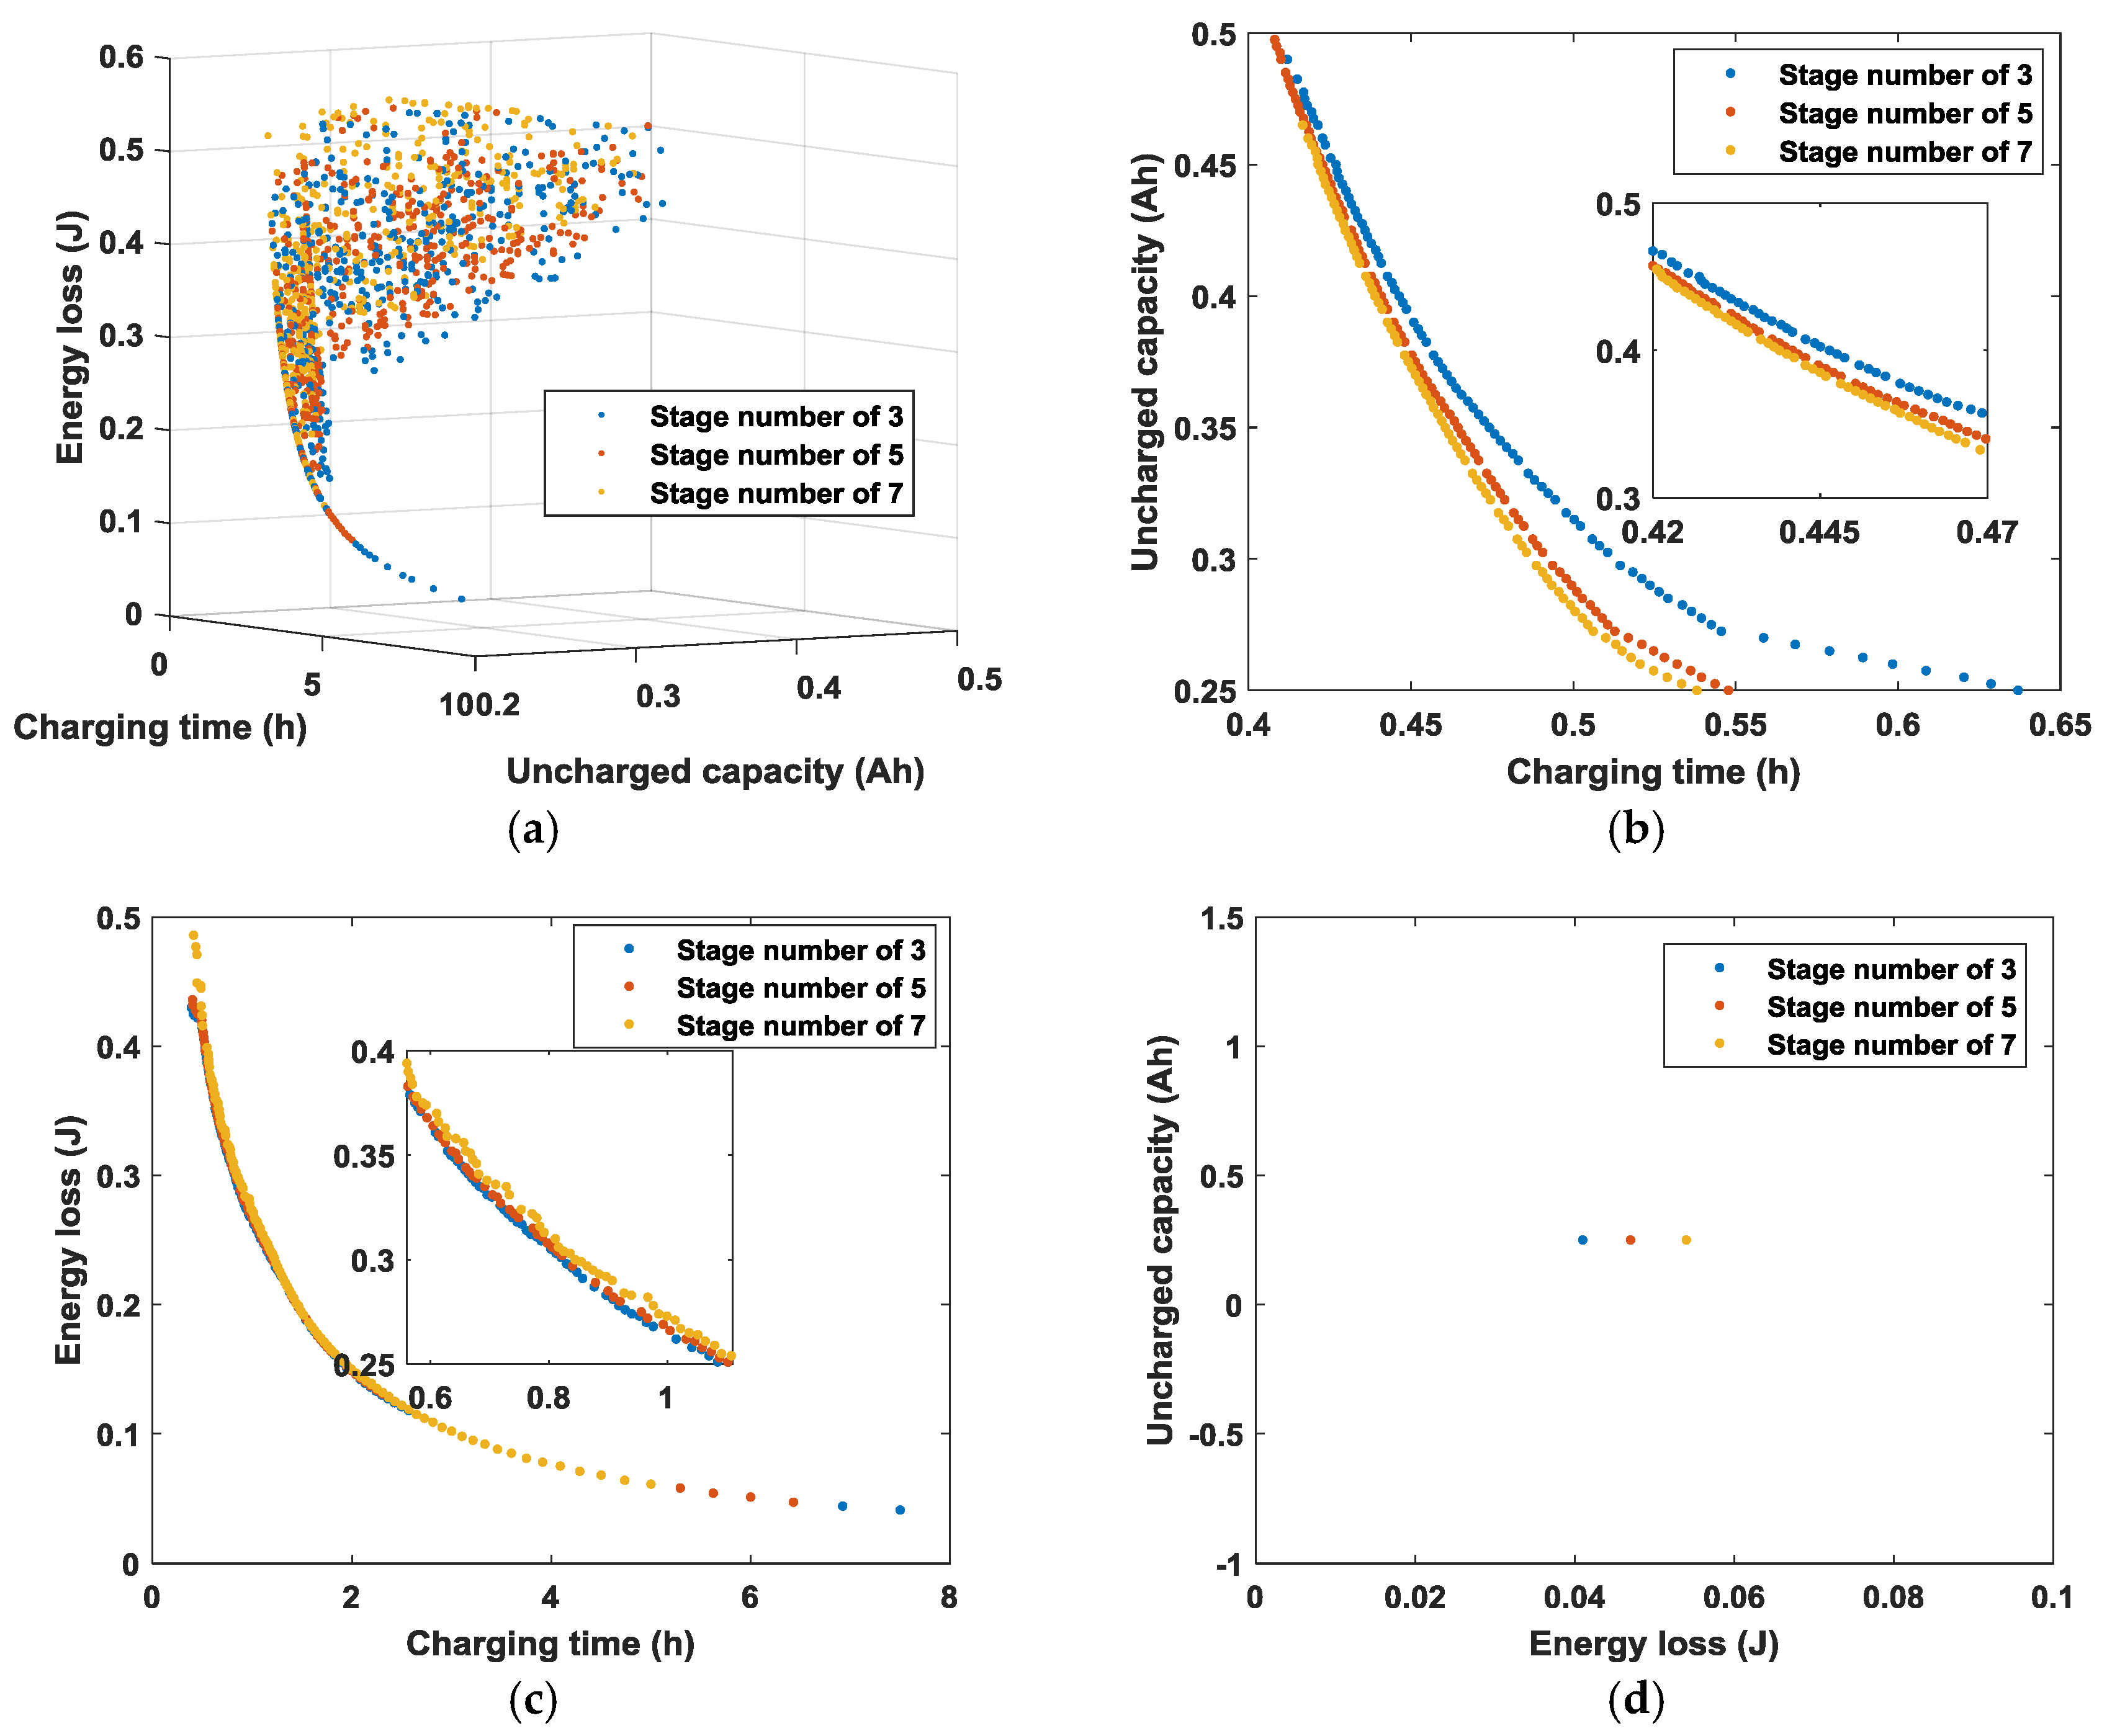
Figure 6.
Simulation result under different cut-off voltage. (a) Pareto set of charging time, uncharged capacity and energy loss; (b) Pareto set of charging time and uncharged capacity; (c) Pareto set of charging time and energy loss; (d) Pareto set of energy loss and uncharged capacity.
Figure 6.
Simulation result under different cut-off voltage. (a) Pareto set of charging time, uncharged capacity and energy loss; (b) Pareto set of charging time and uncharged capacity; (c) Pareto set of charging time and energy loss; (d) Pareto set of energy loss and uncharged capacity.

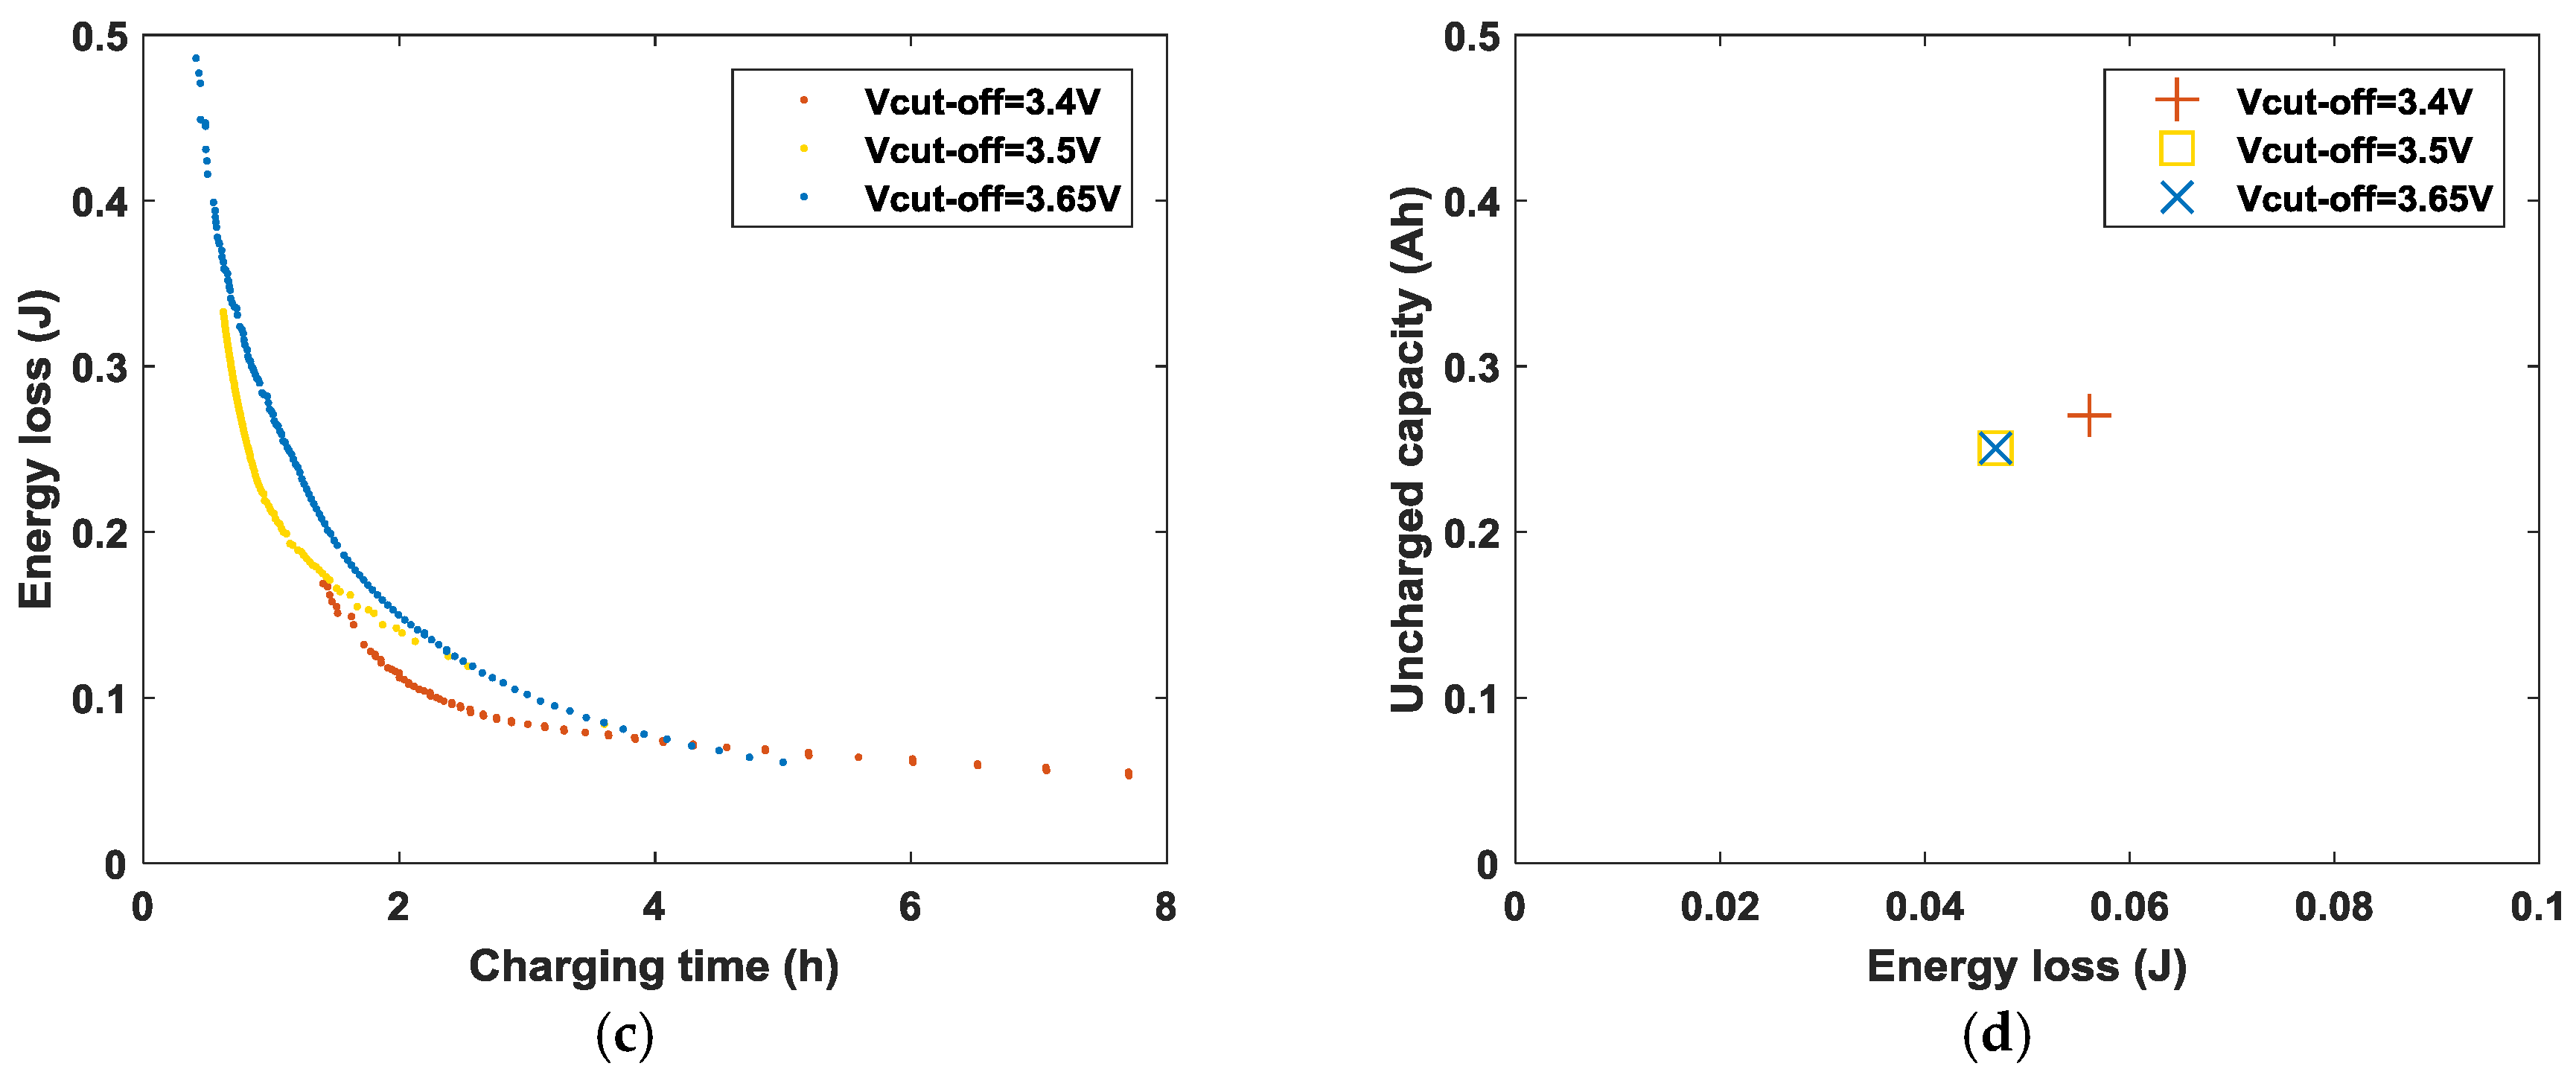
Figure 7.
Simulation result under different weight factors. (a) Pareto set for the proposed charging strategy; (b) charging current performance; (c) SOC performance; (d) energy loss performance.
Figure 7.
Simulation result under different weight factors. (a) Pareto set for the proposed charging strategy; (b) charging current performance; (c) SOC performance; (d) energy loss performance.
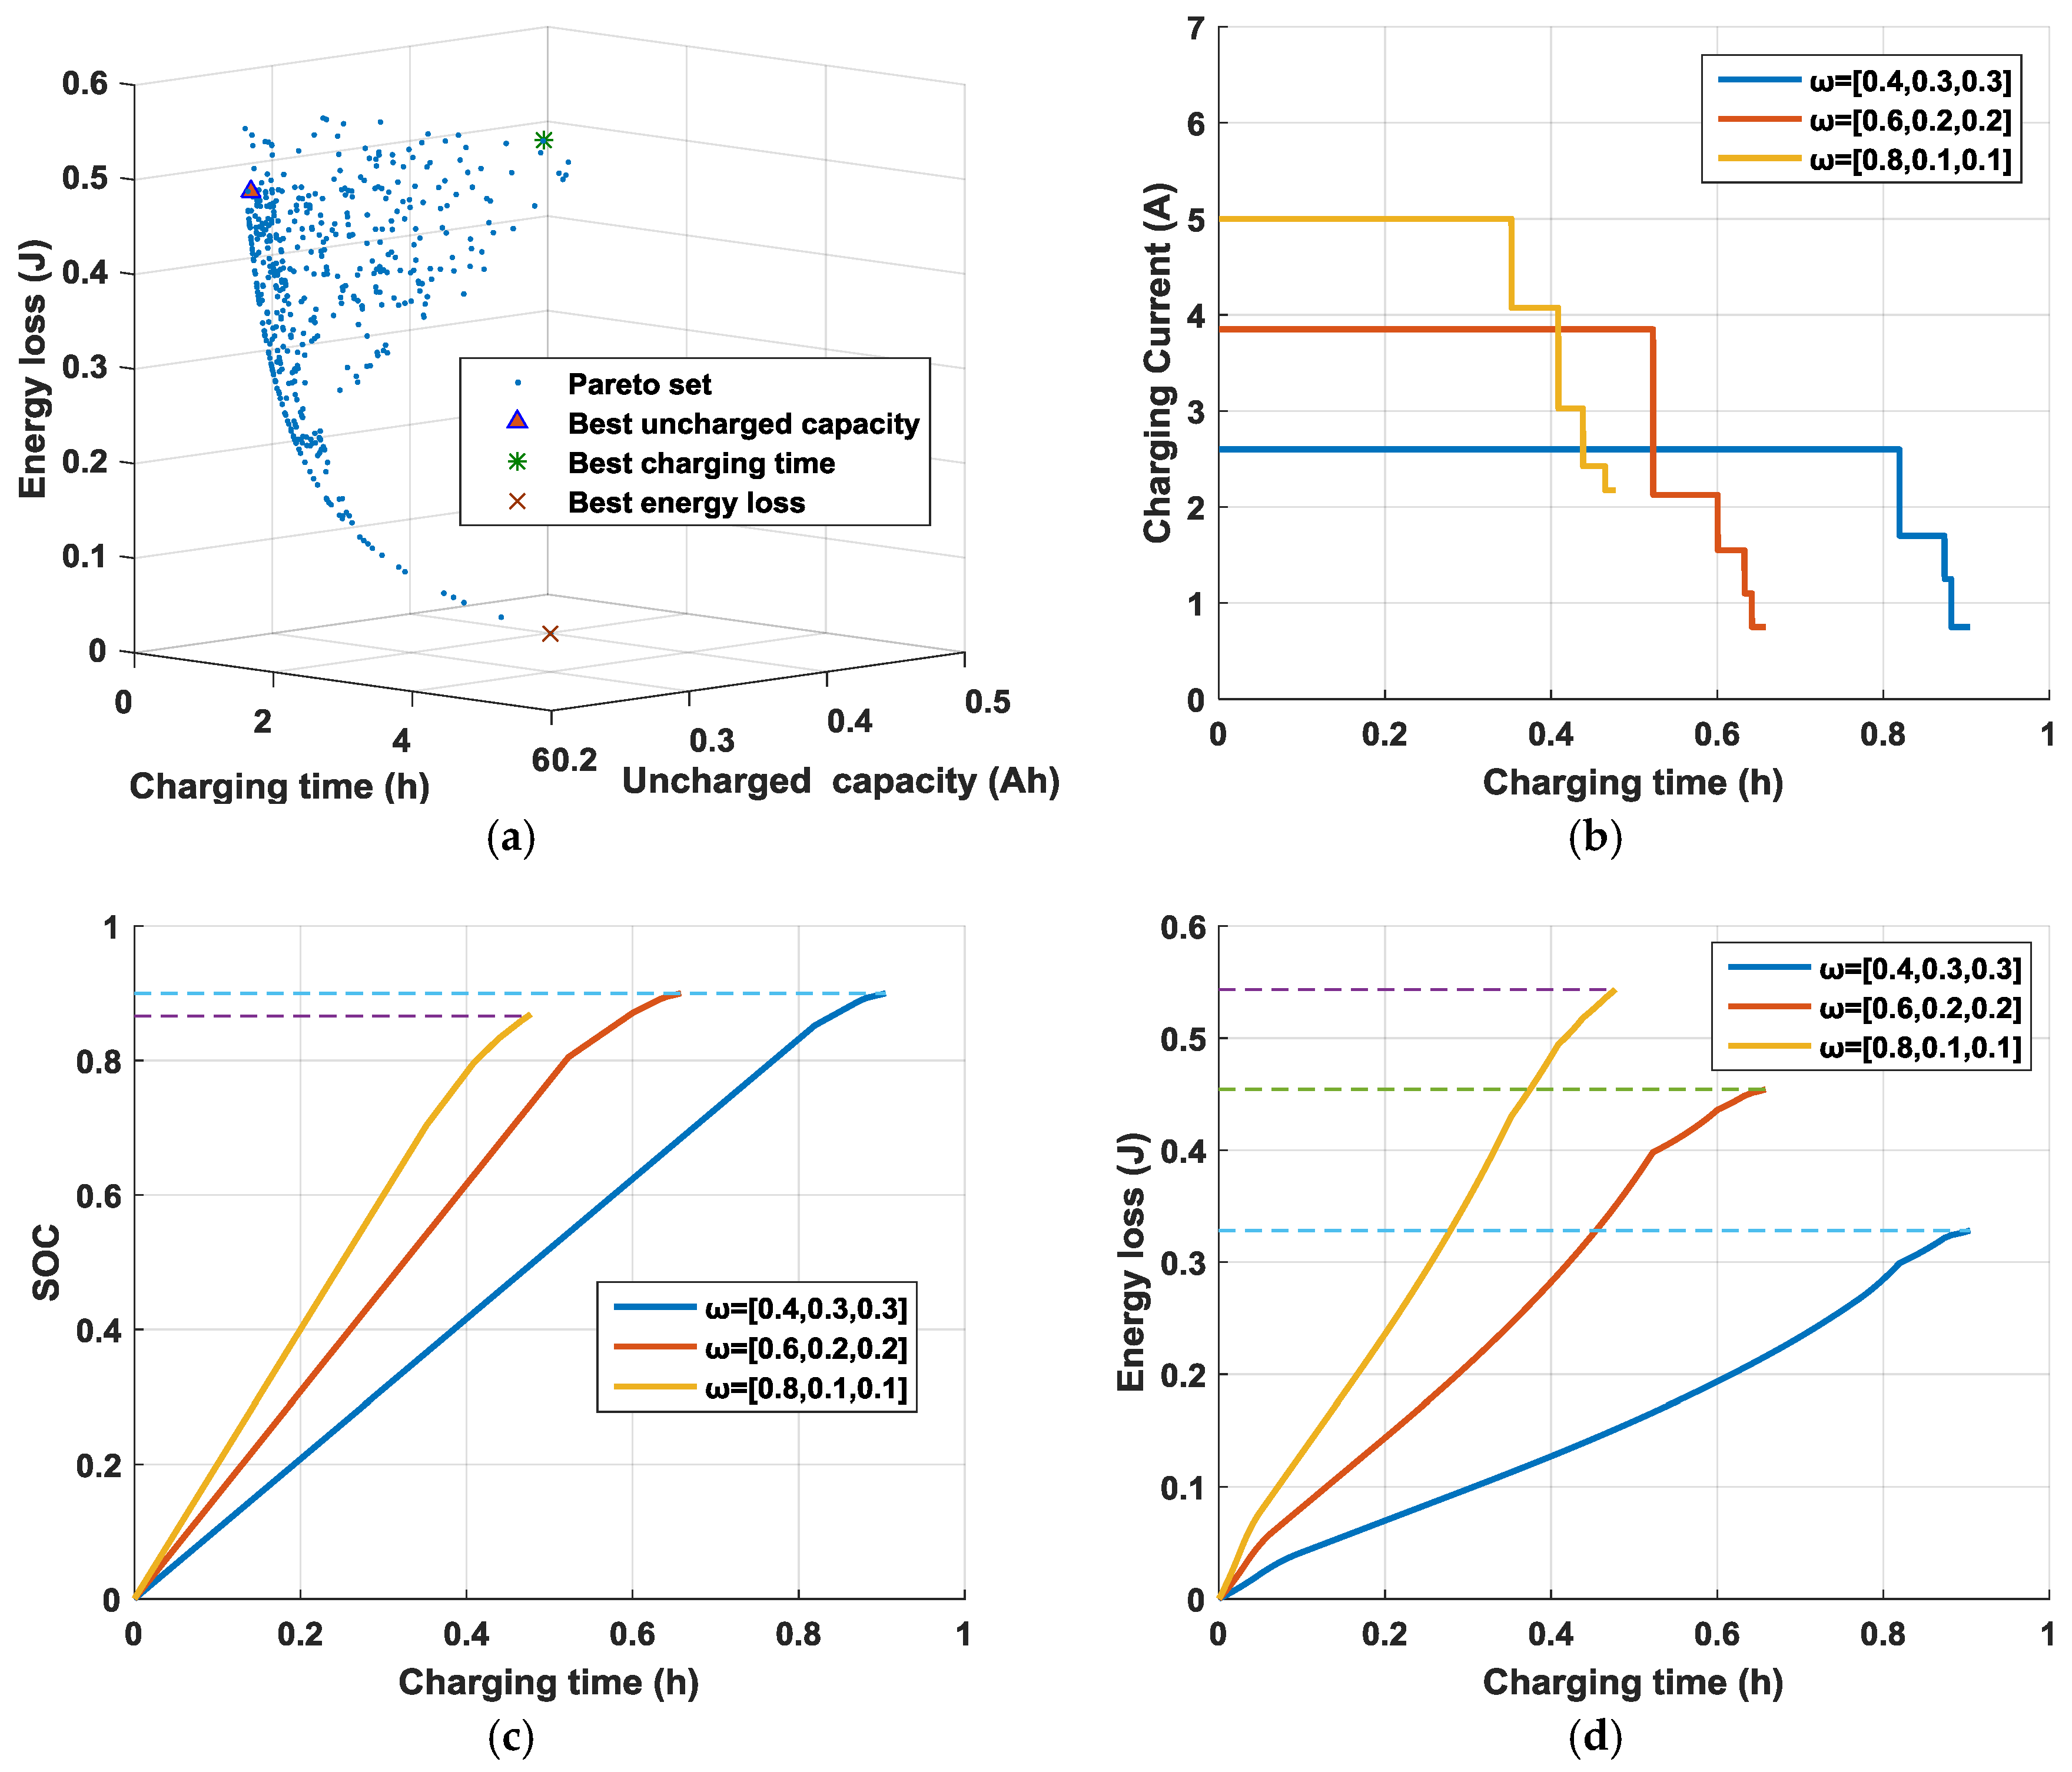
Figure 8.
Experimental comparison of the object function between the proposed and traditional charging strategy.
Figure 8.
Experimental comparison of the object function between the proposed and traditional charging strategy.
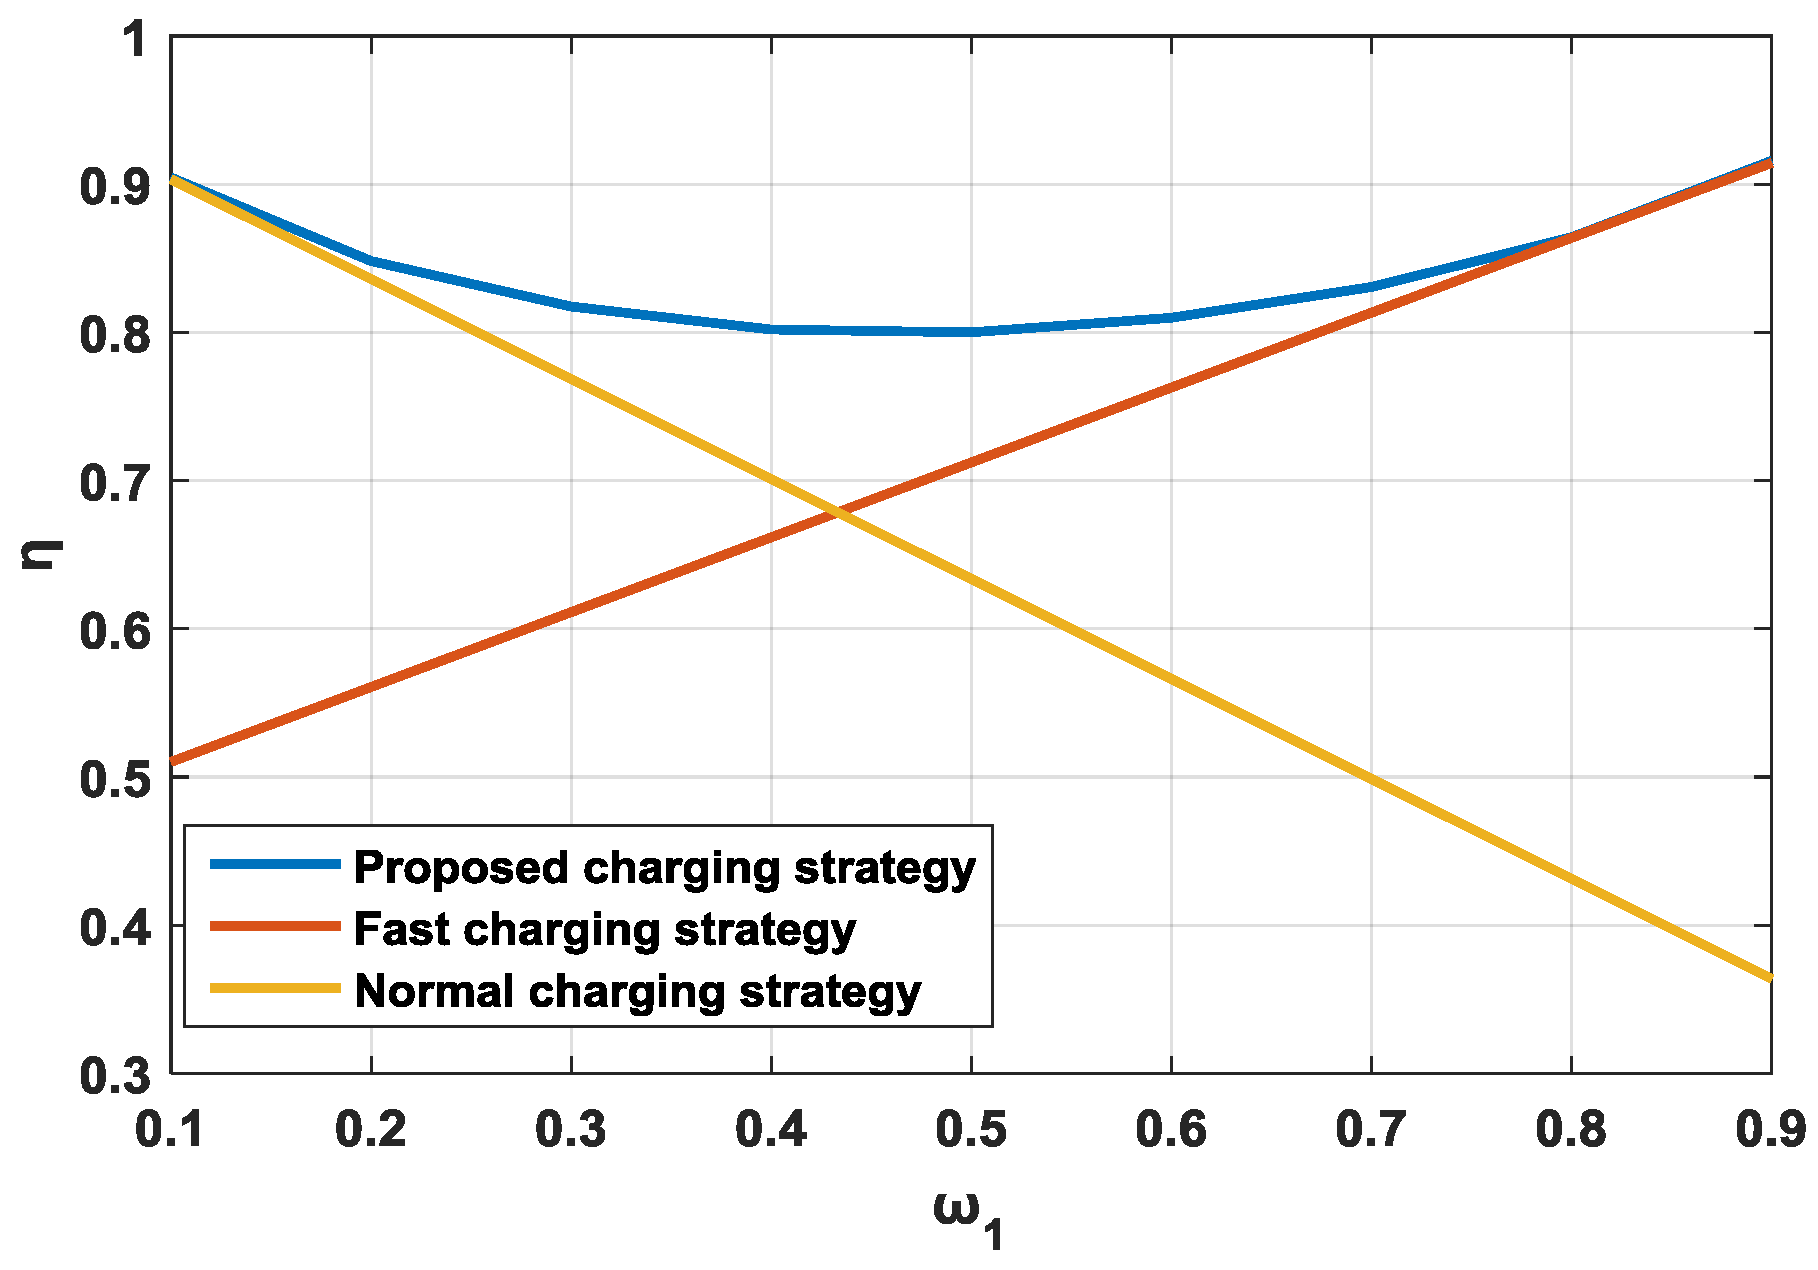
Figure 9.
Relative increase in charging performance of the proposed charging strategy compared with traditional normal and fast charging.
Figure 9.
Relative increase in charging performance of the proposed charging strategy compared with traditional normal and fast charging.
© 2017 by the authors. Licensee MDPI, Basel, Switzerland. This article is an open access article distributed under the terms and conditions of the Creative Commons Attribution (CC BY) license (http://creativecommons.org/licenses/by/4.0/).
Share and Cite
MDPI and ACS Style
Min, H.; Sun, W.; Li, X.; Guo, D.; Yu, Y.; Zhu, T.; Zhao, Z. Research on the Optimal Charging Strategy for Li-Ion Batteries Based on Multi-Objective Optimization. Energies 2017, 10, 709. https://doi.org/10.3390/en10050709
AMA Style
Min H, Sun W, Li X, Guo D, Yu Y, Zhu T, Zhao Z. Research on the Optimal Charging Strategy for Li-Ion Batteries Based on Multi-Objective Optimization. Energies. 2017; 10(5):709. https://doi.org/10.3390/en10050709
Chicago/Turabian StyleMin, Haitao, Weiyi Sun, Xinyong Li, Dongni Guo, Yuanbin Yu, Tao Zhu, and Zhongmin Zhao. 2017. "Research on the Optimal Charging Strategy for Li-Ion Batteries Based on Multi-Objective Optimization" Energies 10, no. 5: 709. https://doi.org/10.3390/en10050709
Note that from the first issue of 2016, this journal uses article numbers instead of page numbers. See further details here.