Article

Simulation Modeling Method and Experimental Investigation on the Uniflow Scavenging System of an Opposed-Piston Folded-Cranktrain Diesel Engine

1
School of Mechanical and Power Engineering, North University of China, Taiyuan 030051, China
2
School of Mechanical and Vehicle Engineering, Beijing Institute of Technology, Beijing 100081, China
*
Author to whom correspondence should be addressed.
Energies 2017, 10(5), 727; https://doi.org/10.3390/en10050727
Submission received: 20 December 2016 / Revised: 3 May 2017 / Accepted: 18 May 2017 / Published: 20 May 2017

Abstract

:
The scavenging process for opposed-piston folded-cranktrain (OPFC) diesel engines can be described by the time evolution of the in-cylinder and exhaust chamber residual gas rates. The relation curve of in-cylinder and exhaust chamber residual gas rate is called scavenging profile, which is calculated through the changes of in-cylinder and exhaust chamber gas compositions determined by computational fluid dynamics (CFD) simulation. The scavenging profile is used to calculate the scavenging process by mono-dimensional (1D) simulation. The tracer gas method (TGM) is employed to validate the accuracy of the scavenging profile. At the same time, the gas exchange performance under different intake and exhaust state parameters was examined based on the TGM. The results show that the scavenging process from 1D simulation and experiment match well, which means the scavenging model obtained by CFD simulation performs well and validation of its effectiveness by TGM is possible. The difference between intake and exhaust pressure has a significant positive effect on the gas exchange performance and trapped gas mass, but the pressure difference has little effect on the scavenging efficiency and the trapped air mass if the delivery ratio exceeds 1.4.

1. Introduction

The opposed piston two stroke (OP2S) engine concept can be traced back to late 1800s. Since then, many novel applications have been used on aircraft, ships and vehicles. In the first half of the 20th century, OP2S engines were developed in multiple countries for a wide variety of applications, however, modern emissions regulations stopped the widespread development of most two-stroke engines in the latter half of the 20th century [1]. In recent years, with the application of advanced design technology, modern analytical tools, materials and engineering methods, the emission problem no longer limits the successful design of a clean and efficient OP2S [2], so OP2S engines have again attracted intensive attention to improve engine efficiency and emission performance [3,4,5,6,7]. Compared with conventional engines, OP2S engines have many fundamental advantages [8]. The opposed-piston structure is characterized by two pistons reciprocating opposite each other in a common cylinder, which cancels the need for the cylinder head and valve mechanism, which leads to lower heat loss for higher wall temperatures of the two piston crowns compared to a cylinder head. The nearly symmetrical movement of opposed pistons also leads to excellent engine balance even for single cylinder configurations.
In the uniflow scavenging process of an OP2S engine, two ideal models must be firstly introduced: the perfect displacement model and the perfect mixing model. The perfect displacement model is used to describe if the burned gases are pushed out by the fresh gases without any mixing. The perfect mixing model applies if the entering fresh mixture mixes instantaneously and uniformly with the cylinder contents. Since 1914, when Hopkinson proposed a perfect mixing scavenging model, lots of different models have been offered to draw conclusions about the quality of the scavenging process [9]. A model with good ability to reproduce the real process as well as low mathematical burden is always needed. Merker and Gerstle classified these models into single-zone, multi zone and fluid mechanical models [10]. In single-zone models, Benson and Brandham assumed that the cylinder content can be divided into two zones, a perfect displacement and a perfect mixing zone [11]. In the first phase, the scavenging process works as a perfect displacement while the second phase takes place as a perfect mixing process. Dang and Wallace combined perfect displacement with perfect mixing and short circuiting [12]. Multi-zone models divide the cylinder volume into two or more sub-volumes or systems. All sub-volumes or systems share a constant pressure but different zones can have different temperatures. The temperature of each sub-volume is constant and no heat transfer between zones is assumed. Several such models have been proposed by Streit, Borman and Wallace [13,14,15]. In recent years, a synthetic scavenging model for the overall characterization of the scavenging process of two-stroke engines was widely used. It gives the mass fraction of burned gases exhausted as a function of the mass fraction of burned gases in the cylinder. The model is usually used as input data in many mono-dimensional (1D) softwares [16]. Ferrara, Balduzzi and Vichi presented an innovative solution to reduce the short-circuit by designing a rotating valve positioned in correspondence with the exhaust port [17].
The scavenging model is used as input data for the second step of the 1D simulation. The new solution has been analyzed both in terms of global performance using 1D code, and by the fluid dynamics behavior of the system through computational fluid dynamics (CFD) simulations. Laget, Ternel and Thiriot used the synthetic scavenging model to study the influence of intake and exhaust pressure on the scavenging process in their preliminary design of a two-stroke uniflow diesel engine for passenger cars [18]. Tribotte, Ravet and Dugue compared three kinds of cylinder heads following the guideline of the synthetic scavenging model [19]. The results after redesign proved satisfactory. Pohorelsky, Brynych and Macek also used the synthetic scavenging model as a part of their 1D engine model to determine the air management requirements for a down-sized two-stroke engine [20]. For the improvement of scavenging efficiency the transient gas exchange simulation was carried out for multiple cases, including two intake port configurations at various back pressures in the exhaust system and two port timings [21]. The effects of exhaust back pressure, port timing and intake port layout on scavenging and trapped air mass in the cylinder all were investigated by transient CFD simulation including blow-down and scavenging. By three dimensional computational fluid dynamics under different intake pressures and engine speeds, Wang et al., evaluated the scavenging process by analyzing delivery ratio, trapping efficiency, scavenging efficiency and charging efficiency [22]. In addition, the in-cylinder flow motions, which play important roles in controlling the charge mixing and combustion process, were studied for different scavenging port designs. In order to achieve aggressive engine downsizing, a boosted uniflow scavenged direct injection gasoline engine concept has been proposed and researched by means of CFD simulation and demonstration in a single cylinder engine [23]. In summary, the scavenging model is always used in pre-design and some optimization work. From the literatures above, we can see most scavenging profiles are calculated by 1D code. The cylinder is divided into different zones and a combination of the perfect displacement model, perfect mixing model and short circuiting model is used to simulate the scavenging process. The mass change of fresh air and burned gas are used as the calculation method to obtain the profile, which is a model of the flow conditions in the cylinder closer to the reality.
In addition, trapping efficiency has been a difficult parameter to measure because trapping efficiency varies with the level of in-cylinder mixing, gas velocities, exhaust tuning and other physical phenomena that are difficult to predict. Numerous techniques involving in-cylinder sampling have been successfully implemented to measure trapping efficiency [24]. Although these techniques have proven to be reliable given that a significant portion of the cylinder contents is removed, or represented with each sample, it generally requires major engine modifications and a laboratory environment. In-cylinder sampling can be intrusive to the combustion process and is costly to carry out. The engine cylinder typically must be physically modified to accommodate a sampling valve. The biggest advantage of the tracer gas method (TGM) is that it does not require major engine modifications to execute it. Additionally, it is adaptable to field applications. The experimental setup is external to the engine, eliminating the need for any major engine modification [25,26,27].
In this paper, the scavenging profile is calculated through the changes of in-cylinder and exhaust chamber gas compositions by CFD simulation, which can reflect the flow conditions in the cylinder closer to the reality [28]. On the one hand the TGM validates the scavenging model, on the other hand it shows the rules influencing the scavenging process.

2. Uniflow Scavenging System of an OPFC Diesel Engine

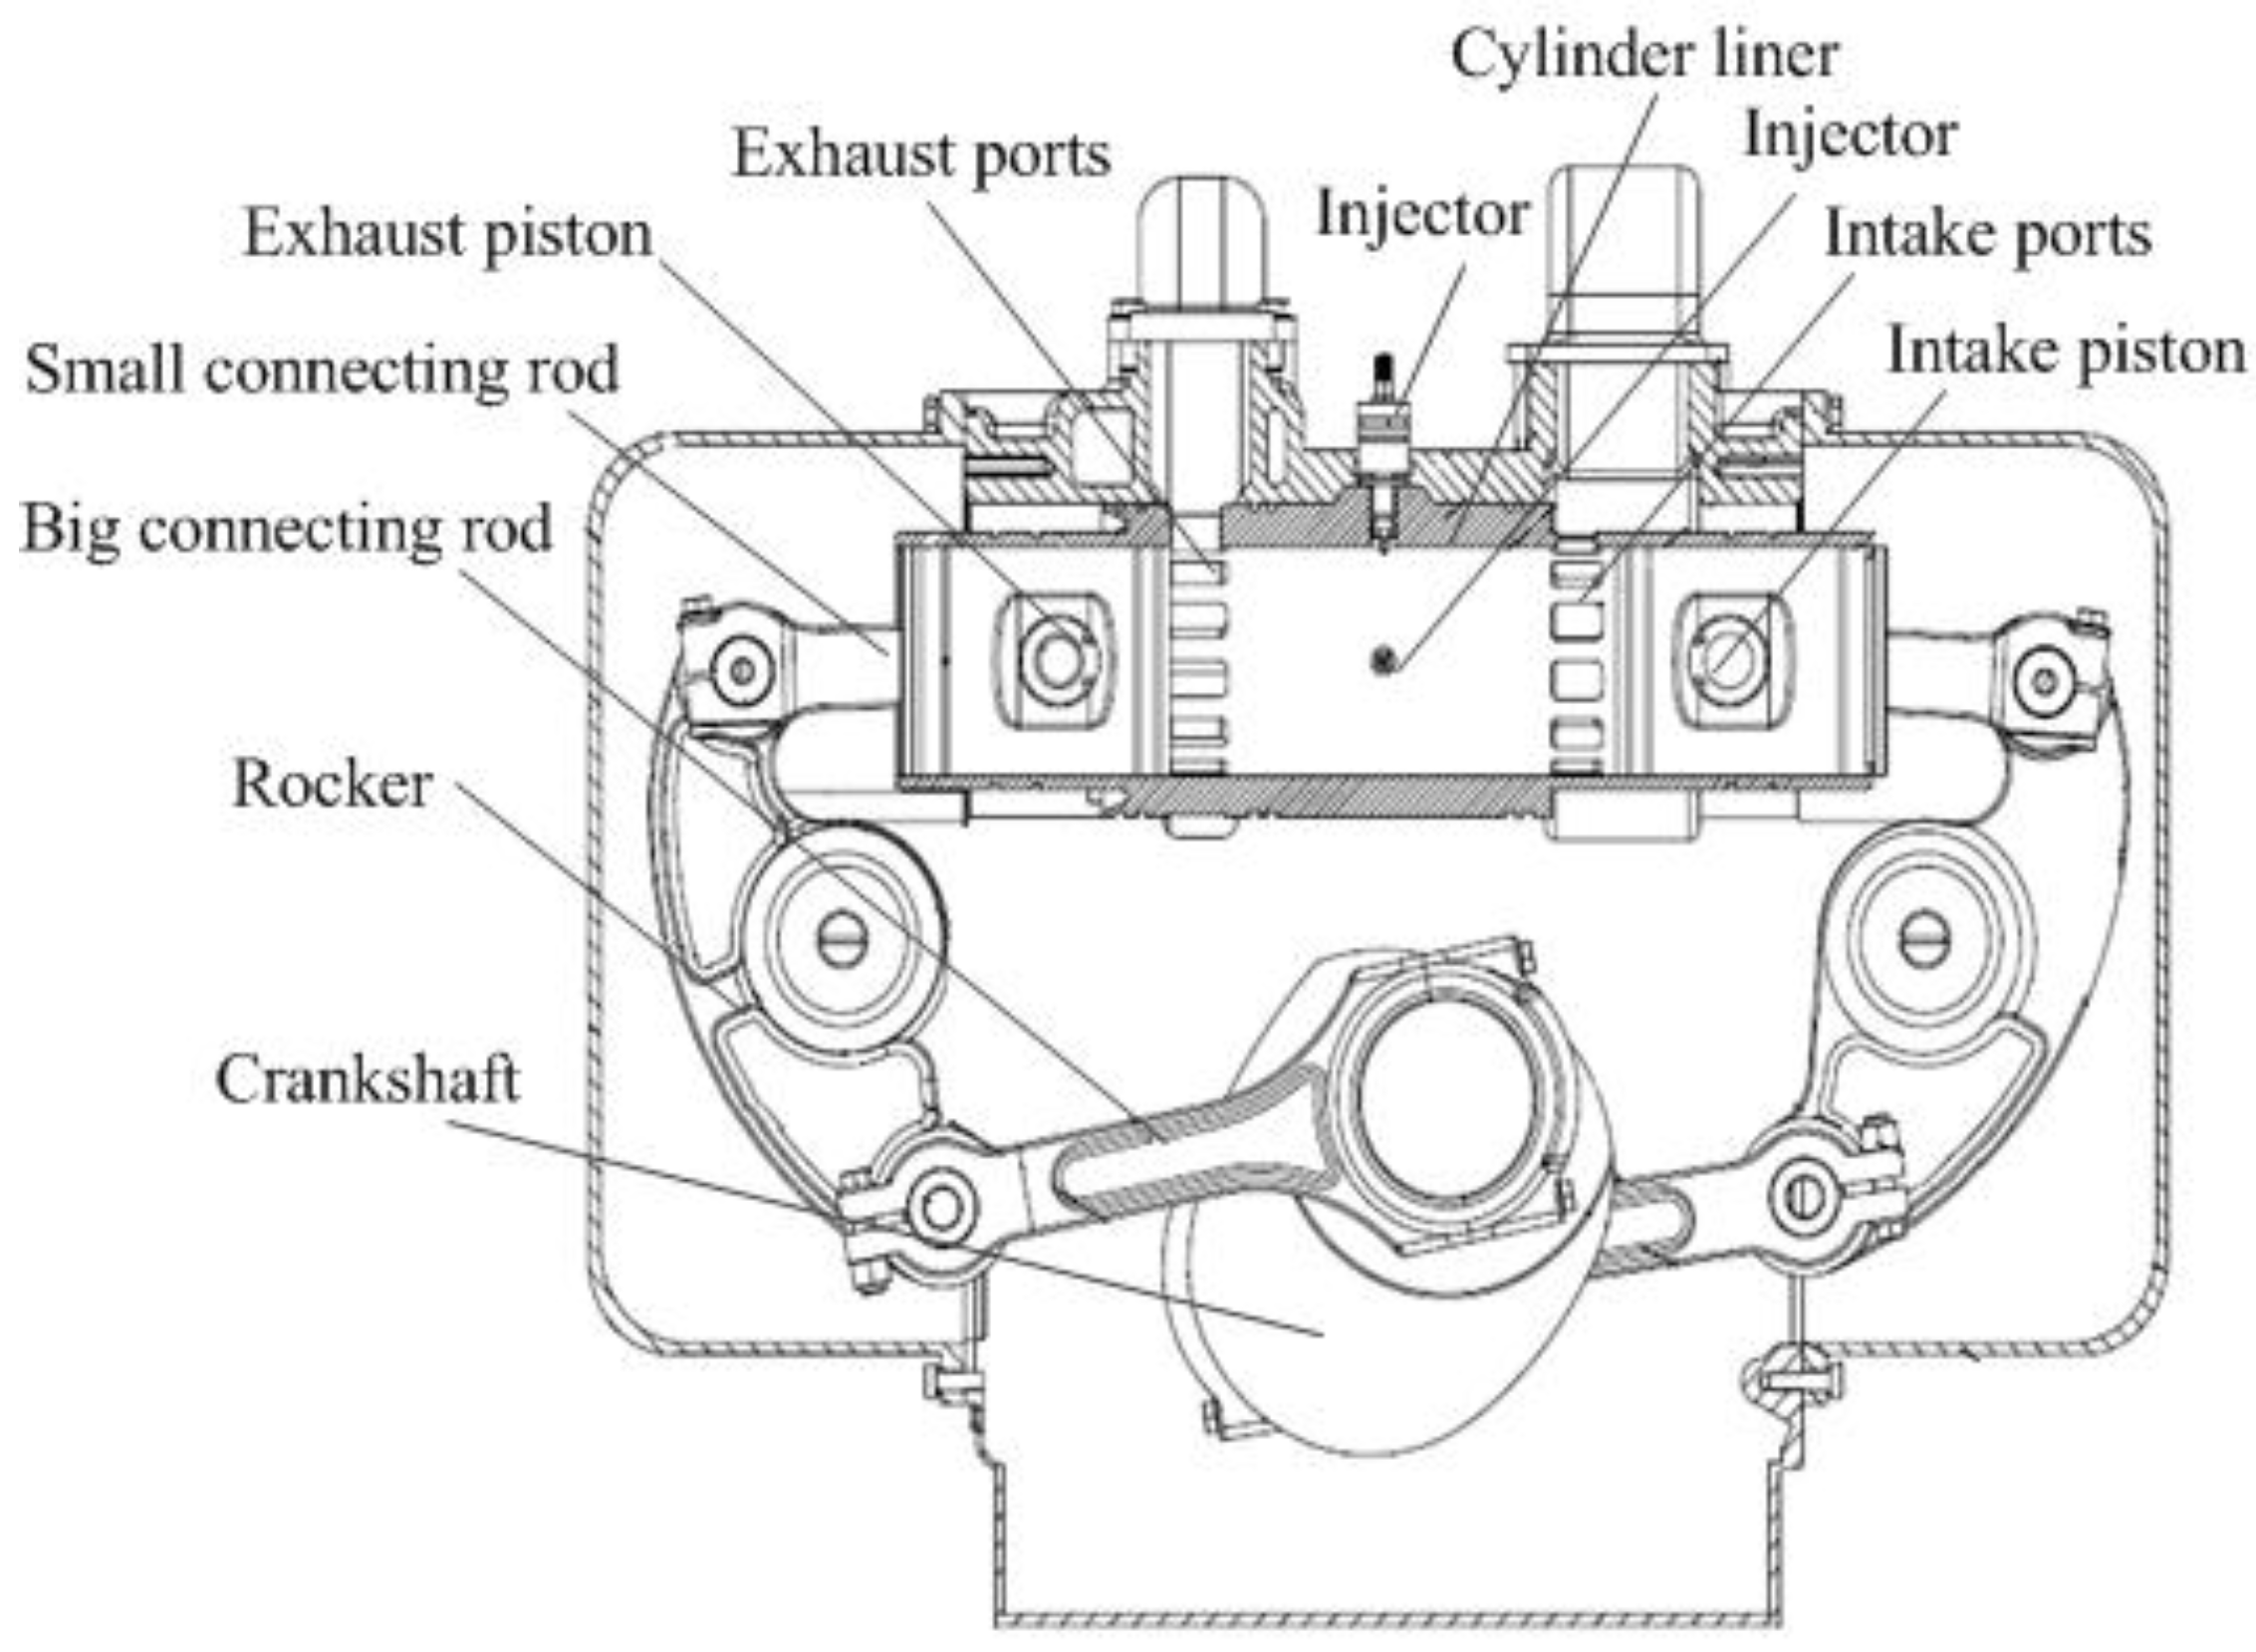
2.1. OPFC Diesel Engine Concept

As shown in Figure 1, the cylinder of the opposed-piston folded-cranktrain (OPFC) diesel engine was horizontal and the injector was placed on the cylinder liner. Meanwhile, at the end of the liner there were gas ports, intake ports on one side and exhaust ports on the other side. Intake ports were used to deliver fresh air into the cylinder, and exhaust ports were used to deliver burnt gases out from the cylinder. There were two pistons placed in the same cylinder liner, and a combustion chamber was formed when two pistons moved to the most closed position, which is inner dead center (IDC). Rockers were placed either end of the cylinder body, and the upper end of the rocker was connected to piston by a small connecting rod, and the lower end of the rocker was connected to crankshaft by a big connecting rod. The reciprocating movements of pistons were driven by the crankshaft through the rockers and connecting rods. The pistons can be defined by the differences between control gas ports. The piston controlling the opening and closing of intake ports was defined as the intake piston and the piston controlling the opening and closing of exhaust ports was defined as the exhaust piston. Usually a phase difference between the intake piston and exhaust piston is an effective way to improve gas exchange performance in the OPFC engine by changing the scavenging duration and timing. At the same time, due to the opposed-piston motion phase difference, opposed-pistons on both sides can not arrive at each top dead center (TDC) simultaneously. When opposed-pistons are around IDC, the opposed-pistons’ relative velocity affects the isochoric combustion duration. When the opposed-pistons are approaching IDC, the greater the motion phase difference is, the smaller the relative velocity is. This is caused by the opposed-piston motion phase difference, which results in the exhaust piston moving away from the IDC, while the intake piston will be close to the IDC. There is a catch-up process between two pistons, and when the phase difference is bigger, the catch-up process will be longer [29,30]. The engine specifications are listed in Table 1.

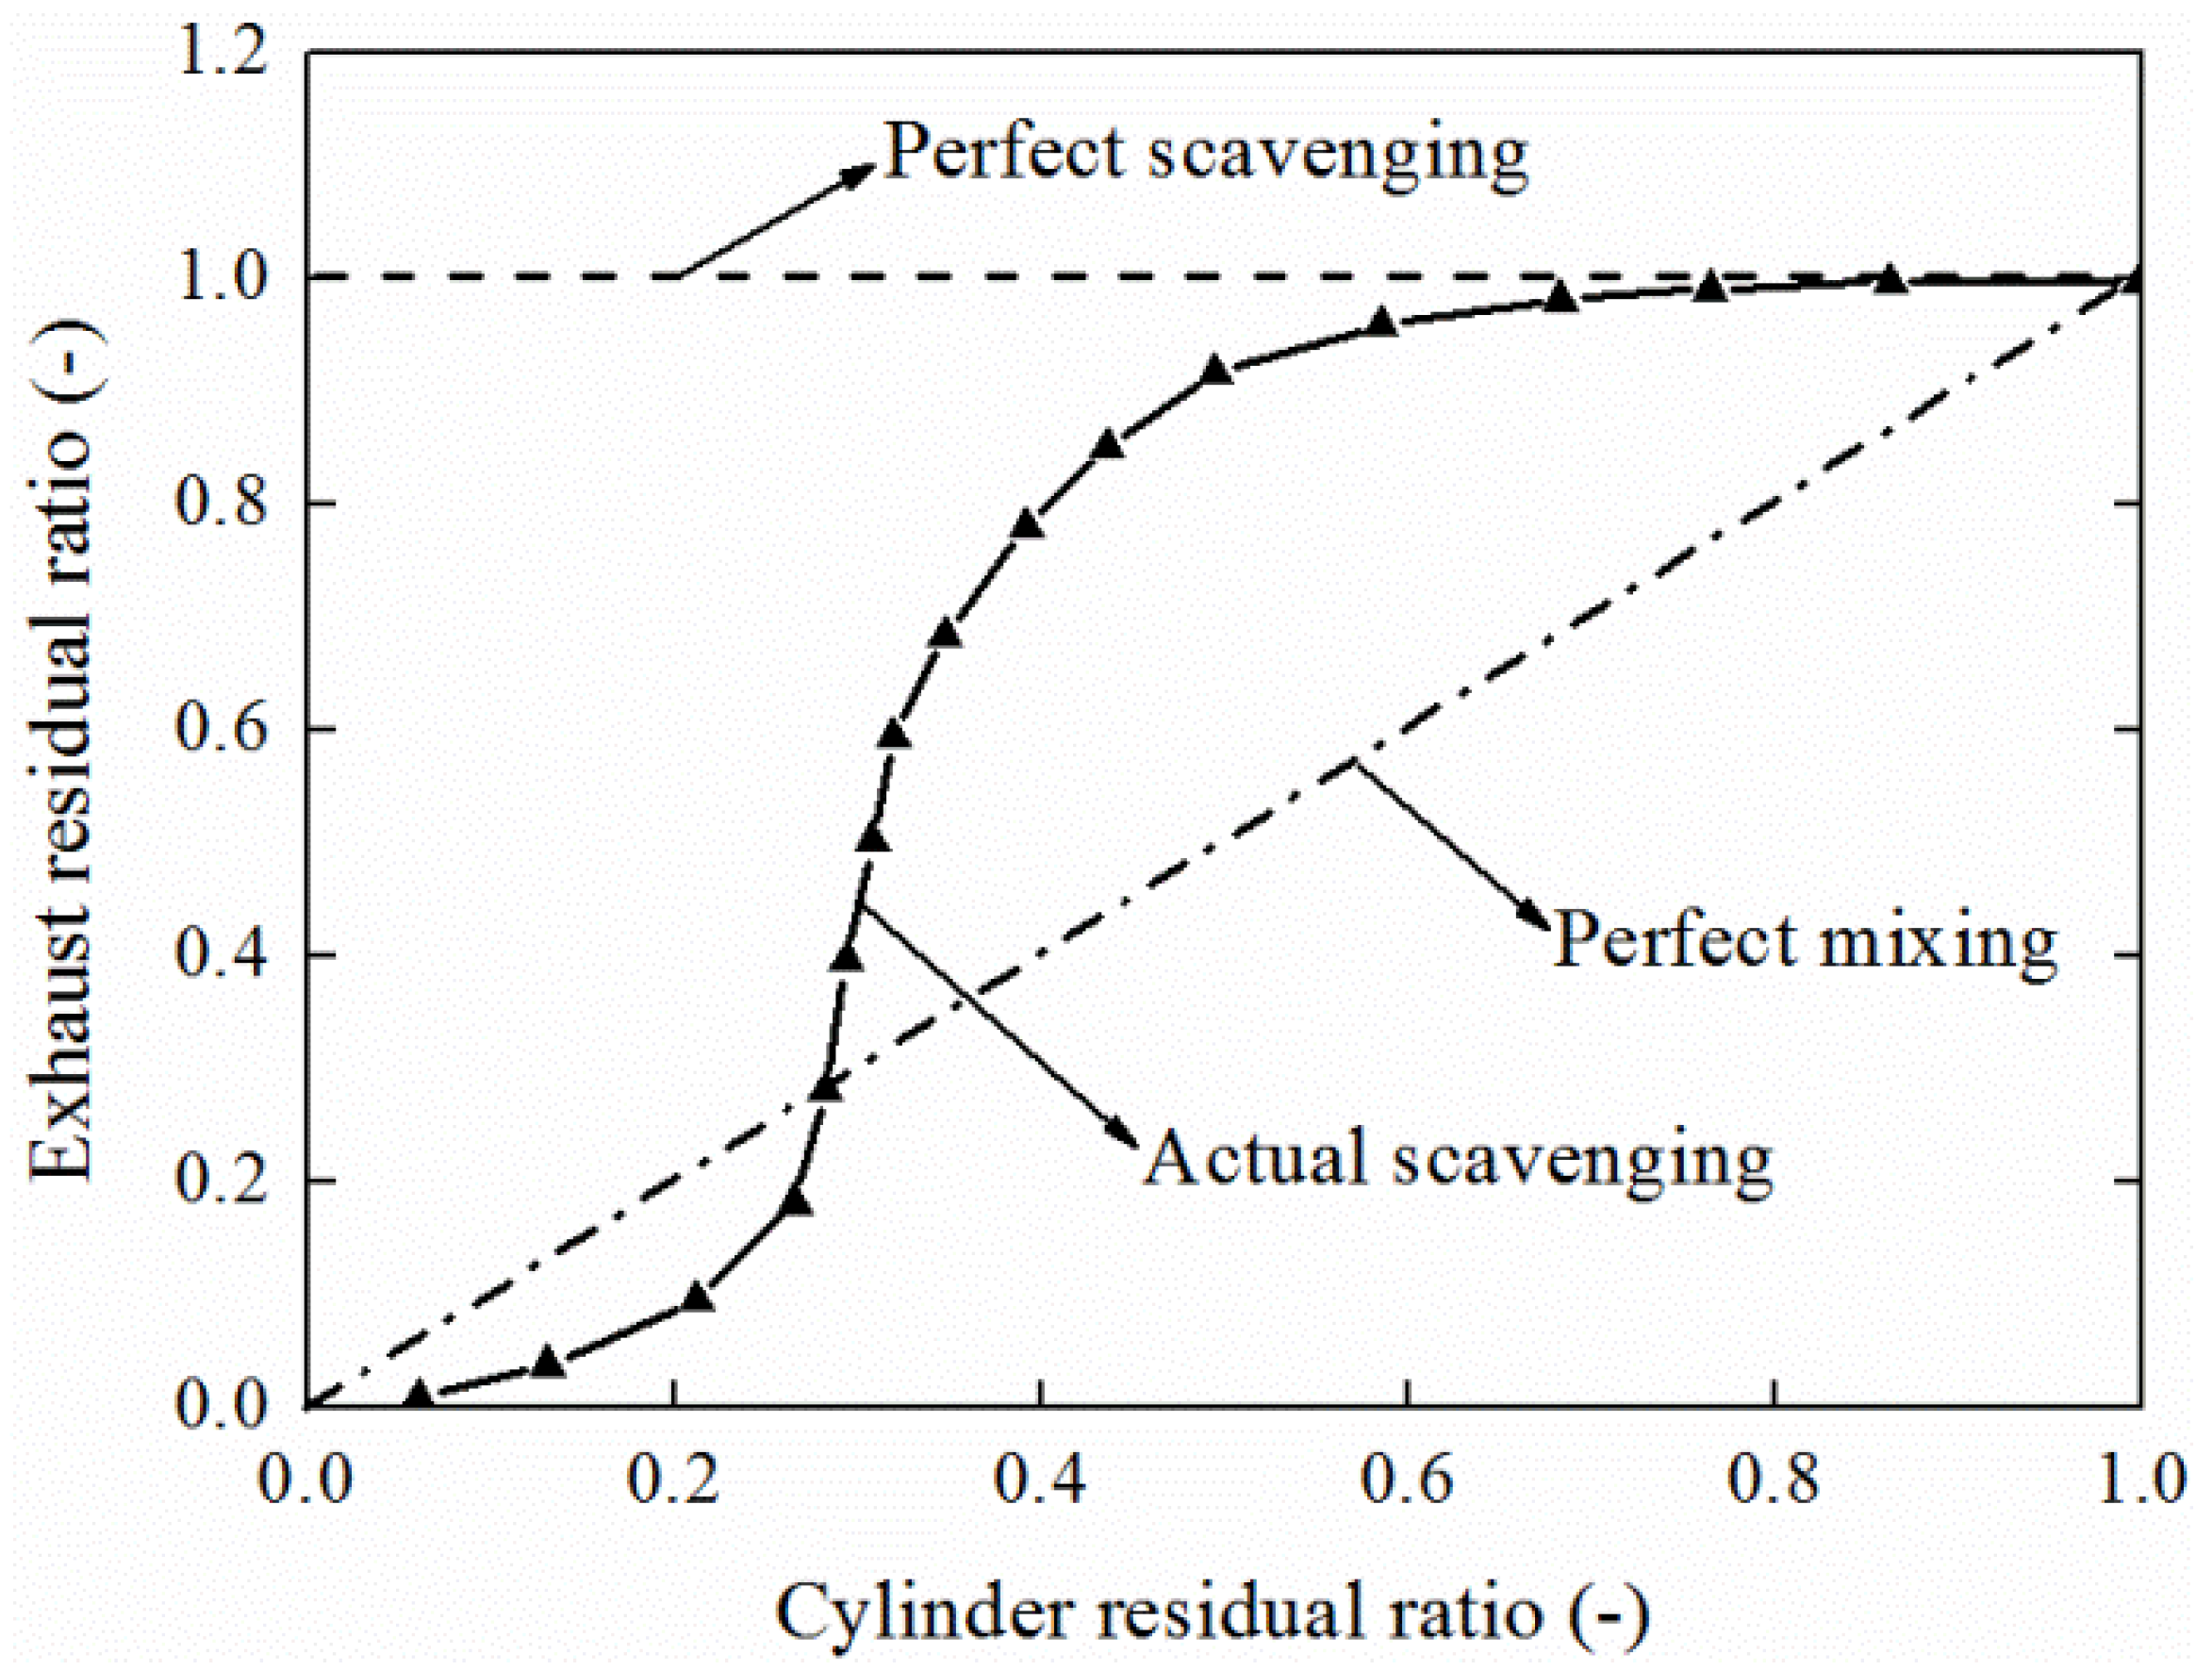
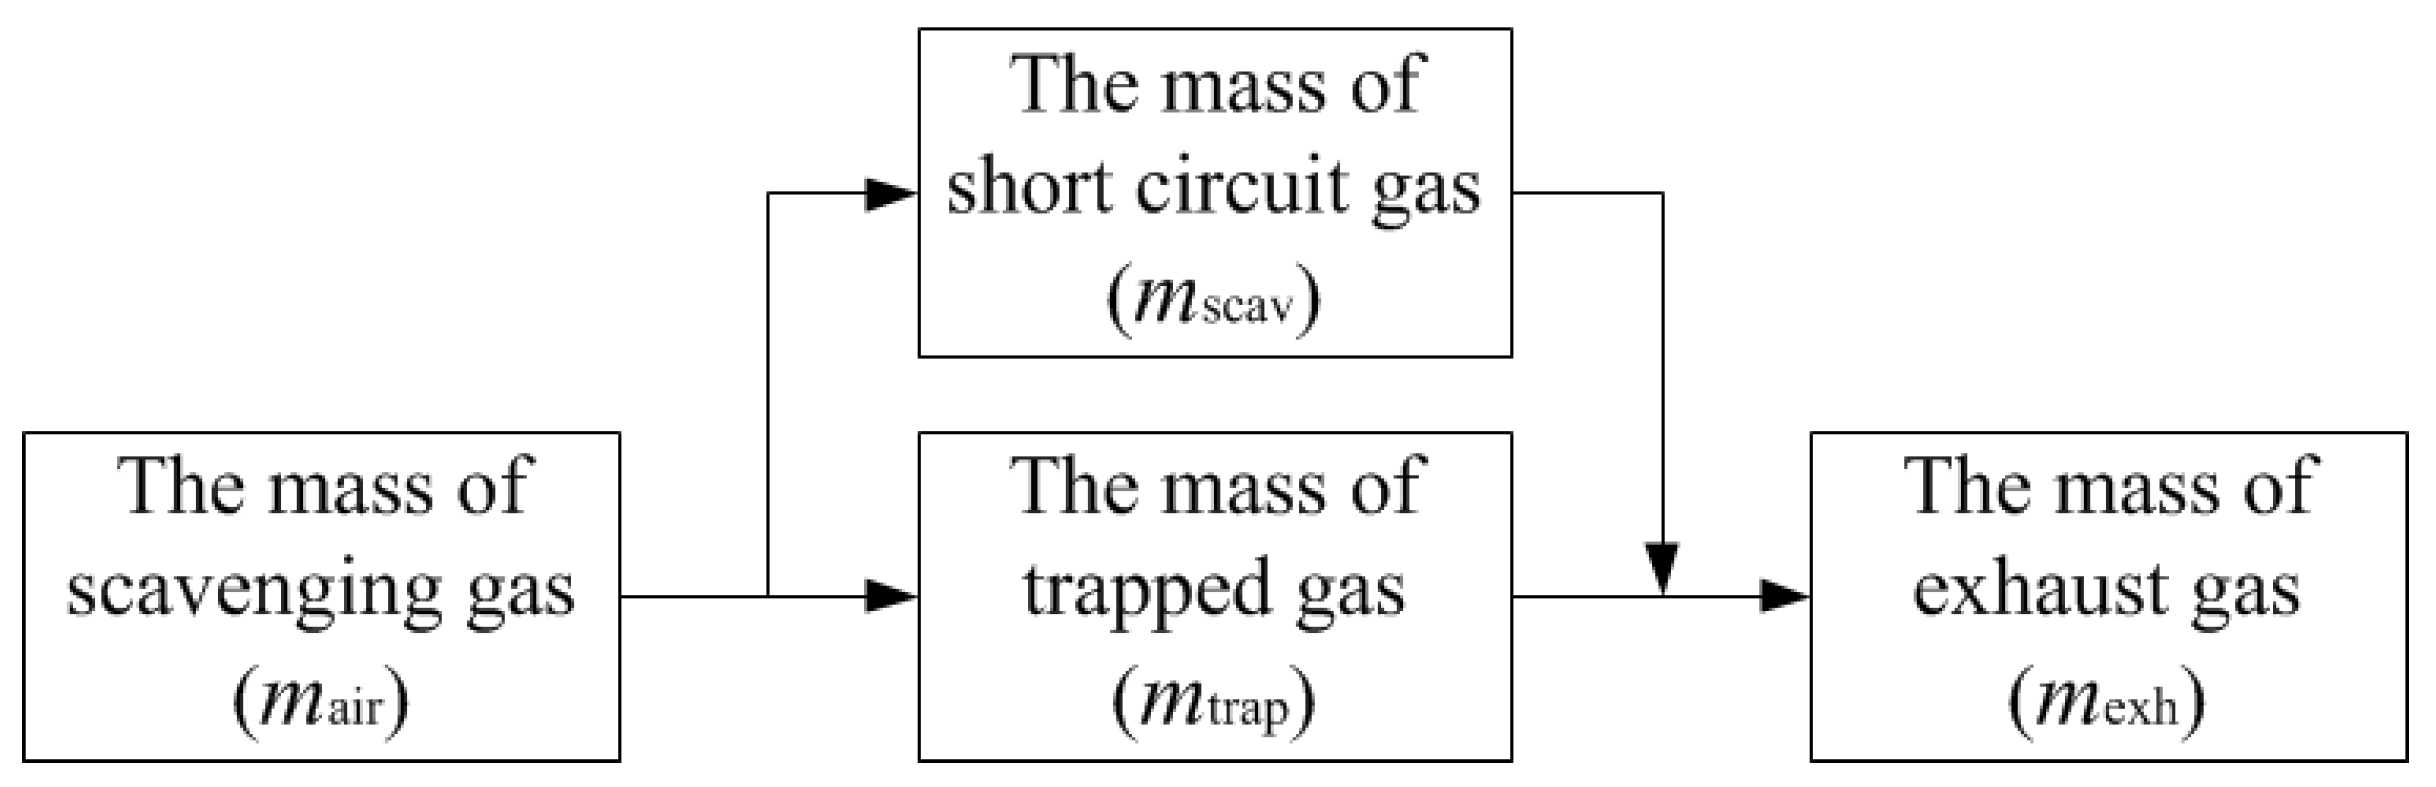
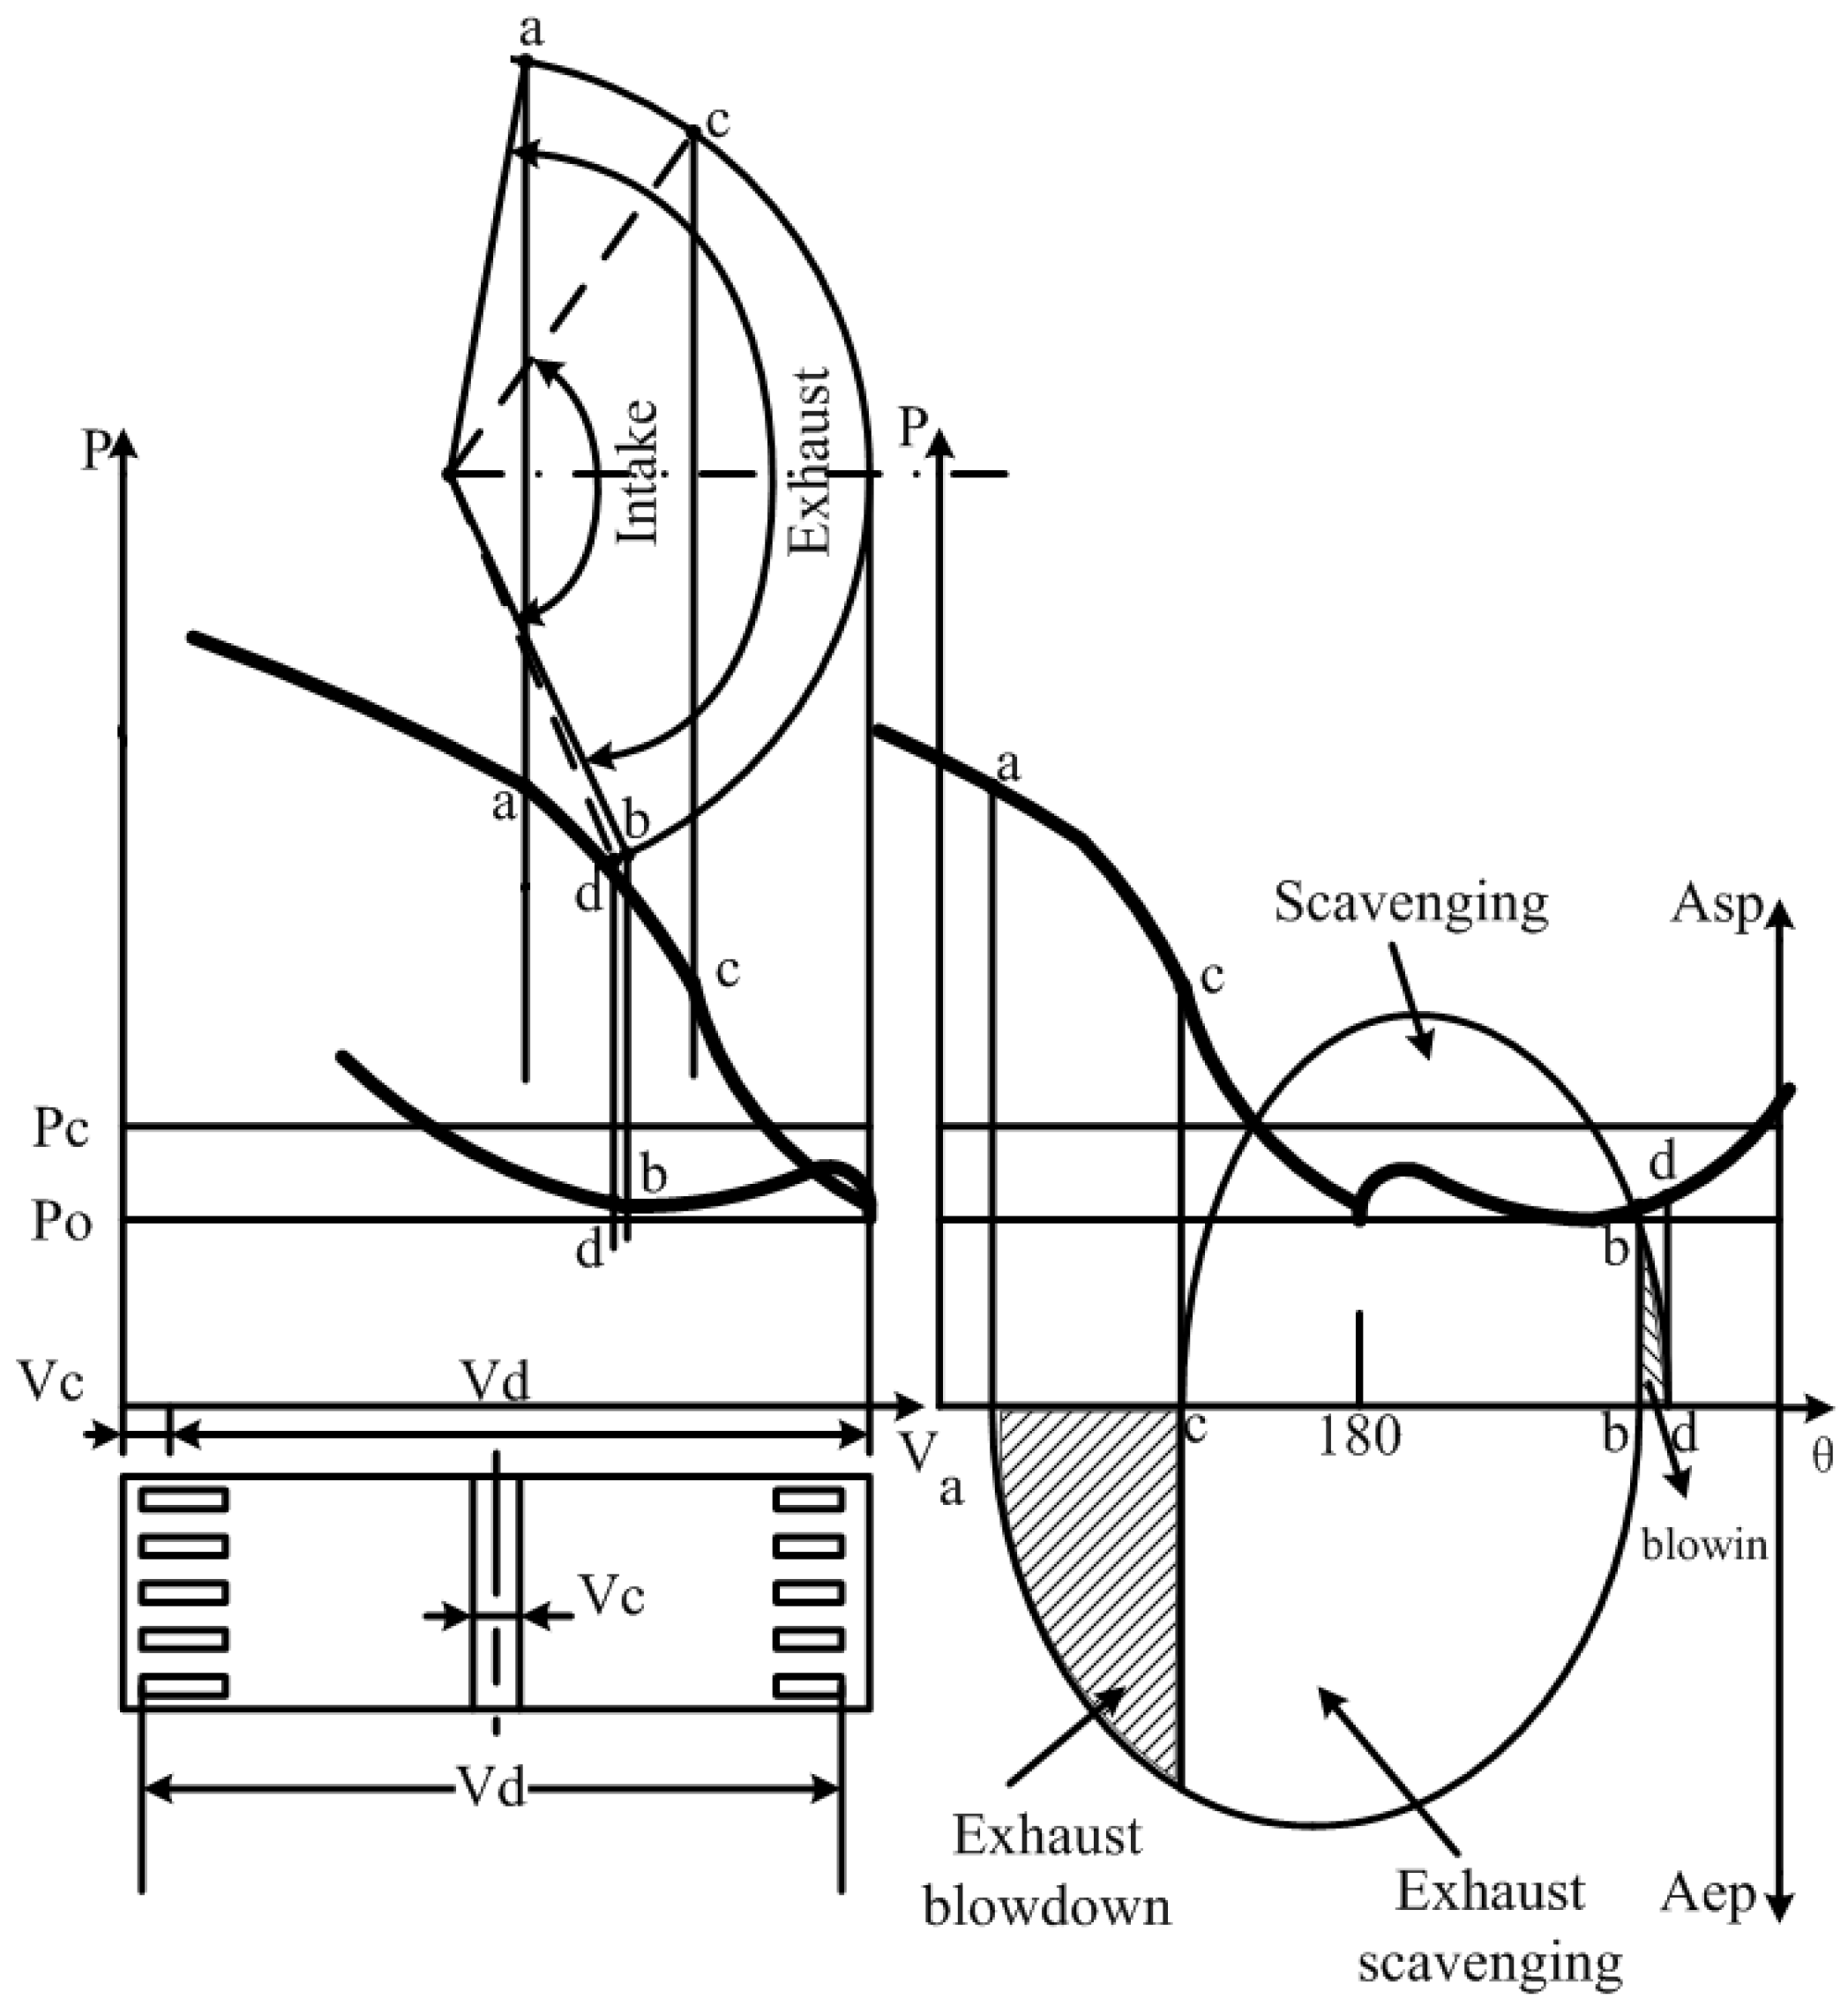
2.2. Scavenging Process Characterization

Figure 2 shows the principle of the uniflow scavenging process of the OPFC diesel engine gas exchange. The exhaust port open first before outer dead center (ODC) and a blow down discharge process commences. The discharge period up to the time of the scavenging port opening is called the free exhaust period. The intake port also opens before ODC when the cylinder pressure slightly exceeds the scavenging pressure. Because the burned gas flow is toward the exhaust port, which now has a large open area, the exhaust flow continues and little backflow occurs. When the cylinder pressure is less than the scavenging pressure fresh air enters the cylinder and the scavenging process starts. This flow continues as long as the intake port is open and the scavenging total pressure exceeds the pressure in the cylinder. As the pressure rises above the exhaust pressure, the fresh charge flowing into the cylinder displaces the burned gas: a part of the fresh air mixes with the burned gases and is expelled with them. The intake port closes after the exhaust port closes, and since the flow toward the intake port is continuous, additional fresh air is obtained. The additional air inflow period up to the time of intake port close is called the post intake period.
Delivery ratio, trapping efficiency and scavenging efficiency are usually employed as evaluation indexes in the two-stroke scavenging system:
The delivery ratio:
l 0 = mass   of   delivered   air   ( or   mixture )   per   cycle reference   mass
The reference mass is defined as displaced volume × ambient air (or mixture). Ambient air (or mixture) density is determined at atmospheric conditions or at intake conditions.
The trapping efficiency:
η t r = mass   of   delivered   air   ( or   mixture )   retained mass   of   delivered   air   ( or   mixture )  
The trapping efficiency indicates what fraction of the air (or mixture) supplied to the cylinder is retained in the cylinder.
The scavenging efficiency:
η s c = mass   of   delivered   air   ( or   mixture )   retained mass   of   trapped   cylinder   charge
The scavenging efficiency indicates to what extent the residual gases in the cylinder have been replaced with fresh air.
When the reference mass in the definition of delivery ratio is the trapped cylinder mass (or closely approximated by it) then:
η s c = l 0 η t r
For the perfect displacement model, trapping and scavenging efficiency vary with the delivery ratio as follows [31]:
η t r = 1 η s c = l 0 for l 0 1 η t r = 1 / l 0 η s c = 1 for l 0 > 1
For the perfect mixing model, trapping and scavenging efficiency vary with the delivery ratio as follows:
η t r = 1 l 0 ( 1 e l 0 ) η s c = 1 e l 0

3. Uniflow Scavenging System Modeling

3.1. Working Process 1D Model

Based on the hypothesis of one-dimensional isentropic flow, the fluid flow condition of free exhaust process can be written as a supercritical condition [31]:
d m s d φ = C v F s 6 n 2 g k ( k 1 ) R T p z ( 2 p z + 1 ) 1 k 1
The fluid flow condition of scavenging process can be written as a subcritical condition:
d m s d φ = C v F s 6 n 2 g k k 1 p s R T ( p z p s ) 2 k ( p z p s ) k + 1 k
where Cv is the intake or exhaust port flow coefficient, n is the engine speed, ps is the inlet pressure, pz is the outlet pressure. For the exhaust ports, ps is the in-cylinder pressure and pz is the exhaust chamber pressure; for the intake ports, ps is intake chamber pressure and pz is in-cylinder pressure. Fs is area of intake or exhaust port in different crank angle, g is gravitational acceleration, k is adiabatic exponent, R is gas constant, T is gas temperature.
The uniflow scavenging process is assumed to be complete in the three models: perfect displacement model, perfect mixing model and short circuit model. In practice, the scavenging process includes multiple scavenging models, giving a relation for scavenging efficiency:
η s c = { l 0 l 0 l 0 c 1 e i l 0 l 0 > l 0 c
where the term i is the scavenging model index, and l0c is the demarcation point between perfect scavenging and rich exhaust scavenging.
Section 3.3 shows the scavenging profile which was calculated by the three-dimensional (3D) CFD simulation as the input boundary conditions of 1D simulation scavenging model [30]. A simulation model based on GT-Power were established, Wiebe mode was used to describe the combustion process in the cylinder, and the Woschni mode was used to calculate the heat transfer in the cylinder [32]. The relationship between the residual gas coefficient in the exhaust and the residual gas coefficient in the cylinder is employed to describe the two-stroke scavenging process.

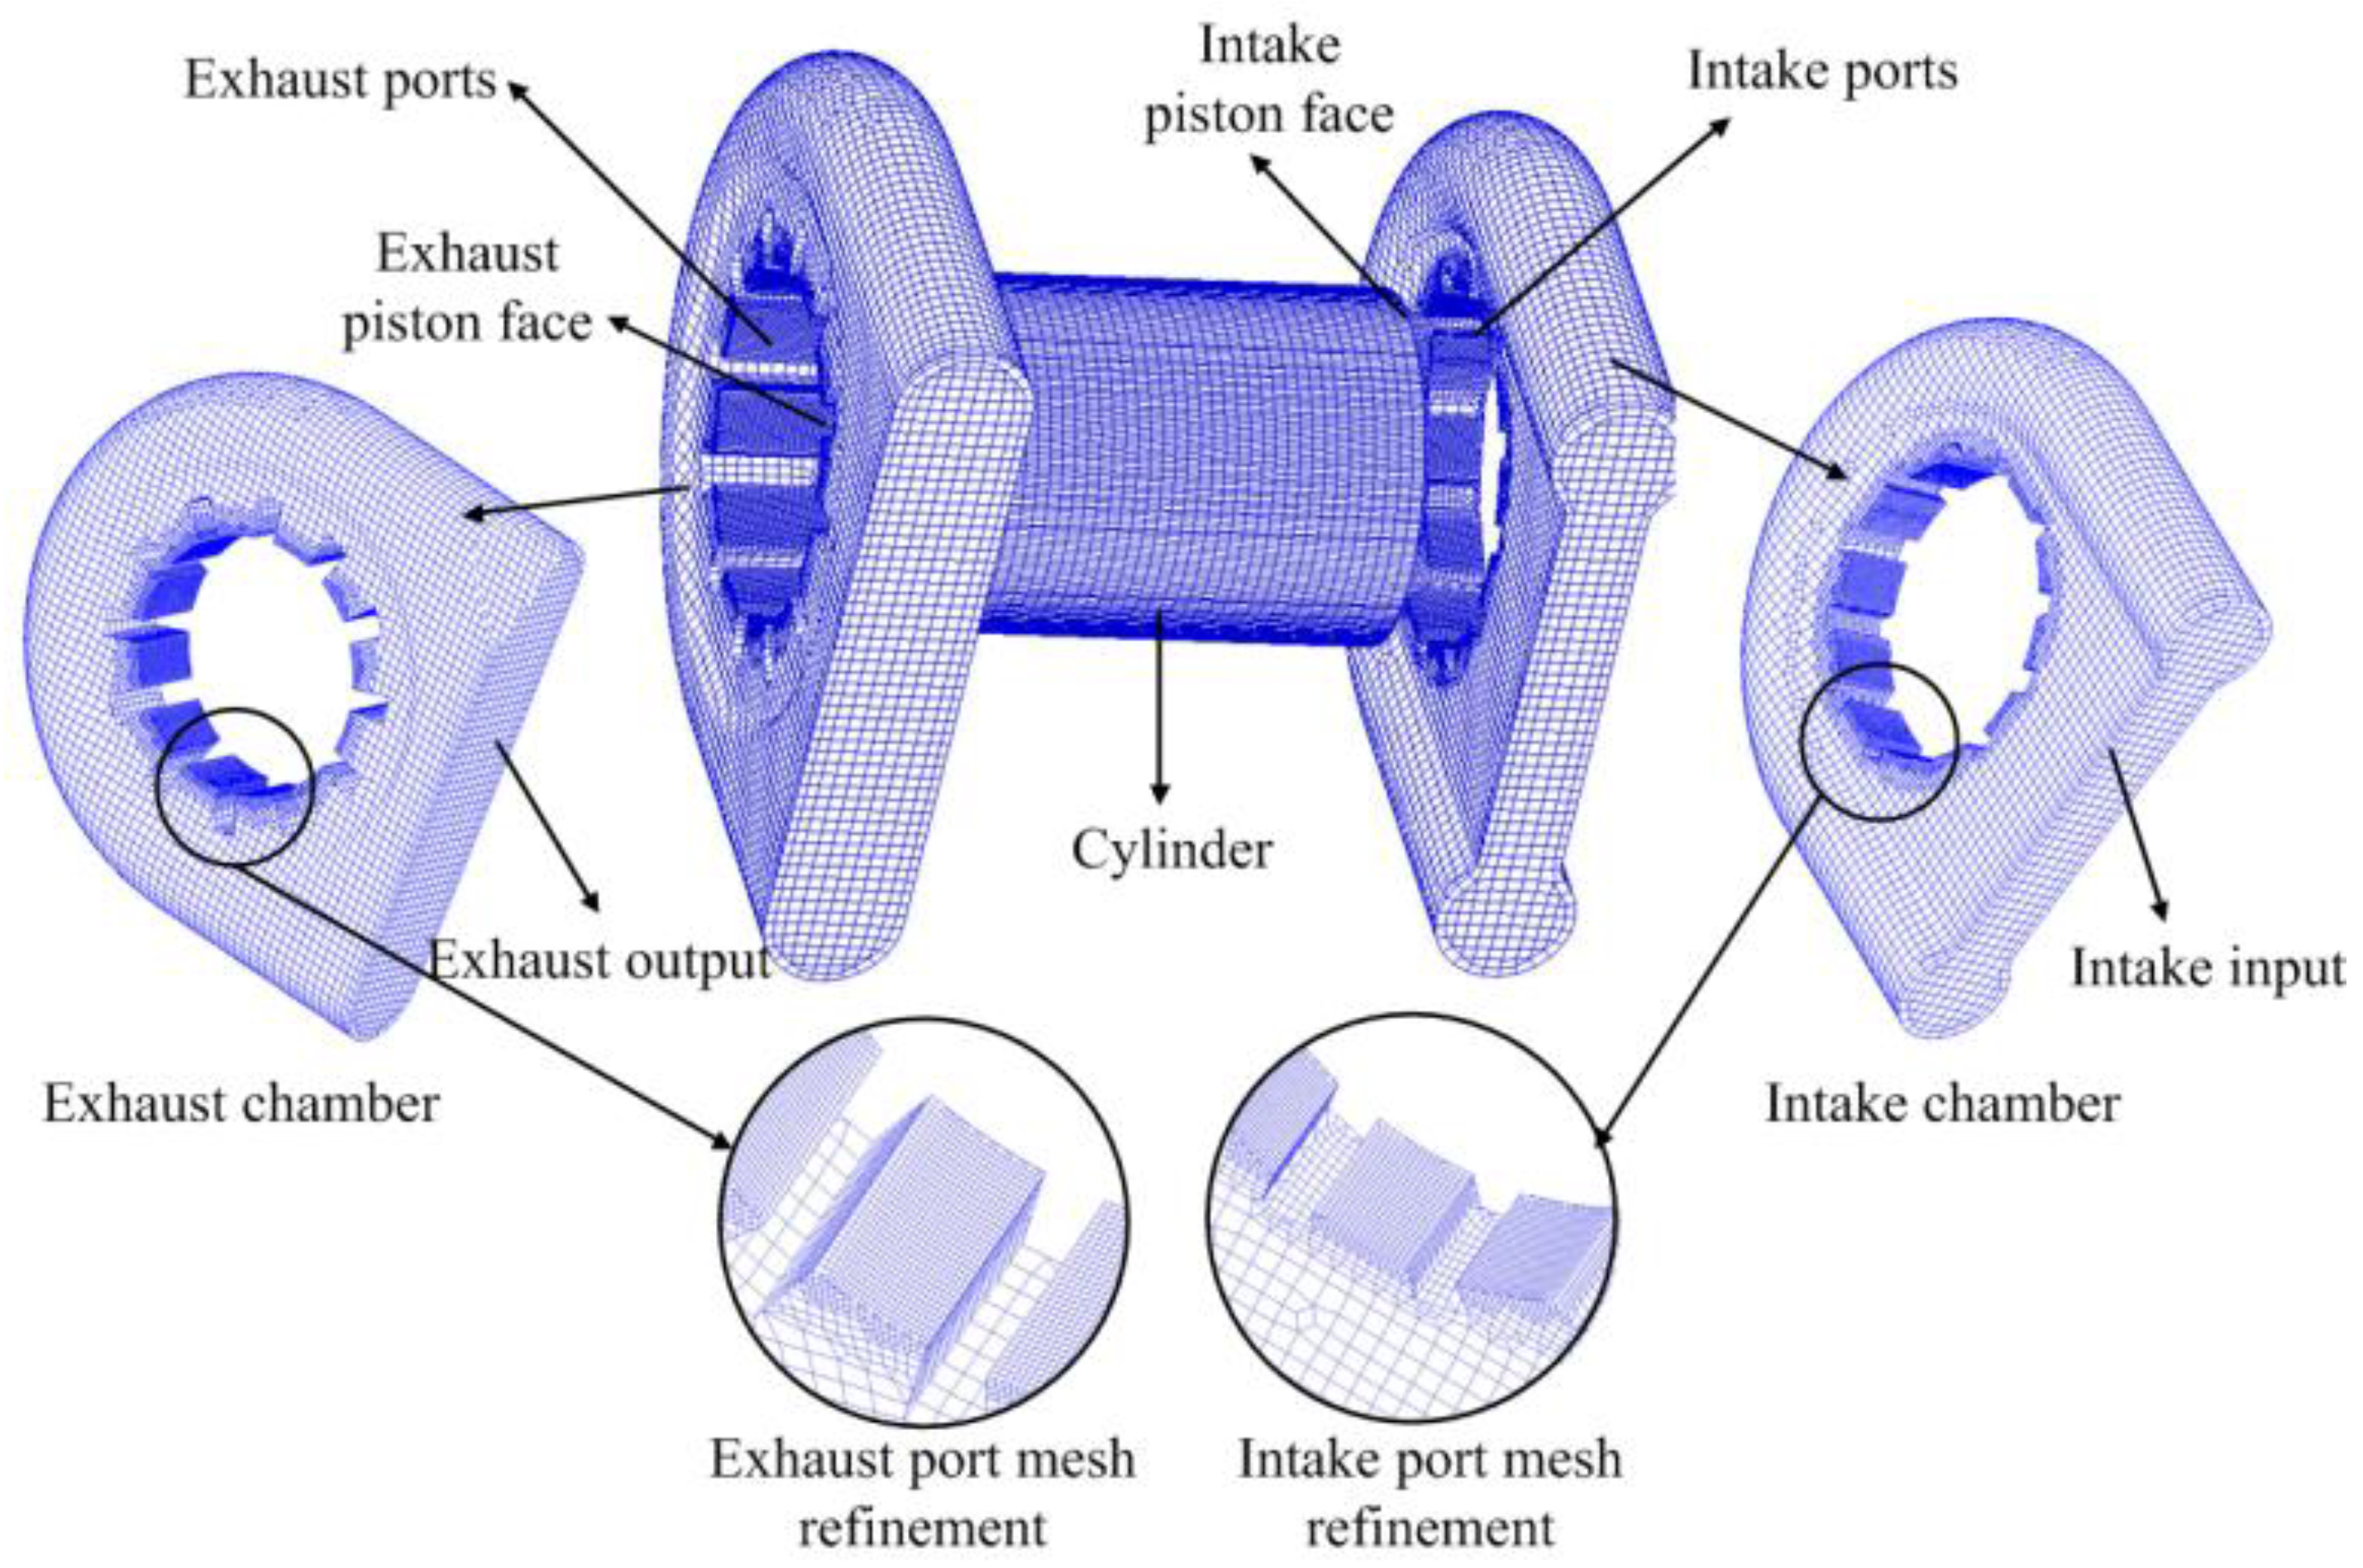
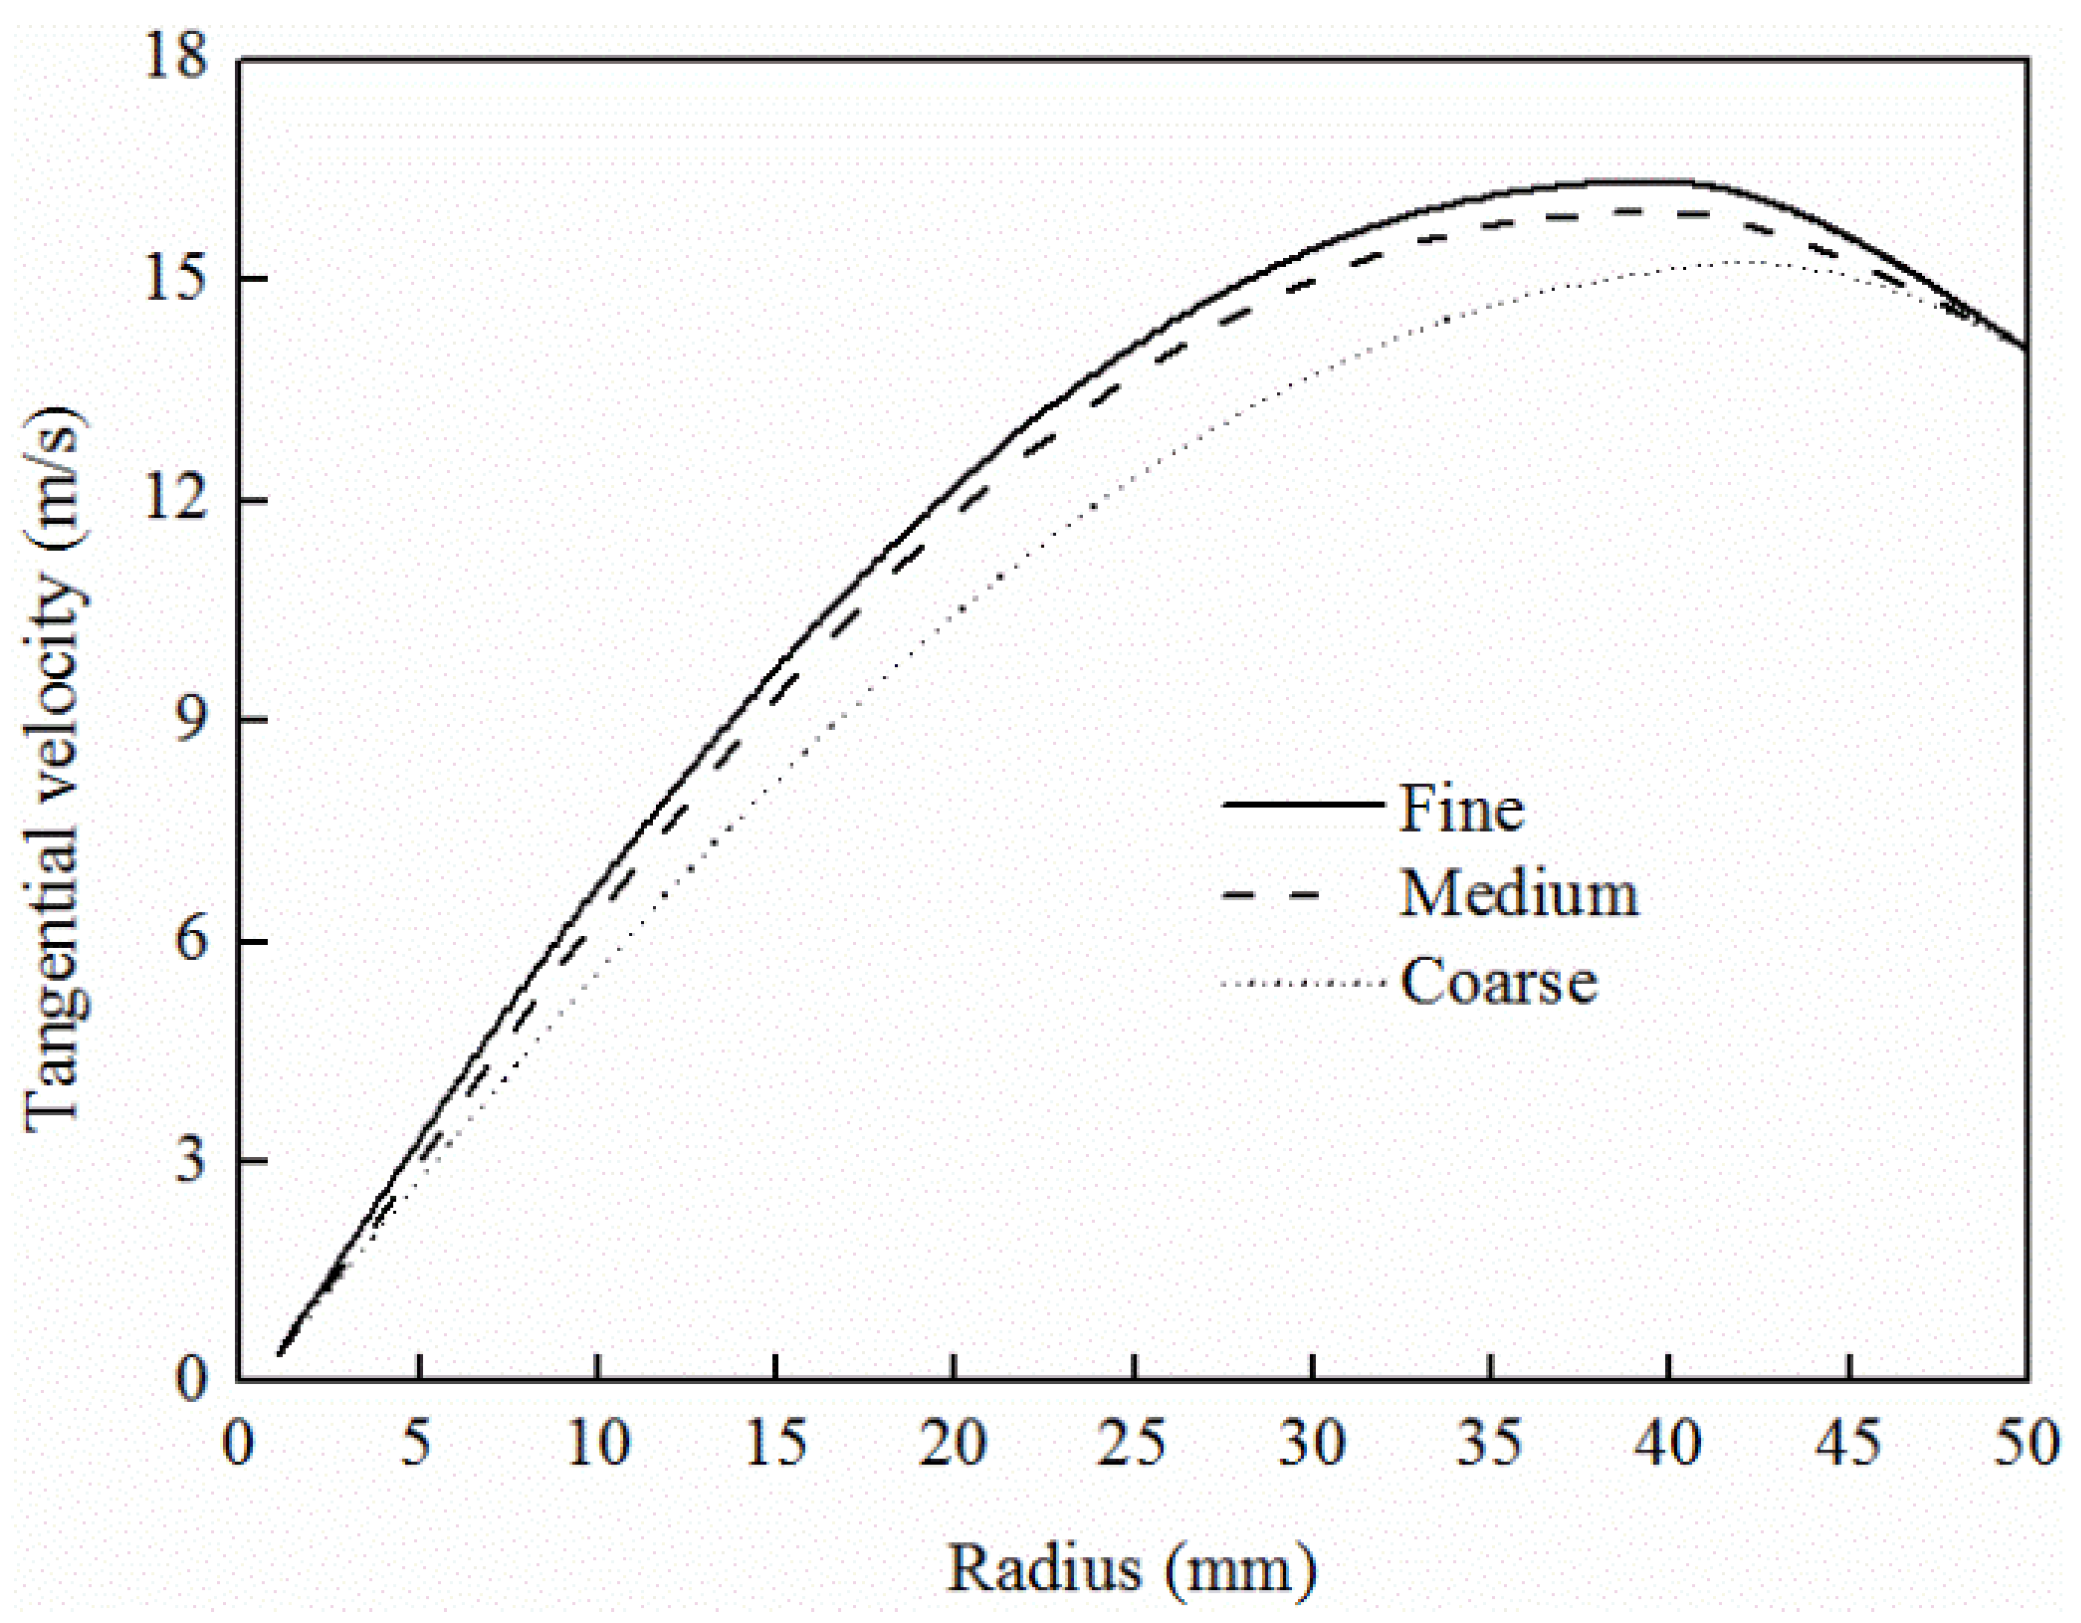
3.2. Scavenging Process 3D CFD Model

AVL-Fire software is used to build the CFD model in the working process simulation [33]. Fame Engine plus is used to generate the moving meshes of the cylinder by defining movement selection, buffer selection, interpolation selection and the relative motion rule of the opposed-piston. The intake and exhaust chamber are generated as non-moving meshes which is refined near the intake and exhaust ports, in order to capture the significant flow gradients accurately, as shown in Figure 3. The full-scale three-dimensional CFD model consists of 472,895 cells for the scavenging process and 76,419 cells for the compression process after rezoning. The dynamic mesh of piston motion in the intake and exhaust stroke has been treated according to the realistic motion rules of opposed pistons. The scavenging calculation is from exhaust port opening (EPO) to intake ports closing (IPC), while the in-cylinder working process is from IPC to EPO. Mesh movement includes three parts: intake and exhaust piston and cylinder to simulate the gas motion during the entire working process model which was used in the calculation of turbulence.
The boundary conditions were chosen to reflect the physical conditions in the validation model and the prototype engine. Because the pressure at the intake ports fluctuates, the intake pressure is obtained by an experimental method. Two hundred cycles of intake pressure measurement are carried out. For each cycle point, the average value is calculated and the result is shown as Figure 4. The k-epsilon-xi-f model is employed to capture turbulence [34]. The k-epsilon-xi-f model can simulate the intake vortex and flow separation with higher accuracy. With the k-epsilon-xi-f model, the scavenging process with high pressure drop is calculated. The time step for the calculation is set at about 0.5°. A constant pressure boundary condition is used for exhaust ports and a mean exhaust receiver pressure of 1 bar is taken. Frictional effects at the walls are not taken into account, i.e., the smooth wall option for turbulent flow boundary condition is used. The initial conditions in cylinder are extracted from the GT-Power software simulation for every case. The flow field is initialized by specifying the temperature, pressure and turbulence intensity. By performance prediction, the initial pressure and temperature in the cylinder are computed in a scheme of 80 kW at an engine speed of 2400 rpm, which are the initial conditions for CFD. Initial temperatures of cylinder, intake chamber and exhaust chamber are given a value of 788 K, 322 K, and 634 K, respectively.
In order to investigate mesh independence, two additional meshes are tested. One with approximately 150,000 cells denoted “coarse” and one with approximately 237,000 cells denoted “medium”. The reference mesh of 304,000 cells is referred to as “fine” [35]. The intake port radial angle (obliquity angle) was the between of flow direction and radius direction, which could be used to form swirl. For uniflow scavenging system, the intake swirl can increase scavenging flow velocity and improve scavenging process. Because of the intake port radial angle, in-cylinder flow was swirl mainly in scavenging process. The tangential velocity was selected for comparison. The effect of mesh resolution is presented by comparing radial profiles of tangential velocity as shown in Figure 5. The profiles are sampled the cross section of cylinder center when the opposed piston is at the ODC. The comparison shows that the velocity profiles are in good agreement, the maximum error is 3.3% and the medium mesh can be the considered mesh.

3.3. Scavenging Profile

Figure 6 shows the real scavenging process from the CFD simulation. The red color represents the burned gas while the blue color represents the fresh air. The numbers from 0 to 1 for the color legend represents the percentage of burned gas. Before 120 °CA, the scavenging ports are sealed by the piston. The cylinder and exhaust chamber are filled with burned gas and the intake chamber is full of fresh charge. With the separation of two pistons, the intake port opens, and the fresh charge begins to flow into cylinder. The portion of fresh charge increases until 160 °CA and, meanwhile, fresh charge and burned gas mix at the contact regions. At 170 °CA, a mixture of fresh charge and burned gas exists in exhaust chamber. The burned gas still accounts for a great proportion in the exhaust chamber and this also means that short circuiting happens. From 180 °CA to 250 °CA, the fresh charge constantly replaces the burned gas in the cylinder and exhaust chamber. When the two pistons seal the scavenging ports once again, almost all the burned gas is displaced by fresh charge. We can observe the variation of burned gas and fresh charge in cylinder from Figure 6.
Since the scavenging process of two stroke engines occurs in a very short time, it is hard to know the proportion of fresh air and burned gas in-cylinder during one cycle under experimental conditions. We assume the fresh air is comprised of oxygen and nitrogen and the fuel in cylinder is burned to carbon dioxide and water. Under full load conditions, through tracking the variation of oxygen and nitrogen, the in-cylinder residual ratio and exhaust chamber residual ratio are calculated.
Before exhaust port opening, the in-cylinder burnt gas is defined as a gas mixture which is made up of H2O, CO2 and N2. As shown in Figure 7a, the ratio of in-cylinder burnt gas composition remains unchanged during the free exhaust phase. During the early stages of the scavenging process, the composition of H2O and CO2 decreases but the composition of O2 is increased. Because the proportion of N2 in the fresh charge is greater than in in the burnt gas, the N2 composition is increased slightly. During the middle and later stages of the scavenging process, the in-cylinder N2 and O2 compositions remain unchanged because the CO2 and H2O are completely expelled from the cylinder. As shown in Figure 7b, the ratio of gas compositions in the exhaust chamber has the same change trend as the in-cylinder gas compositions. The primary difference is that the variation of gas compositions in the exhaust chamber lags behind that of the gas compositions in the cylinder by 40 °CA. When the ratio of gas compositions in exhaust chamber is changed, the fresh charge is short-circuited in the scavenging process.
Through the abovementioned analysis, the state parameter of scavenging process can be obtained by calculating the change of fresh charge (O2 and N2). The residual gas coefficient in the cylinder is described by the O2 and N2 in the cylinder as follows:
η R , c y l = 1 O 2 , c y l % + 76.8 % 23.2 % O 2 , c y l % O 2 , c y l % + N 2 , c y l % + CO 2 , c y l % + H 2 O c y l %
where O2,cyl%, N2,cyl%, CO2,cyl% and H2Ocyl% are the instantaneous mass percentages of O2, N2, CO2 and H2O in the cylinder.
The residual gas coefficient in exhaust is described by the O2 and N2 in the exhaust as follows:
η R , e x h = 1 O 2 , e x h % + 76.8 % 23.2 % O 2 , e x h % O 2 , e x h % + N 2 , e x h % + CO 2 , e x h % + H 2 O e x h %
where O2,exh%, N2,exh%, CO2,exh% and H2Oexh% are the instantaneous mass percentages of O2, N2, CO2 and H2O in the exhaust.
As shown in Figure 8, the profile should be analyzed from 1.0 to zero. Before the intake port opens, no fresh charge passes into the cylinder. Both the cylinder residual ratio and exhaust chamber residual ratio remain at 1. With the outward movement of the pistons, the intake and exhaust ports are unsealed and a fresh charge flows into the cylinder. The burned gas is constantly replaced by fresh charge. When the cylinder residual ratio is 0.35, the synthetic scavenging profile begins to decline obviously. Through the whole process, the OPFC diesel engine scavenging profile remains above the perfect mixing curve which means the scavenging process of OPFC diesel engine is satisfactory. This profile will be used as the boundary condition of the 1D simulation to calculate the OPFC diesel engine scavenging efficiency and trapping efficiency.

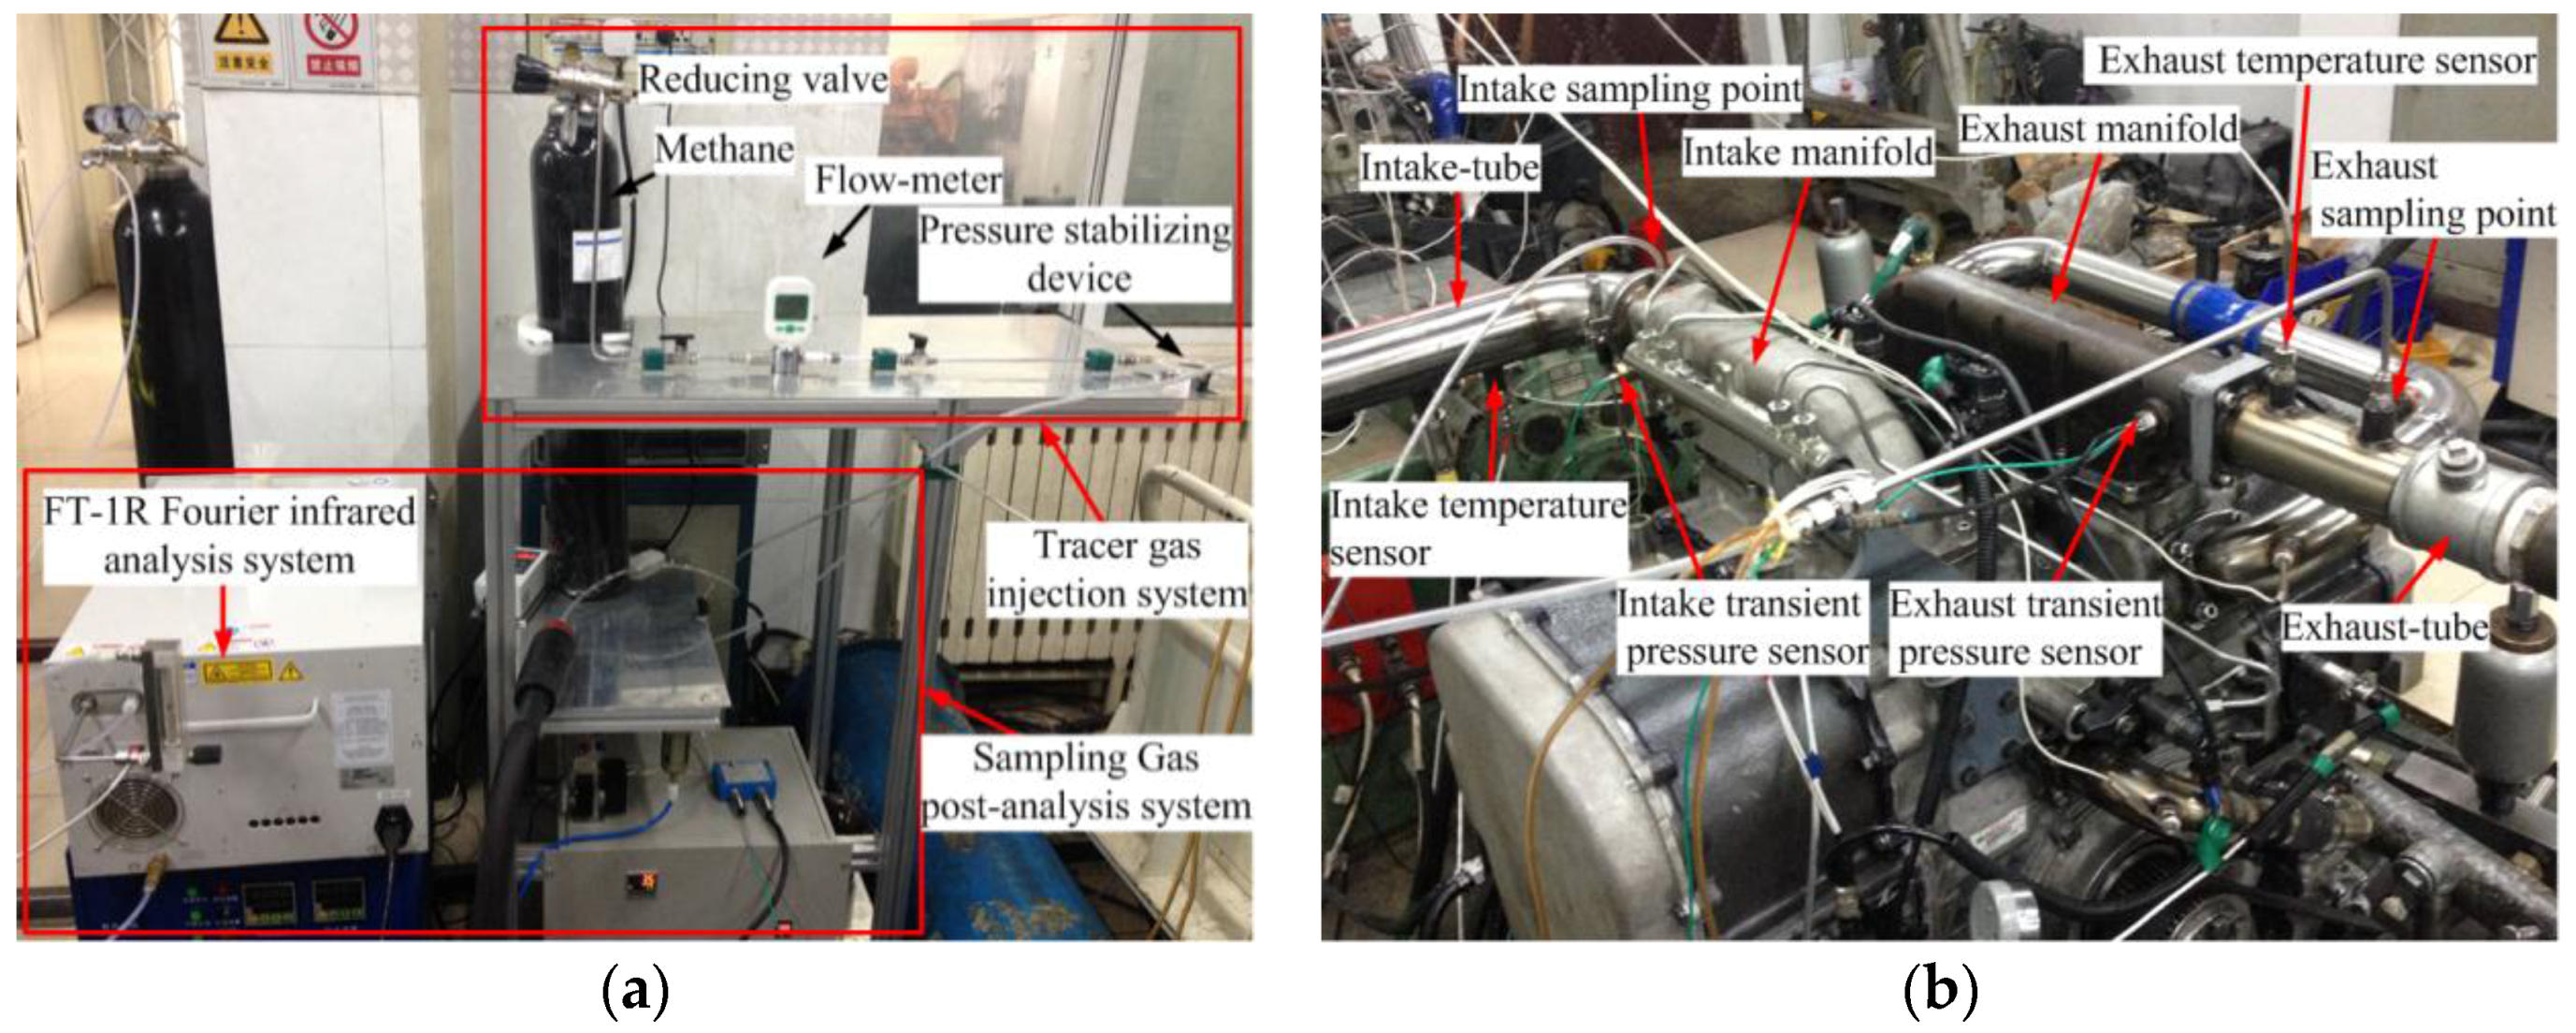
4. Experimental Investigations

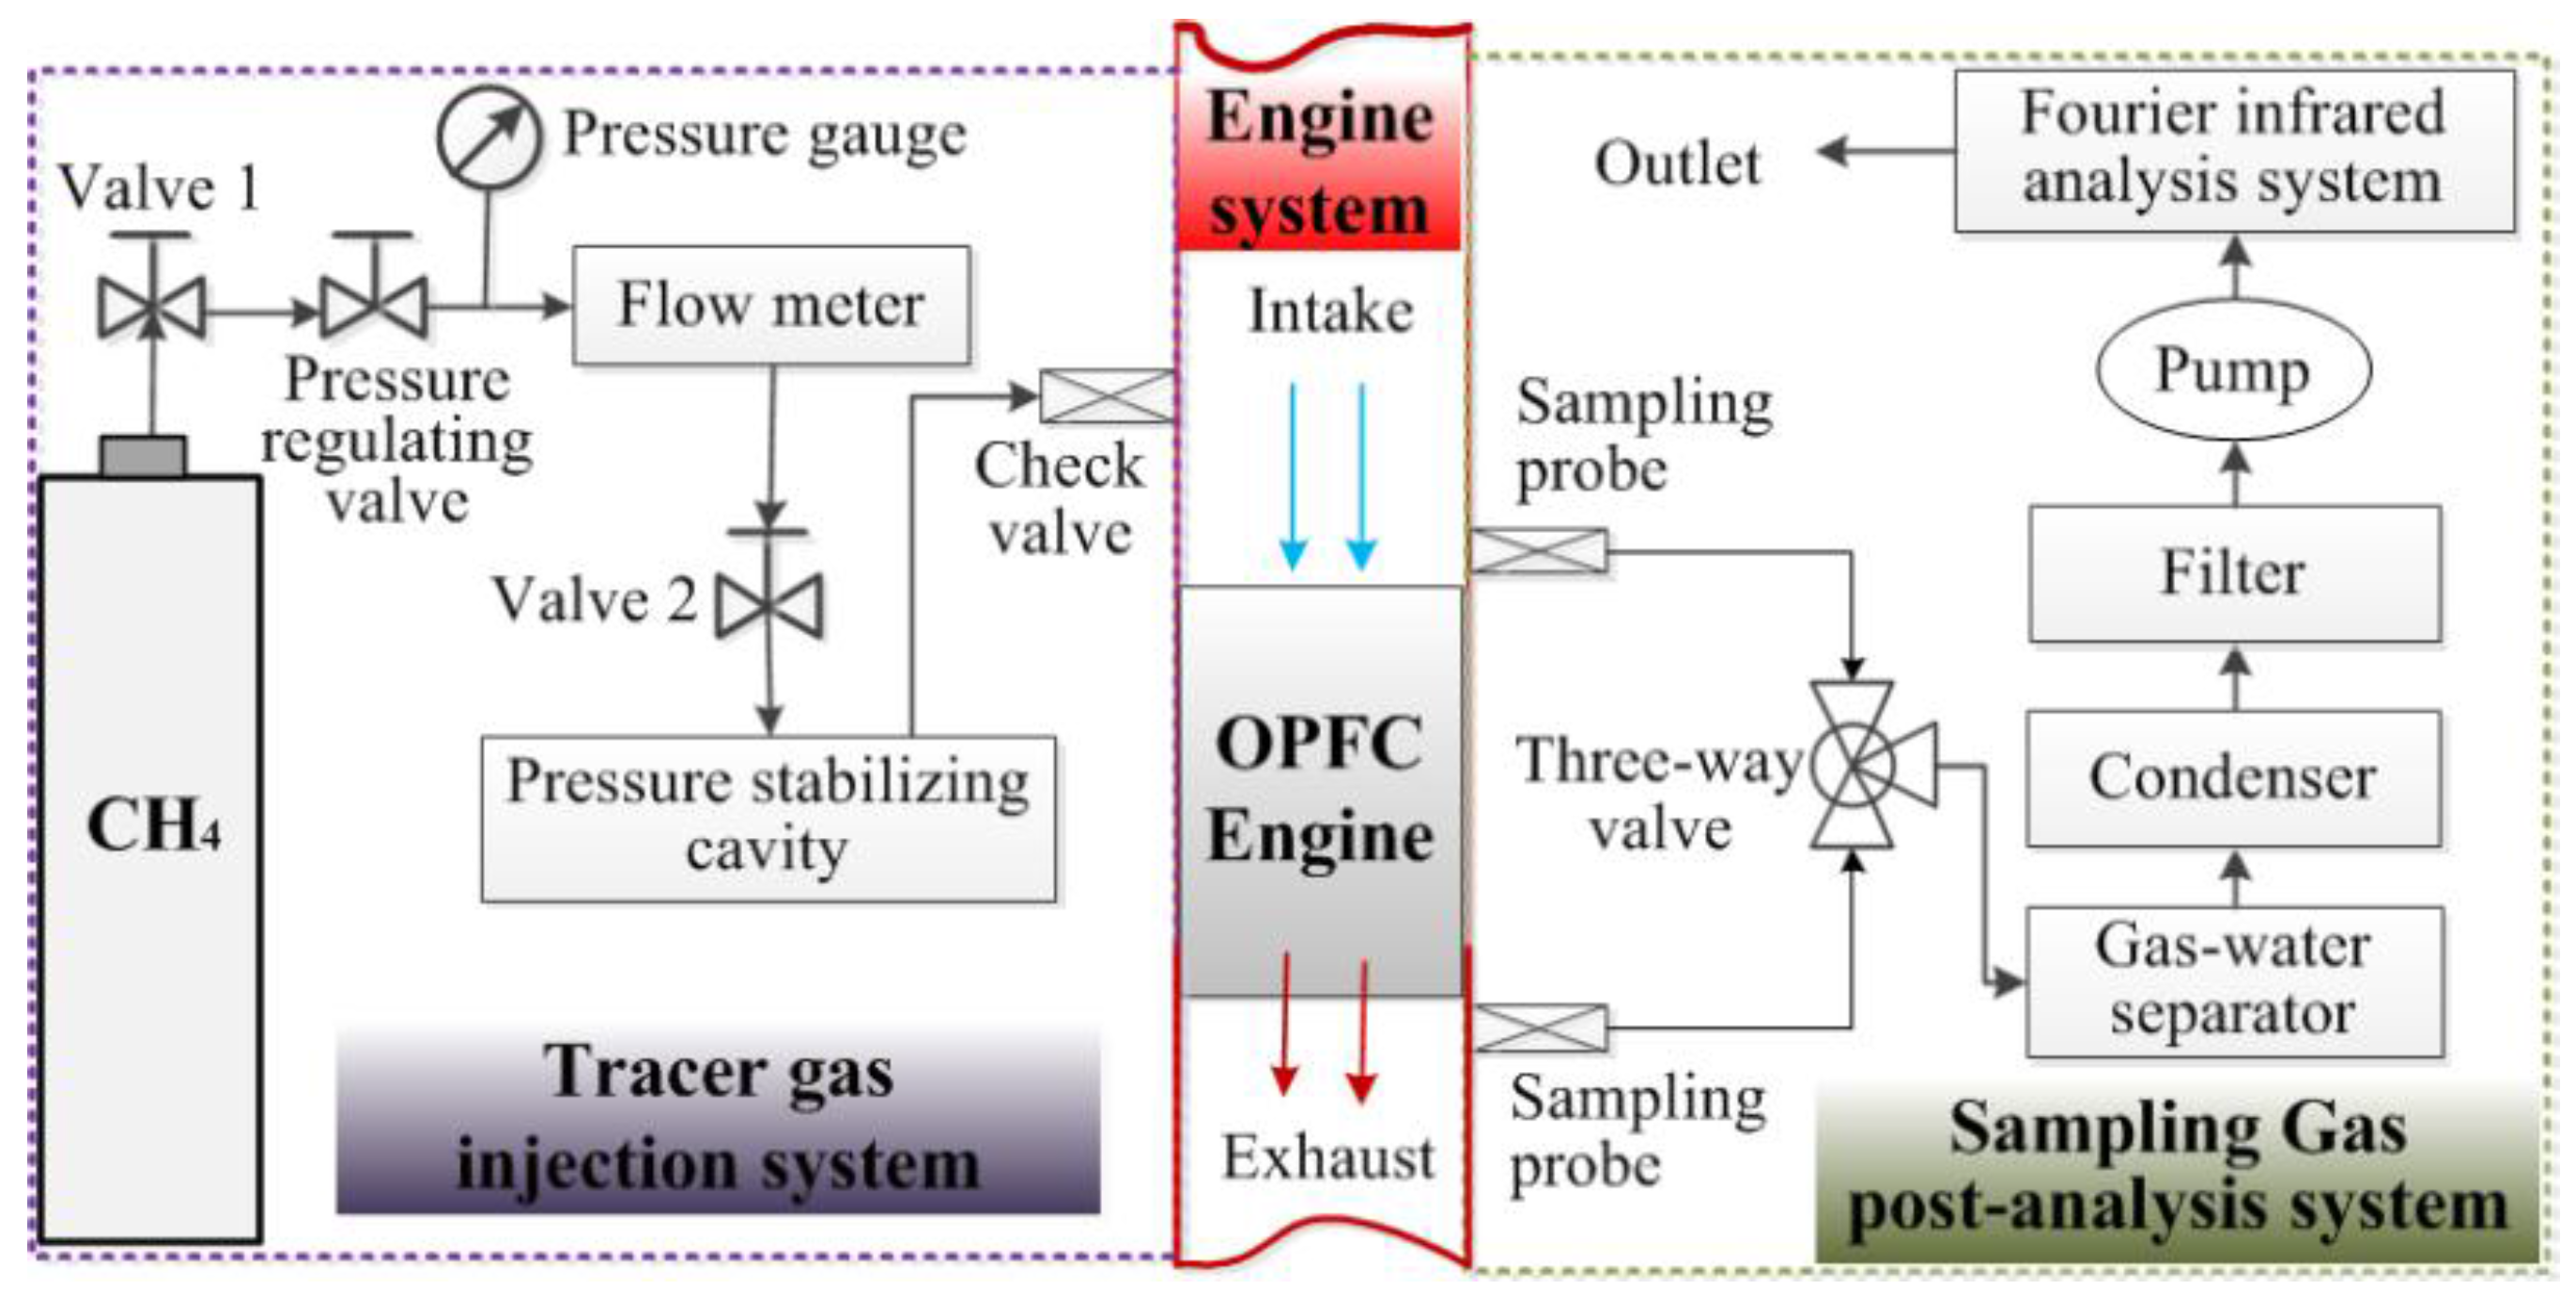
4.1. Tracer Gas Method

The TGM was selected as the simplest method to implemented to measure the scavenging performance of a running diesel engine. As described in the [36], the engine may be idealized as a steady flow system. This method is based on the use of small quantities of a gas which are assumed to burn completely in the combustion temperature but not to burn at temperatures below those prevailing in the cylinder when the exhaust ports open. Figure 9 shows the scavenging efficiency test schematic using the tracer gas method. It consists of three parts: tracer gas injection system, tracer gas sampling and analysis system and OPFC principle prototype.
As shown in Figure 10a, in the tracer gas injection system, the tracer gas (methane) is injected into the intake manifold for homogeneous mixing. The experiment utilizes a reducing valve, flow-meter and pressure stabilizing device for monitoring and controlling the gas flow. The methane injection point is located at the entrance of the compressor. After the methane is injected, it is mixed with high speed intake air. As shown in Figure 10b, the distance between the inlet collecting point and injection point is approximately 4.2 m. Thus, it can be concluded that homogeneous mixing between tracer gas and intake air is complete and the exhaust collection is about 0.8 m apart from the intake. The effect of intake collection point position on the inlet molar fraction is mainly embodied in the degree of mixing of methane and intake, while the exhaust collection position influence on the exhaust molar fraction is mainly reflected in the consumption and combustion of tracer gas caused by the discharge temperature. In particular, the exhaust temperature effect is negligible as the exhaust temperature is lower during the OPFC diesel engine underload performance. After filtration and cooling, gas samples can be delivered to a Fourier infrared analysis system by an air pump for on-line real time analysis.

4.2. Scavenging Process Parameters

According to Equation (1), the delivery ratio can be calculated by Equation (12):
l 0 = G S G R = G S / t _ c y c l e V h ρ s N c y l n = g s V h ρ s N c y l n
where l0 is the delivery ratio, GS is the mass of delivered air (or mixture) per cycle, GR is the reference mass, t_cycle is the time per cycle, Vh is the displacement per cylinder, ρs is the intake density, Ncyl is the engine cylinder number, n is the engine speed, and gs is the intake flow rate.
Intake density can be calculated by Equation (13):
ρ s = p s M R T s
where ps is the intake pressure, M is the molar mass, R is the molar gas constant, Ts is the intake temperature. As shown in Figure 11, Equations (14) and (15) can be derived.
m air = m trap + m scav
m air W tracer , air = m trap , tracer + m scav W tracer , scav
where mair is the mass of scavenging gas, mtrap is the mass of trapped gas, mscav is the mass of the short circuit gas, Wtracer,air is the mass fraction of tracer gas in the total scavenging air, mtrap,tracer is the mass of tracer gas in the total scavenging air, Wtracer,scav is the mass fraction of tracer gas that is circulated.
The tracer gas mass that is circulated equals the tracer gas mass in the exhaust gas, so Equation (16) can be derived from Equation (15):
m trap , tracer = m air W tracer , air m exh W tracer , exh
where Wtracer,air is the mass fraction of tracer gas that is circulated, mexh is the mass of tracer gas in the exhaust gas, Wtracer,exh is the mass fraction of tracer gas in the exhaust gas.
According to the definition of trapping efficiency, Equation (17) can be derived:
η t r = G 0 G S = m trap , tracer m air W tracer , air = 1 m exh W tracer , exh m air W tracer , air = 1 m exh m tracer , exh m exh m air m tracer , air m air = 1 ( m air + m fuel m air ) ( M tracer , exh n tracer , exh M exh n exh M tracer , air n tracer , air M air n air ) = 1 ( 1 + ( F / A ) o v ) ( Χ t , e M tracer , exh M exh Χ t , i M tracer , air M air )
where ηtr is the trapping efficiency, G0 is the mass of delivered (or mixture) air retained, mtracer,exh is the mass of tracer gas in the exhaust gas, mfuel is the mass of fuel, Mtracer,exh is the molar mass of tracer gas in the exhaust gas, ntracer,exh is the molarity of tracer gas in the exhaust gas, Mexh is the molar mass of exhaust air, nexh is the molarity of exhaust gas, Mtracer,air is the molar mass of tracer gas in the total scavenging air, ntracer,air is the molarity of tracer gas in the total scavenging air, Mair is the molar mass of the intake air, nair is the molarity of the intake air, F is the fuel, A is the intake air, (F/A)ov is the global fuel-air ratio, Xt,e is the molar concentration of tracer gas in the intake pipe, Xt,i is the molar concentration of tracer gas in the exhaust pipe.
Since the molar masses of tracer gas in the intake gas and exhaust gas are equal. The trapping efficiency can be calculated by Equation (18):
η t r = 1 ( 1 + ( F / A ) o v ) ( X t , e M air X t , i M exh )
Scavenging efficiency can be calculated by Equation (4) after the delivery ratio and trapping efficiency are calculated.

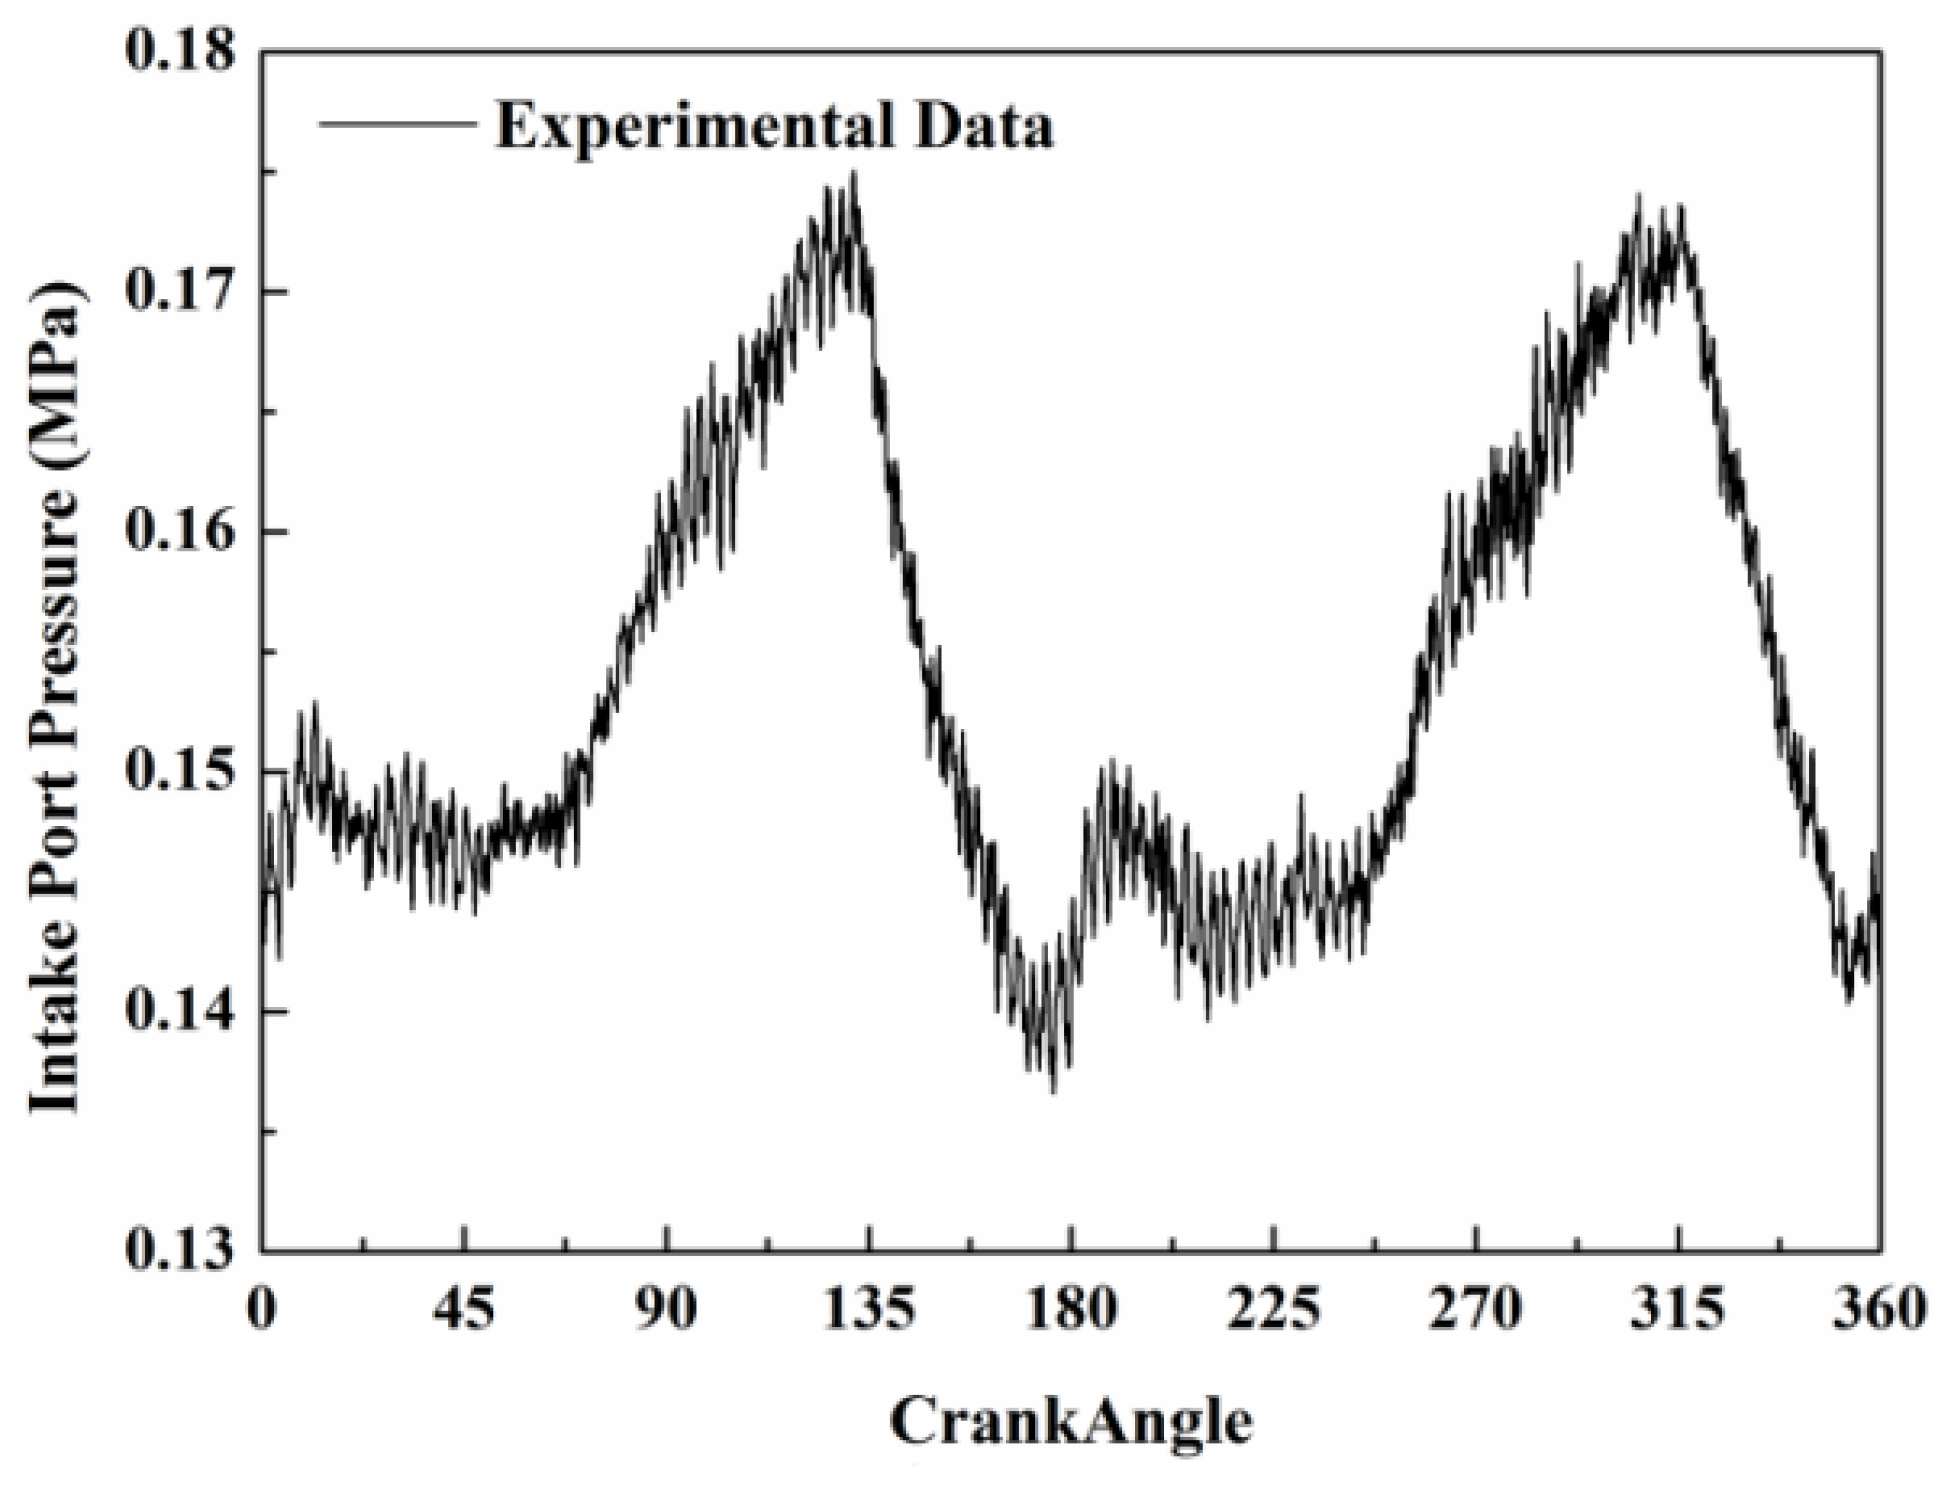
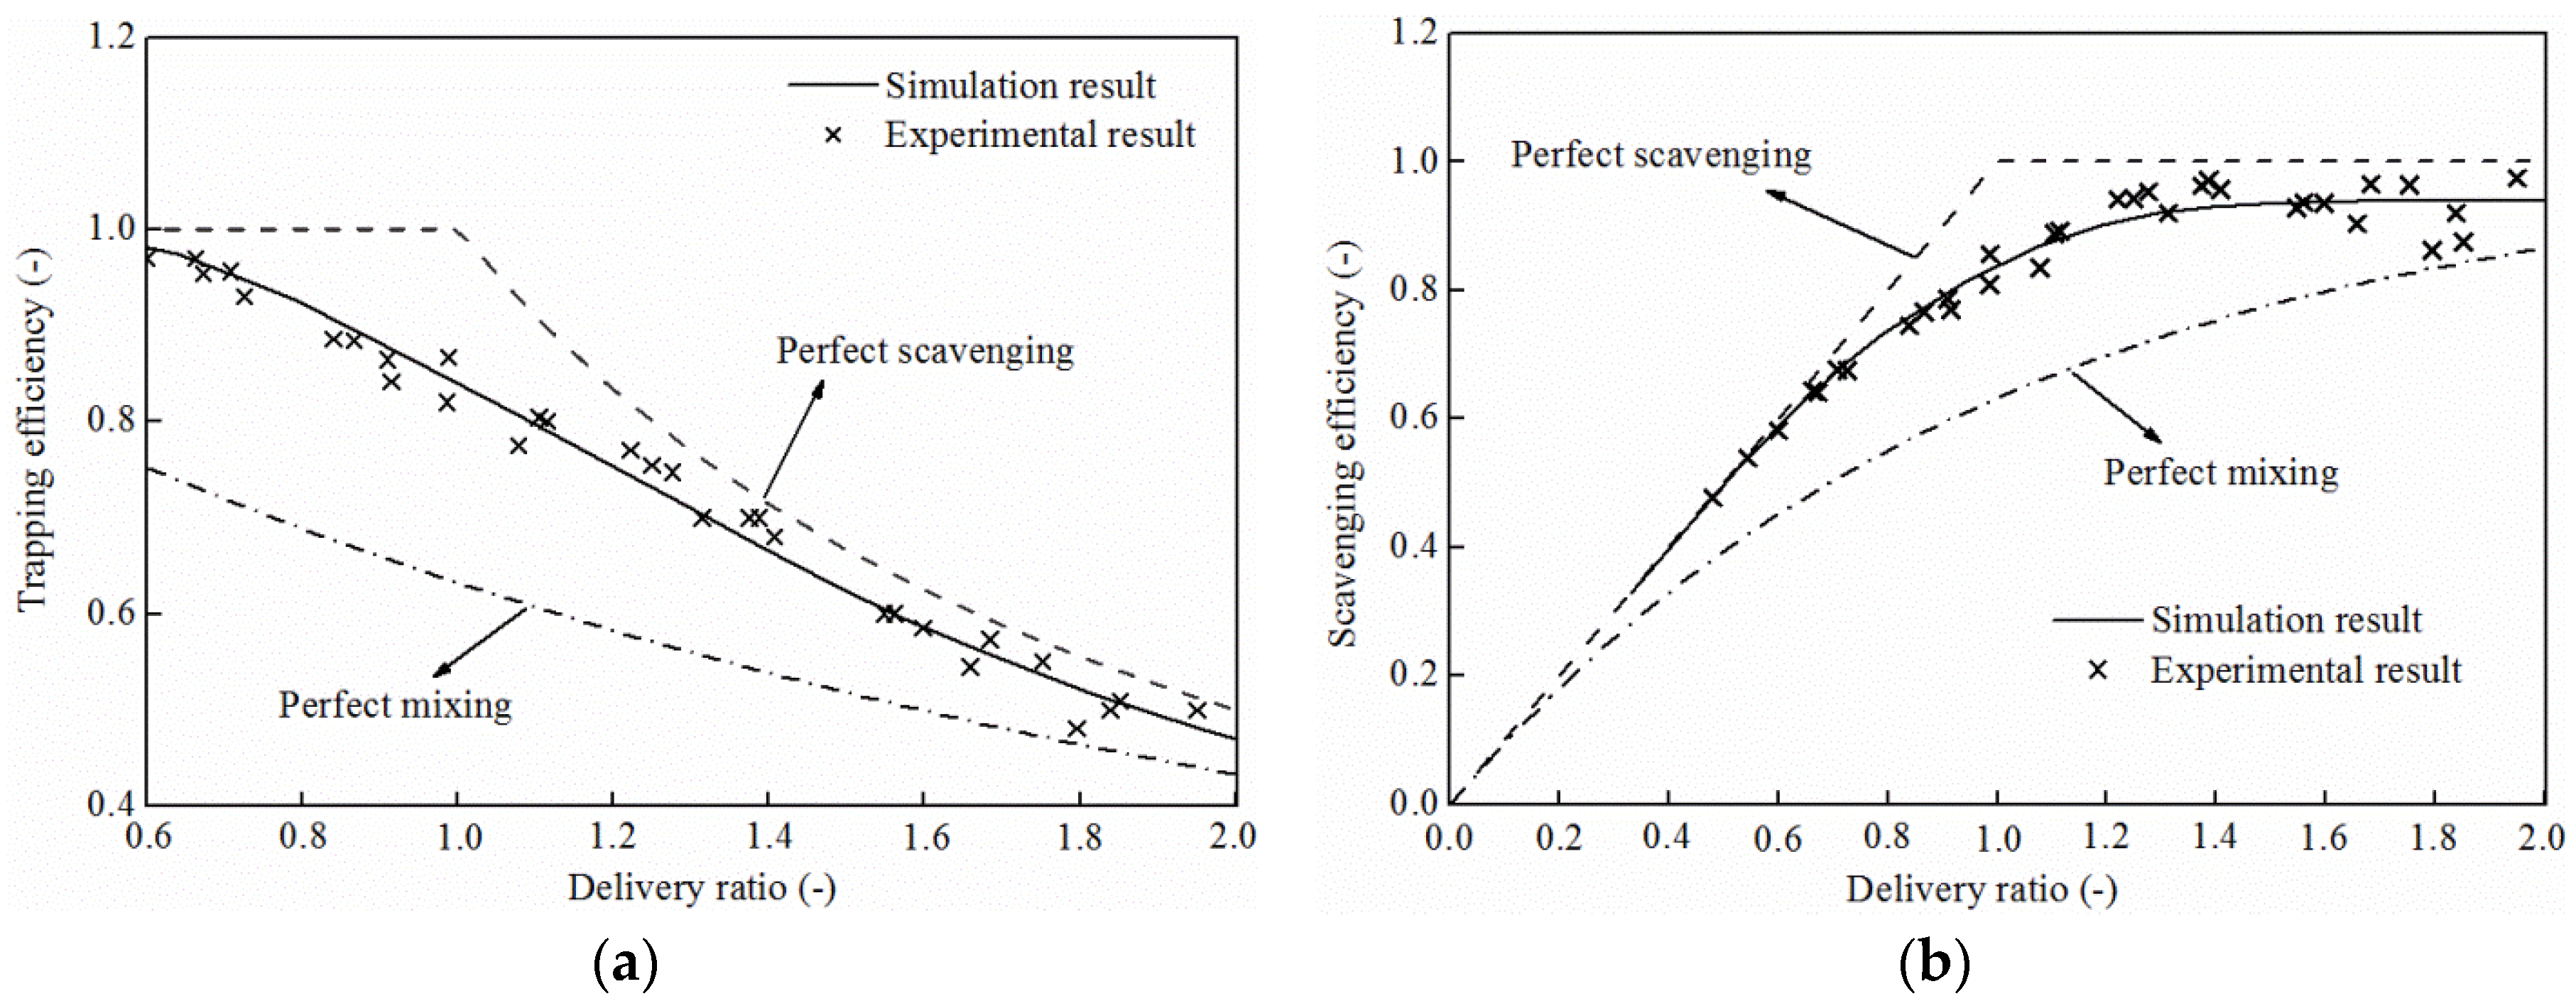
4.3. Validation of Scavenging Model

By comparing the experimental data and simulation results, it can be found that the experimental results approximate the perfect scavenging model and perfect mixing model, as shown in Figure 12. It should be noted that the experimental data are closer to the perfect scavenging model, indicating the diesel engine is superior in gas transfer quality. The simulation results are shown to be in close agreement with the experimental data and the error is less than 5%. Therefore, it can be concluded that in-cylinder and exhaust coefficients of residual gas are more accurate in the representation of OPFC diesel engine scavenging simulation. Figure 12b shows a gradual increase in scavenging efficiency as the delivery ratio grows. When the delivery ratio exceeds 1.4, the effect of delivery ratio on scavenging efficiency is weakened and any further increase in delivery ratio would only worsen the pumping losses, therefore, it is suggested that the delivery ratio should be controlled within 1.4. Meanwhile, when the delivery ratio is less than 0.5, the number of misfiring cycles in the experiments grows while the torque declines, resulting in a worsening engine performance. In view of this, a delivery ratio ranging from 0.5 to 1.4 is proposed for an optimization goal taking both stable operation and less pumping losses into consideration.

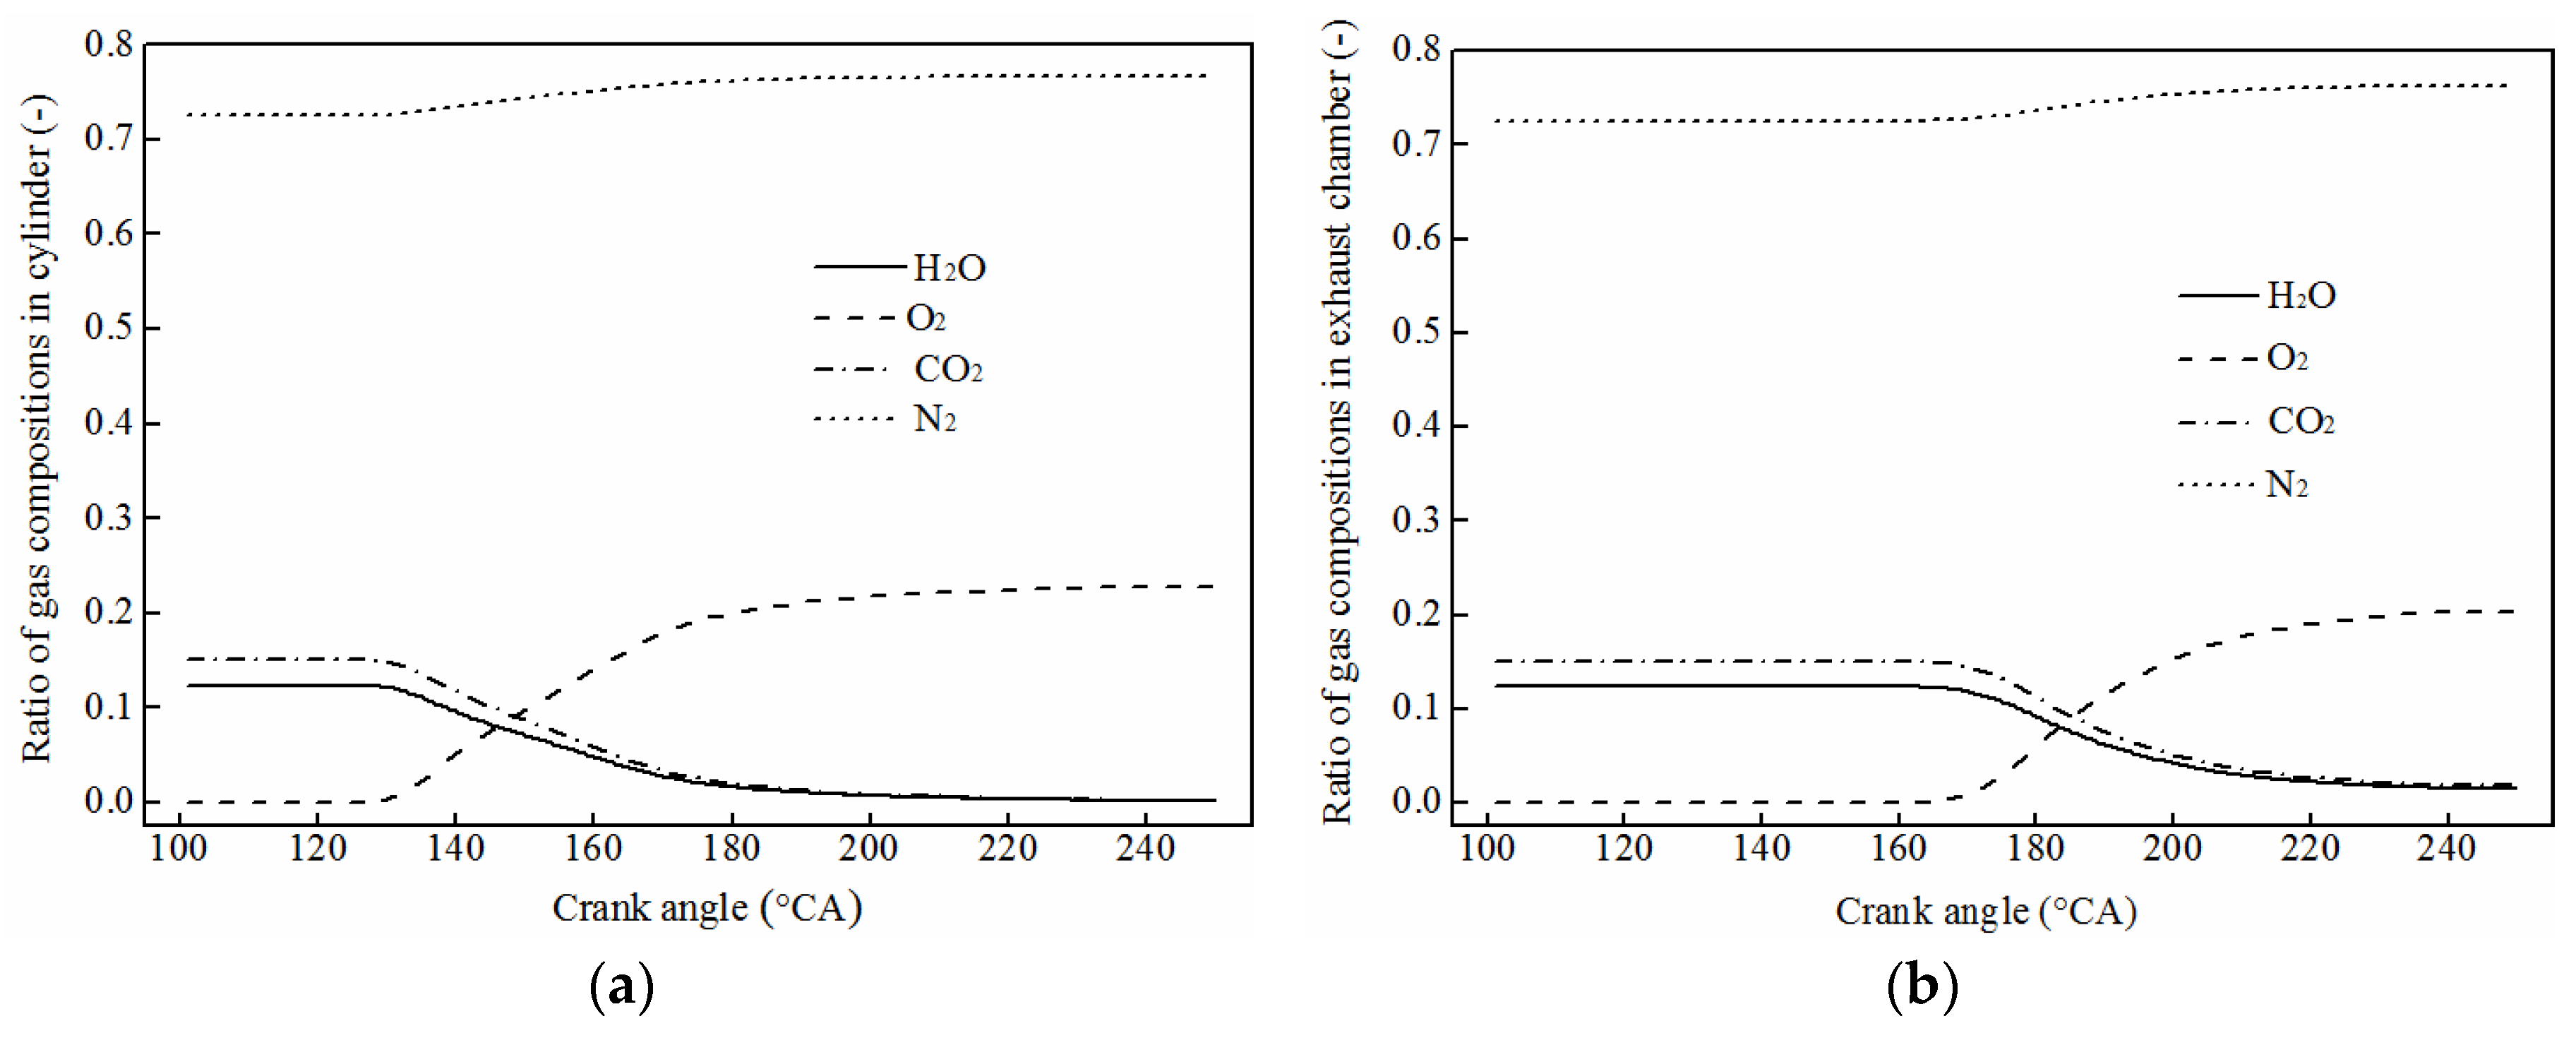
4.4. Experimental Results and Analysis

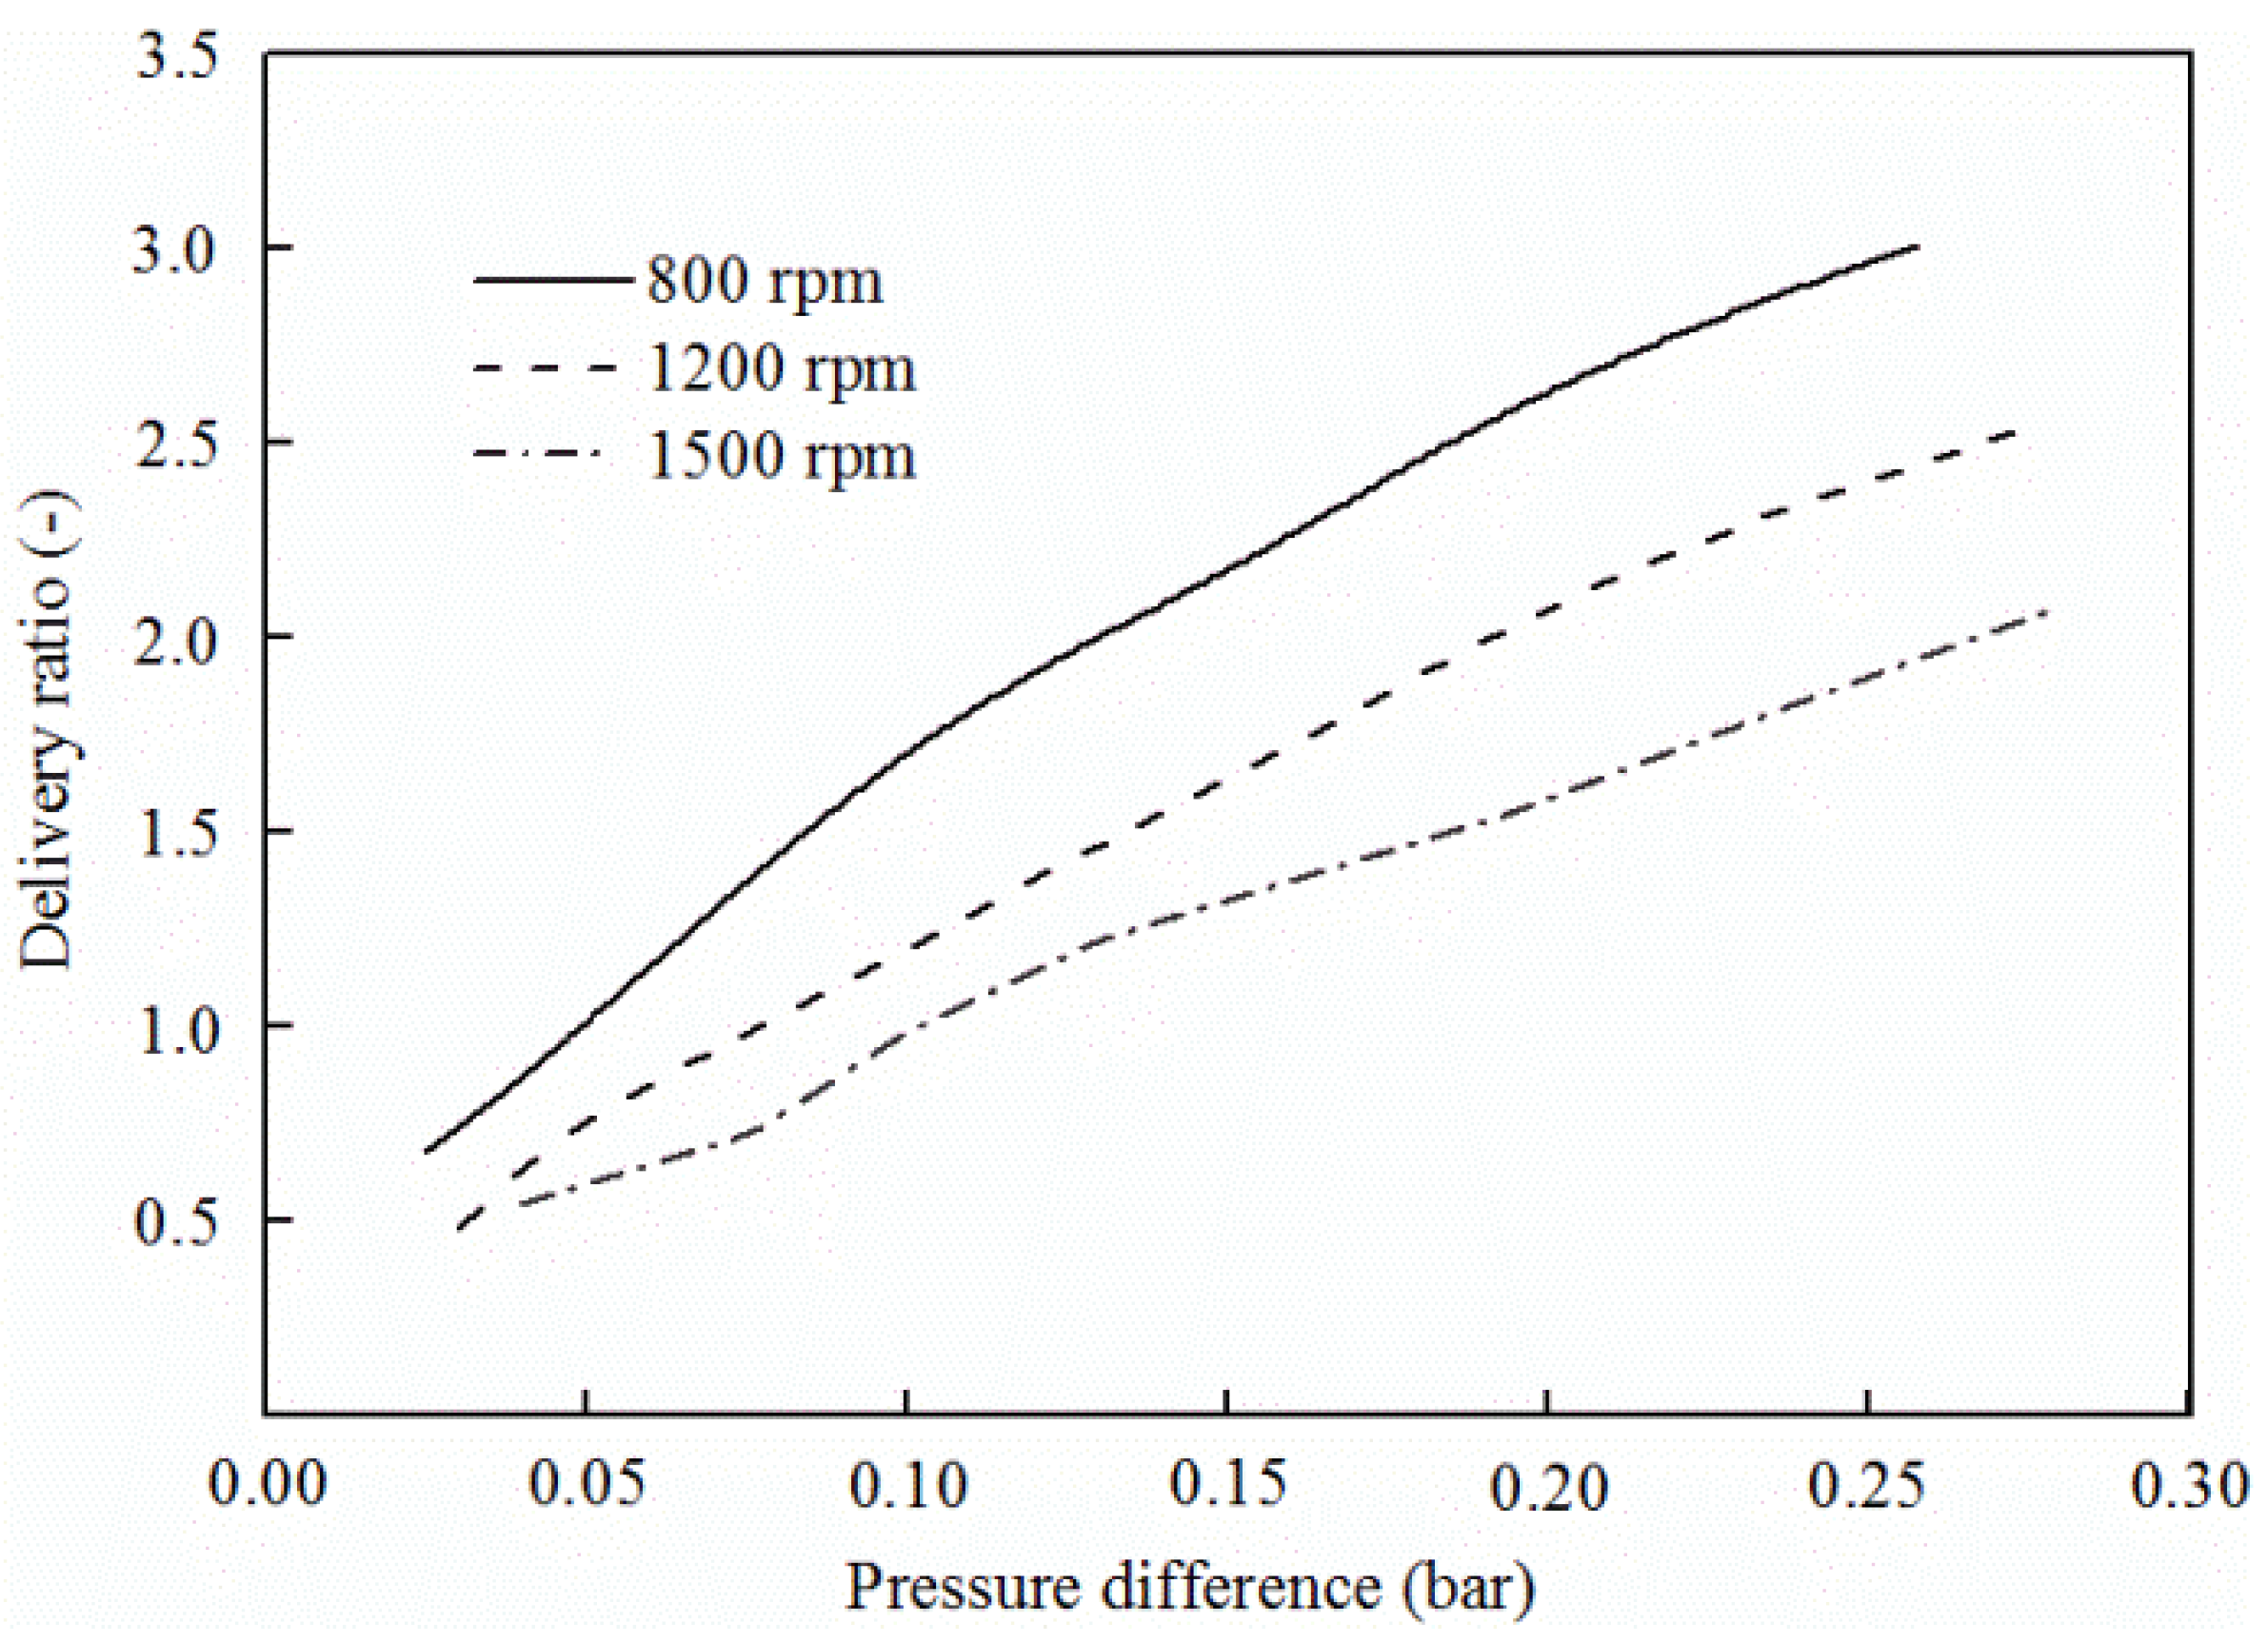
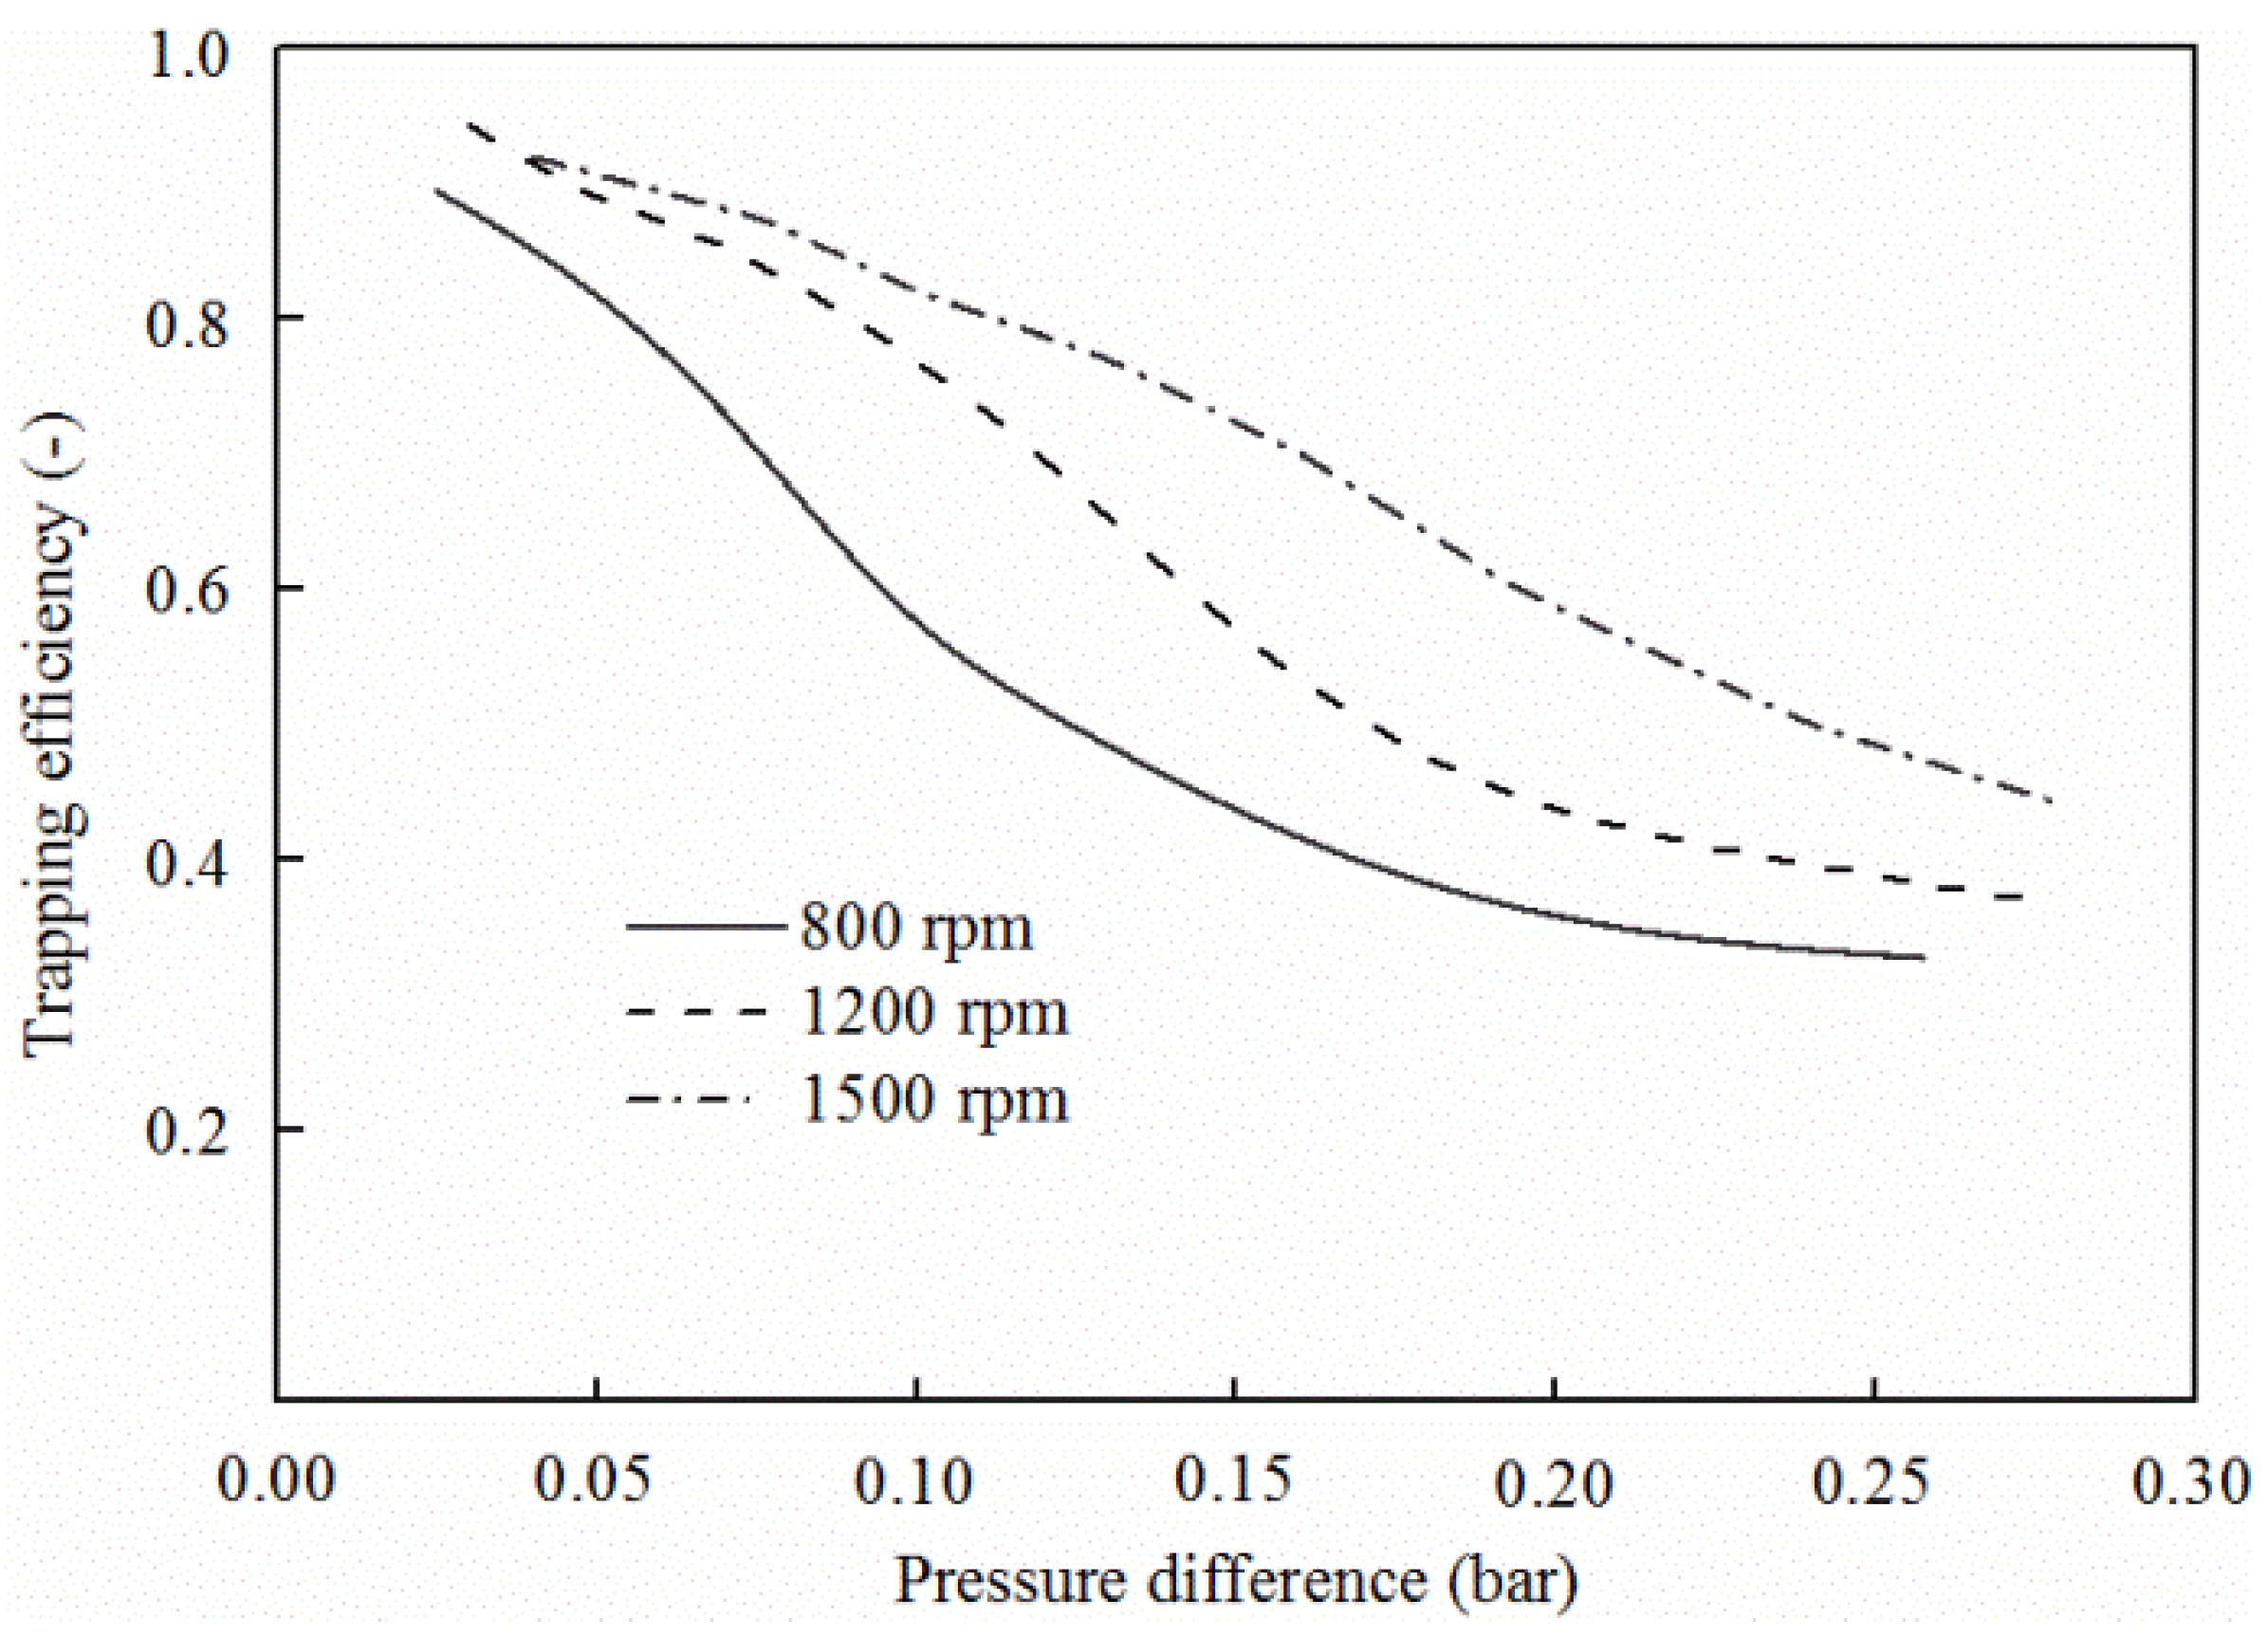
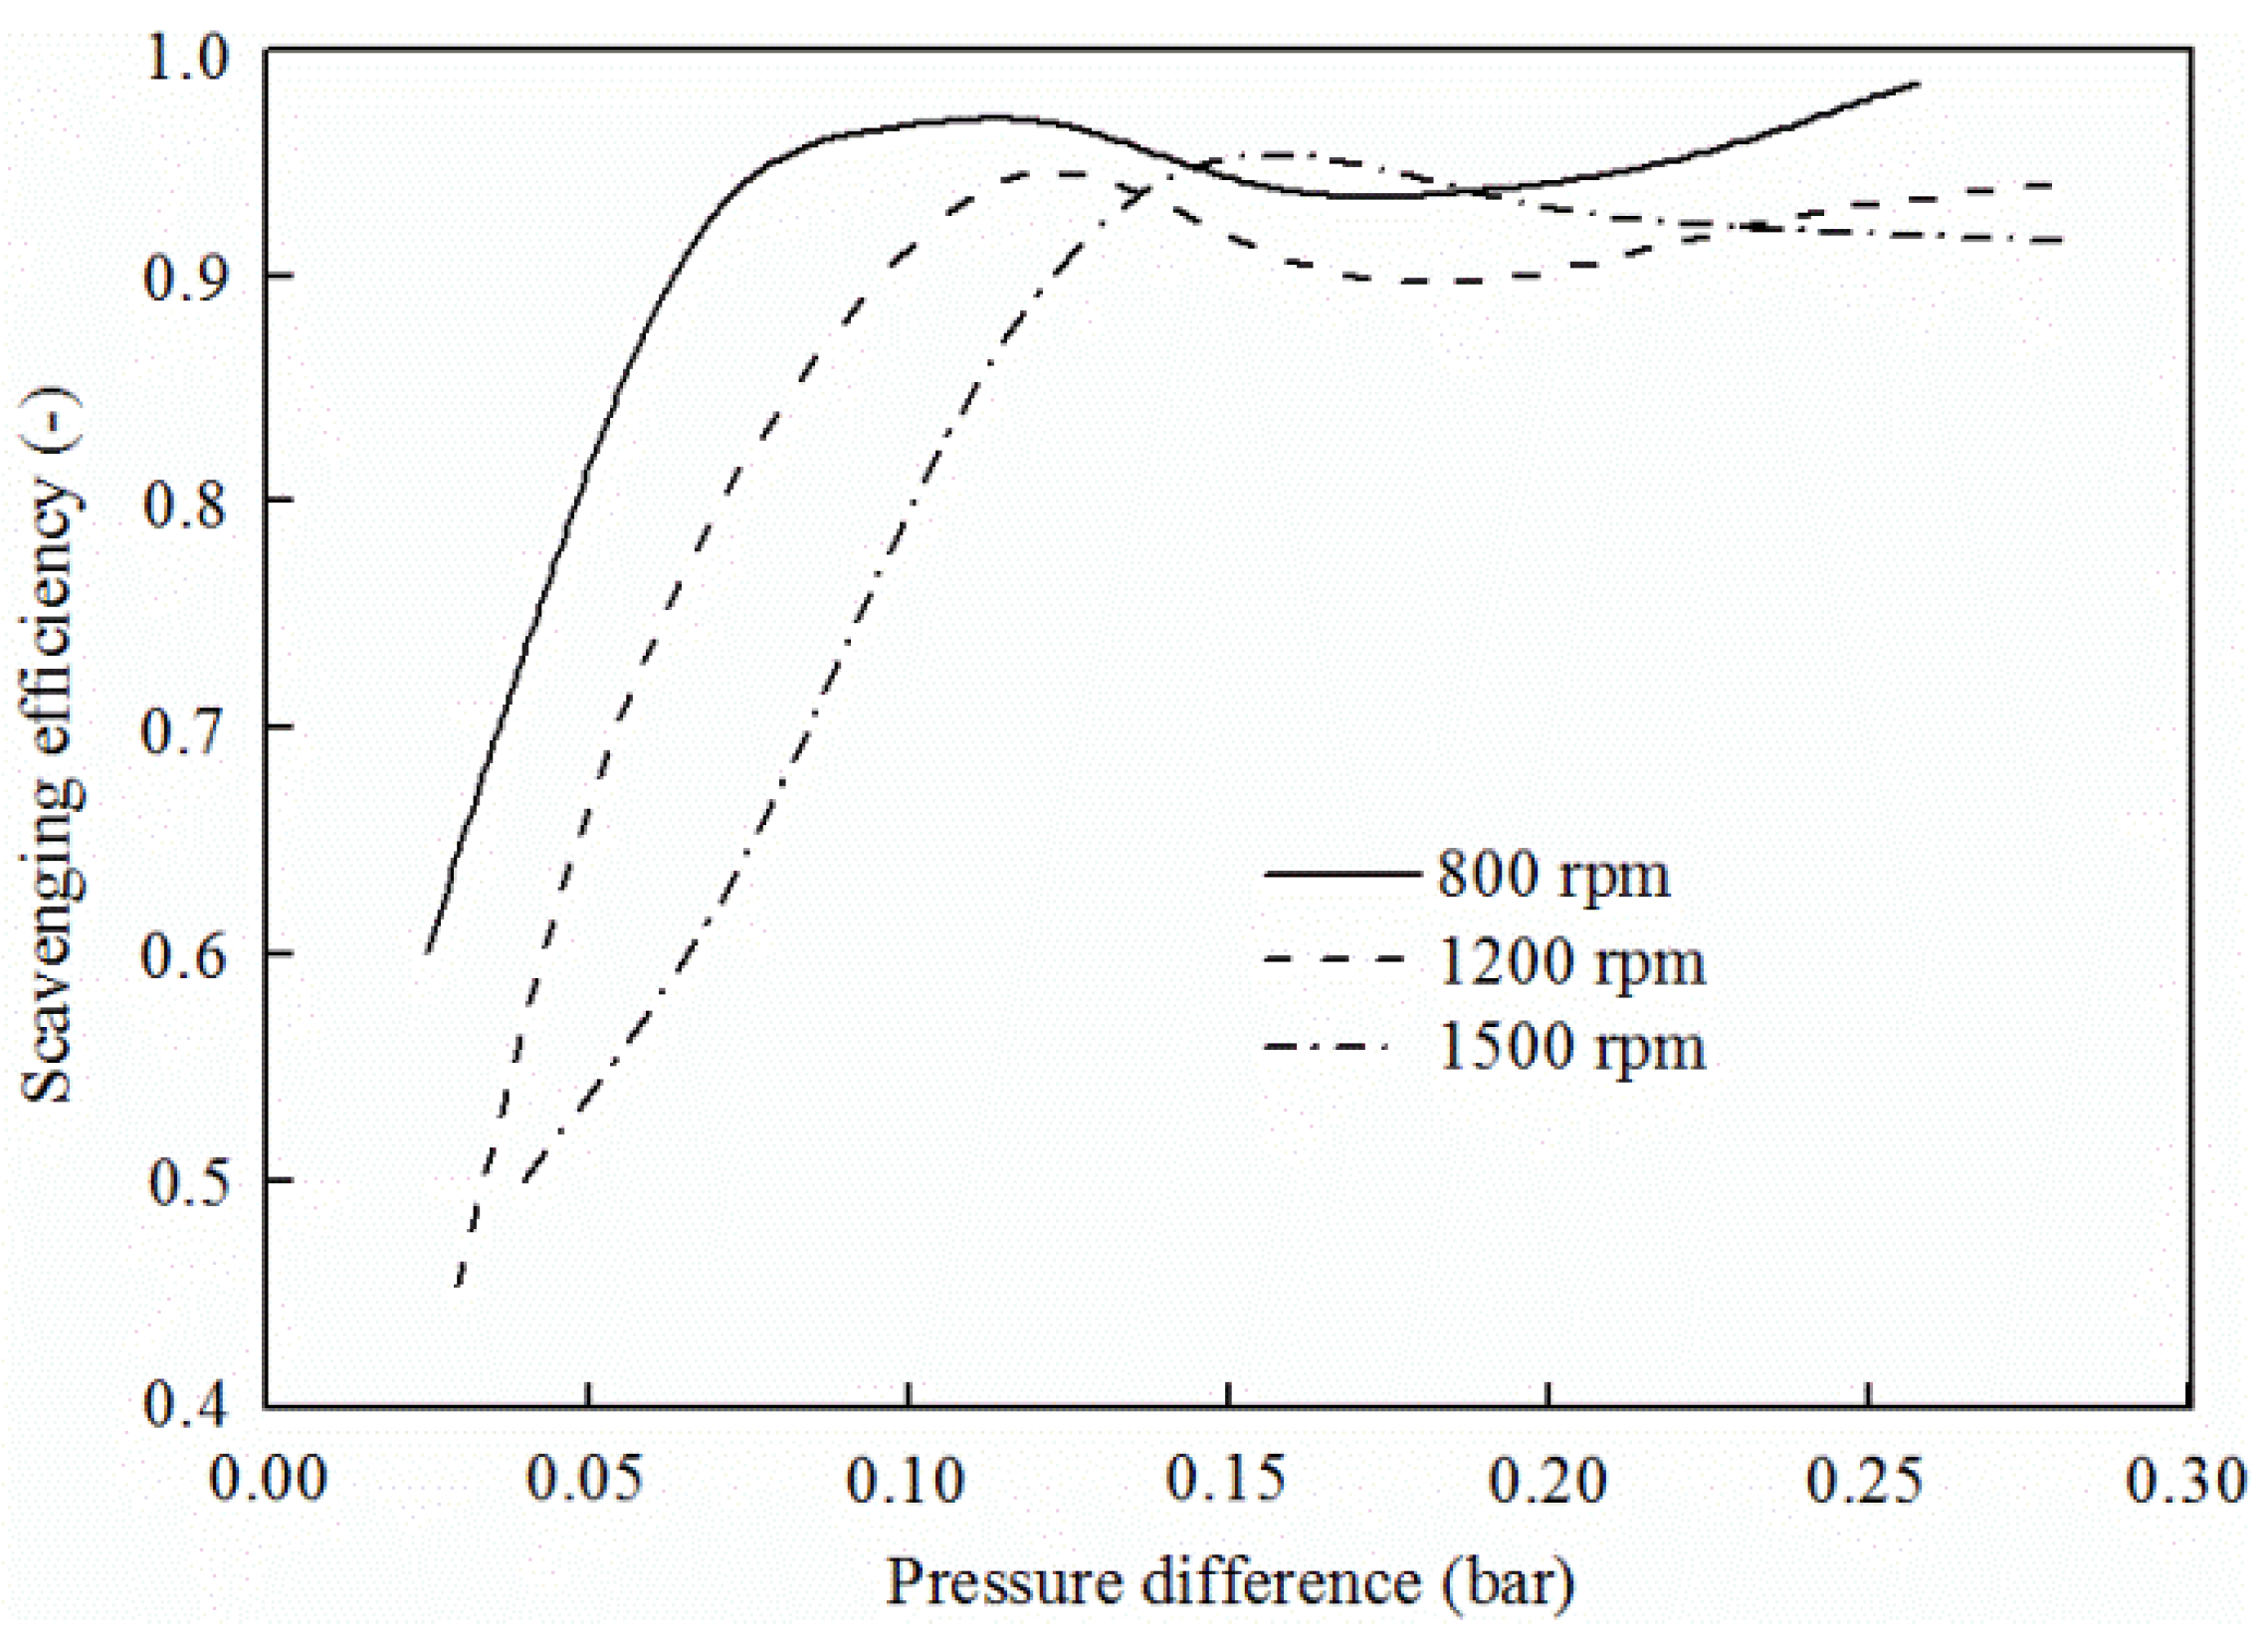
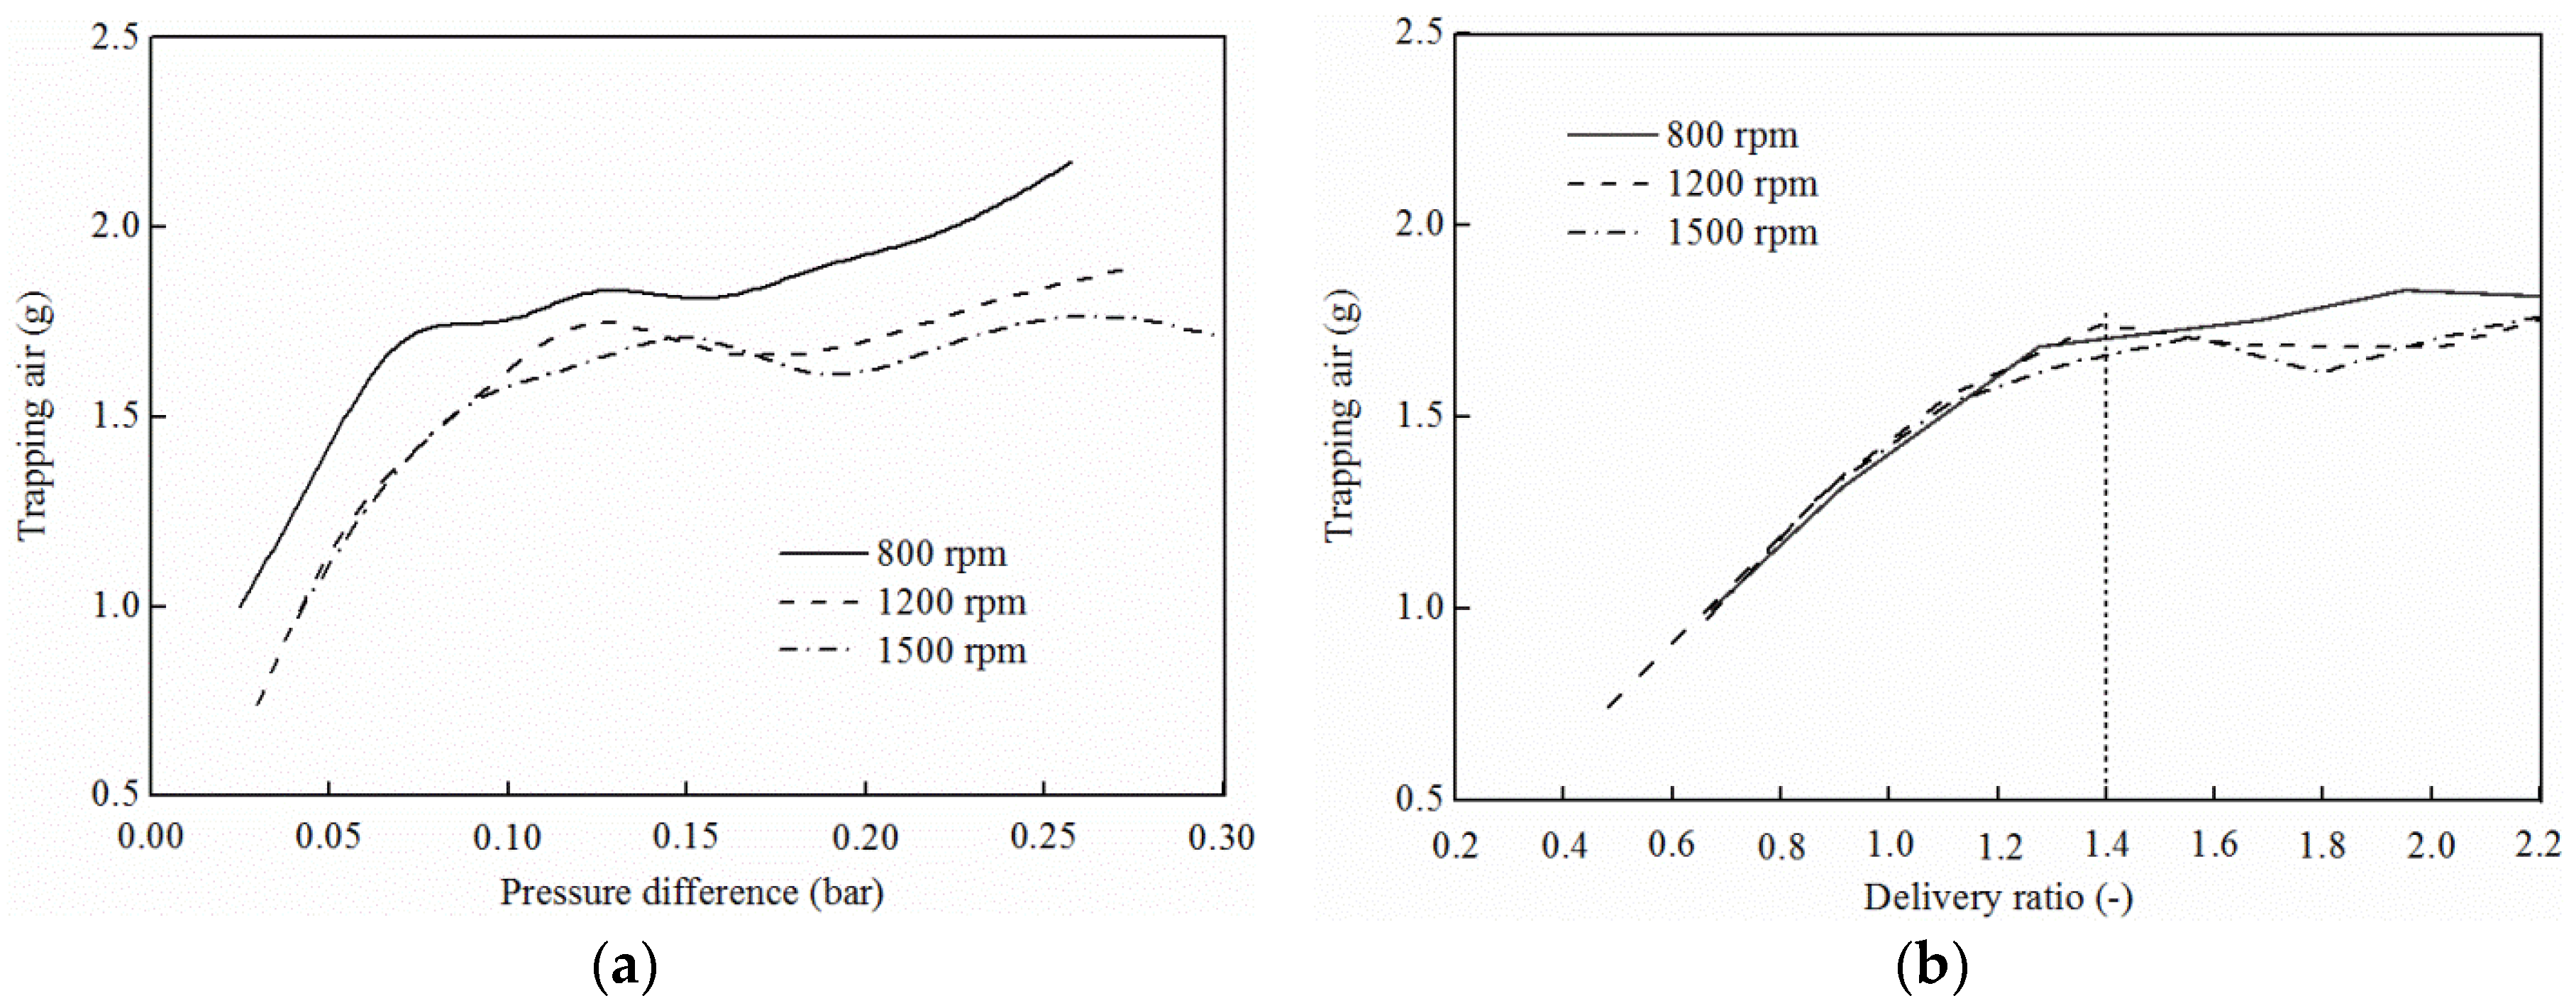
4.4.1. Effect of Pressure Difference on Scavenging Process

Cooling water temperature in the experiment is controlled at 80 ± 2 °C. The principle prototype runs respectively at 800 rpm, 1200 rpm and 1500 rpm with a stable load of 20 ± 1 N·m. Figure 13 shows the effect of pressure difference between the intake and exhaust on delivery ratio at different running speeds. Delivery ratio increases when the pressure difference between the intake and exhaust grows for a certain engine running speed. Delivery ratio declines when the engine running speed is accelerated with a certain pressure difference between the intake and exhaust. The following can explain such a difference: in the case of a certain engine running speed and scavenging duration, a larger intake and exhaust pressure difference is much more beneficial to fresh charge. Consequently, the delivery ratio is bigger; with a certain pressure difference between the intake and exhaust, the higher the engine running speed is, the shorter the scavenging duration is. As fresh charge is weakened consequently, the delivery ratio decreases. Therefore, scavenging pressure difference and engine running speed are the main factors affecting the delivery ratio.
Figure 14 shows the effect of pressure difference between the intake and exhaust on trapping efficiency. With a certain engine running speed, trapping efficiency decreases when the pressure difference between the intake and exhaust increases. This is due to an increase in the total air supply with the increase of pressure difference. Consequently, the amount of gas captured in the cylinder is relatively smaller than that of intake air. Besides, with the certain pressure difference, the lower the engine running speed is, the smaller the trapping efficiency is since a lower engine speed prolongs the gas exchange duration, thus leading to a larger scavenging amount.
Figure 15 shows the effect of pressure difference between the intake and exhaust on scavenging efficiency. With a certain engine running speed, scavenging efficiency increases with a rising pressure difference. The scavenging efficiency remains almost unchanged when the pressure difference reaches a certain value beyond which it will only increase pumping losses rather than improve the scavenging efficiency. The experimental result shows that engines running at different speeds require different pressure differences to achieve the same scavenging efficiency and the higher the engine running speed is, the more pressure difference it requires. This is mainly due to a shorter scavenging duration caused by an increasing engine running speed, which hinders residual gas scavenging.

4.4.2. Effect of Pressure Difference on Trapping Air

Figure 16 shows the effect of pressure difference and delivery ratio on trapping air mass. With a certain engine running speed, the pressure difference has a greater influence on trapping air mass when the pressure difference between the intake and exhaust is smaller. As pressure difference increases, the trapping air mass remains almost unchanged at different engine running speeds once the pressure difference reaches a certain value. The result also shows that the prototype running at a lower speed requires a relatively smaller pressure difference for a stable trapping air mass. Such a result has an affinity for total scavenging consumption during the scavenging process. The definition of delivery ratio shows that the larger the total scavenging mass is, the higher the delivery ratio is. Delivery ratio is completely determined by pressure difference during scavenging. Thus, the relation of delivery ratio and trapping air mass can be used to explain the effect of pressure difference on trapping air mass. Assuming exhaust back pressure is consistent and the delivery ratio is “1” in an ideal scavenging situation, a perfect scavenging can be completed so that in-cylinder fresh charge reaches its maximum. As the delivery ratio continues to increase while in-cylinder fresh charge remains stable, extra gas in the cylinder is short-circuited. Since the OPFC diesel engine scavenging approximates perfect scavenging and perfect mixing scavenging, the delivery ratio should exceed “1” consequently when the fresh charge reaches the inflection point. Figure 10 indicates that fresh charger under different running speeds reaches the inflection point when the delivery ratio is 1.4. The pressure differences required for a delivery ratio of 1.4 are respectively 0.075, 0.117 and 0.158 MPa.

5. Conclusions

(1) The scavenging profile can be calculated by 3D CFD simulation through the changes of gas compositions. As a vital boundary condition, results from 1D simulation with correct scavenging profiles show good agreement with the experimental data.
(2) The scavenging profile obtained by 3D CFD simulation can simulate the real scavenging process. Moreover, the relationship of residual gas coefficient in the exhaust and residual gas coefficient in the cylinder in a 1D scavenging model can characterize the scavenging process of OPFC engines with reasonable accuracy.
(3) With the increase of pressure difference, the delivery ratio increases and the trapping efficiency reduces. To achieve the same delivery ratio under different running speeds, a higher running speed requires a greater pressure difference; when the pressure difference reaches a certain value (the delivery ratio is 1.4), the scavenging efficiency will gradually stabilize. At this time, any further increase of pressure difference cannot effectively improve the scavenging efficiency.
(4) Pressure difference also has a major effect on trapping air mass. When the delivery ratio is less than 1.4, the trapping air mass will increase to a larger extent with the increase of pressure difference. However, when the delivery ratio exceeds 1.4, the effect of increasing pressure difference is not obvious or even decreases the trapping air mass. The scavenging process of an OPFC diesel engine is satisfactory and the delivery ratio range is 0.5–1.4.

Acknowledgments

The authors gratefully acknowledge the financial support by the National Natural Science Foundation of China (Grant No. 51605447), the Applied Basic Research Programs of Shanxi Province in China (Grant No. 201601D021085) and the National Ministry Fundamental Research Foundation of China (Grant No. B2220110005).

Author Contributions

Fukang Ma and Zhenfeng Zhao designed the experiment set-up; Yaonan Feng and Jun Wang performed the simulation; Tiexiong Su and Yuhang Liu analyzed the data; Yi Zhang and Yangang Zhang contributed to the editing and reviewing of the document.

Conflicts of Interest

The authors declare no conflict of interest.

Nomenclature

1Dmono-dimensionalIPCintake ports closing
3Dthree-dimensionalODCouter dead center
CAcrank angleOP2Sopposed-piston two-stroke
CFDcomputational fluid dynamicsOPFCopposed-piston folded-cranktrain
EPOexhaust port openingTDCtop dead center
IDCinner dead centerTGMtracer gas method

References

  1. Pirault, J.P.; Flint, M. Opposed Piston Engines: Evolution, Use, and Future Applications; SAE International: Warrendale, PA, USA, 2010. [Google Scholar]
  2. Naik, S.; Johnson, D.; Koszewnik, J. Practical Applications of Opposed-Piston Engine Technology to Reduce Fuel Consumption and Emissions; SAE Technical Paper 2013-01-2754; SAE International: Warrendale, PA, USA, 2013. [Google Scholar]
  3. Hofbauer, P. Opposed Piston Opposed Cylinder (OPOC) Engine for Military Ground Vehicles; SAE Technical Paper 2005-01-1548; SAE International: Warrendale, PA, USA, 2005. [Google Scholar]
  4. Hirsch, N.R.; Schwarz, E.E.; McGough, M.G. Advanced Opposed-Piston Two-Stroke Diesel Demonstrator; SAE Technical Paper 2006-01-0926; SAE International: Warrendale, PA, USA, 2006. [Google Scholar]
  5. Herold, R.E.; Wahl, M.H.; Regner, G. Thermodynamic Benefits of Opposed-Piston Two-Stroke Engines; SAE Technical Paper 2011-01-2216; SAE International: Warrendale, PA, USA, 2011. [Google Scholar]
  6. Regner, G.; Herold, R.E.; Wahl, M.H. The Achates Power Opposed-Piston Two-Stroke Engine: Performance and Emissions Results in a Medium-Duty Application; SAE Technical Paper 2011-01-2221; SAE International: Warrendale, PA, USA, 2011. [Google Scholar]
  7. Redon, F.; Kalebjian, C.; Kessler, J. Meeting Stringent 2025 Emissions and Fuel Efficiency Regulations with an Opposed-Piston, Light-Duty Diesel Engine; SAE Technical Paper 2014-01-1187; SAE International: Warrendale, PA, USA, 2014. [Google Scholar]
  8. Regner, G.; Johnson, D.; Koszewnik, J. Modernizing the Opposed Piston, Two-Stroke Engine for Clean, Efficient Transportation; SAE Technical Paper 2013-26-0114; SAE International: Warrendale, PA, USA, 2013. [Google Scholar]
  9. Hopkinson, B. The charging of two-cycle internal-combustion engines. J. Am. Soc. Naval Eng. 2010, 26, 974–985. [Google Scholar] [CrossRef]
  10. Merker, G.; Gerstle, M. Evaluation on Two Stroke Engines Scavenging Models; SAE Paper 970358; SAE International: Warrendale, PA, USA, 1997. [Google Scholar]
  11. Benson, R.S.; Brandham, P.T. A method for obtaining a quantitative assessment of the influence of charging efficiency on two-stroke engine performance. Int. J. Mech. Sci. 1969, 11, 303–312. [Google Scholar] [CrossRef]
  12. Dang, D.; Wallace, F.J. Some single zone scavenging models for two-stroke engines. Int. J. Mech. Sci. 1992, 34, 595–604. [Google Scholar] [CrossRef]
  13. Sher, E.; Harari, R. A simple and realistic model for the scavenging process in a crankcase-scavenged two-stroke cycle engine. Proc. Inst. Mech. Eng. Part A J. Power Energy 1991, 205, 129–137. [Google Scholar] [CrossRef]
  14. Streit, E.E.; Borman, G.L. Mathematical Simulation of a Large Turbocharged Two-Stroke Diesel Engine; SAE International: Warrendale, PA, USA, 1971. [Google Scholar]
  15. Wallace, F.; Cave, P. Experimental and Analytical Scavenging Studies on a Two-Cycle Opposed Piston Diesel Engine; SAE Technical Paper 710175; SAE International: Warrendale, PA, USA, 1971. [Google Scholar]
  16. Bozza, F.; Gimelli, A. A Comprehensive 1D Model for the Simulation of a Small-Size Two-Stroke SI Engine; SAE Paper 2004-01-0999; SAE International: Warrendale, PA, USA, 2004. [Google Scholar]
  17. Ferrara, G.; Balduzzi, F.; Vichi, G. An Innovative Solution for Two-Stroke Engines to Reduce the Short-Circuit Effects; SAE Technical Paper 2012-01-0180; SAE International: Warrendale, PA, USA, 2012. [Google Scholar]
  18. Laget, O.; Ternel, C.; Thiriot, J.; Charmasson, S.; Tribotte, P.; Vidal, F. Preliminary design of a two-stroke uniflow diesel engine for passenger car. SAE Int. J. Engines 2013, 6, 596–613. [Google Scholar] [CrossRef]
  19. Tribotte, P.; Ravet, F.; Dugue, V.; Obernesser, P.; Quechon, N.; Benajes, J.; Novella, R.; De Lima, D. Two strokes diesel engine-promising solution to reduce CO2 emissions. Proced. Soc. Behav. Sci. 2012, 48, 2295–2314. [Google Scholar] [CrossRef]
  20. Pohorelsky, L.; Brynych, P.; Macek, J.; Vallaude, P.-Y.; Ricaud, J.-C.; Obernesser, P.; Tribottre, P. Air System Conception for a Downsized Two-Stroke Diesel Engine; SAE Technical Paper 2012-01-0831; SAE International: Warrendale, PA, USA, 2012. [Google Scholar]
  21. He, C.; Xu, S. Transient Gas Exchange Simulation and Uniflow Scavenging Analysis for a Unique Opposed Piston Diesel Engine; SAE Technical Paper 2016-01-1087; SAE International: Warrendale, PA, USA, 2016. [Google Scholar]
  22. Wang, X.; Ma, J.; Zhao, H. Evaluations of Scavenge Port Designs for a Boosted Uniflow Scavenged Direct Injection Gasoline (BUSDIG) Engine by 3D CFD Simulations; SAE Technical Paper 2016-01-1049; SAE International: Warrendale, PA, USA, 2011. [Google Scholar]
  23. Ma, J.; Zhao, H. The Modeling and Design of a Boosted Uniflow Scavenged Direct Injection Gasoline (BUSDIG) Engine; SAE Technical Paper 2015-01-1970; SAE International: Warrendale, PA, USA, 2015. [Google Scholar]
  24. Nuti, M.; Martorano, L. Short-Circuit Ratio Evaluation in the Scavenging of Two-Stroke S. I. Engines; SAE 850177; SAE International: Warrendale, PA, USA, 1985. [Google Scholar]
  25. Olsen, D.B.; Holden, J.C.; Hutcherson, G.C.; Willson, B.D. Formaldehyde characterization utilizing in-cylinder sampling in a large bore natural gas engine. ASME J. Eng. Gas Turbines Power 2001, 123, 669–676. [Google Scholar] [CrossRef]
  26. Matthew, G.M.; Robert, F. Experimental Investigation of the Scavenging Performance of a Two-Stroke Opposed-Piston Diesel Tank Engine; SAE Paper, 2004-01-1591; SAE International: Warrendale, PA, USA, 2004. [Google Scholar]
  27. Olsen, D.B.; Hutcherson, G.C.; Willson, B.D.; Mitchell, G.E. Development of the tracer gas method for large bore natural gas engines—Part I method validation. J. Eng. Gas Turbines Power 2002, 124, 678–685. [Google Scholar] [CrossRef]
  28. Wu, Y.; Wang, Y.; Zhen, X.; Guan, S.; Wang, J. Three-dimensional CFD (computational fluid dynamics) analysis of scavenging process in a two-stroke free-piston engine. Energy 2014, 68, 167–173. [Google Scholar] [CrossRef]
  29. Ma, F.K.; Zhao, C.L.; Zhang, S.L. Scheme Design and Performance Simulation of Opposed-Piston Two-Stroke Gasoline Direct Injection Engine; SAE Technical Paper 2015-01-1276; SAE International: Warrendale, PA, USA, 2015. [Google Scholar]
  30. Ma, F.K.; Zhao, C.L.; Zhang, F.J. An experimental investigation on combustion and heat release characteristics of an opposed-piston folded-cranktrain diesel engine. Energies 2015, 8, 6365–6381. [Google Scholar] [CrossRef]
  31. Taylor, C.F. The Internal-Combustion Engine in Theory and Practice: Thermodynamics, Fluid Flow, Performance, 2nd ed.; MIT Press: Cambridge, UK, 1985. [Google Scholar]
  32. GT-Powerv.7.1. Engine Performance Application Manual; Gamma Technologies: Detroit, MI, USA, 2010.
  33. AVL-Fire vs. CFD User Guide; AVL Technologies: Graz, Austria, 2012.
  34. Basara, B.; Krajnovic, S.; Girimaji, S.; Pavlovic, Z. Near-wall formulation of the partially averaged navier stokes turbulence model. AIAA J. 2011, 49, 2627–2636. [Google Scholar] [CrossRef]
  35. Sigurdsson, E.; Ingvorsen, K.M.; Jensen, M.V. Numerical analysis of the scavenge flow and convective heat transfer in large two-stroke marine diesel engines. Appl. Energy 2014, 123, 37–46. [Google Scholar] [CrossRef]
  36. McGough, M.G.; Fanick, E.R. Experimental Investigation of the Scavenging Performance of a Two-Stroke Opposed-Piston Diesel Tank Engine; SAE International: Warrendale, PA, USA, 2004. [Google Scholar]
Figure 1. OPFC diesel engine concept.
Energies 10 00727 g001
Figure 2. Gas exchange in an OPFC diesel engine.
Energies 10 00727 g002
Figure 3. CFD calculation model.
Energies 10 00727 g003
Figure 4. Intake pressure curve.
Energies 10 00727 g004
Figure 5. Comparison between different mesh resolutions.
Energies 10 00727 g005
Figure 6. In-cylinder scavenging process of the OPFC engine.
Energies 10 00727 g006
Figure 7. The variation of gas components in the scavenging process: (a) in-cylinder gas components; (b) exhaust chamber gas components.
Energies 10 00727 g007
Figure 8. The uniflow scavenging profile of the OPFC diesel engine.
Energies 10 00727 g008
Figure 9. TGM test schematic.
Energies 10 00727 g009
Figure 10. TGM test bed: (a) injection, collection and analysis system; (b) OPFC diesel engine.
Energies 10 00727 g010
Figure 11. Principle of TGM.
Energies 10 00727 g011
Figure 12. Result comparison between simulation and experimental data: (a) trapping efficiency variation with delivery ratio; and (b) scavenging efficiency variation with delivery ratio.
Energies 10 00727 g012
Figure 13. Effect of pressure difference on delivery ratio.
Energies 10 00727 g013
Figure 14. Effect of pressure difference on trapping efficiency.
Energies 10 00727 g014
Figure 15. Effect of pressure difference on scavenging efficiency.
Energies 10 00727 g015
Figure 16. Trapping air mass effect in the scavenging process: (a) effect of pressure difference on trapping air mass; and (b) effect of delivery ratio on trapping air mass.
Energies 10 00727 g016
Table 1. Engine specifications.
Parameters (unit)Value
Number of cylinders (-)2
Bore (mm)100
Stroke (intake/exhaust) (mm)110/110
Nominal compression ratio (-)22
Trapping compression ratio (-)15.8
Displacement (L)3.4
Intake port height (mm)24
Exhaust port height (mm)28
Intake port circumference ratio (-)0.75
Exhaust port circumference ratio (-)0.6
Intake port radial angle (°)15
Exhaust port radial angle (°)0
Opposed-piston motion phase difference (°CA)17
Maximum engine power (kW)80 @ 2400 rpm
Maximum engine moment (N·m)420 @ 1600 rpm

