
Prediction of Steam Jacket Dynamics and Water Balances in Underground Coal Gasification


GFZ German Research Centre for Geosciences, Fluid Systems Modelling, Telegrafenberg, 14473 Potsdam, Germany
*
Author to whom correspondence should be addressed.
Energies 2017, 10(6), 739; https://doi.org/10.3390/en10060739
Submission received: 24 March 2017
/
Revised: 18 May 2017
/
Accepted: 19 May 2017
/
Published: 23 May 2017
Abstract
:Underground coal gasification (UCG) converts coal to a high-calorific synthesis gas for the production of fuels or chemical feedstock. UCG reactors are generally operated below hydrostatic pressure to avoid leakage of UCG fluids into overburden aquifers. Additionally, fluid flow out of and into the reactor is also determined by the presence of the steam jacket, emerging in close reactor vicinity due to the high temperatures generated in UCG operation. Aiming at improving the understanding of the substantial role of the steam jacket in UCG operations, we employ numerical non-isothermal multiphase flow simulations to assess the occurring multiphase fluid flow processes. For that purpose, we first validate our modeling approach against published data on the U.S. UCG field trials at Hanna and Hoe Creek, achieving a very good agreement between our simulation and the observed water balances. Then, we discuss the effect of coal seam permeability and UCG reactor pressure on the dynamic multiphase flow processes in the reactor’s vicinity. The presented modeling approach allows for the quantification and prediction of time-dependent temperature and pressure distributions in the reactor vicinity, and thus steam jacket dynamics as well as reactor water in- and outflows.
1. Introduction
Underground coal gasification (UCG) has the potential to increase worldwide coal reserves by the utilization of coal deposits not mineable by conventional methods [1,2,3]. It is based on gasifying coal in situ to produce a high-calorific synthesis gas, which can be applied for electricity generation as well as fuel or chemical feedstock production at the surface. This re-emerging technology could provide a relevant contribution to the development of Clean Coal Technologies, if accompanied by carbon capture and storage, e.g., in the reactor cavities generated in the coal following the cease of operation [4,5,6]. Apart from its high economic potentials [7,8,9], UCG may induce environmental impacts such as freshwater aquifer pollution by synthesis gas and/or by-product leakage [10,11,12,13,14,15,16].
The gasification zone propagates between injection and production wells in the UCG reactor, which is partially filled with caved coal rubble from the overburden. The rate of reactor growth depends on a number of factors, some of which can be controlled, such as the rate of air or steam injection, as well as the geological boundary conditions affected by the chemo-thermo-hydro-mechanical properties of the coal and its overburden [17,18,19,20,21].
Coal permeability and hydraulic pressure determine the pressure gradient between the reactor and overlying aquifers and control the water inflow into the reactor and the flow of UCG products out of the reactor into the surrounding rock as well as the convective heat transfer between the reactor, the coal, and its overburden [17,22]. Next to mechanical stress changes triggered by coal excavation, thermal stresses also induce permeability changes in the reactor’s close vicinity [19,23,24,25,26]. Furthermore, permeability affects natural convection that transports fluids along with heat and potential UCG by-products into the overburden. Close to the reactor, fluid flow is also determined by the high reactor temperatures. In this context, the presence of water plays an especially vital role in the UCG process, providing a source of hydrogen for the steam-char and methanation reactions, which contribute significantly to the calorific value of the synthesis gas [27]. Water also favors the water-gas-shift reaction, which trades carbon monoxide for hydrogen [27]. In addition, phase transitions between liquid and gaseous water in the close reactor vicinity consume heat, which is required by the endothermic steam-char reaction. As a result, a layer of steam surrounds the UCG reactor, termed the steam jacket. In order to prevent or significantly mitigate potential environmental impacts, UCG reactors are generally operated below hydrostatic pressure, hindering the outflow of UCG process fluids into adjacent aquifers [28,29]. Although, the difference between reactor and hydrostatic pressure produces an inflow of groundwater into the reactor, preventing UCG by-product leakage, on the other hand, the emerging steam jacket reduces the heat consumption by water evaporation and controls the spatial water inflow into the reactor, allowing operators to maintain an efficient and sustainable operation [1,30,31].
Many efforts have been undertaken towards understanding the complex and strongly coupled thermo-hydro-mechanical processes in UCG [16,26,32,33,34,35,36]. Numerical modeling has been an important methodology to study these processes in view of UCG performance and sustainability. However, most of the earlier UCG modeling efforts assumed reduced complexity to achieve reasonable computational runtimes. Further, the former model’s applicability is limited to specific and isolated cases, resulting in models that can hardly predict the performance of previous and future UCG operations [37]. With the current advancement in numerical modeling software tools and increasingly powerful computational hardware, 3D models with a reasonable complexity, e.g., supra-critical multiphase fluid flow, can be efficiently employed [37].
The present study addresses thermo-hydraulic processes in UCG to improve the understanding of UCG steam jacket dynamics and multiphase fluid flow in the reactor’s close vicinity. For that purpose, we apply a scientific numerical simulator to investigate the influence of reactor pressure and coal permeability on water flow into and out of a UCG reactor as well as the spatial and temporal variation of pressure and temperature in view of the steam jacket dynamics. We first employ the well-documented U.S. UCG field trials at Hanna and Hoe Creek for model validation and then apply our validated modeling approach to demonstrate the effect of coal seam permeability and reactor pressure on the complex multiphase fluid flow processes in the reactor vicinity. Our objective is to improve the understanding of the sub- and supercritical multiphase flow processes in the UCG reactor vicinity and the associated steam jacket formation in space and time. In the present study, coupled mechanical and/or chemical modeling approach was consciously not taken into account in favor of model validation against published operational data, i.e., water balances. Further, the high complexity of the coupled processes in UCG is likely to produce superimposing effects in the simulation results, avoiding a proper understanding of the mechanisms responsible for vapor phase formation and multiphase flow. Therefore, we decided to focus on thermo-hydraulic processes in the present study only to account for steam jacket dynamics as a result of formation fluid vaporization in the high-temperature reactor near-field.
2. Method and Numerical Model Description
The simulation of hydraulic multiphase-flow processes in UCG is complex in view of reaching numerical convergence, since temperature and pressure are likely to cross the critical point of water. In this case, a transition from subcritical to supercritical mixture properties occurs, demanding non-isothermal compositional multiphase flow simulations to account for three-phase water flow, including the occurring phase transitions. In the present study, we applied the numerical simulator MUFITS (Multiphase Filtration Transport Simulator) [38] for modeling the thermodynamic processes in the UCG reactor vicinity. MUFITS is a scientific multiphase flow simulator and provides different modules for the analysis of non-isothermal multiphase flows in porous media [38,39,40]. In contrast to the classic numerical approach, wherein pressure and temperature are used to determine the multiphase thermodynamic equilibrium, MUFITS uses pressure-enthalpy-mixture compositional variables [38,41]. Fluid mixture properties are specified by the thermodynamic potential:
which is determined by pressure () and total enthalpy (). Here, is the mixture molar composition and is the molar entropy. The potential (Equation (1)) is represented using a polynomial spline in the space, for which coefficients are calculated before the hydrodynamic simulations [42]. The thermodynamic potential is used in the conditional extremum problem (Equations (2)–(4)), which corresponds to the entropy maximum conditions in the thermodynamic equilibrium (= constant, denotes the total parameters of the mixture) [38,42]:
where, is the phase molar fraction and the subscript = 1, 2, 3 refers the -th phase of the binary mixture. Therefore, MUFITS can be used to describe single-, two- and three-phase states of mixtures under a wide range of pressures and temperatures, minimizing numerical convergence issues [38,39,40,43]. A detailed description and the corresponding problem solution method as formulated in Equations (2)–(4) is given by Afanasyev [41]. For the modeling of water flow in porous media, mass (Equation (5)) and energy conservation equations (Equation (6)) are used to maintain mass balances, while Darcy’s law (Equation (7)) is employed for fluid transport [38,42]:
where, and represent the phases and components, respectively, is the porosity, the density, the -th component mass fraction in the -th phase, the saturation, the Darcy velocity, () the (energy) influx out of the point source, e the internal energy, the mass enthalpy, the effective heat conduction coefficient, T the temperature, K the absolute permeability, the relative permeability, the viscosity, the gravitational acceleration, and the subscript refers to the host rock parameters. For this study, heat conduction and convection were included by using the MUFITS 2016.C BINMIXT module [42].
3. Modeling Approach Validation Using UCG Trial Data
3.1. Field-Tests Hanna II and Hoe Creek II
During the mid to late 1970s, the U.S. Department of Energy financed eight field tests at shallow depths in Wyoming to determine the feasibility of in situ UCG [44]. The Laramie Energy Technology Center (LERC) conducted five pilot tests at the Hanna and the Lawrence Livermore National Laboratory (LLNL) three tests at the Hoe Creek site. The well-documented results of these field tests have been presented in numerous publications and reports, e.g., [14,44,45,46,47,48,49,50,51,52,53,54]. Yang et al. [36] reviewed the recent global developments, research progress, and technical innovations as well as the economic feasibility of UCG over the past ten years. Since the present study focuses on literature data on water balance calculation models introduced by Camp et al. [55,56], Krantz et al. [27] and Levie et al. [57] for the Hanna II Phase 2 and Hoe Creek II tests, these field trials are briefly introduced here. The Hanna II test was conducted in a 9-m thick subbituminous coal seam with overlying sandstone strata at 83 m depth. A linked vertical wells (LVW) configuration with a distance of 18 m was used, whereby about 1800 tons of coal were gasified in 25 days [49,57,58]. At the Hoe Creek site, the stratigraphic sequence consists of sandstones, claystones, siltstones and two coal seams. The deeper coal seam with a thickness of 8 m at 38 m depth was the target seam here [12,17]. The Hoe Creek II test was conducted for 58 days and consumed a similar amount of coal as the Hanna II Phase 2 one, also using a LVW configuration with an identical well distance [54]. Cross-sections following the Hanna II and Hoe Creek II field tests, taking into account operational monitoring data and post-burn coring show reactor growths up into the coal seam roof [25,57,58], whereby roof collapse particularly occurred at the Hoe Creek II site. As a consequence of the operational procedure and hydrogeological boundary conditions, product gases migrated from the Hoe Creek II reactor into adjacent aquifers, which became contaminated with UCG by-products such as tars and organic compounds [54]. Contamination of shallow freshwater aquifers following the Hoe Creek II tests became a main concern in UCG operation, but this is not in the direct focus of this study.
3.2. Previous Existing Models to Quantify Water Balances
The semi-analytical model [27,55,56], which was developed in the 1970s to predict water flow into and out of the UCG reactor incorporates isothermal unsteady-state radial flow (permeation) as well as spalling-enhanced dehydration (drying) of coal and overburden rocks. These two mechanisms were mathematically integrated with a semi-analytical reactor growth model and applied to predict the water balances in the two field tests introduced before. The produced amount of water from the UCG reactors was observed at the production wells, and is therefore zero when water from adjacent rocks is not flowing into the UCG reactor or water flow from the reactor into the adjacent rocks does not occur. Water flow into and out of the UCG reactor is strongly determined by the direction of the pressure gradient between the reactor and the adjacent aquifer. In the model developed by Camp [55], outflow from the reactor is only considered if a water column of at least about 0.3 m (one foot) height is displaced out of the close reactor vicinity. It has to be noted that this assumption is only taken into account for the Hanna model, but neglected in the Hoe Creek one. Camp [55] assumes the reactor to have a cylindrical shape, growing radially according to the daily coal consumption and due to the occurrence of the aforementioned spalling-enhanced drying mechanism. The integrated semi-analytical reactor-growth model provides the daily water flow from this mechanism and supplies the water balance model with the reactor dimensions, which are increasing with time. Coal composition and its time-dependent consumption are calculated using material and energy balances [59], while the average daily reactor pressure is taken from Gunn [60]. The coal consumed in both field trials and used in the semi-analytical models amounts to about 1340 m3 for the Hanna II Phase 2 and about 1400 m3 for the Hoe Creek II test [55]. The model predictions are in very good agreement with the observed daily and total water production at the wellheads for the Hanna II Phase 2 and Hoe Creek II field tests [55]. Camp’s modeling results on the water permeation for both field tests are used for the validation of our non-isothermal multiphase flow modeling approach, comparing simulated and observed water flow into and out of the respective UCG reactors.
3.3. Numerical Model Implementation
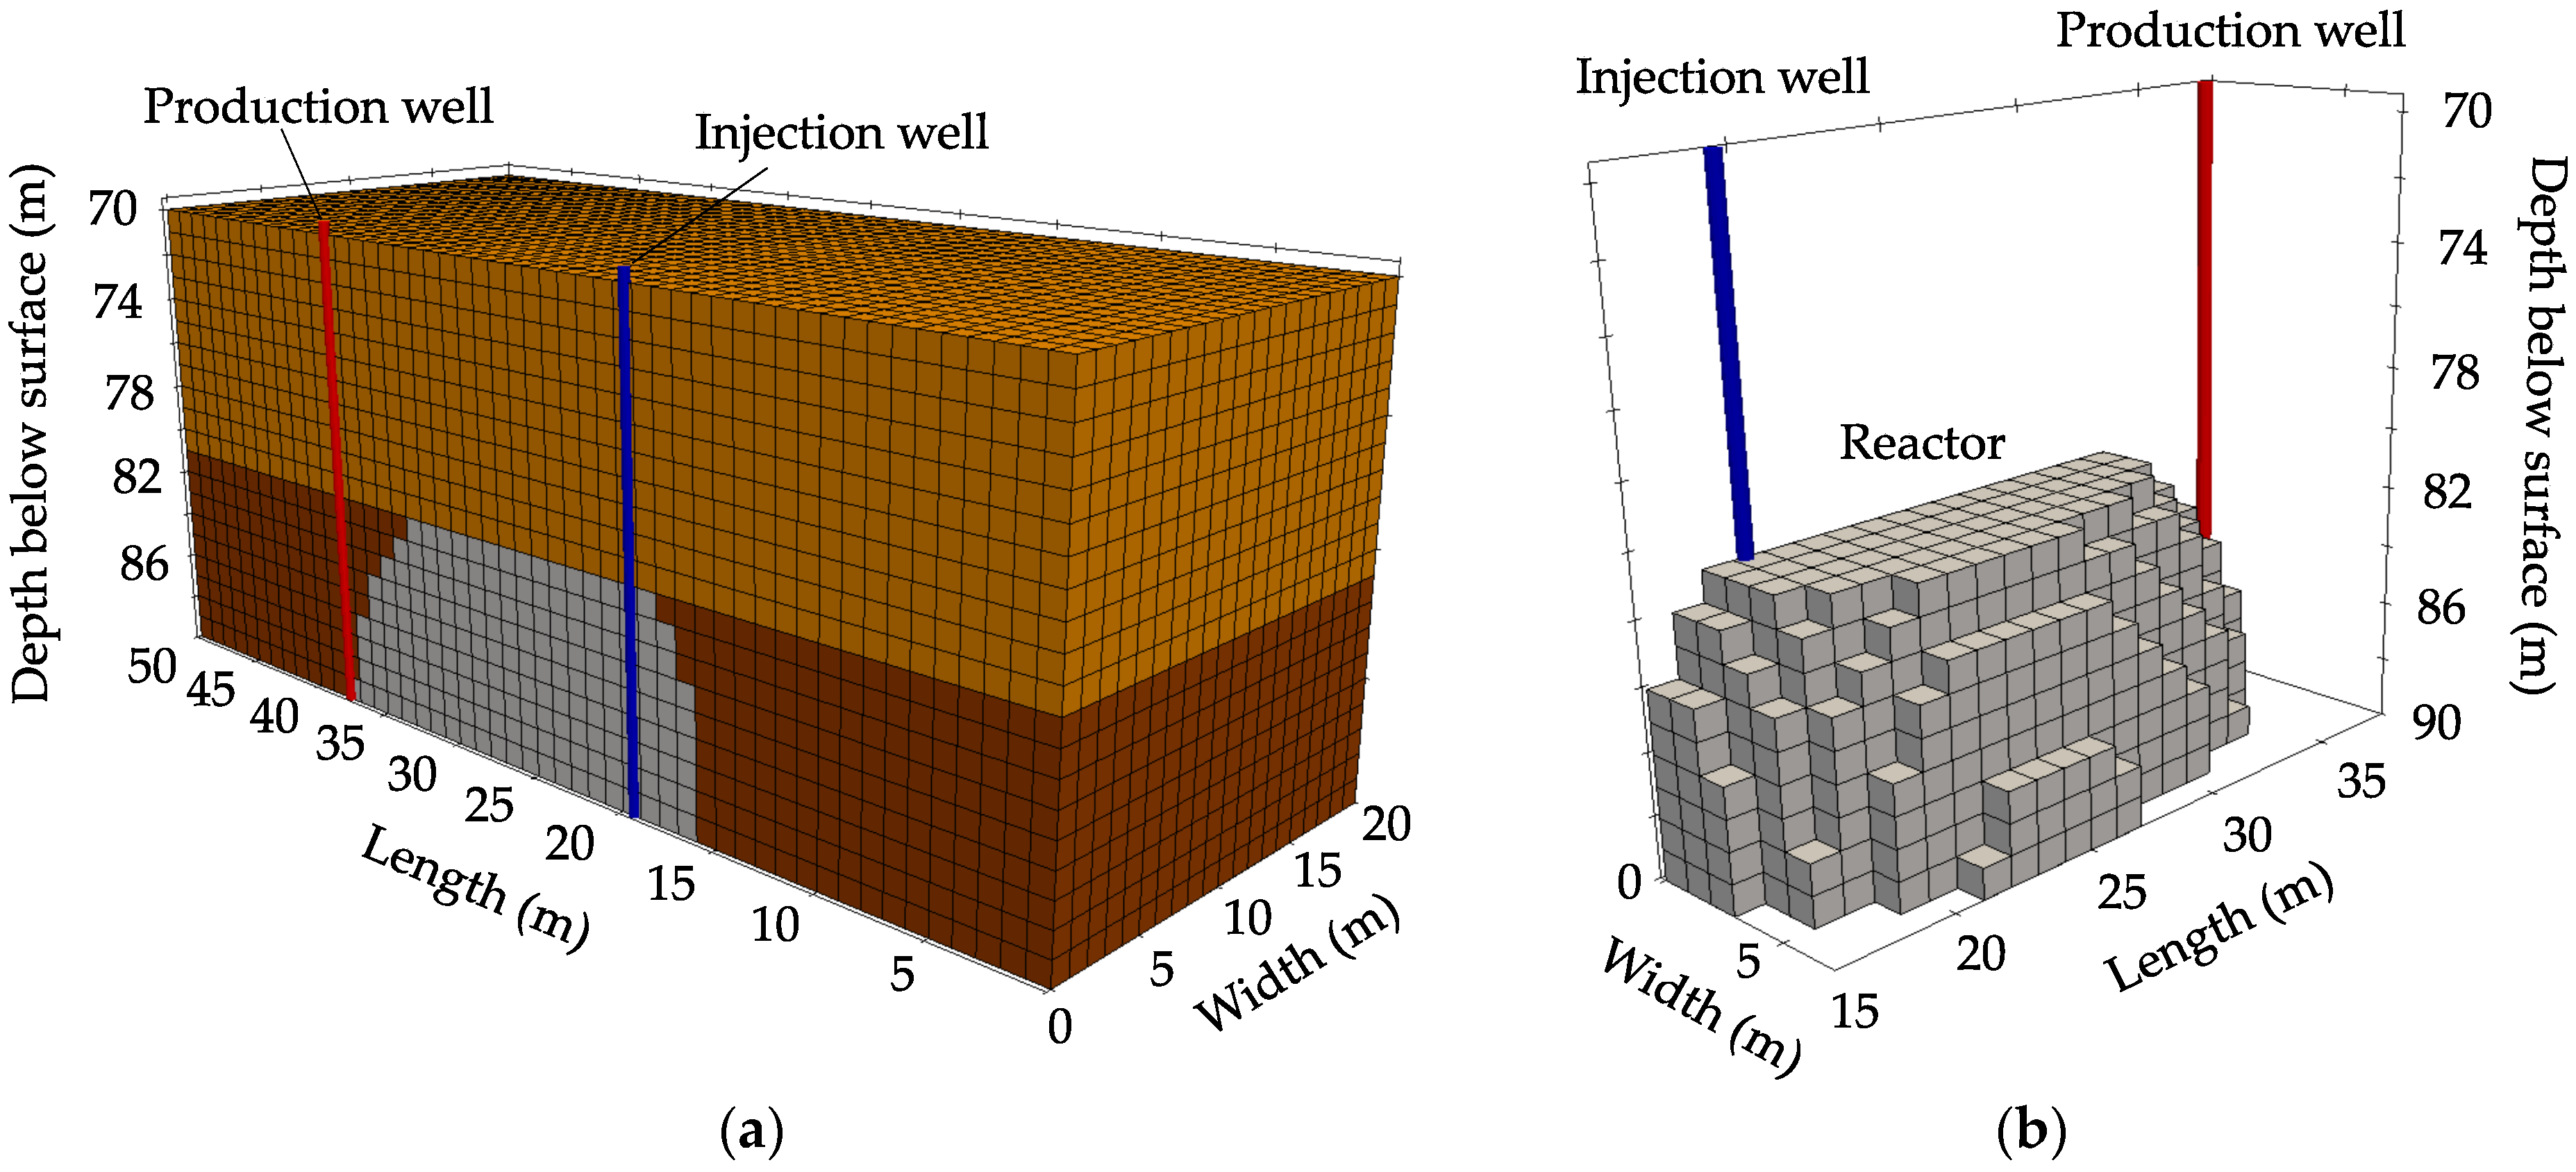
For the validation of our modeling approach, we conduct two numerical simulations and compare our results against published data on the observed water balances [27,56]. Based on comprehensive well log data as well as geological cross-sections of both field tests, two 3D thermo-hydraulic models are implemented. Due to the almost similar amount of coal consumed during both tests, Figure 1 shows the reactor dimensions at the end of operation for both field tests. Two lithological units, coal seam and overburden, are integrated into the numerical model, while a spatial model size of 50 m × 20 m × 20 m discretized by 20,000 1-m hexahedral elements is used. The model dimensions are chosen to locate the model boundaries far enough from the reactor boundaries to avoid hydraulic boundary effects that would compromise the simulation results. Grid discretization is adopted to maintain an optimum balance between the required computational time and the accuracy of the modeling results. For that purpose, the implemented model size and grid dimensions were optimized by sensitivity analyses, which are not discussed here due to the limited scientific interest.
The implemented numerical model makes use of the UCG reactor symmetry along its vertical axis, assuming that a symmetric tear-drop shaped reactor growth along the link between the injection and production well develops with increasing operational time, whereby the areal sweep contours of the reactor are derived from Levie et al. [57]. Table 1 shows the model parameters used in the simulations of both field tests.
Hydraulic heads of 47 m (0.462 MPa) and 22 m (0.221 MPa) at the coal seam base are used in the Hanna and Hoe Creek simulations, indicating that both field tests were undertaken in the water-saturated zone [55]. In both cases, relative permeability has to be considered in the prediction and evaluation of multiphase flow processes, since two-phase flow conditions develop due to the emerging water vapor phase at the calculated in situ pressures and temperatures. In different literature, heat transfer [62,63,64], liquid phase (), and gas phase relative permeabilities () are typically modeled as a function of liquid saturation ():
Relative permeability functions derived from Zhang et al. [65] were tested in this context for the coal seam layer but show only a negligible effect on the water flow calculations in our models. Taking this finding into account and aiming at improving numerical convergence, we assume that the relative permeability functions given in Equations (8) and (9) are valid for both lithological layers, while capillary pressure effects can be neglected. For modeling purposes, Camp [55] considered the coal seams and overburden layers at both sites to represent horizontal aquifers of infinite radial extent with isotropic permeabilities, vertically embedded in impermeable strata. Therefore, our lateral model boundaries are assumed to be open for fluid flow (Dirichlet boundary conditions with constant head), while the bottom boundary is closed for fluid flow (Neumann boundary condition), and the model top boundary uses Cauchy boundary conditions to represent a boundary closed for fluid flow, respecting the site-specific overburden aquifer thickness. After achieving hydraulic equilibrium, the simulations start with a time step size of 0.1 days in the Hanna (simulation time of 25 days in total) and Hoe Creek models (simulation time of 58 days in total), respectively. Considering the time-dependent coal consumption in each field test, we have integrated a reactor growth model with our simulation runs to account for the increasing interface between the reactor and its adjacent coal and rocks. In this context, constant linear pressure and temperature gradients (Dirichlet boundary conditions) derived from operational data [58] are assigned to grid elements representing the UCG reactor, spatially increasing with each time step (Figure 2). Due to the lack of temperature data for the Hoe Creek field test, a constant temperature of 600 °C [66] is applied here instead. Permeabilities were fitted for each layer for both field tests individually; the findings are discussed in the following section. The Camp [55] model data have been time-corrected (time shift of about −3 days), using the operational pressure records [58].
3.4. Model Validation Results and Discussion
Our simulation results plotted in Figure 2 show the pressure dependency of the water in- and outflow (black) during the 25-day UCG operation at Hanna. Here, low horizontal and vertical coal seam permeabilities of 5 and 2 mD were implemented, respectively. The overburden, characterized by low-permeable sandstones is assigned with the same values. During the first ten days of the test, the reactor pressure is below the hydrostatic pressure, resulting in a flow of groundwater into the reactor at a rate of up to 3 m3/day. With the increase of reactor pressure above the aquifer pressure, the pressure gradient is reversed in the aquifer direction and water flow out of the reactor occurs. The maximum observed peak in reactor pressure of about 0.65 MPa after 15 days leads to the highest simulated outflow of up to 4 m3/day. Comparing our simulation results against the data in the literature exhibits a very good agreement, whereby a qualitative correlation between reactor pressure and water flows becomes obvious (Figure 2). Figure 3 shows the pressure history and simulation results on water in- and outflow for the 58-day Hoe Creek field test in comparison with the data in the literature. A higher coal seam permeability of 100 mD in the horizontal and 20 mD in the vertical direction, derived from simulations undertaken for history-matching permeability, results in a very good agreement of our Hoe Creek simulation results with the published data [55]. According to Stone and Snoeberger [67], most horizontal permeability measurements reported values between 225 and 408 mD. Therefore, an average value of 350 mD is used in Camp’s model [55]. However, this high permeability is not confirmed by our best-fit permeability derived from history-matching. An overburden permeability with 120 mD in the horizontal and 22 mD in the vertical direction is applied in our model, following Buscheck et al. [17]. Potential explanations for the deviation in coal seam permeability between our best-fit model and the Camp data [55] are discussed below.
The reactor pressure during UCG operation was maintained below the hydraulic pressure, so that the Hoe Creek II field test is mainly characterized by water flow into the reactor. The water inflow rate is significantly higher than for the Hanna test, reaching up to 28 m3/day. Only a short phase of water outflow of up to 8 m3/day was determined at days eight to eleven, while water outflow for this field test does not occur in the literature data for the reasons discussed above.
The deviation of the calculated inflow values from the literature data mainly results from the following aspects. First, we allow hydraulic pressure to vary in the coal seam and the overburden aquifers during UCG operation. In contrast, Camp [55] assumed a constant hydraulic coal seam aquifer pressure in his model. The simplified cylindrical geometry used by Camp [55] exposes a smaller contact surface between the cylindrical reactor and its adjacent rocks, compared to the tear-drop reactor shape geometry used in our modeling approach. Also, we consider the observed reactor temperature as an inner boundary condition derived from the operational data, whereas the non-isothermal effects are neglected in the modeling done by Camp [55]. Furthermore, we implemented the observed pressure history in 0.1-day steps for both field tests instead of using daily-averaged data as Camp [55] did. For instance, the pressure drop we determined in the Hanna simulation at day ten cannot be faithfully reproduced in his model. As a result, Camp’s calculated inflow into the reactor is lower than in our simulation results. Due to the lack of published reactor pressure data for the Hoe Creek field test, we considered the pressure history provided by Camp’s model documentation [55], which in turn may have reduced the quality of our match due to its one-day resolution in time. Finally, the best match of water inflow was achieved with 100 mD horizontal coal seam permeability for the Hoe Creek field test, whereas the literature data exhibits permeabilities between 225 and 408 mD at the Hoe Creek I site [67]. The target coal seams (Felix No. 2) at Hoe Creek sites I and II are characterized by a highly anisotropic permeability tensor [67], whereby most hydraulic tests were undertaken at Hoe Creek site I. Here, the principal permeability tensor axes of the target coal seam correspond with the orientation of two sets of near-vertical fractures, which are likely to impose a high local permeability. Hence, hydraulic coal seam characteristics can be expected to vary substantially between the Hoe Creek sites I and II.
We conclude from this modeling exercise, using geological and operational data from two UCG field trials differing in terms of their duration and hydrogeological boundary conditions, that our modeling approach is capable of reflecting the most important non-isothermal multiphase flow processes required to calculate UCG reactor water balances. Thus, our modeling approach provides the required features to assess steam jacket dynamics in UCG.
4. Effect of Reactor Pressure and Coal Seam Permeability on Steam Jacket Dynamics
Usually, UCG operators aim at maintaining a small but nonetheless positive water inflow from the surrounding coal seam and overburden into the reactor to limit gas and heat losses and especially the leakage of UCG by-products, which may have potential environmental impacts such as groundwater contamination [1,31]. The water inflow rate can be managed by adjusting the reactor operating pressure, determined by the injection and production wellhead pressures. Further, water flow behavior in the reactor vicinity is subject to multiphase flow processes, including steam jacket formation (regions with gas saturation > 0). Due to relative permeability effects, the steam jacket can effectively retard fluid flow into the reactor and at the same time limit fluid leakage out of the reactor, and hence an understanding of steam jacket formation is substantial for efficient and sustainable UCG operation in terms of optimizing the synthesis gas quality and minimizing environmental impacts.
4.1. Numerical Model Geometry, Initial and Boundary Conditions
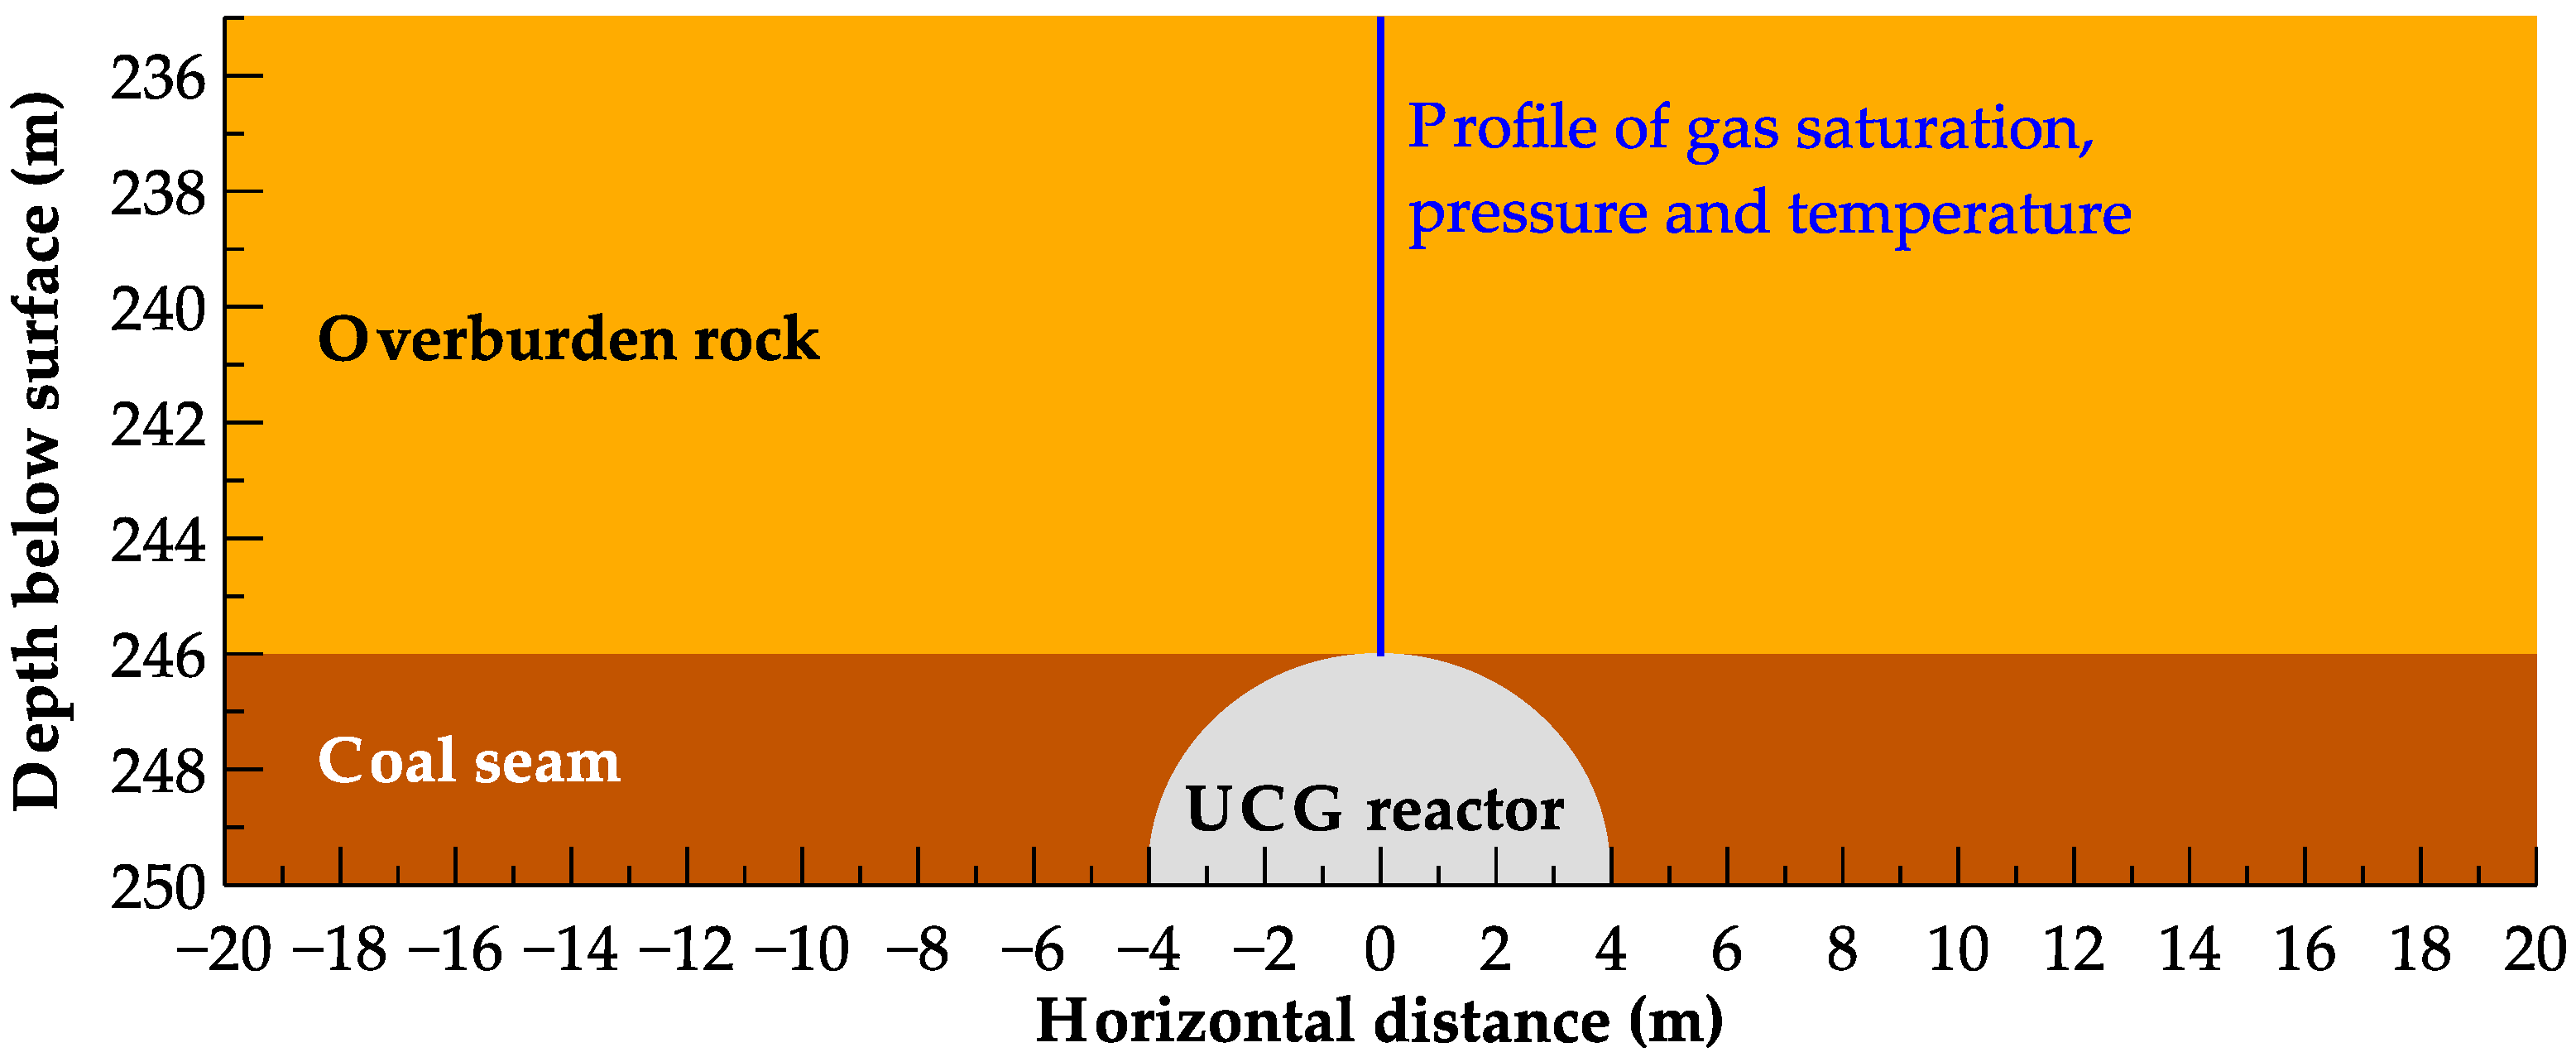
A 2D numerical model is employed to analyze the thermo-hydraulic behavior, in particular the steam jacket dynamics in the UCG reactor vicinity. For that purpose, we carry out twelve different multiphase flow simulations with simulation times of 30 days each. Thereby, different reactor pressures (5% and 1% above as well as 1% and 5% below hydrostatic pressure, respectively) and coal seam permeabilities (1, 10, and 100 mD) are tested. The permeability of the implemented overburden sandstone (50 mD) is maintained constant in all simulations to focus on the effect of coal seam permeability only. The chosen model size and grid discretization are adapted according to the aforementioned grid and boundary condition criteria. Spatial model size is 40 m in width and 15 m in height, comprising two lithological units discretized by about 9600 hexahedron elements with edge sizes of 0.25 m (Figure 4). The model represents a 2D geological cross-section of a synthetic radial-symmetric UCG reactor with a coal seam thickness of 4 m, located at a depth of 250 m below the surface. In the present simulation runs, a static reactor shape with a radius of 4 m is used to represent the final reactor dimensions at the end of UCG operation (Figure 4). All data applied in the thermo-hydraulic model are compiled in Table 2, derived from literature data [19] and maintained constant for the lithological units during the entire simulation time. Hydrogeological sandstone properties are implemented for the overburden lithology [19].
Identical assumptions to those made for the previously introduced 3D models were considered with regard to relative permeabilities and capillary pressures. The lateral model boundaries were assumed to be open for fluid flow (Dirichlet boundary condition), whereas the top and bottom boundaries were closed for fluid flow (Neumann boundary condition). Following the Hoe Creek simulation implementation, a constant temperature of 600 °C was applied at the reactor elements, whereby the in situ temperature was set to 20 °C at all other elements.
4.2. Steam Jacket Dynamics in the UCG Reactor Vicinity
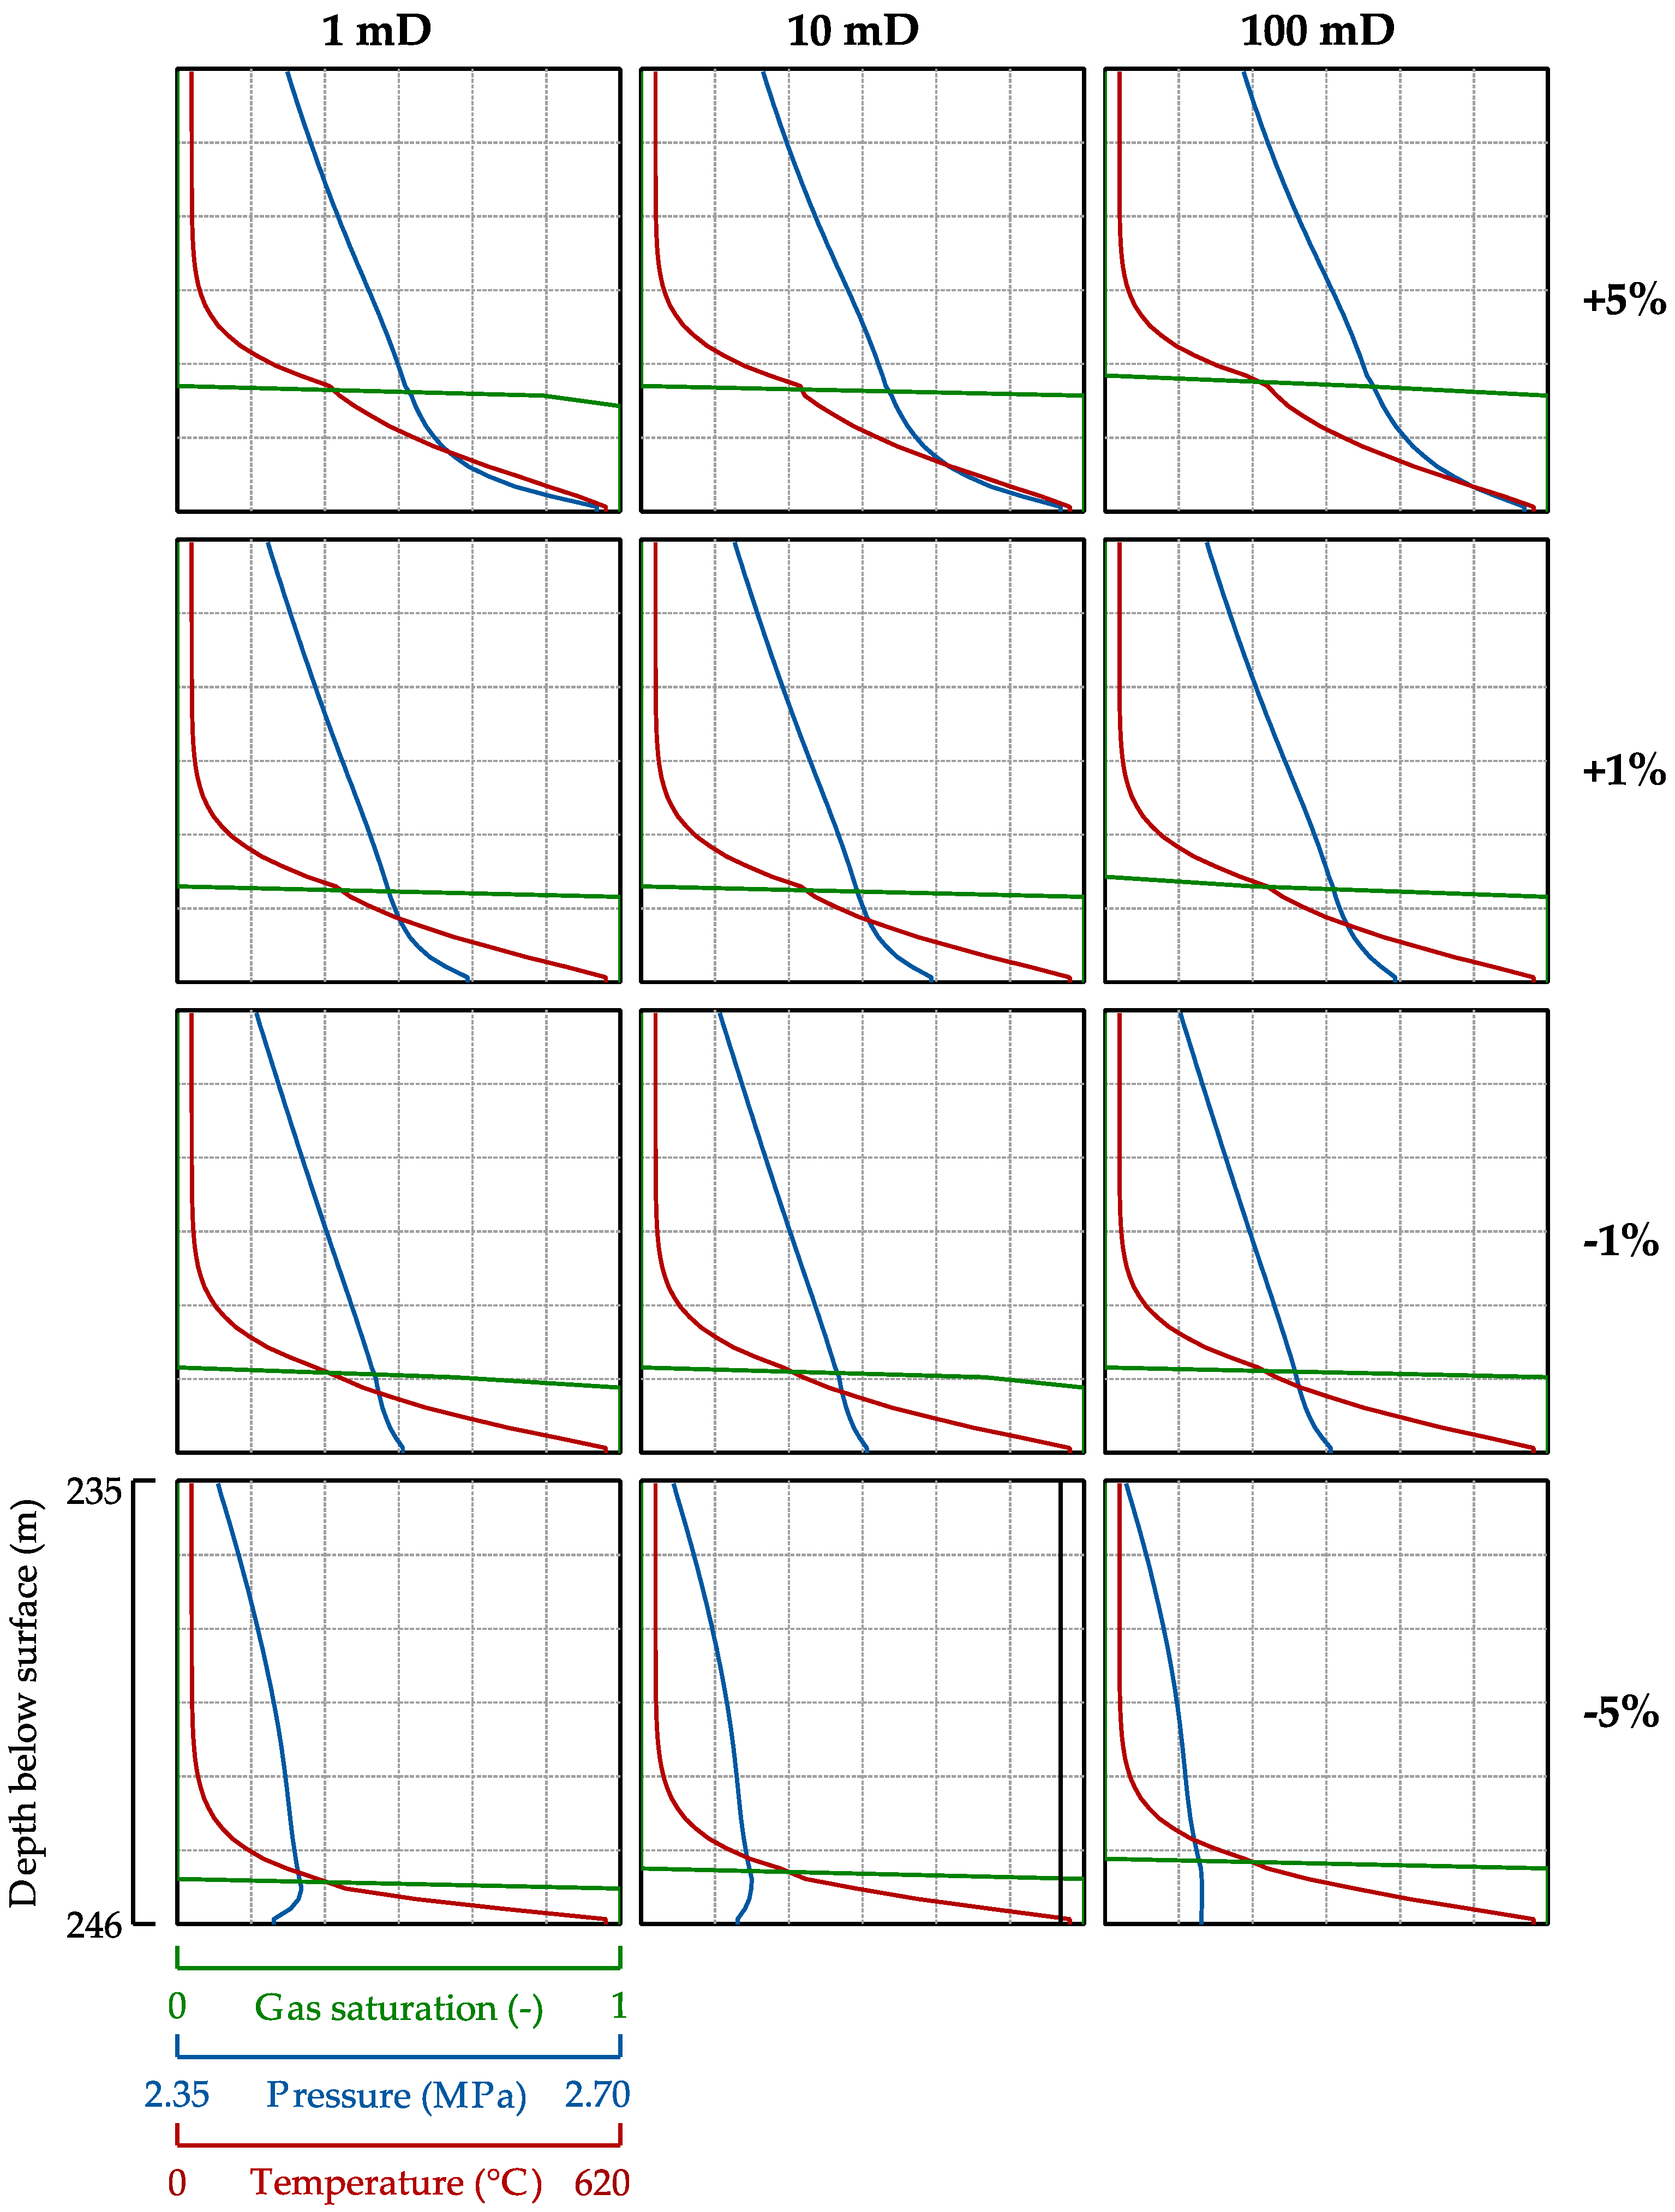
Figure 5 shows the calculated maximum steam jacket extents at constant reactor pressure variations by +1% and +5% (top) as well as −1% and −5% (bottom) relative to the initial hydrostatic pressure at the coal seam top after 30 days of simulation. Hereafter, we only refer by +5% and +1% (for supra-hydrostatic pressures) as well as −1% and −5% (sub-hydrostatic pressures) to the hydraulic pressure regimes.
For each of these reactor pressure-driven scenarios, the effects of coal seam permeability on the spatial steam jacket extent are calculated for 1, 10, and 100 mD. The resulting water in- and outflows for each scenario, scaled to 1-m UCG reactor length are shown in Figure 6. The comparison of the steam jacket extents around the UCG reactor exhibits their strong dependency on the reactor pressure. In vertical directions, these differ by about 1 m only due to the constant overburden permeability (50 mD in horizontal direction). For the +5% scenario, a maximum steam jacket extent of up to 3.5 m in the vertical and 8 m in the horizontal direction is observed for a coal seam permeability scenario of 100 mD. The lower the coal seam permeability, the lower the horizontal steam jacket extent, with 2 m for 10 mD and 1 m for 1 mD in the +5% scenario. The +1% scenario generates a maximum horizontal steam jacket extent of up to 3.5 m for a 100 mD permeability. Differences in the horizontal steam jacket extent for the +1% scenario are considerably lower (maximum of 0.25 m) for the coal seam permeabilities of 10 mD and 1 mD. In both scenarios, the maximum steam jacket extent is in the range of up to one meter. The slightly flattened shapes around the reactor result from the difference in permeabilities between the coal seam and the overburden as well as the horizontal-to-vertical permeability anisotropy. High temperatures at the reactor boundary induce steam jacket formation, even if the reactor pressure is operated below the hydrostatic one. Here, water inflow into the reactor (Figure 6) reduces the spatial steam jacket extent, whereby it is limited to a maximum of 1 m in the horizontal direction in all sub-hydrostatic reactor pressure-driven simulation scenarios. Varying coal seam permeabilities to 1, 10, and 100 mD shows that higher permeabilities result in higher water inflows (Figure 6), and thus a marginally lower spatial steam jacket extent at the coal seam base for the −1% and −5% scenarios (Figure 5).
With decreasing depth, hydrostatic pressure decreases, while the reactor pressure is assumed to be constant during the entire simulation time. Therefore, the driving force for water inflow provided by the pressure gradient wanes towards the reactor top and results in local supra-hydrostatic pressure. This becomes apparent in the inverse trend of the steam jacket extent at the height of the transition between coal seam and overburden. For the −5% reactor pressure assumption, the horizontal steam jacket extent in the 100-mD permeability scenario is smaller than that in the 10-mD one due to higher horizontal inflow rates at these depths (Figure 6).
However, in the overburden, the steam jacket extends farther in the 100-mD permeability scenario compared to the 10-mD one. This behavior is observed for all scenarios running at supra-hydrostatic reactor pressures. Hence, higher permeabilities in the coal seam as well as slightly supra-hydrostatic pressures at the reactor top result in a greater steam jacket extent in the vertical than in the horizontal direction for all sub-hydrostatic scenarios. The maximum vertical extent of the steam jacket above the reactor reaches about 1.1 m for the −5% and 2 m for the −1% scenario. As expected, the simulation results on water in- and outflow, scaled to 1-m reactor length, show relatively constant water flows in all investigated scenarios (Figure 6). The maximum steam jacket extent is reached (see Figure 5) with a highest outflow rate of up to about 1 m3/day and about 0.8 m3/day in average in the +5% scenario with 100 mD permeability. For all the scenarios with +5% reactor pressure, the outflow is limited to a maximum rate of about 0.4 m3/day due to the low coal seam permeability. If any, only low flow rates are observed in the +1% pressure scenarios. Almost reverse flow rates are observed in the sub-hydrostatic scenarios, with a maximum inflow rate of about 1.2 m3/day and an average inflow of about 0.8 m3/day in the 100-mD permeability and −5% reactor pressure scenario. Due to the steam jacket formation at the top of the reactor and the permeability anisotropy, the calculated inflow mainly occurs horizontally from the coal seam (not shown here).
A decrease in water outflow and increase in water inflow are observed as negative peaks at simulation times between 0.3 and 0.9 days (Figure 6, bottom). Although different in amplitude, the peak is observed in all calculated water flow rates, indicating the time of steam jacket formation above the reactor. At the time of steam jacket formation, decreasing relative permeabilities of the wetting phase at the reactor top induce a change in the hydraulic flow regime, changing from radial to mainly horizontal wetting-phase flow behavior, while the non-wetting phase (vapor) flow is generally radial, depending on the respective pressure, temperature and permeability regime.
4.3. Pressure and Temperature Variation in the Overburden Aquifer
Figure 7 shows the gas saturations, pressures, and temperatures calculated for the twelve investigated scenarios along the vertical profile given in Figure 4 at the end of the simulation time (30 days). Since overburden permeability was maintained at a constant value (50 mD), the variation of coal seam permeability has a negligible impact on gas saturation, pressure and temperature in the overburden. The thermal front (temperatures ≥ 200 °C) moves upward with the steam jacket, whereby its extent above the reactor depends on the reactor pressure as presented in Figure 5. The higher the reactor pressure, the further the steam jacket extent and associated migration of the thermal front (about 1.1 to 3.5 m). A relatively linear thermal gradient between 600 and 200 °C develops where the vapor phase (steam jacket) occurs. The discontinuity in the temperature profiles indicates the transition from the gas-rich water (vapor) to the liquid water-saturated zone, in which an exponential decrease in temperature with decreasing depth is observed due to its higher specific heat capacity and conductivity.
The reactor pressure also influences the initially hydrostatic pressure regime in the reactor’s vicinity. Figure 7 shows that in the gas-rich zone (steam jacket) and in the liquid water-saturated zone, the pressure gradient is shifted to higher values with increasing reactor pressures. Sub-hydrostatic pressure gradients develop below the liquid water-saturated zone above the reactor in the −1% and −5% scenarios, explaining the observed preferential inflow into the reactor at these depths.
5. Discussion and Conclusions
In the present study, we introduced a new modeling approach to quantify and predict steam jacket dynamics as well as water flows into and out of a UCG reactor. These processes are highly variable phenomena in time and space, depending mainly on thermal and hydrogeological coal seam and overburden properties as well as UCG operation conditions. The very good agreement between our simulation results and the U.S. field trial data indicates that the relevant physics related to non-isothermal multiphase flow processes are sufficiently reproduced by our modeling approach, validating it at the same time.
The mathematical model developed by Camp et al. [27,55,56] to assess water balances under consideration of reactor growth is limited to the special case of uniform isotropic permeability and isothermal single-phase flow. Nevertheless, that model reproduces the water flow observed at both U.S. field tests reasonably well [51], using data on time-dependent reactor pressure and coal consumption in the semi-analytical modeling approach for the spalling-enhanced drying of coal and overburden rock as well as water balance calculations. Compared to water production from coal and rock drying, water in- and outflows are relatively low for the Hanna trial [51]. This is mainly due to the low Hanna coal seam permeability (approximately 3 to 15 mD) and the moderate pressure gradients between the reactor and the overburden aquifer. For that reason, we decided to also validate our modeling approach against the Hoe Creek field test, exhibiting significantly higher permeabilities as well as water in- and outflows. Also for this field test, our simulation results are in a very good agreement with the data from the literature, emphasizing that the modeling approach is generally applicable to describe the thermo-hydraulic processes occurring in the UCG reactor vicinity. The difference between our best-fit coal seam permeability (100 mD) and Camp’s model (350 mD) is expected to arise from neglecting a hydraulically permeable overburden and isothermal flow. Deviations from the permeability documented for the Hoe Creek field site (coal permeability between 225–408 mD [67]) are likely to result from the generally high permeability heterogeneity of the target coal seam.
According to Camp and White [14], low coal and overburden permeabilities are preferable in view of limiting water flow into the UCG reactor, since spalling-enhanced drying of coal and roof rocks generally supplies sufficient water to feed an efficient gasification process. In this context, our modeling approach supports UCG operators to adjust reactor operating pressures to maintain the required water inflow and minimize potential fluid leakages out of the reactor. Further, we demonstrated that low permeability strata and low to moderate reactor pressures mitigate the spatial steam jacket extent; hence, limiting upward and lateral migration distances of UCG by-products. A lower water inflow will also reduce the water amount produced from the gasifier to the surface, minimizing the costs of synthesis gas dehydration. Our simulation results further demonstrate that the steam jacket will evolve in the lateral direction by multiple times the coal seam thickness if the reactor is operated at supra-hydrostatic pressures.
Camp and White [14] discuss that a fingering phenomena being related to upward vapor migration is rather more likely than a continuous steam jacket front advancement in highly heterogeneous coals. However, this was not observed in our simulation results due to the applied directional homogeneous permeability distribution. Modeling the development of gas fingering requires detailed knowledge on a potential spatial distribution of the coal’s dual porosity and permeability characteristics to consider the coal cleat system and potential fractures in addition to the coal matrix in our non-isothermal multiphase flow simulations. Furthermore, phase transitions occur abruptly, effectively representing a jump from fully liquid- to gas-saturated grid elements, which is in good agreement with existing publications on evaporation front movements in porous media [29,64]. A comparison of isothermal simulations without any phase transition with non-isothermal ones with phase transitions shows that neglecting non-isothermal effects results in deviations in the calculated spatial flow regimes and water balances. This is not discussed in detail here, since it is out of the scope of the present study and of limited scientific relevance for the presented results.
The prediction of steam jacket dynamics and the accompanying optimization of water balances is of substantial importance in view of optimizing the calorific synthesis gas value and designing an optimum UCG operation by balancing the steam-char reaction and heat losses due to water evaporation to achieve a maximum coal-to-synthesis gas conversion efficiency. Synthesis gas and UCG by-products will be contained within the reactor and the area of maximum steam jacket extent if operators maintain sub-hydrostatic reactor pressures. For that purpose, our thermo-hydraulic modeling approach provides an efficient method to support the design and operation of pressure monitoring in pilot- to commercial-scale UCG operations, and thus an efficient tool to tackle geological and operational uncertainties.
In summary, our modeling approach allows for a detailed quantification and prediction of steam jacket dynamics and non-isothermal multiphase flow processes in the UCG reactor vicinity, especially in view of water balances, avoiding aquifer contamination during the entire UCG operation lifecycle.
Future work aims at the integration of the coal cleat system in addition to its matrix to investigate preferential migration pathways and potential gas fingering processes, since effective coal permeability is controlled by fractures that encompass its natural cleat system and any other present fractures [31]. Moreover, thermo-mechanically-induced permeability changes in the close vicinity of the reactor will be considered in our future research activities to investigate the formation of potential leakage pathways for gas losses. In this context, the presence of high-permeable faults and their potential reactivation have also to be assessed in view of preferential leakage pathways for UCG gases.
Acknowledgments
The authors would like to thank David Camp (Lawrence Livermore National Laboratory, USA) for data provision as well as many valuable discussions on the U.S. field trial data and related modeling activities. Furthermore, we are grateful for the constructive comments provided by the three anonymous reviewers.
Author Contributions
Christopher Otto and Thomas Kempka designed research; Christopher Otto performed the research; Christopher Otto and Thomas Kempka analyzed data; and Christopher Otto and Thomas Kempka wrote the paper.
Conflicts of Interest
The authors declare no conflict of interest.
References
- Burton, E.; Friedmann, J.; Upadhye, R. Best Practices in Underground Coal Gasification; Contract No. W-7405-Eng-48; Lawrence Livermore National Laboratory: Livermore, CA, USA, 2006.
- Blinderman, M.S.; Saulov, D.N.; Klimenko, A.Y. Forward and reverse combustion linking in underground coal gasification. Energy 2008, 33, 446–454. [Google Scholar] [CrossRef]
- Couch, G. Underground Coal Gasification; CCC/151; IEA Clean Coal Centre: London, UK, 2009. [Google Scholar]
- Durucan, S.; Korre, A.; Shi, J.-Q.; Idiens, M.; Stańczyk, K.; Kapusta, K.; Rogut-Dabrowska, A.; Kempka, T.; Wolf, K.-H.; Younger, P.; et al. TOPS: Technology Options for Coupled Underground Coal Gasification and CO2 Capture and Storage. Energy Procedia 2014, 63, 5827–5835. [Google Scholar] [CrossRef]
- Nakaten, N.; Azzam, R.; Kempka, T. Sensitivity analysis on UCG–CCS economics. Int. J. Greenh. Gas Control 2014, 26, 51–60. [Google Scholar] [CrossRef]
- Kempka, T.; Fernández-Steeger, T.; Li, D.Y.; Schulten, M.; Schlüter, R.; Krooss, B.M. Carbon dioxide sorption capacities of coal gasification residues. Environ. Sci. Technol. 2011, 45, 1719–1723. [Google Scholar] [CrossRef] [PubMed]
- Nakaten, N.; Islam, R.; Kempka, T. Underground Coal Gasification with Extended CO2 Utilization—An Economic and Carbon Neutral Approach to Tackle Energy and Fertilizer Supply Shortages in Bangladesh. Energy Procedia 2014, 63, 8036–8043. [Google Scholar] [CrossRef]
- Nakaten, N.; Schlüter, R.; Azzam, R.; Kempka, T. Development of a techno-economic model for dynamic calculation of cost of electricity, energy demand and CO2 emissions of an integrated UCG–CCS process. Energy 2014, 66, 779–790. [Google Scholar] [CrossRef]
- Nakaten, N.; Kötting, P.; Azzam, R.; Kempka, T. Underground Coal Gasification and CO2 Storage Support Bulgaria’s Low Carbon Energy Supply. Energy Procedia 2013, 40, 212–221. [Google Scholar] [CrossRef]
- Humenick, M. Groundwater pollutants from underground coal gasification. Water Res. 1978, 12, 463–469. [Google Scholar] [CrossRef]
- Liu, S.; Li, J.; Mei, M.; Dong, D. Groundwater Pollution from Underground Coal Gasification. J. China Univ. Min. Technol. 2007, 17, 467–472. [Google Scholar] [CrossRef]
- Campbell, J.H.; Wang, F.T.; Mead, S.W.; Busby, J.F. Groundwater quality near an underground coal gasification experiment. J. Hydrol. 1979, 44, 241–266. [Google Scholar] [CrossRef]
- Kapusta, K.; Stańczyk, K.; Wiatowski, M.; Chećko, J. Environmental aspects of a field-scale underground coal gasification trial in a shallow coal seam at the Experimental Mine Barbara in Poland. Fuel 2013, 113, 196–208. [Google Scholar] [CrossRef]
- Camp, D.W.; White, J.A. Underground Coal Gasification: An Overview of Groundwater Contamination Hazards and Mitigation Strategies; Report No.: LLNL-TR-668633; Lawrence Livermore National Laboratory: Livermore, CA, USA, 2015.
- Klebingat, S.; Kempka, T.; Schulten, M.; Azzam, R.; Fernandez-Steeger, T.M. Innovative thermodynamic underground coal gasification model for coupled synthesis gas quality and tar production analyses. Fuel 2016, 183, 680–686. [Google Scholar] [CrossRef]
- Akbarzadeh Kasani, H.; Chalaturnyk, R.J. Coupled reservoir and geomechanical simulation for a deep underground coal gasification project. J. Nat. Gas Sci. Eng. 2017, 37, 487–501. [Google Scholar] [CrossRef]
- Buscheck, T.; Hao, Y.; Morris, J.P.; Burton, E. Thermal-Hydrological Sensitivity Analysis of Underground Coal Gasification. In Proceedings of the 2009 International Pittsburgh Coal Conference, Pittsburgh PA, USA, 5–8 October 2009; p. 8. [Google Scholar]
- Najafi, M.; Jalali, S.M.E.; KhaloKakaie, R.; Forouhandeh, F. Prediction of cavity growth rate during underground coal gasification using multiple regression analysis. Int. J. Coal Sci. Technol. 2015, 2, 318–324. [Google Scholar] [CrossRef]
- Otto, C.; Kempka, T. Thermo-Mechanical Simulations of Rock Behavior in Underground Coal Gasification Show Negligible Impact of Temperature-Dependent Parameters on Permeability Changes. Energies 2015, 8, 5800–5827. [Google Scholar] [CrossRef]
- Sury, M.; White, M.; Kirton, J.; Carr, P.; Woodbridge, R. Review of Environmental Issues of Underground Coal Gasification; Report No.: COAL R272 DTI/Pub URN 04/1880WS; Atkins Consultants Ltd.: Surrey, UK; University of Liège Belgium: Liège, Belgium; FWS Consultants Ltd.: Spennymoor, UK, 2004; pp. 1–126. [Google Scholar]
- Sarraf Shirazi, A.; Karimipour, S.; Gupta, R. Numerical Simulation and Evaluation of Cavity Growth in In Situ Coal Gasification. Ind. Eng. Chem. Res. 2013, 52, 11712–11722. [Google Scholar] [CrossRef]
- Morris, J.; Buscheck, T.; Hao, Y. Coupled Geomechanical Simulations of UCG Cavity Evolution. In Proceedings of the 2009 International Pittsburgh Coal Conference, Pittsburgh, PA, USA, 20–23 September 2009; p. 11. [Google Scholar]
- Otto, C.; Kempka, T. Thermo-mechanical Simulations Confirm: Temperature-dependent Mudrock Properties are Nice to have in Far-field Environmental Assessments of Underground Coal Gasification. Energy Procedia 2015, 76, 582–591. [Google Scholar] [CrossRef]
- Otto, C.; Kempka, T.; Kapusta, K.; Stańczyk, K. Fault Reactivation Can Generate Hydraulic Short Circuits in Underground Coal Gasification—New Insights from Regional-Scale Thermo-Mechanical 3D Modeling. Minerals 2016, 6, 101. [Google Scholar] [CrossRef]
- Akbarzadeh, H.; Chalaturnyk, R.J. Structural changes in coal at elevated temperature pertinent to underground coal gasification: A review. Int. J. Coal Geol. 2014, 131, 126–146. [Google Scholar] [CrossRef]
- Akbarzadeh, H.; Chalaturnyk, R.J. Coupled Fluid-Thermal-Mechanical Analyses of a Deep Underground Coal Gasification Cavity. Quest J. J. Archit. Civ. Eng. 2013, 1, 1–14. [Google Scholar]
- Krantz, W.B.; Camp, D.W.; Gunn, R.D. A Water-Influx Model for UCG. In Proceedings of the Sixth Underground Coal Conversion Symposium, Afton, OK, USA, 13–17 July 1980; pp. 21–31. [Google Scholar]
- Shafirovich, E.; Varma, A. Underground Coal Gasification: A Brief Review of Current Status. Ind. Eng. Chem. Res. 2009, 35, 7865–7875. [Google Scholar] [CrossRef]
- Saulov, D.N.; Plumb, O.A.; Klimenko, A.Y. Flame propagation in a gasification channel. Energy 2010, 35, 1264–1273. [Google Scholar] [CrossRef]
- Blinderman, M.S.; Jones, R.M. The Chinchilla IGCC Project to Date: Underground Coal Gasification and Environment. Proceedings of Gasification Technologies Conference, San Francisco, CA, USA, 27–30 October 2002. [Google Scholar]
- Perkins, G.; Love, G. Commercialisation of Underground Coal Gasification. In Proceedings of the Chemeca 2010: Engineering at the Edge Conference, Adelaide, Australia, 26–29 September 2010; p. 12. [Google Scholar]
- McKee, C.R.; Santoro, R.D. Gas Leakage and Water Influx from In Situ Coal Gasification; Report No. DE-AP-20-80-LC00193; Department of Energy, Laramie Energy Technology Center: Laramie, WY, USA, 1980. [Google Scholar]
- Nitao, J.J.; Camp, D.W.; Buscheck, T.A.; White, J.A.; Burton, G.C.; Wagoner, J.L.; Chen, M. Progress on a New Integrated 3-D UCG Simulator and its Initial Application. In Proceedings of the International Pittsburgh Coal Conference, Pittsburgh, PA, USA, 12–15 September 2011; p. 13. [Google Scholar]
- Akbarzadeh, H.; Chalaturnyk, R.J. Sequentially coupled flow-geomechanical modeling of underground coal gasification for a three-dimensional problem. Mitig. Adapt. Strateg. Glob. Chang. 2014, 21, 577–594. [Google Scholar] [CrossRef]
- Sarhosis, V.; Yang, D.; Sheng, Y.; Kempka, T. Coupled Hydro-thermal Analysis of Underground Coal Gasification Reactor Cool Down for Subsequent CO2 Storage. Energy Procedia 2013, 40, 428–436. [Google Scholar] [CrossRef]
- Yang, D.; Koukouzas, N.; Green, M.; Sheng, Y. Recent development on underground coal gasification and subsequent CO2 storage. J. Energy Inst. 2016, 89, 469–484. [Google Scholar] [CrossRef]
- Khan, M.; Mmbaga, J.; Shirazi, A.; Trivedi, J.; Liu, Q.; Gupta, R. Modelling Underground Coal Gasification—A Review. Energies 2015, 8, 12603–12668. [Google Scholar] [CrossRef]
- Afanasyev, A.A. Application of the reservoir simulator MUFITS for 3D modlling of CO2 Storage in geological formations. Energy Procedia 2013, 40, 365–374. [Google Scholar] [CrossRef]
- Afanasyev, A.A. Hydrodynamic Modelling of Petroleum Reservoirs using Simulator MUFITS. Energy Procedia 2015, 76, 427–435. [Google Scholar] [CrossRef]
- Afanasyev, A.A.; Kempka, T.; Kühn, M.; Melnik, O. Validation of the MUFITS Reservoir Simulator Against Standard CO2 Storage Benchmarks and History-matched Models of the Ketzin Pilot Site. Energy Procedia 2016, 97, 395–402. [Google Scholar] [CrossRef]
- Afanasyev, A.A. Simulation of the properties of a binary carbon dioxide-water mixture under sub- and supercritical conditions. High Temp. 2012, 50, 340–347. [Google Scholar] [CrossRef]
- Afanasyev, A.A. Multiphase compositional modelling of CO2 injection under subcritical conditions: The impact of dissolution and phase transitions between liquid and gaseous CO2 on reservoir temperature. Int. J. Greenh. Gas Control 2013, 19, 731–742. [Google Scholar] [CrossRef]
- Afanasyev, A.A.; Costa, A.A.; Chiodini, G. Investigation of hydrothermal activity at Campi Flegrei caldera using 3D numerical simulations: Extension to high temperature processes. J. Volcanol. Geotherm. Res. 2015, 299, 68–77. [Google Scholar] [CrossRef]
- Thorsness, C.B.; Cena, R.J. A UCG Process Data Base—Hoe Creek; Lawrence Livermore National Laboratory, Report No.: UCRL-84086; Lawrence Livermore National Laboratory: Berkeley, CA, USA, 1985.
- Bartke, T.C.; Fischer, D.D.; King, S.B.; Boyd, R.M.; Humphrey, A.E. Volume 1: General Information and Executive Summary. In Hanna, Wyoming Underground Coal Gasification Data Base; Morgantown Energy Technology Center and United States, Department of Energy, Office of Scientific and Technical Information: Laramie, WY, USA; 1985; p. 53. [Google Scholar]
- Barbour, F.A.; Covell, J.R. Trace Gas, Product Water, and Particulate Characterization for Rocky Mountain 1 UCG Project. In Underground Coal Gasification Test Hanna, Wyoming; Western Research Institute, University of Wyoming Research Corporation: Laramie, WY, USA, 1988; p. 105. [Google Scholar]
- Aiman, W.R.; Thorsness, C.B.; Hill, R.W.; Rozsa, R.B.; Cena, R.; Gregg, D.W.; Stephens, D.R. The Hoe Creek II Field Experiment On Underground Coal Gasification, Preliminary Results. In Proceedings of the Combustion Institute/Western States Section, Spring Meeting, Boulder, CO, USA, 17–18 April 1978; pp. 1–6. [Google Scholar]
- Campbell, G.G.; Brandenburg, C.F.; Boyd, R.M.; Sterner, T.E. Underground Coal Gasification at Hanna, Wyoming. In Proceedings of the Thermal Power Conference, Pullman, WA, USA, 15–17 October 1975; Laramie Aramie Energy Research Center Laramie: Laramie, WY, USA, 1975; p. 22. [Google Scholar]
- Fischer, D.D.; King, S.B.; Humphrey, A.E. A Report on the Successful Development of Underground Coal Gasification at Hanna, Wyoming; Energy Research and Development Administration, Laramie Energy Research Center: Laramie, WY, USA, 1975. [Google Scholar]
- Brandenburg, C.F.; Fischer, D.D.; Boyd, R.M.; King, S.B.; Humphrey, A.E. A review of LERC’s in situ coal gasification project. In Proceedings of the 3rd Annual UCC Symposium, South Lake Tahoe, CA, USA, 6–9 June 1977; pp. 66–76. [Google Scholar]
- Gunn, R.D.; Krantz, W.B. Underground Coal Gasification: Development of Theory, Laboratory Experimentation, Interpretation and Correlation with the Hanna Field Tests; Final Report: DE-AS20-80LC 10442; Department of Energy Office of Fossil Energy Morgantown Energy Technology Center: Morgantown, WV, USA, 1987. [Google Scholar]
- Bartke, T.C.; Fischer, D.D.; King, S.B.; Boyd, R.M.; Humphrey, A.E. Volume 3: The Hanna II, Phase I Field Test. In Hanna, Wyoming Underground Coal Gasification Data Base; Morgantown Energy Technology Center and United States, Department of Energy, Office of Scientific and Technical Information: Laramie, WY, USA, 1985; p. 52. [Google Scholar]
- LaFleur, D.W.; Grisak, G.E.; Stetzenbach, K.J.; Thompson, G.M. Evaluation of the Porosity of the Hanna No. 1 Coal Seam; Final Report: DE-AS2D-83LC10987; Department of Energy Laramie Energy Technology Center: Laramie, WY, USA, 1984. [Google Scholar]
- Nordin, J.S. Review of Information and Data Relevant to the Hoe Creek Underground Coal Gasification Site Restoration. In Western Research Institute, the University of Wyoming Research Coporation; Western Research Institute, The University of Wyoming Research Corporation: Laramine, WY, USA, 1992; Volume WRI-92-R01, p. 68. [Google Scholar]
- Camp, D.W. A model of Water Influx for Underground Coal Gasification. Master’s Thesis, University of Colorado, Boulder, CO, USA, 1980. [Google Scholar]
- Camp, D.W.; Krantz, W.B.; Gunn, R.D. A Water-Influx Model for UCG with Spalling-Enhanced Drying. In Proceedings of the 15th Intersociety Energy Conversion Engineering Conference, Seattle, WA, USA, 18–22 August 1980; p. 8. [Google Scholar]
- Levie, B.E.; Krantz, W.B.; Camp, D.W.; Gunn, R.D. Application of the Spalling-Enhanced-Drying Model in Predicting Cavity Geometry and Operating Strategy for the Hanna 2, Phase 2 UCG Field Test. In Proceedings of the Seventh Annual Underground Coal Conversion Symposium, Fallen Leaf Lake, CA, USA, 8–11 September 1980. [Google Scholar]
- Bartke, T.C.; Fischer, D.D.; King, S.B.; Boyd, R.M.; Humphrey, A.E. Volume 4: The Hanna II, Phase II and III Field Test. In Hanna, Wyoming Underground Coal Gasification Data Base; Morgantown Energy Technology Center and United States, Department of Energy, Office of Scientific and Technical Information: Laramie, WY, USA, 1985; p. 62. [Google Scholar]
- Boysen, J.E. Daily Material and Energy Balances for the Hanna Field Tests; Report: LETC Internal Document; Department of Energy Laramie Energy Technology Center: Laramie, WY, USA, 1978. [Google Scholar]
- Gunn, R.D. Material Balance: Its Applications and Mis-applications in Underground Coal Gasification; Report, LETC/RI-79105; Laramie Energy Technology Center: Laramie, WY, USA, 1979. [Google Scholar]
- Min, O.K. Finite Element Modeling of Thermo-Mechanical Responses Associated with Underground Coal Conversion. Ph.D. Thesis, Ohio State University, Columbus, OH, USA, 1983. [Google Scholar]
- Pakala, V.K.C. Evaporation Fronts in Porous Media. Ph.D. Thesis, Department of Mechanical Engineering, University of Wyoming, Laramie, WY, USA, 2012. [Google Scholar]
- Catton, H.; Lee, S. Two-Phase Flow in Porous Medium. In Proceedings of the ASME/JSME Thermal Engineering Joint Conference, Honolulu, HI, USA, 22–27 March 1987; Marto, P.J., Tanasawa, I., Eds.; Volume 2, pp. 333–341. [Google Scholar]
- Plumb, O.A.; Klimenko, A.Y. The Stability of Evaporating Fronts in Porous Media. J. Porous Media 2010, 13, 145–155. [Google Scholar] [CrossRef]
- Zhang, J.; Feng, Q.; Zhang, X.; Wen, S.; Zhai, Y. Relative Permeability of Coal: A Review. Transp. Porous Media 2015, 106, 563–594. [Google Scholar] [CrossRef]
- Lee, S.C. Computational Method for Thermoviscoelasticity with Application to Rock Mechanics. Ph.D. Thesis, Ohio State University, Columbus, OH, USA, 1984. [Google Scholar]
- Stone, R.; Snoeberger, D.F. Evaluation of the Native Hydraulic Characteristics of the Felix Coal (Eocene, Wasatch Formation) and Associated Strata, Hoe Creek Site, Campbell County, Wyoming; Report: UCRL-51992; Lawrence Livermore Laboratory: Livermore, CA, USA, 1976. [Google Scholar]
Figure 1.
Cross-section of the employed numerical model grid with two lithological units (dark brown: coal seam; light brown: overburden) and the UCG reactor (grey) (a); Cross-section view of the spatial UCG reactor dimensions at the end of operation (b).
Figure 1.
Cross-section of the employed numerical model grid with two lithological units (dark brown: coal seam; light brown: overburden) and the UCG reactor (grey) (a); Cross-section view of the spatial UCG reactor dimensions at the end of operation (b).

Figure 2.
Simulation results of water in- and outflow at Hanna (solid black line) in comparison with the data in the literature (dashed black line) [27,55,56] show very good agreement and exhibit a strong pressure-dependency (blue line) [58] of the calculated water in- and outflows. Reactor pressure and temperature (red line) [58] are applied at all reactor elements as inner boundary conditions. Water outflow is positive here.
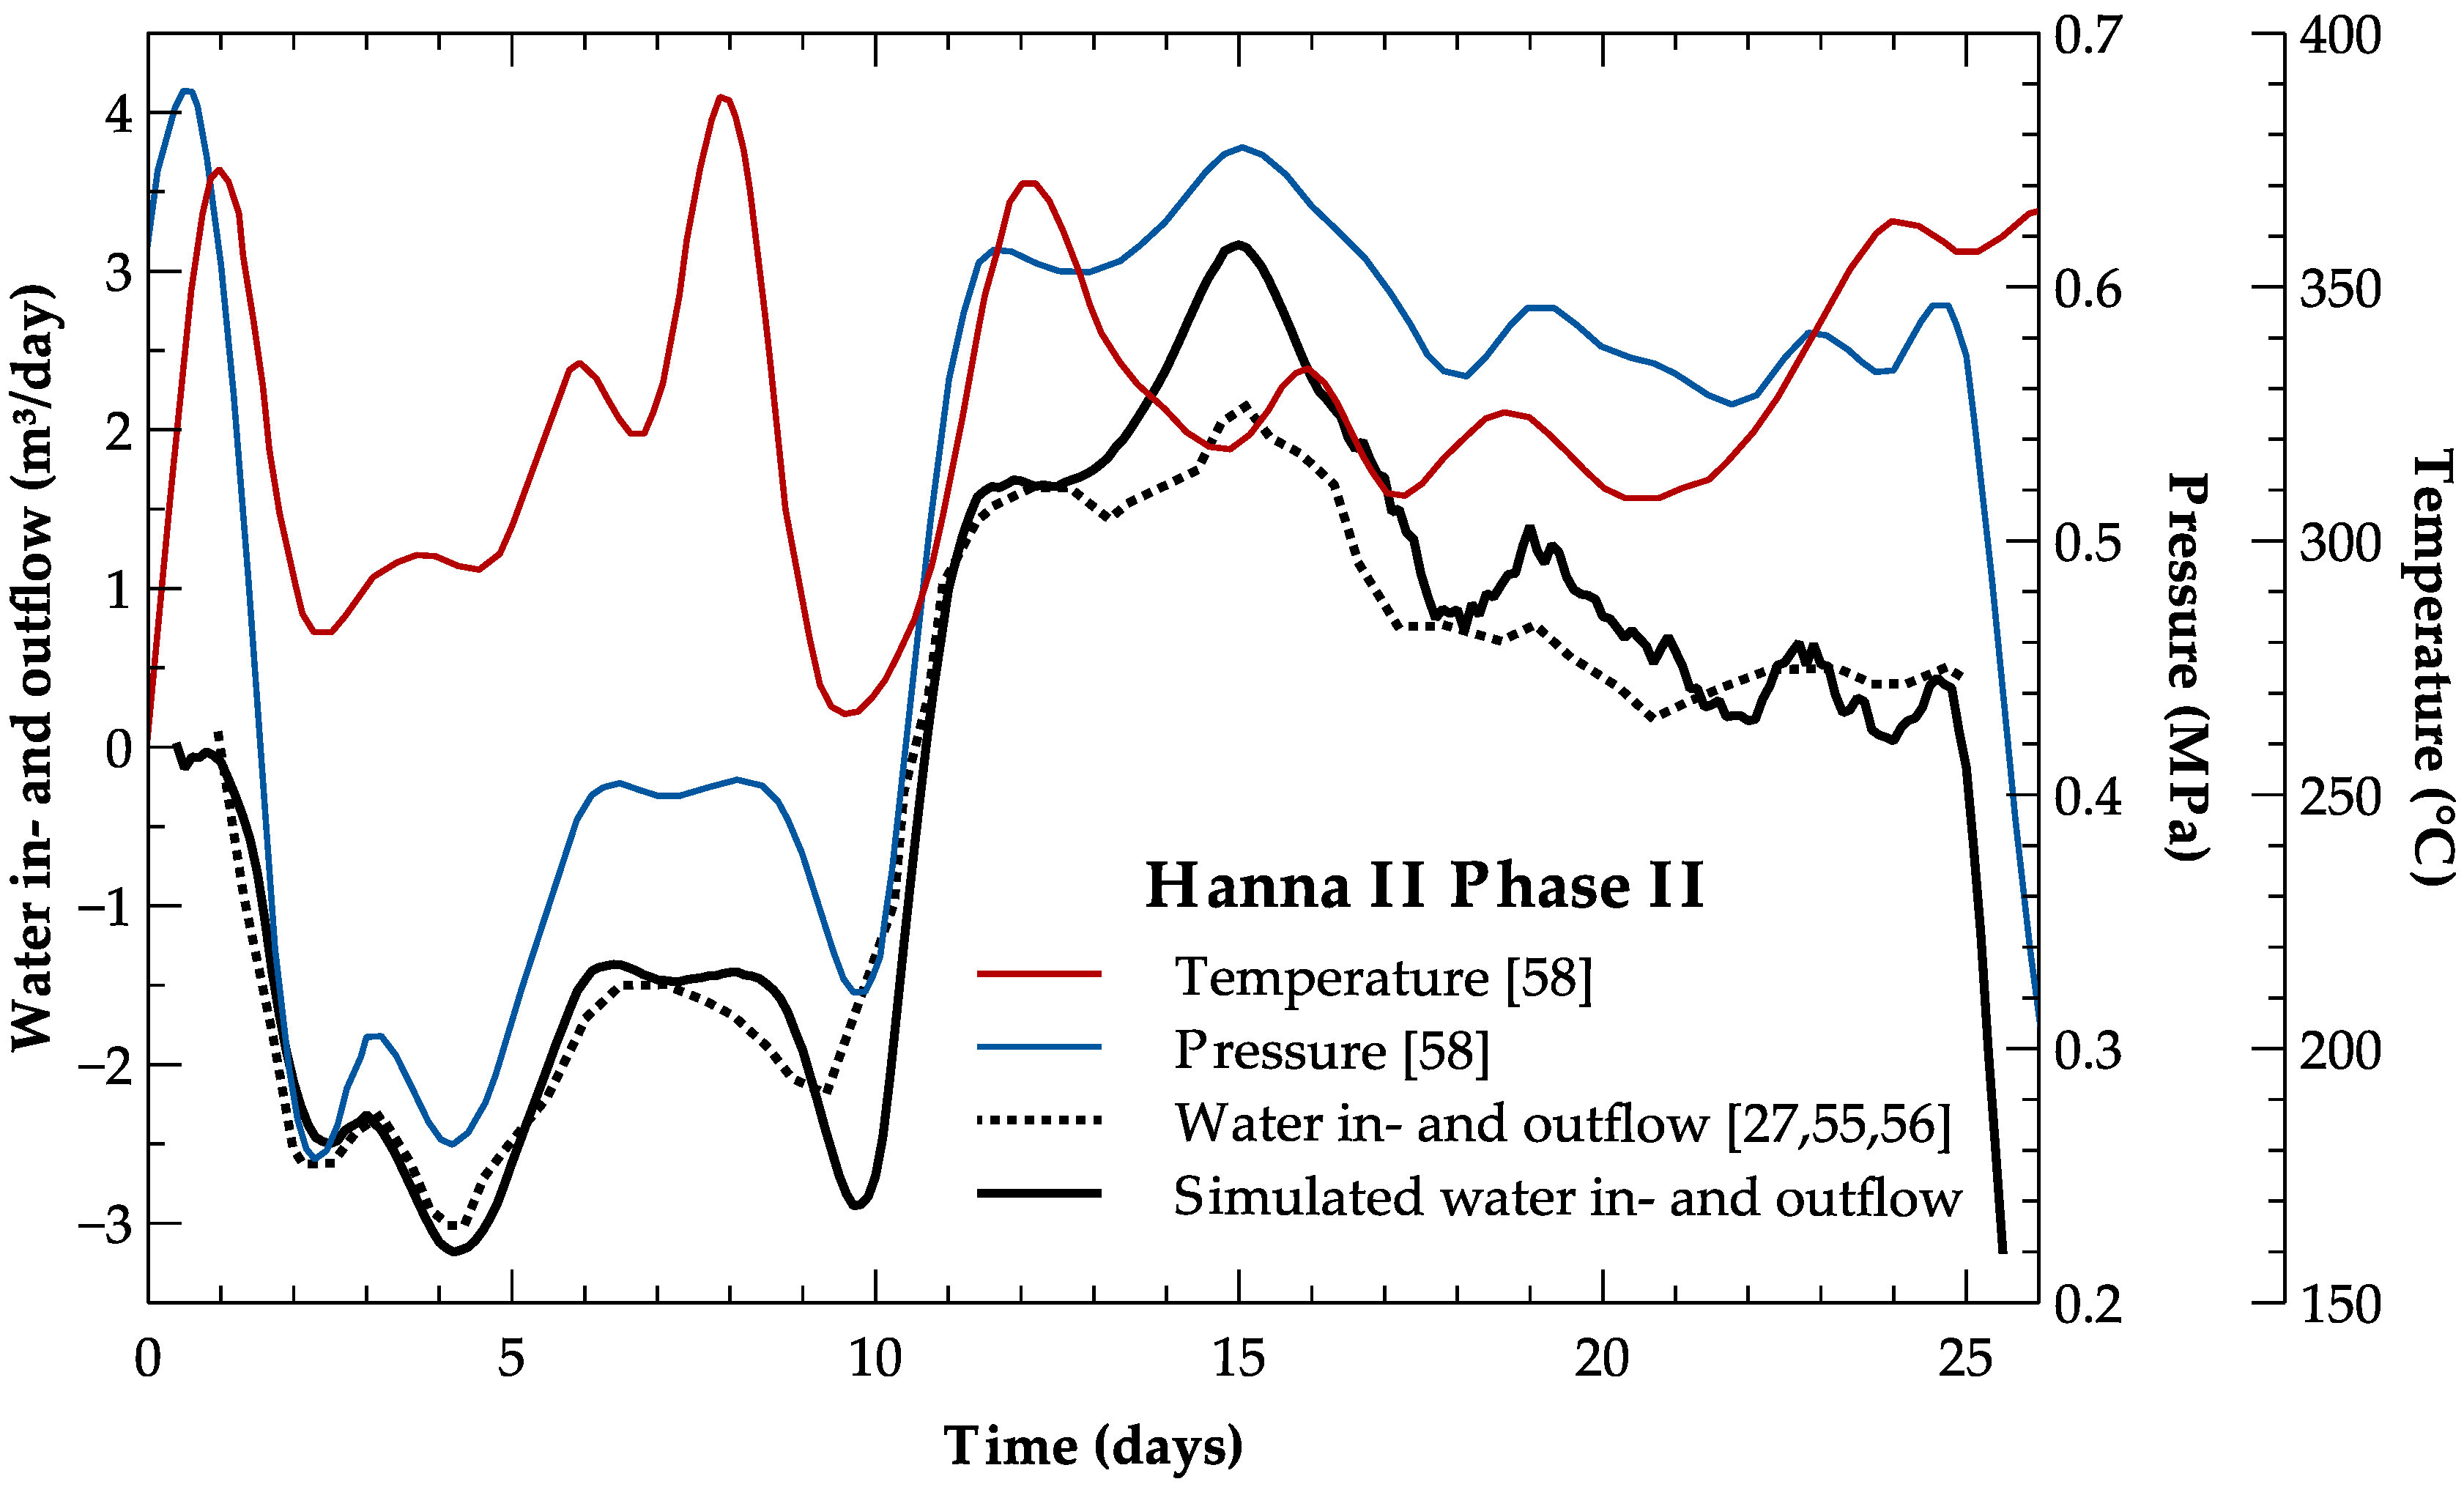
Figure 3.
Simulation results on water in- and outflow for the Hoe Creek field test (solid black line) show a very good agreement with the data in the literature (dashed black line) [55], exhibiting a strong pressure-dependency (blue line) of water flow. Water outflow is positive here.
Figure 3.
Simulation results on water in- and outflow for the Hoe Creek field test (solid black line) show a very good agreement with the data in the literature (dashed black line) [55], exhibiting a strong pressure-dependency (blue line) of water flow. Water outflow is positive here.
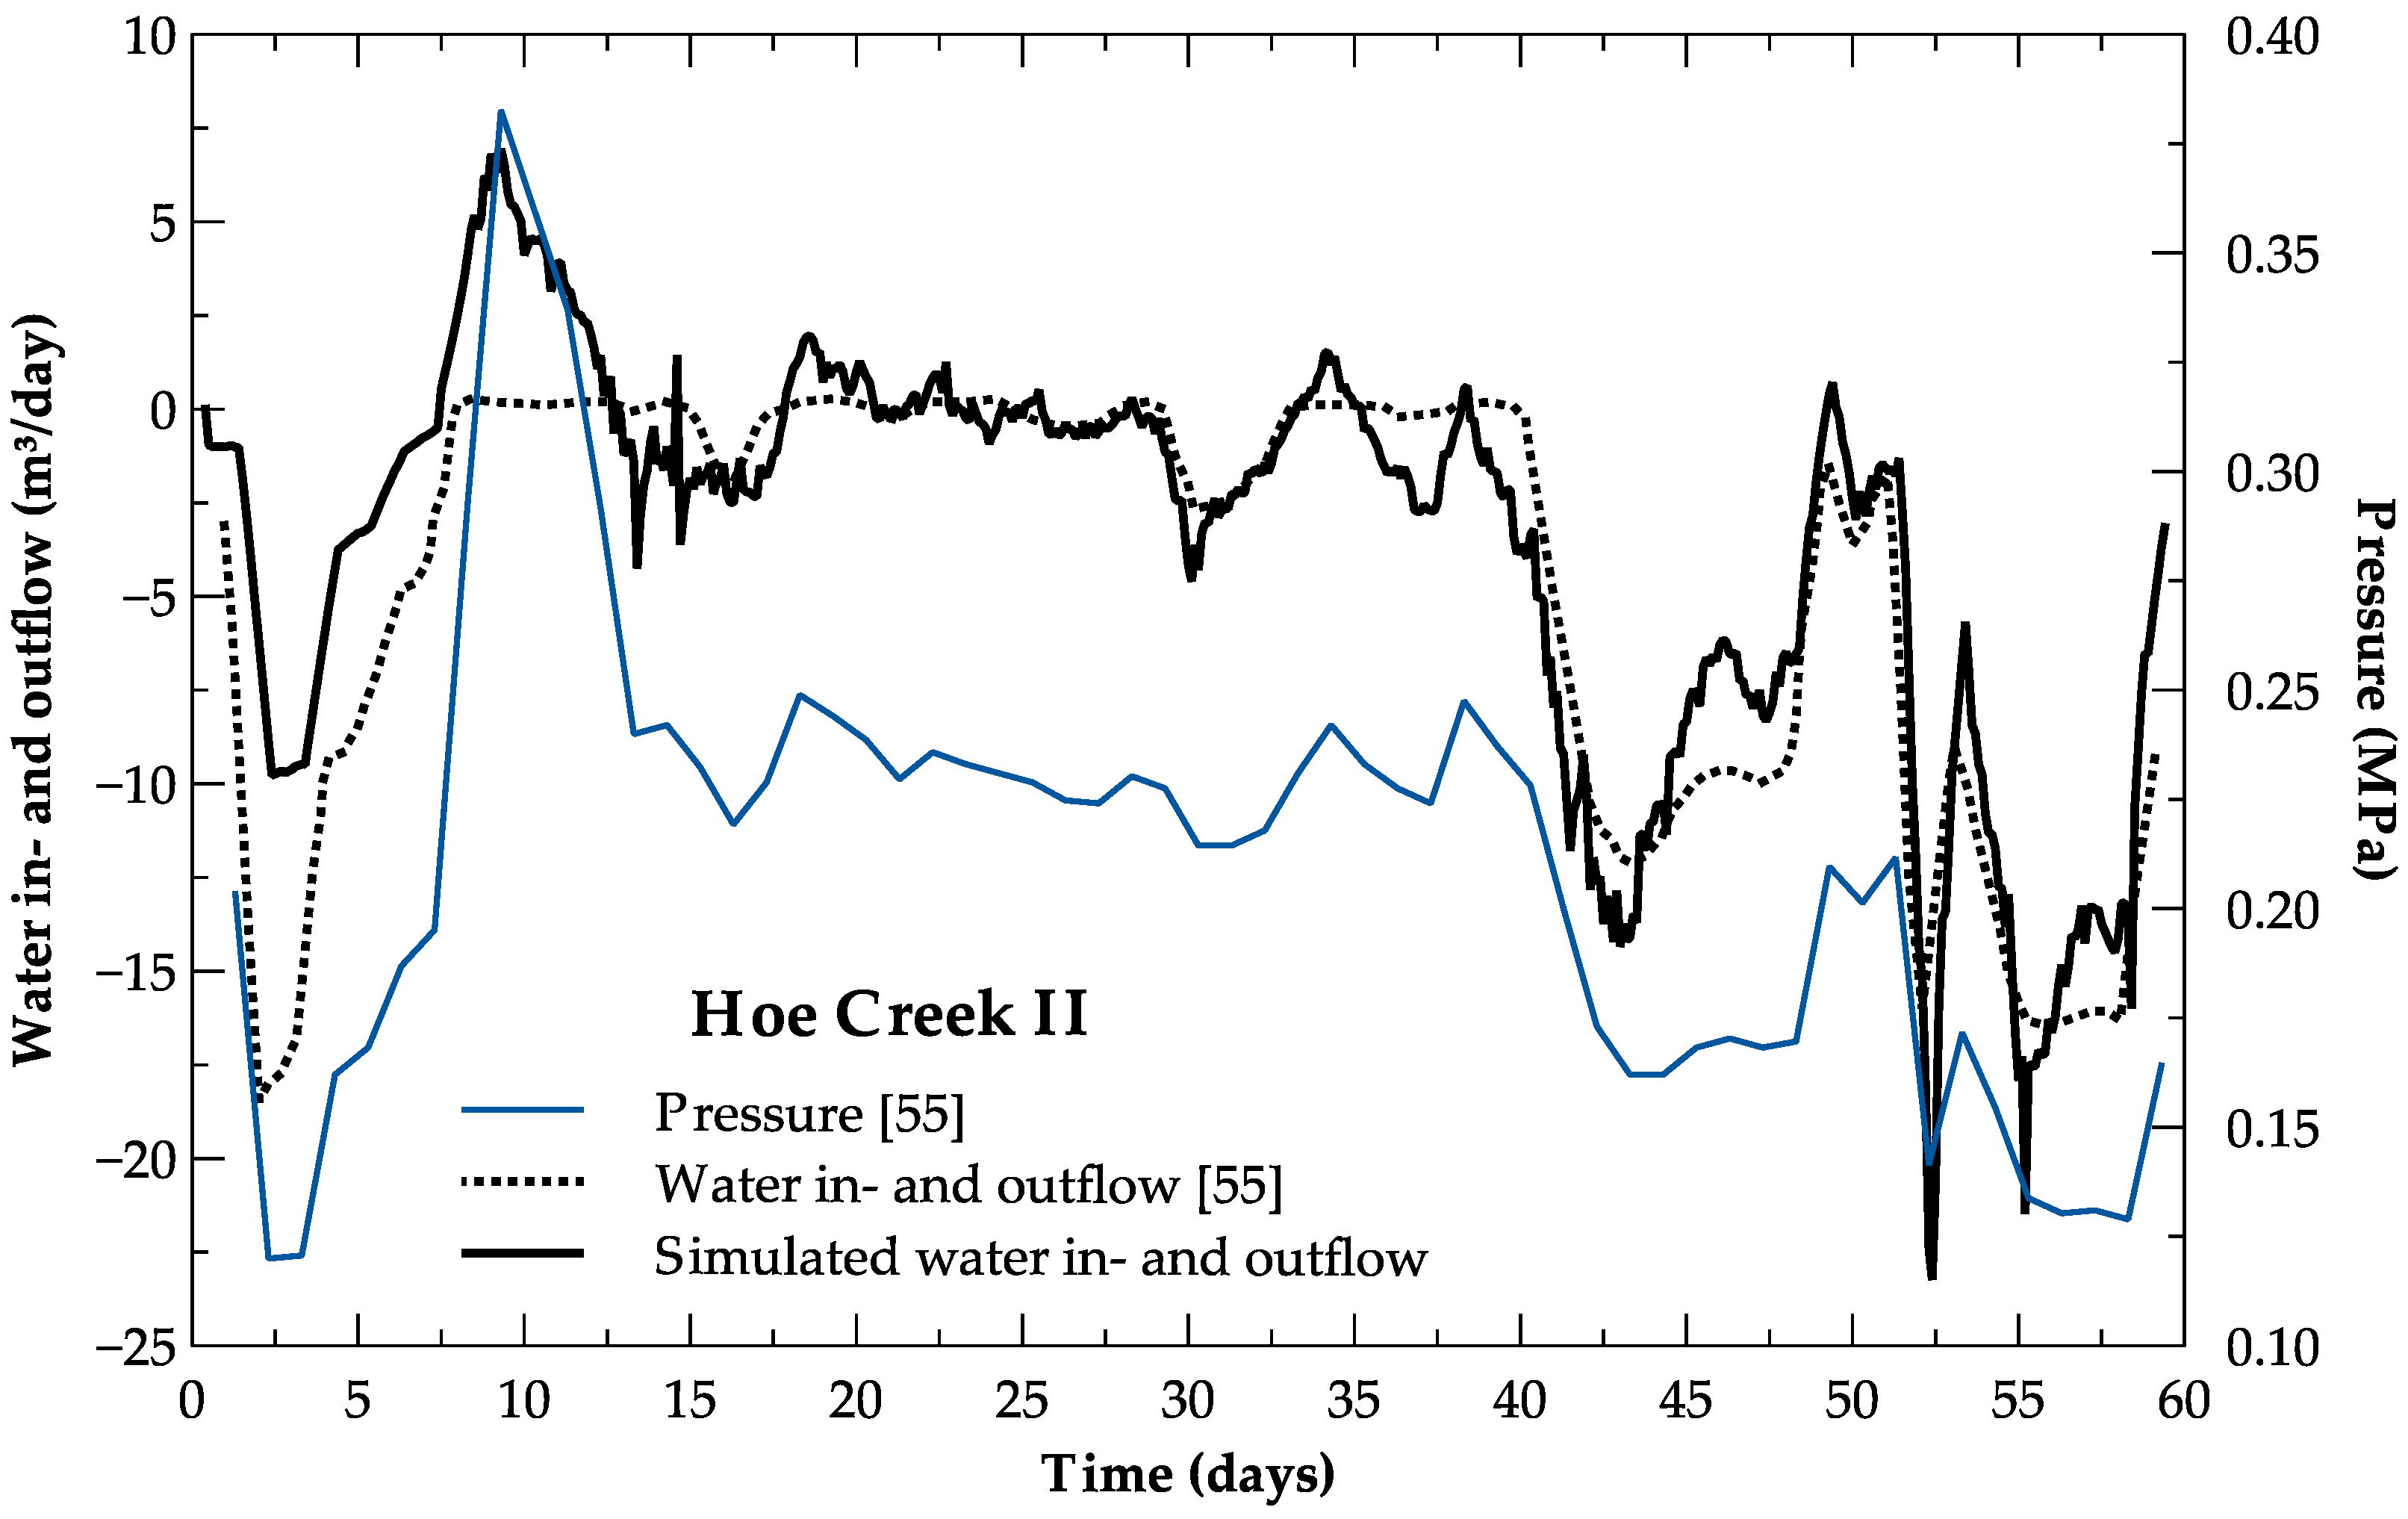
Figure 4.
Cross-section of the 2D thermo-hydraulic model, comprising two lithological units with a radial UCG reactor shape at 246 to 250 m depth. The simulated gas saturation, pressure, and temperature profiles given in Figure 7 are plotted along the blue vertical profile given here.
Figure 4.
Cross-section of the 2D thermo-hydraulic model, comprising two lithological units with a radial UCG reactor shape at 246 to 250 m depth. The simulated gas saturation, pressure, and temperature profiles given in Figure 7 are plotted along the blue vertical profile given here.

Figure 5.
Simulated steam jacket extents after 30 days of UCG operation for different pressures above (top) and below (bottom) the initial hydrostatic pressure and for different assumed coal seam permeabilities (horizontal permeability of the overburden is maintained constant at 50 mD).
Figure 5.
Simulated steam jacket extents after 30 days of UCG operation for different pressures above (top) and below (bottom) the initial hydrostatic pressure and for different assumed coal seam permeabilities (horizontal permeability of the overburden is maintained constant at 50 mD).
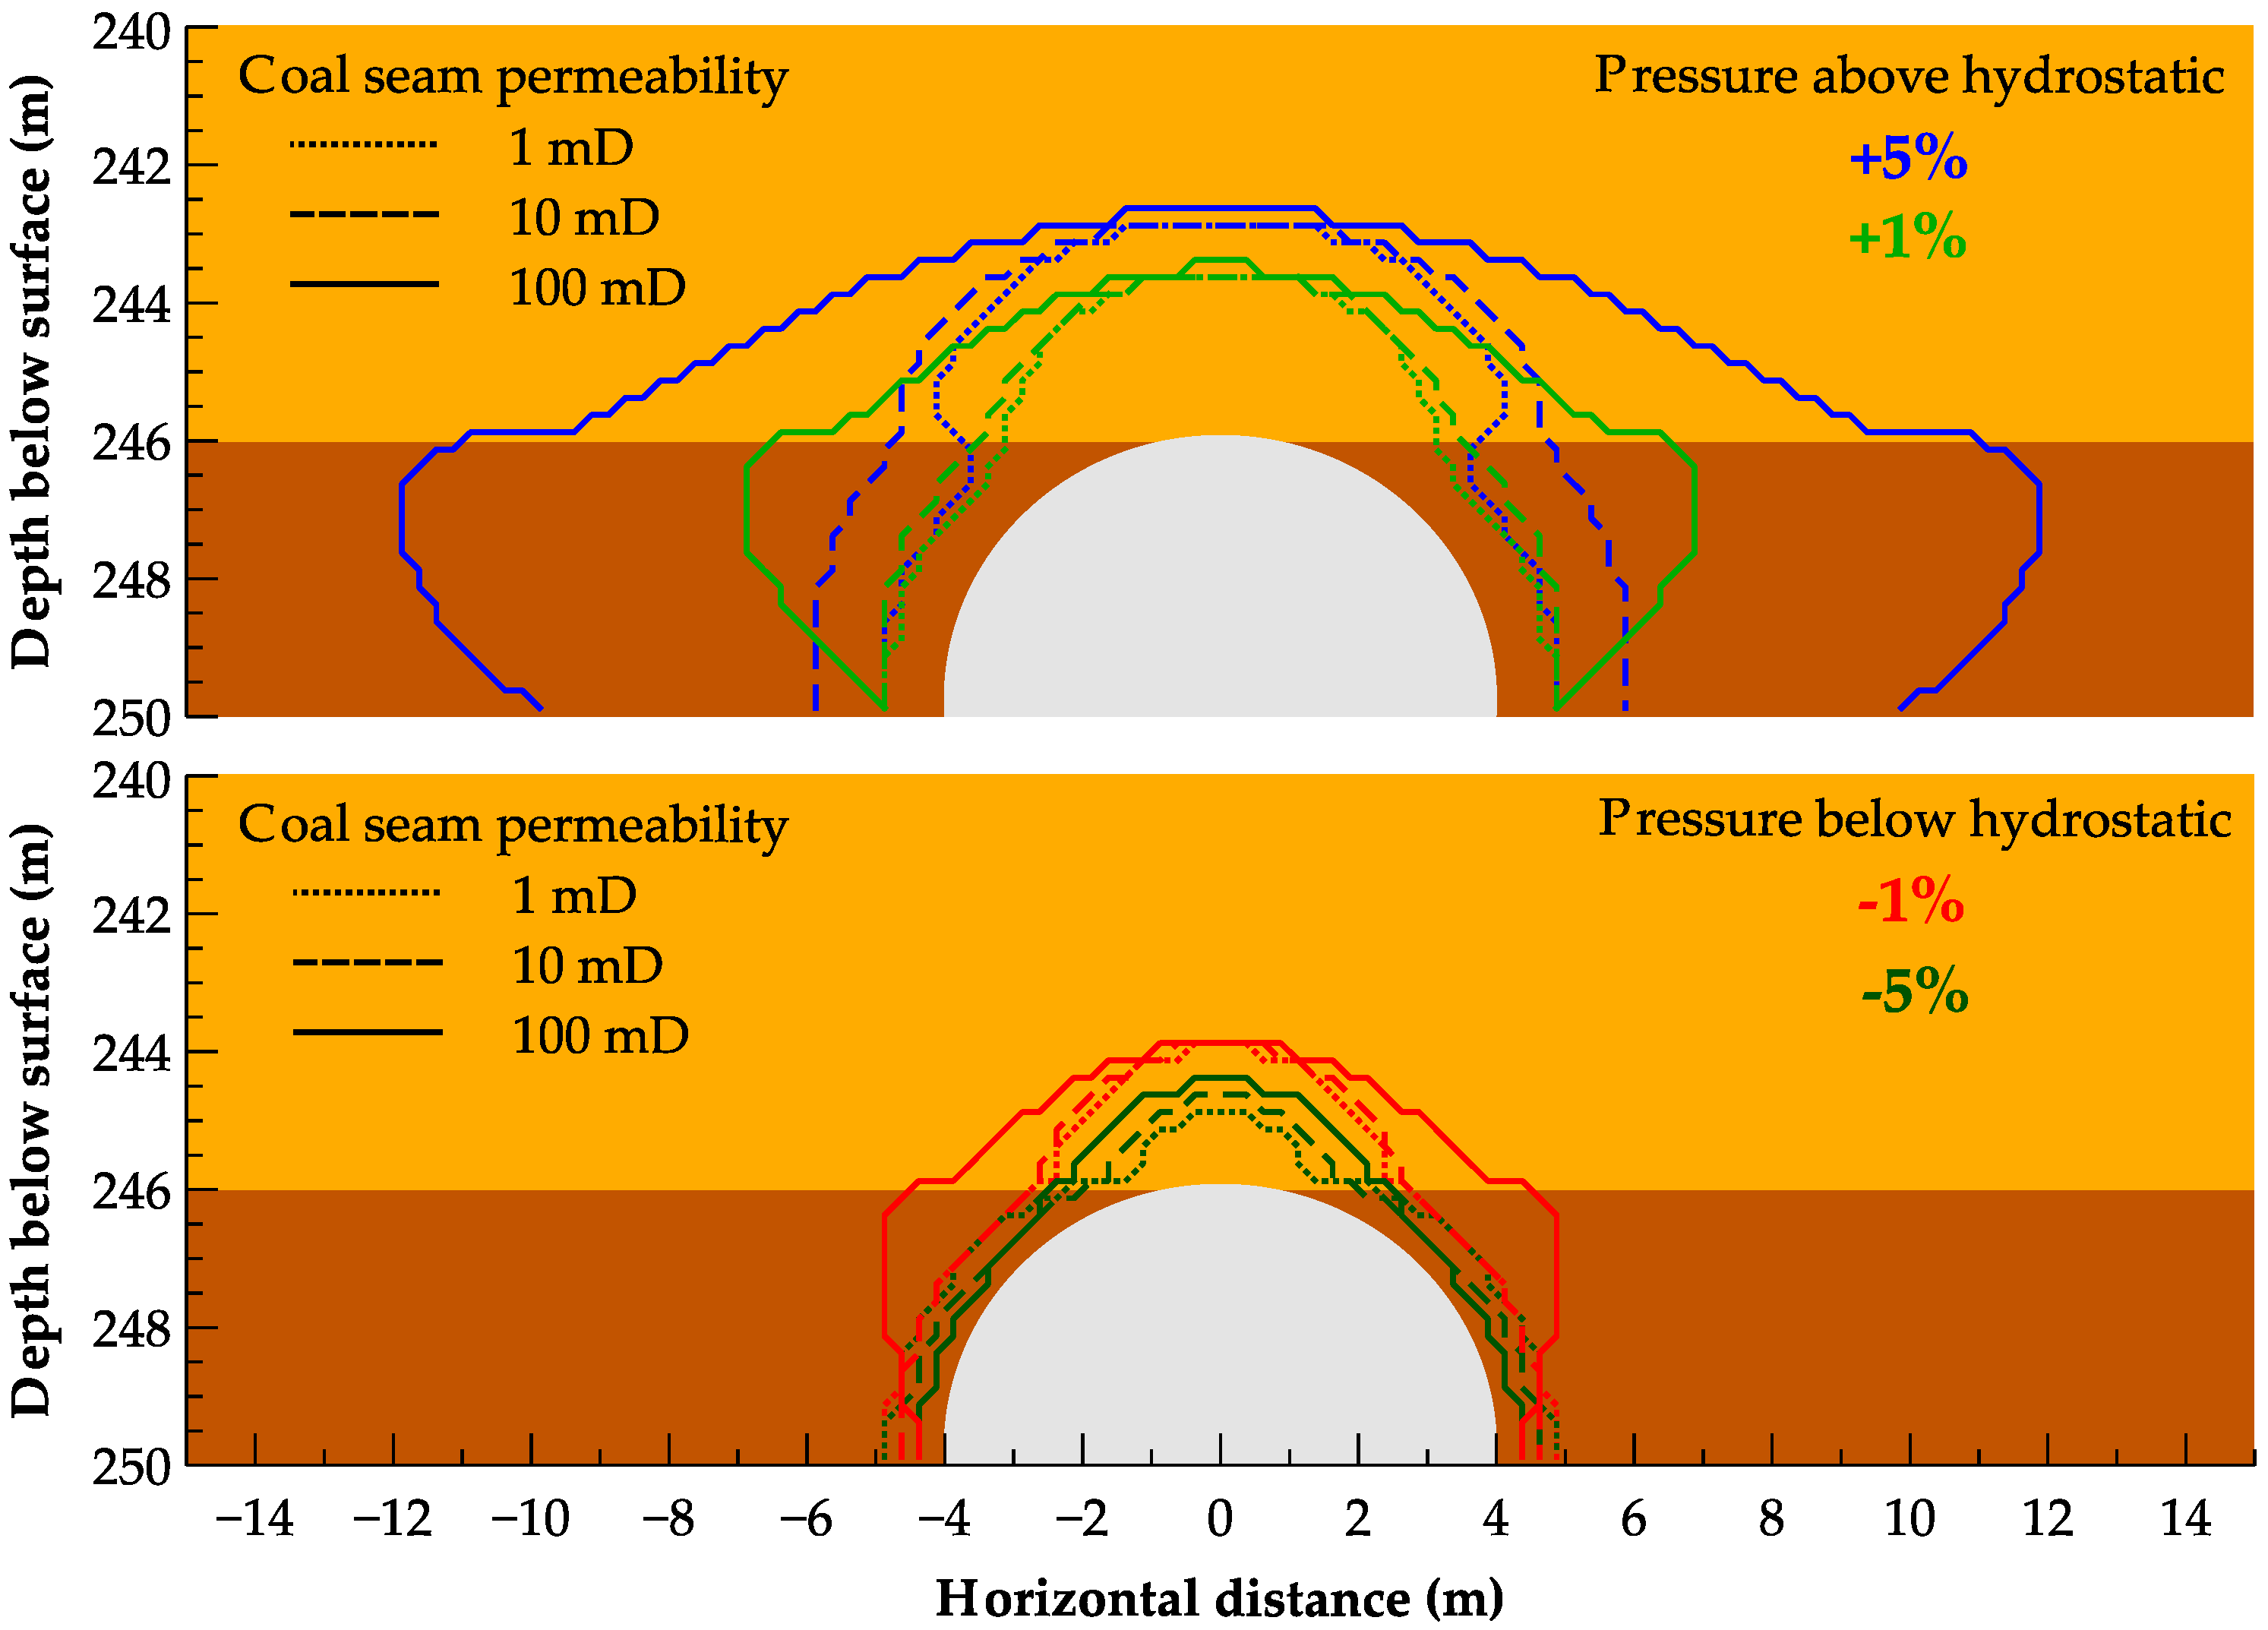
Figure 6.
Simulation results of water in- and outflow scaled to 1-m reactor length in the twelve simulation scenarios for the entire simulation time (top) and for the first two days of simulation (bottom). Water outflow is positive here.
Figure 6.
Simulation results of water in- and outflow scaled to 1-m reactor length in the twelve simulation scenarios for the entire simulation time (top) and for the first two days of simulation (bottom). Water outflow is positive here.
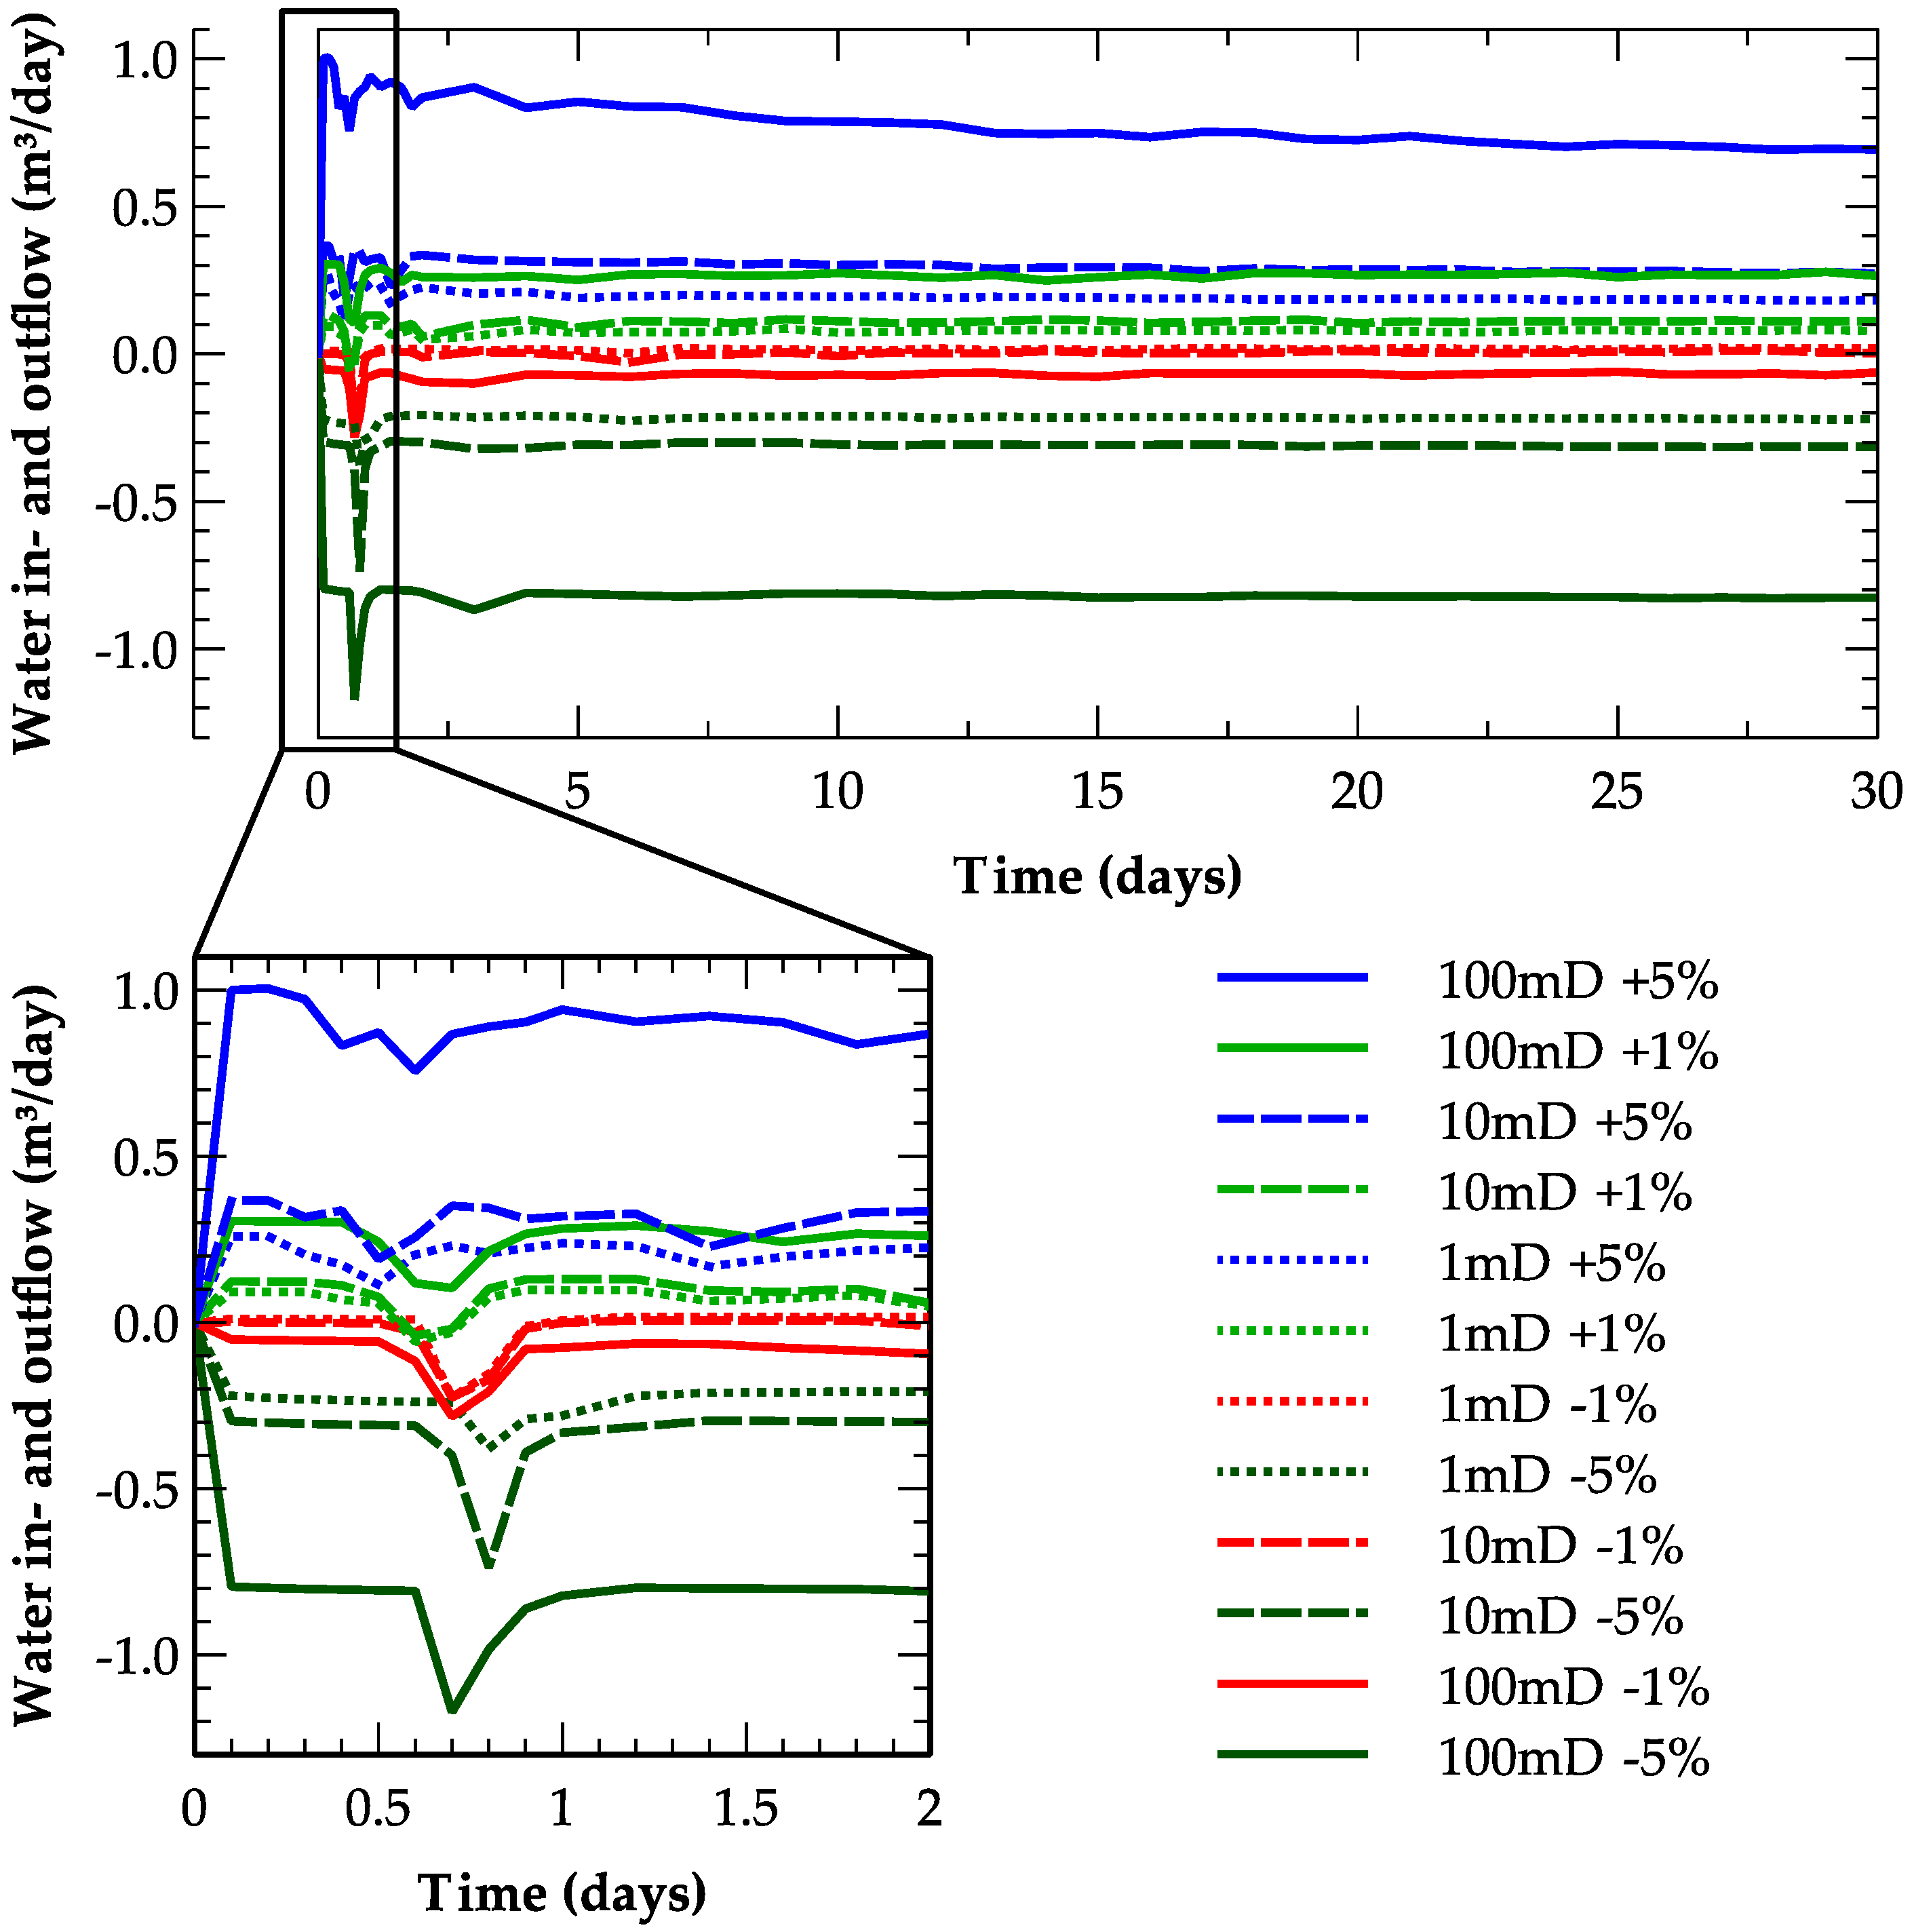
Figure 7.
Simulated gas saturations (green), pressures (blue), and temperatures (red) along the vertical profile shown in Figure 4 for all investigated scenarios at the end of simulation time (30 days).
Figure 7.
Simulated gas saturations (green), pressures (blue), and temperatures (red) along the vertical profile shown in Figure 4 for all investigated scenarios at the end of simulation time (30 days).

| Parameter | Hanna II | Hoe Creek II | ||
|---|---|---|---|---|
| Coal Seam | Overburden | Coal Seam | Overburden | |
| Density (kg/m3) | 1350 | 2200 | 1350 | 2259 |
| Specific heat capacity (J/kg K) | 2000 | 1636 | 800 | 900 |
| Thermal conductivity (W/m/K) | 3.4 | 2.0 | 0.27 | 2.0 |
| Porosity (-) | 0.1 | 0.1 | 0.1 | 0.1 |
| Horizontal permeability (mD) | 5 1 | 5 | 100 1 | 120 |
| Vertical-to-horizontal permeability ratio (-) | 1/3 | 1/3 | 1/5 | 1/5 |
1 Best-fit of permeability match against operational data of water flow into and out of the UCG reactor.
Table 2.
Thermo-hydraulic rock properties applied for 2D model parametrization [19].
Table 2.
Thermo-hydraulic rock properties applied for 2D model parametrization [19].
| Parameter | Coal Seam | Overburden |
|---|---|---|
| Density (kg/m3) | 1300 | 2200 |
| Specific heat capacity (J/kg K) | 2000 | 1363 |
| Thermal conductivity (W/m/K) | 0.23 | 2.3 |
| Porosity (-) | 0.02 | 0.1 |
| Permeability (mD) | 1; 10; 100 1 | 50 |
| Horizontal-to-vertical permeability ratio (-) | 1/3 | 1/3 |
1 The effect of coal seam permeability is analyzed in different simulation scenarios.
© 2017 by the authors. Licensee MDPI, Basel, Switzerland. This article is an open access article distributed under the terms and conditions of the Creative Commons Attribution (CC BY) license (http://creativecommons.org/licenses/by/4.0/).
Share and Cite
MDPI and ACS Style
Otto, C.; Kempka, T. Prediction of Steam Jacket Dynamics and Water Balances in Underground Coal Gasification. Energies 2017, 10, 739. https://doi.org/10.3390/en10060739
AMA Style
Otto C, Kempka T. Prediction of Steam Jacket Dynamics and Water Balances in Underground Coal Gasification. Energies. 2017; 10(6):739. https://doi.org/10.3390/en10060739
Chicago/Turabian StyleOtto, Christopher, and Thomas Kempka. 2017. "Prediction of Steam Jacket Dynamics and Water Balances in Underground Coal Gasification" Energies 10, no. 6: 739. https://doi.org/10.3390/en10060739
Note that from the first issue of 2016, this journal uses article numbers instead of page numbers. See further details here.