
Lifetime Assessment of Combined Cycles for Cogeneration of Power and Heat in Offshore Oil and Gas Installations


Department of Energy and Process Engineering, Norwegian University of Science and Technology—NTNU, Kolbjørn Hejes v 1B, 7491 Trondheim, Norway
*
Author to whom correspondence should be addressed.
Energies 2017, 10(6), 744; https://doi.org/10.3390/en10060744
Submission received: 31 March 2017
/
Revised: 12 May 2017
/
Accepted: 19 May 2017
/
Published: 25 May 2017
(This article belongs to the Section I: Energy Fundamentals and Conversion)
Abstract
:The utilization of combined cycles for offshore cogeneration of power and heat is an attractive option to reduce the CO2 emissions directly related to the oil and gas sector. Main challenges for their efficient implementation are the potentially large heat-to-power ratios and the variability of power and heat requirements throughout the different stages of a field’s lifetime. This paper aimed to provide the first elements for an assessment of the technology. Two combined cycle configurations were evaluated (backpressure and extraction steam turbine cycle), as well as different scenarios of power and heat requirements. The optimum design approach was firstly investigated. Designing the combined cycle at the end-life conditions, rather than at peak conditions, demonstrated to return better overall performance, when the entire plant’s lifetime is considered. A comparative analysis between the defined optimum designs was then carried out. Although the backpressure steam turbine cycle demonstrated to be feasible in all the cases analyzed, it showed to be effective only for offshore installations characterized by low temperature large process heat demands. On the other hand, the extraction steam turbine cycle could not meet large process heat demands but it was very attractive when the heat requirements were more limited, irrespective of the temperature at which this heat was requested.
1. Introduction
The offshore extraction and processing of oil and gas is an energy-intensive sector, with significant power and heat requirements. It is common practice to use a fraction of produced gas in order to generate power onsite by means of gas turbines. This approach demonstrated to be an effective concept to locally produce the power necessary to meet the requirements connected to the offshore plants operation. On the other hand, the utilization of produced gas decreases the amount of gas that can be exported and gives local emissions of CO2 resulting from the gas combustion. Therefore, an improved energy management entails environmental and economic benefits. Various analyses have been carried out in order to identify opportunities for increasing the energy efficiency of these plants [1,2,3,4,5,6]. The processes to be implemented and, accordingly, the design of an offshore plant depend to a large extent on the characteristics of the reservoir to develop. For this reason, the outcomes of energy and exergy analyses are often site-specific and cannot be generalized. However, both Nguyen et al. [1] and De Oliveira and Van Hombeeck [5] stressed the importance of an efficient utilization of the exergy associated with the exhaust gases of gas turbines. The common strategy consists of exploiting the thermal energy available in the hot gases to meet the process heat demand of the plant by means of a waste heat recovery unit (WHRU). The introduction of WHRU improves the energy efficiency of the plant and nowadays WHRUs cover a large share of all heat demand for offshore operations. A further step ahead in the direction of an efficient energy management could be made if the waste heat of the gas turbines is used as heat source for a bottoming cycle. Several works investigated the feasibility of offshore bottoming cycles. Kloster [7,8] argued that the adoption of combined cycles based on a steam bottoming cycle are the most viable option to improve energy efficiency and cut CO2 emissions. Three projects, developed on the Norwegian continental shelf (Oseberg, Eldfisk and Snorre B), are described to stress the technical and economic feasibility of the technology. Nord and Bolland [9] investigated the challenges associated with the installation of a steam bottoming cycle offshore. Requirements like compactness, weight limitations and flexibility have to be considered in the design of these cycles. Once-through heat recovery steam generator technology was evaluated as attractive for offshore applications and the performance of a cycle was tested with design and off-design simulations [10]. A refinement of the design for such steam bottoming cycle was also presented, based on a detailed combined cycle model and numerical optimization tools [11]. The solution with minimum weight-to-power ratio was determined, alongside with the Pareto frontier of solutions with maximum power and minimum weight. Besides focusing on the ways to design compact and low weight steam cycles, it is critical to analyse the site-scale integration of such technologies. Nguyen et al. [12] carried out a systematic analysis on steam bottoming cycles for offshore applications. The thermoenvironomic (i.e., energetic, economic and environmental) performance of combined cycles was assessed, together with the possible integration schemes at a site-scale level. Given the range of temperatures at which the waste heat could be available, other working fluids could become competitive with steam. Pierobon et al. [13] investigated the most suitable waste heat recovery technology for a specific offshore facility. The technologies analyzed were steam Rankine cycle, air bottoming cycle and organic Rankine cycle (ORC), with their respective designs defined through a multi-objective optimization process. Steam Rankine cycles and organic Rankine cycles demonstrated to be competing technologies when targeting at the design of highly-efficient offshore platforms. The air bottoming cycle was evaluated as less attractive. The design of optimal organic Rankine cycle was further studied with regard to an offshore oil and gas platform in the North Sea. A first screening, based on a dynamic model, allowed to discard solutions which did not comply with the dynamic requirements of the system [14]. The optimal designs were then determined through a multi-objective optimization methodology, which considered thermal efficiency, total volume of the system, and net present value as objective functions [15]. Taking as case study the same offshore installation, a methodology were proposed for optimization of axial turbine design as a function of the ORC conditions [16]. A systematic analysis on the utilization of ORC cycles for offshore applications was carried out by Bhargava et al. [17]. The thermodynamic performance of three cycle configurations, combined with different power rating gas turbines, was studied and compared. Barerra et al. [18] studied the utilization of an organic Rankine cycle on board of a Brazilian floating production, storage and offloading (FPSO) unit. The benefits of the combined cycle were evaluated at different field conditions. An organic Rankine cycle was also evaluated for the revamping of an existing upstream gas facility, in parallel with other options for an increased energy efficiency (e.g., substitution of a gas turbine driving a gas compressor with an electric motor) [19]. Walnum et al. [20] evaluated the viability of CO2 bottoming cycles. The high working pressure implied an increased compactness of the cycle, while a 8% to 16% lower power output was obtained in comparison to a steam bottoming cycle. The simulations also showed an advantageous off-design performance. Mazzetti et al. [21] evaluated that applying a combined cycle technology based on a CO2 bottoming cycle could result in a 22% CO2 emissions reduction over the 18 years of operation of the case study considered. Most of these studies focused solely on power generation. However, offshore installations are often characterized by significant requirements of process heat. Combined cycles offer the possibility to cogenerate power and heat, although a cogeneration layout, especially when heat at high temperature is requested, decreases the power output of the steam turbine. A cogeneration layout demonstrated to be feasible for offshore and other similar applications [22]. An additional challenge in offshore applications consists of the variability of power and heat requirements, which are influenced by the oil and gas production profiles. As a consequence, offshore plants operate off-design most of their life, with a negative impact on the energy efficiency. A specific set of operating conditions needs to be selected to design a combined cycle. Nguyen et al. [23] discussed how the integration of a steam Rankine cycle is more challenging at peak conditions, due to the peak heat requirements associated with the higher production rate of hydrocarbons. This strategy ensures the cycle capability to meet power and heat demands in each expected operating conditions but the end-life period would be characterized by a substantial efficiency decrease. An effective design should be able to perform efficiently in the several operational modes to which the plant will be subjected, rather than only at specific conditions. Similar considerations were made for marine applications, since ships can have very variable operational profiles. In this field, some advanced studies were presented. Kalikatzarakis and Frangopoulos [24] developed a multi-criteria approach to the design of an ORC which took into account the operational profile of the ship. In an attempt to further investigate the influence of accounting for the operational profile, Baldi et al. [25] proposed a procedure for the optimization of a combined Diesel and ORC system design. The method demonstrated to be advantageous in terms of fuel consumption compared to a case where only the performance at the design point was considered.
The aim of this paper was to provide a first assessment on the effectiveness of combined cycles for cogeneration of power and heat in offshore oil and gas installations. To the authors’ knowledge such assessment is missing in the literature which so far focused on combined cycles for production of only power. Backpressure and extraction steam turbine cycles were considered in the analysis. The first step to fulfill the main objective of the paper was to define a methodology to pinpoint the optimum combined cycle design, by taking into account the entire plant’s lifetime with its varying energy requirements. For that purpose, designs were developed to perform efficiently either at the peak conditions of the plant (peak production rate of crude oil with high plant energy requirements) or at the end-life of the plant (long tail-period of reservoir depletion with reduced plant energy requirements). The definition of the optimum designs was based on a constrained multi-objective optimization process, while the lifetime performance was obtained through off-design simulations. Once evaluated the general feasibility and established the design approach returning the best lifetime performance, the relative effectiveness of the cycles was assessed through a comparison with the reference case of a simple gas turbine cycle. The basis of the whole analysis was an actual offshore plant in the Barents Sea, with its predicted power and heat requirements throughout the field’s lifetime. In order to provide a more complete overview, other scenarios of power and heat requirements were also proposed and investigated.
2. Methodology
THERMOFLEX (Thermoflow Inc., Southborough, MA, USA) [26] was the simulation tool used for the process modeling and simulation. THERMOFLEX is a fully-flexible program for design and off-design simulation of thermal systems. Further, it allows estimations of sizes and weights of the physical components. The genetic algorithm for the optimization processes was implemented from the MATLAB Global Optimization Toolbox [27]. A MATLAB routine was also developed to carry out the lifetime plant simulations. The two simulation platforms were set to communicate through a common Microsoft Excel interface. MATLAB provided the inputs relative to the different operating conditions and subsequently launched a simulation in THERMOFLEX. The simulation outputs were collected, conveyed to MATLAB and further processed.
2.1. Case Study
As a starting point for the evaluation of the feasibility to cogenerate power and heat through combined cycles in offshore installations, an actual case study was considered. The Johan Castberg field is located 110 km north of the Snøhvit-field in the Barents Sea. A floating production, storage and offloading vessel (FPSO) concept has been selected as the field production unit. The first oil is expected by 2023 and the production phase is assumed to last until 2052. The power and heat requirements to operate the plant are strongly influenced by the crude oil production profile. An estimation of those requirements through the field’s lifetime was made publically available by the operators of the plant in 2016 [28]. In accordance with the information available, profiles of power and heat demands were developed where each year is characterized by values representing averaged power and heat requirements for that year (see Figure 1). The heat to the process units is assumed to be supplied through pressurized water in a separate heating circuit. The process supply temperature needed is highly dependent on the conditions and the characteristics of the crude oil (e.g., initial feed temperature, viscosity, content of medium-weight hydrocarbons, etc.), and on the processes to be implemented (separation, crude oil stabilization, gas dehydration, etc.). Without a complete knowledge of that set of information, it was decided to use either 150 °C or 120 °C as assumed process supply temperature. A rather high heat demand characterizes the case study selected. Such large heat-to-power ratio is not often found in offshore installations and it is challenging to be fully met by a combined cycle in cogenerative mode. Therefore, in order to encompass a larger range of possible applications, the analysis was not limited to the retrieved power and heat profiles but included an additional case in which only half of the heat demand initially considered is to be supplied. This could be the case of the selected plant where half of the heat demand is covered by alternative equipment or the case of a different plant with more limited process heat requirements. Summing up, four different cases were evaluated:
- Case A.
- 100% heat demand at 150 °C;
- Case B.
- 100% heat demand at 120 °C;
- Case C.
- 50% heat demand at 150 °C;
- Case D.
- 50% heat demand at 120 °C.
2.2. Modeling the Combined Cycle
The general layout of the combined cycle included two gas turbines (GTs), a single once-through heat recovery steam generator (OTSG), a steam turbine (ST) and a dearating condenser. The GTs were selected to be of the type GE LM2500 + G4. A data-defined model was used, based on the specifications and correction curves provided by the manufacturer. The GTs were equipped with dry low emission burners and variable guide vanes (VGV). The OTSG technology was selected because it was demonstrated to provide the best compromise between weight and efficiency [9]. Thus, a single-pressure OTSG was modelled in order to extract the thermal energy from the GTs exhausts and raise superheated steam. The OTSG was modeled as the sum of three parts—economiser, evaporator and superheater—with dynamic internal boundaries to be determined as a function of operating conditions and with the active boiling zone left free to move across the boiler. The main process variables (pressure and temperature of the steam, approach temperatures, pinch points, etc.) were selected through an optimization process, while some parameters of the physical hardware were fixed for all the cases. The ST model is based on the semi-empirical method described in [29]. A constant dry step efficiency is assumed for the ST group, corrected by a proper factor when wet expansion occurs, and the design-point inlet flow function and adjusted nozzle area calculated. In off-design simulations correlations based on the Stodola’s cone law are used. The relation proposed by [29] between the dry step efficiency and the non-dimensional flow coefficient is utilized. A deaerating condenser is modelled as a shell and tube heat exchanger, where sea water is the cooling medium.
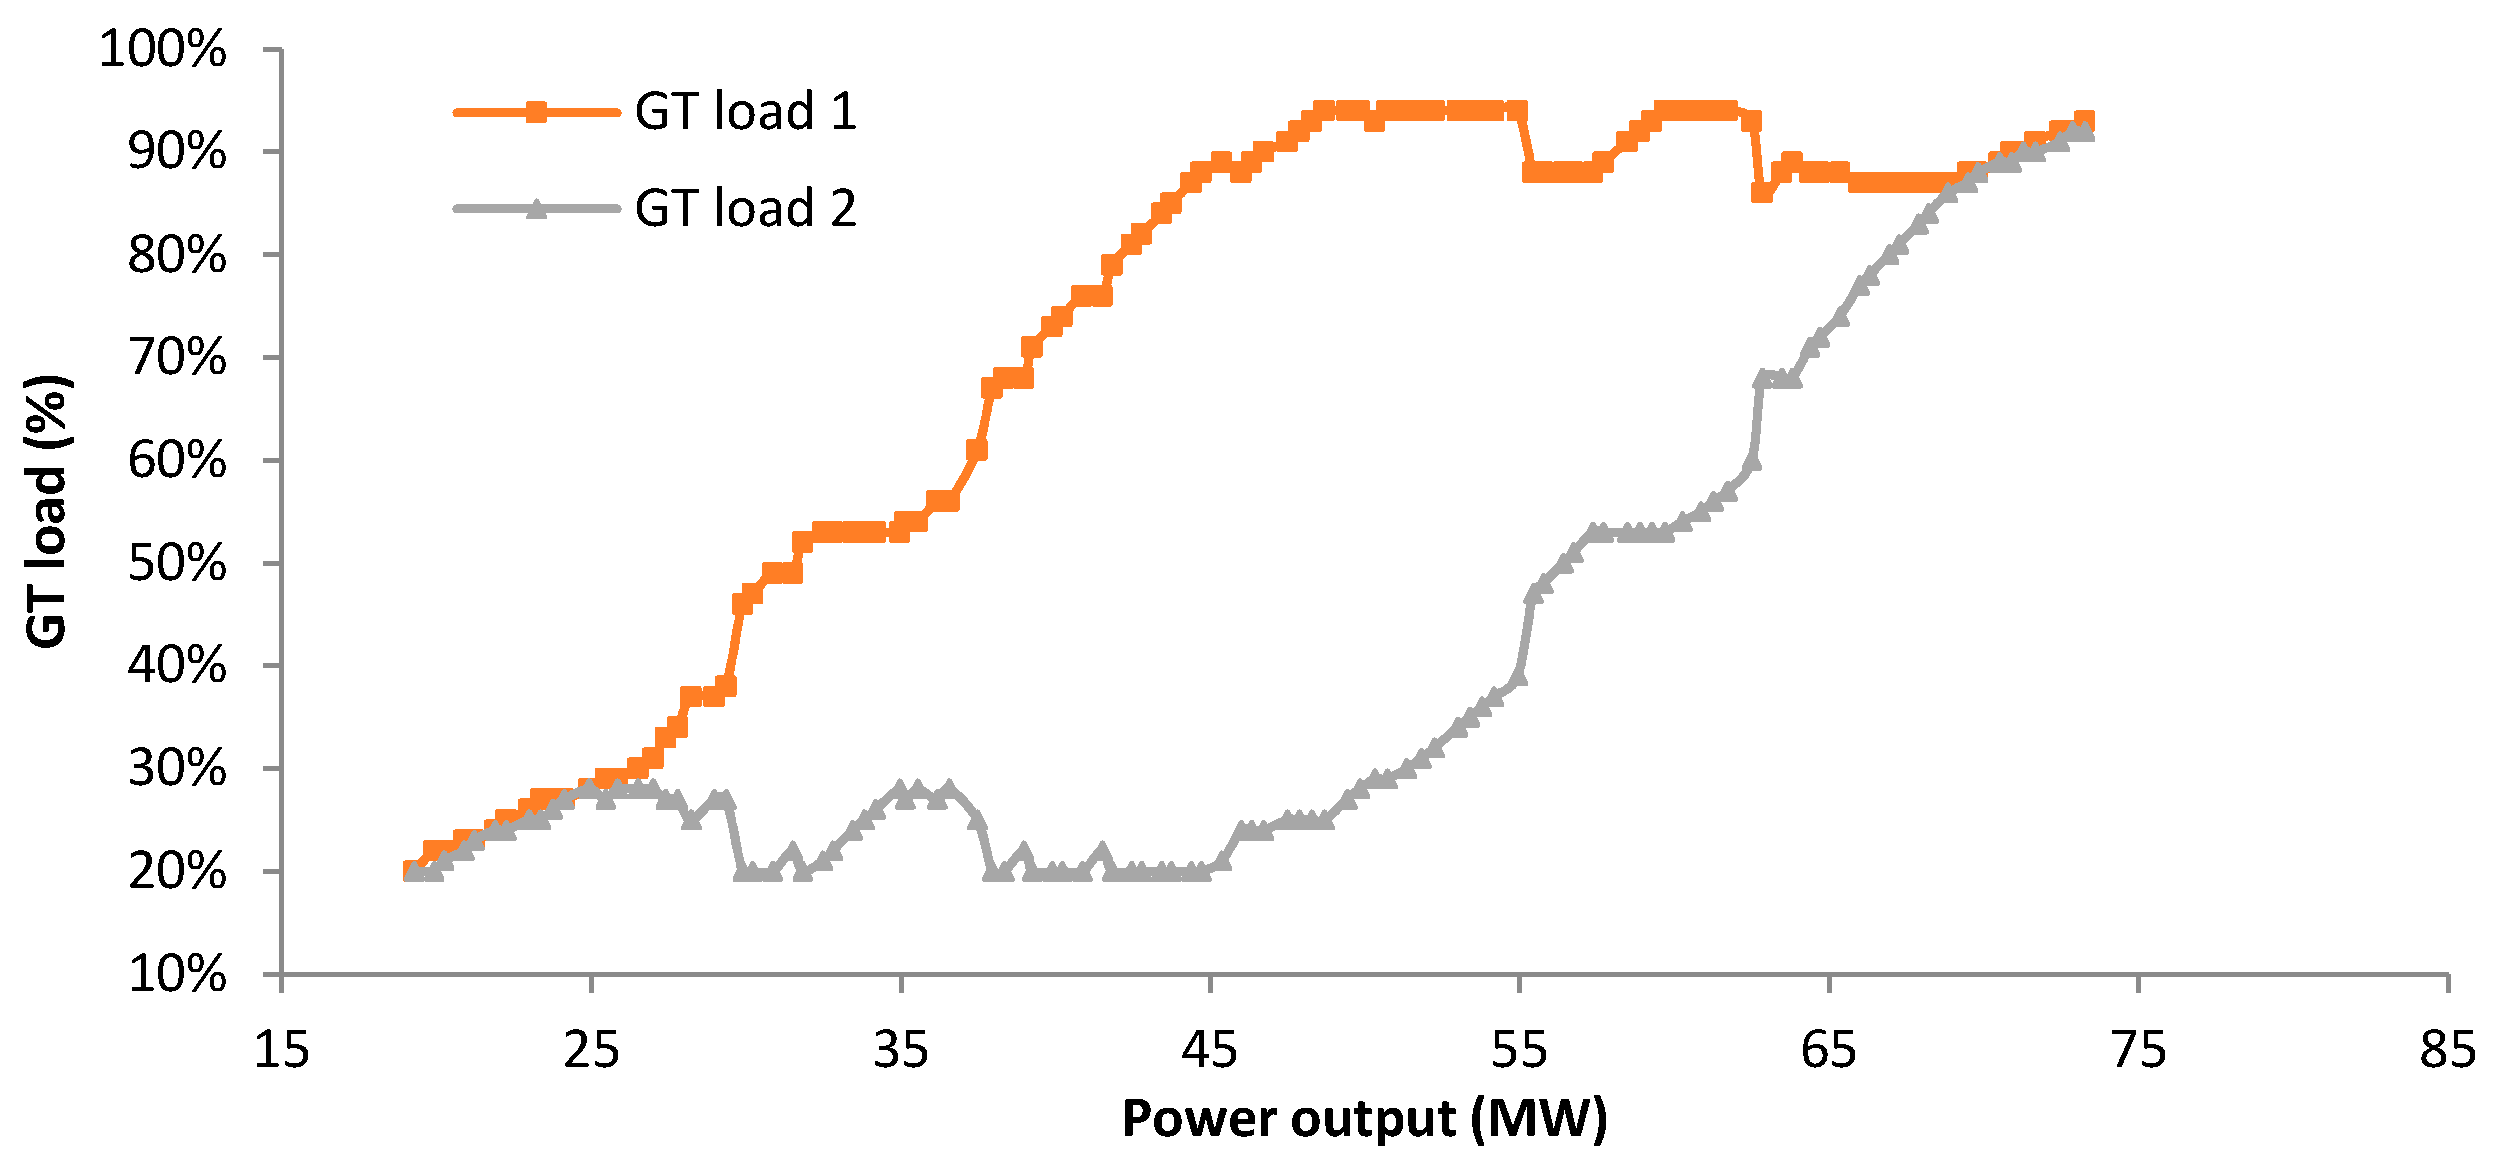
The GT model used was a data-defined model, thus the control strategy was already embedded in the correction curves and was not modified. The approach used was a combination of VGV control and turbine inlet temperature control (TIT). The power output of the combined cycle was controlled by means of the GTs. The ST generated power with the steam made available by the OTSG. In order to retain the overall part-load efficiency at the highest possible level, the optimum strategy for the decrease of the GT loads was investigated. For each of the designs studied, it was determined the set of GT loads which returned the desired plant load with the highest efficiency. Figure 2 shows an example of the outputs obtained. An even share of the load between the two GTs proved to be the best option for very high and low power outputs. Otherwise, it was demonstrated more efficient to keep one GT load at high levels, while the other GT made up for the remaining power output. In the evaluation of the best part-load strategy, constraints were introduced in terms of maximum and minimum GT loads, respectively 94% and 20%. Further, it was not considered the possibility of shutting down one gas turbine in order not to compromise the responsiveness of the system in the case of one GT malfunctioning.
The control mode for the steam cycle was based on sliding pressure operation, with the steam pressure level governed by the Stodola’s cone law. The steam temperature was controlled by the feedwater flow to the OTSG, as suggested by [30] for heat recovery steam generators of the once-through type. In particular, the temperature of the steam at the entrance of the OTSG section defined as superheater was controlled. Due to the variability of the energy requirements, the control of maximum live-steam pressure was necessary for some designs. A higher limit was set, as a percentage of the design value, and the live-steam pressure was controlled by a steam turbine bypass control valve. Steam bypass was also applied when the combined cycle was not able to fully meet the process heat demand.
The one presented in this section is a general overview of the modelling approach. Depending on the combined cycle configuration selected differences and additional requisites could have arisen, which are detailed in the specific sections.
2.3. Modeling the Heat Transfer Process
A precise modelling of the heat exchanging section would have required a detailed breakdown of the process heat requirements of the plant in all the operating conditions evaluated. Such level of details was not available. Further, the paper aimed to provide some general guidelines (not only case specific) on the feasibility of the process configurations tested and on their optimal design. Thus, a simplified approach was used. The process heat is assumed to be supplied through a heating medium circuit. Pressurized water was selected as heating medium, with an inlet temperature of 100 °C and an outlet temperature of either 150 °C or 120 °C depending on the case studied. Steam, coming from the steam turbine, was the hot source, transferring heat to the pressurized water, in every configuration chosen. The steam had to fulfil the following requirements: in the first instance, it needed to be able to entirely provide the requested heat with a certain flexibility margin; in the second instance, the temperature levels were checked in order to ensure the feasibility of the heat transfer process in a generic heat exchanger, i.e., complying with selected limits for the minimum approach temperature and pinch point. Meeting these requirements practically meant to determine either the minimum possible backpressure or extraction pressure of the steam turbine (5.4 bar and 2.3 bar, respectively for a process supply temperature of 150 °C or 120 °C).
2.4. Other Modeling Assumptions
A list of the remaining modeling assumptions is shown in Table 1. A sulfur-free natural gas was selected to be the fuel gas for the GTs.
2.5. Multi-Objective Optimization of the Design
The designs of the combined cycle in both configurations were defined through a constrained multi-objective optimization process. A set of decision variables—such as pressure and temperature levels and pinch-points—was defined. The decision variables were selected among those having a significant influence on the cycle performance. Only continuous variables (i.e., those that can take a value between a lower and upper bound) were used. The selected variables were: (i) steam evaporation pressure (psteam); (ii) superheated steam temperature (Tsteam); (iii) pinch point temperature difference in the OTSG (ΔTOTSG); (iv) condenser pressure (pcond); (v) condenser cooling water temperature difference (ΔTcw); (vi) extraction pressure of the steam in the extraction steam turbine (pextr) and (vii) load of the second GT (GT2 load). Table 2 lists those variables, together with the relative bounds defined for the optimization problem. The variables related to the condenser were not used during the optimization of the backpressure steam turbine cycle because the optimal designs efficiently succeeded to exploit the thermal energy of the steam, and the condenser could be bypassed. The design of the condenser was developed in a second stage in order to ensure the feasibility of the heat rejection in any of the predicted operating conditions. The pressure at the outlet of the backpressure ST was not a decision variable but was arbitrarily selected to be as low as possible in accordance with the thermal load specifications.
The optimization process researched the combination of values of the decision variables that minimized the objective functions. A genetic algorithm (GA) served the purpose, by identifying the Pareto frontier of optimal solutions. The objective functions were selected to be the plant heat rate and the total weight of the combined cycle. Minimizing the heat rate, ergo maximizing the energy efficiency, implied reductions of fuel gas utilization and CO2 emissions. The plant heat rate was defined as:
where ηnet is the net cycle efficiency, is the mass flow rate of natural gas used as fuel in the GT, LHVf is the natural gas lower heating value and is the net plant power output. The second objective function was the total bottoming cycle weight. Minimizing the weight is of paramount importance in offshore applications. The total weight parameter was the summation of the weights of the OTSG, the steam turbine, the generator and the condenser. The weights estimations were based on the hardware design defined for the components listed. Some characteristics of the hardware were kept constant (material selection, tubing layout, etc.), while other were modified according to the values of the decision variables tested (number of tubes, nozzle areas, etc.). Other works defined a single composite variable (e.g., weight-to-power ratio [11]) in order to have a single-objective optimization problem and, thus, a single optimum point. However, in this work it was preferred to define the optimization problem with two objective functions in order to have a broader overview on the possible designs that could be defined and to evaluate the tradeoffs associated with the different solutions (also related to off-design operations).
The GA is a method for solving both constrained and unconstrained optimization problems, which is based on natural selection, the process that drives biological evolution. The GA algorithm does not require the objective function to be differentiable or continuous [31] and has proved itself to be a reliable method for problems of the same type as the one of this paper [32,33]. The GA parameters for the constrained multi-objective optimization process were initially selected in accordance with the indications given by previous similar works [11,13,32] and following corrected with the experience gained with the first runs. The values used in the paper represent the chosen compromise between the likelihood of finding the global minimum and the time necessary to solve the optimization problem:
- Population size 100
- Number of generations 10
- Crossover fraction 0.8
- Function tolerance 10−3.
3. Backpressure Steam Turbine Cycle
The first configuration investigated consists of a combined cycle operated in a cogeneration mode with a backpressure ST. A simplified representation of the cycle layout is shown in Figure 3. The pressure at the outlet of the ST is determined according to the process supply temperature and the thermal load requested by the processing plant. All steam from the turbine is sent to the heat exchanging section where it transfers heat to pressurized water in the heating medium loop (i.e., the cold side of the generic heat exchanger). The conditions at the outlet of the hot side of the generic heat exchanger depend on the thermal load demand. Typically, a two-phase flow is expected which is further cooled in a deaerating condenser. In the case of high thermal loads, saturated water could be obtained which bypasses the condenser. The possibility for a fraction of the live-steam to bypass the ST is also modeled in order to control the maximum live-steam pressure and to ensure the capability to meet the heat demand in any circumstance.
3.1. Design Optimization of the Backpressure Steam Turbine Cycle
In this section, the designs developed and the related performance of the backpressure steam turbine cycles are reported. Four cases—case A, B, C and D—were analyzed. For each case, two design points were considered in the optimization of the combined cycle design, namely the peak conditions and the end-life conditions. The designs were defined through a constrained multi-objective optimization process. The optimization process returned a Pareto frontier of optimal solutions. The range of solutions was screened and an instance representing a good compromise between high efficiency and low total weight was selected. The screening process ruled out the solutions at the edges of the Pareto frontier and those that involved steep gradients (a gain in one variable at the price of a large loss of the other). Among the Pareto solutions remained, the selection was arbitrary. Another solution was pinpointed for each of the two design approaches used. These additional solutions were selected so to be characterized by similar total weight, in order to allow a comparison of the two design approaches, other conditions being equal. Table 3 shows all the designs so defined, with the relative nomenclature, for a total of 16 instances.
The backpressure ST cycle was able to meet power and heat requirements in all cases investigated. Table 4 shows the sets of parameters selected for the optimized designs in all cases, while Figure A1, Figure A2, Figure A3 and Figure A4 in Appendix A show the Pareto frontiers where those designs were selected. The steam evaporation pressures obtained from the optimization process were rather high, in many cases over 30 bar. A previous analysis on offshore combined cycles showed that the optimal pressure was around 25 bar [11]. The mentioned paper investigated a combined cycle without cogeneration of heat. The introduction of a backpressure configuration demanded higher steam pressure in order to achieve a certain degree of steam expansion in the ST and, consequently, acceptable efficiencies. A disadvantage of the high levels of steam pressure, other conditions being equal (such as pinch points and heat transfer surfaces), was a non-optimized waste heat recovery, with relatively high gas temperatures to the stack and a reduced steam generation. In accordance with these considerations, in the cases where the pressure at the ST outlet was lower (2.3 bar, in cases B and D), the optimum steam pressure levels could be decreased in comparison to the cases at equal process heat requirement (cases A and C, respectively), allowing a more efficient exploitation of the waste heat in the OTSG. Another effect observed was that lower steam pressure values were found when higher heat demands needed to be satisfied. This could be verified by looking at the differences in optimum steam pressures between the cases supplying 100% (cases A and B) or 50% of the original heat demand (cases C and D) but also by looking at the different design approaches within the same case (peak designs needed to meet a higher heat demand in comparison to end-life designs). The explanation for this behavior was that a larger heat demand necessitated a larger production of steam in order to be met. Thus, lower steam pressures had to be used, even though they led to a decrease of the ST performance. With regard to the superheated steam temperature, the optimum values obtained were relatively lower from what shown in the literature [11]. The high level of steam pressure demanded a reduced superheated steam temperature in order to ensure a sufficient steam generation and a better exploitation of exhaust gases. Further, the temperature values between the different designs followed the variations of the pressure levels in order to retain an effective heat transfer process in the OTSG. In fact, if a reduction of superheated steam temperature had not followed the reduction of steam pressure, the increased steam-live temperature at the ST inlet would not have compensated for the reduced OTSG efficiency. It was also observed that the optimal share of the load between the two GTs cannot be defined a priori. In most cases, it was convenient to operate one GT at higher load, while the other made up for the remaining power output. However, some designs were defined with an even share of the load (designs BP-Ap2 and BP-Cp2).
3.2. Lifetime Performance of the Backpressure Steam Turbine Cycle Designs
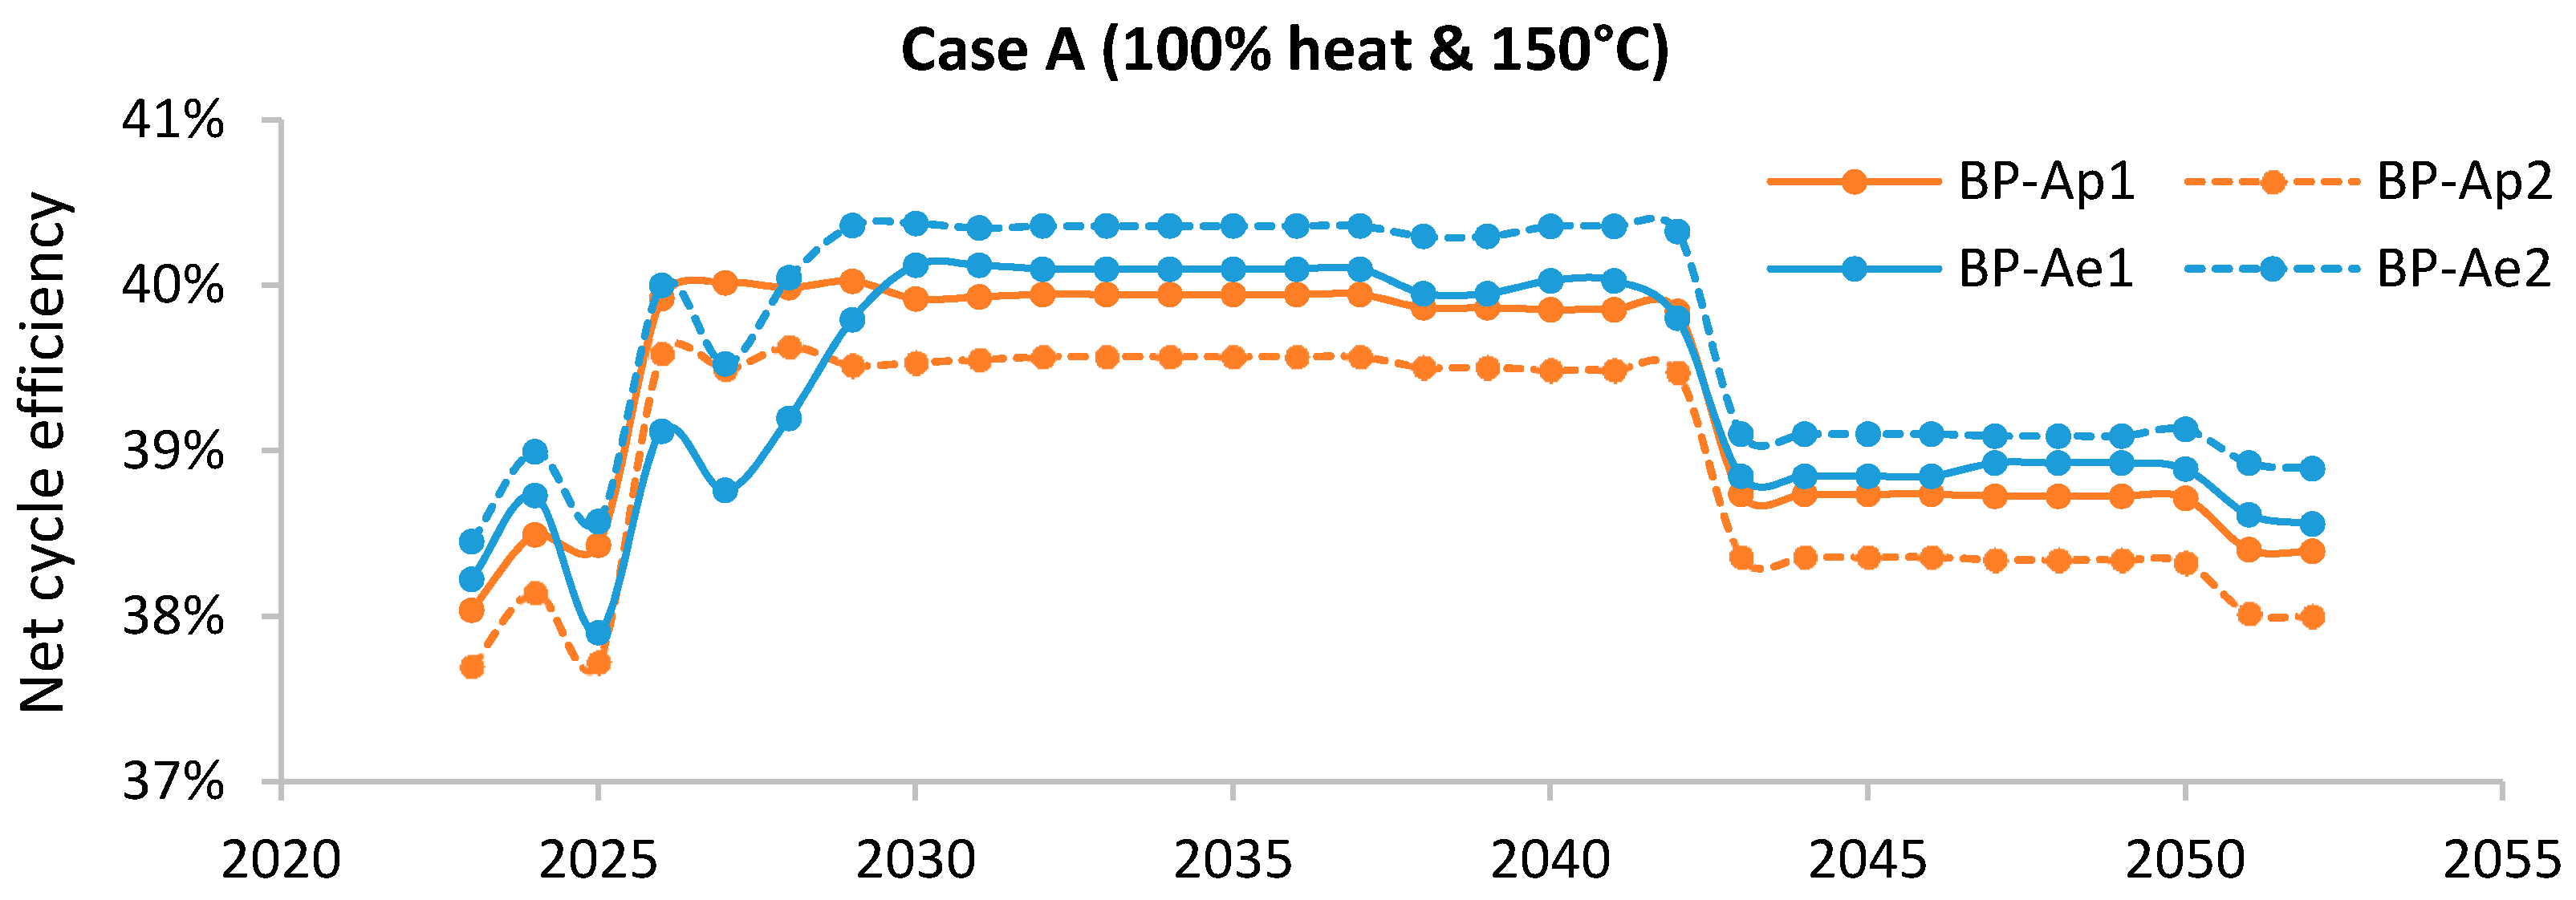
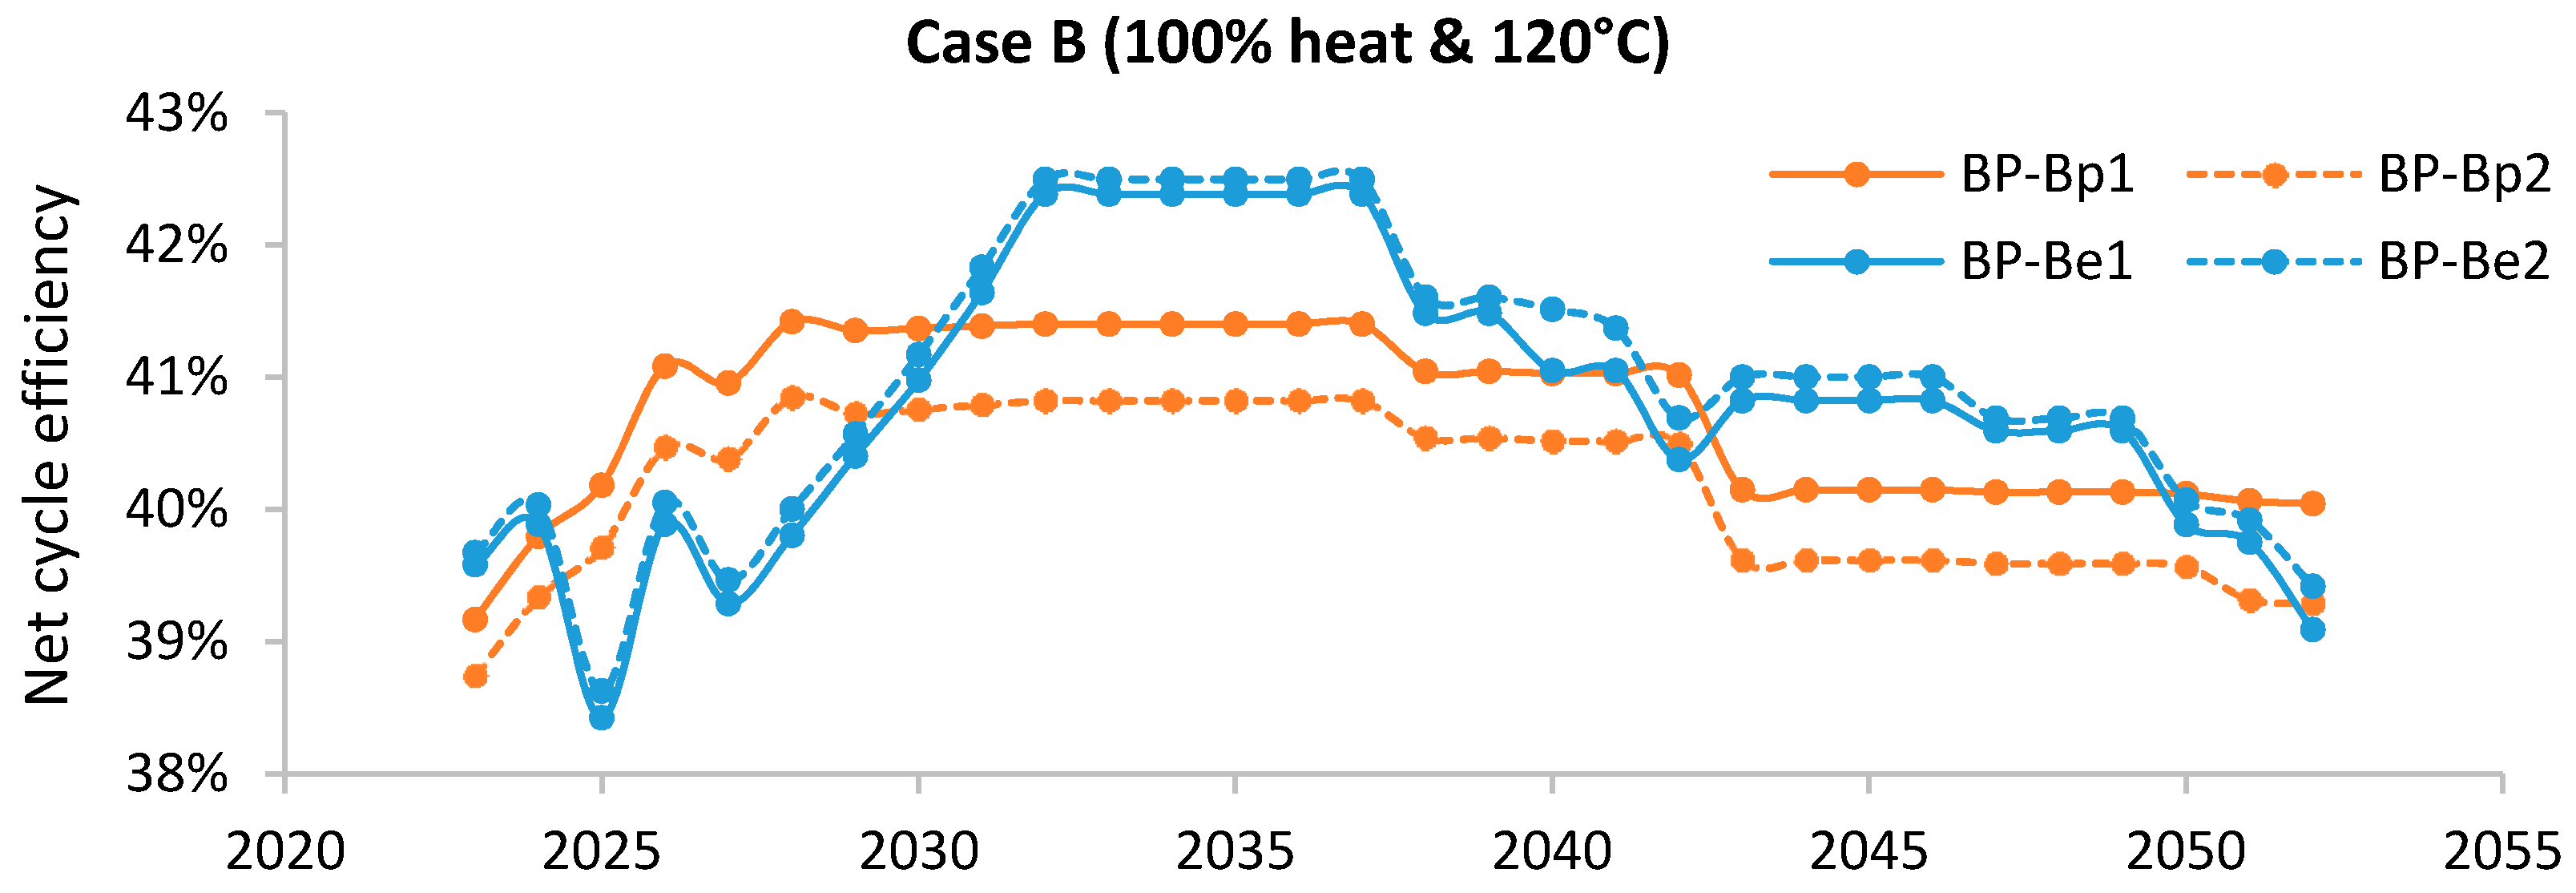
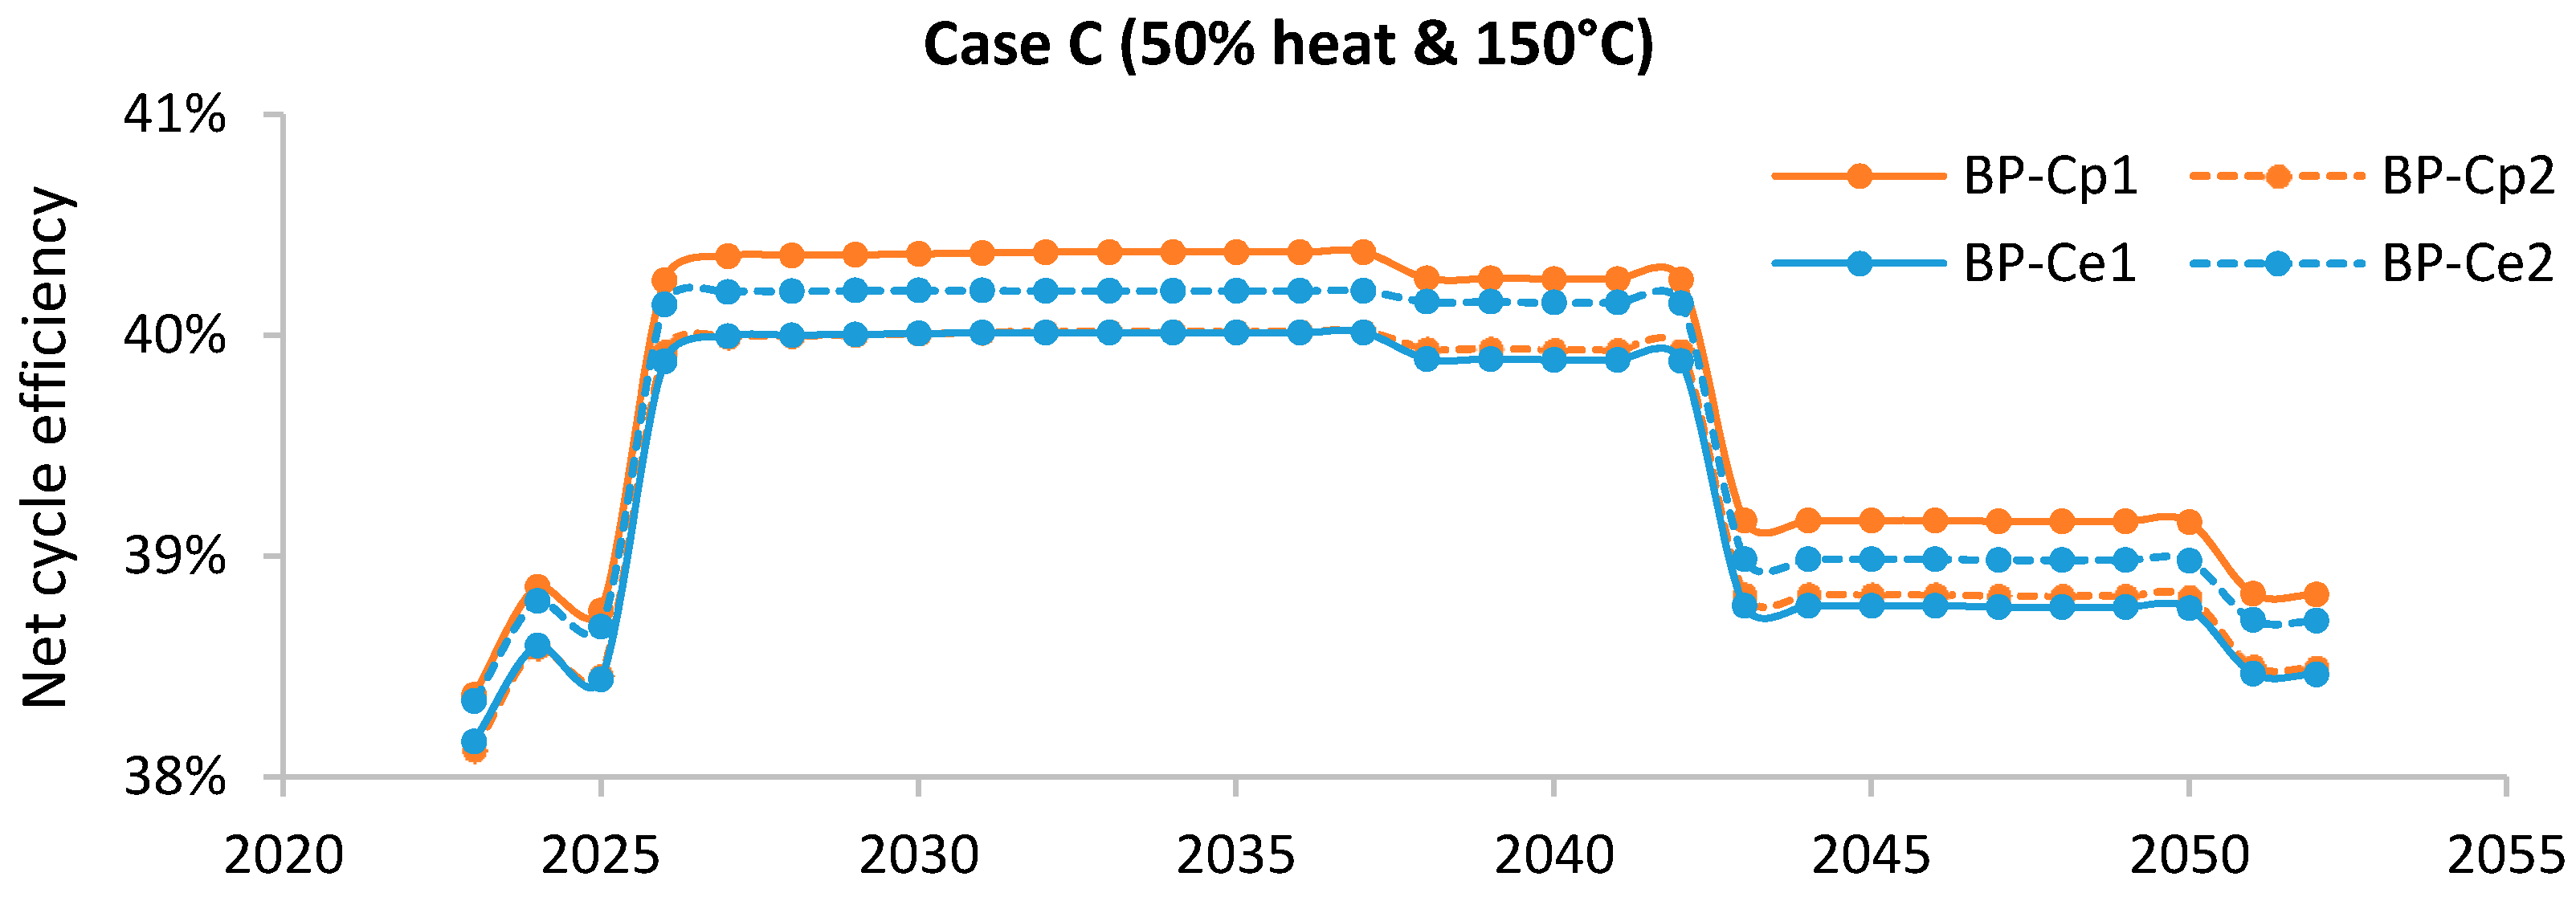
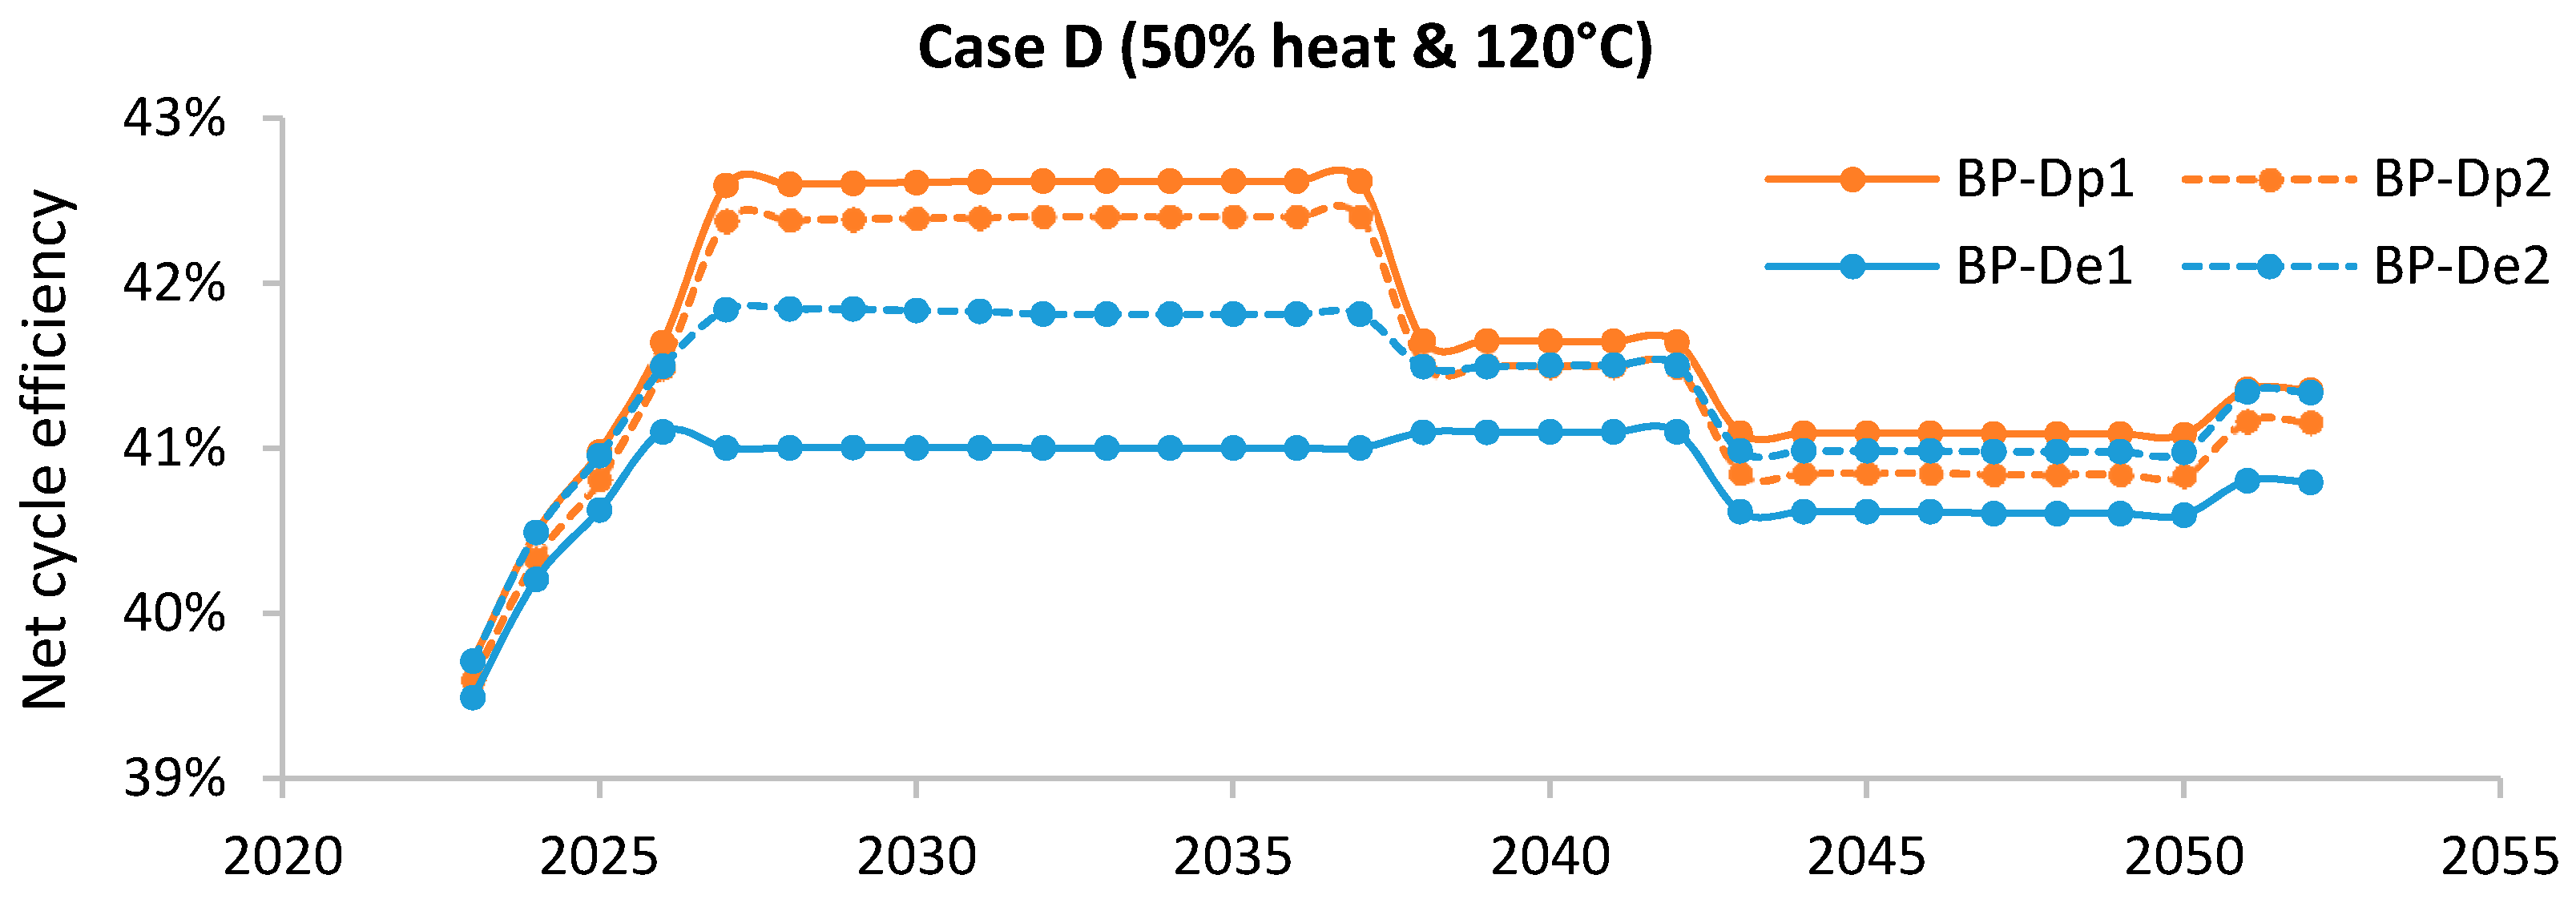
Models of the combined cycle were developed according to the outputs of the design optimization process. Off-design simulations were run, in accordance with the power and heat requirements scenario selected. The main outputs of the off-design simulations are shown in Table 5, while the annual performance is shown in Figure 4, Figure 5, Figure 6 and Figure 7. As a premise, some general considerations on the average net cycle efficiency —calculated as the average between the efficiencies in all the off-design conditions evaluated—should be made. It can be noted that particularly low values were achieved in comparison to a more conventional combined cycle plant. Different factors contributed to this outcome. In the first instance, the large process heat demand of the cases studied significantly decreased the power output which could be generated by the cycle and, thus, the . In addition, the designs developed had as additional objective to limit the overall weight. If the only objective function was to minimize the HR, more efficient cycles would have been defined. Furthermore, the variable heat and power demands entailed low part-load conditions in many instances with a consequent reduction of the average efficiency. In all the cases studied, the designs selected as compromise between good efficiency and limited total weight (BP-Ap1 and BP-Ae1 for the case A, BP-Bp1 and BP-Be1 for the case B, BP-Cp1 and BP-Ce1 for the case C, and BP-Dp1 and BP-De1 for the case D) resulted in combined cycles significantly heavier for the peak designs than for the end-life designs (between +16.8% and +21.5%). This was somehow expected, as for a larger power output there is a larger thermal energy available from the exhausts of the GTs. Thus, the bottoming combined cycle was designed to exploit such increased waste energy available, with a consequent increase of sizes and weights. However, it was also expected a better efficiency of the cycle. This was verified only for the cases C and D characterized by half of the heat demand where the was slightly higher for the peak designs compared to the end-life designs leading to lower cumulative CO2 emissions (a 2.2% and 0.9% reduction, respectively for cases C and D), calculated as:
where are the cumulative CO2 emissions, xav is the plant availability factor (set to 0.96) and is the mass flow rate of CO2 in the exhaust gas. On the other hand, the and, accordingly, the cumulative CO2 emissions are rather similar between the peak designs and the end-life designs for cases A and B. Further elements can be added to the analysis by comparing the performance of the designs selected to have similar total weight (BP-Ap2 and BP-Ae2 for the case A, BP-Bp2 and BP-Be2 for the case B, BP-Cp2 and BP-Ce2 for the case C, and BP-Dp2 and BP-De2 for the case D). For cases C and D, similar total weights resulted in similar lifetime performance between the peak designs and the end-life designs. A limited impact could be ascribed to elements such as the share of the power load between the GTs and the bottoming cycle, the necessity of some steam bypass control and the allocation of weights during the design process. Overall, the observed differences are small and no design approach clearly outperformed the other. The outcome was different for cases A and B. The lifetime performance of the end-life designs showed to be better compared to that of the peak designs, with an increase of the leading to a reduction of cumulative CO2 emissions of 1.9%, both for cases A and B. The end-life designs proved to perform better not only in the tail years of plant’s operation but, surprisingly, also in some of the first years. At a first glance, this outcome was counterintuitive, since the peak designs were optimized for peak conditions, typical of the first years of exploitation of a field. However, those designs were defined in a way to be able to meet the peak requirements of power and, in particular, heat, without activating any control strategies, such as steam bypass. Such capability was obtained at the price of a reduced efficiency in the other operating conditions characterized by a lower heat demand. An analysis of the values of steam evaporation pressure and superheated steam temperature, in cases A and B, helps understand this concept. The levels of live-steam pressure and temperature were kept lower for the peak designs in comparison to the end-life designs because this allowed a larger production of steam, necessary to meet the large process heat demand (i.e., 52 MW). On the other hand, the end-life degns were defined to target high efficiency while meeting a more moderate process heat demand (i.e., 40 MW), resulting in pressures and temperatures closer to the upper bound. The outcome of those design approaches was that the end-life designs could not satisfy the entire peak heat demand unless a fraction of steam bypassed the steam turbine. In the years when the steam bypass was implemented, it was responsible for a significant efficiency decrease. Otherwise, the end-life designs proved to be more efficient, even during some of the first years of plant’s operation. Although to a lower extent, the same considerations can be made when comparing the cases termed as compromise. This explains why, for cases A and B, to a larger total weight related to peak designs did not correspond a reduction in cumulative CO2 emissions.
The outlined trend could be observed in Figure 4 and Figure 5. The end-life designs are characterized by an oscillating performance, especially in years with large heat-to-power ratios. In fact, when the heat demand became sufficiently large (e.g., year 2027), some steam needed to bypass the ST, leading to relatively low net cycle efficiencies. The peak designs, on the other hand, showed a more stable but, on average, slightly worse performances, due to the more conservative designs. Summing up, if high efficiency has to be targeted and the total weight is not a major concern, the peak design is probably the best approach. However, limitation of weights are as a matter of fact an issue for offshore installations. Given that, the end-life designs seem able to return better lifetime performance at equal total weights. This consideration is especially valid for cases characterized by a high process heat demand.
4. Extraction Steam Turbine Cycle
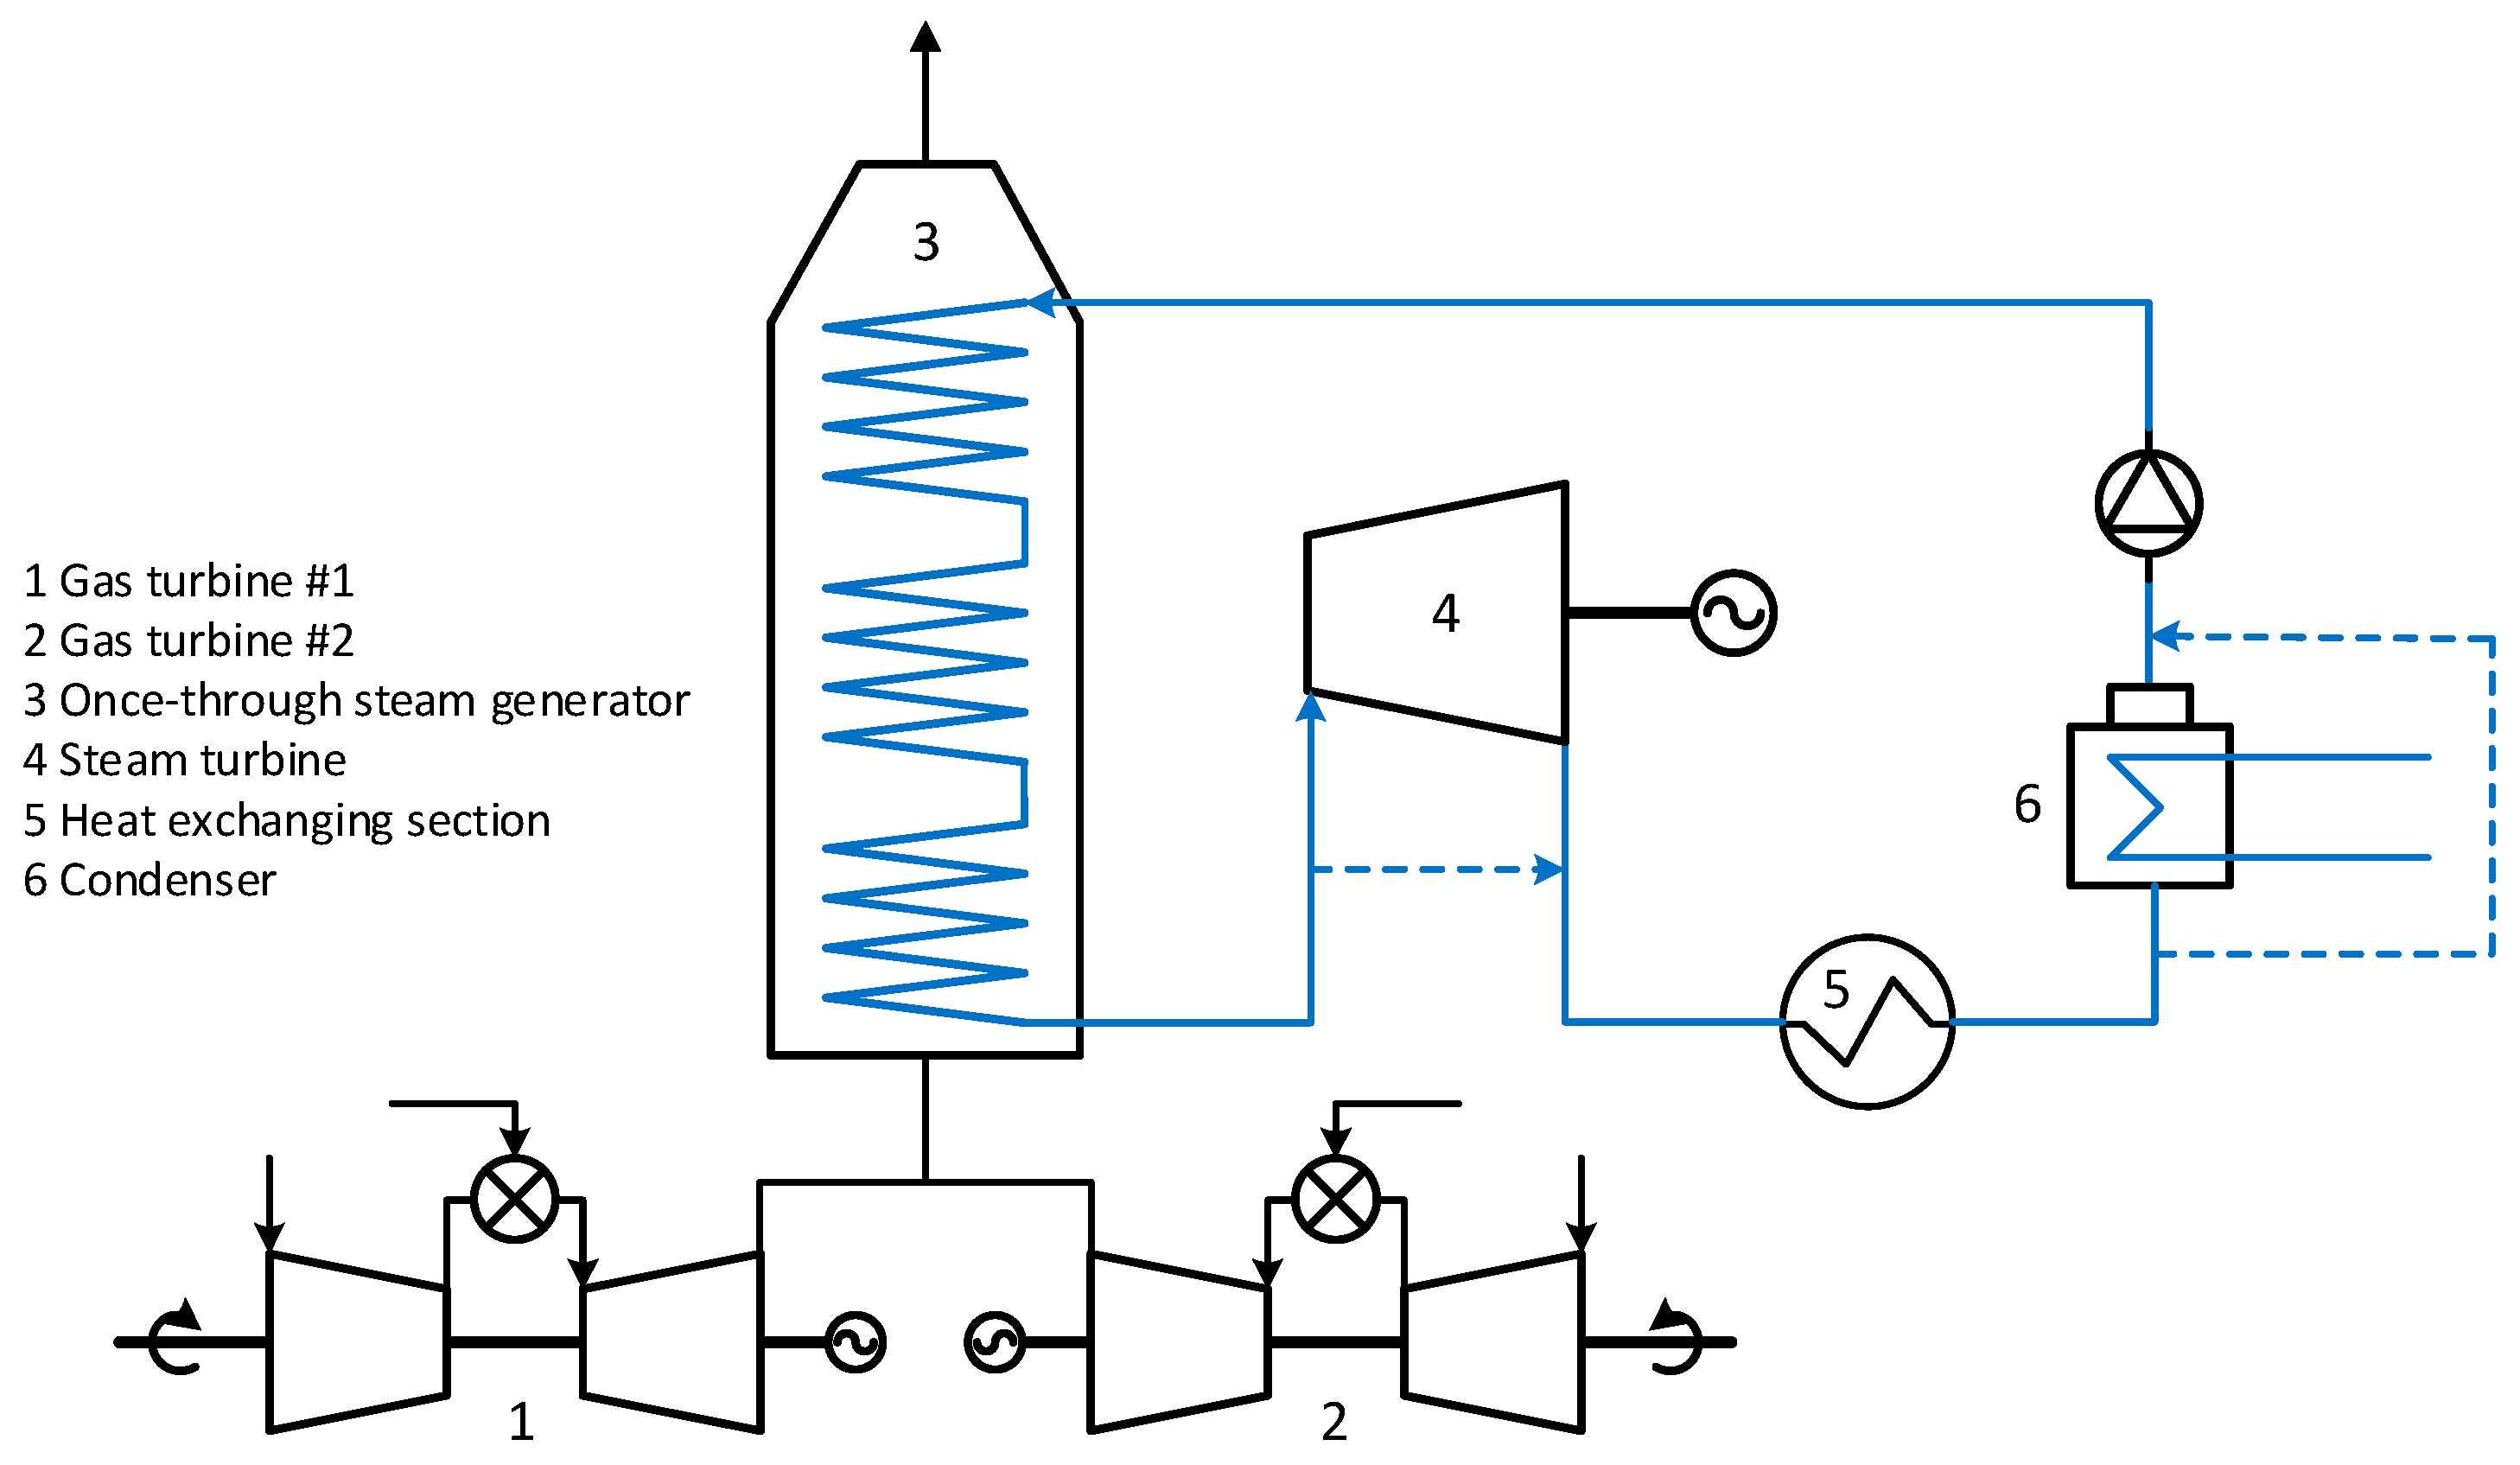
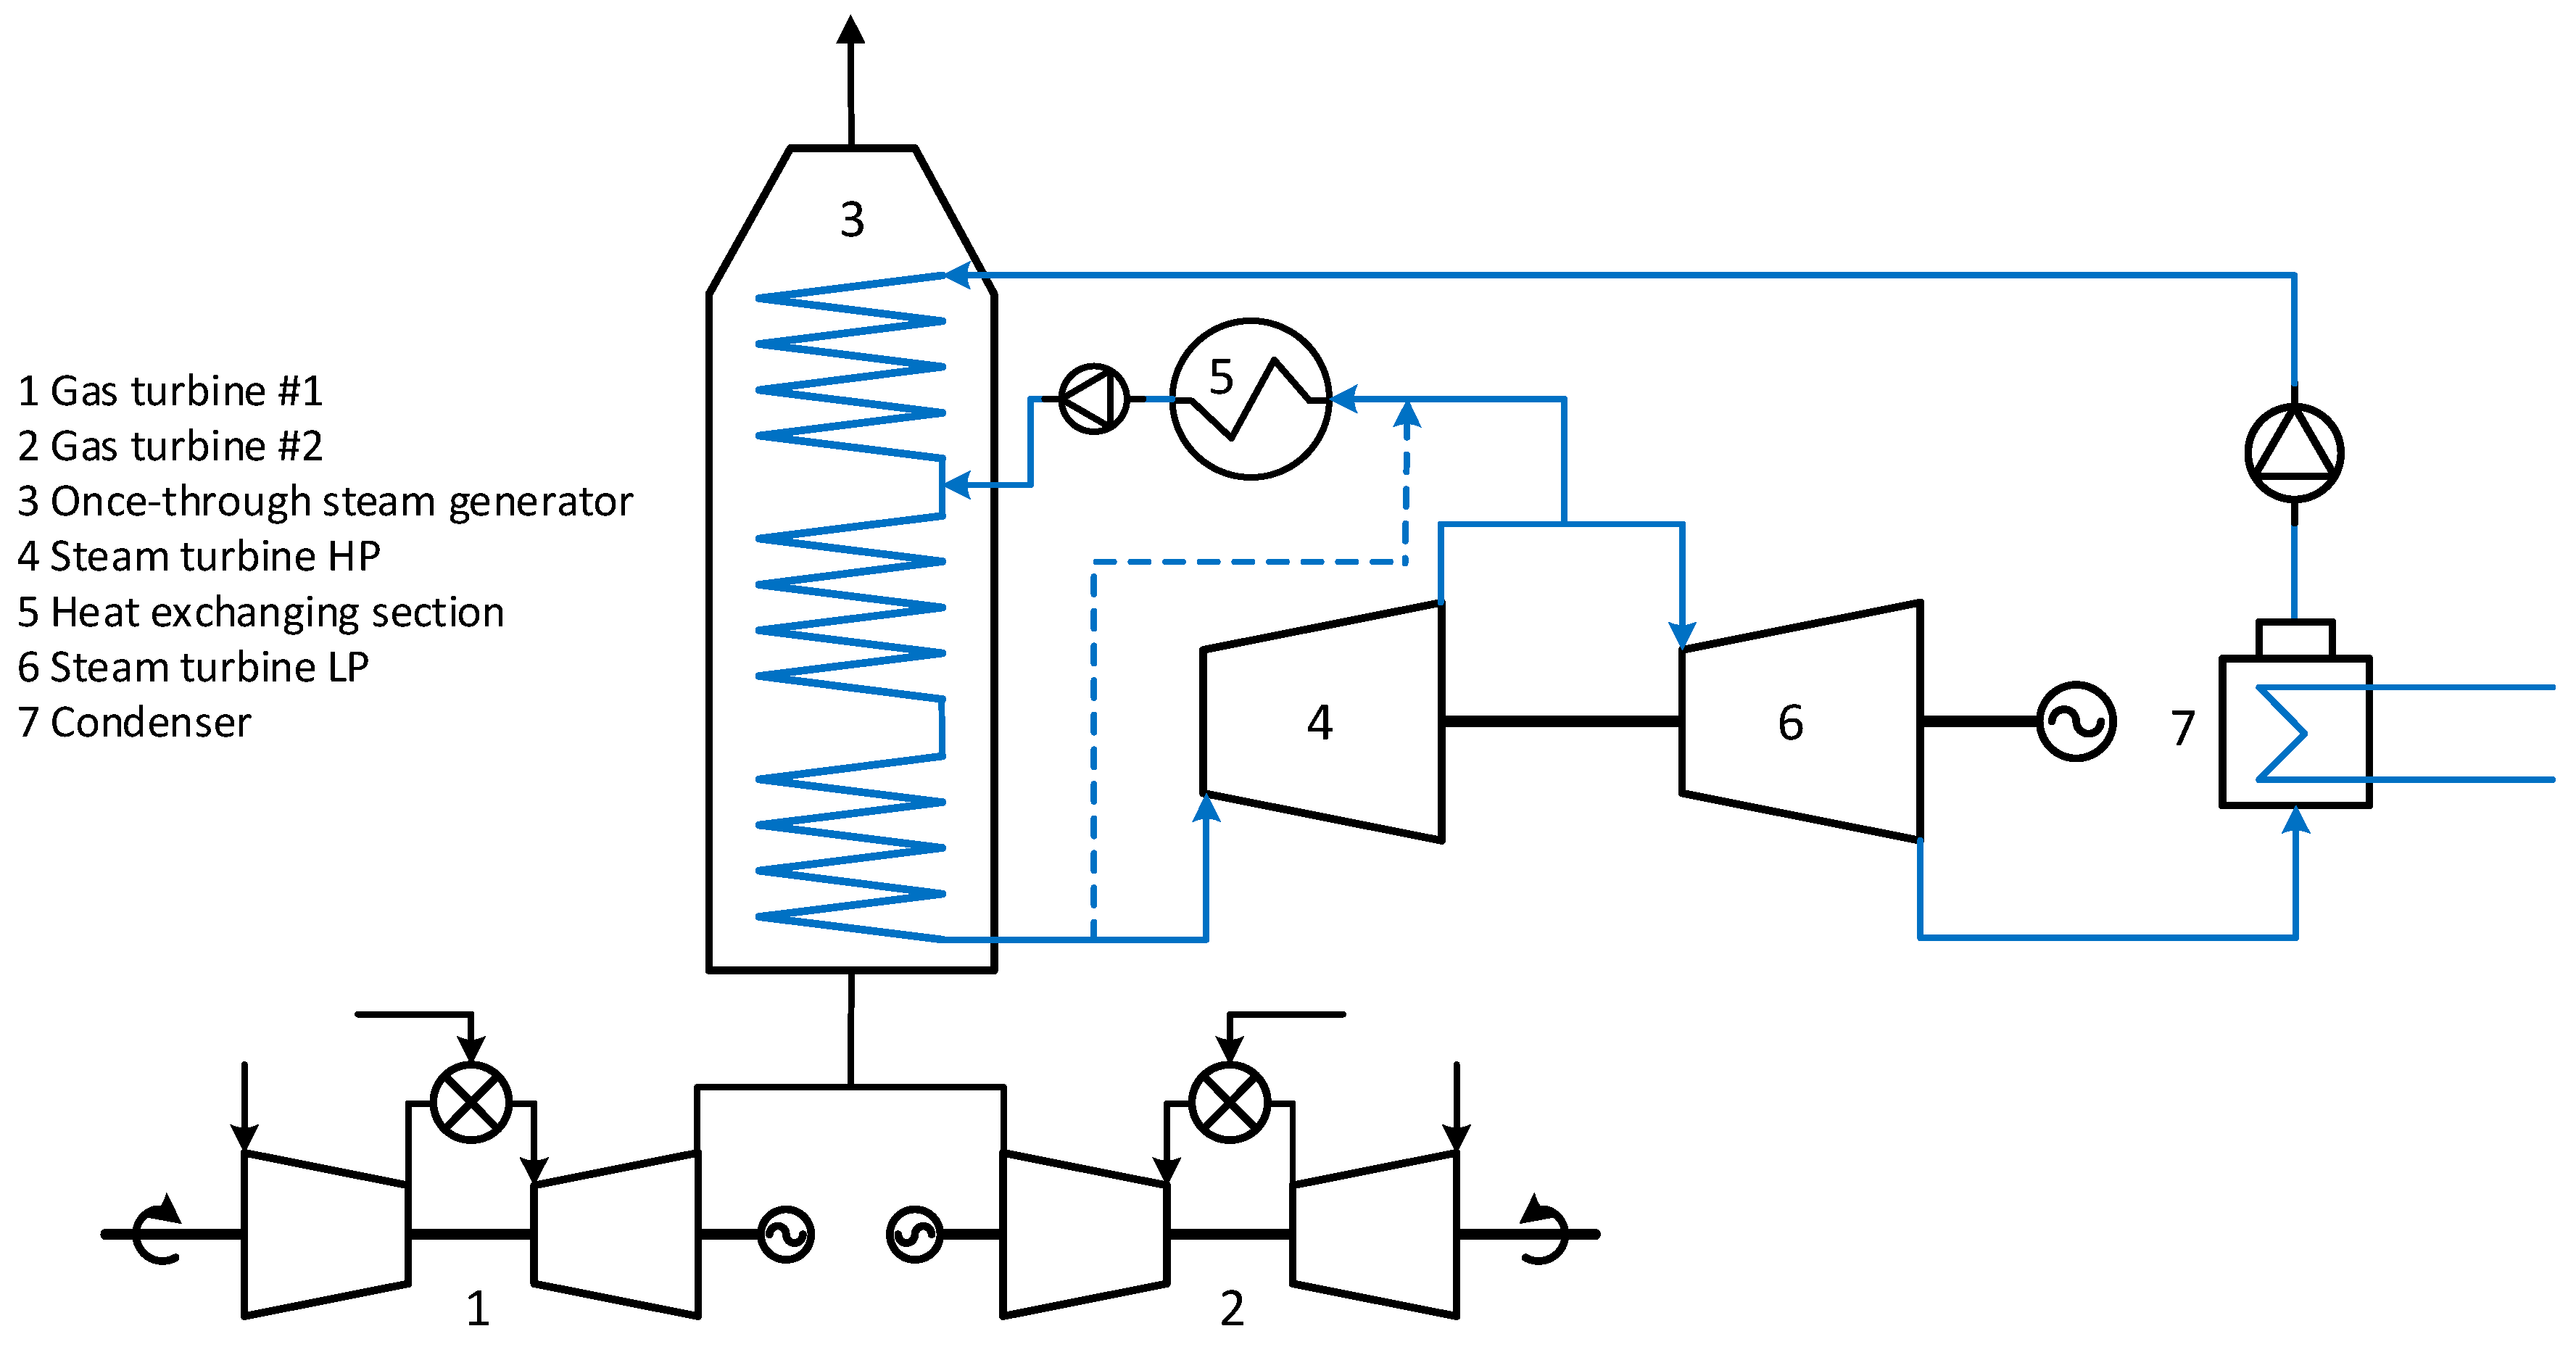
The second configuration investigated consists of a combined cycle operated in a cogeneration mode with an extraction ST. A simplified representation of the cycle layout is shown in Figure 8. The extraction ST is fitted with an extraction nozzle, allowing part of the steam to be withdrawn at an intermediate stage while the remainder of the steam is further expanded and exhausted to a condenser. The ST is equipped with a valve to maintain constant pressure of the extraction steam while the turbine load and extraction demand are varying [34]. The fraction of steam extracted is determined according to the thermal load requested by the processing plant. This amount of steam is sent to the heat exchanging section where it transfers heat to pressurized water in the heating medium loop (i.e., the cold side of the generic heat exchanger). The outlet of the hot side of the generic heat exchanger is subcooled water which is pumped to be fed to a proper economizer section of the OTSG. The possibility for a fraction of the live-steam to bypass the ST is also modeled in order to control the maximum live-steam pressure and to ensure the capability to meet the heat demand in any circumstance. This process configuration in not new to the offshore field, although it has rarely been used. For instance, it was the concept selected on some offshore oil and gas installations in the Norwegian continental shelf [7].
4.1. Design Optimization of the Extraction Steam Turbine Cycle
In this section, the designs developed and the performance of the related extraction steam turbine cycles are reported. The same procedure for the definition of the designs was carried out as that outlined for the backpressure steam turbine cycle. Table 6 shows all the designs defined for the extraction steam turbine cycle configuration, with the relative nomenclature.
The design of the extraction steam turbine cycle could not be developed for cases A and B. The cycle was not able to fulfil the energy requirements in all the operating conditions characterizing the life of the plant. An unfeasible fraction of steam would have needed to be extracted from the ST. A first conclusion could then be drawn. For typical offshore conditions, a combined cycle design with an extraction ST is a viable option only within certain limits of heat-to-power ratio. Beyond that threshold, a configuration based on a backpressure ST is the only option for cogenerating power and heat with a combined cycle. Table 7 shows the sets of parameters selected for the optimized designs in cases C and D, while Figure A5 and Figure A6 in Appendix B show the Pareto frontiers where those designs were selected. One clear indication for the design of these systems regarded the extraction pressure. It showed to be more beneficial to keep the extraction pressure as low as possible given the constraints in the heat transfer process, rather than having higher pressures but reduced fractions of steam extracted. This is in line with a more efficient heat transfer process in the heating exchanging section. Considering the limitations due to the process supply temperature (minimum pextr of 5.4 bar and 2.3 bar, respectively for a process supply temperature of 150 °C or 120 °C), the pressures obtained from the optimization processes tended to level off to those values. Relatively high steam evaporation pressures and low superheated steam temperatures were obtained, in line to what observed for the backpressure steam cycle configuration. Similar considerations apply to explain those outputs. For case D, it can be noticed that the values became closer to what showed by a previous work [11], which referred to an offshore combined cycle but not in a cogeneration mode. This confirmed the effectiveness of the analysis. Assuming that the referenced values describe the optimum for a combined cycle generating only power, it is sound that the optimized parameters of the combined cycles investigated in this work tended to those values when the heat requirement was low (like in case D) and not strongly affecting the ST performance. It was also observed that an optimal design involved an uneven share of the load between the two GTs in all the designed defined, with one GT operating efficiently at high loads while the other made up for the remaining power.
4.2. Lifetime Performance of the Backpressure Steam Turbine Cycle Designs
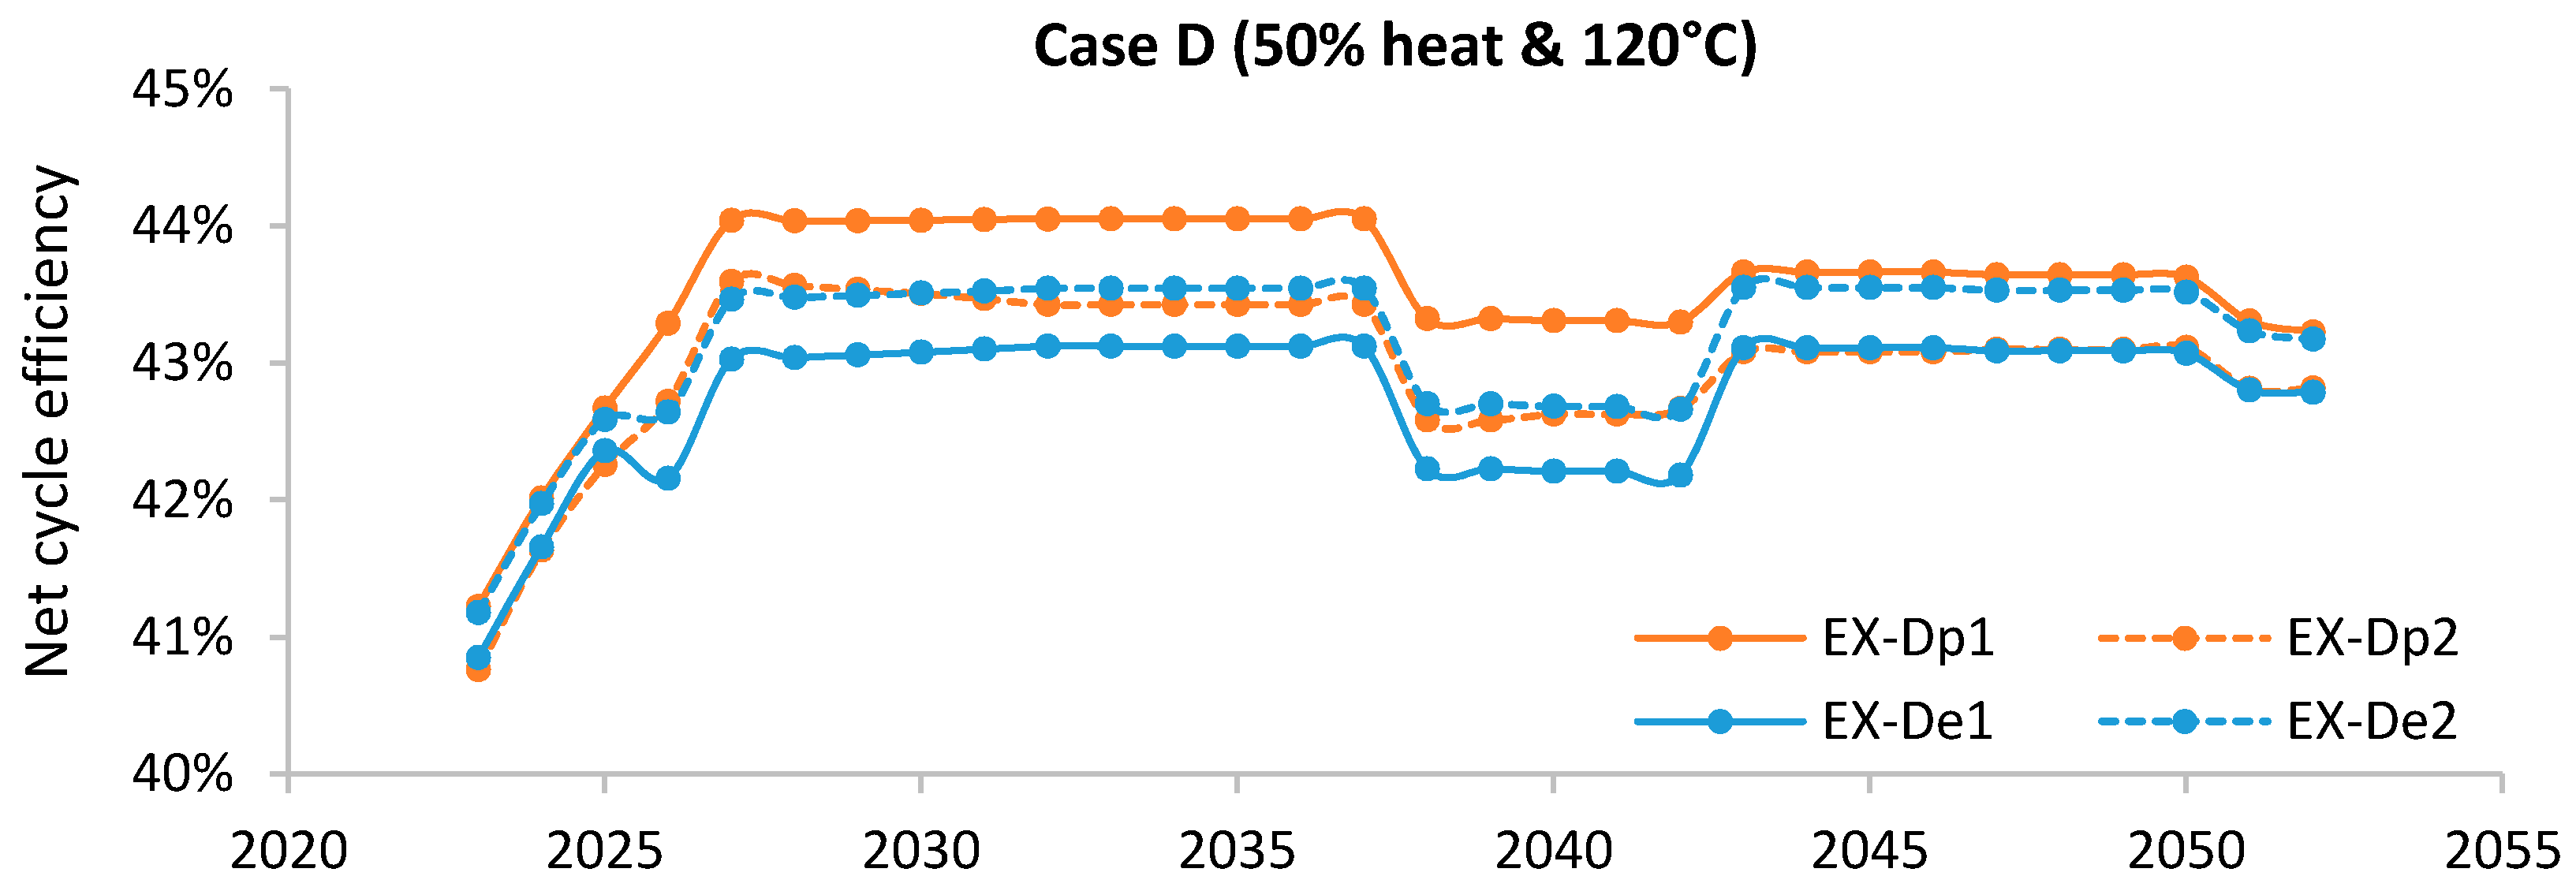
Models of the combined cycle were developed according to the outputs of the design optimization process. Off-design simulations were run, in accordance with the power and heat requirements scenario selected. The main outputs of the off-design simulations are shown in Table 8, while the annual performance is shown in Figure 9 and Figure 10. Similar considerations to those outlined for the backpressure steam turbine cycle could be made to explain the low values of average net cycle efficiency achieved. The designs selected as compromise between good efficiency and limited total weight (EX-Cp1 and EX-Ce1 for the case C, and EX-Dp1 and EX-De1 for the case D) resulted in combined cycles significantly heavier for the peak designs than for the end-life designs (+14.9% and +16.6%, respectively for case C and D). The reason was the larger thermal energy available from the exhausts of the GTs which, in order to be exploited, demanded larger heat transfer surfaces and, ultimately, augmented sizes and weights of the bottoming cycle equipment. To this increase in the weights, it was supposed to correspond a better cycle efficiency. This was verified to a certain extent. The was slightly higher for the peak designs compared to the end-life designs leading to lower cumulative CO2 emissions (a 2.1% and 1.9% reduction, respectively for case C and D). In order to assess the relative performance of the two design approaches at equal conditions, the outputs of the designs with similar total weight were further analyzed (EX-Cp2 and EX-Ce2 for the case C, and EX-Dp2 and EX-De2 for the case D). The lifetime performance of the end-life designs was better compared to that of the peak designs, with an increase of the leading to a reduction of cumulative CO2 emissions of 0.6% and 0.4%, respectively for case C and D. The end-life designs, being optimized for the end-life conditions, performed more efficiently in the tail years of plant’s operation. In the peak years, though, the peak designs did not outperform the end-life designs as could be expected whereas the performances were rather similar. The main reason for this outcome was that the gap in efficiency in the bottoming cycle of the end-life designs tended to be closed by the higher loads at which the GTs were operated. It is known that for a common combined cycle the GT is responsible for the largest share of total power output. This fact was even more stressed in the system here investigated since the bottoming cycle power output was decreased in order to be able to meet also the heat requirements and, in particular, at peak conditions when the heat demand is larger. Thus, the efficiency of the GT simple cycle weighed much more than that of the steam bottoming cycle and the GT efficiency increase, due to the higher GTs loads, positively contributed to the overall efficiency in the end-life designs. Summing up, high efficiency can be achieved with the peak design approach but with large total weight of the bottoming cycle. If the total weight has to be limited, the end-life designs proved to return slightly better performance throughout the entire lifetime.
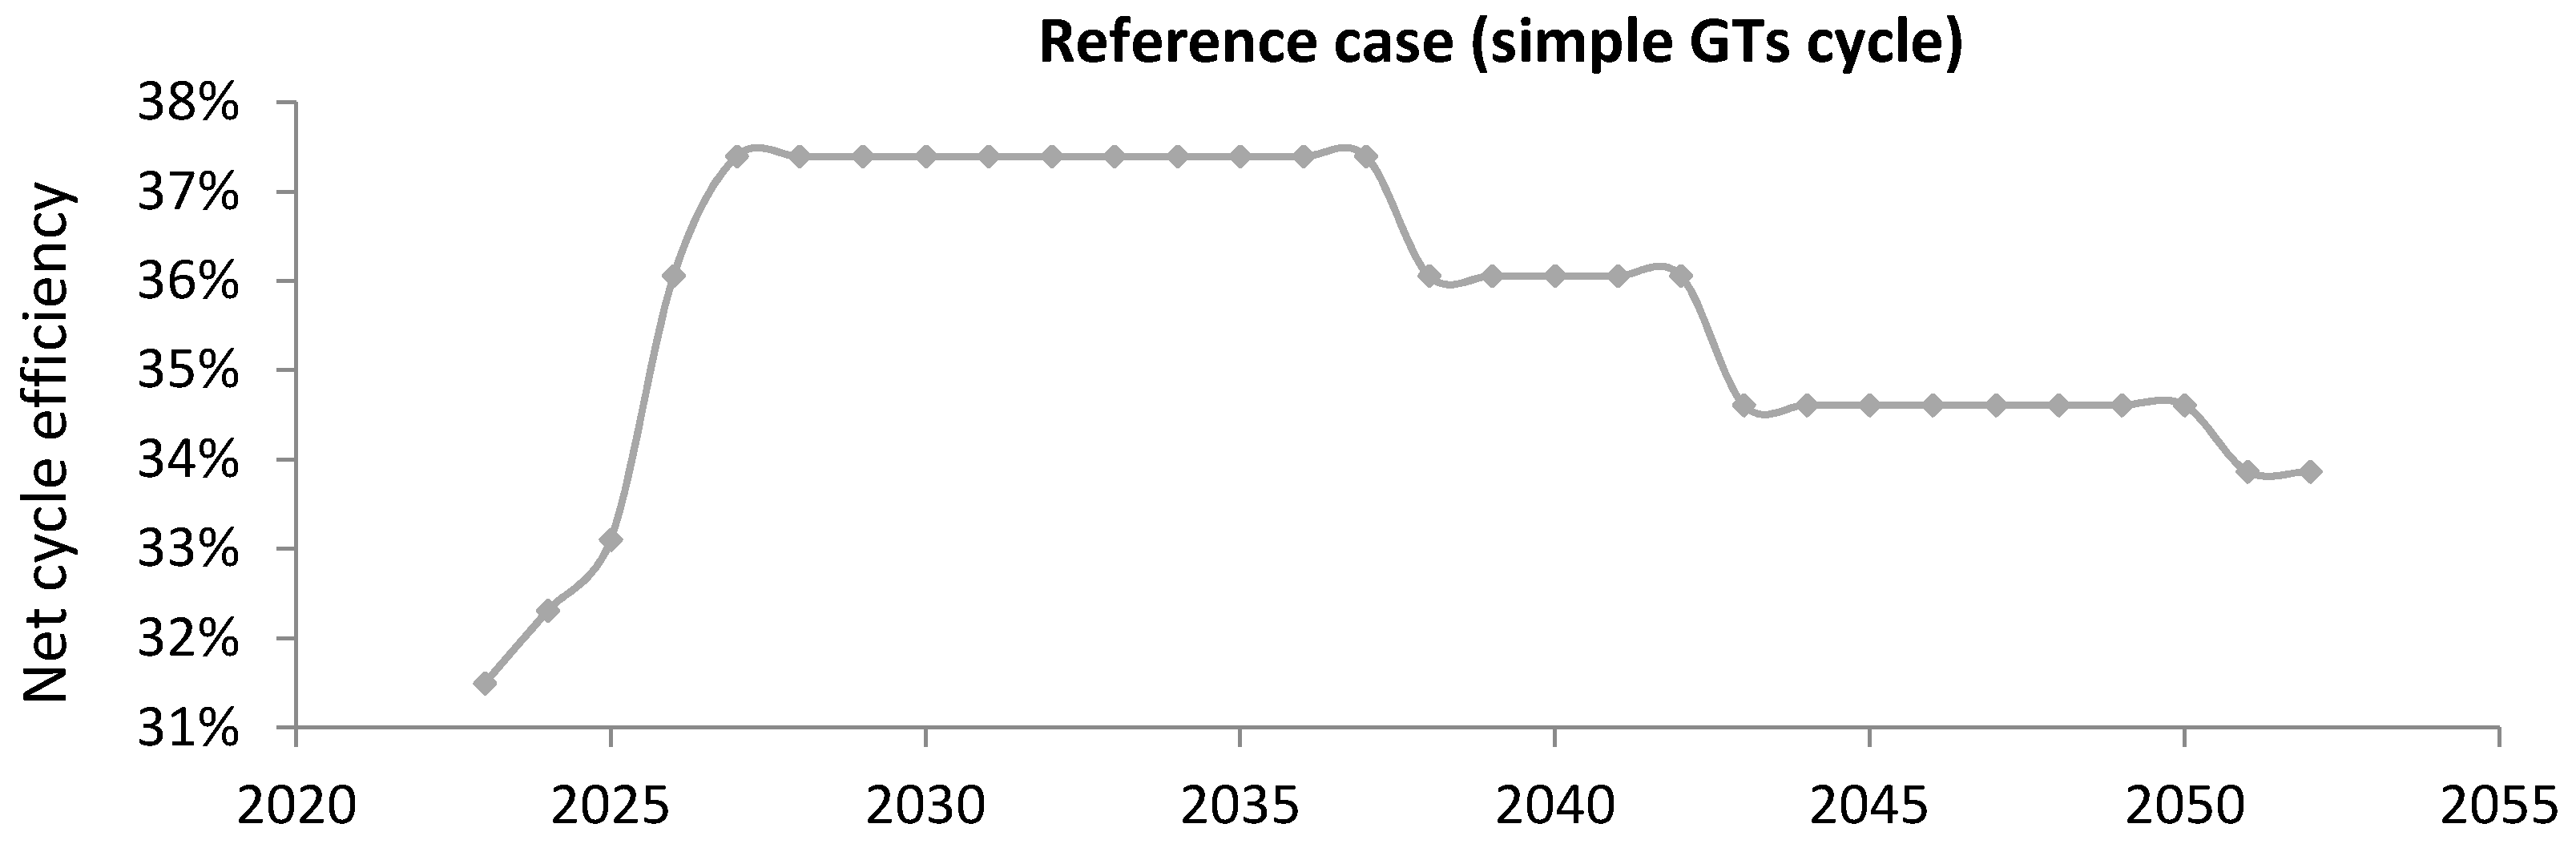
5. Reference Case Simple gas Turbine Cycle
In order to provide a complete overview, the effectiveness of the combined cycle configurations studied needed to be compared to a reference case. The common practice in offshore oil and gas installations is to use simple GT cycles to generate power. The process heat is normally obtained by exploiting the thermal energy in the exhaust GT gases by means of WHRUs. A reference case model was developed to simulate this common layout. Two GTs (2 X GE LM2500 + G4) were modeled and their operation planned in order to meet the power demand throughout the plant’s lifetime. The load was evenly shared between the two GTs, as this is the typical operational strategy implemented. A model of the WHRU was not developed but it was verified that in every operating conditions simulated, the exhaust gases would be thermodynamically able to cover the process heat requirements. The simulation throughout the plant’s lifetime returned a of 35.6% and cumulative CO2 emissions of 7.93 Mton. A breakdown of the net cycle efficiency evolution throughout the years is shown in Figure 11. A significant variability of the efficiency can be noticed, in line with the typical performance decay of a GT at part-loads.
6. Comparative Analysis of the Results
A comparative analysis of the results reported in Table 5 and Table 7 suggested some initial considerations. For high heat-to-power ratios (cases A and B) a comparison could not be made as the extraction steam turbine cycle demonstrated to be unable to meet the process heat demand. When more relaxed heat requirements were considered, designs for both configurations could be developed. On the whole, it was noted that the optimization processes led to cycles with a similar total weight, even though with different layouts. This trend was also verified by looking at the entire Pareto frontier for all the cases (see Appendix A and Appendix B). With regard to the cycles’ performance, evaluated in terms of , the extraction steam turbine cycles demonstrated to perform significantly better than the backpressure steam turbine cycles. Given that the weights were similar, the extraction layout appeared generally advantageous. In order to be more specific in the analysis, Table 9 shows some selected results for the two combined cycle configurations studied, together with the performance of the reference case. For each of the cases analyzed (cases A, B, C and D), the most efficient design was chosen among those characterized by the same weight. The simple GTs cycle is represented with the same performance in every case because its operation is not affected by the different thermal loads.
The convenience of cogenerating heat and power through a combined cycle decreases with the increase of the heat requirement. For cases A and B, characterized by 100% of the original heat demand, limited gains in efficiency were achieved, especially when a high temperature heat demand was considered (case A). In such case a 9.3% CO2 emission reduction was obtained, in comparison to a simple GTs cycle, while a lower heat temperature (case B) helped increasing the CO2 emission reduction to 12.1%. The benefits of using a combined cycle are more marked when the heat requirement decreases. For cases C and D, characterized by 50% of the original heat demand, an extraction steam turbine cycle design could be developed and led to a cut of the cumulative CO2 emissions of 21.5% and 22.2% in case C and D, respectively. More limited reductions were obtained by the backpressure steam turbine cycle designs (9.1% and 13.3% in case C and D, respectively). Overall, the backpressure steam turbine cycle proved to be the only option to cogenerate heat and power through a combined cycle when high heat-to-power ratios applies but the performance improvements in comparison to a simple GTs cycle are limited. The effectiveness of those combined cycles are strongly affected by the temperature at which the heat needs to be supplied to the plant processes and only to a lower extent by the amount of heat requirement. The process supply temperature directly influences the backpressure of the steam turbine and, accordingly, the efficiency of the bottoming cycle. Although the extraction steam turbine cycle could satisfied only smaller heat demands, in those cases it demonstrated to be the most effective option, showing significant performance improvements in comparison to a simple GTs cycle. Further, its effectiveness is not rapidly decreasing with increased process supply temperatures, making these cycles attractive for various types of offshore installations.
The analysis presented provided some necessary first indications in an overall assessment on the feasibility of offshore combined cycles for cogeneration of power and heat. However, a comprehensive evaluation should take into account a number of additional aspects. A first issue concerns the weight of the power generation unit. An economic analysis would be needed to verify if the increase in efficiency and the reduction in CO2 emissions would be sufficient to repay the larger capital investment connected to an increased weight. In order to provide some initial elements with regard to this, the results of a simplified analysis are shown in Table 10. The analysis evaluated the economic benefits which could be obtained by operating the combined cycles reported in Table 9. The annual positive cash flows, associated with a reduced gas utilization and lower CO2 emissions, were calculated and discounted with an interest rate equal to 7%. The gas price estimations were based on [35], in particular on the new policies scenario developed by the International Energy Agency (IEA). The CO2 price estimations took into account that the petroleum sector in Norway is subjected both to a CO2 tax and to the EU Emissions Trading System (EU ETS). The specific values in 2016 of CO2 tax and cost of CO2 allowances were used for the calculations. The annual discounted cash flows, related to a decrease in the operational costs, were summed up throughout the plant’s life to give the overall saving. This term can be thought as the maximum additional capital investment that could be used to install a combined cycle instead of a simple GTs cycle in order to have a better economic performance.
The results proposed in Table 10 are based on a number of simplifying assumptions (e.g., gas and CO2 prices) and, as such, cannot be deemed as a conclusive indication on the economic performance of the combined cycles. On the other hand, the sake of the analysis was simply to give a first outlook on the economic viability of the offshore combined cycles presented in the paper. The cycles showed a larger margin to reach economic competitiveness when a low heat-to-power ratio was considered. In particular, the implementation of the extraction steam turbine cycle resulted in overall operational savings of 120 M$ and 125 M$ for cases C and D, respectively. With regard to the backpressure extraction steam turbine cycle, the estimated overall operational savings are generally lower and strongly depending on the temperature of the process heat. They range between a maximum of 68 M$ for a temperature of 150 °C and a maximum of 96 M$ for a temperature of 120 °C.
Another aspect which should be considered is the responsiveness of the power generation system, which is expected to decrease when introducing a bottoming cycle. In offshore applications, characterized by a high variability of power and heat requirements, this could be an important element for a complete assessment of the technology.
7. Conclusions
The paper provided a first assessment on combined cycles for cogeneration of power and heat in offshore oil and gas installations. An installation in the Barents Sea was taken as basis for the analysis and different scenarios of power and heat requirements were considered. Steam was considered as working medium for the bottoming cycle and two configurations were tested: backpressure steam turbine cycle and extraction steam turbine cycle. At first, the best approach for the design of the combined cycle was investigated for the various cases. In particular, it was analyzed whether it is more convenient to design the cycle to comply with peak power and heat requirements or with the requirements characterizing the end-life years of the plant. The designs were defined through a constrained multi-objective optimization process, with the cycle heat rate and the total weight of the bottoming cycle as objective functions. For both the combined cycle configurations, the end-life design approach generally returned overall better performances at equal total weights of the bottoming cycle, when the entire plant’s lifetime is considered. The peak design approach resulted in designs reaching high efficiency but at the price of a significant weight of the equipment, which is generally not acceptable for offshore applications. The difference between the two design approaches was particularly evident for the backpressure steam turbine cycle when asked to satisfy large heat demands. In those instances, the designs defined through the peak design approach were able to meet the heat demand in every circumstance, without applying any control strategy (e.g., steam bypass) and, thus, in a more efficient manner. On the other hand, when the most common situation of a more limited heat demand was to be simulated, the efficiencies were lower compared to those of the end-life designs. Once identified the best designs, the effectiveness of the combined cycle configurations was evaluated, taking as reference case a simple GTs cycle with waste heat recovery unit. For high heat-to-power ratios the backpressure steam turbine cycle showed to be the only option to cogenerate power and heat through a combined cycle. The implementation of such combined cycle led to better average efficiencies and to a consequent reduction of cumulative CO2 emissions ranging from 9.3% to 12.1%, depending on the temperature at which the process heat needed to be supplied. More significant performance improvements could be achieved in scenarios characterized by lower heat-to-power ratios. In those cases, the extraction steam turbine cycle proved to be more effective than the backpressure steam turbine cycle and resulted in potential cuts of CO2 emissions up to 22.2%. Summing up, the backpressure steam turbine cycle can be considered in offshore installations characterized by low temperature large process heat demands, for example when there are large heat requirements for the crude oil separation. For cases where the heat to be supplied to the plant processes is more limited, irrespective of the temperature at which this heat is requested, the extraction steam turbine cycle proved to be attractive. This could be the case of installations including gas treatment processes.
Acknowledgments
This publication has been produced with support from Lundin Norway AS within the research project “Electrification and efficient energy supply of offshore oil platforms”. The funds for covering the costs to publish in open access were provided by the Norwegian University of Science and Technology—NTNU.
Author Contributions
Luca Riboldi developed the models, defined the optimization problems, carried out the simulations and wrote the manuscript. Lars O. Nord contributed to the critical analysis of the results, reviewed the manuscript and supervised the work.
Conflicts of Interest
The authors declare no conflict of interest.
Abbreviations and Symbols
| CHP | combined heat and power |
| BP | backpressure |
| EX | extraction |
| FPSO | floating production, storage and offloading |
| GT | gas turbine |
| HR | heat rate |
| LHVf | natural gas lower heating value |
| cumulative CO2 emissions | |
| mass flow rate of CO2 in the exhaust gas | |
| . | mass flow rate of natural gas |
| ORC | organic Rankine cycle |
| OTSG | once-through heat recovery steam generator |
| pcond | condenser pressure |
| pextr | extraction pressure |
| psteam | eam evaporation pressure |
| ST | steam turbine |
| Tsteam | superheated steam temperature |
| VGV | variable guide vanes |
| net plant power output | |
| WHRU | waste heat recovery unit |
| xav | plant availability factor |
| Greek letters | |
| ΔTcw | condenser cooling water temperature difference |
| ΔTOTSG | pinch point temperature difference in the OTSG |
| ηnet | net cycle efficiency |
Appendix A. Pareto Frontiers of the Backpressure Steam Turbine Cycle for Cases A, B, C and D
Figure A1.
Pareto frontiers of backpressure steam turbine cycle for case A at peak (BP-Ap) and end-life (BP-Ae) conditions.
Figure A1.
Pareto frontiers of backpressure steam turbine cycle for case A at peak (BP-Ap) and end-life (BP-Ae) conditions.
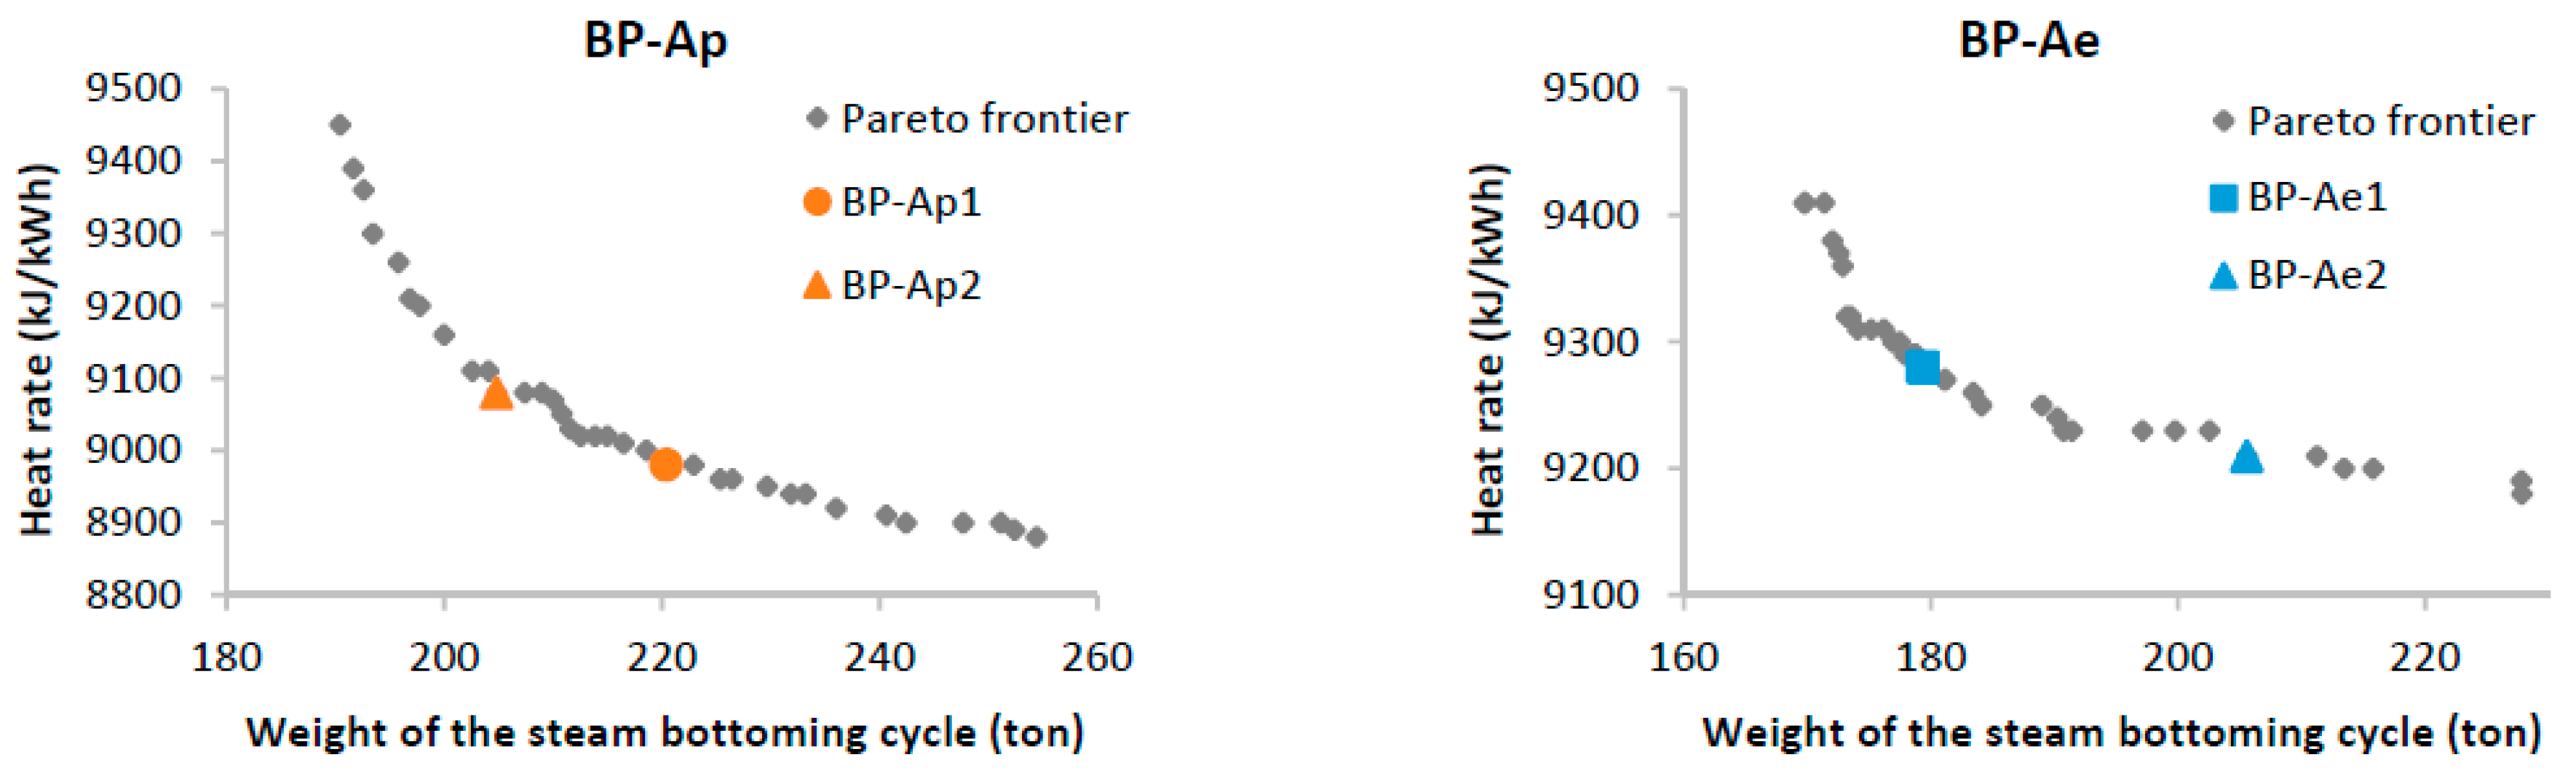
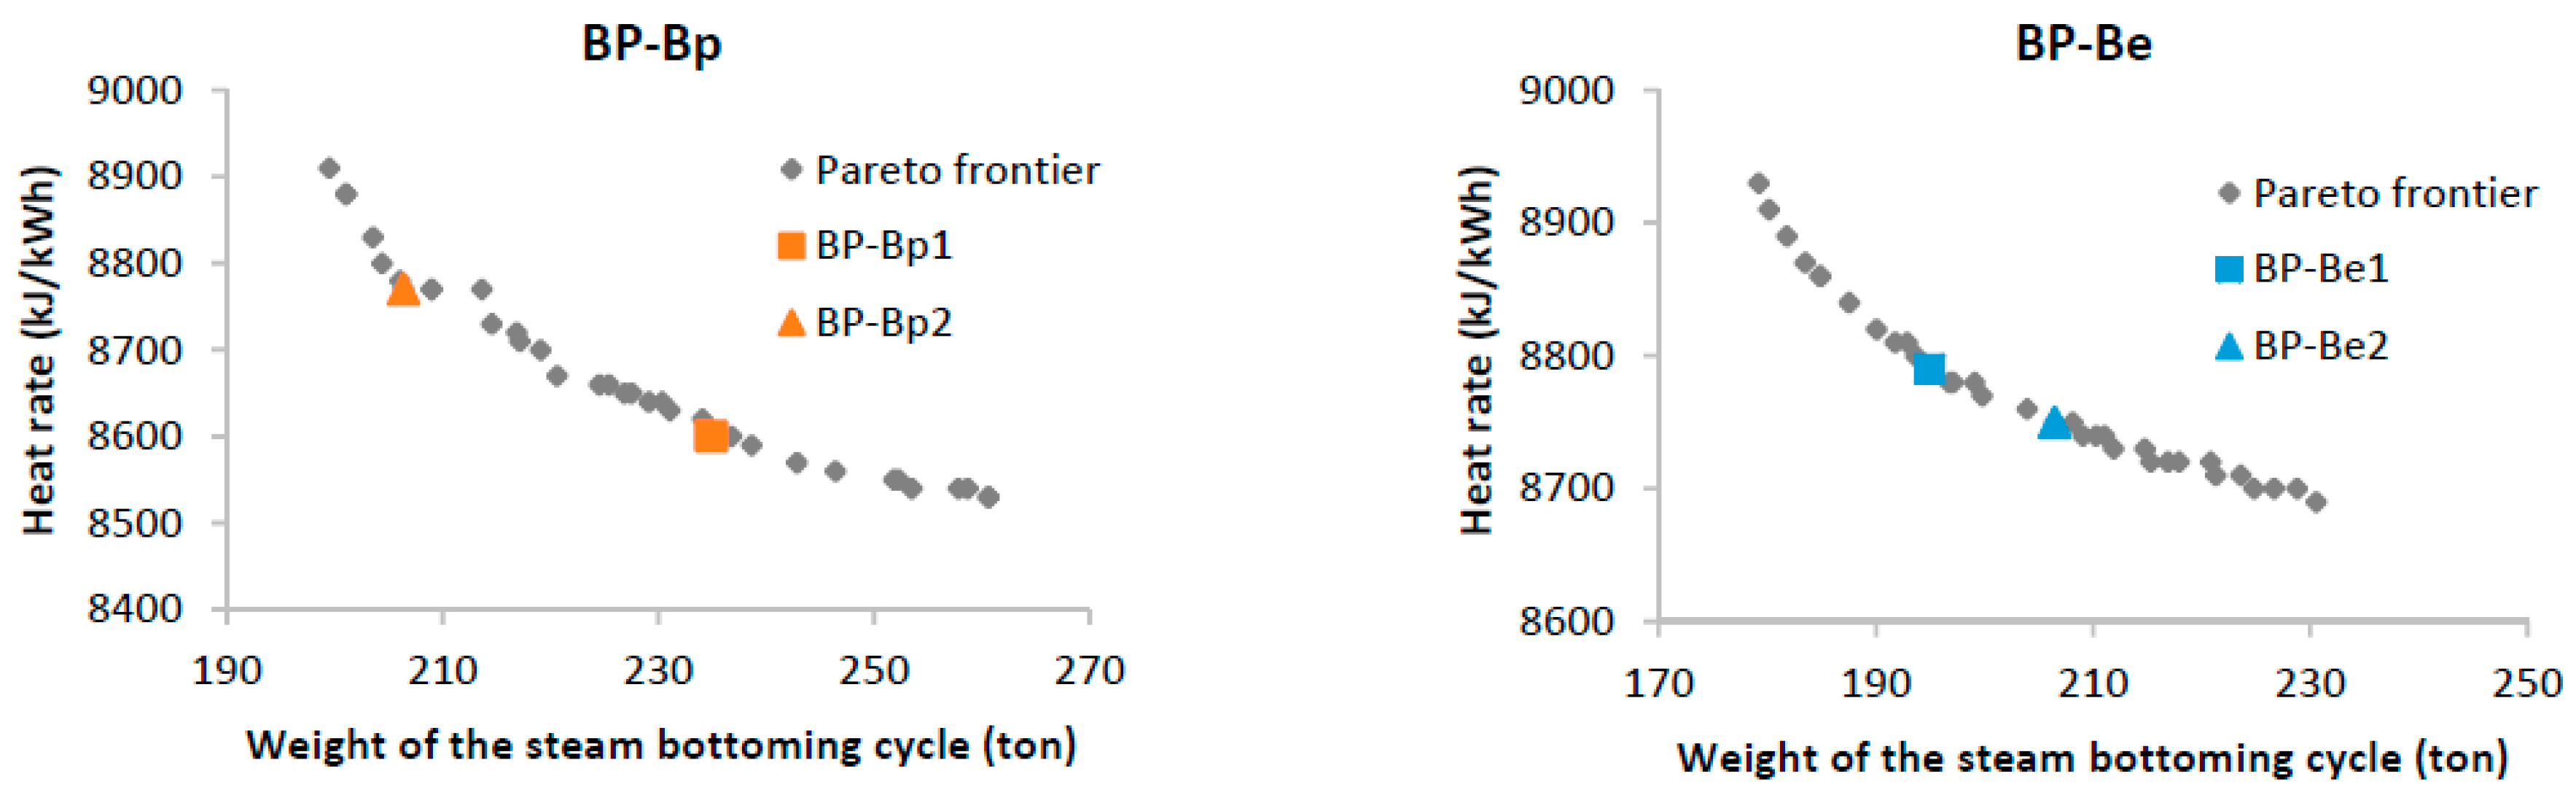
Figure A2.
Pareto frontiers of backpressure steam turbine cycle for case B at peak (BP-Bp) and end-life (BP-Be) conditions.
Figure A2.
Pareto frontiers of backpressure steam turbine cycle for case B at peak (BP-Bp) and end-life (BP-Be) conditions.

Figure A3.
Pareto frontiers of backpressure steam turbine cycle for case C at peak (BP-Cp) and end-life (BP-Ce) conditions.
Figure A3.
Pareto frontiers of backpressure steam turbine cycle for case C at peak (BP-Cp) and end-life (BP-Ce) conditions.
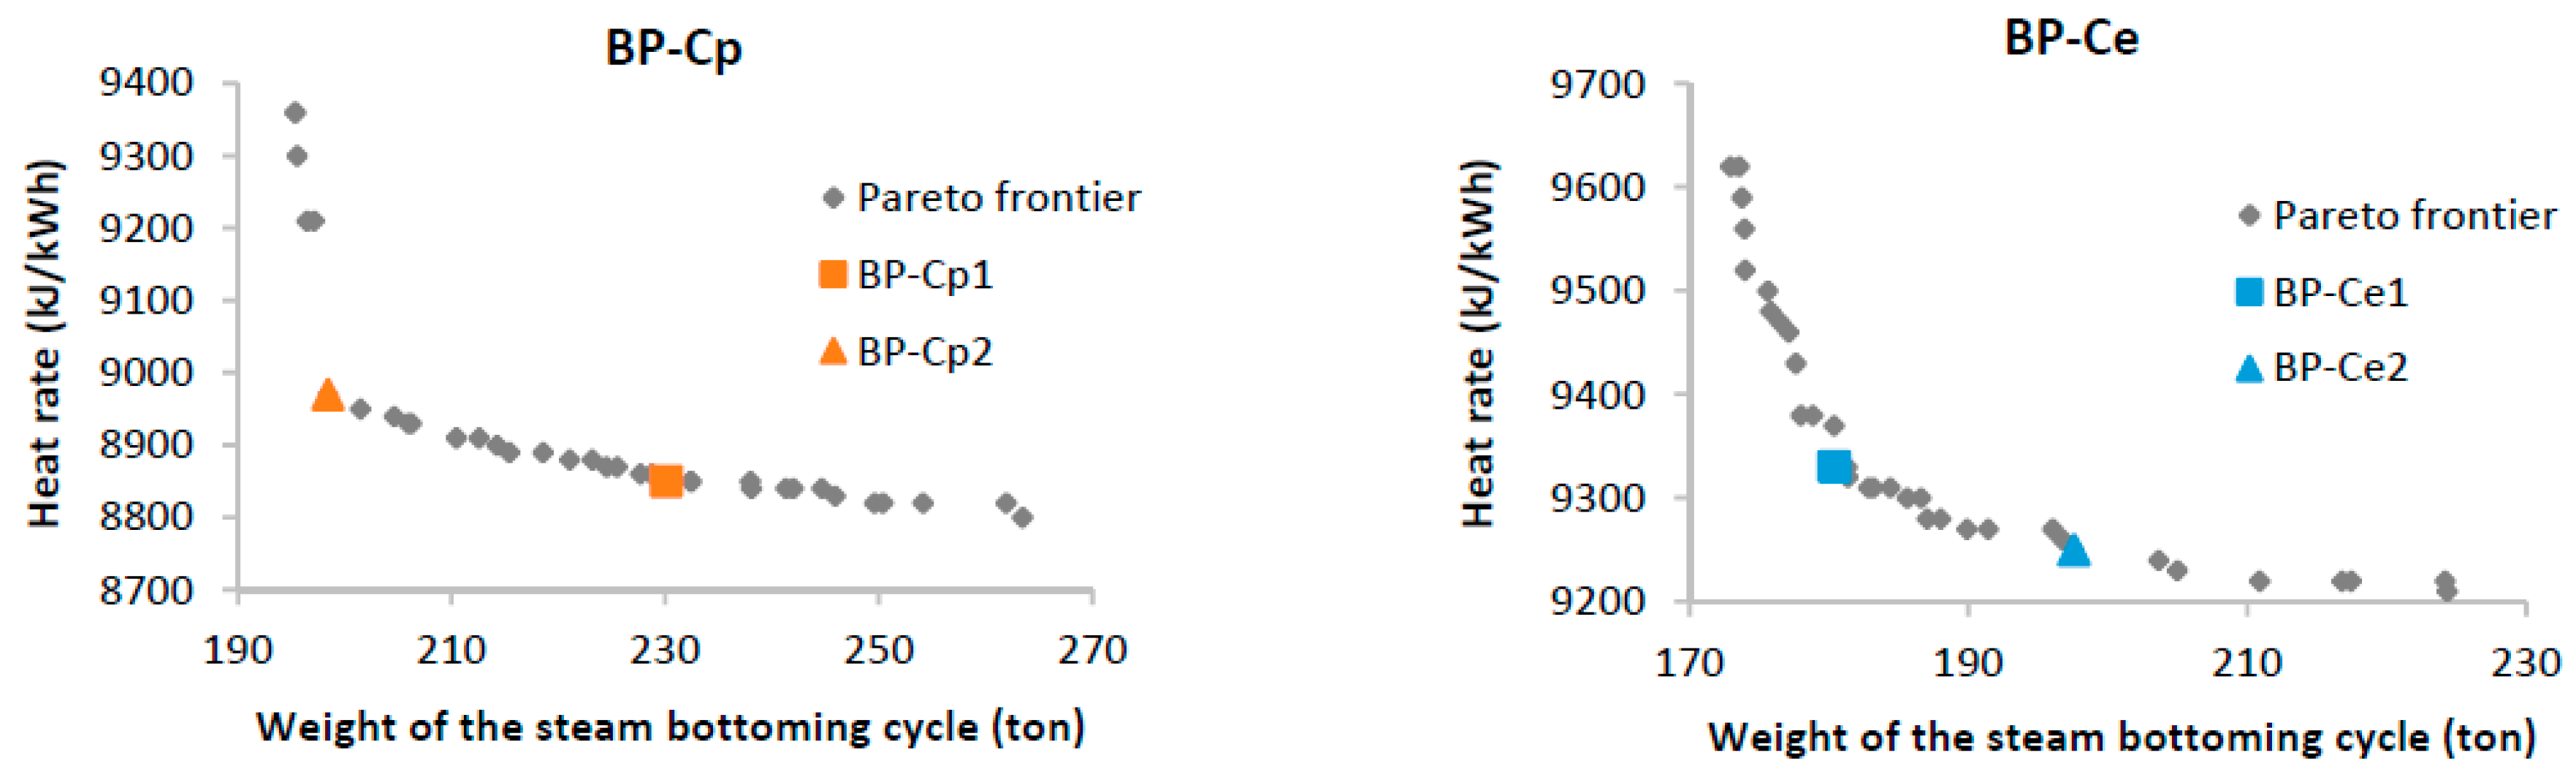
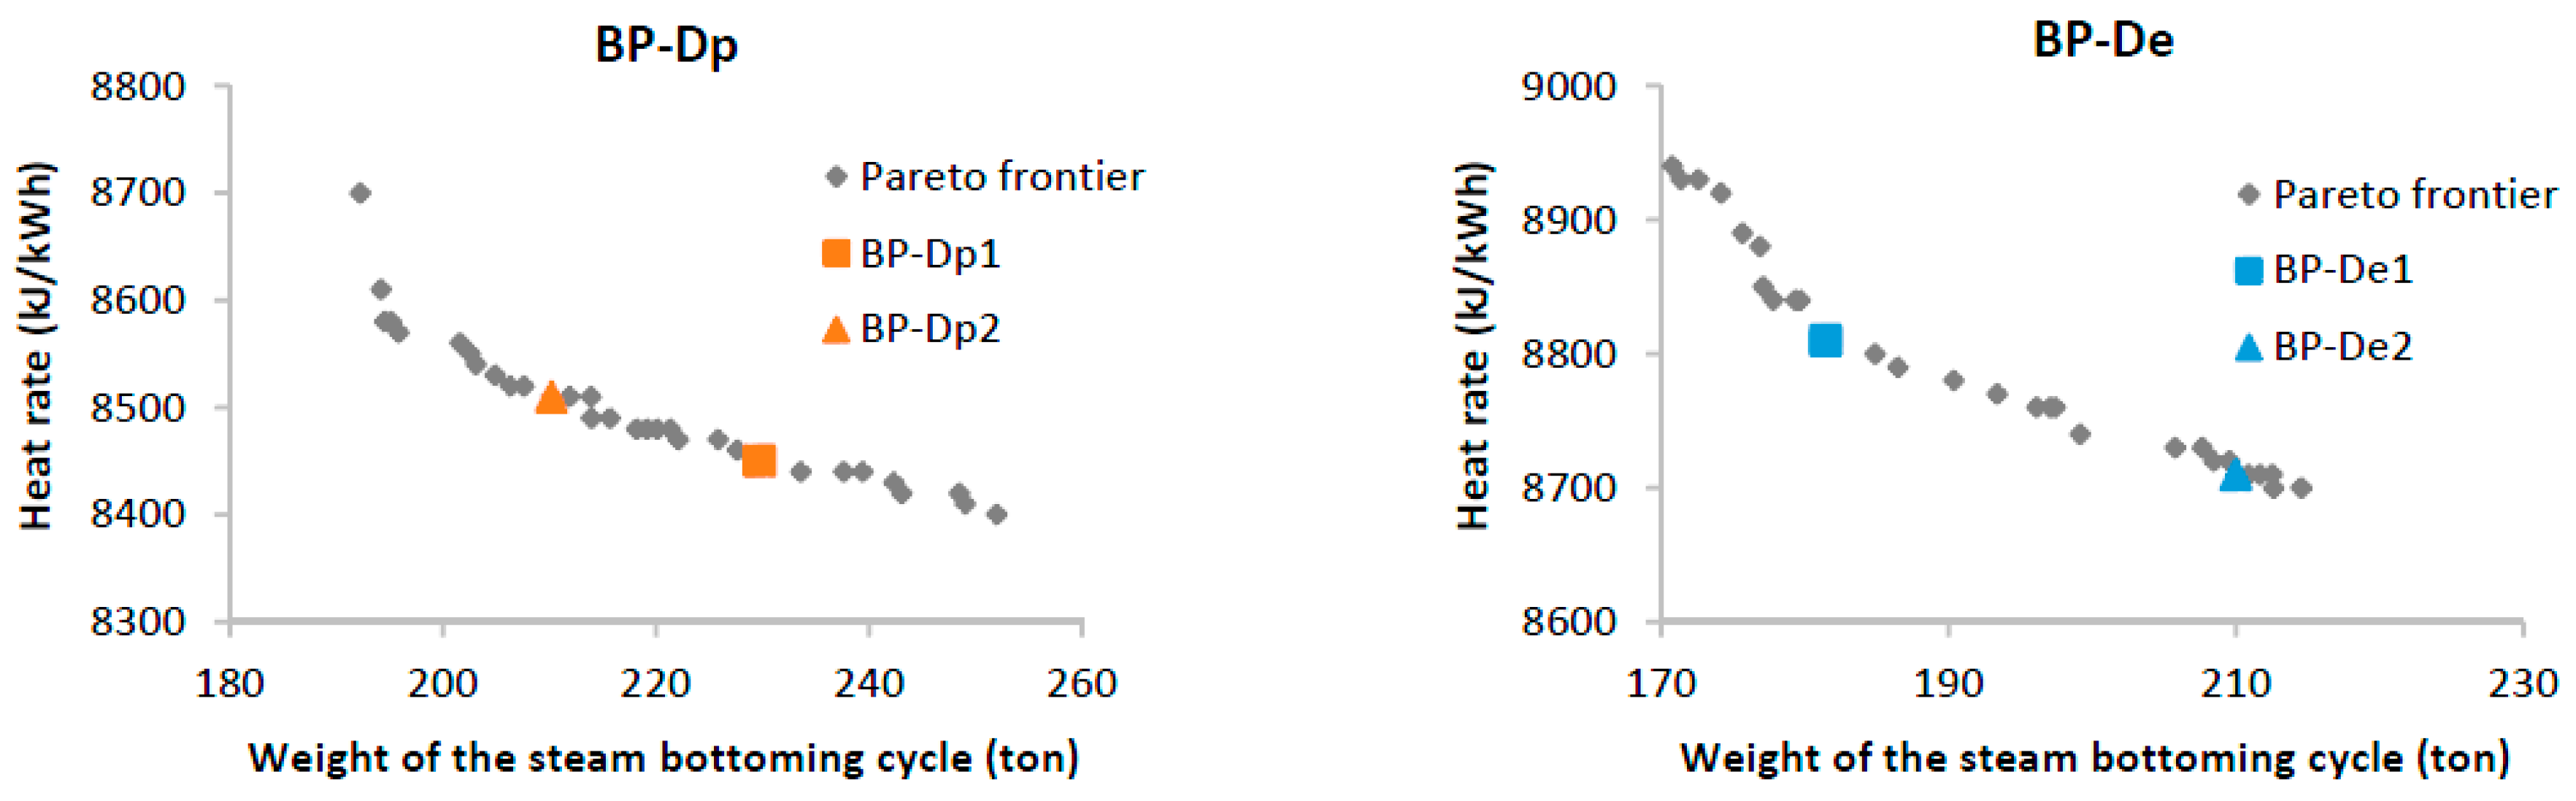
Figure A4.
Pareto frontiers of backpressure steam turbine cycle for case D at peak (BP-Dp) and end-life (BP-De) conditions.
Figure A4.
Pareto frontiers of backpressure steam turbine cycle for case D at peak (BP-Dp) and end-life (BP-De) conditions.

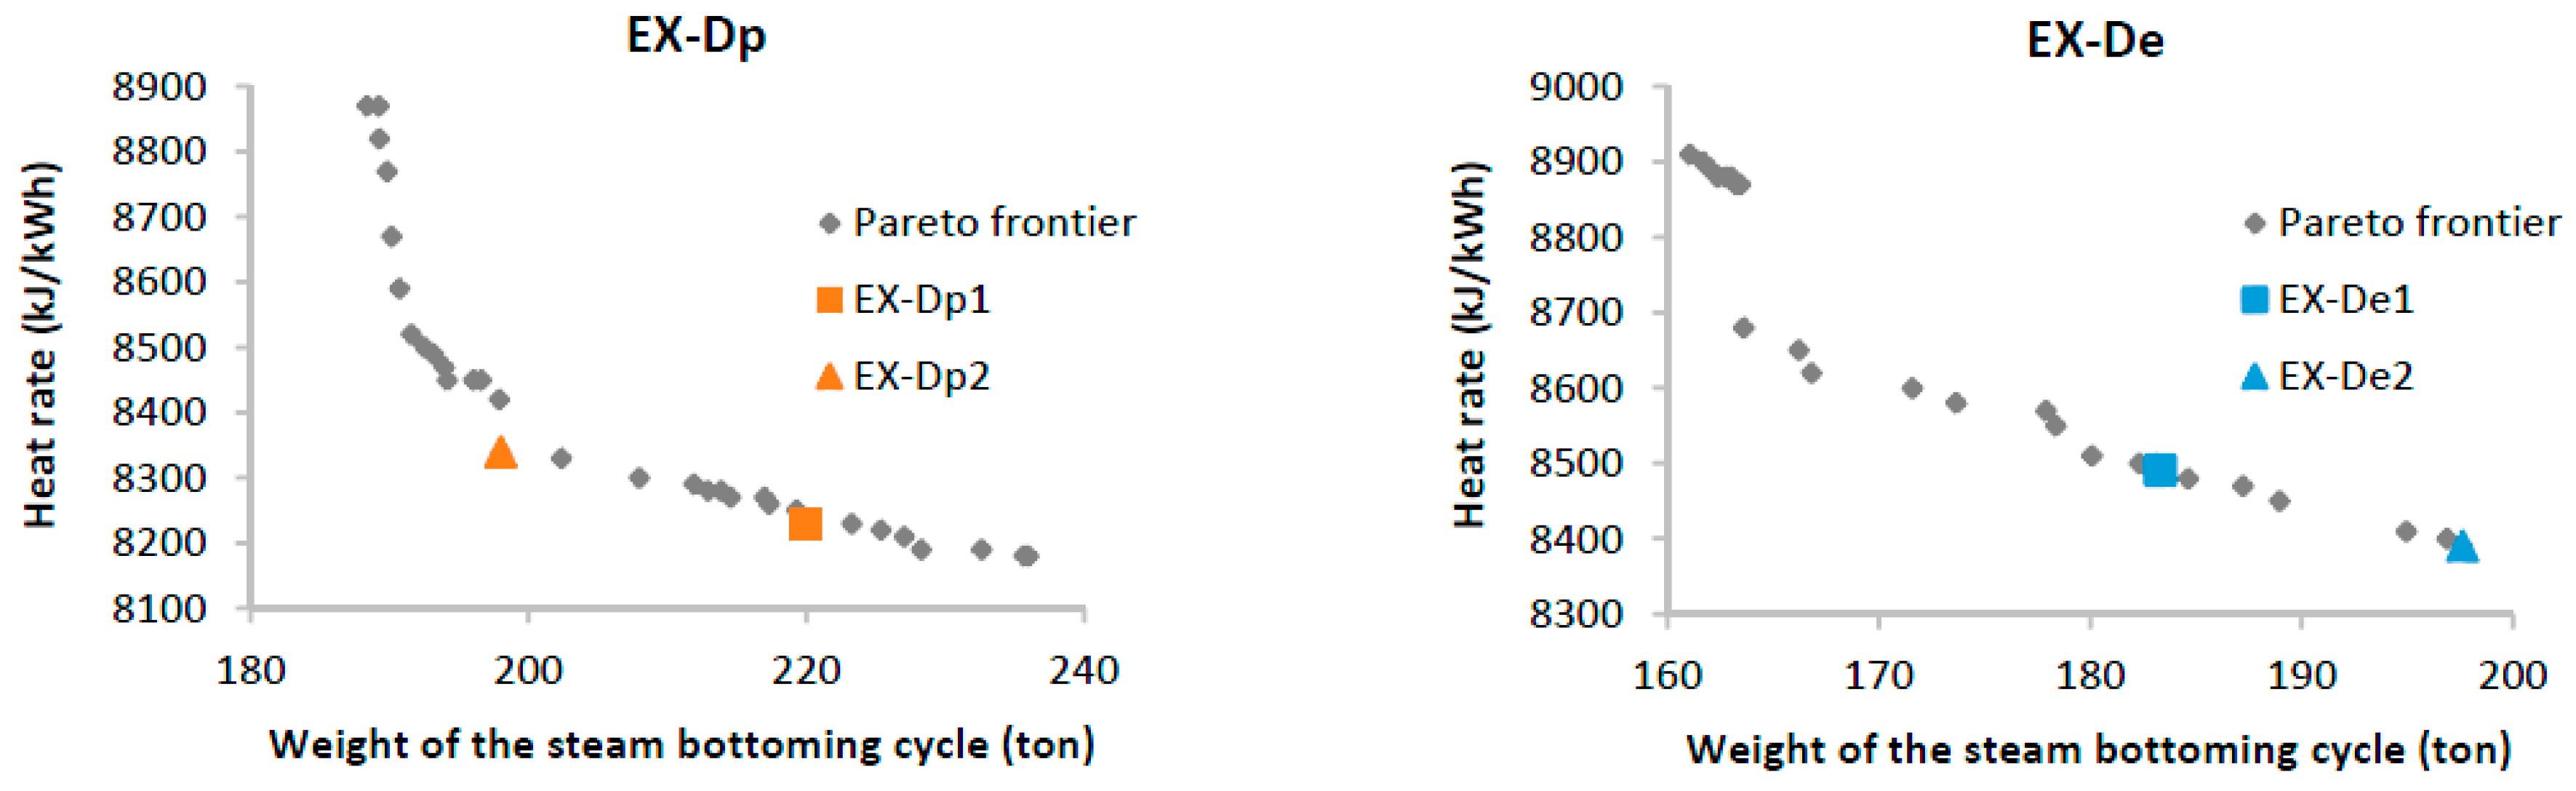
Appendix B. Pareto Frontiers of the Extraction Steam Turbine Cycle for Cases C and D
Figure A5.
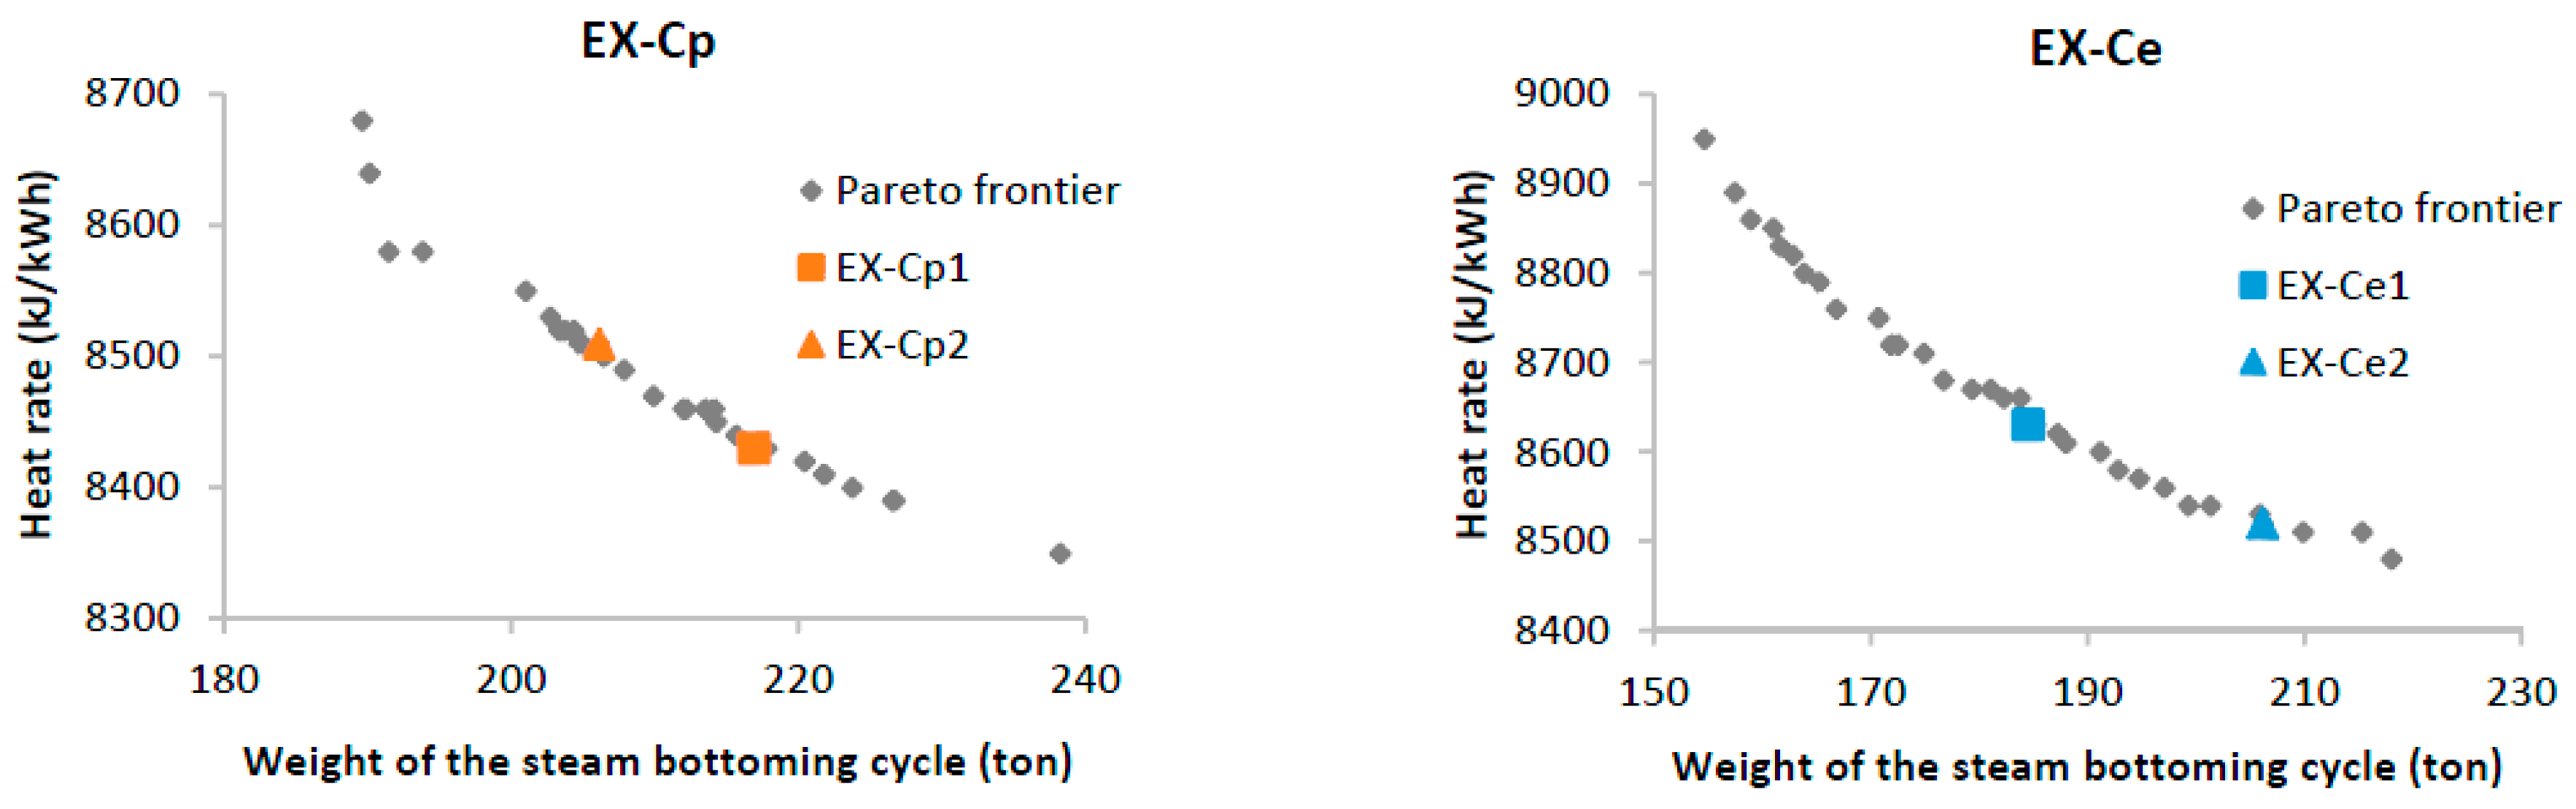
Pareto frontiers of extraction steam turbine cycle for case C at peak (EX-Cp) and end-life (EX-Ce) conditions.
Figure A5.
Pareto frontiers of extraction steam turbine cycle for case C at peak (EX-Cp) and end-life (EX-Ce) conditions.

Figure A6.
Pareto frontiers of extraction steam turbine cycle for case D at peak (EX-Dp) and end-life (EX-De) conditions.
Figure A6.
Pareto frontiers of extraction steam turbine cycle for case D at peak (EX-Dp) and end-life (EX-De) conditions.
References
- Nguyen, T.V.; Pierobon, L.; Elmegaard, B.; Haglind, F.; Breuhaus, P.; Voldsund, M. Exergetic assessment of energy systems on North Sea oil and gas platforms. Energy 2013, 62, 23–36. [Google Scholar] [CrossRef]
- Nguyen, T.V.; Jacyno, T.; Breuhaus, P.; Voldsund, M.; Elmegaard, B. Thermodynamic analysis of an upstream petroleum plant operated on a mature field. Energy 2014, 68, 454–469. [Google Scholar] [CrossRef]
- Voldsund, M.; Ertesvåg, I.S.; He, W.; Kjelstrup, S. Exergy analysis of the oil and gas processing on a north sea oil platform a real production day. Energy 2013, 55, 716–727. [Google Scholar] [CrossRef]
- Voldsund, M.; Nguyen, T.V.; Elmegaard, B.; Ertesvåg, I.S.; Røsjorde, A.; Jøssang, K.; Kjelstrup, S. Exergy destruction and losses on four North Sea offshore platforms: A comparative study of the oil and gas processing plants. Energy 2014, 74, 45–58. [Google Scholar] [CrossRef]
- De Oliveira, S.; Van Hombeeck, M. Exergy analysis of petroleum separation processes in offshore platforms. Energy Convers. Manag. 1997, 38, 1577–1584. [Google Scholar] [CrossRef]
- Carranza Sánchez, Y.A.; de Oliveira, S. Exergy analysis of offshore primary petroleum processing plant with CO2 capture. Energy 2015, 88, 46–56. [Google Scholar] [CrossRef]
- Kloster, P. Energy optimization on offshore installations with emphasis on offshore and combined cycle plants. In Proceedings of the Offshore Europe Conference, Aberdeen, UK, 7–10 September 1999. [Google Scholar]
- Kloster, P. Reduction of Emissions to Air Through Energy Optimisation on Offshore Installations. In Proceedings of the SPE International Conference on Health, Safety, and the Environment in Oil and Gas Exploration and Production, Stavanger, Norway, 26–28 June 2000. [Google Scholar]
- Nord, L.O.; Bolland, O. Steam bottoming cycles offshore—Challenges and possibilities. J. Power Technol. 2012, 92, 201–207. [Google Scholar]
- Nord, L.O.; Bolland, O. Design and off-design simulations of combined cycles for offshore oil and gas installations. Appl. Therm. Eng. 2013, 54, 85–91. [Google Scholar] [CrossRef]
- Nord, L.O.; Martelli, E.; Bolland, O. Weight and power optimization of steam bottoming cycle for offshore oil and gas installations. Energy 2014, 76, 891–898. [Google Scholar] [CrossRef]
- Nguyen, T.V.; Tock, L.; Breuhaus, P.; Maréchal, F.; Elmegaard, B. Oil and gas platforms with steam bottoming cycles: System integration and thermoenvironomic evaluation. Appl. Energy 2014, 131, 222–237. [Google Scholar] [CrossRef]
- Pierobon, L.; Benato, A.; Scolari, E.; Haglind, F.; Stoppato, A. Waste heat recovery technologies for offshore platforms. Appl. Energy 2014, 136, 228–241. [Google Scholar] [CrossRef]
- Pierobon, L.; Casati, E.; Casella, F.; Haglind, F.; Colonna, P. Design methodology for flexible energy conversion systems accounting for dynamic performance. Energy 2014, 68, 667–679. [Google Scholar] [CrossRef]
- Pierobon, L.; Nguyen, T.V.; Larsen, U.; Haglind, F.; Elmegaard, B. Multi-objective optimization of organic Rankine cycles for waste heat recovery: Application in an offshore platform. Energy 2013, 58, 538–549. [Google Scholar] [CrossRef]
- La Seta, A.; Meroni, A.; Andreasen, J.G.; Pierobon, L.; Persico, G.; Haglind, F. Combined Turbine and Cycle Optimization for Organic Rankine Cycle Power Systems—Part B: Application on a Case Study. Energies 2016, 9, 393. [Google Scholar] [CrossRef]
- Bhargava, R.K.; Bianchi, M.; Branchini, L.; De Pascale, A.; Orlandini, V. Organica Rankine cycle system for effective energy recovery in offshore applications: A parametric investigation with different power rating gas turbines. In Proceedings of the ASME Turbo Expo 2015, Montréal, QC, Canada, 15–19 June 2015. [Google Scholar]
- Barrera, J.E.; Bazzo, E.; Kami, E. Exergy analysis and energy improvement of a Brazilian floating oil platform using Organic Rankine Cycles. Energy 2015, 88, 67–79. [Google Scholar] [CrossRef]
- Margarone, M.; Magi, S.; Gorla, G.; Biffi, S.; Siboni, P.; Valenti, G.; Romano, M.C.; Giuffrida, A.; Negri, E.; Macchi, E. Revamping, Energy Efficiency, and Exergy Analysis of an Existing Upstream Gas Treatment Facility. J. Energy Resour. Technol. 2011, 133, 12001. [Google Scholar] [CrossRef]
- Walnum, H.T.; Nekså, P.; Nord, L.O.; Andresen, T. Modelling and simulation of CO2 (carbon dioxide) bottoming cycles for offshore oil and gas installations at design and off-design conditions. Energy 2013, 59, 513–520. [Google Scholar] [CrossRef]
- Mazzetti, J.M.; Nekså, P.; Walnum, H.T.; Hemmingsen, A.K.T. Energy-Efficient Technologies for Reduction of Offshore CO2 Emmissions. In Proceedings of the Offshore Technology Conference, Houston, TX, USA, 6–9 May 2013. [Google Scholar]
- Grljušić, M.; Medica, V.; Radica, G. Calculation of Efficiencies of a Ship Power Plant Operating with Waste Heat Recovery through Combined Heat and Power Production. Energies 2015, 8, 4273–4299. [Google Scholar] [CrossRef]
- Nguyen, T.V.; Fülop, T.G.; Breuhaus, P.; Elmegaard, B. Life performance of oil and gas platforms: Site integration and thermodynamic evaluation. Energy 2014, 73, 282–301. [Google Scholar] [CrossRef]
- Kalikatzarakis, M.; Frangopoulos, C.A. Multi-criteria selection and thermo-economic optimization of Organic Rankine Cycle system for a marine application. Int. J. Thermodyn. 2015, 18, 133. [Google Scholar] [CrossRef]
- Baldi, F.; Larsen, U.; Gabrielii, C. Comparison of different procedures for the optimisation of a combined Diesel engine and organic Rankine cycle system based on ship operational profile. Ocean Eng. 2015, 110, 85–93. [Google Scholar] [CrossRef]
- Thermoflex Version 26.0; Thermoflow Inc.: Fayville, MA, USA, 2016.
- Global Optimization Toolbox; MathWorks: Natick, MA, USA, 2016.
- PL532 Johan Castberg—Forslag Til Program for Konsekvensutredning; Statoil: Stavanger, Norway, 2016.
- Spencer, R.C.; Cotton, K.C.; Cannon, C.N. A method for predicting the performance of steam turbine generators 16,500 kW and larger. J. Eng. Power 1963, 85, 249–298. [Google Scholar] [CrossRef]
- Kehlhofer, R.; Hannemann, F.; Stirnimann, F.; Rukes, B. Combined-Cycle Gas & Steam Turbine Power Plants, 3rd ed.; PennWell Corporation: Tulsa, OK, USA, 1999. [Google Scholar]
- Rios, L.M.; Sahinidis, N.V. Derivative-free optimization: A review of algorithms and comparison of software implementations. J. Glob. Optim. 2013, 56, 1247–1293. [Google Scholar] [CrossRef]
- Wang, J.; Yan, Z.; Wang, M.; Ma, S.; Dai, Y. Thermodynamic analysis and optimization of an (organic Rankine cycle) ORC using low grade heat source. Energy 2013, 49, 356–365. [Google Scholar] [CrossRef]
- Ahmadi, P.; Dincer, I.; Rosen, M.A. Exergy, exergoeconomic and environmental analyses and evolutionary algorithm based multi-objective optimization of combined cycle power plants. Energy 2011, 36, 5886–5898. [Google Scholar] [CrossRef]
- Bolland, O. Thermal Power Generation—Compendium; Norwegian University of Science and Technology (NTNU): Trondheim, Norway, 2014. [Google Scholar]
- International Energy Agency (IEA). World Energy Outlook 2016; IEA: Paris, France, 2016; Available online: http://www.worldenergyoutlook.org/publications/weo-2016/ (accessed on 15 March 2017).
Figure 1.
Power and heat demand profile for Johan Castberg [28].
Figure 1.
Power and heat demand profile for Johan Castberg [28].
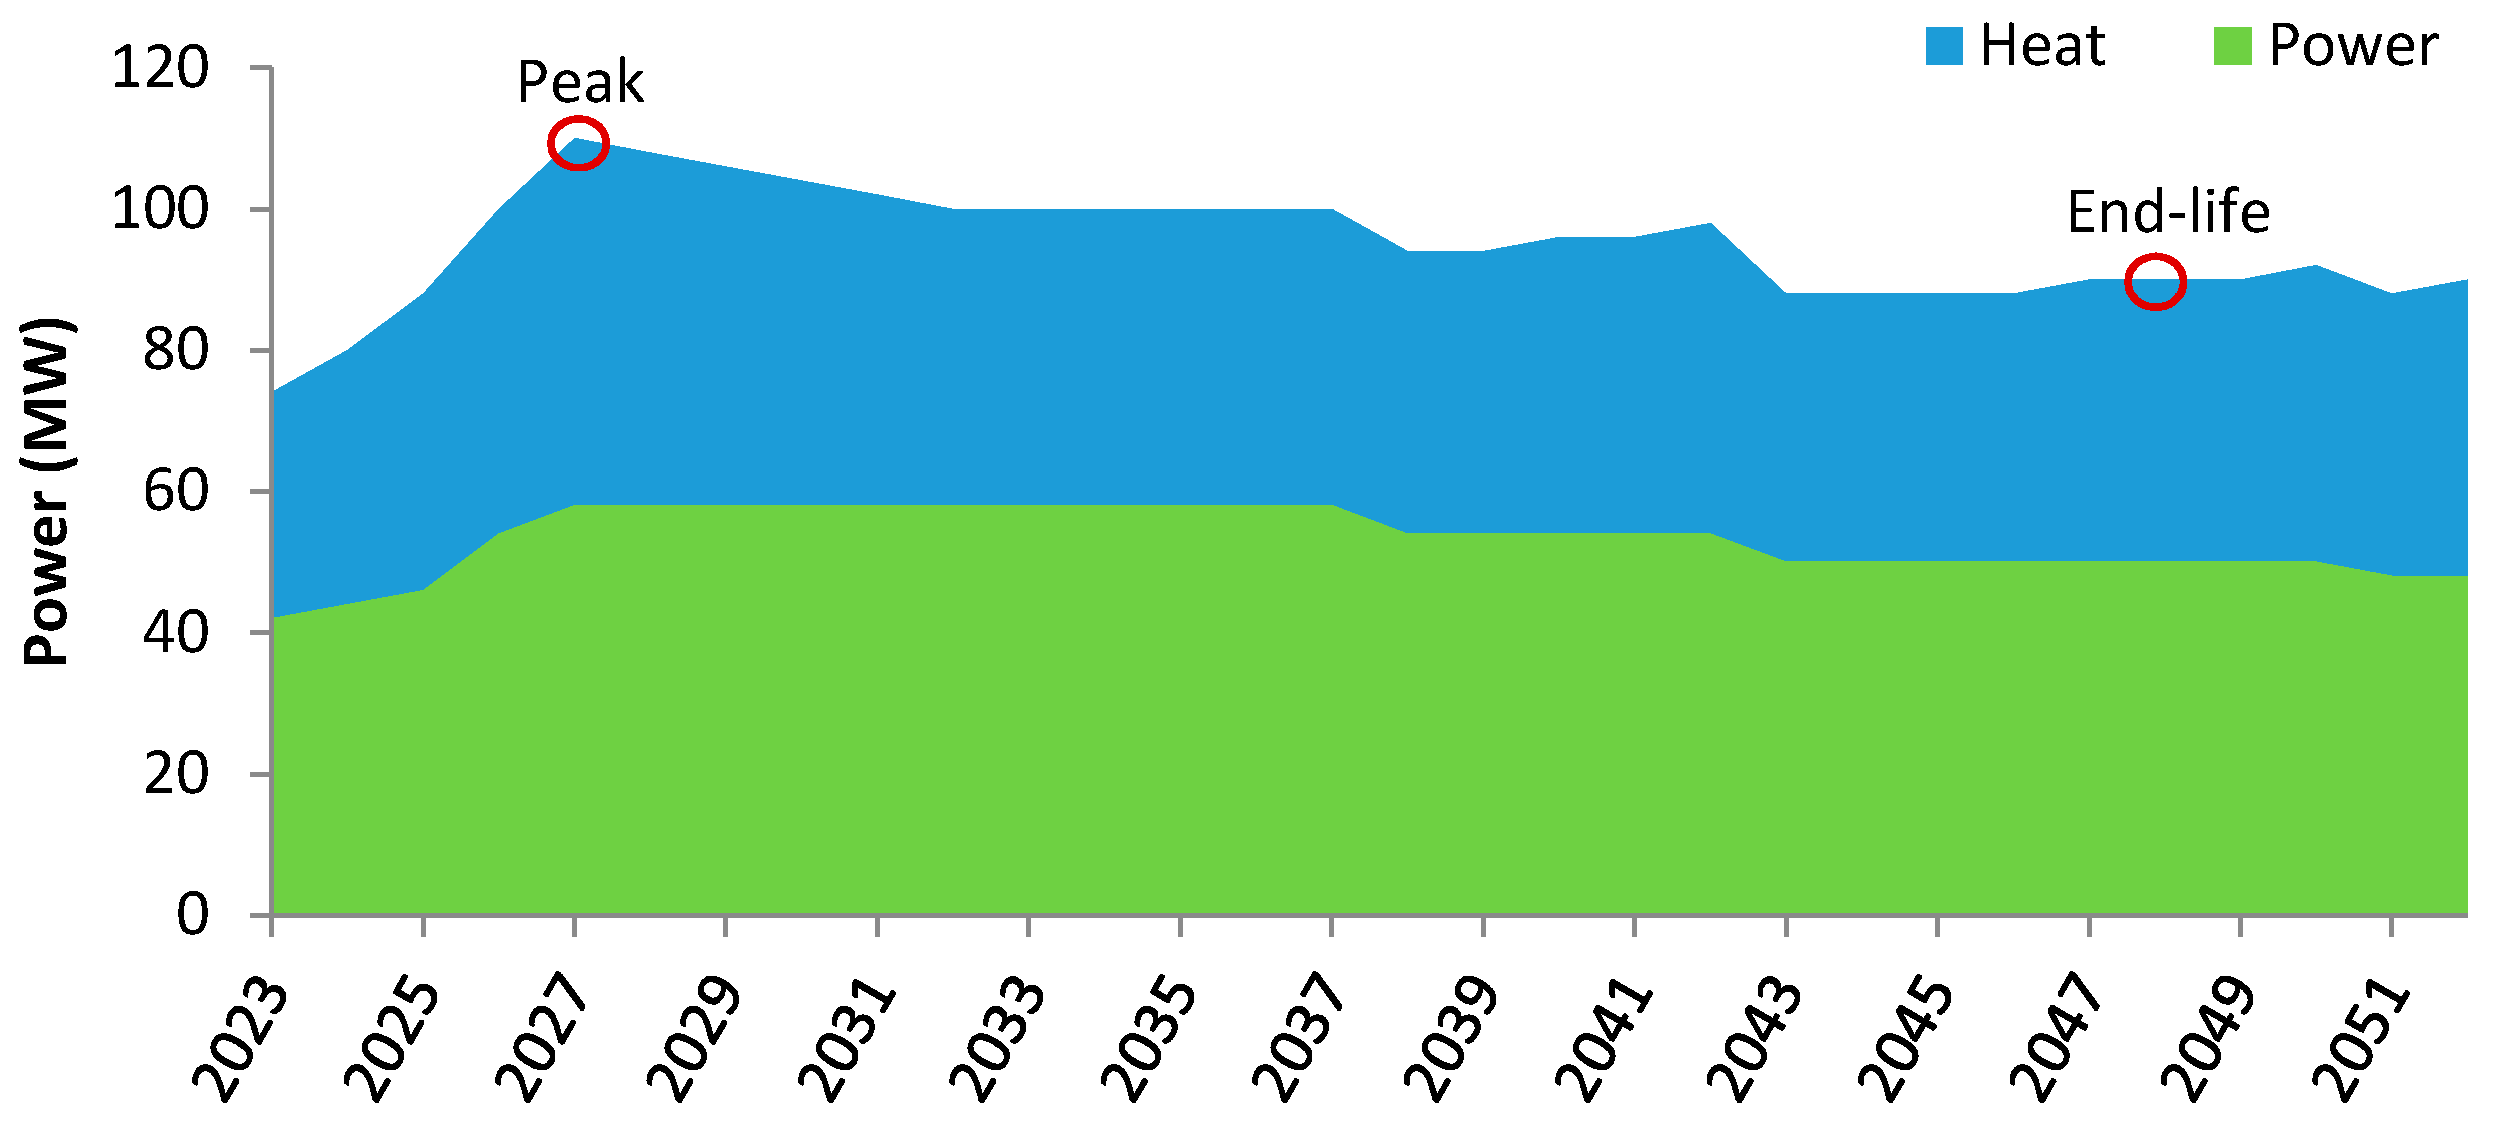
Figure 2.
Example of optimum load share between two topping gas turbines of a combined cycle.

Figure 3.
Layout of the backpressure steam turbine cycle.

Figure 4.
Performances of backpressure steam turbine cycles defined for case A.

Figure 5.
Performances of backpressure steam turbine cycles defined for case B.

Figure 6.
Performances of backpressure steam turbine cycles defined for case C.

Figure 7.
Performances of backpressure steam turbine cycles defined for case D.

Figure 8.
Layout of the extraction steam turbine cycle.

Figure 9.
Performances of extraction steam turbine cycles defined for case C.

Figure 10.
Performances of extraction steam turbine cycles defined for case D.

Figure 11.
Performances of simple gas turbines cycle.


Table 1.
Site conditions and modelling assumptions.
| Gas Turbine | Natural Gas (vol %) | ||
|---|---|---|---|
| Model type | GE LM2500 + G4 | CH4 | 72.9 |
| GT fuel | Production gas | C2H6 | 13.6 |
| Frequency (Hz) | 60 | C3H8 | 8.3 |
| GT inlet ΔP (mbar) | 10 | N2 | 1.6 |
| GT exhaust ΔP (mbar) | 10 | CO2 | 0.2 |
| Once-Through Boiler | n-C4H10 | 1.8 | |
| Tube material | Incoloy | i-C4H10 | 0.9 |
| Fin material | TP409 | n-C5H12 | 0.3 |
| Fin type | Serrated | i-C5H12 | 0.3 |
| Tube layout | Staggered | C6H14+ | 0.1 |
| Water Loop | Condenser | ||
| Inlet water T (°C) | 100 | Condenser type | Dearating condenser |
| Outlet water T (°C) | 150/120 | Heat exchanger design | Shell-and-tube |
| Pressure (bar) | 20 | Pumps | |
| Generators | Isentropic efficiency | 0.75 | |
| Efficiency | 0.985 |
Table 2.
List of decision variables, with upper and lower bounds.
| Decision Variables | Backpressure Steam Turbine Cycle | Extraction Steam Turbine Cycle | ||
|---|---|---|---|---|
| Lower Bound | Upper Bound | Lower Bound | Upper Bound | |
| psteam (bar) | 15 | 40 | 15 | 40 |
| Tsteam (°C) | 400 | 515 | 400 | 515 |
| ΔTOTSG (°C) | 10 | 30 | 10 | 30 |
| pcond (bar) | - | - | 0.03 | 0.12 |
| ΔTcw (°C) | - | - | 3 | 10 |
| pextr (bar) | - | - | 5.5 | 12.0 |
| GT2 load (%) | 20 | 94 | 20 | 94 |
Table 3.
Overview of all the designs defined for the backpressure steam turbine cycle.
| Backpressure Steam Turbine Cycle BP- | Case A (100% heat/150 °C) BP-A | Peak design BP-Ap | Compromise | BP-Ap1 |
| Same weight | BP-Ap2 | |||
| End-life design BP-Ae | Compromise | BP-Ae1 | ||
| Same weight | BP-Ae2 | |||
| Case B (100% heat/120 °C) BP-B | Peak design BP-Bp | Compromise | BP-Bp1 | |
| Same weight | BP-Bp2 | |||
| End-life design BP-Be | Compromise | BP-Be1 | ||
| Same weight | BP-Be2 | |||
| Case C (50% heat/150 °C) BP-C | Peak design BP-Cp | Compromise | BP-Cp1 | |
| Same weight | BP-Cp2 | |||
| End-life design BP-Ce | Compromise | BP-Ce1 | ||
| Same weight | BP-Ce2 | |||
| Case D (50% heat/120 °C) BP-D | Peak design BP-Dp | Compromise | BP-Dp1 | |
| Same weight | BP-Dp2 | |||
| End-life design BP-De | Compromise | BP-De1 | ||
| Same weight | BP-De2 |
Table 4.
Main characteristics of the designs defined for the backpressure steam turbine cycle.
| Designs | Decisions Variables | Objective Functions | ||||||
|---|---|---|---|---|---|---|---|---|
| psteam | Tsteam | ΔTOTSG | GT2 Load | GT1 Load | pout | Weight | HR | |
| bar | °C | °C | % | % | bar | ton | kJ/kWh | |
| BP-Ap1 | 33.8 | 440.4 | 19.3 | 65.2 | 90.8 | 5.4 | 220 | 8980 |
| BP-Ap2 | 28.0 | 445.0 | 25.5 | 79.0 | 77.0 | 5.4 | 205 | 9080 |
| BP-Ae1 | 39.4 | 460.1 | 25.3 | 38.0 | 92.0 | 5.4 | 179 | 9280 |
| BP-Ae2 | 39.4 | 477.7 | 16.0 | 39.9 | 90.1 | 5.4 | 206 | 9210 |
| BP-Bp1 | 22.5 | 432.8 | 16.1 | 39.0 | 88.1 | 2.3 | 235 | 8600 |
| BP-Bp2 | 19.6 | 408.9 | 28.0 | 39.6 | 92.4 | 2.3 | 206 | 8770 |
| BP-Be1 | 36.7 | 482.1 | 23.7 | 36.6 | 92.0 | 2.3 | 195 | 8790 |
| BP-Be2 | 38.3 | 487.7 | 19.7 | 38.1 | 90.5 | 2.3 | 207 | 8750 |
| BP-Cp1 | 39.5 | 487.3 | 18.9 | 68.2 | 87.8 | 5.4 | 230 | 8850 |
| BP-Cp2 | 37.9 | 472.7 | 29.9 | 79.5 | 76.5 | 5.4 | 198 | 8970 |
| BP-Ce1 | 39.7 | 435.1 | 27.1 | 39.0 | 91.0 | 5.4 | 180 | 9330 |
| BP-Ce2 | 38.9 | 475.7 | 20.9 | 39.6 | 90.4 | 5.4 | 198 | 9250 |
| BP-Dp1 | 36.2 | 493.5 | 16.2 | 53.0 | 93.0 | 2.3 | 230 | 8450 |
| BP-Dp2 | 35.2 | 478.6 | 21.8 | 53.4 | 92.6 | 2.3 | 210 | 8510 |
| BP-De1 | 33.1 | 463.5 | 23.6 | 28.2 | 93.8 | 2.3 | 181 | 8810 |
| BP-De2 | 34.4 | 468.0 | 11.7 | 28.2 | 93.8 | 2.3 | 210 | 8710 |
Table 5.
Lifetime performance of the designs defined for the backpressure steam turbine cycle.
| Designs | Weight | CO2 Emissions | ||
|---|---|---|---|---|
| ton | Mton | % | ||
| Case A (100% heat/150 °C) | BP-Ap1 | 220 | 7.25 | 39.3 |
| BP-Ap2 | 205 | 7.33 | 39.0 | |
| BP-Ae1 | 179 | 7.25 | 39.4 | |
| BP-Ae2 | 206 | 7.19 | 39.7 | |
| Case B (100% heat/120 °C) | BP-Bp1 | 235 | 7.01 | 40.7 |
| BP-Bp2 | 206 | 7.11 | 40.2 | |
| BP-Be1 | 195 | 7.00 | 40.8 | |
| BP-Be2 | 207 | 6.97 | 41.0 | |
| Case C (50% heat/150 °C) | BP-Cp1 | 230 | 7.18 | 39.8 |
| BP-Cp2 | 198 | 7.24 | 39.4 | |
| BP-Ce1 | 181 | 7.24 | 39.4 | |
| BP-Ce2 | 198 | 7.21 | .6 | |
| Case D (50% heat/120 °C) | BP-Dp1 | 230 | 6.84 | 41.7 |
| BP-Dp2 | 210 | 6.88 | 41.5 | |
| BP-De1 | 181 | 7.00 | 40.8 | |
| BP-De2 | 210 | 6.92 | 41.2 | |
Table 6.
Overview of all the designs defined for the extraction steam turbine cycle.
| Extraction Steam Turbine Cycle EX- | Case A (100% heat/150 °C) EX-A | Peak design EX-Ap | Compromise | EX-Ap1 |
| Same weight | EX-Ap2 | |||
| End-life design EX-Ae | Compromise | EX-Ae1 | ||
| Same weight | EX-Ae2 | |||
| Case B (100% heat/120 °C) EX-B | Peak design EX-Bp | Compromise | EX-Bp1 | |
| Same weight | EX-Bp2 | |||
| End-life design EX-Be | Compromise | EX-Be1 | ||
| Same weight | EX-Be2 | |||
| Case C (50% heat/150 °C) EX-C | Peak design EX-Cp | Compromise | EX-Cp1 | |
| Same weight | EX-Cp2 | |||
| End-life design EX-Ce | Compromise | EX-Ce1 | ||
| Same weight | EX-Ce2 | |||
| Case D (50% heat/120 °C) EX-D | Peak design EX-Dp | Compromise | EX-Dp1 | |
| Same weight | EX-Dp2 | |||
| End-life design EX-De | Compromise | EX-De1 | ||
| Same weight | EX-De2 |
Table 7.
Main characteristics of the designs defined for the extraction steam turbine cycle.
| Designs | Decisions Variables | Objective Functions | ||||||||
|---|---|---|---|---|---|---|---|---|---|---|
| psteam | Tsteam | ΔTOTSG | pcond | ΔTcw | pextr | GT2 Load | GT1 Load | Weight | HR | |
| bar | °C | °C | bar | °C | bar | % | % | ton | kJ/kWh | |
| EX-Cp1 | 31.1 | 457.0 | 25.3 | 0.057 | 6.1 | 5.5 | 49.2 | 86.8 | 217 | 8430 |
| EX-Cp2 | 30.3 | 459.3 | 28.0 | 0.077 | 5.5 | 6.0 | 48.8 | 87.2 | 206 | 8510 |
| EX-Ce1 | 28.1 | 407.0 | 13.8 | 0.072 | 7.2 | 5.6 | 25.1 | 86.9 | 185 | 8630 |
| EX-Ce2 | 33.5 | 435.9 | 13.4 | 0.045 | 4.9 | 6.0 | 24.5 | 87.5 | 206 | 8520 |
| EX-Dp1 | 29.0 | 471.0 | 12.5 | 0.075 | 5.7 | 2.4 | 45.7 | 90.3 | 220 | 8230 |
| EX-Dp2 | 23.9 | 467.2 | 15.9 | 0.111 | 6.5 | 2.4 | 48.1 | 87.9 | 198 | 8340 |
| EX-De1 | 22.0 | 452.4 | 15.8 | 0.071 | 8.0 | 2.6 | 27.7 | 86.3 | 183 | 8490 |
| EX-De2 | 29.0 | 464.2 | 15.3 | 0.068 | 7.9 | 2.4 | 27.8 | 86.2 | 198 | 8390 |
Table 8.
Lifetime performance of the designs defined for the extraction steam turbine cycle.
| Designs | Weight | CO2 Emissions | ||
|---|---|---|---|---|
| ton | Mton | % | ||
| Case C (50% heat/150 °C) | EX-Cp1 | 217 | 6.20 | 42.9 |
| EX-Cp2 | 206 | 6.26 | 42.5 | |
| EX-Ce1 | 185 | 6.35 | 41.9 | |
| EX-Ce2 | 206 | 6.22 | 42.8 | |
| Case D (50% heat/120 °C) | EX-Dp1 | 220 | 6.12 | 43.5 |
| EX-Dp2 | 198 | 6.20 | 43.0 | |
| EX-De1 | 183 | 6.23 | 42.7 | |
| EX-De2 | 198 | 6.17 | 43.2 | |
Table 9.
Lifetime performance of the selected designs for the different power and heat generation concepts.
Table 9.
Lifetime performance of the selected designs for the different power and heat generation concepts.
| Designs | Weight | CO2 Emissions | ||
|---|---|---|---|---|
| ton | Mton | % | ||
| Case A (100% heat/150 °C) | GTs cycle | - | 7.93 | 35.6 |
| BP-Ae2 | 206 | 7.19 | 39.7 | |
| EX- | - | - | - | |
| Case B (100% heat/120 °C) | GTs cycle | - | 7.93 | 35.6 |
| BP-Be2 | 207 | 6.97 | 41.0 | |
| EX- | - | - | - | |
| Case C (50% heat/150 °C) | GTs cycle | - | 7.93 | 35.6 |
| BP-Ce2 | 198 | 7.21 | 39.6 | |
| EX-Ce2 | 206 | 6.22 | 42.8 | |
| Case D (50% heat/120 °C) | GTs cycle | - | 7.93 | 35.6 |
| BP-Dp2 | 210 | 6.88 | 41.5 | |
| EX-De2 | 198 | 6.17 | 43.2 | |
Table 10.
Overall saving in operational costs associated with the utilization of offshore combined cycles instead of a simple GTs cycle.
Table 10.
Overall saving in operational costs associated with the utilization of offshore combined cycles instead of a simple GTs cycle.
| Designs | Overall Operational Saving (M$) | |
|---|---|---|
| Case A (100% heat/150 °C) | BP-Ae2 | 68 |
| EX- | - | |
| Case B (100% heat/120 °C) | BP-Be2 | 85 |
| EX- | - | |
| Case C (50% heat/150 °C) | BP-Ce2 | 67 |
| EX-Ce2 | 120 | |
| Case D (50% heat/120 °C) | BP-Dp2 | 96 |
| EX-De2 | 125 | |
© 2017 by the authors. Licensee MDPI, Basel, Switzerland. This article is an open access article distributed under the terms and conditions of the Creative Commons Attribution (CC BY) license (http://creativecommons.org/licenses/by/4.0/).
Share and Cite
MDPI and ACS Style
Riboldi, L.; Nord, L.O. Lifetime Assessment of Combined Cycles for Cogeneration of Power and Heat in Offshore Oil and Gas Installations. Energies 2017, 10, 744. https://doi.org/10.3390/en10060744
AMA Style
Riboldi L, Nord LO. Lifetime Assessment of Combined Cycles for Cogeneration of Power and Heat in Offshore Oil and Gas Installations. Energies. 2017; 10(6):744. https://doi.org/10.3390/en10060744
Chicago/Turabian StyleRiboldi, Luca, and Lars O. Nord. 2017. "Lifetime Assessment of Combined Cycles for Cogeneration of Power and Heat in Offshore Oil and Gas Installations" Energies 10, no. 6: 744. https://doi.org/10.3390/en10060744
Note that from the first issue of 2016, this journal uses article numbers instead of page numbers. See further details here.