
Failure Mechanical Behavior of Australian Strathbogie Granite at High Temperatures: Insights from Particle Flow Modeling


1
State Key Laboratory for Geomechanics and Deep Underground Engineering, School of Mechanics and Civil Engineering, China University of Mining and Technology, Xuzhou 221116, China
2
Deep Earth Energy Research Laboratory, Department of Civil Engineering, Monash University, Melbourne, Victoria 3800, Australia
*
Author to whom correspondence should be addressed.
Energies 2017, 10(6), 756; https://doi.org/10.3390/en10060756
Submission received: 30 November 2016
/
Revised: 4 May 2017
/
Accepted: 15 May 2017
/
Published: 28 May 2017
(This article belongs to the Special Issue Unconventional Natural Gas (UNG) Recoveries)
Abstract
:Thermally induced damage has an important influence on rock mechanics and engineering, especially for high-level radioactive waste repositories, geological carbon storage, underground coal gasification, and hydrothermal systems. Additionally, the wide application of geothermal heat requires knowledge of the geothermal conditions of reservoir rocks at elevated temperature. However, few methods to date have been reported for investigating the micro-mechanics of specimens at elevated temperatures. Therefore, this paper uses a cluster model in particle flow code in two dimensions (PFC2D) to simulate the uniaxial compressive testing of Australian Strathbogie granite at various elevated temperatures. The peak strength and ultimate failure mode of the granite specimens at different elevated temperatures obtained by the numerical methods are consistent with those obtained by experimentation. Since the tensile force is always concentrated around the boundary of the crystal, cracks easily occur at the intergranular contacts, especially between the b-b and b-k boundaries where less intragranular contact is observed. The intergranular and intragranular cracking of the specimens is almost constant with increasing temperature at low temperature, and then it rapidly and linearly increases. However, the inflection point of intergranular micro-cracking is less than that of intragranular cracking. Intergranular cracking is more easily induced by a high temperature than intragranular cracking. At an elevated temperature, the cumulative micro-crack counts curve propagates in a stable way during the active period, and it has no unstable crack propagation stage. The micro-cracks and parallel bond forces in the specimens with elevated temperature evolution and axial strain have different characteristics than those at lower temperature. More branch fractures and isolated wider micro-cracks are generated with increasing temperature when the temperature is over 400 °C. Therefore, the total number of cracks is almost constant when the temperature is below 400 °C; next, it linearly increases when the temperature is over 400 °C. This trend is the same as that observed by experimentation.
1. Introduction
When rock is subjected to thermal load, thermal damage and thermal cracking usually occur, which may affect underground engineering and geological projects, such as enhanced geothermal systems, high-level radioactive waste repositories, geological carbon storage, underground coal gasification, and hydrothermal systems [1,2,3,4]. Additionally, geothermal heat has now been identified as an effective renewable energy, but its wide application has been limited due to the lack of knowledge about geothermal conditions of reservoir rocks at elevated temperature [5].
To date, substantial research has been performed to better understand thermal damage and thermal cracking. Compression testing, coupled with scanning electron microscope (SEM), stereological analysis, mercury injection tests, P-wave velocity, Acoustic Emission (AE) tests, and X-ray Diffraction (XRD) tests have been used to investigate the characteristics of thermally induced cracks in rock [4,6,7,8]. The first explanation for the variation in rock mechanics under thermal treatment is that the thermal stress within rocks subjected to a thermal load is induced due to the different expansion rates of mineral grains, resulting in the initiation of new intergranular and intragranular cracking and failure at elevated temperatures [9,10,11]. The other explanation is that rock minerals experience a process of dehydration, lattice recombination, mineral shrinkage, and increased crack connectivity at high temperatures [4,7,8].
Homand-Etienne and Houpert [10] used SEM and compressibility tests to study the mechanical behavior of thermally cracked granites, and showed that the cracking density increases with the intensity of thermal treatment. Jansen et al. [12] investigated the development of thermal cracks by continuously monitoring AE generated during thermal cycles in granite specimens, and showed that micro-cracks open at temperatures above 80 °C, and micro-cracks can coalesce to form a macroscopic fracture. Menéndez et al. [13] demonstrated the influence of thermal cracking on several physical properties (porosity, acoustic velocity, attenuation, electrical conductivity, and permeability) of granite, and good correlations were found between the evolution of the physical properties and the amount of damage induced, and no significant anisotropy was observed in thermally cracked granite samples where most observed cracks were located at the boundaries between adjacent minerals. Ferrero et al. [11] performed a study on the mechanical effects of temperature on two marbles (black marble and white marble) that involved uniaxial compressive (UCS) testing and polarizing optical microscopy at temperatures between 230 °C and 600 °C. The results indicated that the average and maximum crack lengths were not significantly affected by the heating temperature, while the crack densities at various temperatures always showed an increase with the temperature of heating. Chaki et al. [14] studied the influence of thermal damage on some physical properties such as porosity, permeability, and ultrasonic wave propagation in granite rocks, and found that the three techniques were complementary and similarly describe the rock behavior at each stage of heat treatment.
Xu et al. [7,8] used SEM, AE, and XRD to analyze granite after temperature treatment ranging from 25 °C to 1200 °C under uniaxial compression, and indicated that the phase transition from crystalline to noncrystalline is a key factor that causes sudden change in the rock mechanical properties under a high temperature. Ranjith et al. [4] explained the thermally-induced plasticity of sandstone with the process of transformation of plasticity on rock mineralogy, and considered that the origin of the thermally induced strengthening observed for temperatures less than 500 °C may be related to strain hardening by localized plasticity development.
The widely accepted mechanism explaining thermal cracking is that the minerals in continually heated rocks expand at different rates, inducing strain at the grain boundaries and then inter-granular cracking [9,10,13,15]. Based on this theory, Yu et al. [9] and Zhao [16] used rock failure process analysis (RFPA) and particle flow code in two dimensions (PFC2D) to simulate the effect of thermal expansion on granite, but they were not able to simulate the intragranular cracks induced by thermal expansion. Therefore, the cluster element (a cluster is defined as a set of particles that are adjacent to one another and can be used to model geometry-dependent properties such as dilation and interlocking reaction) that Potyondy and Cundall [17] and Cho et al. [18] used in PFC2D is used in the present study to investigate the process of thermally induced intergranular and intragranular cracks in granite. First, the micro-parameters of granite were calibrated from the experimental results of Strathbogie granite at room temperature. Next, the thermal expansion coefficients were assigned to different mineral types. Finally, the specimens were subjected to an elevated temperature and loaded by uniaxial compression. According to the simulation results, the distribution of micro-cracks and parallel bond forces in the granite specimen at different elevated temperatures, the micro-crack numbers with temperature, the crack evolution process, and the parallel bond force fields were analyzed in detail.
2. Discrete Element Modeling Method
In the present research, PFC2D was adopted to simulate the mechanical behavior of Strathogie granite at different temperatures under uniaxial compression. PFC2D can reduce the computation time, which is more clear for the failure process that has been adopted by many researchers to simulate the uniaxial compression tests [18,19].The overall constitutive behavior of a material is simulated in PFC2D by associating a simple constitutive model with each contact. The constitutive model that acts at a particular contact consists of three parts: a stiffness model, a slip model, and a bonding model. A parallel-bond model, a type of bonding model, can transmit both forces and moments between particles, which can better simulate the crack coalescence behavior of rock material.
The grain-based models (GBMs) [20], clumped particle model [17], and cluster model [18] were used to simulate the mechanical behavior of crystalline rocks. GBMs are constructed by overlaying a polygonal grain structure on a bonded-particle model and representing the interfaces via smooth-joint contacts. However, the thermally induced strains are produced by particle radii and the force carried in each parallel bond, and the clumped particle model cannot simulate the intragranular cracking induced by the thermal load. Therefore, the cluster model was chosen to simulate the process of thermally induced intergranular and intragranular cracks in granite.
2.1. Thermal Simulation Methodology
PFC2D allows for the simulation of transient heat conduction and storage in materials consisting of particles as well as the development of thermally induced displacements and forces. The thermal material is represented as a network of heat reservoirs associated with each particle and thermal pipes (associated with the contacts). Heat flow occurs via conduction in the active pipes that connect the reservoirs. Thermal strains are produced in the PFC2D material by accounting for the thermal expansion of the particles and the bonding material that joins them. The thermal expansion is applied as follows.
Given a temperature change of ∆T, we change each particle radius, R, such that:
where is the coefficient of linear thermal expansion associated with the particle, and R is the radius of the particle.
If a parallel bond is present at the contact associated with a pipe, we account for the expansion of the bond material by assuming that only the normal components of the force vector carried by the bond will be affected by the temperature change. We envision an isotropic expansion of the bond material, which effectively changes the bond length . This phenomenon is modeled by changing the normal component of the bond force vector as:
where, is the bond normal stiffness, A is the area of the bond cross section, is the expansion coefficient of the bond material (taken as equal to the average of the expansion coefficients of the particles at the two ends of the pipe associated with the bond), is the bond length (taken as equal to the distance between the centroids of the two particle at the ends of the pipe associated with the bond), and ∆T is the temperature increment (taken as equal to the average temperature change of the two particles at the ends of the pipe associated with the bond) [21].
2.2. Verification in Uniform Elastic Material
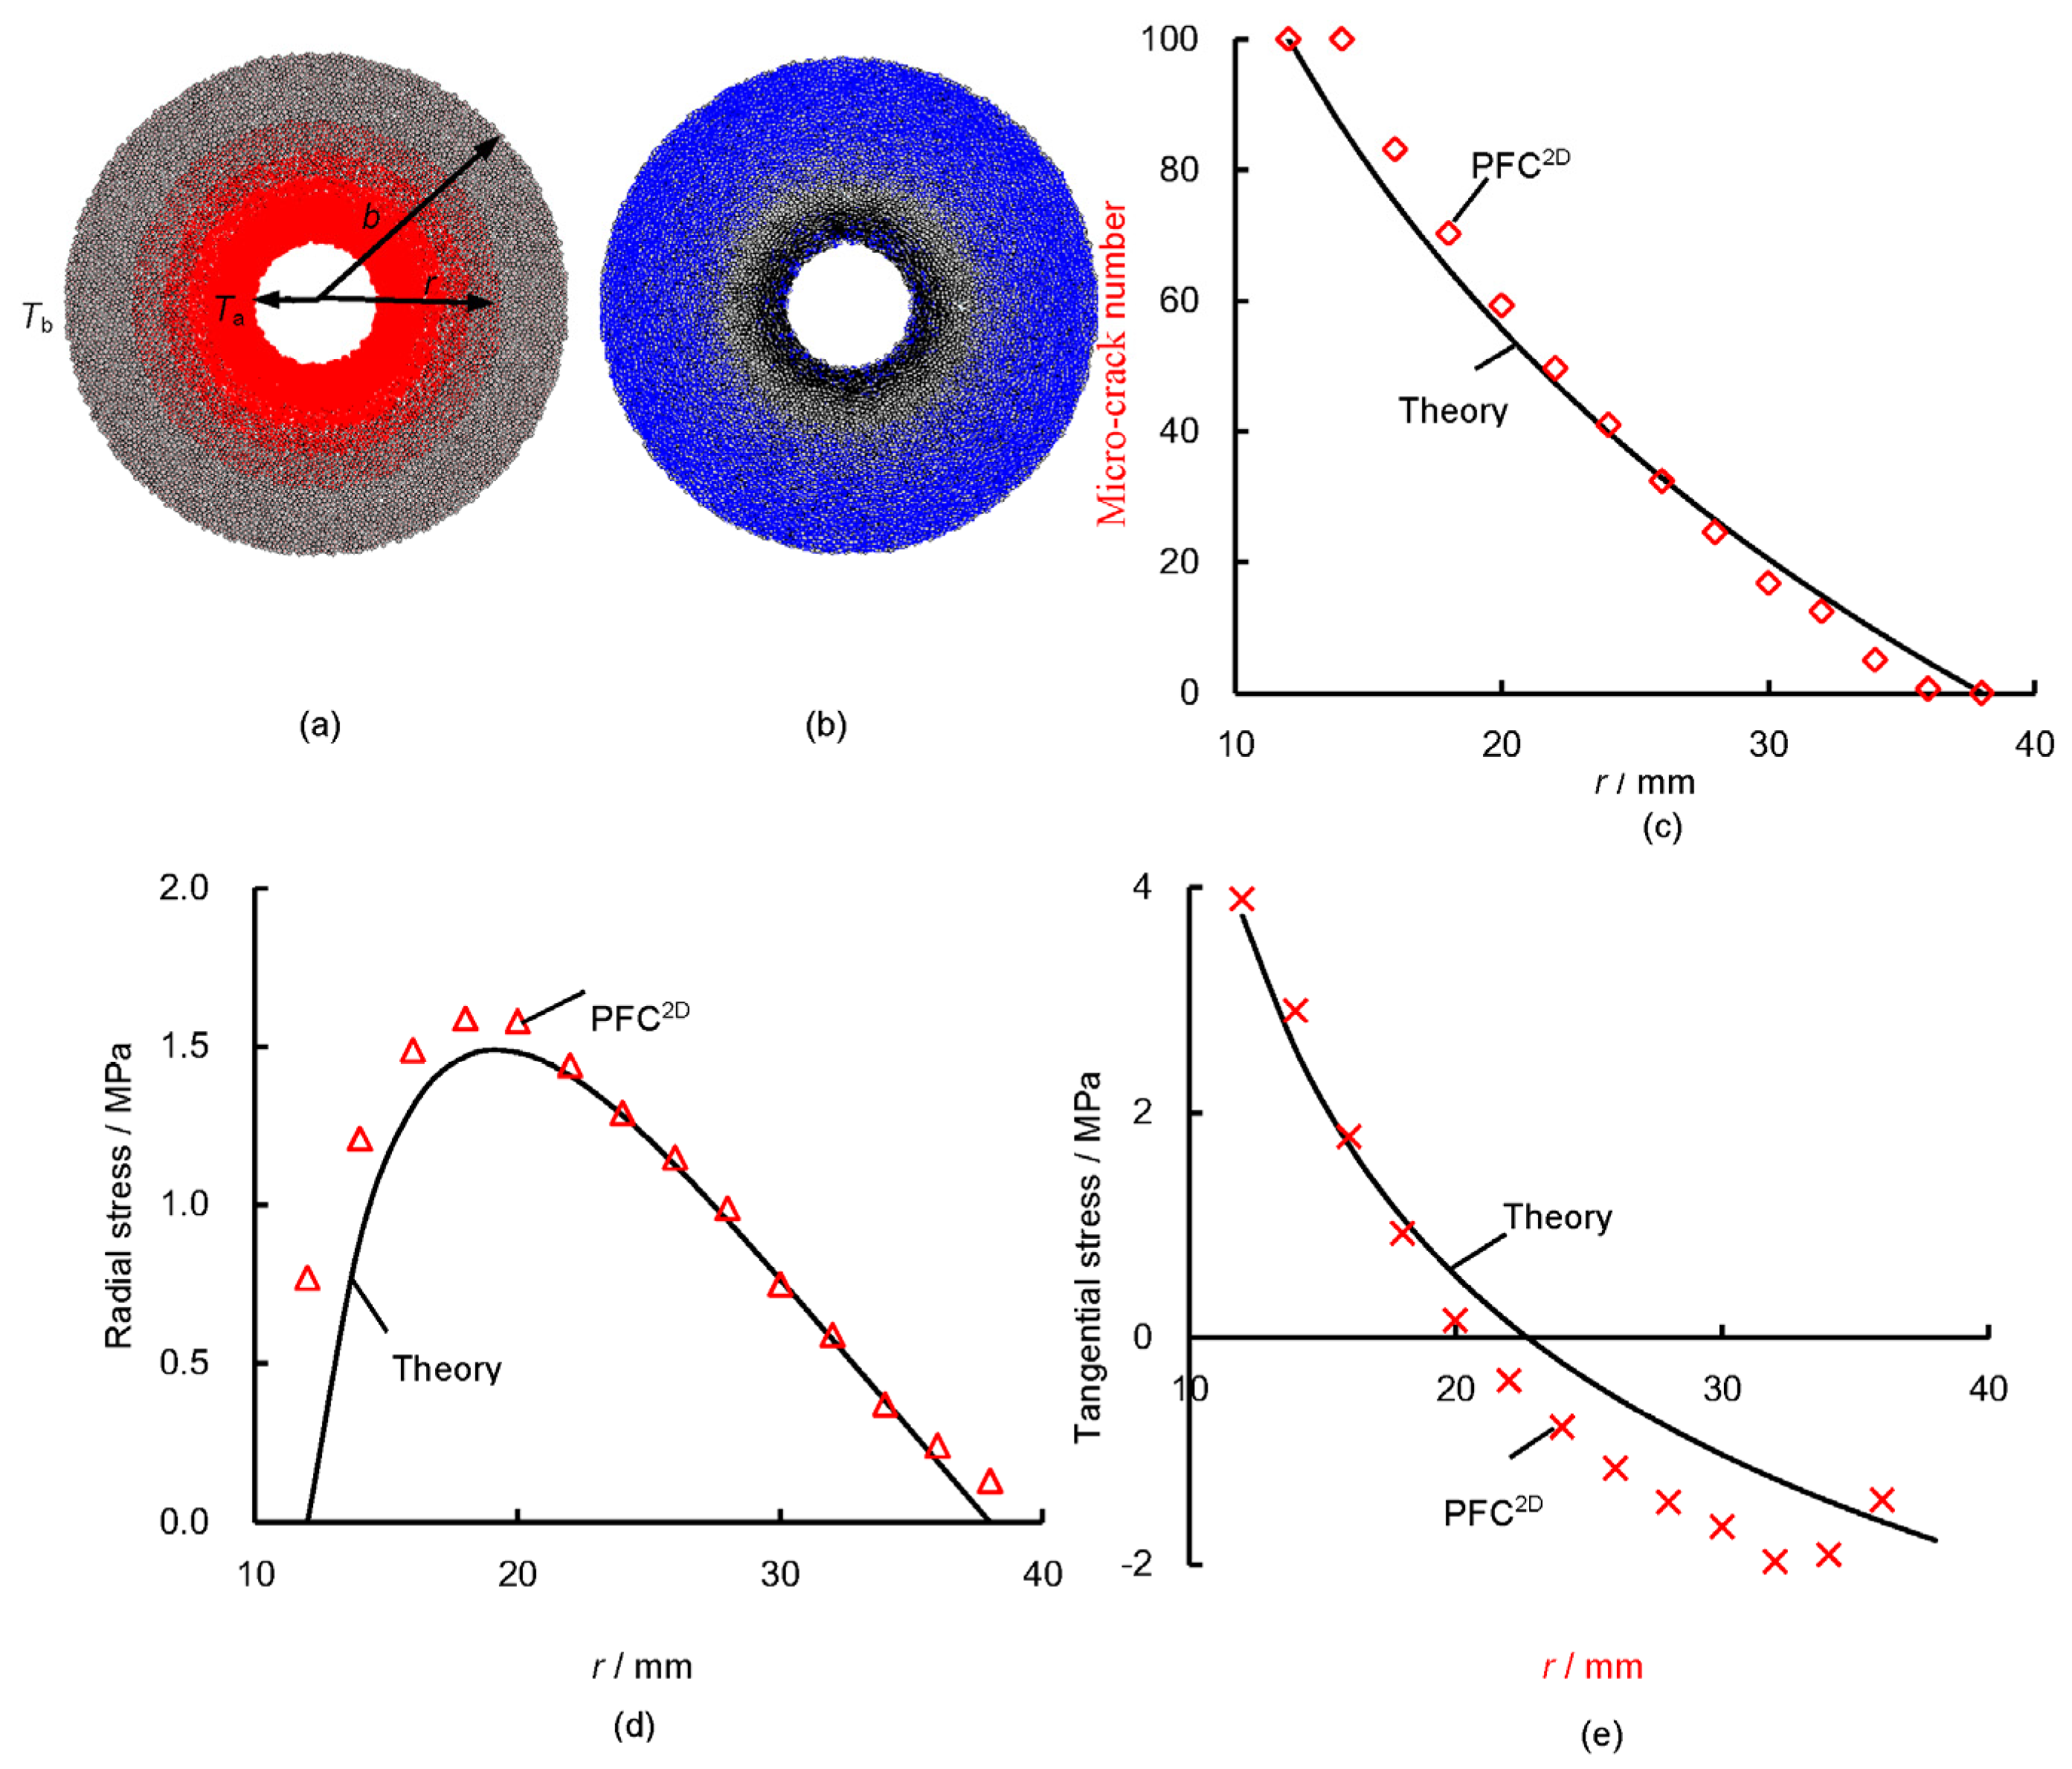
Figure 1 illustrates the temperature and stress field distribution induced by the thermal gradient of the specimens to verify the feasibility of PFC2D. The annular sample (uniform material) has internal and external radii of a = 12 mm and b = 38 mm for the temperature and stress field distribution induced by thermal gradient. The mechanical parameters such as the Young’s modulus (E = 30.88 GPa), Poison’s ratio (μ = 0.16), thermal conductivity coefficient (k = 3.5 W/m°C), coefficient of linear thermal expansion (αt = 3.0 × 10⁻⁶ K−1), and heat at constant volume (Cv = 1015J/kg°C) are defined, and then constant temperatures are applied on both the internal (Ta = 100 °C) and external (Tb = 0 °C) boundaries. Assuming a steady-state thermal problem, the temperature profile for an annular sample is [9]:
According to the classical theory of thermo-elasticity [22,23], the radial and tangential stresses induced by the thermal gradient are:
Figure 1a shows the temperature distribution in the annular specimen. In Figure 1a, the radius of the red point represents the magnitude of the temperature. The temperature decreases rapidly at first and then slowly with increased radius. Figure 1b illustrates the parallel bond forces in the specimen. The black and blue segments represent the compressive and tensile force in the parallel bond. In Figure 1b, the compressive force concentrates near the internal radius of the hollow specimen, and tensile force concentrates near the external radius of the hollow specimen.
Figure 1c–e show the temperature, radial stress, and tangential stress variation with increasing radius, respectively. The radial and tangential stresses are obtained by the measurement circle (the radius is 4 mm, and the interval is set as 2 mm). These figures show that the temperature, radial stress, and tangential stress are consistent with the analytical solutions.
2.3. Modelling the Specimen with Clusters
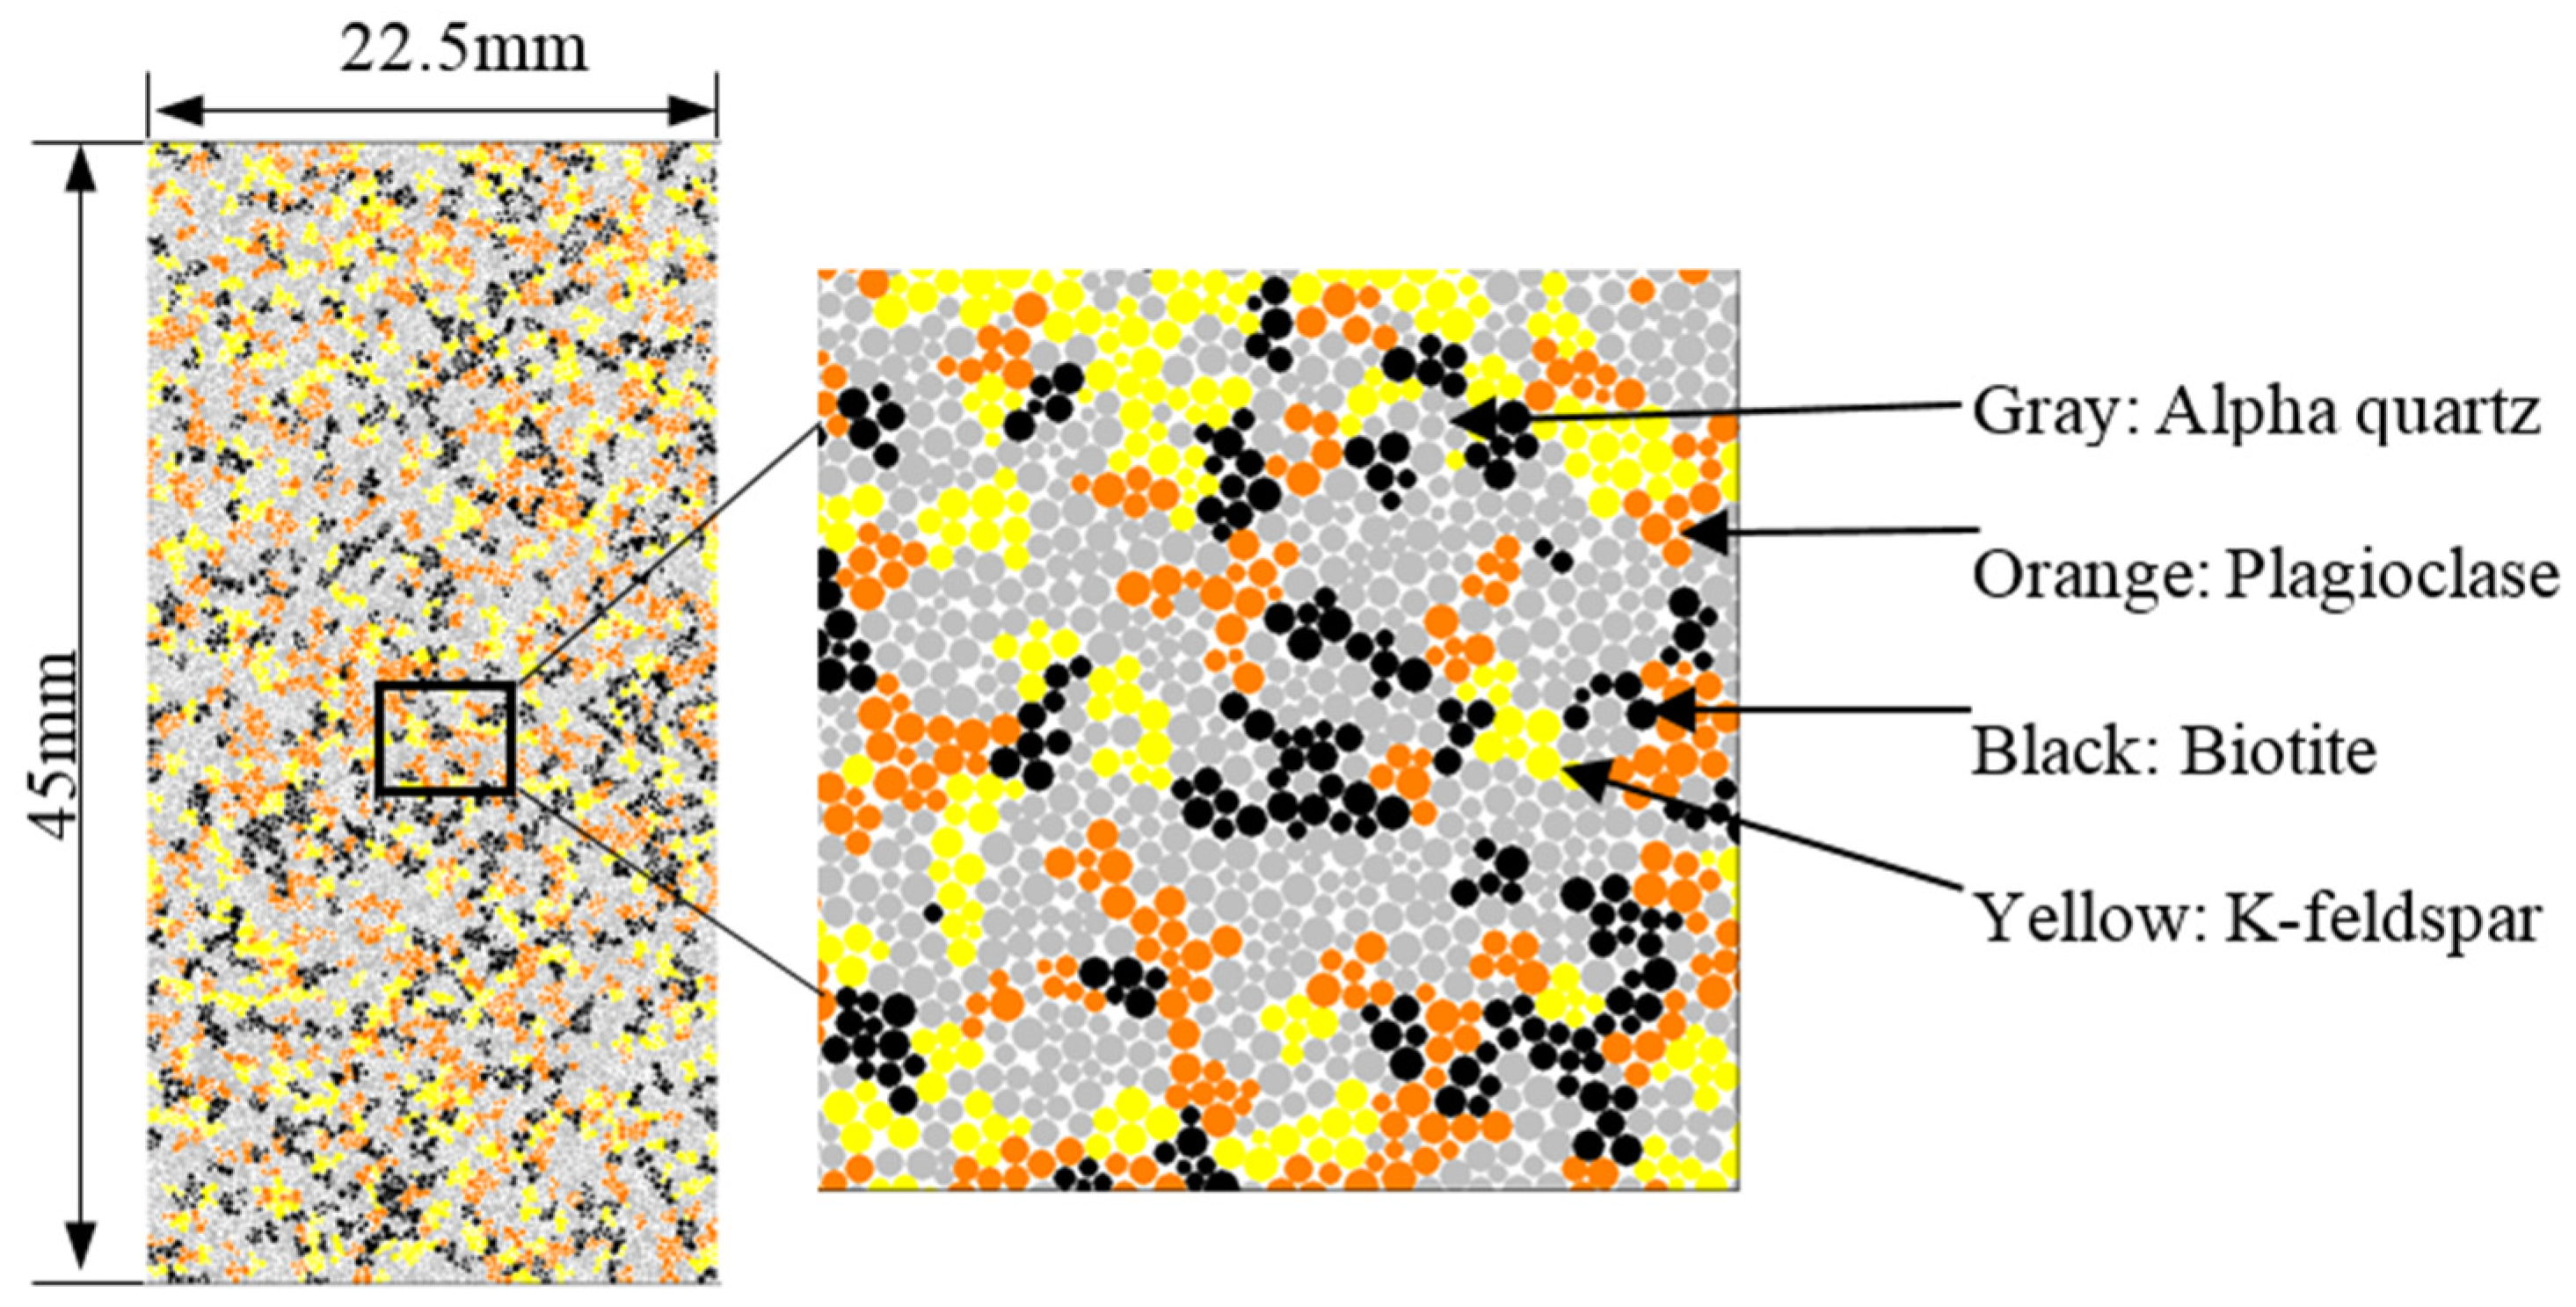
First, a numerical intact specimen was generated by PFC2D, and the scale of the numeric specimen was the same as that of the experimental specimen, i.e., 22.5 mm in width and 45 mm in height. Since the particle size followed a uniform distribution ranging from 0.1 mm to 0.2 mm, each numerical specimen was discretized into 12,032 particles with 29,663 parallel bonds. After generating the intact specimen, the development of a cluster model began. A particle was randomly chosen as a parent and was then looped through the particles that contacted the parent particle and it was added to the cluster until the set number was reached. If the number of balls in each cluster was not reached, the traversing particle continually contacted the cluster, until the maximum number of balls in each cluster was reached. The maximum number of balls in each cluster was set as 5, and 3184 clusters were generated in the box.
Strathbogie granite is a high-level, discordant, composite granite intrusion in south-eastern Australia, which has been studied by some researchers as a geothermal reservoir rock [5,24,25]. It is fine-grained and white gray and dark brown in color with a tested porosity of 0.463% [25,26]. The tested granite mainly consists of alpha quartz (50%), plagioclase (16%), biotite (15%), and K-feldspar (13%), as shown in Table 1 [5]. Based on individual cluster identification codes, each cluster was randomly specified to a type of mineral, and the number of clusters correspond to the mineral content, and eventually four mineral groups were formed (Figure 2). Then 1785 clusters were defined as alpha quartz, 509 clusters as plagioclase, 477 clusters as biotite, and 413 clusters as K-feldspar. Correspondingly, 3374 contacts were defined between quartz and plagioclase, 3141 between quartz and biotite, 2637 between quartz and K-feldspar, 1092 between plagioclase and biotite, 940 between plagioclase and K-feldspar, 857 between biotite and K-feldspar, 4367 between two quartz grains, 590 between two plagioclase grains, 549 between biotite grains, 378 between K-feldspar grains, and 13,760 contacts were defined as intergranular.
To accurately reflect the thermal behavior of rock specimens containing different minerals, the thermal expansion coefficients assigned to the minerals were as follows: quartz, 24.3 × 10⁻⁶ K−1; plagioclase, 14.1 × 10⁻⁶ K−1; biotite, 3.0 × 10⁻⁶ K−1; and K-feldspar, 8.7 × 10⁻⁶ K−1 [27].
3. Confirmation of Micro-Parameters of Strathbogie Granite
The determination of micro-parameters in PFC2D via experiments is known to be difficult. However, to validate the particle properties used in the numerical modeling, it is essential to establish a correlation between the macro-behavior (i.e., the axial stress-strain curve, uniaxial peak strength, ultimate failure mode, and crack coalescence process) and the micro-parameters. During the calibration process, the micro-parameters were confirmed by “trial and error”. The macroscopic behavior of a granite specimen at room temperature (T = 23 °C) under uniaxial compression obtained by experimentation was used in this study to calibrate the micro-parameters. The macroscopic results obtained by numerical simulation after each trial were used to check the micro-parameters [21]. This process was repeated until the numerical results achieved good agreement with the experimental results. Table 2 lists the micro-parameters used in the cluster model for Strathboge granite. The effective Young’s modulus of the particle and parallel bond are 20 GPa, and the ratio of normal to shear stiffness of the particle and parallel bond are both 2.5. The values of the intracluster parallel-bond normal strength and shear strength are 220 ± 30 MPa and 320 ± 60 MPa, respectively. The value of the intercluster parallel-bond normal strength and shear strength are 110 ± 20 MPa and 160 ± 30 MPa, respectively.
Figure 3 illustrates a comparison of the experimental and numerical failure mode for Strathbogie granite at room temperature under uniaxial compression. The peak strength of the numerical study was 210.41 MPa, which was approximately equal to that obtained by experimentation (215.98 MPa). For the numerical failure mode shown in Figure 3, the red and blue segments represent the micro-cracks that formed as a result of tensile and shear contact forces exceeding the prescribed parallel-bond normal strength and shear strength, respectively. The failure pattern for the numerical specimen is approximately diagonal and shows more brittle characteristics, which approximate the experimental failure mode [25].
4. Crack Distribution in the Specimen after Heat Treatment
After the mechanical micro-properties of the particle and parallel bonds were assigned, the thermal properties of mineral grains were assigned according to their mineral type. The four walls around the specimen were deleted before heating the specimen. To minimize thermal shock and the development of stress fractures, the temperature of the granite specimens was assumed to change uniformly and in a sufficiently short time. The temperature of the granite specimen uniformly changed by 10 °C every step and the cycle of the model until a static equilibrium state was reached (the ratio of the maximum unbalanced magnitude over all the particles divided by the average applied force magnitude over all the particles was equal to 0.05). Then 10,000 cycles were run after reaching the target temperature.
The thermal stresses induced by the different thermal expansions of the four minerals increase as the temperature continuously increases. Once the force of contact reaches the strength criterion, thermally induced cracks initiate and grow. The distribution of micro-cracks and parallel bond forces in granite specimens at different temperatures are illustrated in Figure 4 (The enlarged portion is the same as Figure 2) in which the first row represents the crack distribution, and the second row represents the parallel bond forces. In the first row, red segments between balls represent the tensile cracking, and no shear cracking (blue segment) is observed in granite specimens at different temperatures. In the second row, the red and black segments represent tensile and compressive parallel bond forces, respectively, and the magnitude of the force is represented by the width of the segment. When the temperature is below 200 °C, no cracking is observed in the specimens, and the tensile forces mainly concentrate between the mineral boundaries, especially the biotite boundaries. When T = 400 °C, less tensile cracking is observed between the biotite and other minerals, tensile forces concentrate at the plagioclase and K-feldspar boundaries, but they mainly concentrate at the biotite boundaries. When T = 600 °C, more tensile cracks are observed at the biotite, plagioclase, and K-feldspar boundaries, and some cracks coalescence with each other. The tensile force concentrations at the biotite boundaries are somewhat reduced, due to crack initiation at the biotite boundaries. When the temperature is over 600 °C, increasing tensile cracking is observed in the specimens with increasing temperature, and the tensile forces also concentrate at the boundaries of the minerals.
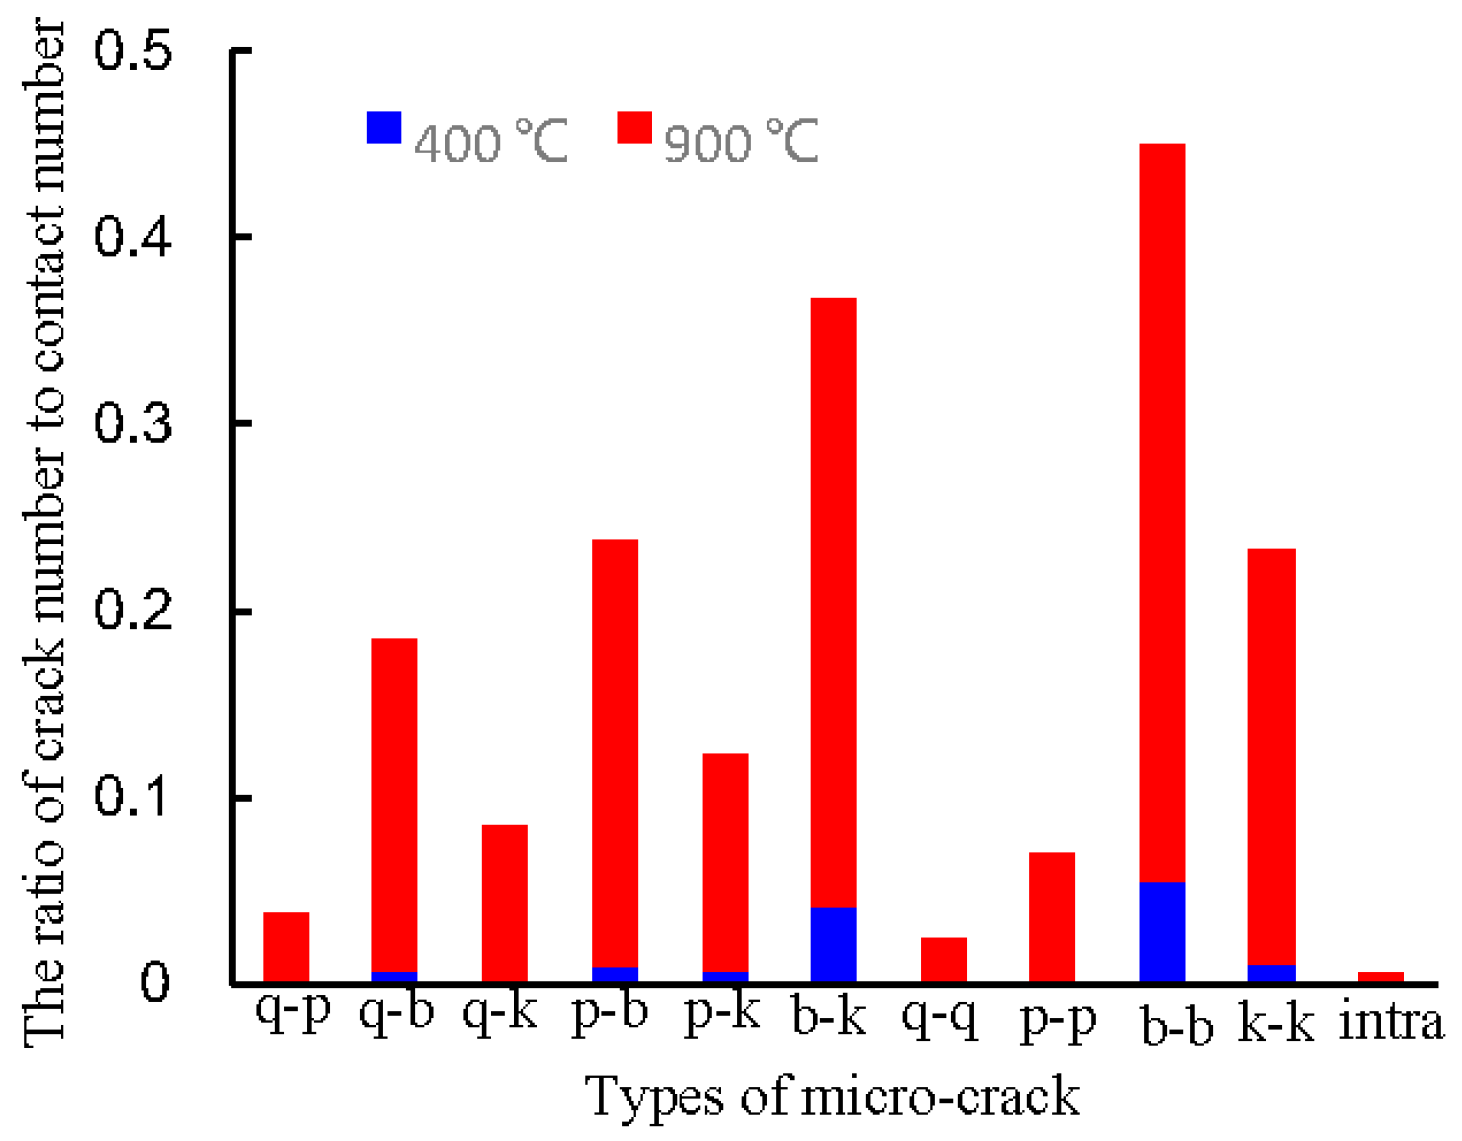
To investigate the distribution of different micro-cracking types in the heated granite specimen, the ratio of broken contacts (cracks) to corresponding total contacts was analyzed at temperatures of 400 °C and 900 °C. In Figure 5, the letters q, p, b, and k represent quartz, plagioclase, biotite, and K-feldspar, respectively, while q-p represents micro-cracking between quartz and plagioclase, and intra represents the intragranular cracking. When T = 400 °C, the contacts between biotite and between biotite and K-feldspar are easily broken. This can be explained by the greater difference in the coefficient of linear thermal expansion between the biotite and other minerals, which easily induces tensile stress between the biotite and other minerals, as shown in Figure 4. Less cracking is found between quartz, plagioclase, and K-feldspar, due to the minor differences in the coefficients of linear thermal expansion between the minerals. No p-p and intragranular cracks were observed.
When T = 900 °C, the ratio between the number of cracks and the corresponding total number of contacts increases with increasing temperature, and the difference between the ratio of different minerals also decreases with increasing temperature. However, the ratios of b-b and b-k are greater than those of the other minerals. The p-p and intragranular cracking are found in the specimens, but their ratio is minor.
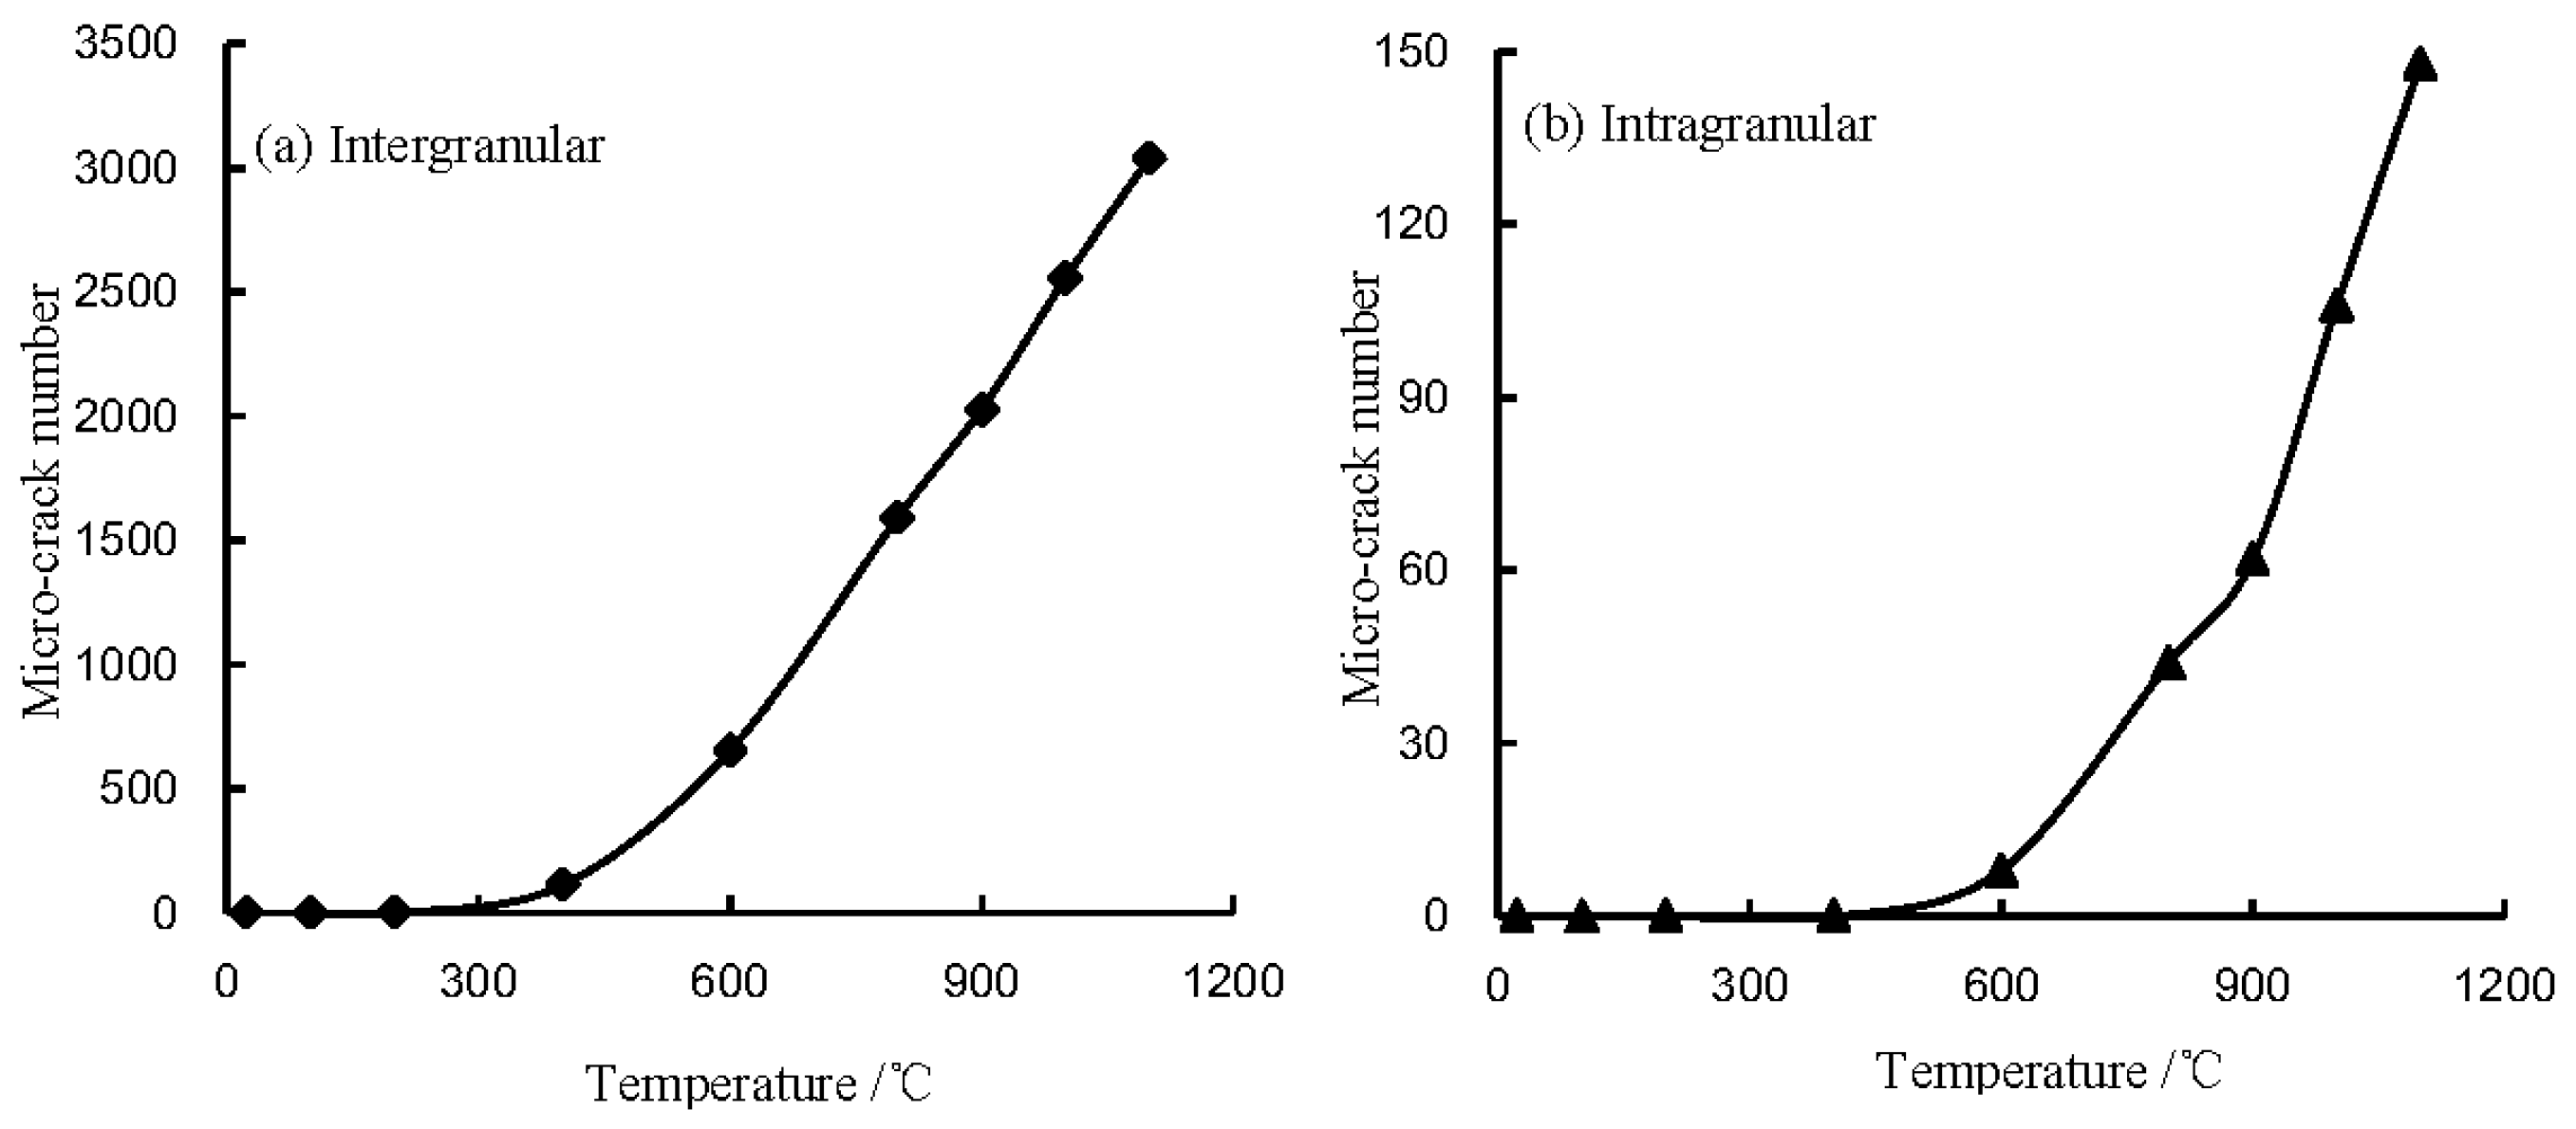
Figure 6 presents the variation of micro-cracking numbers with temperature. The crack number is almost zero at lower temperatures and rapidly and linearly increases thereafter. Figure 6a shows that the number of intergranular cracks is almost constant when the temperature is below 300 °C, then, it rapidly increases in a linear manner when the temperature is over 300 °C. The variation of the intragranular crack numbers with temperature is illustrated in Figure 6b. As for the trend of grain boundary cracking, the number of intragranular cracks is first constant and then rapidly increases with increasing temperature. However, the inflection point occurs for T = 400 °C. This result is the same as that obtained by Nasseri [28]. Figure 7 presents the evolution of the intergranular micro-cracks and intragranular micro-crack densities as a function of the temperature. Intergranular crack densities continue to increase with temperature. However, intragranular crack densities are almost constant when the temperature is below 400 °C, and then they rapidly increase linearly with increasing temperature. From the above analysis, we conclude that grain boundary cracking is more easily induced by high temperatures than by intragranular cracking.
5. Failure Process of the Granite Specimen under Uniaxial Compression
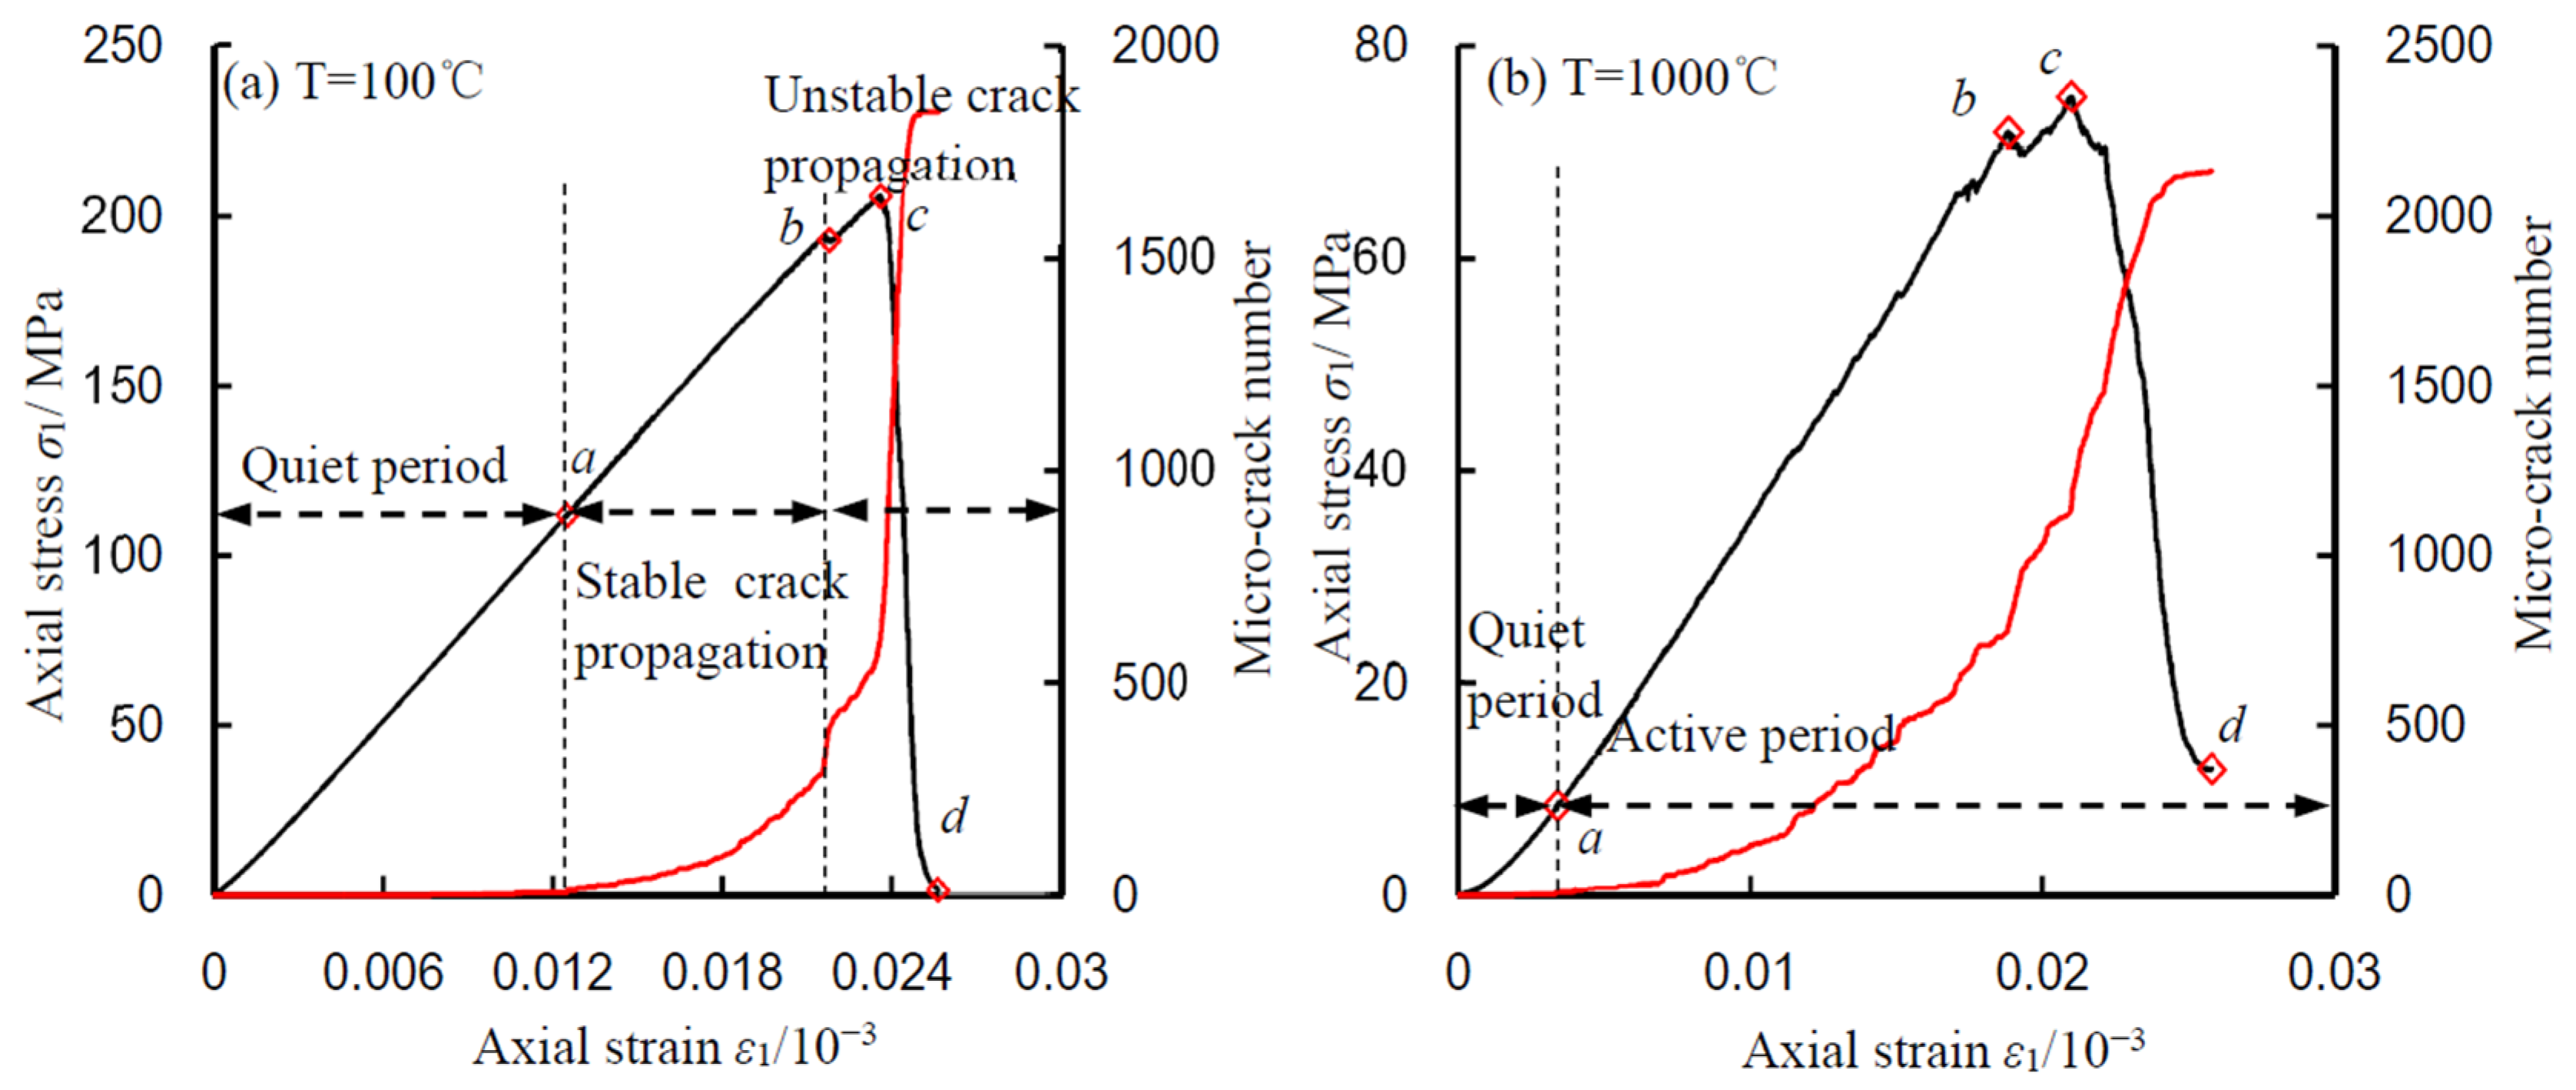
First, 0.1 MPa pre-pressure was applied to the heating treatment specimen, and then uniaxial compression testing was adopted. Figure 8 depicts the variation of the cumulative crack number against the axial stress for specimens tested at temperatures of 100 °C and 1000 °C. When T = 100 °C as shown in Figure 8a, the cumulative crack number curve can be divided into two typical periods, i.e., a quiet period and an active period. In the quiet period, the crack numbers are almost zero. The quiet period corresponds to the stage of elastic deformation. In the active period, the cumulative crack number undergoes two different stages, that is, stable and unstable crack propagation. In the stable crack propagation stage, cracking initiates and propagates in a stable way, the crack numbers slowly increase, and the number of cracks is lower compared to the stage of unstable crack propagation. In the unstable crack propagation stage, the crack numbers rapidly increase in an exponential way. The unstable crack propagation stage corresponds to a sudden drop in the axial stress near peak strength. The characteristics of the cumulative crack number curve obtained by numerical analysis are similar to those observed by Shao et al. [25], Ranjith et al. [29], and Yang et al. [30].
When T = 1000 °C as shown in Figure 8b, the cumulative crack (not containing the crack induced by thermal stress) count curve also has a quiet period and an active period, but the active period cannot be divided into a stable crack propagation stage and an unstable crack propagation stage, and the crack initiation stress is also less than that at T = 100 °C. This phenomenon can be explained as follows: the structure of a specimen at elevated temperature is somewhat damaged, and cracking easily initiates and propagates when axial stress is applied. In addition, since a flawed specimen cannot regain more elastic strain energy with that of an intact specimen, violent destruction cannot be observed after the peak strength, and the crack numbers increase and axial stress drops steadily.
In a general sense, the higher the rock strength, the more micro-cracks will be generated during loading. However, the results show the opposite trend. In our opinion, on the one hand, cracks will easily be generated at an elevated temperature, and less energy will be dissipated due to the induced crack. On the other hand, more strain energy has been stored in the specimen, due to the mineral expansion at the elevated temperature.
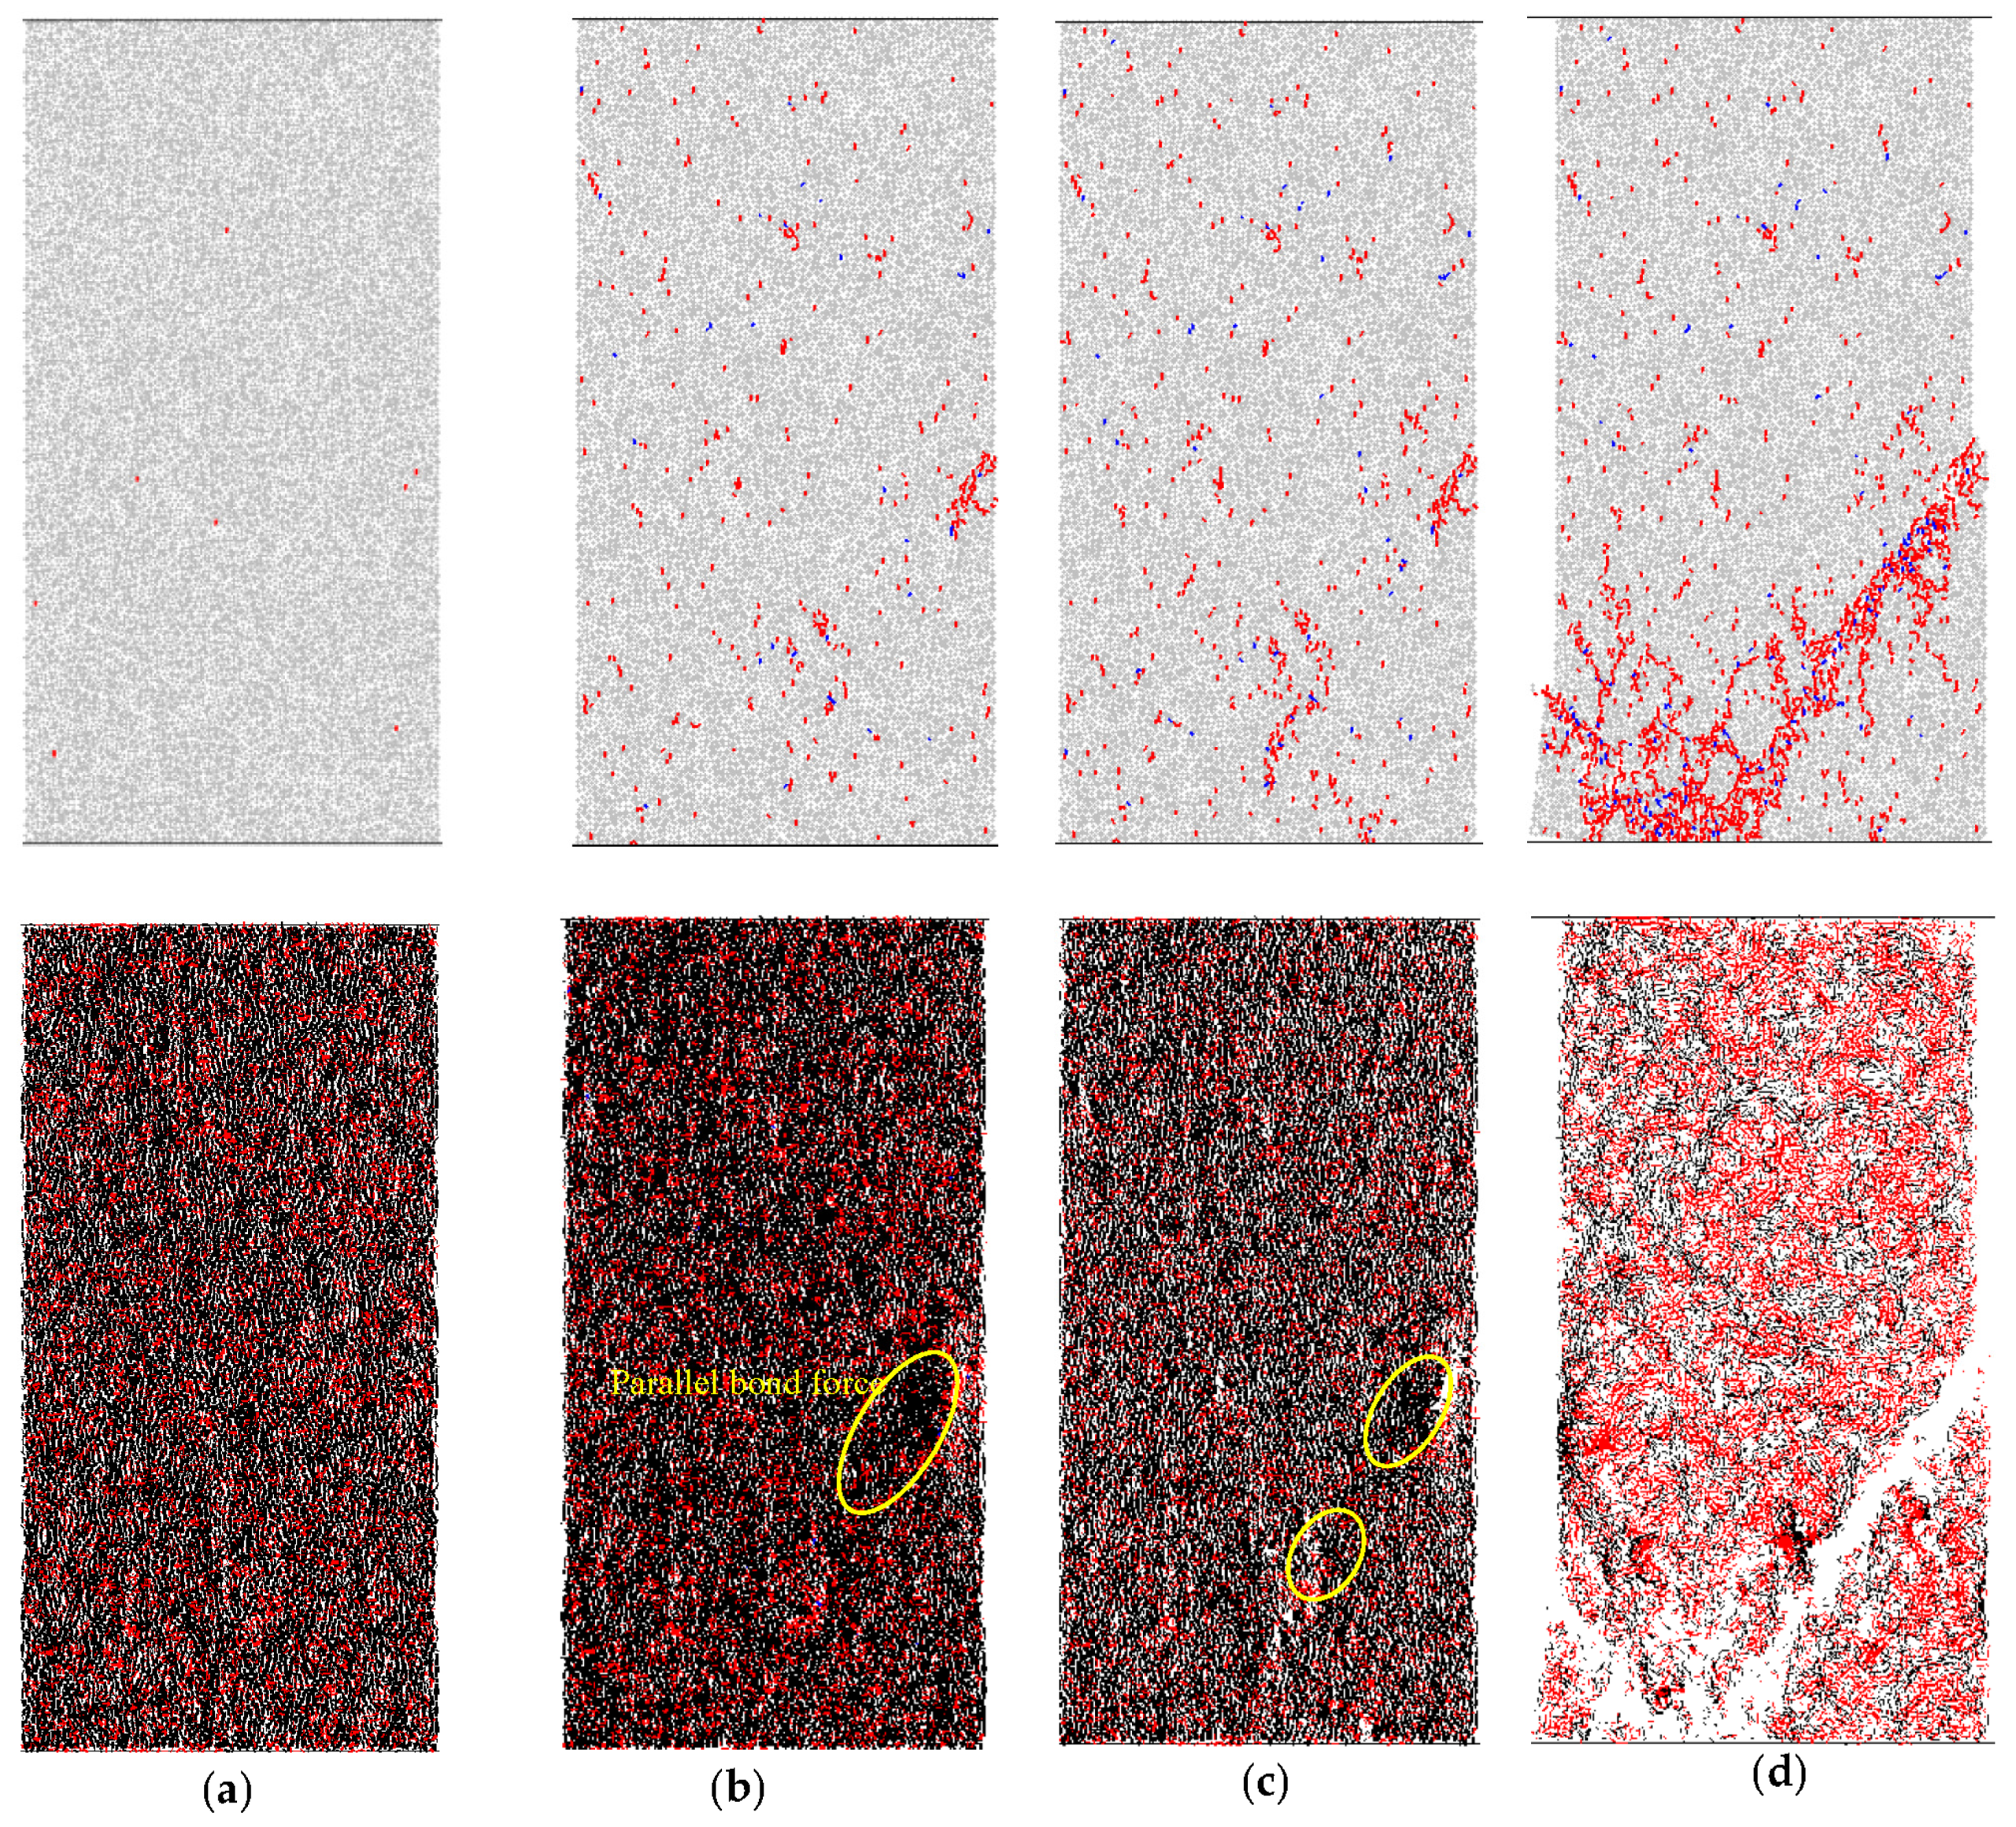
Corresponding to the letters in Figure 8a, the crack evolution process and parallel force field of the granite specimens at 100 °C are shown in Figure 9. As shown in Figure 4, the first row represents the crack distribution, and the second row represents the parallel bond force. In the first row, the red segment represents tensile cracking, and the blue segment represents shear cracking. In the second row, the red segment represents the tensile parallel bond force, the black segment represents the compressive parallel bond force, and the magnitude of the force is represented by the width of the segment.
When the axial stress is loaded to point a (ε1 = 1.25 × 10⁻², σ1 = 112.07 MPa), the maximum parallel bond force (PFm) equals 2.21 × 10⁴ N, and the number of micro-cracks begins to increase slowly with axial loading. Micro-cracks are randomly distributed in the specimens, and the parallel bond force is evenly distributed. After point a, the axial stress and number of micro-cracks steadily increase with the axial strain. When the stress reaches point b (ε1 = 2.18 × 10⁻², σ1 = 192.81 MPa), and the PFm is 4.47 × 10⁴ N, the stress slightly drops, and the number of micro-cracks sharply increases with increasing axial strain. Some micro-cracks coalesce with each other, and the parallel bond force is also evenly distributed overall, but the parallel bond force concentrates in a particular area, as shown in Figure 9b. When the axial stress load reaches the peak strength (ε1 = 2.36 × 10⁻², σ1 = 205.63 MPa), the PFm is 6.19 × 10⁴ N and the micro-crack numbers increase sharply with the axial strain. More micro-crack coalescence is observed, and parallel bond force concentration is found at the tips of the macro-crack. After peak strength, the axial stress suddenly drops with the axial strain. The axial stress is almost zero when it drops to point d (ε1 = 2.56 × 10⁻², σ1 = 1.75 MPa), and the PFm decreases from 6.19 × 10⁴ N to 1.47 × 10⁴ N. A macro shear zone appears in the specimen, and the force concentration is released.
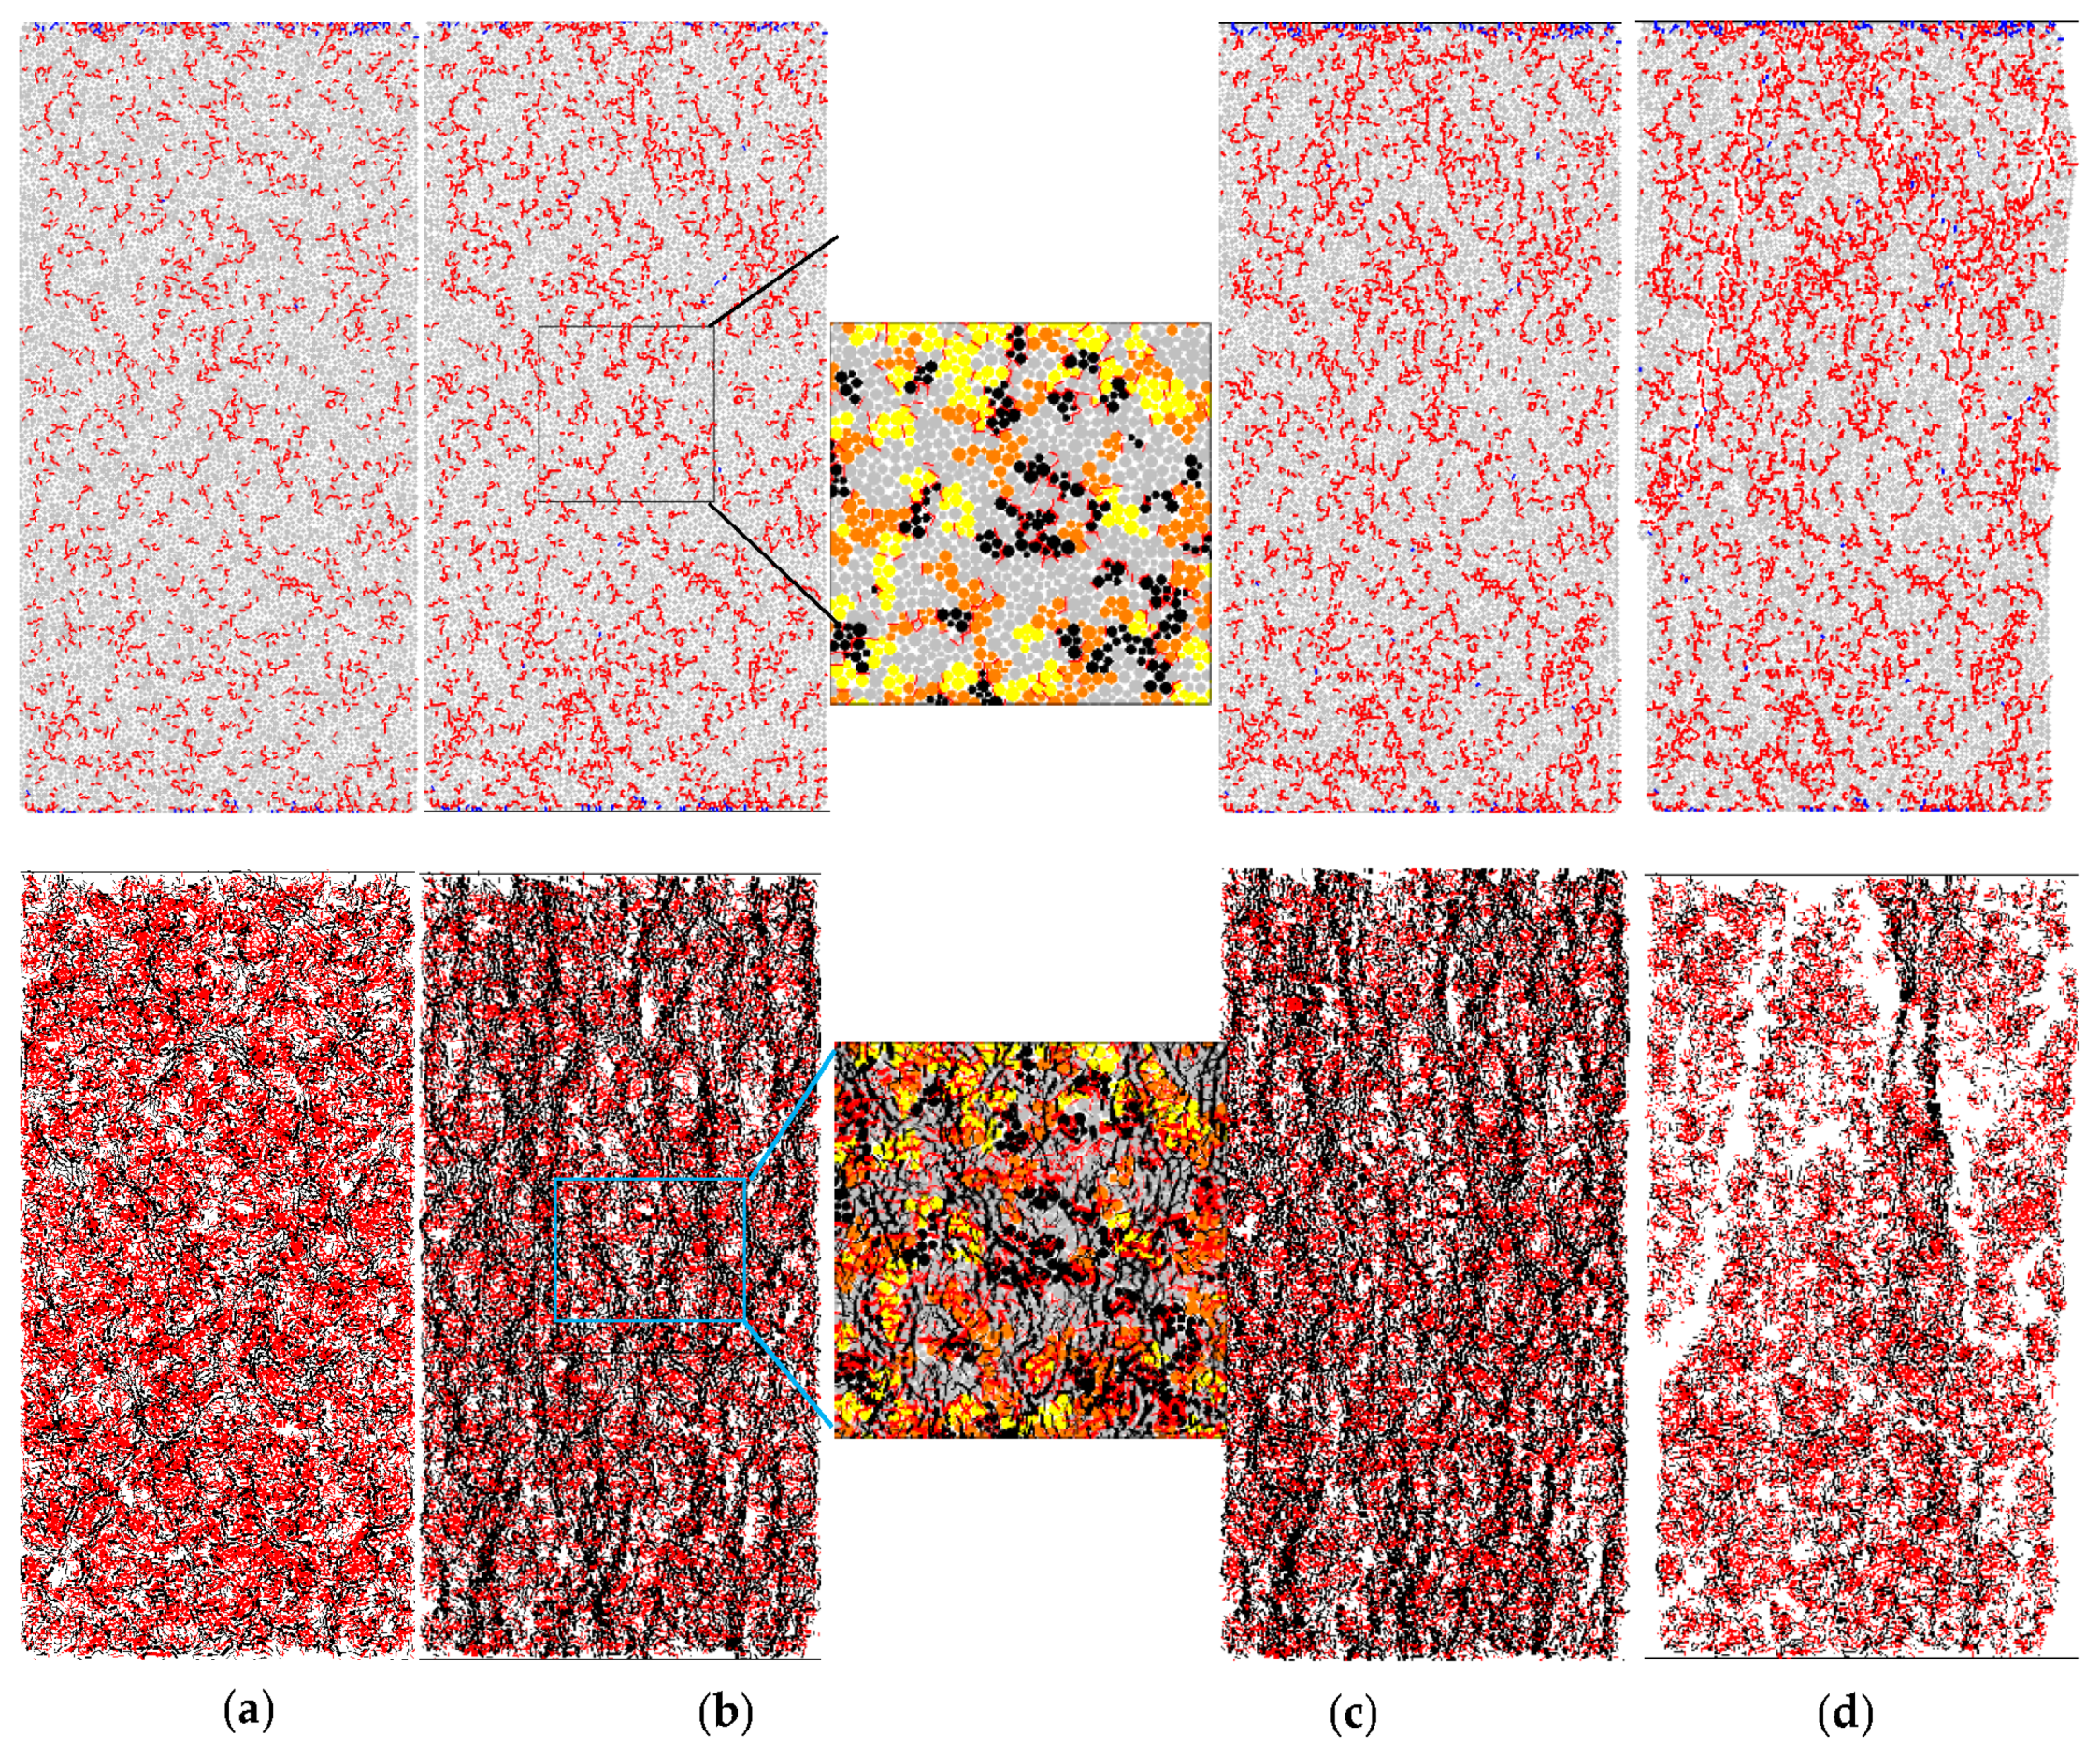
Corresponding to the letters in Figure 8b, the crack evolution process and parallel force field of a granite specimen at 1000 °C are shown in Figure 10. When the axial stress is loaded to point a (ε1 = 3.39 × 10⁻³, σ1 = 8.44 MPa), the PFm is 3.34 × 10⁴ N, and the number of micro-cracks begins to slowly increase with axial loading. The micro-cracks coalesce with each other, and many macro-cracks along the mineral boundaries are observed. The tensile force concentration along the mineral boundaries is also found, due to the differential thermal expansion of mineral granite. After point a, the number of micro-cracks increases in a stable way. When the specimen is loaded to point b (ε1 = 1.88 × 10⁻², σ1 = 71.87 MPa), the PFm increases to 4.75 × 10⁴ N. The macro cracks propagate at some distance along the mineral boundaries. The compressive force is mainly concentrated in the grains, and the tensile force is mainly concentrated at the mineral boundaries, as shown in a partial enlarged drawing in Figure 10b. When the axial stress increases to the peak strength (ε1 = 2.10 × 10⁻², σ1 = 75.31 MPa), the PFm equals 5.01 × 10⁴ N. More macro-cracks along the mineral boundaries coalesce with each other, the tensile parallel bond force concentrates at the mineral boundaries, and the compressive parallel bond force also concentrates along the line that is almost parallel to the loading direction. After the peak strength, the axial stress gradually decreases with the axial strain. When the axial strain is loaded to point d (ε1 = 2.58 × 10⁻², σ1 = 11.93 MPa), the axial stress and the number of micro-cracks are almost constant. The PFm slightly decreases from 5.01 × 10⁴ N to 4.67 × 10⁴ N, meaning that the specimens also have carrying capacity.
By comparing Figure 9 and Figure 10, we can see that the micro-crack distribution in the specimen moves from random to coalescing at a local region, and then the specimens emanates macro shear cracks with the loading process at a lower temperature (T = 100 °C). However, micro-cracks mainly propagate along mineral boundaries and then form macro-cracks in the specimen at an elevated temperature (T = 1000 °C). The parallel bond force is evenly distributed at the initiation of the loading phase, and then concentrates at local areas and finally releases to a low level at a lower temperature (T = 100 °C). However, the tensile parallel bond force mainly concentrates at the mineral boundaries, the compressive parallel force concentrates along a line almost parallel to the loading direction while no force concentrates at local areas, and the PFm shows only a slight decrease. This phenomenon explains why the specimens have residual strength at an elevated temperature.
6. Mechanical Behavior of the Granite Specimens under Uniaxial Compression
Figure 11 presents a comparison of the experimental and numerical stress-strain curves for Strathbogie granite at different temperatures under uniaxial compression. According to Figure 11a, the experimental stress-strain curves from 23 °C to 1100 °C show two different behaviors. The stress-strain curves from 23 °C to 600 °C display an initial elastic increase in the stress with increasing strain until the peak strength is reached, which is then followed by a sudden drop of stress. On the other hand, the curves with a temperature over 800 °C display a more gradual decrease in the stress after the peak strength with increasing strain at failure [25]. According to Figure 11b, similar behavior appears with increasing temperature, except for the stress-strain curve of 1100 °C. The reason for this phenomenon is that the PFC cannot simulate the partial melting of the Strathbogie granite at or above 1100 °C. However, the peak strain of the numerical results after 600 °C is underestimated, because of the failure to consider the plastic deformation and thermal transition of quartz.
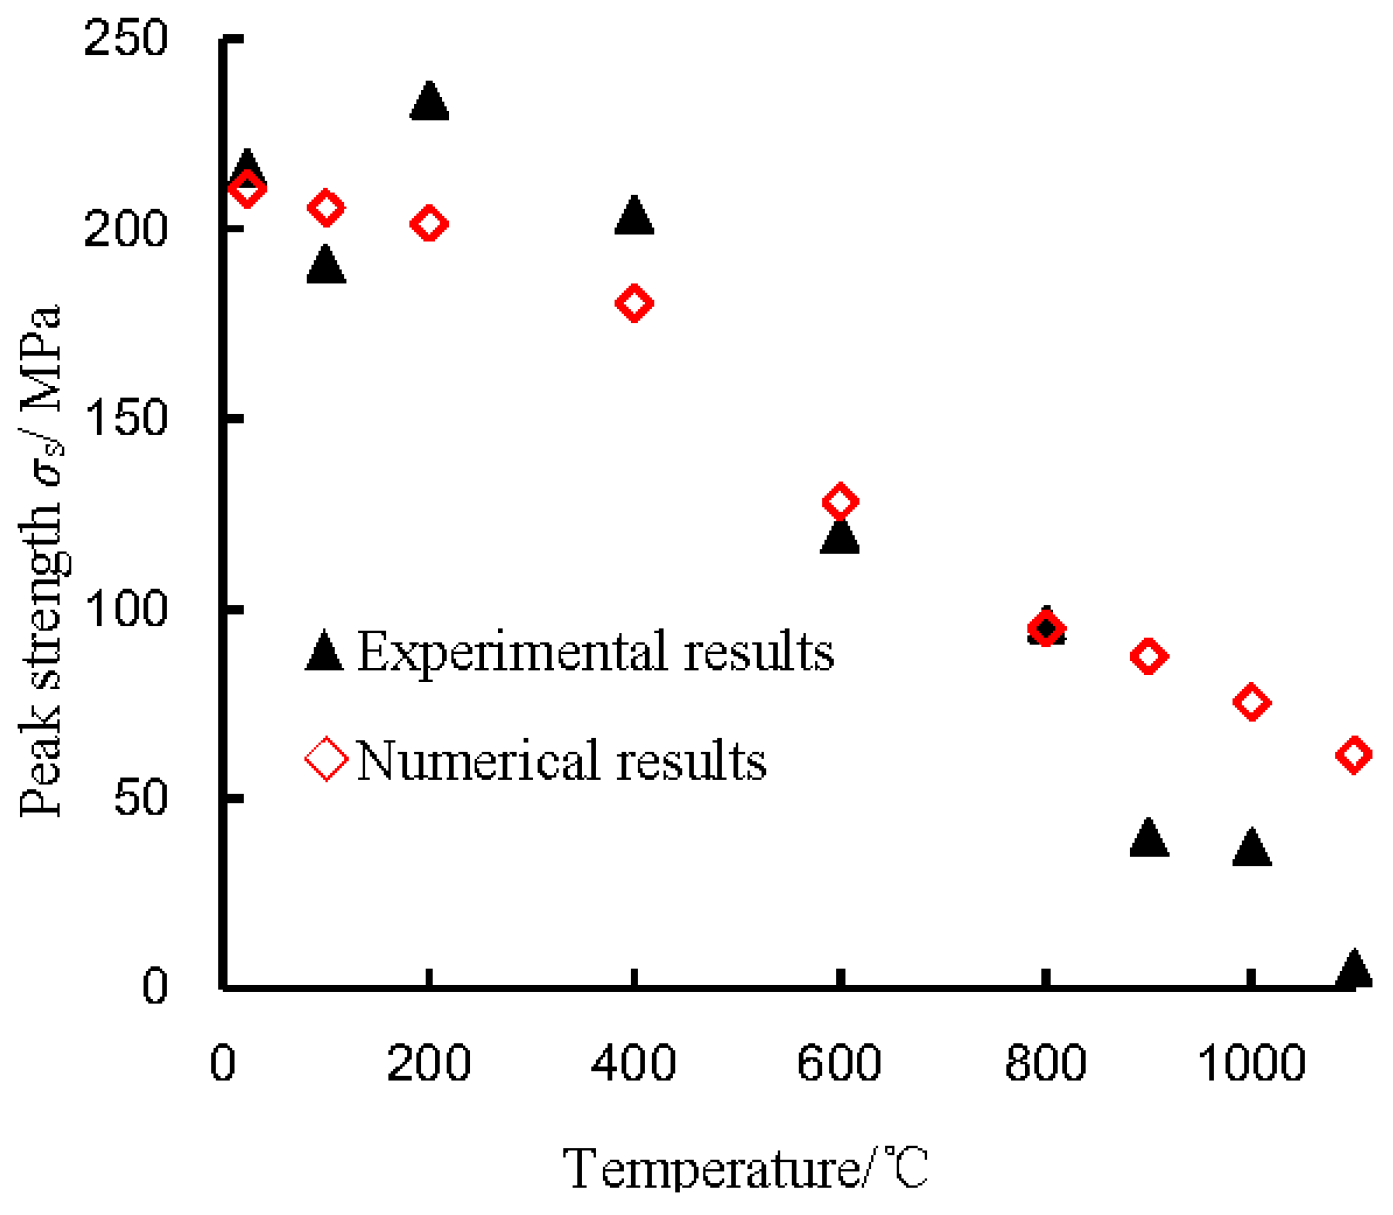
Figure 12 presents a comparison of the experimental and numerical peak strength for Strathbogie granite at different temperatures under uniaxial compression. In Figure 12, the peak strength of heated granite simulated by PFC2D shows a similar trend to that obtained from the experiments with increasing temperature, except for 1100 °C. When the temperature is below 400 °C, the peak strength is almost constant, and a sudden drop in the peak strength can be observed when the temperature increases from 400 °C to 900 °C.
The ultimate failure modes at different temperatures are depicted in Figure 13. Under uniaxial compression, the specimens at temperature from 100 °C to 400 °C show typical brittle failure with a diagonal shear fracture plane, which is the same as that at room temperature. As the temperature increases, the fracture pattern of the specimens transitions to a single shear fracture plane, and the width is increased at T = 600 °C. The shear fracture planes become more indistinct when the temperature is higher than 800 °C. Moreover, the specimens show cataclastic failure when the thermal damage is sufficiently intense (Figure 13e–h). The variation of ultimate failure with temperature is the same as that obtained in the experiments [25], as shown in Figure 14.
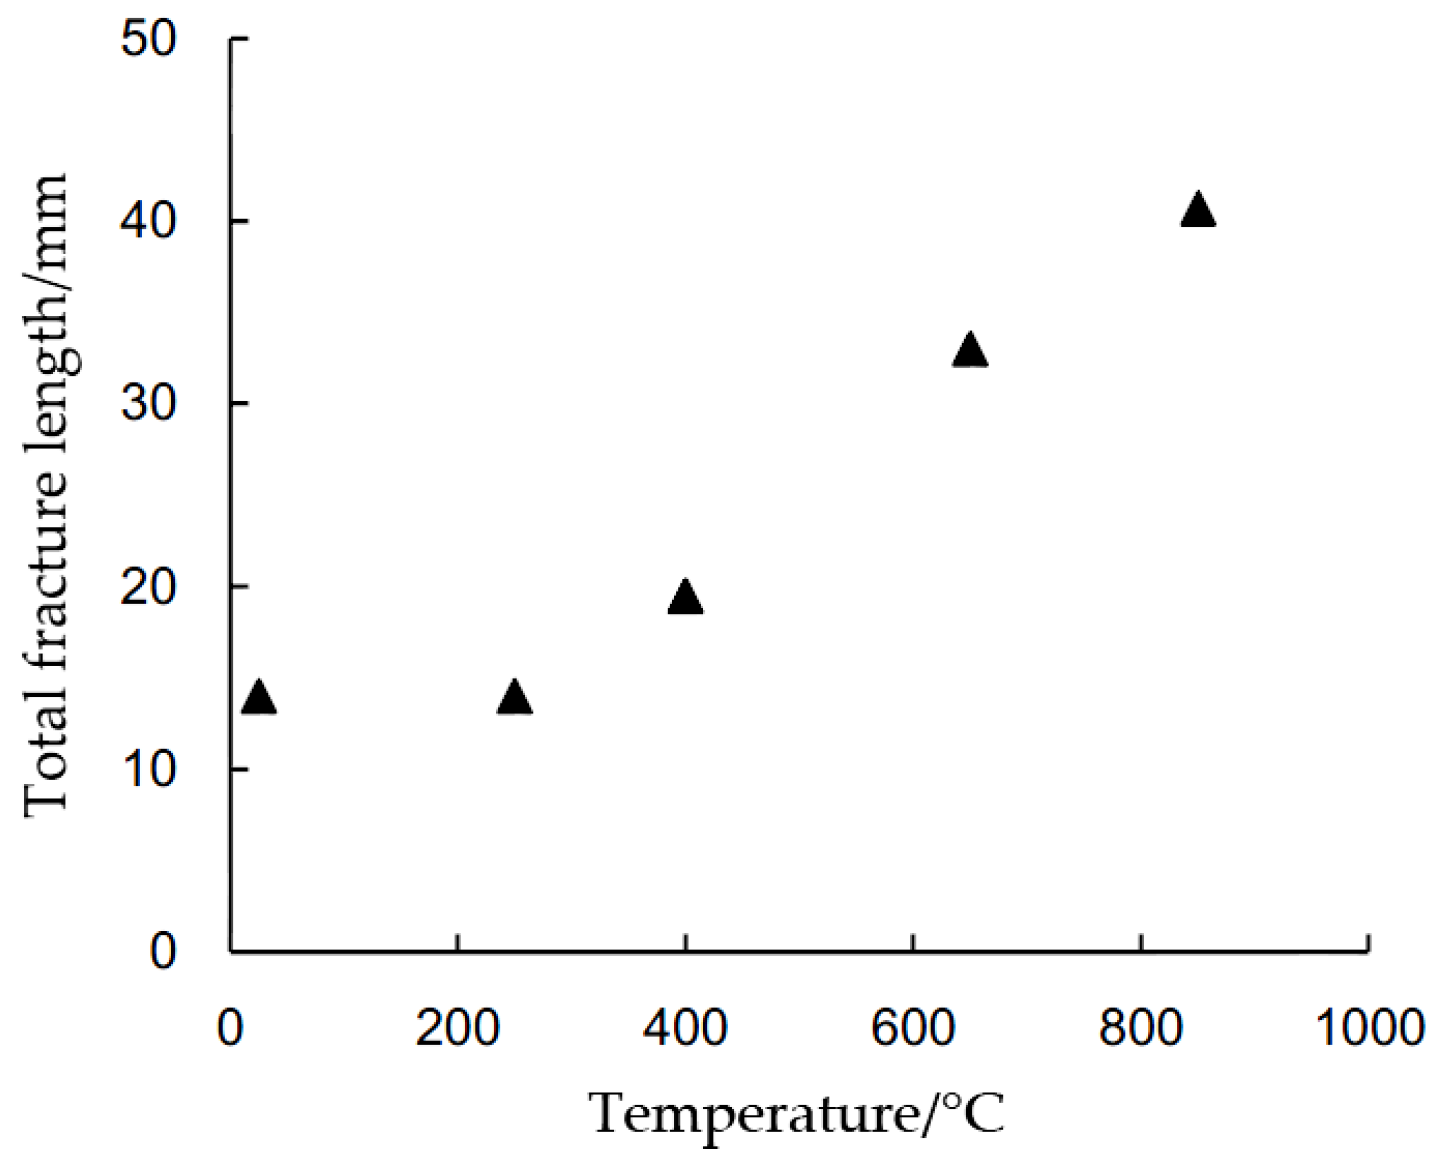
Figure 15 illustrates the variation in the total crack length of the specimens after loading with increasing temperature. In Figure 15, the length of the crack is almost constant when the temperature is below 400 °C; then, the crack length shows a linear increase when the temperature is over 400 °C. This trend is the same as that observed by Nasseri [28], as shown in Figure 16. In Figure 16, for both the room temperature and T = 250 °C specimens, the total length is 14 mm. The fracture propagation path is characterized by a lack of branching, consisting of a few short grain boundary cracks that are parallel to the main fracture. For a higher temperature, the total fracture length increases to 19.5, 33, and 40.7 mm at 450, 650, and 850 °C, respectively. This corresponds to increased fracture branching and the appearance of isolated wider micro-cracks within the damage zone. This phenomenon also appears in Figure 13, where more fracture branching and isolated wider micro-cracks are observed with increasing temperature when the temperature is over 400 °C.
7. Conclusions
Based on previous experimental results for Australian Strathbogie granite, a systematic numerical simulation by the particle flow code was performed to analyze the strength, deformation, and micro-mechanical behavior of granite specimens at different elevated temperatures under uniaxial compression. Based on the simulation results, the following conclusions can be drawn:
- (1)
- The macro-mechanical behavior of granite variations with temperature can be simulated by the cluster model in particle flow code, and the results obtained by the numerical simulation are similar to those obtained by experimentation. The axial stress-strain curve, the peak strength, and ultimate failure mode are proposed to discriminate the rightness and reasonability of the numerical simulated method.
- (2)
- Because the tensile force always concentrates around the boundaries of crystals, cracks easily occur at intergranular contacts, and at b-b and b-k boundaries. Less intragranular cracking is observed.
- (3)
- The intergranular and intraganular cracking of specimens are almost zero with increasing temperature at a low temperature; then they rapidly and linearly increase. However, the inflection point of intergranular micro-cracking is at a lower temperature than that of the intragranular crack. Hence, intergranular cracking is more easily induced by higher temperatures than intragranular cracking.
- (4)
- At elevated temperatures, the cumulative micro-crack count curves propagate in a stable way in the active period, and they do not have an unstable crack propagation stage. The evolution of micro-cracking and parallel bond forces in the specimens at elevated temperature with axial strain have different characteristics than those at lower temperature.
- (5)
- More branch fractures and isolated wider micro-cracks are generated with increasing temperature when the temperature is over 400 °C. Therefore, the number of cracks is almost constant when the temperature is below 400 °C, and the number of cracks has a linear increase when the temperature is over 400 °C. This trend is the same as that observed by experimentation.
This paper reports a simulation of the cluster model for Strathbogie granite under elevated temperature and uniaxial compression. However, the plastic deformation and the thermal transition of quartz at 573 °C are not taken into account, and will be investigated in the future.
Acknowledgments
This research was supported by the Fundamental Research Funds for the Central Universities (2014XT03) and the Natural Science Foundation of Jiangsu Province for Distinguished Young Scholars (BK20150005). We would also like to acknowledge the editor and the anonymous reviewers for their valuable comments, which have greatly improved this paper.
Author Contributions
Pathegama Gamage Ranjith conceived and designed the numerical simulations; Wen-Ling Tian performed the simulations; Sheng-Qi Yang analyzed the data; Sheng-Qi Yang wrote the paper; Pathegama Gamage Ranjith revised the English of this paper.
Conflicts of Interest
The authors declare no conflict of interest.
References
- Ghassemi, A. A Review of Some Rock Mechanics Issues in Geothermal Reservoir Development. Geotech. Geol. Eng. 2012, 30, 647–664. [Google Scholar] [CrossRef]
- Rutqvist, J. The geomechanics of CO2, storage in deep sedimentary formations. Geotech. Geol. Eng. 2012, 30, 525–551. [Google Scholar] [CrossRef]
- Li, L.C.; Tang, C.A.; Wang, S.Y.; Yu, J. A coupled thermo-hydrologic-mechanical damage model and associated application in a stability analysis on a rock pillar. Tunn. Undergr. Space Technol. 2013, 34, 38–53. [Google Scholar] [CrossRef]
- Ranjith, P.G.; Viete, D.R.; Chen, B.J.; Perera, M.S.A. Transformation plasticity and the effect of temperature on the mechanical behaviour of hawkesbury sandstone at atmospheric pressure. Eng. Geol. 2012, 151, 120–127. [Google Scholar]
- Kumari, W.G.P.; Ranjith, P.G.; Perera, M.S.A.; Shao, S.; Chen, B.K.; Lashin, A. Mechanical behaviour of Australian Strathbogie granite under in-situ stress and temperature conditions: An application to geothermal energy extraction. Geothermics 2017, 65, 44–59. [Google Scholar] [CrossRef]
- David, C.; Menéndez, B.; Darot, M. Influence of stress-induced and thermal cracking on physical properties and microstructure of la peyratte granite. Int. J. Rock Mech. Min. Sci. 1999, 36, 433–448. [Google Scholar] [CrossRef]
- Xu, X.L.; Gao, F.; Shen, X.M.; Xie, H.P. Mechanical characteristics and microcosmic mechanisms of granite under temperature loads. J. China Univ. Min. Technol. 2008, 18, 413–417. [Google Scholar] [CrossRef]
- Xu, X.L.; Kang, Z.X.; Ming, J.; Ge, W.X.; Jing, C. Research of microcosmic mechanism of brittle-plastic transition for granite under high temperature. Procedia Earth Planet. Sci. 2009, 1, 432–437. [Google Scholar]
- Yu, Q.L.; Ranjith, P.G.; Liu, H.Y.; Yang, T.H.; Tang, S.B.; Tang, C.A.; Yang, S.Q. A mesostructure-based damage model for thermal cracking analysis and application in granite at elevated temperatures. Rock Mech. Rock Eng. 2015, 48, 2263–2282. [Google Scholar] [CrossRef]
- Homand-Etienne, F.; Houpert, R. Thermally induced microcracking in granites: Characterization and analysis. Int. J. Rock Mech. Min. Sci. Geomech. Abstr. 1989, 26, 125–134. [Google Scholar] [CrossRef]
- Ferrero, A.M.; Marini, P. Experimental studies on the mechanical behaviour of two thermal cracked marbles. Rock Mech. Rock Eng. 2001, 34, 57–66. [Google Scholar] [CrossRef]
- Jansen, D.P.; Carlson, S.R.; Young, R.P.; Hutchins, D.A. Ultrasonic imaging and acoustic emission monitoring of thermally induced microcracks in Lac du Bonnet granite. J. Geophys. Res. 1993, 982, 22231–22243. [Google Scholar] [CrossRef]
- Menéndez, B.; David, C.; Darot, M. A study of the crack network in thermally and mechanically cracked granite samples using confocal scanning laser microscopy. Phys. Chem. Earth Part A Solid Earth Geod. 1999, 24, 627–632. [Google Scholar] [CrossRef]
- Chaki, S.; Takarli, M.; Agbodjan, W.P. Influence of thermal damage on physical properties of a granite rock: Porosity, permeability and ultrasonic wave evolutions. Constr. Build. Mater. 2008, 22, 1456–1461. [Google Scholar] [CrossRef]
- Davidge, R.W. Cracking at grain boundaries in polycrystalline brittle materials. Acta Metall. 1981, 29, 1695–1702. [Google Scholar] [CrossRef]
- Zhao, Z. Thermal influence on mechanical properties of granite: A microcracking perspective. Rock Mech. Rock Eng. 2015, 49, 747–762. [Google Scholar] [CrossRef]
- Potyondy, D.O.; Cundall, P.A. A bonded-particle model for rock. Int. J. Rock Mech. Min. Sci. 2004, 41, 1329–1364. [Google Scholar] [CrossRef]
- Cho, N.; Martin, C.D.; Sego, D.C. A clumped particle model for rock. Int. J. Rock Mech. Min. Sci. 2007, 44, 997–1010. [Google Scholar] [CrossRef]
- Zhang, X.P.; Wong, L.N.Y. Crack initiation, propagation and coalescence in rock-like material containing two fissures: A numerical study based on bonded-particle model approach. Rock Mech. Rock Eng. 2013, 46, 1001–1021. [Google Scholar] [CrossRef]
- Potyondy, D.O. The bonded-particle model as a tool for rock mechanics research and application: Current trends and future directions. Geosyst. Eng. 2015, 18, 1–28. [Google Scholar] [CrossRef]
- Itasca Consulting Group, Inc. PFC2D, v. 3.10, Itasca Consulting Group, Inc.: Minneapolis, MN, USA, 2004.
- Boley, B.A.; Wiener, J.H. Theory of Thermal Stresses; John Wiley& Sons: New York, NY, USA, 1960. [Google Scholar]
- Timoshenko, S.P. Theory of Elasticity, 3rd ed.; McGraw-HillBook Company: New York, NY, USA, 1987. [Google Scholar]
- Shao, S.S.; Wasantha, P.L.P.; Ranjith, P.G.; Chen, B.K. Effect of cooling rate on the mechanical behavior of heated Strathbogie granite with different grain sizes. Int. J. Rock Mech. Min. Sci. 2014, 70, 381–387. [Google Scholar] [CrossRef]
- Shao, S.; Ranjith, P.G.; Wasantha, P.L.P.; Chen, B.K. Experimental and numerical studies on the mechanical behaviour of Australian Strathbogie granite at high temperatures: An application to geothermal energy. Geothermics 2015, 54, 96–108. [Google Scholar] [CrossRef]
- Phillips Neil, G.; Wall, V.J.; Clemens, J.D. Petrologoyf Thes Thathbogbiea Tholitha: Cordierite-BearginrgaNite. Can. Miner. 1981, 19, 47–63. [Google Scholar]
- Fei, Y. Thermal expansion. In Mineral Physics and Crystallography: A Handbook of Physical Constants; American Geophysical Union: Washington, DC, USA, 1995; pp. 29–44. [Google Scholar]
- Nasseri, M.H.B.; Schubnel, A.; Young, R.P. Coupled evolutions of fracture toughness and elastic wave velocities at high crack density in thermally treated Westerly Granite. Int. J. Rock Mech. Min. Sci. 2007, 44, 601–616. [Google Scholar] [CrossRef]
- Ranjith, P.G.; Fourar, M.; Pong, S.F.; Chian, W.; Haque, A. Characterisation of fractured rocks under uniaxial loading states. Int. J. Rock Mech. Min. Sci. 2004, 41, 43–48. [Google Scholar] [CrossRef]
- Yang, S.Q.; Ranjith, P.G.; Jing, H.W.; Tian, W.L.; Ju, Y. An experimental investigation on thermal damage and failure mechanical behavior of granite after exposure to different high temperature treatments. Geothermics 2017, 65, 180–197. [Google Scholar] [CrossRef]
Figure 1.
Comparison of numerical results and theoretical results for the annular sample: (a) temperature field in the specimen; (b) parallel bond forces field in the specimen; (c) temperature distributed along the radius; (d) radial stress; and (e) tangential stress.
Figure 1.
Comparison of numerical results and theoretical results for the annular sample: (a) temperature field in the specimen; (b) parallel bond forces field in the specimen; (c) temperature distributed along the radius; (d) radial stress; and (e) tangential stress.

Figure 2.
Numerical specimen of Strathbogie granite built in particle flow code in two dimensions (PFC2D).
Figure 2.
Numerical specimen of Strathbogie granite built in particle flow code in two dimensions (PFC2D).

Figure 3.
Comparison of (a) numerical and (b) experimental failure modes for the Strathbogie granite at room temperature under uniaxial compression [25].
Figure 3.
Comparison of (a) numerical and (b) experimental failure modes for the Strathbogie granite at room temperature under uniaxial compression [25].

Figure 4.
Distribution of micro-cracks and parallel bond forces at different temperatures: (a) 100 °C; (b) 200 °C; (c) 400 °C; (d) 600 °C; (e) 800 °C; (f) 900 °C; (g) 1000 °C; and (h) 1100 °C.
Figure 4.
Distribution of micro-cracks and parallel bond forces at different temperatures: (a) 100 °C; (b) 200 °C; (c) 400 °C; (d) 600 °C; (e) 800 °C; (f) 900 °C; (g) 1000 °C; and (h) 1100 °C.

Figure 5.
The ratio of the crack number to the corresponding contact number of granite specimens at different temperatures.
Figure 5.
The ratio of the crack number to the corresponding contact number of granite specimens at different temperatures.

Figure 6.
Micro-crack number varies with temperature: (a) intergranular; and (b) intragranular.

Figure 7.
Evolution of granite boundary micro-cracks and intragranular micro-crack densities as a function of the temperature treatment [28]: (a) intergranular; and (b) intragranular.
Figure 7.
Evolution of granite boundary micro-cracks and intragranular micro-crack densities as a function of the temperature treatment [28]: (a) intergranular; and (b) intragranular.

Figure 8.
Cumulative micro-crack counts vs. axial stress for granite specimens: (a) T = 100 °C; and (b) T = 1000 °C.
Figure 8.
Cumulative micro-crack counts vs. axial stress for granite specimens: (a) T = 100 °C; and (b) T = 1000 °C.

Figure 9.
Crack evolution process and parallel bond force field of the granite specimen at 100 °C: (a) ε1 = 1.25 × 10⁻², σ1 = 112.07 MPa; (b) ε1 = 2.18 × 10⁻², σ1 = 192.81 MPa; (c) ε1 = 2.36 × 10⁻², σ1 = 205.63 MPa; and (d) ε1 = 2.56 × 10⁻², σ1 = 1.75 MPa.
Figure 9.
Crack evolution process and parallel bond force field of the granite specimen at 100 °C: (a) ε1 = 1.25 × 10⁻², σ1 = 112.07 MPa; (b) ε1 = 2.18 × 10⁻², σ1 = 192.81 MPa; (c) ε1 = 2.36 × 10⁻², σ1 = 205.63 MPa; and (d) ε1 = 2.56 × 10⁻², σ1 = 1.75 MPa.

Figure 10.
Crack evolution process and parallel bond force field of the granite specimen at 1000 °C (a) ε1 = 3.39 × 10⁻³, σ1 = 8.44 MPa; (b) ε1 = 1.88 × 10⁻², σ1 = 71.87 MPa; (c) ε1 = 2.10 × 10⁻², σ1 = 75.31 MPa; and (d) ε1 = 2.58 × 10⁻², σ1 = 11.93 MPa.
Figure 10.
Crack evolution process and parallel bond force field of the granite specimen at 1000 °C (a) ε1 = 3.39 × 10⁻³, σ1 = 8.44 MPa; (b) ε1 = 1.88 × 10⁻², σ1 = 71.87 MPa; (c) ε1 = 2.10 × 10⁻², σ1 = 75.31 MPa; and (d) ε1 = 2.58 × 10⁻², σ1 = 11.93 MPa.

Figure 11.
Comparison of the experimental and numerical stress-strain curves of Strathbogie granite at different temperatures under uniaxial compression: (a) experimental results [25]; and (b) numerical results.
Figure 11.
Comparison of the experimental and numerical stress-strain curves of Strathbogie granite at different temperatures under uniaxial compression: (a) experimental results [25]; and (b) numerical results.

Figure 12.
Comparison of the experimental and numerical uniaxial compressive strength of Strathbogie granite at different temperatures [25].
Figure 12.
Comparison of the experimental and numerical uniaxial compressive strength of Strathbogie granite at different temperatures [25].

Figure 13.
Numerical simulated results of ultimate failure mode of the numerical specimens after the heating treatment: (a) T = 100 °C; (b) T = 200 °C; (c) T = 400 °C; (d) T = 600 °C; (e) T = 800 °C; (f) T = 900 °C; (g) T = 1000 °C; and (h) T = 1100 °C.
Figure 13.
Numerical simulated results of ultimate failure mode of the numerical specimens after the heating treatment: (a) T = 100 °C; (b) T = 200 °C; (c) T = 400 °C; (d) T = 600 °C; (e) T = 800 °C; (f) T = 900 °C; (g) T = 1000 °C; and (h) T = 1100 °C.

Figure 14.
Experimental results of ultimate failure mode of the granite specimens after the heating treatment [25]: (a) T = 100 °C; (b) T = 200 °C; (c) T = 400 °C; (d) T = 600 °C; (e) T = 800 °C; (f) T = 900 °C; (g) T = 1000 °C; and (h) T = 1100 °C.
Figure 14.
Experimental results of ultimate failure mode of the granite specimens after the heating treatment [25]: (a) T = 100 °C; (b) T = 200 °C; (c) T = 400 °C; (d) T = 600 °C; (e) T = 800 °C; (f) T = 900 °C; (g) T = 1000 °C; and (h) T = 1100 °C.

Figure 15.
Total crack length of the specimens after loading varies with temperature.

Figure 16.
Total length of the propagation fracture varies with temperature [28].
Figure 16.
Total length of the propagation fracture varies with temperature [28].


Table 1.
Contents and thermal expansion coefficients of minerals in the Strathbogie granite specimen [5].
Table 1.
Contents and thermal expansion coefficients of minerals in the Strathbogie granite specimen [5].
| Type of Mineral | Content in Experimental Specimen, % | Content in Numerical Specimen, % | Thermal Expansion Coefficients, 10−6 K−1 |
|---|---|---|---|
| Quartz | 50 | 56 | 24.3 |
| Plagioclase | 16 | 16 | 14.1 |
| Biotite | 15 | 15 | 3.0 |
| K-feldspar | 13 | 13 | 8.7 |
Table 2.
Micro-parameters of the cluster model in PFC2D.
| Micro-Parameters | Values | Micro-Parameters | Values |
|---|---|---|---|
| Minimum radius, Rl (mm) | 0.1 | Effective modulus of the parallel bond, (GPa) | 20 |
| Maximum radius, Ru (mm) | 0.2 | Ratio of normal to shear stiffness of the parallel bond, | 2.5 |
| Effective modulus of the particle, Ec (GPa) | 20 | Parallel bond normal strength of intracluster, σn (MPa) | 220 ± 30 |
| Ratio of normal to shear stiffness of the particle, kn/ks | 2.5 | Parallel bond shear strength of intracluster, σs (MPa) | 320 ± 60 |
| Particle friction coefficient, μ | 0.3 | Parallel bond normal strength of intercluater σbn/MPa | 110 ± 20 |
| Parallel-bond radius multiplier, λ | 1.0 | Parallel bond shear strength of intercluater σbs /MPa | 160 ± 30 |
© 2017 by the authors. Licensee MDPI, Basel, Switzerland. This article is an open access article distributed under the terms and conditions of the Creative Commons Attribution (CC BY) license (http://creativecommons.org/licenses/by/4.0/).
Share and Cite
MDPI and ACS Style
Yang, S.-Q.; Tian, W.-L.; Ranjith, P.G. Failure Mechanical Behavior of Australian Strathbogie Granite at High Temperatures: Insights from Particle Flow Modeling. Energies 2017, 10, 756. https://doi.org/10.3390/en10060756
AMA Style
Yang S-Q, Tian W-L, Ranjith PG. Failure Mechanical Behavior of Australian Strathbogie Granite at High Temperatures: Insights from Particle Flow Modeling. Energies. 2017; 10(6):756. https://doi.org/10.3390/en10060756
Chicago/Turabian StyleYang, Sheng-Qi, Wen-Ling Tian, and Pathegama Gamage Ranjith. 2017. "Failure Mechanical Behavior of Australian Strathbogie Granite at High Temperatures: Insights from Particle Flow Modeling" Energies 10, no. 6: 756. https://doi.org/10.3390/en10060756
Note that from the first issue of 2016, this journal uses article numbers instead of page numbers. See further details here.