
A Behavioral Economics Approach to Residential Electricity Consumption


1
Department of Electricity and Materials, Lactec Institutes, Curitiba 81530-180, Brazil
2
Department of Electrical Engineering, Federal University of Parana, Curitiba 82590-300, Brazil
3
Department of Economics, Federal University of Parana, Curitiba 80210-170, Brazil
4
Gnarus Institute, Itajuba 37500-052, Brazil
*
Author to whom correspondence should be addressed.
Energies 2017, 10(6), 768; https://doi.org/10.3390/en10060768
Submission received: 20 April 2017
/
Revised: 27 May 2017
/
Accepted: 29 May 2017
/
Published: 1 June 2017
(This article belongs to the Special Issue Innovative Methods for Smart Grids Planning and Management)
Abstract
:Consumer behavior is complex and is difficult to represent in traditional economic theories of decision-making. This paper focuses on the development of an agent-based approach to analyze people’s behavior in consuming electricity using a behavioral economics framework, where the consumer is the main agent of power systems. This approach may bring useful insights for distribution companies and regulatory agencies, helping to shift thinking to a more user-centric approach. The emergent properties of electricity consumption are modeled by the means of consumer’s heuristics, taking into account the electricity price, consumer’s satisfaction level, willingness to invest in new technologies, social interactions, and marketing strategies by the power utility. Analysis on the emergent behavior of this approach through simulation studies showed that it is indeed valuable, as does not require in-depth data of all details on human behavior. However, it contributes to the understanding of relations among various objects involved in electricity consumption.
1. Introduction
Power system companies supply electricity to a region’s homes and industries. Recently, the electricity industry experienced an urgent need for modernization and increase in reliability. This was due to many reasons, such as environmental issues, the rising price of generating electricity and other fuels, outdated infrastructures, and the increasing connection of renewable intermittent energy source. This modernization reveals several technical challenges [1,2,3] that are being greatly addressed by the academic community and corporations—nevertheless, the main agent of the power system, the consumer, along with its behavior patterns, is often not taken into account.
Behavioral economics has explored some aspects about consumer behavior, which diverge from the traditional economic assumption in which the agents weigh up the costs and benefits of all alternatives, aiming to maximize their benefits, before making a decision. Some key elements that have been introduced by behavioral economics originate from concepts sustained by Herbert Simon [4]. He stated that due to the psychological limitations of organisms (particularly with respect to computational and predictive abilities), actual human rationality-striving can at best be an extremely crude and simplified approximation to the global rationality that is implied.
In the context of firms, for example, Simon [5] has listed several arguments that support this hypothesis—the ambiguity of whether short-run or long-run profit (benefit) is to be maximized, the presence of other “psychic incomes” that should be considered in addition to monetary rewards, and the fact that the entrepreneur may not care to maximize, among others. If decision-making is somehow related to rationality, then it should involve something simpler than the maximization of consumer utility and company profits [6,7].
There are three basic hypotheses, interrelated but distinct, in understanding the boundaries of rationality by Simon (especially applied for consumer’s behavior analysis) [8]: (i) the computational capacity of human beings is restricted; (ii) the information in which people rely on to make decisions is typically incomplete; and (iii) the decision-making on how to adapt to perceived situations can be conscious or unconscious, as people use simple procedures, called rules of thumb or heuristics, to guide their actions.
Other leading exponents in human decision-making are Kahneman (Nobel Prize in Economic Sciences, 2002) and Tversky, whose works have analyzed anomalous behaviors using heuristics [9]. Such an approach, called heuristics and biases, has been used in the analysis of many empirical events in business, law, economics, and medicine. Its assumption relies on people’s limited number of heuristic principles that reduce the complex task of assessing probabilities and predict values to simpler judgmental operations. Contributions from the field of psychology have brought important insights for the establishment of so-called behavioral economics [5,6,10].
This approach on the behavior of economic agents emphasizes its complex nature. A complex system is a system that can be analyzed through many components having relatively many relations among them, so that the behavior of each component depends on the behavior of others [11]. In other words, a system is typically defined as complex if it embodies the following two properties [12]: (i) it is composed of interacting units; and (ii) it has emergent properties, that is, properties arising from the interactions of the units that are not properties of the individual units themselves.
The smart grid may be considered a complex system for a few reasons [13,14]: it has several elements that usually “play” by simple rules (policies); there is a strong nonlinear interaction among “players” in both physical and social aspects; the system presents emergent properties, both intended (e.g., system stability) and unintended (e.g., large-scale blackouts); and, because data needed for decision-making in a smart grid has grown exponentially in the last few years, there is a move for decentralization and hierarchical control strategies. As the distributed integration of intermittent sources of energy and plug-in electric vehicles increases, the complexity of modelling, control and optimization of the smart grid will bring new challenges [15,16,17,18,19].
This paper focuses on the development of a behavioral economics approach for residential electricity consumption using an agent-based computer simulation, in which the consumer is the main agent of power systems. The emergent properties of electricity consumption are modeled by means of consumer’s heuristics. Several assumptions were made to simplify the development of the simulation model, and to allow for the observation of the emergence of complex behavioral phenomena. This approach was modelled considering different categories of consumers and a power utility as agents. The main attributes from the consumer-side are their electricity consumption, satisfaction level with the power utility, willingness to invest in energy efficient technologies, price elasticity, and their interaction with the power utility. The power utility basically defines the electricity price and their marketing/customer programs. All these attributes will be detailed on Section 4.
2. Power Industry Regulation and Demand-Side Management (DSM)
The transmission and distribution of electrical energy is a natural monopoly due to the infrastructure needed, which makes competition between two agents in the same concession area uneconomical. The predominant regulation model is either price cap or incentive regulation. Nevertheless, electricity generation operates under a competitive, although regulated, market. In many countries, a vertical monopoly on generation, transmission, and distribution companies took place until mid-1990s. After that, regulators forced all companies to unbundle according to each operational area, being those sometimes controlled by a holding under a regulated market. As a result, the consumer pays independently for the cost of power generation, transmission, and distribution.
In the majority of countries, consumers supplied with low voltage electricity only have the option to buy energy from their local distribution company. Industries supplied in high voltage may purchase electricity from any generation company, although they still have to pay the transmission and distribution fees for the local companies.
To achieve a stable power grid, demand and supply must be continuously met. However, electricity demand is very difficult to forecast, especially for longer periods, due to its unpredictable economic variations, as well as the increasing intermittent renewable energy sources. In some cases, it may be convenient to use co-trigenerative systems [20].
Forecasts performed by power utilities, in both the long- and short-term, must be accurate to allow for the arrangement of appropriate contracts with the generators (either in auctions, or in the regulated “free” market). Utilities should be aware of customer behavior, their demand elasticity, investment plans, and satisfaction level. Notwithstanding, as most companies only apply classical economic models and specialist’s knowledge, the aforementioned perspectives are often not taken into account.
Experience has shown that the hierarchical, centrally-controlled grid is ill-suited to recent needs, and regulation faces the challenge of choosing the appropriate trade-off between capping peak prices and maintaining efficient production. To those and other challenges, a new concept was created: the smart grid. Its application results in reduced losses and increased performance, ultimately contributing to a more efficient use of electricity. According to [21], when fully developed, the smart grid will allow for the closer involvement of customers. Further, it will have improvements in the generation, transmission, and distribution, by employing tools that will allow the minimization of system vulnerability, as well as an increase in security, reliability, and power quality.
Because the smart grid may be considered as a complex system (or even a system of systems [22,23,24]), design and implementation should consider social and cultural issues, such as the elasticity of energy demand, customer satisfaction, and communities’ social interaction, in order to be successful. Indeed, smart grids need to be studied and understood as a complex techno-socioeconomic system with multiple layers, such as physical, cyber, social, policy, and decision-making, interacting with unstable external conditions (economic cycles, technological innovation, and prevailing and climatic conditions) [25].
Until the 1970s, electricity demand was considered predictable. In the mid-1980s, it became increasingly unpredictable and low-cost supply sources grew scarce. These contributed to the challenge of integrating traditional operating methods and planning with the concept of actively influencing the energy demand, and therefore making the decision-making involved more complex. It gave the thrust needed to establish the concept of “Demand-Side Management” (DSM), proposed by [26], as the planning and implementation of activities influenced consumer’s use of electricity to produce desired changes in the load curve of an electrical system [27]. Its foundation is the mutual benefit between the energy provider and the customers. DSM is considered as an umbrella term for a cluster of concepts for load management (e.g., variable rates, the rational use of energy, fuel substitution, emerging energy applications, energy efficiency, and demand response).
Demand response, in turn, refers to a set of strategies that can be used in competitive electricity markets to increase the participation of the demand-side (end-use customers) in setting prices and clearing the market [28]. It exposes the customer in some ways to a dynamic tariff scheme that induces various reactions in system behavior. It is important to make the distinction between long- and short-term effects of tariffs. In the long-run, the change in the average price will affect the average level of consumption. For instance, large differences in the tariff may encourage customers to, in the long-term, purchase storage systems (thermal or electric energy) or more efficient equipment to decrease consumption, invest in distributed renewable generation, or shift the consumption to periods of the year with lower costs. In the short-term, customers may reduce or offset their demands in response to tariff signals [29,30,31,32].
According to [33], many voices argue that as electricity is a necessity with little price elasticity, its demand cannot be reduced even if the prices increase during peak periods. The authors argue that a 10% increase in the price of electricity may only bring about a 1% decline in demand—yet, this is a statistically significant result. If the marginal price in the peak period increases 5 or 10 times more the off-peak price, it would be possible to reduce electricity demand by a significant amount. Based on data from more than 100 field tests carried out in the United States over a period of 10 years, it has been found that a 5-fold price increase reduces the peak demand by 10%, and a 10-fold price increase reduces it by 20%.
3. Energy Consumption and Behavioral Economics
The application of behavioral economics concepts to the energy sector is in the early stages, with some relevant works being published in the last few years. For instance, [34] analyzed a sizeable discrepancy between peoples’ self-reported knowledge, values, attitudes, and intentions, with their observable behavior. The authors discussed cognitive biases and motivational factors that may explain why traditional economic theories fail to explain some energy-related behaviors.
The question of how behavioral economics may be applied to energy and climate policy, investment in energy efficiency, and provision of public goods, was assessed in a few works. For example, in [35], an augmented model with approaches derived from behavioral science was used to better encourage individuals to purchase, install, and properly use energy-efficient technologies. This aimed at complying with legal mandates and least-cost service obligations, in which utilities must help their customers save energy. Particular attention was devoted to exploring techniques that incorporate psychology, design, and behavioral economics insights into the utility of energy-efficient programs, that could use “e-sensing” technologies [36].
On the same topic, a welfare analysis of taxes and energy efficiency standards based on an alternative time-consistent behavioral model was presented [37]. The authors concluded that temptation or self-control might be a contributing factors in explaining the energy efficiency gap, and that standards might be used as a commitment device to address inefficiencies in consumer choice that stem from temptation.
Nevertheless, in [38], the authors argued that behavioral economics seems unlikely to provide the “magic bullet” to reduce energy consumption—however, it offers new suggestions as to where to start looking for potentially sustainable changes in energy consumption. The study suggested that the most useful role of climate policy is in addressing issues of public perceptions of the affordability of climate policy, and to facilitate the creation of a more responsive energy demand, better capable of responding to weather-induced changes in renewable electricity supply.
In a broader context, another previous work [39] proposed a long-term electrical distribution demand evolution model based on urban and regional growth. In this dynamical model, concepts of land use, urban poles, and urban economy were used to create relations among different types of low- and medium-voltage consumers (residential, commercial, and industrial). The demand evolution takes care of these relations and other factors, such as political desires of development, urban plans of development, the regional situation of the economy, and geographic aspects, among others. The existing loads act as attractors (or as repulsive agents) of new loads.
An agent-based social simulation model was developed in [40] to explore how policies may interact with consumer behavior on the diffusion of electric vehicles over a long time period. Data from a questionnaire with Dutch car drivers were used to parameterize the consumer needs and decision strategies modelled. The model was based on four types of needs: financial, functional, social and environmental. This differs from our proposed model that focuses on simple heuristics under a bounded rationality scenario.
Also in the field of electric vehicles, [41] presented an agent-based simulation focused on their influence on the low voltage network over 10 years. Social influences (i.e., a neighbor of an electric vehicle owner is more likely to also purchase an electric vehicle) were considered and results indicated that it can increase peak demand at a local level, creating a higher demand than current UK governmental studies suggest.
The use of agent-based modeling to model consumer behavior on energy consumption incorporating the actions of individual homeowners in a long-term domestic stock model was demonstrated by [42]. The results showed that the current subsidy in the British energy market seems to offer too much support to some technologies for energy efficiency, which in turn leads to the suppression of other technologies that have a greater energy saving potential. The model was aimed at addressing the technology purchase decision-making process of individual householders considering a highly-disaggregated stock model.
Consumer’s behavior analysis on electricity consumption may be very challenging as, in contrast to other consumer goods, the customer does not “see” the energy bought, but only perceives the work it performed. Nevertheless, it is an essential product to provide comfort, connectivity, information, and security in modern societies. Therefore, it is very important to discuss the single most important agent of the power sector environment, the consumer, trying to achieve a better understanding of its behavior and interactions.
4. Model Specification
To analyze consumer behavior in energy consumption, this paper uses agent-based computer simulation. As consumer behavior is complex, this technique shows itself as a suitable instrument because, given initial parameters set, different situations can be modeled, allowing for the analysis of a particular behavior and the emergence of a global behavior [43,44,45].
To incorporate insights of behavioral economics into the model, several assumptions were necessary, significantly simplifying the overall environment. One may disagree with these assumptions and simplifications made—nevertheless, it is important to point out that the main objective of the work is not to precisely model consumer behavior in energy consumption, but to understand how the use of simple heuristics may help in the analysis of systems with complex behavior such as electricity consumption.
The developed heuristics consider the varying electricity price, willingness to invest in new technologies, social interactions, marketing strategies by the power utility, and consumer’s satisfaction level (or satisficing, in Simon’s sense). Satisficing is a term that combines satisfaction and sufficiency in a cognitive heuristic decision-making strategy. The main idea of the concept of satisficing is to search for possible solutions until an acceptable threshold is met [5].
The key factor in this model is the analysis of the social interactions between consumers and their relationship with the power utility, as well as its implications on the overall electricity consumption. Electricity consumption is hard to predict from the individual behaviors modelled for each consumer category, and can only be assessed by the analysis of the global patterns that emerge from the simulation scenarios.
The ODD (overview, design concepts, and details) protocol [46] will be considered to present the model specification. It is a standard protocol for describing simulation models that describe autonomous individual organism or agents, aiming to make it more comprehensible and replicable.
4.1. Overview of the Proposed Model
The model’s purpose is to study residential electricity consumption using a behavioral economics framework, under the influence of four different interacting categories of consumers. Specifically, it aims to observe the emergent properties of the consumer’s heuristic in different simulation scenarios. The central idea of the model is that electrical loads should not be modelled only due to its electrical characteristics, but as well, should take into account the provision of comfort and services to people.
The model includes two entities: the consumers and the power utility. The consumers are characterized by their category, monthly consumption, satisfaction level, willingness to invest in energy efficient technologies, and price elasticity. The power utility is characterized by its electricity price (which varies according to random price flags), and their DSM program.
In each time step, consumers move randomly to one portion of the grid, where they interact with another consumer at the same place or with the power utility, which is fixed in a given portion of the grid. Based on these interactions, for the other mentioned variables, and their previous state, the model updates the consumption level of all consumers.
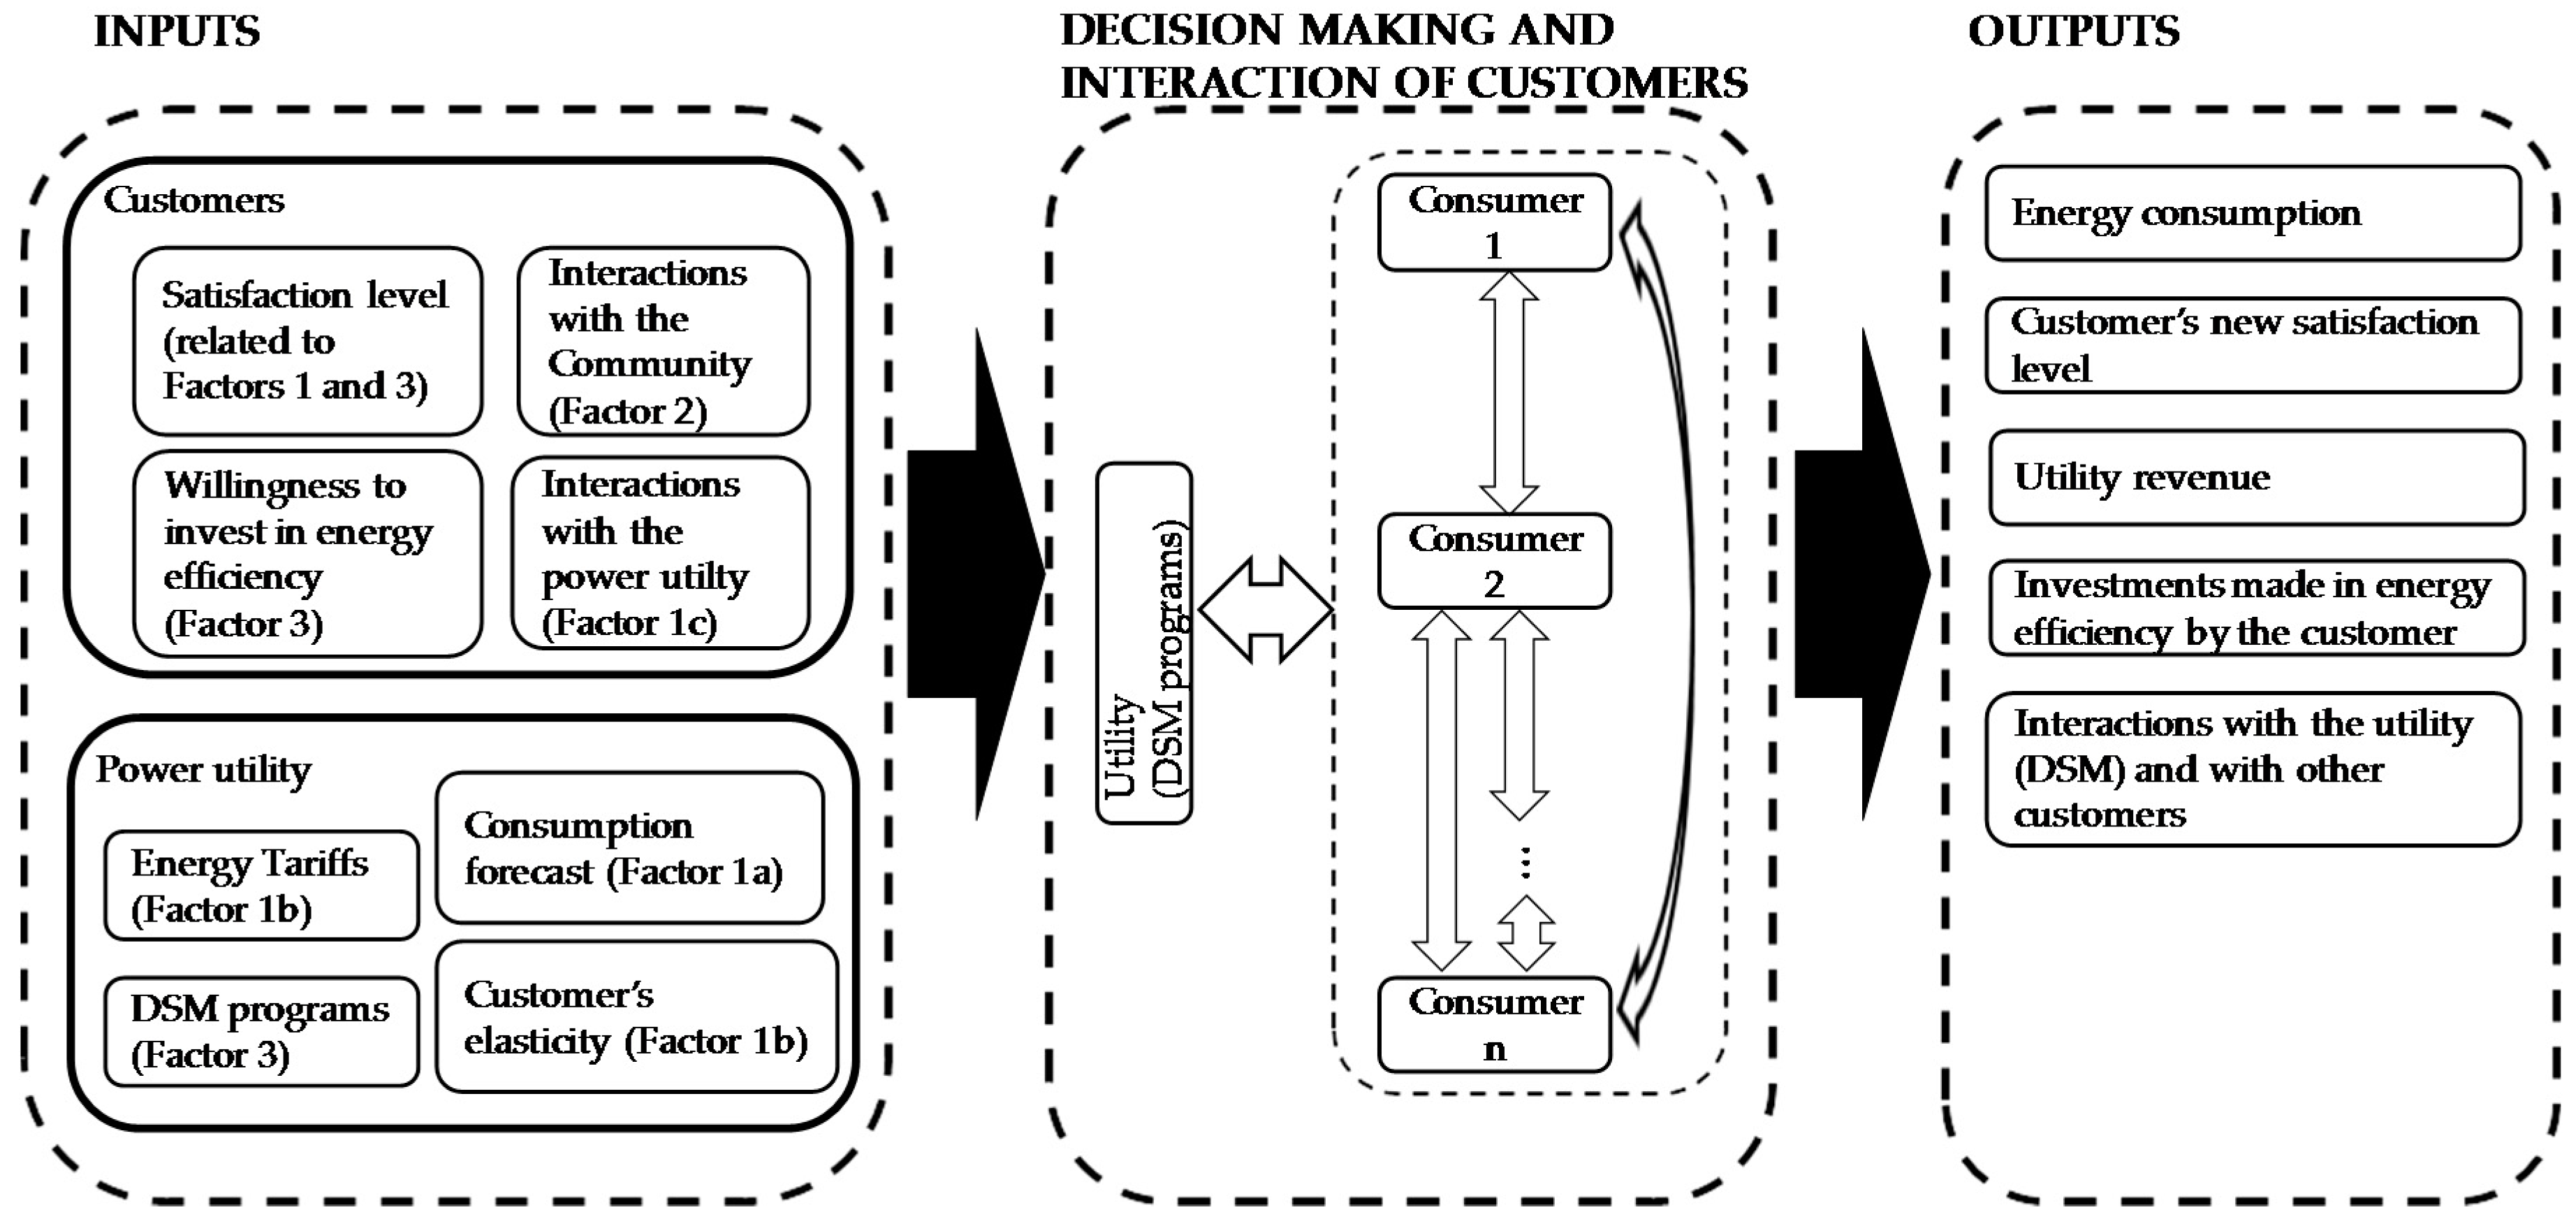
Figure 1 provides a graphical framework of the model’s operation. The central component of the model is the heuristic of the consumers, i.e., the decision-making process, which happens at the level of the individual agent. Four categories of agents were modeled, each one with individual heuristics.
These rules take action for every iteration of the simulation, and vary according to given inputs, which are related to factors that will be detailed in Section 4.3. These inputs may bet set by the utility (e.g., energy prices), by the agent’s intrinsic behavior, social interaction between agents, and interaction with the power utility, for example in a marketing/DSM program. Notice that for every iteration of the simulation, the inputs for an agent will depend on their previous iterations.
The most relevant output analysis data are the amount of interactions with the utility, investment made by customers on energy efficiency, the utility income, total consumption, and the overall satisfaction level.
4.2. Design Concepts
The main design concepts are:
- Emergence: The most important emergent effect we are interested in using behavioral economics concepts to model and simulate electricity consumption is the total consumption level after several interactions between the agents. The individual customer satisfaction levels and the amount of investments made in energy efficiency technologies also emerge from the interactions.
- Sensing: Consumers have access to the electricity price, how many times they invested in energy efficient technologies, and may have access to other customers’ consumption level while interacting with them.
- Interactions: Consumers interact with other consumers and with the power utility.
- Stochasticity: Stochasticity is used to simulate spatial variability, initial consumption level and satisfaction level of the consumers, initial investment level and which investment the customers choose to do, and the electricity price flag.
- Observation: For model testing, the spatial distribution and consumption level of the consumers were observed. For model analysis, only utility level data were recorded.
4.3. Details of the Proposed Model
This section presents the initialization, input, and sub-models involved in the proposed model. Basically, the electricity consumption that a given customer increases or decreases in a given iteration may be influenced by five factors, divided in three groups, and computed sequentially:
- Factor 1a: A fixed increase rate on electricity consumption, considered to mimic changes on consumer behavior due economic growth and the more frequent use of technologies;
- Factor 1b: Their elasticity to electricity price variations;
- Factor 1c: Interactions with the power utility through DSM programs;
- Factor 2: Their interactions due to social interactions;
- Factor 3: Investments made in energy efficient technologies.
How these factors vary is closely related to which category a given consumer belongs (the categories will be detailed in Section 4.3.1), and may also relate to their satisfaction level (detailed in Section 4.3.2). The factors will be detailed in Section 4.3.3, Section 4.3.4 and Section 4.3.5.
4.3.1. Categories of Consumers
Four categories of consumers were modeled, aiming at addressing different human behaviors in the electricity consumption. Table 1 summarizes the main characteristics of the modeled categories and its overall electricity consumption, which were inspired by some of the main characteristics and social/financial division of the Brazilian scenario [47].
Consumers in category 1 represent consumption classes A and B, which compose ca. 15.89% of the Brazilian population and have a higher income. Because electricity price does not affect a significant part of their income, it was assumed that they are inelastic to tariff changes. At the other end, consumers in category 2 have a low income (i.e., classes D and E, representing 41.38% of the Brazilian population). Because of this, when properly encouraged, they may significantly change their energy use pattern. Consumers in category 2 usually make changes due to social interaction, so as to reduce electricity expenses.
Category 3 represents consumption class C, a category of consumers that have a higher income than category 2, but lower than category 1, and represent 42.73% of the Brazilian population. We assumed that this category behaves with a more “satisficing” than optimizing approach for all criteria. Additionally to the income criteria, we considered another division, category 4, which comprises the “early adopters”. These are consumers that may or not have a high income, but their most distinguishing feature is the urge to invest in new technologies. This is represented in the model by investment in energy-efficient technologies such as retrofitting of air-conditioning systems and rooftop solar panels, but could also include intelligent control systems in the presence of radiative exchanges [48,49,50].
4.3.2. Customer Satisfaction
Customer satisfaction varies due to changes in electricity expenses. For consumers in category 4, satisfaction also depends on the amount invested in energy efficiency, as presented in Table 2.
Basically, customer satisfaction increases when their expenditure decreases and vice versa, except for customers in a category that may be insensitive to expenditure variations (category 1). Additionally, customers in category 4 can also increase their satisfaction via investing in energy efficiency. The satisfaction level outset is randomly between 50% and 100% for all consumer categories. Satisfaction level iterates considering the satisfaction parameter (SP), which is based on the description of Table 3, according to (1):
Whenever consumers in category 4 do not invest in a given iteration, their satisfaction with the power utility decreases by 0.1%. On the contrary, when they invest, their satisfaction increases by 0.1%.
4.3.3. Consumption Variations and Price Changes (Factor 1)
The fixed increase rate, factor 1a, is considered the same for all categories of consumers. For factor 1b, it is important to note that different energy pricing schemes, e.g., the use of time-of-use (TOU) tariff, are not considered in this model, although it may bring several benefits to the utility. Customer’s elasticity to price changes are considered only on standard one-rate energy prices.
Table 3 shows customer’s actions that are dependent on price changes according to their category. We considered that customers in category 1 are not very sensitive to price changes, since their expenses related to electricity consumption do not compromise a significant part of their monthly budget. Customers in category 2, on the other hand, have a higher elasticity level aiming to reduce expenses. Finally, customers in categories 3 and 4 vary their consumption, not only due to financial aspects, but also according to their satisfaction level.
The variation of electricity consumption for customers in categories 1 and 2 due to price changes is defined as:
where q is the energy consumption, p is the electricity price, k is a given iteration, CP is the consumption parameters that is valued according to customer’s category 1 or 2 on Table 3, and ε is the elasticity basis level.
Customers of types 3 and 4 vary their consumption according to:
where s is the customer satisfaction level at a given iteration and CSP is the consumption parameter that is valued according to customer’s category 3 or 4 on Table 3.
In the model, the power utility sets the energy price monthly, taking into account the current energy flag. The energy flag is a concept present in Brazil since 2015, where there may be a price increase on the energy price due to the current generator’s dispatch and its dependencies on natural resources. The green flag means low cost to generate energy (in Brazil, meaning more hydrogeneration) and therefore no price increase. The yellow flag indicates attention (increase of R$0.015 for every kilowatt hour; R$ meaning Brazilian currency). Lastly, the red flag indicates that the former situation is getting worse and the supply of energy to meet consumer demand occurs with higher generation costs, (increase of R$0.03 for every kilowatt hour). In the proposed model, the energy flags varied randomly for each iteration, however, in reality they vary monthly according to Brazil’s electricity generation costs.
Finally, factor 1c is related to the DSM actions taken by the utility. In the developed agent-based model, DSM actions are considered as an area of the “simulation world”. All consumers move at random for each iteration, and when they “stop” by the utility marked area, they are influenced as follows: (i) consumption decreases by 1%; and (ii) satisfaction level increases by 1%. These DSM programs may be considered as customer-focused marketing actions.
4.3.4. Social Interactions (Factor 2)
In the developed model, each agent moves along the “simulation world” randomly at every iteration, allowing each agent to eventually meet each other. Whenever they are at the same place, it is considered that a social interaction took place. Social norms regarding class mixing are not considered in the model, therefore every customer has the same likelihood to meet another customer in the simulation (but not necessarily make a social interaction, as indicated by the gaps in Table 4), regardless of their category.
The behavior between each consumer’s category is described in Table 4, where the rows describe the consumer affected. These social interactions happen for both customers, but not necessarily in the same way, e.g., if a consumer in category 2 meets a consumer of category 1, the former increases their consumption, although the latter does not.
Table 4 explains that consumption increases if a customer meets someone who uses more electricity, and vice versa. Exceptions are category 1 whose consumption is not influenced. Lastly, all categories increase their investment level if they meet a category 4 consumer, apart from category 2.
4.3.5. Customer Investments in Energy Efficiency (Factor 3)
Factor 3 influences customer behavior in the development model by investments in energy efficiency, that is:
- Retrofitting of an energy-efficient equipment such as a refrigerator (decreases consumption by 8.4 kWh/month);
- Installation of a solar system 2 kW grid-tie (decreases consumption by 200 kWh/month);
- Retrofitting of electric showers, which are commonly used in Brazil, to natural gas (decreases consumption by 110 kWh/month);
- Retrofitting of an air-conditioning system (decreases consumption by 7.4 kWh/month).
Table 5 presents the customers’ initial investment level range and their behavior after an investment.
The following equation describes how consumers alter their willingness to invest:
Therefore, if a customer has a satisfaction level of 0.8, they will not alter their investment level. If it is greater than 0.8, their investment level will decrease; otherwise, it will increase. Finally, if a given customer performs an investment in a given iteration, they immediately decrease their investment level according to:
where DRAI is the decrease level after an investment, which varies according to Table 5.
5. Results and Analysis
To analyze the emergent behavior present in the simulation model, a base scenario and four analysis scenarios were proposed, as described in Table 6.
The base scenario is composed of 4 consumers of each category. Scenarios 1 to 4 considered that while having the total number of consumers fixed, a significant increase of consumers occurs in categories 1 to 4, respectively. A small number of customers were chosen so that we could monitor how the model behaves on an individual level, and ensure that it behaved sensibly.
5.1. Parameters Considered on the Simulations
This section discusses the main parameters considered on the simulation. Firstly, Table 7 presents the parameters used in (1)–(3) and (5), by defining fixed values to the verbal descriptions in Table 2, Table 3 and Table 5.
For the parameters CP and SP, we assumed that customers in category 1 are totally insensitive to how much they spend in electricity, therefore CP = SP = 0 (zero). Several different set of values were tested for all parameters, and we concluded that the model is not very sensitive to the price elasticity level of consumers. For example, the biggest consumption difference due to variations of the parameters CP and CSP was when customers on category 4 have a CSP of 0.5 instead of 1, using scenario 4 as a reference. The difference in the final consumption for this alternate test set was only ca. 4.56 % lower.
Another important parametrization performed was regarding social interactions. The specific values used in Table 4 are:
- Increases investment level: 2.5%;
- Increases significantly investment level: 5%;
- Increases/decreases consumption: 5%;
- Decreases consumption (if the consumer met consumes less): average between both consumers.
The other initial values considered are as follows:
- Energy price at the first iteration: 0.5 R$/kWh;
- Fixed rate consumption increase: 0.1%/iteration;
- Base elasticity level: −0.146;
- DSM action level: 32 (i.e., ~2.94% of the simulation world, 34 × 32 positions).
A fixed consumption (factor 1a) is the percental rate that electricity consumption would increase if a more traditional economic model that does not consider social interactions and the other aforementioned factors was considered. All simulations were run for 960 iterations. Because of the randomness in the simulation, all scenarios were run 100 times each, and the results presented in the following are the average of all simulations.
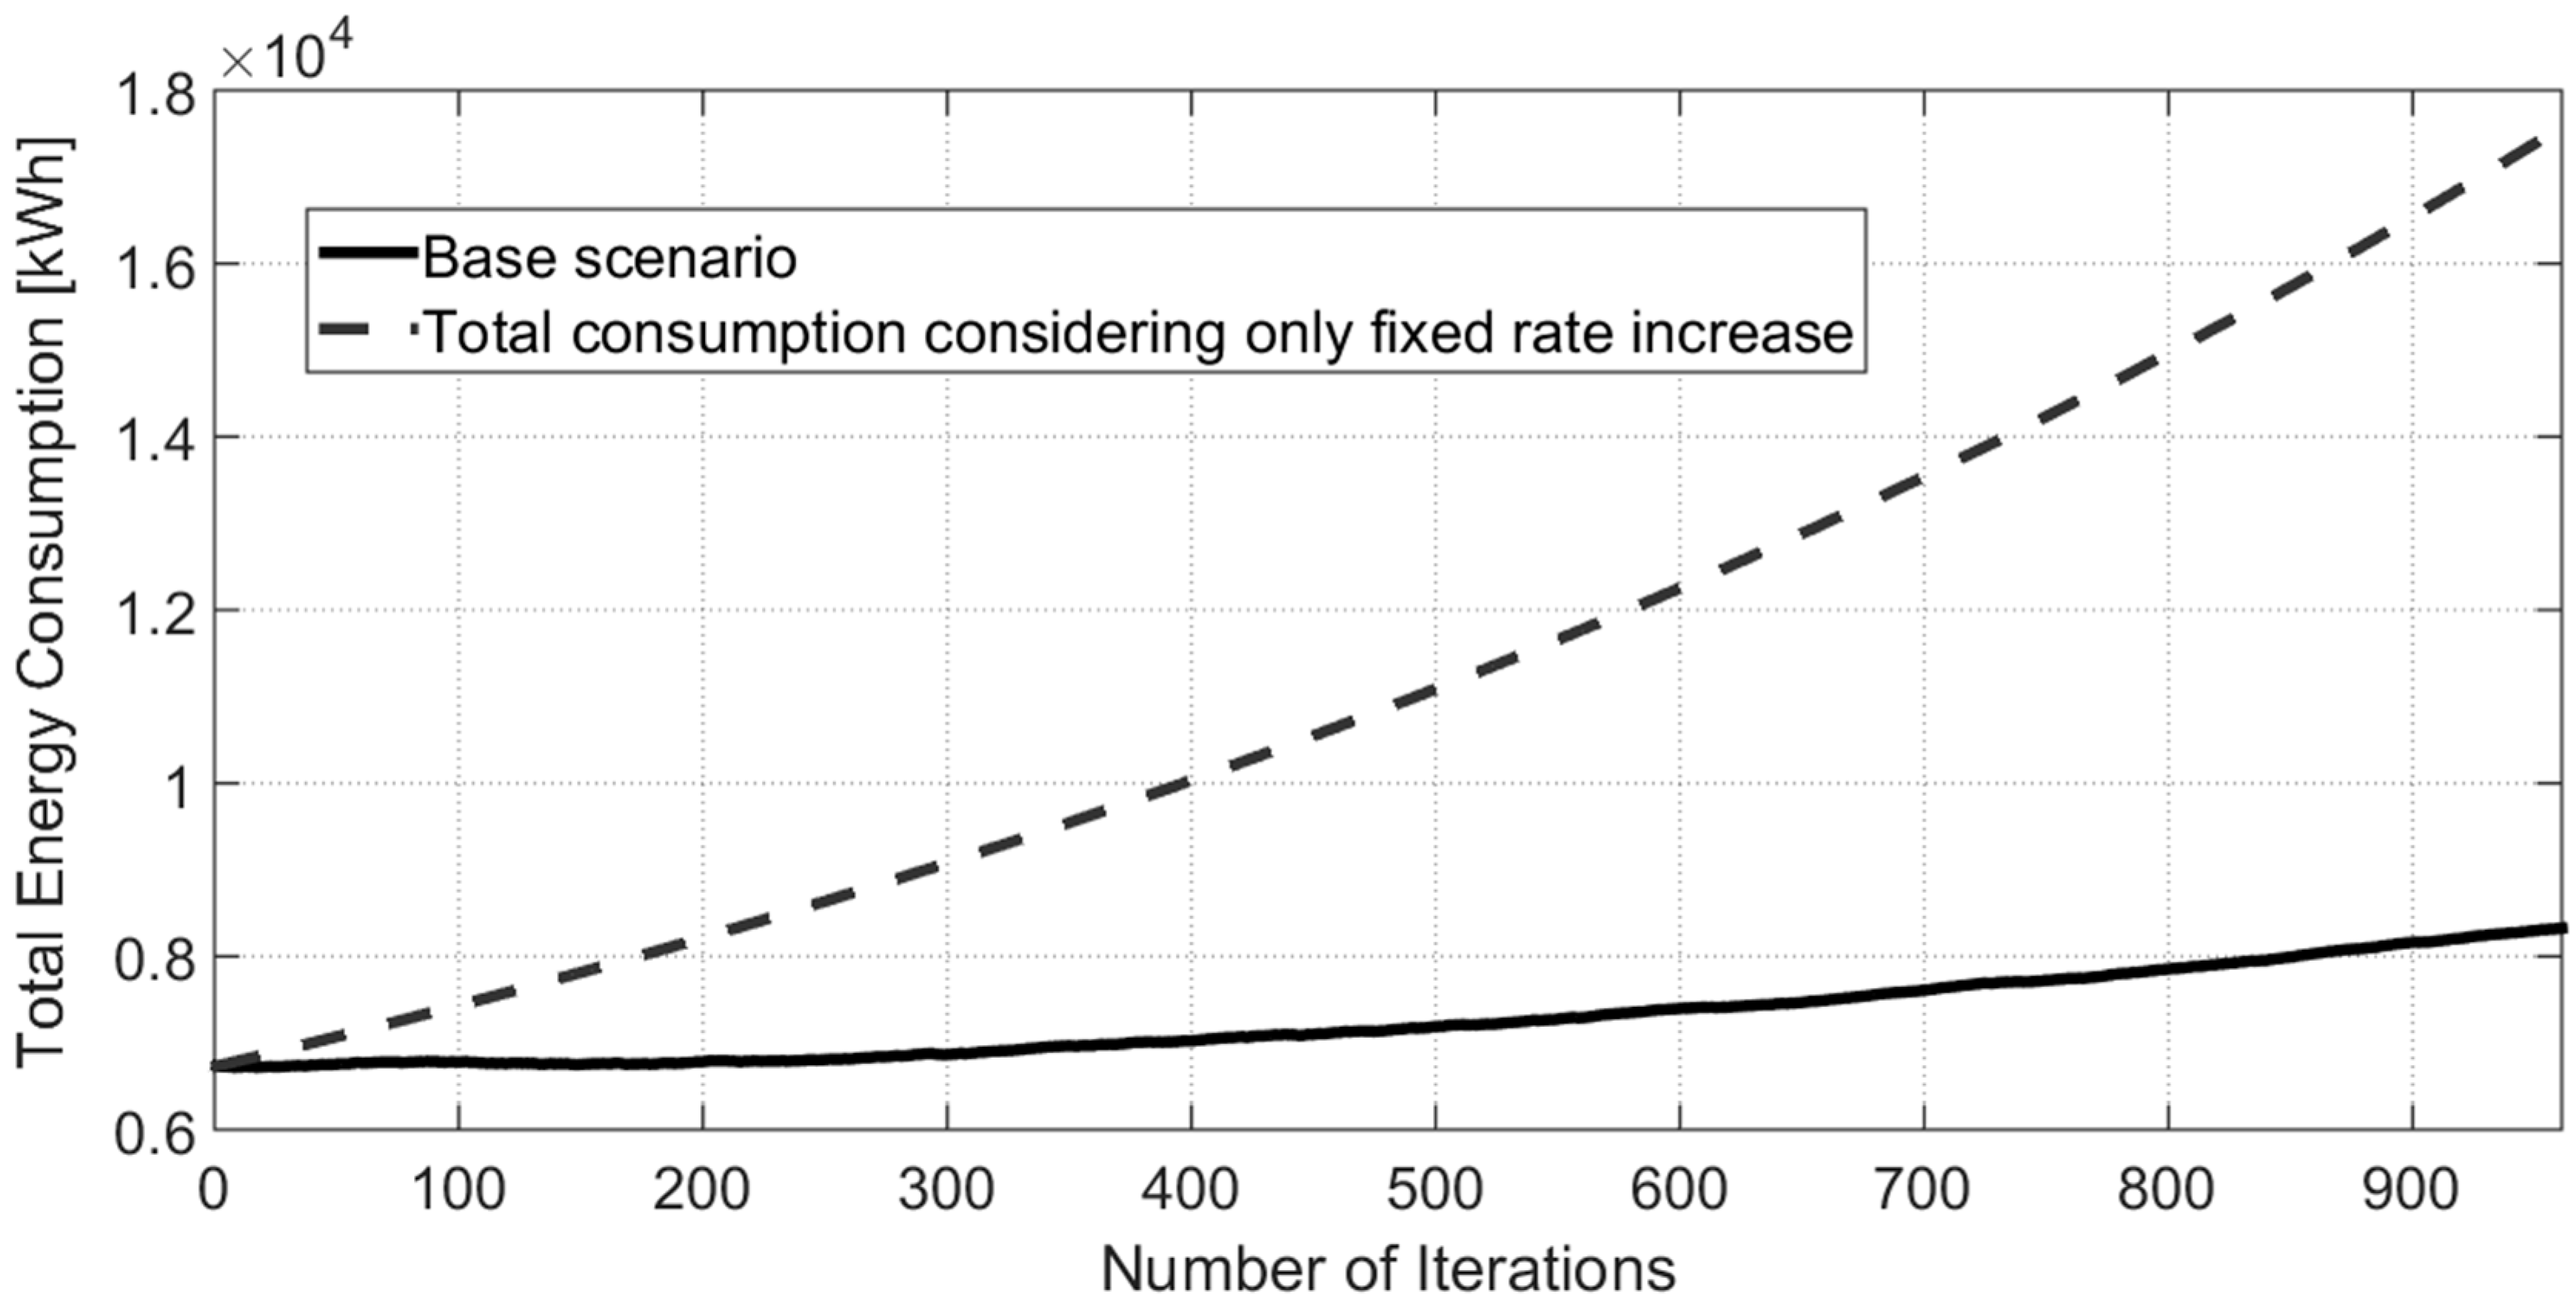
5.2. Base Scenario
In the base scenario, the total consumption started at 6719.48 kWh and reached a level of 8326.67 kWh, i.e., an increase of ~23.92%, as presented by the solid black line in Figure 2. If only the fixed rate increase in energy consumption was considered, the final consumption would be 17,540.82 kWh, as pointed out by the dashed line. This represents an increase that would be nearly 673.31% higher compared to the inclusion of all social interactions, price elasticity, investment, and DSM programs modeled. A significant difference in the simulation results was obtained by the modeling of simple heuristics, although their individual impact could not be considered significant.
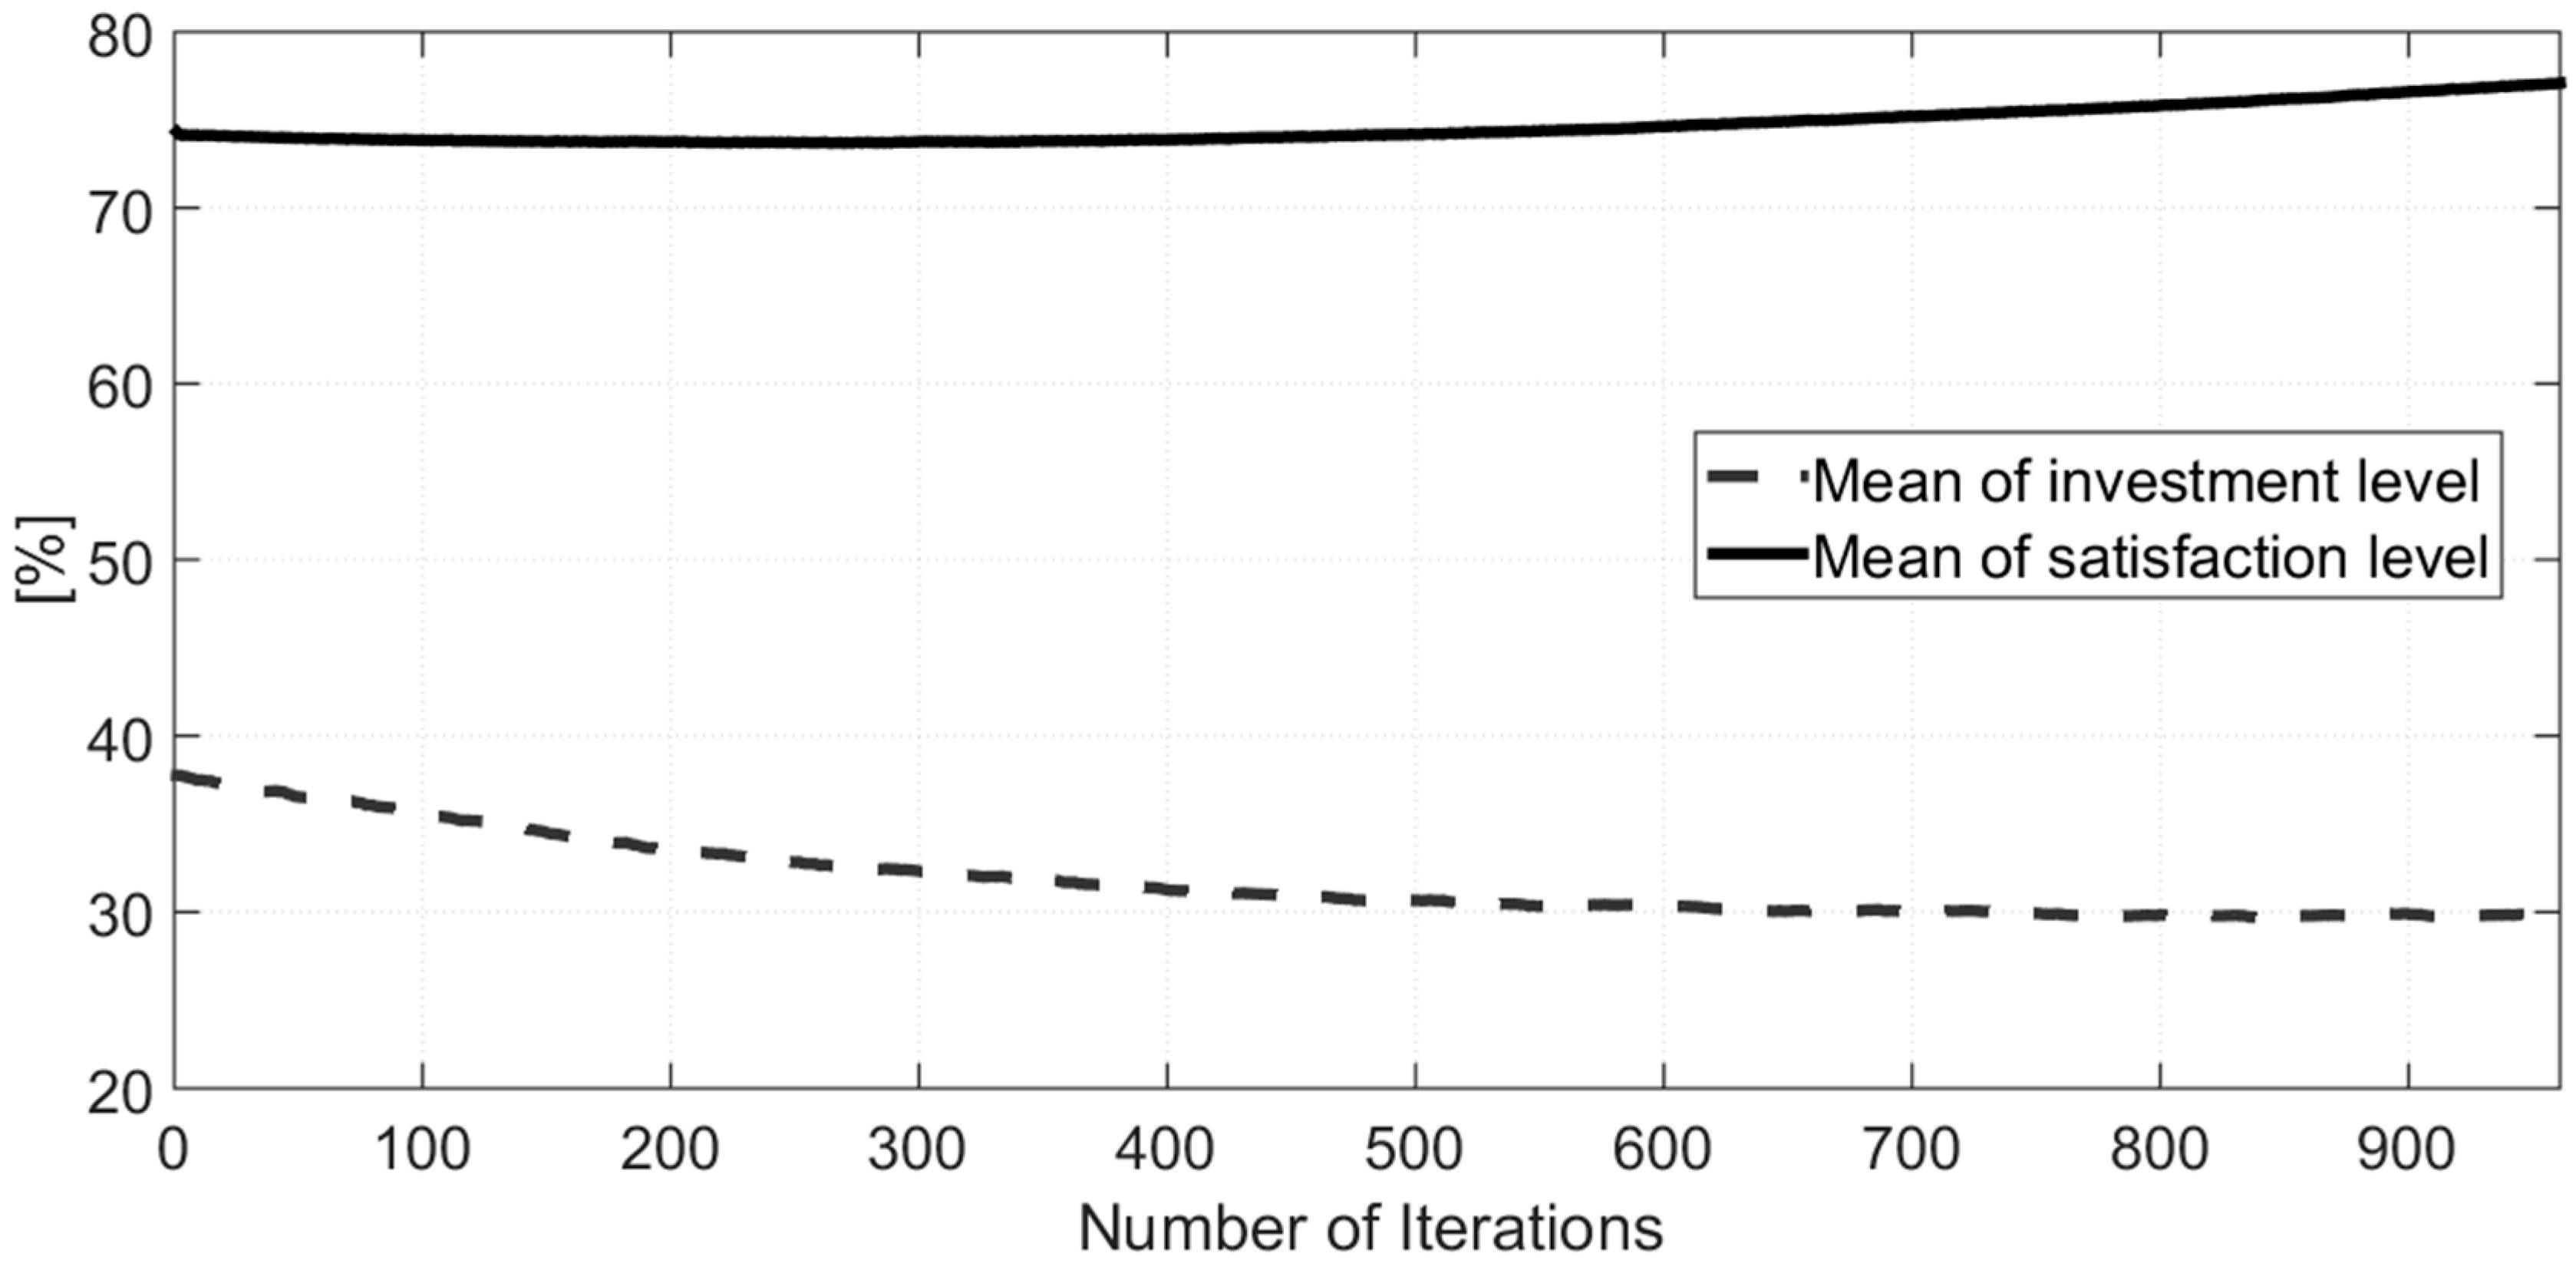
Figure 3 shows how the mean of investment and satisfaction level evolved over time. The investment level in energy efficiency initially decreased, but stabilized at around iteration number 600. This evolution was followed by the accumulated total of investments, which reached an average of 6.28 investments in the first 200 iterations, but only 19.31 investments after iteration number 760 (if it was to increase linearly, the value would be 23.86).
The satisfaction level slightly fell in the first iterations, and then rose to an average level of 77.09%. Social interactions and interactions with the utility (DSM) varied in a quasi-linear way along the simulation, with the former reaching an average number of 106.03, and the latter an average of 187.88.
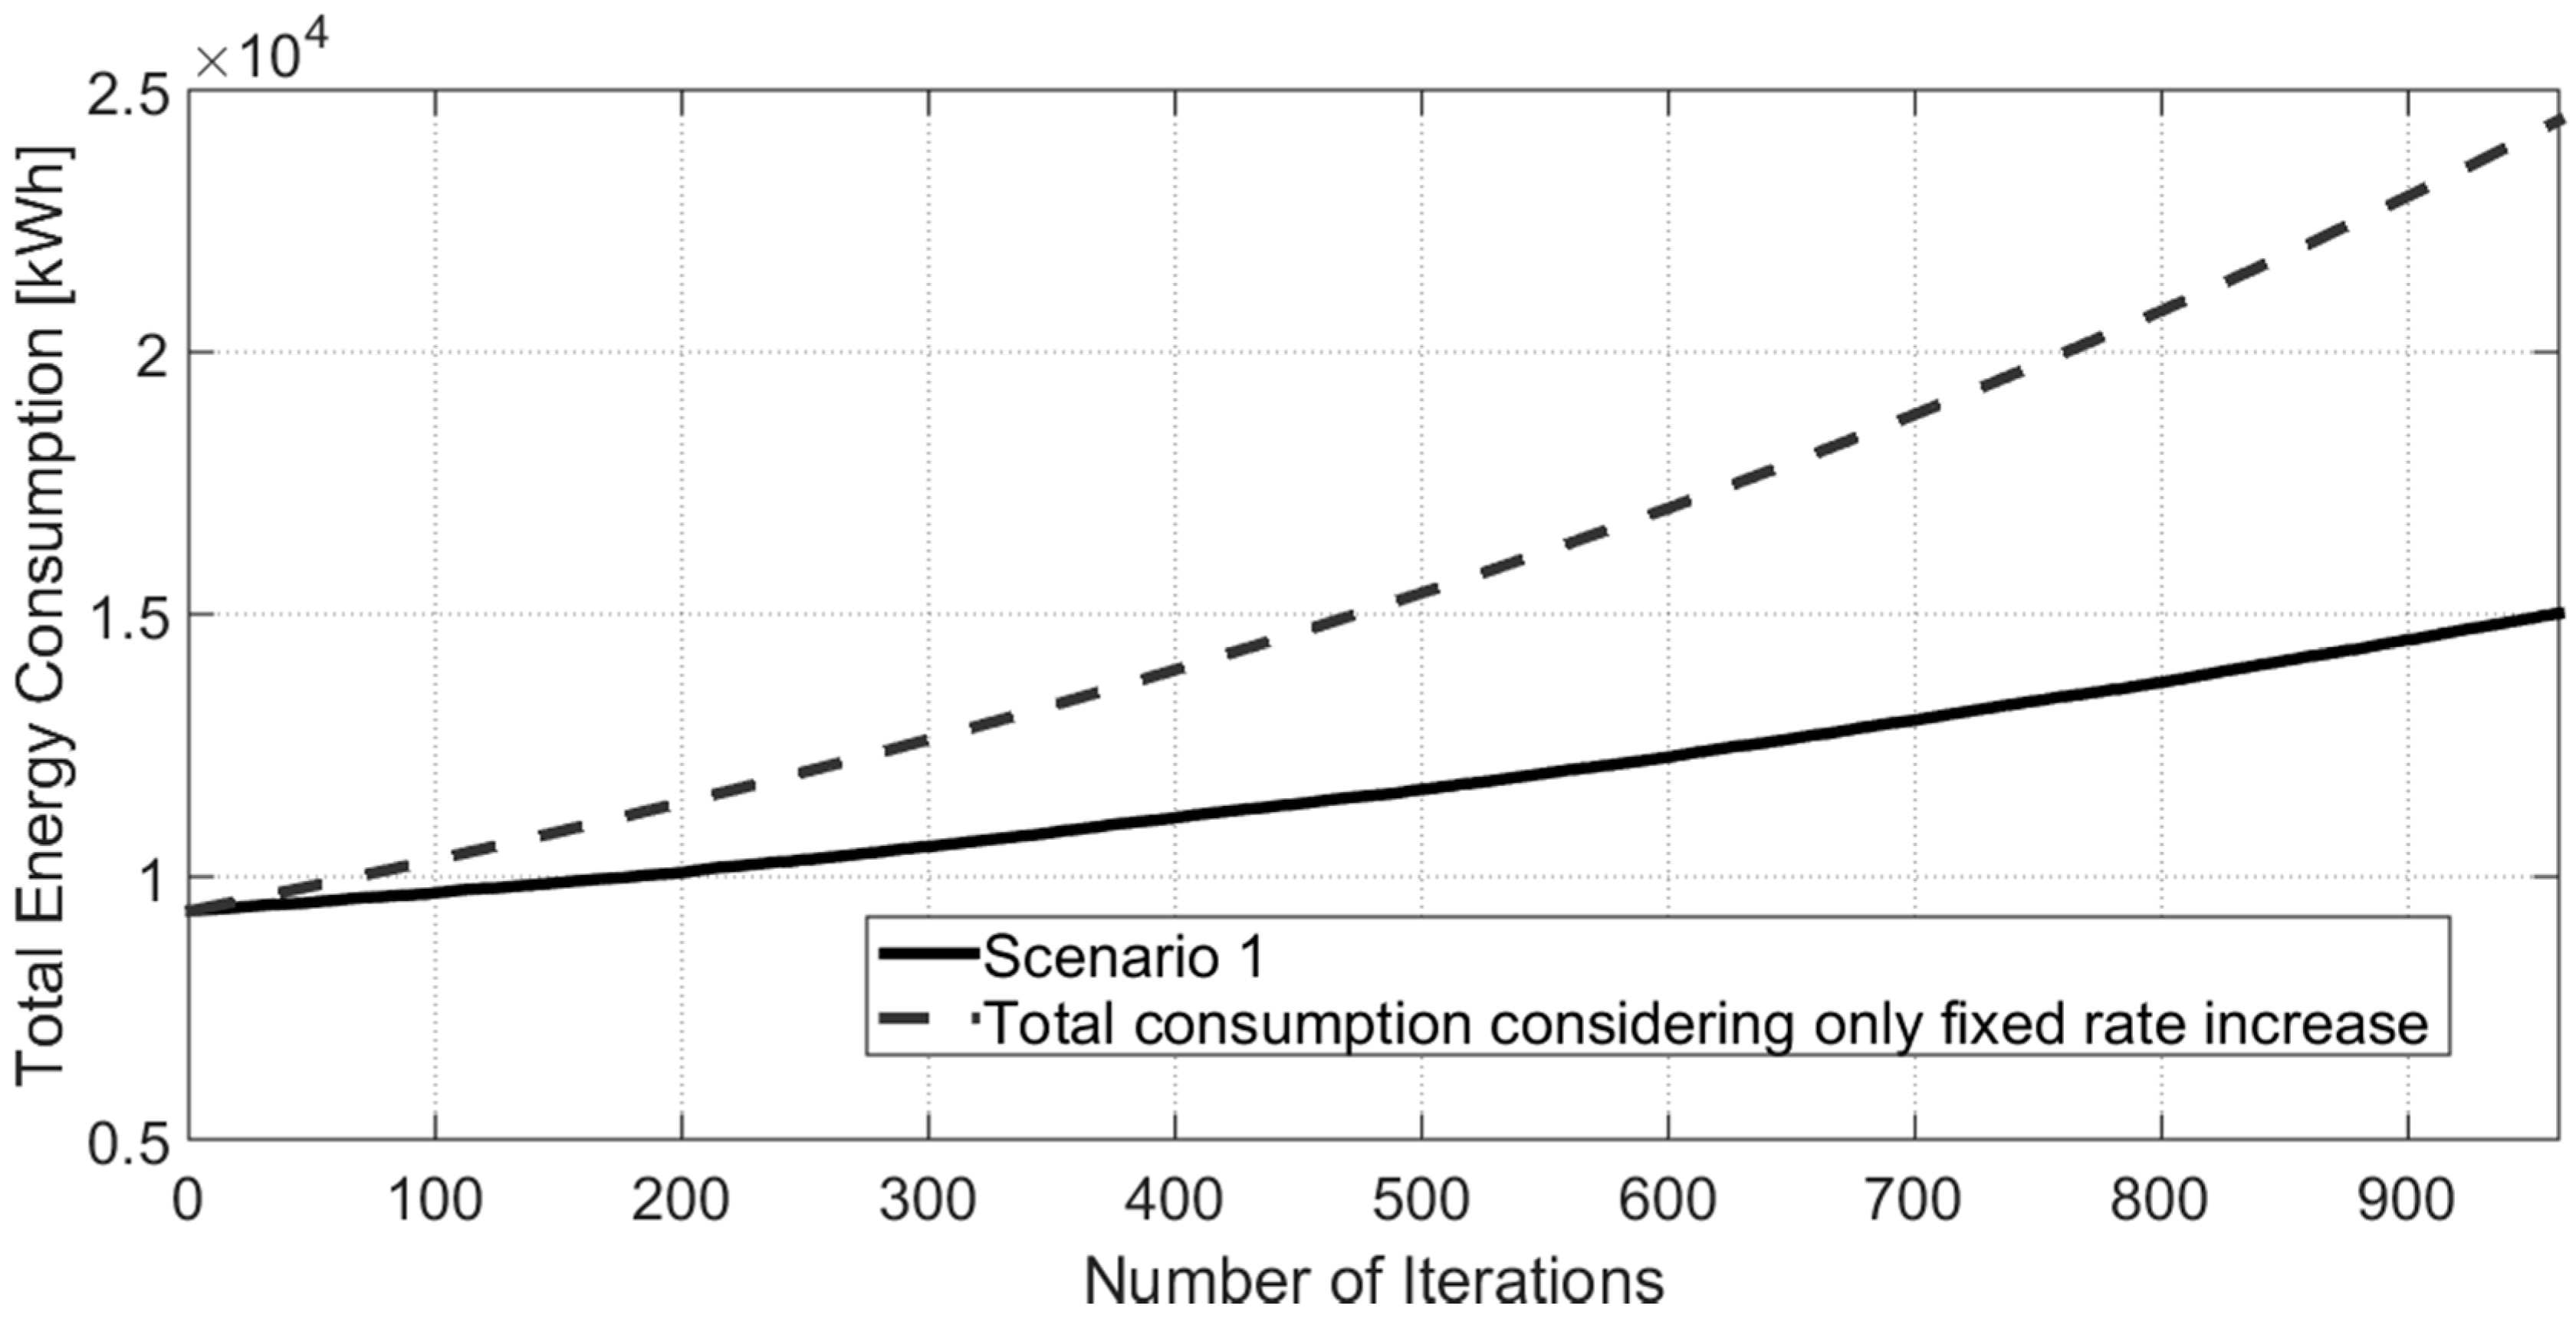
5.3. Results and Analysis of Scenario 1
The consumption level started at 9354.86 kWh, a higher level than the base scenario due to the presence of more consumers in category 1, eventually reaching an end level of 15,015.86 kWh, as presented in Figure 4. A traditional economic model considering only the fixed rate consumption increase would reach a level of 24,420.34 kWh, as presented by the dashed red line. This is a large difference, but not as large as in the base scenario, due to the huge presence of consumers from category 1, whose modeled heuristics did not take into consideration investments and social interactions as much as other categories.
Social interactions reached an average level of 66.14, with zero being the starting point, a value nearly 40% lower than the one presented in the base scenario. This is an expected result due to little interaction level modeled for category 1.
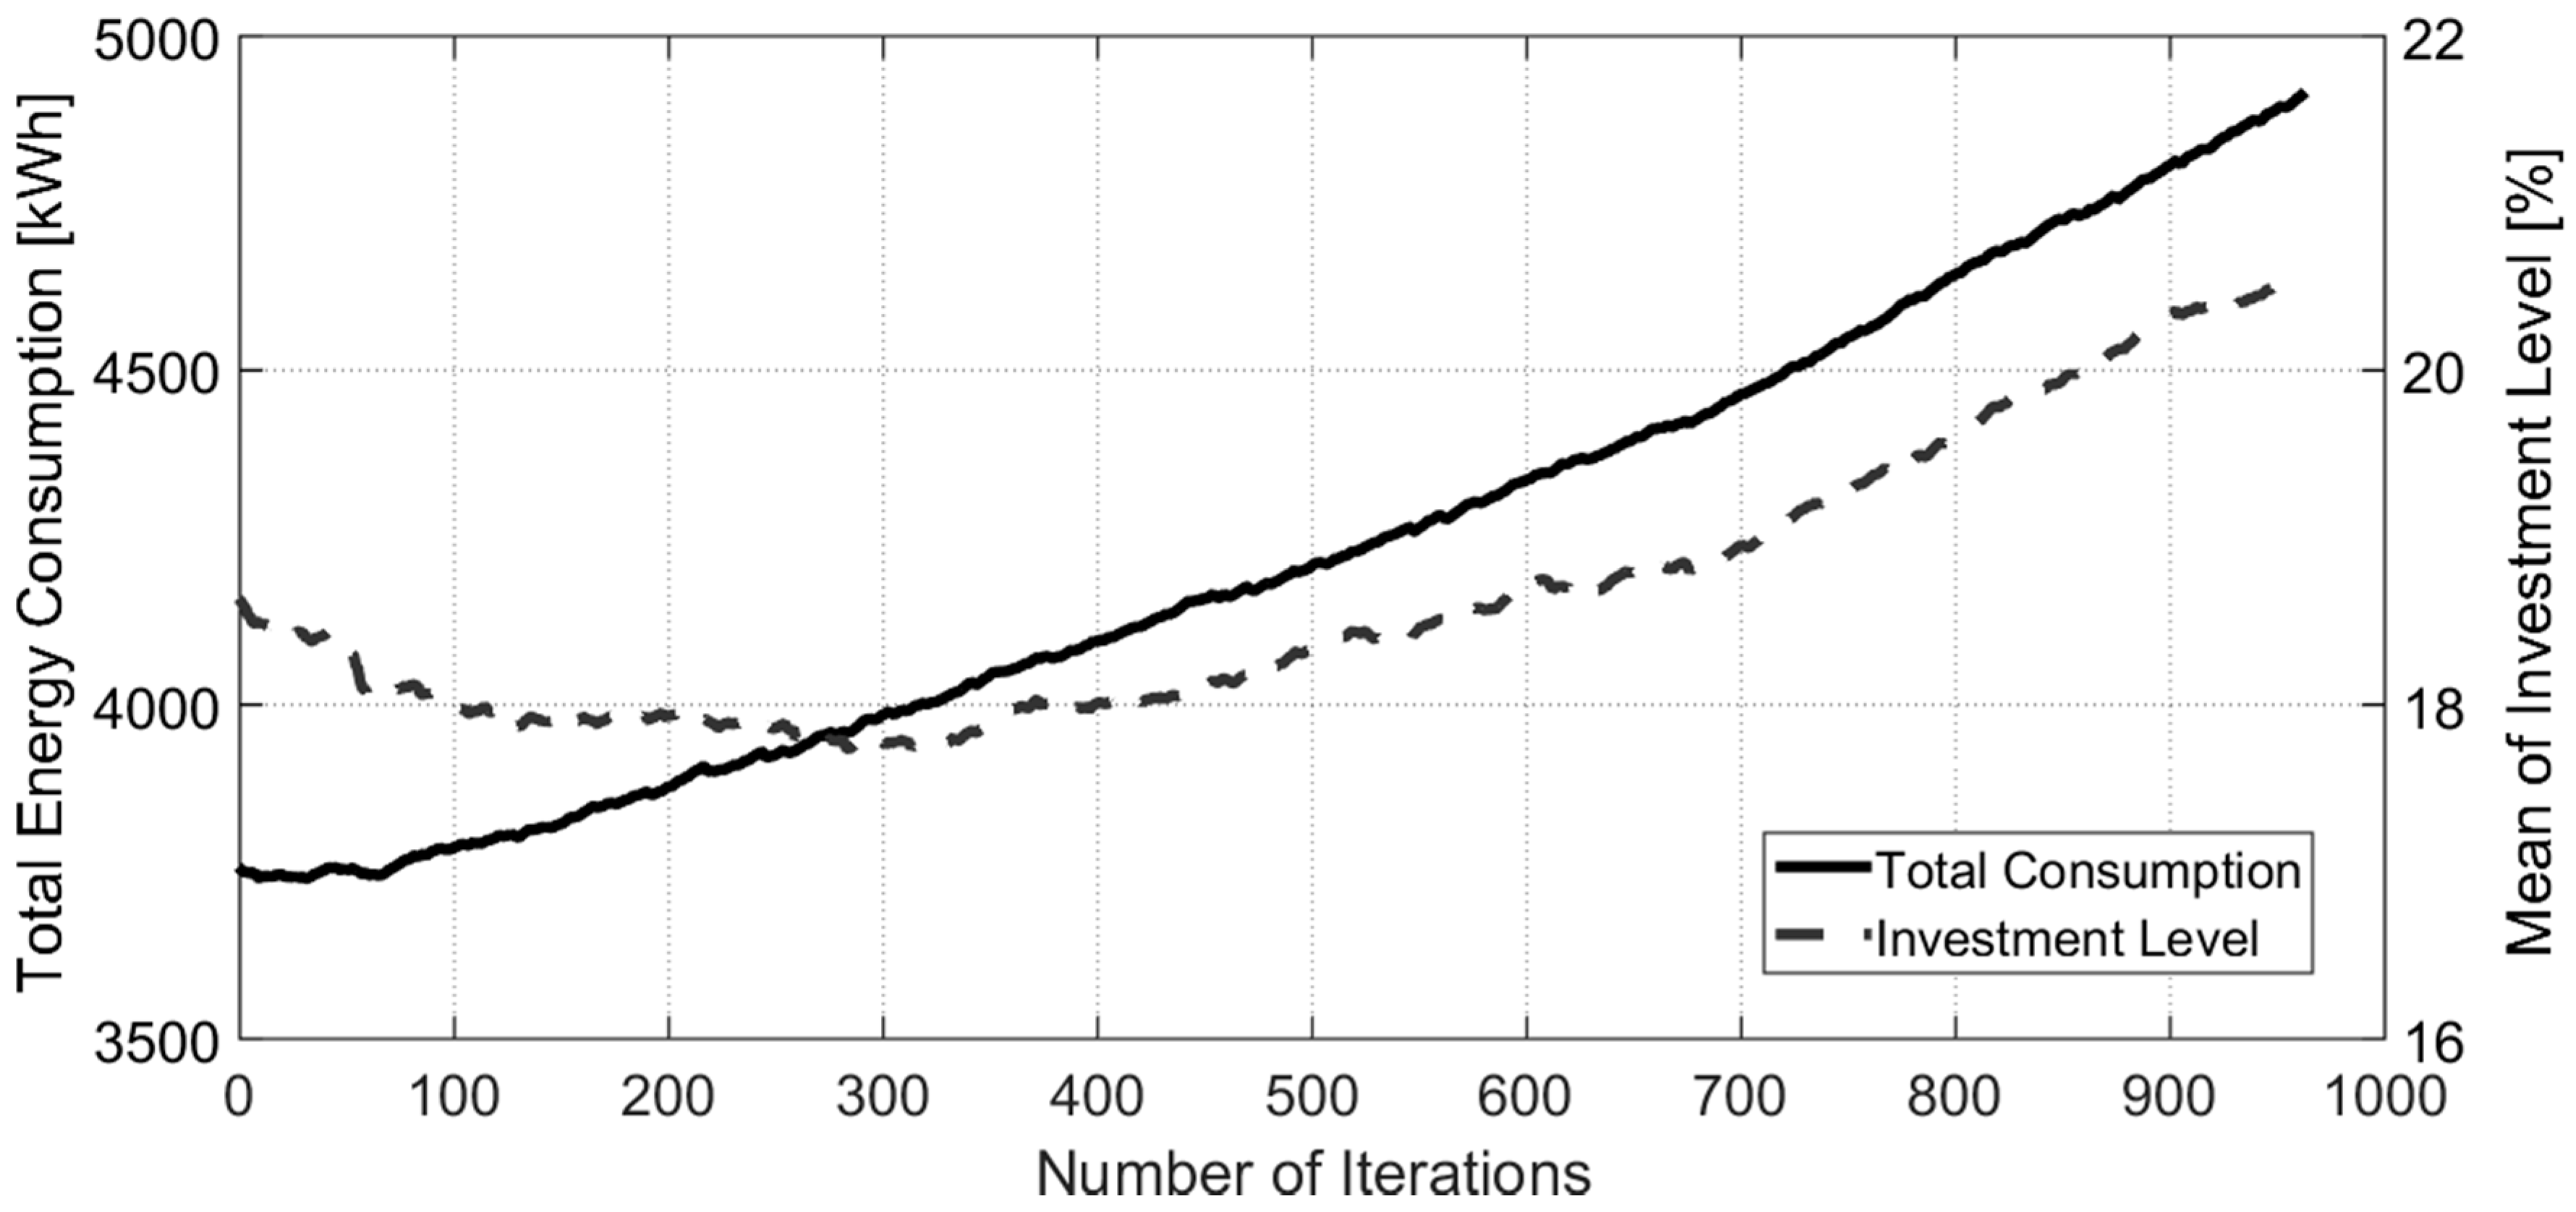
5.4. Results and Analysis of Scenario 2
As consumers in category 2 have a significantly lower initial consumption, the initial value was 3751.27 kWh, steadily increasing to reach a level of 4910.76 kWh, as illustrated in Figure 5.
As shown in Table 5, the initial investment level of category 2 is 0%, resulting in an average initial level of 18.61%, which is a significantly lower level compared to the other scenarios. Due to the social interaction scheme, their bigger price elasticity (base elasticity multiplied by 2), and the few investments made, it is possible to verify that although consumers in category 2 present a lower initial consumption level, scenario 2 presents the steeper increase in electricity consumption. It may be considered an effect of the modeled bounded rationality on the heuristics.
5.5. Results and Analysis of Scenario 3
In scenario 3, there was a 7.32% decrease in energy consumption, as illustrated in Figure 6. One factor that significantly contributed was the amount of social interactions, which totaled 143.4 in average, more than twice the number of scenarios 1 and 2, and 35% more than the base scenario. Compared to scenario 4, the amount of social interactions was slight lower (~10%), but it is important to note that in the modeling of interactions proposed in Table 4, there is a significant impact on the social interactions regarding consumption decrease, directly or indirectly, for consumers on category 3.
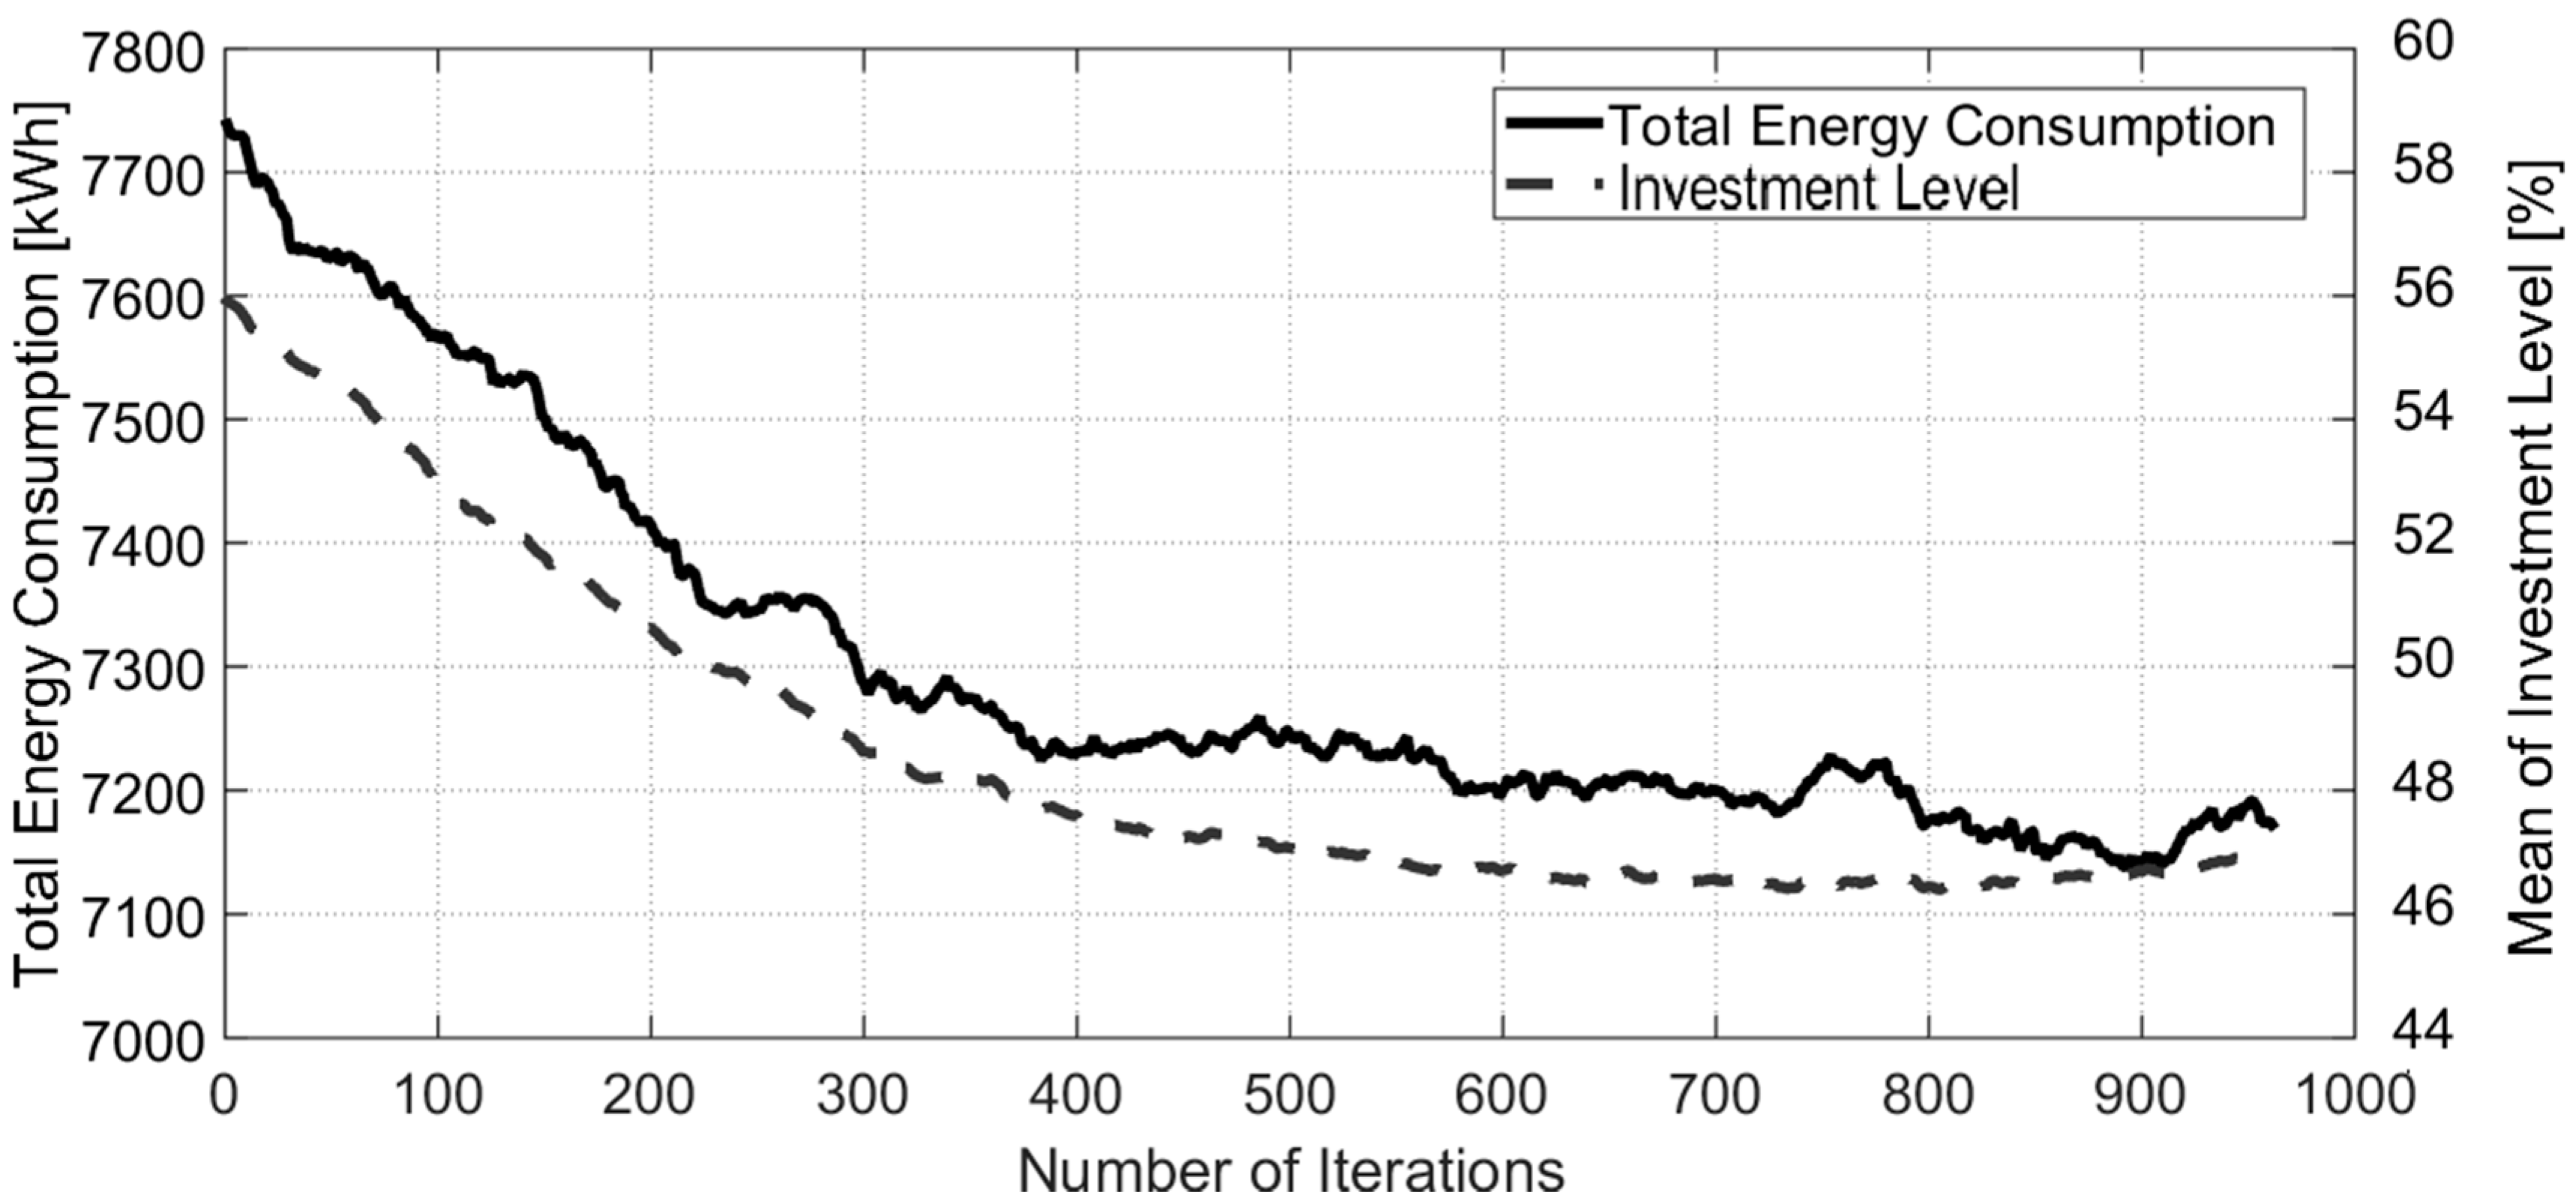
5.6. Results and Analysis of Scenario 4
The objective of scenario 4 is to highlight the behavior of consumers on category 4, i.e., consumers inclined to strongly adopt new technologies and therefore invest in energy-efficient technologies. The total energy consumption decreased, as presented in Figure 7, due to the investments made. This hypothesis is supported due to the 0.9903 Pearson product-moment correlation coefficient between both curves.
The investment level decreased along the iterations of the simulation due to the investments made by the customer, which totaled an average of 46.86 (more than double the amount of base scenario, and nearly three times the amount in scenarios 1–3).
5.7. Analysis of the Number of Interactions for All Scenarios
Since one of the most relevant aspects of the proposed model are social interactions, Table 8 presents the total amount of social interactions for each simulation scenario.
As previously mentioned, the model disregards social norms on class mixing, therefore the possibility of social interactions for all models is basically related to the number of consumers in the simulation. Nevertheless, as showed by Table 4, not all possibilities of social interaction become a social interaction, as it depends on the customer category.
The starting point for the total number of interactions is zero, and it is accumulated along the iterations. The results of the correlation indicate that the emergent behavior on electricity consumption of consumers in categories 1 and 2 is highly correlated with the total number of social interactions. It is also inversely proportional for category 4 and not very correlated for category 3, indicating that, given the proposed model, social interactions should be considered a very important aspect to be considered by power utilities.
6. Conclusions
In this paper, the contribution of a behavioral economics-based approach to achieve a better comprehension of the complexity of electricity consumption was discussed and analyzed. This was achieved through the development of an agent-based simulation model with heuristics, considering different consumer categories, energy efficiency programs, social interactions, and investments in energy-efficient technologies.
The analysis of simulation results on the emergent behavior of heterogeneous agents modeled, all with bounded rationality, indicates some important biases on consumer behavior. These are not usually available in the traditional economic models used by power utilities, as these do not take into consideration the complexity level of the interactions.
One limitation of this model is that, since it was not validated with real data, it cannot be considered as a model for the real world. Nevertheless, this work supports increasing awareness of the importance of a deeper comprehension of consumer behavior in modeling of power systems, so that the challenges for future generations in power generation and delivery may be overcome.
For this model to become accurate, further studies on systems theory, complexity, computational simulation modeling, human and social behaviors, and big data techniques must be investigated to achieve a more in-depth and accurate model.
Acknowledgments
The authors would like to thank the National Council for Scientific and Technological Development (CNPq), Coordination for the Improvement of Higher Education Personnel (CAPES) and Brazilian Electricity Regulatory Agency Research and Development (ANEEL R&D) for supporting this project.
Author Contributions
Luciano C. Siebert and Adriana Sbicca conceived and designed the experiments; Luciano C. Siebert and Adriana Sbicca performed the experiments; Luciano C. Siebert and Alexandre Rasi Aoki analyzed the data; Luciano C. Siebert, Alexandre Rasi Aoki, and Germano Lambert-Torres contributed analysis tools; and Luciano C. Siebert, Adriana Sbicca, Alexandre Rasi Aoki, and Germano Lambert-Torres wrote the paper.
Conflicts of Interest
The authors declare no conflict of interest.
Nomenclature
| Indices | |
| K | Index for iteration |
| Parameters | |
| Ε | Elasticity basis level |
| CP | Consumption parameter |
| CSP | Consumption satisfaction parameter |
| DRAI | Decrease level after an investment |
| SP | Satisfaction parameter |
| Variables | |
| Q | Energy consumption |
| P | Elasticity price |
| S | Customer satisfaction level |
| inv | Investment level |
References
- Gellings, C.W. Smart Grid Planning and Implementation, 1st ed.; Fairmont Press: Lilburn, GA, USA, 2015. [Google Scholar]
- Ardito, L.; Procaccianti, G.; Menga, G.; Morisio, M. Smart grid technologies in Europe: An overview. Energies 2013, 6, 251–281. [Google Scholar] [CrossRef]
- Talari, S.; Shafie-khah, M.; Siano, P.; Loia, V.; Tommasetti, A.; Catalão, J.P.S. A review of smart cities based on the internet of things concept. Energies 2017, 10, 421. [Google Scholar] [CrossRef]
- Simon, H.A. A behavioral model of rational choice. Q. J. Econ. 1955, 69, 99–118. [Google Scholar] [CrossRef]
- Simon, H.A. Theories of decision making. Am. Econ. Rev. 1959, 49, 253–283. [Google Scholar]
- Katona, G. Rational behavior and economic behavior. Psychol. Rev. 1953, 60, 307–318. [Google Scholar] [CrossRef] [PubMed]
- Gomez-Sanz, J.J.; Garcia-Rodriguez, S.; Cuartero-Soler, N.; Hernandez-Callejo, L. Reviewing microgrids from a multi-agent systems perspective. Energies 2014, 7, 3355–3382. [Google Scholar] [CrossRef]
- Sbicca, A. Heuristics in Consumer Decision, 1st ed.; Getúlio Vargas Foundation: Curitiba, Brazil, 2010. (In Portuguese) [Google Scholar]
- Tversky, A.; Kahneman, D. Judgment under uncertainty: Heuristics and biases. Science 1974, 185, 1124–1131. [Google Scholar] [CrossRef] [PubMed]
- Simon, H.A. Rational decision making in business organizations. Am. Econ. Rev. 1979, 69, 493–513. [Google Scholar]
- Simon, H.A. The Sciences of the Artificial, 3rd ed.; MIT Press: Cambridge, MA, USA, 1996. [Google Scholar]
- Tesfatsion, L. Agent-based computational economics: A constructive approach to economic theory. In Handbook of Computational Economics; Tesfatsion, L., Judd, K., Eds.; North Holland: Amsterdam, The Netherlands, 2006; Volume 2, pp. 831–880. [Google Scholar]
- Guérard, G.; Ben Amor, S.; Bui, A. A complex system approach for smart grid analysis and modeling. In Advances in Knowledge-Based and Intelligent Information and Engineering Systems, Proceedings of the 16th Annual KES Conference, San Sebastian, Spain, 10–12 September 2012; Graña, M., Toro, C., Posada, J., Howlett, R.J., Jain, L.C., Eds.; IOS Press: Amsterdam, The Netherlands, 2012; pp. 788–797. [Google Scholar] [CrossRef]
- Kremers, E. Modelling and Simulation of Electrical Energy Systems through a Complex Systems Approach Using Agent-Based Models, 1st ed.; KIT Scientific Publishing: Karlsruhe, Germany, 2012. [Google Scholar]
- Venayagamoorthy, G.K. Dynamic, stochastic, computational and scalable technologies for smart grids. IEEE Comput. Intell. Mag. 2011, 6, 22–35. [Google Scholar] [CrossRef]
- Soares, J.; Morais, H.; Sousa, T.; Vale, Z.; Faria, P. Day-ahead resource scheduling including demand response for electric vehicles. IEEE Trans. Smart Grid 2013, 4, 596–605. [Google Scholar] [CrossRef]
- Nam, S.R.; Kang, S.H.; Lee, J.H.; Choi, J.H.; Ahn, S.J. EMS-data-based load modeling to evaluate the effect of conservation voltage reduction at a national level. Energies 2013, 6, 3692–3705. [Google Scholar] [CrossRef]
- Bai, H.; Miao, S.; Ran, X.; Ye, C. Optimal dispatch strategy of a virtual power plant containing battery switch stations in a unified electricity market. Energies 2015, 8, 2268–2289. [Google Scholar] [CrossRef]
- Gonzatti, R.B.; Ferreira, S.C.; da Silva, C.H.; Borges da Silva, L.E.; Pereira, R.R.; Lambert-Torres, G. Smart impedance: A new way to look at hybrid filters. IEEE Trans. Smart Grid 2016, 7, 837–846. [Google Scholar] [CrossRef]
- Cannistraro, A.; Cannistraro, G.; Cannistraro, M.; Galvagno, A.; Trovato, G. Evaluations technical and economic the integrations of co-trigeneration systems in the dairy industry. Int. J. Heat Technol. 2016, 34, s332–s336. [Google Scholar] [CrossRef]
- Momoh, J. Smart Grid: Fundamentals of Design and Analysis, 1st ed.; IEEE Computer Society Press: Los Alamitos, CA, USA, 2012. [Google Scholar]
- Lopes, A.J.; Lezama, R.; Pineda, R. Model based systems engineering for smart grids as systems of systems. Procedia Comput. Sci. 2011, 6, 441–450. [Google Scholar] [CrossRef]
- Marvasti, A.K.; Fu, Y.; DorMohammadi, S.; Rais-Rohani, M. Optimal operation of active distribution grids: A system of systems framework. IEEE Trans. Smart Grid 2014, 5, 1228–1237. [Google Scholar] [CrossRef]
- Lambert-Torres, G.; Abe, J.M.; da Silva Filho, J.I.; Martins, H.G. Advances in Technological Applications of Logical and Intelligent Systems, 1st ed.; IOS Press: Amsterdam, The Netherlands, 2009. [Google Scholar]
- Bompard, E.; Connors, S.; Fulli, G.; Han, B.; Masera, M.; Mengolini, A.; Nuttall, W.J. Smart Energy Grids and Complexity Science, 1st ed.; JRC Scientific and Policy Report: Petten, The Netherlands, 2012. [Google Scholar]
- Gellings, C.W. The concept of demand-side management for electric utilities. Proc. IEEE 1985, 73, 1468–1470. [Google Scholar] [CrossRef]
- Erdinç, O.; Taşcıkaraoğlu, A.; Paterakis, N.G.; Eren, Y.; Catalão, J.P.S. End-user comfort oriented day-ahead planning for responsive residential HVAC demand aggregation considering weather forecasts. IEEE Trans. Smart Grid 2017, 8, 362–372. [Google Scholar] [CrossRef]
- International Energy Agency. The Power to Choose: Demand Response in Liberalised Electricity Markets; OECD Publishing: Paris, France, 2003. [Google Scholar]
- Kirschen, D.S.; Strbac, G.; Cumperayot, P.; de Paiva Mendes, D. Factoring the elasticity of demand in electricity prices. IEEE Trans. Power Syst. 2000, 15, 612–617. [Google Scholar] [CrossRef]
- Dehghanian, P.; Kezunovic, M. Probabilistic decision making for the bulk power system optimal topology control. IEEE Trans. Smart Grid 2016, 7, 2071–2081. [Google Scholar] [CrossRef]
- Nekooei, K.; Farsangi, M.M.; Nezamabadi-Pour, H.; Lee, K.Y. An improved multi-objective harmony search for optimal placement of DGs in distribution systems. IEEE Trans. Smart Grid 2013, 4, 557–567. [Google Scholar] [CrossRef]
- Mazidi, P.; Tohidi, Y.; Sanz-Bobi, M.A. Strategic maintenance scheduling of an offshore wind farm in a deregulated power system. Energies 2017, 10, 313. [Google Scholar] [CrossRef]
- Ida, T. Can the Smart Grid Save Us from the Power Crisis? Avalible online: http://www.econ.kyoto-u.ac.jp/~ida/4Hoka/smagri/20130125Nikkei-E.pdf (accessed on 31 May 2017).
- Frederiks, E.R.; Stenner, K.; Hobman, E.V. Household energy use: Applying behavioural economics to understand consumer decision-making and behaviour. Renew. Sustain. Energy Rev. 2015, 41, 1385–1394. [Google Scholar] [CrossRef]
- Sullivan, D.; Resources, N.; Council, D. When “Not Losing” is Better Than “Winning”: Using behavioral science to drive customer investment in energy efficiency. In Proceedings of the 17th Biennial 2012 ACEEE Summer Study on Energy Efficiency in Buildings, Pacific Grove, CA, USA, 12–17 August 2012; pp. 284–293. [Google Scholar]
- Cannistraro, M.; Lorenzini, E. The applications of the new technologies “E-sensing” in hospitals. Int. J. Heat Technol. 2016, 34, 551–557. [Google Scholar] [CrossRef]
- Tsvetanov, T.; Segerson, K. Re-evaluating the role of energy efficiency standards: A time-cosistent behavioral economics approach. J. Environ. Econom. Manag. 2013, 66, 347–363. [Google Scholar] [CrossRef]
- Pollitt, M.G.; Shaorshadze, I.; Pollitt, M.G.; Shaorshadze, I. The role of behavioural economics in energy and climate policy. Camb. Work. Pap. Econom. 2011, 1165, 31. [Google Scholar]
- Arango, H.G.; Lambert-Torres, G.; de Moraes, C.H.V.; Borges da Silva, L.E. Spatiotemporal data mining for distribution load expansion. Adv. Electr. Comput. Eng. 2016, 16, 65–72. [Google Scholar] [CrossRef]
- Kangur, A.; Jager, W.; Verbrugge, R.; Bockarjova, M. An agent-based model for diffusion of electric vehicles. J. Environ. Psychol. 2017, in press. [Google Scholar] [CrossRef]
- Poghosyan, A.; Greetham, D.V.; Haben, S.; Lee, T.E. Long term individual load forecast under different electrical vehicles uptake scenarios. Appl. Energy 2015, 157, 699–709. [Google Scholar] [CrossRef]
- Lee, T.; Yao, R.; Coker, P. An analysis of UK policies for domestic energy reduction using an agent based tool. Energy Policy 2014, 66, 267–279. [Google Scholar] [CrossRef]
- Yin, H.; Zhou, W.; Li, M.; Ma, C.; Zhao, C. An adaptive fuzzy logic-based energy management strategy on battery/ultracapacitor hybrid electric vehicles. IEEE Trans. Transp. Electrif. 2016, 2, 300–311. [Google Scholar] [CrossRef]
- Lee, T.; Yao, R. Incorporating technology buying behaviour into UK-based long term domestic stock energy models to provide improved policy analysis. Energy Policy 2013, 52, 363–372. [Google Scholar] [CrossRef]
- da Silva Filho, J.I.; Lambert-Torres, G.; Abe, J.M. Uncertainty Treatment using Paraconsistent Logic, 1st ed.; IOS Press: Amsterdam, The Netherlands, 2010. [Google Scholar] [CrossRef]
- Grimm, V.; Berger, U.; Bastiansen, F.; Eliassen, S.; Ginot, V.; Giske, J.; Goss-Custard, J.; Grand, T.; Heinz, S.K.; Huse, G.; Huth, A.; Jepsen, J.U. A standard protocol for describing individual-based and agent-based models. Ecol. Model. 2006, 198, 115–126. [Google Scholar] [CrossRef]
- Paiva, G.F.S.; Silva, D.B.N.; Feijó, C.A. Consumption and socioeconomic classification in Brazil: A study based on the Brazilian family expenditure survey. In Proceedings of the IARIW-IBGE Conference on Income, Wealth and Well-Being in Latin America, Rio de Janeiro, Brazil, 11–14 September 2013. [Google Scholar]
- Cannistraro, A.; Cannistraro, G.; Cannistraro, M.; Galvagno, A.; Trovato, G. Reduced of demand of energy cooling in the CED, “Centers of Processing Data”, with use of free-cooling systems. Int. J. Heat Technol. 2016, 34, 498–502. [Google Scholar] [CrossRef]
- Cannistraro, G.; Cannistraro, M.; Cannistraro, A.; Galvagno, A.; Trovato, G. Evaluation of the convenience of a citizen service district heating for residential use. A new scenario introduced by high efficiency energy system. Int. J. Heat Technol. 2015, 33, 167–172. [Google Scholar] [CrossRef]
- Cannistraro, G.; Cannistraro, M.; Restivo, R. The local media radiant temperature for the calculation of comfort in areas characterized by radiant surfaces. Int. J. Heat Technol. 2015, 33, 115–122. [Google Scholar] [CrossRef]
Figure 1.
Framework of the model (factors are detailed in Section 4.3).
Figure 1.
Framework of the model (factors are detailed in Section 4.3).

Figure 2.
Base scenario: total consumption versus number of iterations.

Figure 3.
Base scenario: mean of investment and satisfaction level.

Figure 4.
Scenario 1: total consumption versus number of iterations.

Figure 5.
Scenario 2: total consumption and mean of investment level.

Figure 6.
Scenario 3: total consumption.
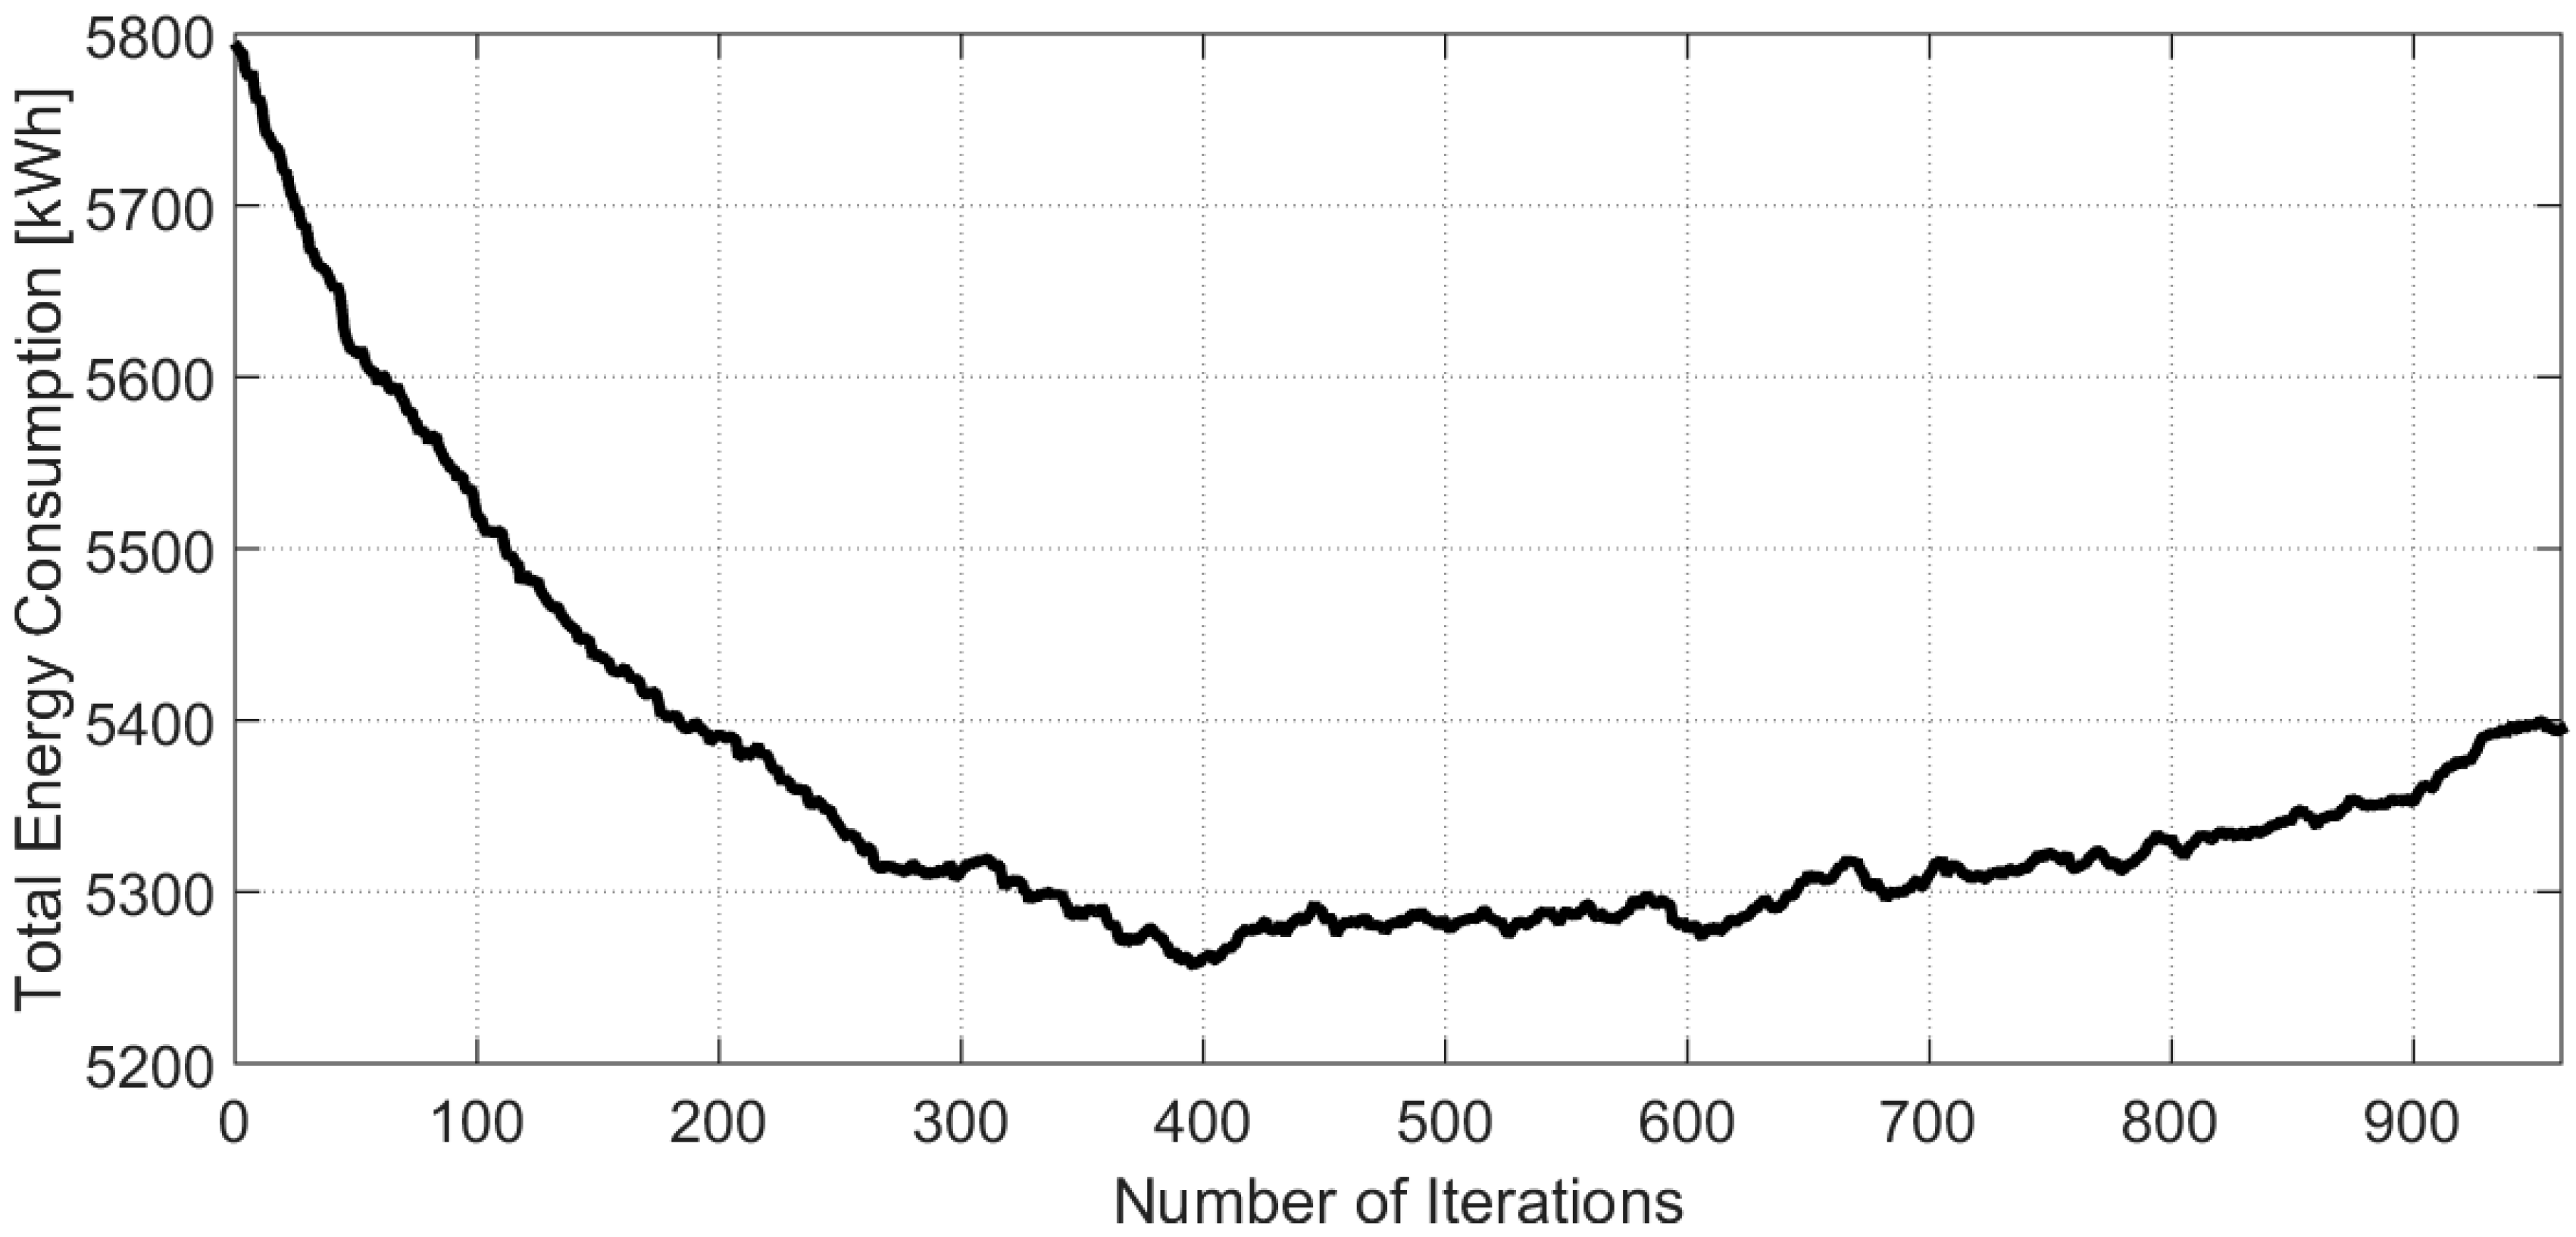
Figure 7.
Scenario 4: total consumption and investment level.


Table 1.
Categories of consumers.
| Category | Main Characteristics | Initial Consumption |
|---|---|---|
| 1 | Not sensible to tariff changes; Invests in energy efficiency when possible; Occasionally change habits due to social interaction | High (500–1000 kWh/month) |
| 2 | Strongly sensible to tariff changes; Does not invest in energy efficiency; Change habits due to social interaction | Low (10–100 kWh/month) |
| 3 | Sensible to tariff changes; May invest in energy efficiency; Sometimes change habits due to social interaction | Average (100–500 kWh/month) |
| 4 | Sensible to tariff changes; Invests often in energy efficiency; Sometimes change habits due to social interaction | Average–High (100–1000 kWh/month) |
Table 2.
Causes for changes in satisfaction level.
| Category | Satisfaction Increase | Satisfaction Decrease |
|---|---|---|
| 1 | Little or no changes | Little or no changes |
| 2 | Consumer reduced energy expenditure | Consumer increased energy expenditure |
| 3 | Consumer reduced energy expenditure | Consumer increased energy expenditure |
| 4 | Consumer reduced energy expenditure; Consumer invested in energy efficiency | Consumer increased energy expenditure; Consumer didn’t invest in energy efficiency |
Table 3.
Price changes.
| Category | Tariff Increase | Tariff Decrease |
|---|---|---|
| 1 | Not or very little sensitive to price changes | Not or very little sensitive to price changes |
| 2 | Decreases consumption significantly | Increases consumption significantly |
| 3; 4 | Decreases consumption depending on own satisfaction level | Increases consumption depending on own satisfaction level |
Table 4.
Social interaction scheme.
| Category Affected | Category that Affects (Consumer Met) | |||
|---|---|---|---|---|
| 1 | 2 | 3 | 4 | |
| 1 | - | - | - | Increases investment level |
| 2 | Increases consumption | - | - | - |
| 3 | - | Decreases consumption | Decreases consumption (if the consumer met consumes less) | Increases investment level |
| 4 | Increases consumption | - | Decreases consumption (if the consumer met consumes less) | Increases significantly investment level |
Table 5.
Investment.
| Category | Initial Investment | Behavior after an Investment |
|---|---|---|
| 1 | 40–60% | Will wait a reasonable time to invest again |
| 2 | 0% | Don’t want to invest again in a long time |
| 3 | 15–35% | Will wait a reasonable time to invest again |
| 4 | 65–85% | Will invest again soon |
Table 6.
Simulation scenarios.
| Scenario | Consumers |
|---|---|
| Base | All categories: 4 consumers |
| 1 | Category 1: 10 consumers Categories 2, 3, and 4: 2 consumers |
| 2 | Categories 1, 3, and 4: 2 consumers Category 2: 10 consumers |
| 3 | Categories 1, 2, and 4: 2 consumers Category 3: 10 consumers |
| 4 | Categories 1, 2, and 3: 2 consumers Category 4: 10 consumers |
Table 7.
Parameters.
| Parameter | Category | Value |
|---|---|---|
| CP | 1 | 0 |
| CP | 2 | 2 |
| CSP | 3 | 1 |
| CSP | 4 | 1 |
| SP | 1 | 0 |
| SP | 2 | 10 |
| SP | 3 | 5 |
| SP | 4 | 10 |
| DRAI | 1 | 0.4 |
| DRAI | 2 | 0.2 |
| DRAI | 3 | 0.4 |
| DRAI | 4 | 0.8 |
Table 8.
Total number of social interactions.
| Simulation | Total Number of Interactions among Customers | Correlation (R2) between Electricity Consumption and Total Number of Interactions |
|---|---|---|
| Base Case | 106.03 | 0.970 |
| Scenario 1 | 90.49 | 0.994 |
| Scenario 2 | 52.25 | 0.991 |
| Scenario 3 | 143.4 | −0.554 |
| Scenario 4 | 158.54 | −0.879 |
© 2017 by the authors. Licensee MDPI, Basel, Switzerland. This article is an open access article distributed under the terms and conditions of the Creative Commons Attribution (CC BY) license (http://creativecommons.org/licenses/by/4.0/).
Share and Cite
MDPI and ACS Style
Siebert, L.C.; Sbicca, A.; Aoki, A.R.; Lambert-Torres, G. A Behavioral Economics Approach to Residential Electricity Consumption. Energies 2017, 10, 768. https://doi.org/10.3390/en10060768
AMA Style
Siebert LC, Sbicca A, Aoki AR, Lambert-Torres G. A Behavioral Economics Approach to Residential Electricity Consumption. Energies. 2017; 10(6):768. https://doi.org/10.3390/en10060768
Chicago/Turabian StyleSiebert, Luciano C., Adriana Sbicca, Alexandre Rasi Aoki, and Germano Lambert-Torres. 2017. "A Behavioral Economics Approach to Residential Electricity Consumption" Energies 10, no. 6: 768. https://doi.org/10.3390/en10060768
Note that from the first issue of 2016, this journal uses article numbers instead of page numbers. See further details here.