
Optimization of Battery Capacity Decay for Semi-Active Hybrid Energy Storage System Equipped on Electric City Bus

1
College of Electrical and Electronics Engineering, Harbin University of Science and Technology, Harbin 150000, China
2
State Key Laboratory of Automotive Safety and Energy, Tsinghua University, Beijing 100084, China
*
Author to whom correspondence should be addressed.
Energies 2017, 10(6), 792; https://doi.org/10.3390/en10060792
Submission received: 9 May 2017
/
Revised: 1 June 2017
/
Accepted: 6 June 2017
/
Published: 9 June 2017
(This article belongs to the Special Issue Advanced Energy Storage Technologies and Their Applications (AESA))
Abstract
:In view of severe changes in temperature during different seasons in cold areas of northern China, the decay of battery capacity of electric vehicles poses a problem. This paper uses an electric bus power system with semi-active hybrid energy storage system (HESS) as the research object and proposes a convex power distribution strategy to optimize the battery current that represents degradation of battery capacity based on the analysis of semi-empirical LiFePO4 battery life decline model. Simulation results show that, at a room temperature of 25 °C, during a daily trip organized by the Harbin City Driving Cycle including four cycle lines and four charging phases, the percentage of battery degradation was 9.6 × 10⁻³%. According to the average temperature of different months in Harbin, the percentage of battery degradation of the power distribution strategy proposed in this paper is 3.15% in one year; the electric bus can operate for 6.4 years until its capacity reduces to 80% of its initial value, and it can operate for 0.51 year more than the rule-based power distribution strategy.

1. Introduction
As the sole power source in a traditional electric vehicle, a battery needs to satisfy the power and energy demands of a bus under different operating conditions. When the battery is repeatedly over-charged and over-discharged in the long-term operating, the battery degradation will be accelerated. Furthermore, when the battery is operated at low temperature, its capacity degradation is more significant. The hybrid energy storage system (HESS) is composed of a battery and super capacity (SC); the battery provides the required energy and the SC satisfies the instantaneous power requirements, can effectively inhibit the battery charge and discharge current changes, and optimizes the working conditions of the energy system [1].
Currently, experts and scholars in the field of electric vehicle hybrid energy storage research are focused on the modeling and performance of the system components, system parameters matching, power distribution, etc. In terms of system component modeling and experimentation, Luo et al. [2] derived and verified a driving cycle life prediction model for LiFePO4 battery based on the experimental verification of the existing capacity decay model for LiFePO4 under a constant current charge/discharge condition. Abeywardana et al. [3] proposed a new type of inverter combined with boost circuits used in HESS, which eliminates the high current injected into the drive motor as compared to conventional controllers that eliminate the equivalent series resistance of the inverter. Henson et al. [4] conducted a comparative study of the battery/SC with different depths of discharge (DODs) for minimizing the cost of the HESS. Xiong et al. [5,6] used different algorithms to estimate the relationship of the voltage to the state-of-charge (SOC) and capacity of lithium ion battery, and they also validated the accuracy of the method through hardware-in-the-loop experiments. In terms of system parameter matching and power distribution, Mid-Eum et al. [7] used the convex optimization method to optimize the power loss and battery power fluctuations considering the real-time dynamic load to propose a method for calculating the SC reference voltage. Song et al. [8,9] proposed a new semi-active topology; the operation cost of the HESS, including the battery degradation cost and electricity cost, is minimized by using the dynamic programming (DP) approach. Further, they studied four topologies and proposed a rule-based power distribution strategy with four kinds of topologies based on the optimization results. Hu et al. [10] conducted energy efficiency analysis and component selection of the plug-in hybrid power system using convex optimization.
In summary, there have been studies related to the parameter matching and system control of HESS facing battery degradation. However, to the best of our knowledge, there are no published papers that combine the climatic conditions in northern China and the corresponding urban driving cycle operating conditions to optimize the functioning of the HESS. In order to attain the full potential of the HESS to enhance the battery life of electric buses under local conditions, in this study, we considered the electric bus operating in Harbin, China as an example, and proposed a method to optimize charge/discharge current of battery through convex optimization considering the average monthly temperature change in one year.
This paper is organized as follows. In Section 2, we analyze the configuration and working modes of the HESS. In Section 3, we introduce the models of LiFePO4 batteries, SCs, and vehicle. Section 4 presents a convex optimization power distribution strategy based on the semi-empirical model of battery degradation. In Section 5, the simulation results and operating years were analyzed and the results are compared with those of the rule-based strategy.
2. Analysis of Configuration and Working Modes of Hybrid Energy Storage System
As the main energy source of electric vehicles, energy-based batteries have the disadvantages of low power density and high capacity degradation [11]. In order to satisfy the peak power demand, the power density of batteries should be sufficiently high; further, considering a battery that is the only power source of a traditional electric car, in principle, the only way to increase the power density of the batteries is to increase the number of batteries. Thus, it will result in high cost and high battery degradation. However, the SCs have characteristics of high power density and low capacity degradation. A combination of the battery and SC satisfies power and energy requirements, as well as the different performance requirements of the vehicles.
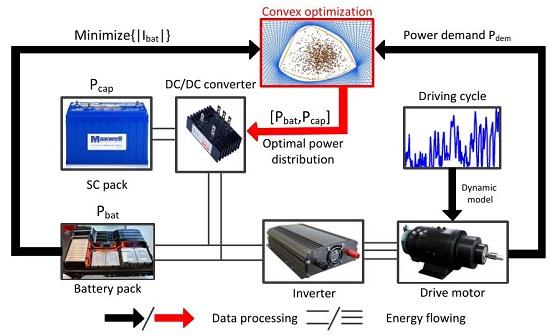
According to the different connections between the battery, SC, and DC/DC converter, the HESS can be classified into three major types, namely, fully active, passive, and semi-active, as shown in Figure 1. In the fully active HESSs, both the battery and SC are connected to the DC bus via a DC/DC converter; two DC/DC converters can simultaneously control the output power of the battery and the SC. Further, it has good control margins. However, a fully active HESS has low system efficiency and a complicated system structure owing to the existence of the two converters; it also increases the system cost owing to the additional cost of the DC/DC converter. Therefore, the fully active topology can achieve a good control effect, but at the expense of system efficiency, complexity, and cost [12]. In the passive topology, the battery and SC are directly connected to the DC bus and the system structure is simple. Owing to the absence of a converter, the system efficiency of the passive topology is the highest, whereas it is uncontrollable of the energy flowing [13]. In the semi-active topology, either the battery or the SC is connected to the DC/DC converter through a unique converter to control the distribution of the output power of the two energy sources. Since the DC bus is connected to one of the battery and SC directly, a fast DC/DC converter is required to maintain DC voltage when the load is changed. However, compared to the fully active and passive topologies, the semi-active topology solved the problems of low efficiency, high cost, uncontrollability, etc. [14].
The topology adopted in this study is shown in Figure 1d. Semi-active topology 2 employs a DC/DC converter to decouple the SC from the battery/DC bus. Furthermore, the DC bus voltage is equal to the battery voltage as they are directly connected. Compared to the other three topologies, the use of SC is more flexible [15], and its working mode is shown in Figure 2. In the driving mode, both the battery and SC provide power to the motor, and the SC satisfies the instantaneous high power requirements. In the braking mode, the energy charging for the SC first through the converter, then the braking energy charging for the battery when the SC is full. For the power conversion between SC and DC bus, a fast three-leg bidirectional DC/DC converter is used. It can be operated in the interleaved manner and has the merit of being commercially available [16,17]. The degradation of the SC is very small and its working life can accommodate millions of charge/discharge cycles. The power demand from the vehicle will be volatile during rapid acceleration and braking; hence, the SC plays the role of power and energy buffer when it is connected between the battery and driving motor through the DC/DC converter.
3. Power System Modeling Based on HESS
3.1. Battery Model
Compared to the Nickel Metal Hydride (Ni-MH) power battery, lead-acid power battery, and the other driving batteries utilized in electric vehicles, the LiFePO4 battery has the characteristic of good battery service life and high energy density. However, its low temperature performance is not outstanding [18]. The parameters of the LiFePO4 cell used in this study are shown in Table 1.
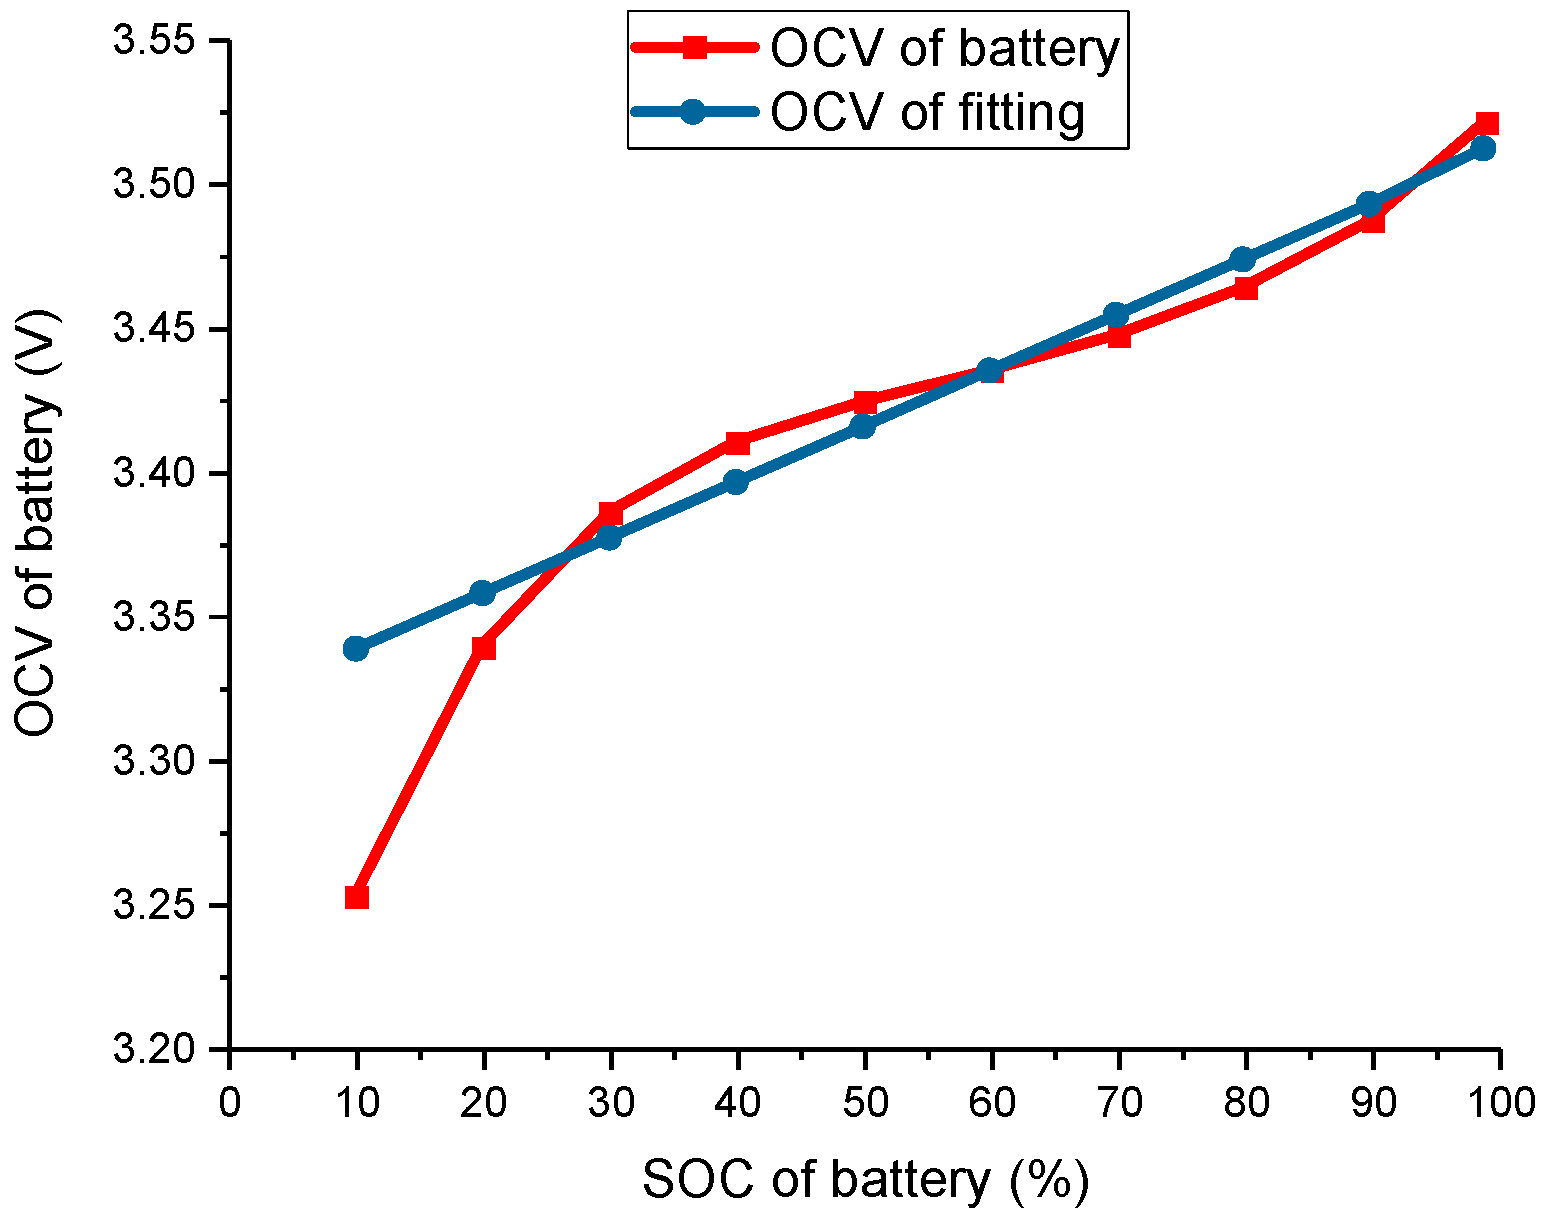
The Rint model shown in Figure 3 was adopted to represent the battery behavior, where Ubat is the battery terminal voltage and Rbat is the resistance of the battery. Since the voltage and SOC are strongly correlated [19] in Equation (1), and in order to adopt the subsequent power distribution strategy, the one-time curve fitting is used to find the functional relationship between the battery open circuit voltage Vbat and its SOC, as shown in Figure 4.
The power consumption on battery internal resistance Pbat_loss can be calculated by the following equation, where Ibat is the current flowing through the battery cell. The charge resistance and discharge resistance of the cell are measured under different SOCs at a room temperature of 25 °C, as shown in Figure 5.
3.2. Super Capacitor Model
The main purpose of using the SC is to protect the battery more effectively; it has the characteristics of high charge and discharge efficiency, long service life, and better low temperature performance. The SC equivalent circuit model is shown in Figure 6, where Rcap is the equivalent series resistance, Icap is the current flowing through the SC cell, Ccap is the capacitance of the SC cell, and Vcap is the Open Circuit Voltage (OCV) of the SC cell. In this study, we use The Maxwell Technologies® company’s super capacity and the parameters of the SC cell are listed in Table 2. Since the SC can achieve millions of charge/discharge cycles, this article ignores the capacity degradation of the SC in the entire process [20]. The open circuit voltage method is used to express the relationship between its open circuit voltage Vcap and SOCcap.
The power consumption on SCs internal resistance Pcap_loss can be calculated by Equation (8), where Icap is the current flowing through the SC cell.
3.3. Battery Degradation Model
The high cost of lithium-ion battery is one of the main factors restricting the development of electric vehicles. The conversion cost of electric vehicles can be reduced by extending the lifespan of lithium-ion battery. In recent years, researchers have made significant efforts to calculate and predict the degradation of the battery [21,22,23]. In Ref. [21], the authors conducted a series of charge/discharge experiments through constant current-constant voltage (CC-CV) and used a scanning electron microscope (SEM) to characterize the structure of cathode, anode, and separator in Li-ion batteries. The results have shown that the capacity fading of batteries can be attributed primarily to the loss of active Li+ and the losses of cathode and anode active materials. In Ref. [22], a large number of charge and discharge experiments were carried out on LiFePO4 batteries, and the semi-empirical formula of battery decay percentage and ambient temperature, charge/discharge rate, and cycling time were obtained. In Ref. [23], the effect of parameters such as the end of charge voltage, DOD, film resistance, exchange current density, and over voltage of the parasitic reaction on the capacity fading and battery performance were studied. However, in summary, it is very difficult to calibrate and parameterize the degree of battery degradation in an electric vehicle during actual operation. Therefore, we considered many factors that affect battery degradation and adopted the semi-empirical model used in Ref. [24]. The semi-empirical formula is as shown in Equation (9).
3.4. Vehicle Model
The vehicle power system model can be used to obtain the power demand of the vehicle at different times during the operation. The power demand of a vehicle should be the output power of the driving wheel for an electric bus with semi-active HESS. The output power of the driving wheel is the product of the demand torque and the required angular velocity, as shown in Equation (12).
In the optimization process, the minimal mileage L of more than 50 km should be considered, obtained at a constant cruising speed v0 (50 km/h) on a flat road [25]. Accordingly, we can deduce the following inequality constraints.
We assume that the maximum required power in the drive mode and brake mode is provided by the SCs (SCs output power in driving mode, and SCs absorb power in braking mode). The following inequality constraints should be satisfied when selecting the number of SCs.
4. Convex Optimal Control Strategy Based on the Battery Degradation
Through the driving cycle, we can calculate the power demand of the bus at every step. In the driving mode, the required power Pdem should be the output power of the drive motor on its output shaft. The electrical power output on the DC bus is equal to the motor output power plus the motor power loss, which is obtained by the fitting. The electrical power output on the DC bus at this time is the total power to be satisfied by the batteries and the SCs (considering the efficiency of DC/DC converter).
Assuming that the SCs are in the same energy storage state at the beginning and end of the driving cycle, the degradation percentage Qloss_sum of the battery is calculated using the following equation.
In order to reduce the computation time in the convex optimization, as shown in Figure 7, the relationship between the battery current Ibat and the battery degradation percentage Qloss is determined at room temperature 25 °C based on Equation (9). Irrespective of the braking or driving modes, Qloss always increases as the charge or discharge current Ibat increases. Hence, the optimization of the entire driving cycle of battery degradation can be equivalent to optimizing the entire driving cycle of the battery current in the absolute value. There is the following relationship:
Therefore, as shown in Equation (18), the equivalent optimization target for the purpose of optimizing the battery degradation could be obtained. According to the constraints of the optimization target in the convex optimization [26], Equation (18) satisfies the requirement that the convex optimization must be a convex function or an affine function for the objective function.
The implementation process of the convex optimization strategy used in this study is shown in Figure 8. In order to satisfy the constraints on the number of battery cells and SC cells in Equations (14) and (15), the number of selected battery and SC cells is nbat = 120 and ncap = 240, respectively. The battery pack and SC pack in the HESS are all grouped by n series and one parallel connection, and the unbalance between the cells is ignored [27]. As the energy source of the vehicle, the LiFePO4 battery pack is not only for the drive motor to provide energy, but also for the super capacitor when SOCcap is low. The SC pack is between the LiFePO4 battery pack and the drive motor, acting as an energy and power buffer, and absorbing the braking energy from the drive motor during braking.
According to the output voltage changes of the battery and the SC cell, we can constrain the output energy range of the battery pack and capacitor group,
where Vbat_min, Vbat_max, Vcap_min, and Vcap_max are the maximum and minimum voltages corresponding to the battery and the SOC of the SC, given by Equation (20).
The range of the output power of the battery and SC pack can be limited according to the maximum charge/discharge current of the battery and SC cell.
The power consumed on the battery pack and the SC pack internal resistance can be calculated from Equation (22).
For the battery pack and the SC pack, it is necessary to satisfy the total power demand in different cases, by satisfying the following equation constraints.
In this study, we use Equation (18) as an optimization target, and the battery pack energy Eb, SC pack energy Ecap, battery pack port output power Pbatopen, and SC pack port output power Pcapopen as the convex optimization variables. The battery pack power Pbat, SC pack power Pcap, battery pack power loss Pbat_loss, and SC pack power loss Pcap_loss are used as the equation constraints of the convex optimization. The overall optimization function is given in Table 4.
According to the description of the convex optimization problem in Ref. [26], the constraint conditions in Table 4 are convex or affine functions; the entire convex optimization problem satisfies the convex optimization requirement, and the convex optimization implementation flow is shown in Figure 9.
5. Simulation and Results Analysis
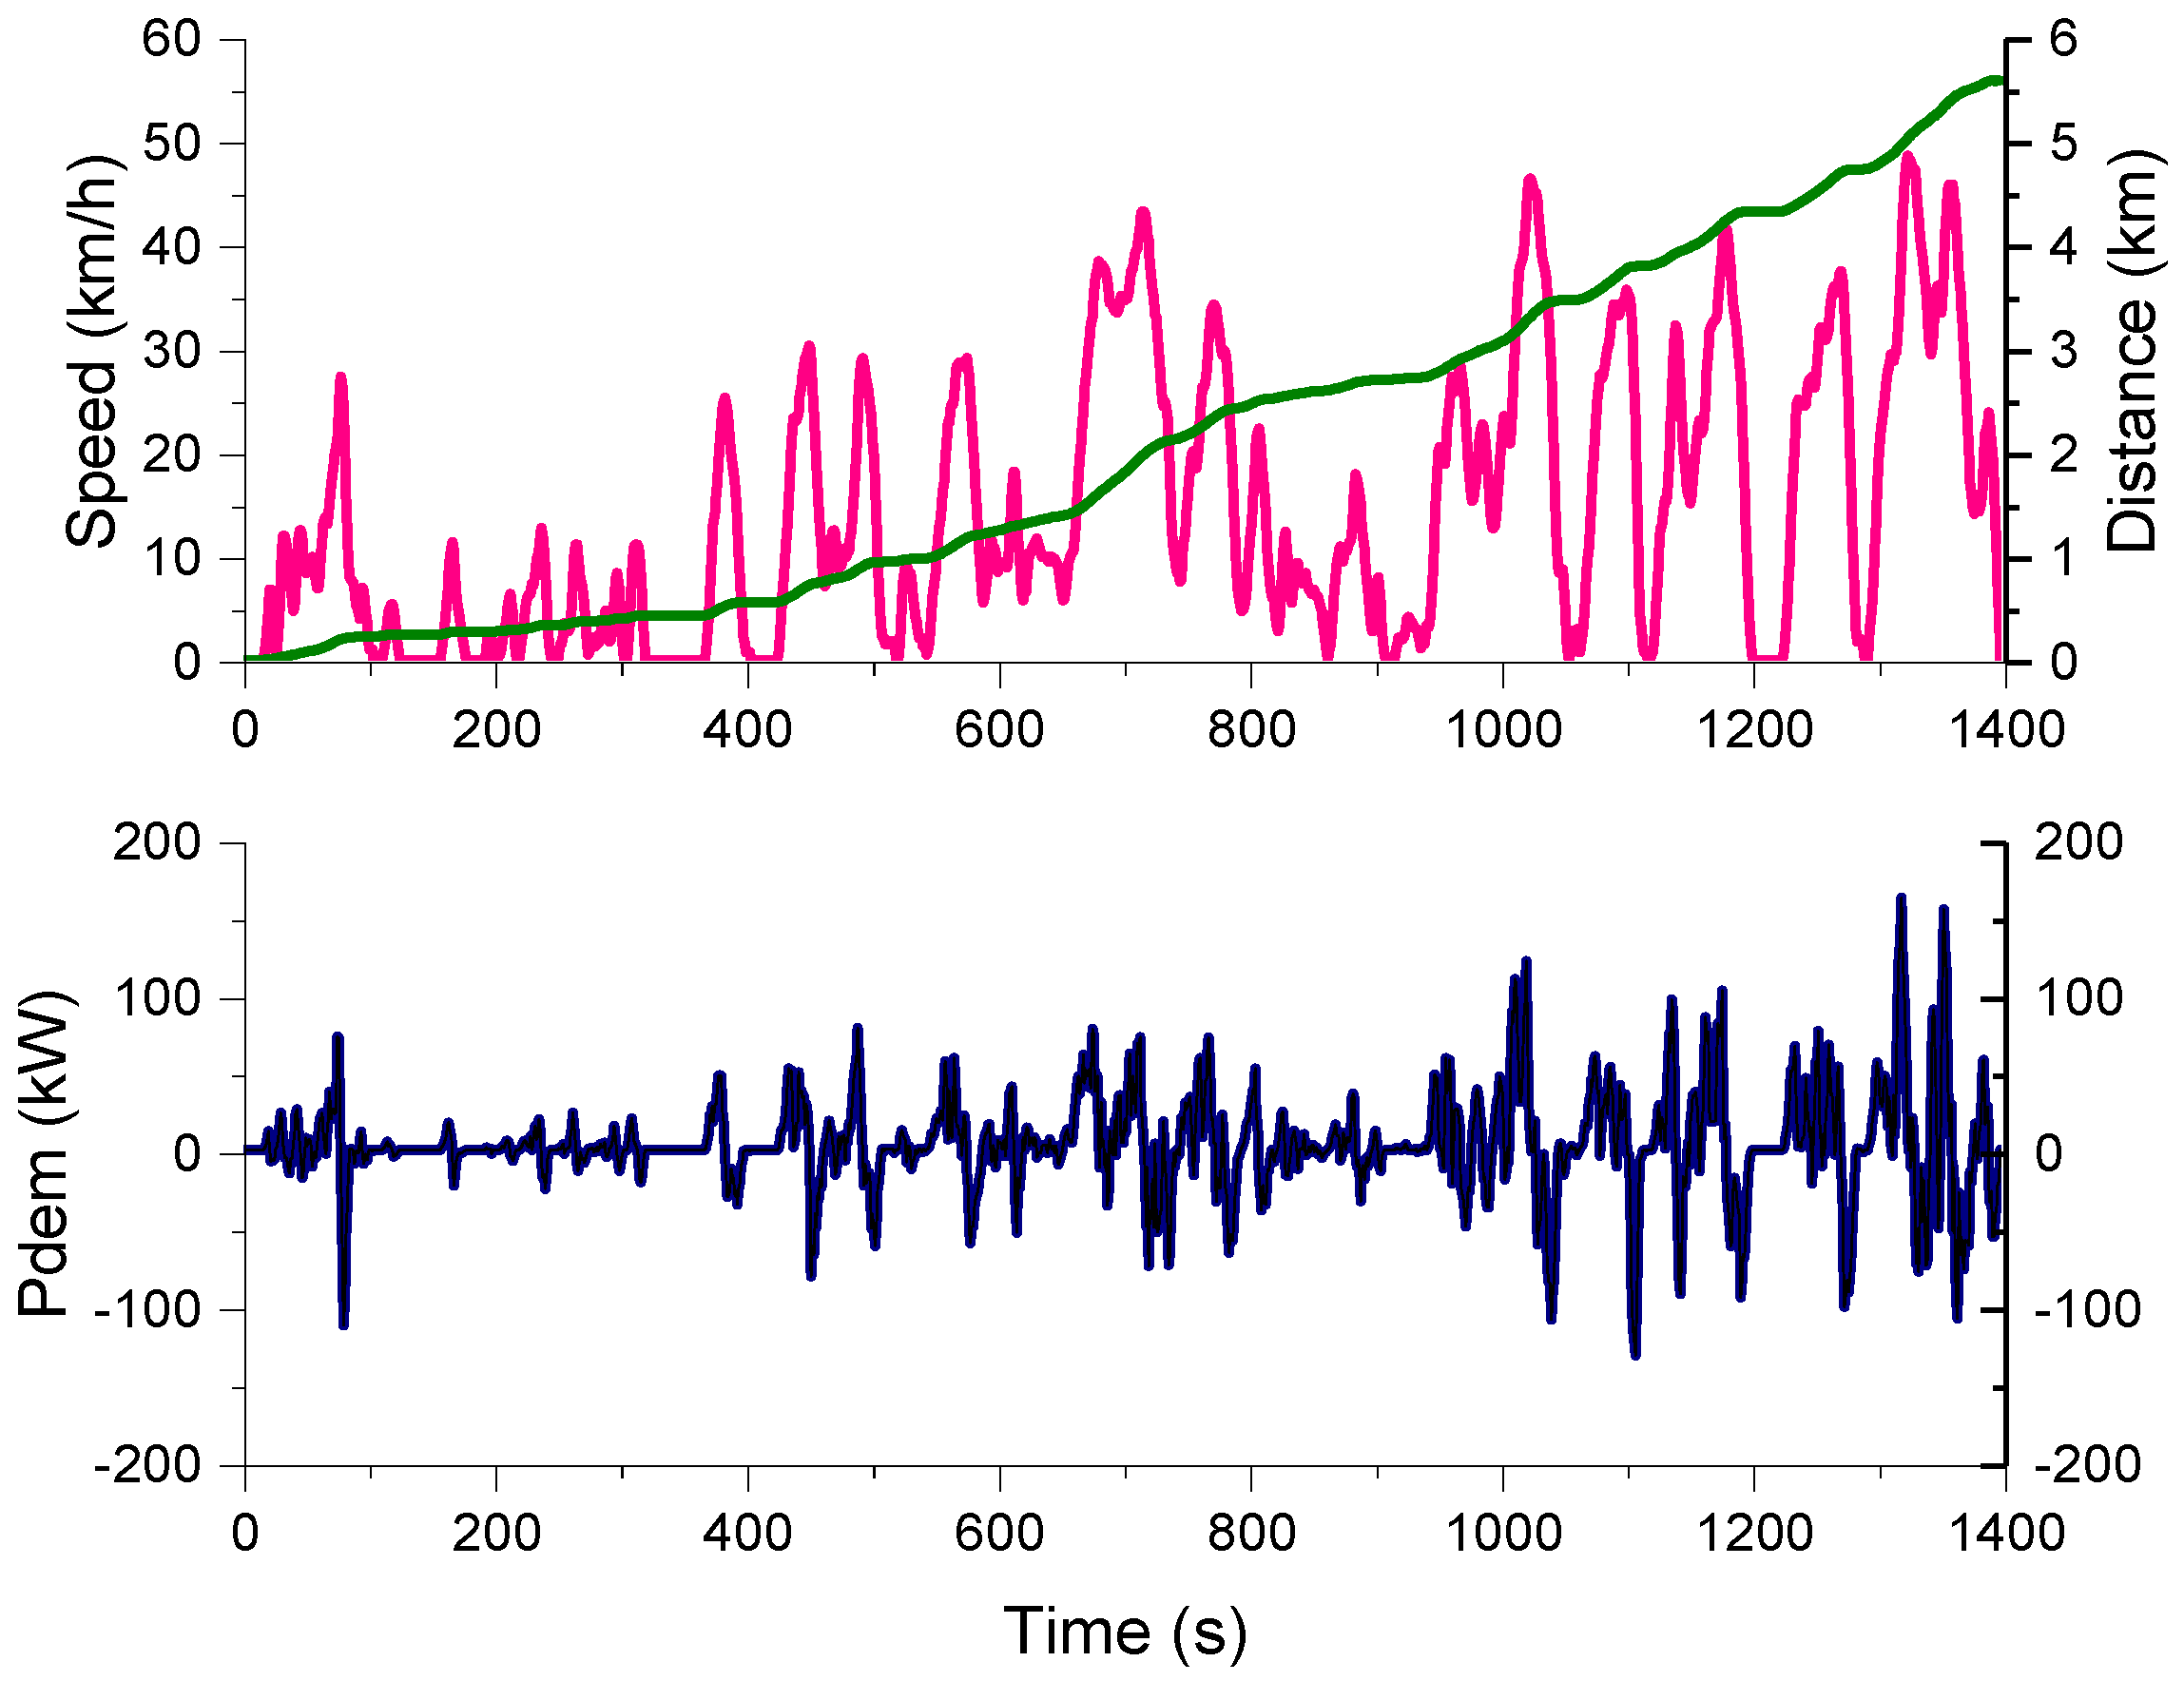
In order to verify the effectiveness of the HESS optimization proposed in this study, we compared its performance with that of the rule-based power distribution strategy under the Harbin city driving cycle [28]. The Harbin city driving cycle and the power demand is shown in Figure 10. The convex optimization result is shown in Figure 11. It can be observed that the battery only provides a small range of demand for power fluctuations, whereas the SC satisfies instantaneous high power requirements. When the required power is greater than a certain threshold, the SC and the battery pack together provide the power required. However, owing to the presence of DC/DC converter efficiency and powertrain efficiency, the sum of the power of the battery pack and the SC pack is much greater than the power demand. Furthermore, the same as the result of two efficiency effects, in the braking mode, the SC cannot recover all the braking energy. In addition, as shown in Figure 11b, the battery only provides a small demand for power and the SC satisfies instantaneous high power requirements; this can be reflected in the relationship between power demand and SC power. When the power demand fluctuates in the range of 0 kW to 20 kW, the SC does not output power. This part of the power is borne by the battery and when the power demand fluctuates in the range of 20 kW to the highest power demand, the SC satisfies the power demand. Owing to the efficiency of DC/DC converter and the efficiency of the powertrain, the slope of the fitted line k is slightly greater than 1 when the demand power is greater than 20 kW. When the power demand fluctuates in the negative range, the SC absorbs the braking energy, and the slope of the fitting line k is less than 1 owing to the DC/DC converter efficiency and the efficiency of the powertrain. The entire convex optimization process consumes 1.33 × 10⁷ J, i.e., approximately 3.70 kWh. Since the optimization target is absolute value of the battery current, while the terminal voltage drop of the battery pack is very small in one driving cycle. Therefore, the optimization goal also has a significant role in optimizing the battery energy consumption.
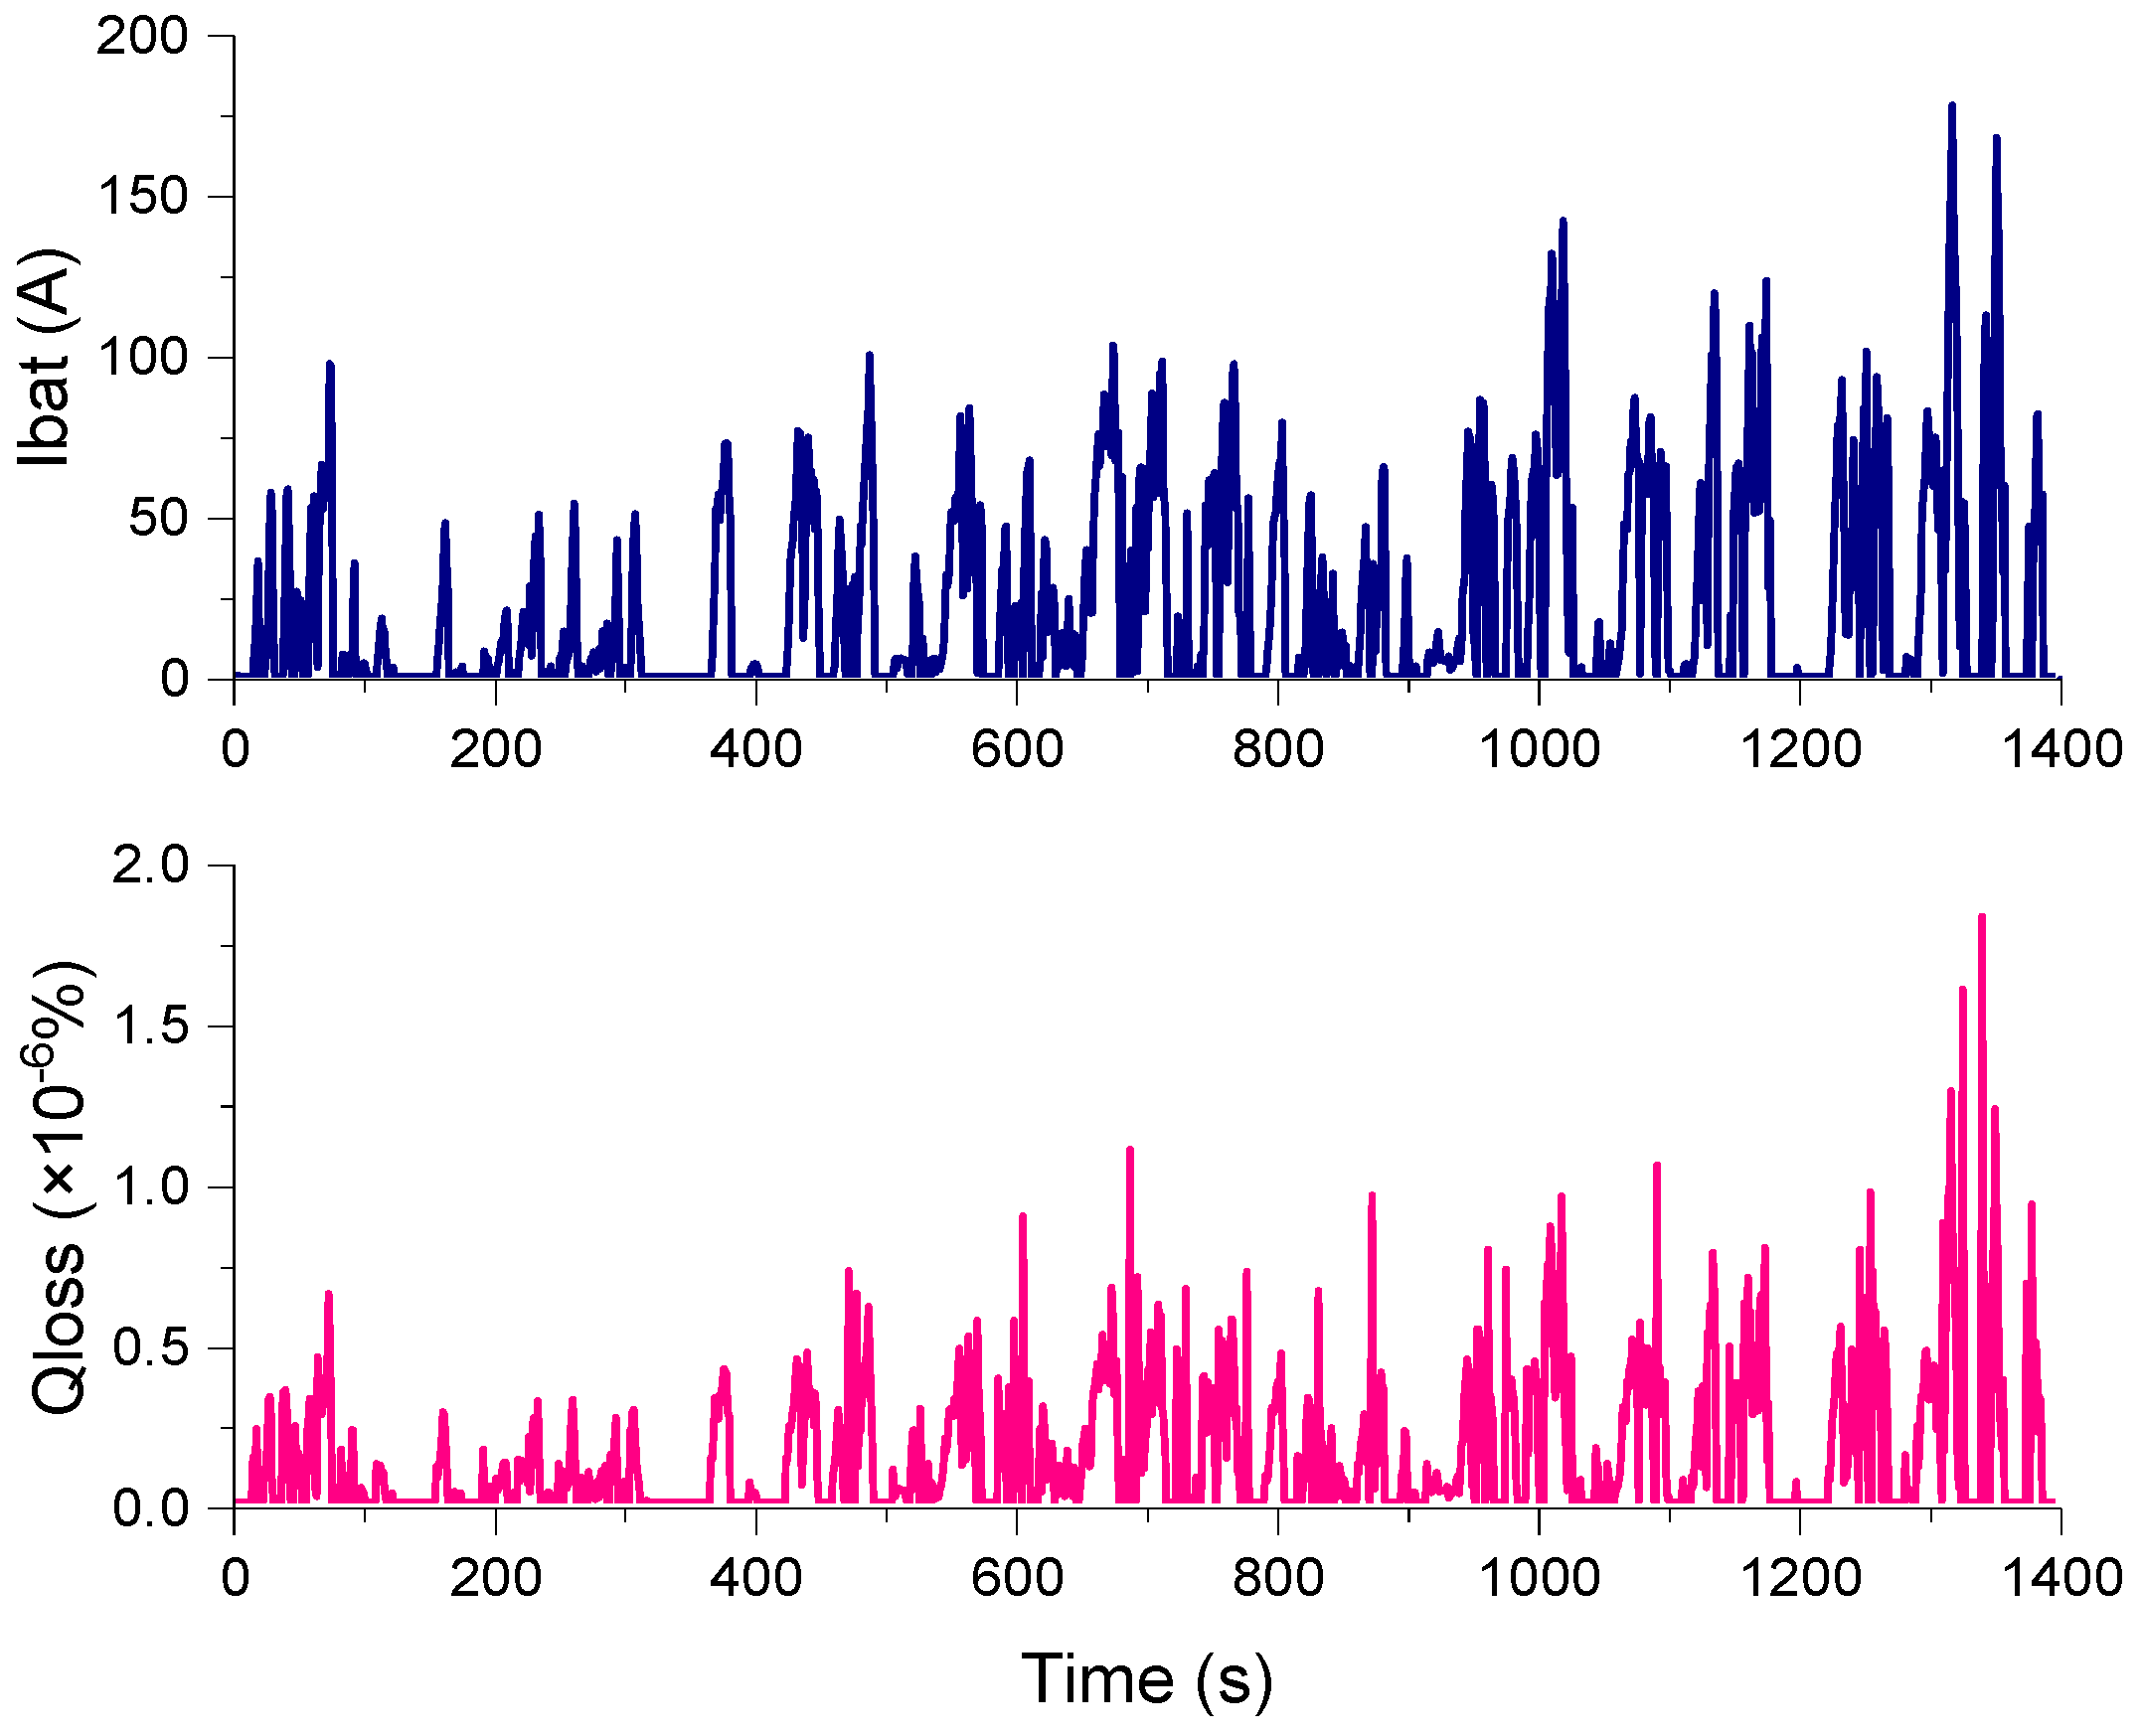
Figure 12 shows the battery current and battery degradation percent at a room temperature of 25 °C based on convex optimization. In the latter part of the driving cycle, the acceleration/deceleration of the vehicle is violent; hence, the battery current undergoes greater fluctuations. However, the maximum value of the battery current does not exceed 200 A. The battery runs within 1C discharge magnification rate altogether. In addition, according to the relationship between the battery charge/discharge current Ibat and the battery degradation percentage Qloss in Figure 7, it can be observed that the battery current has approximately an exponential relationship with the battery degradation percentage Qloss when the battery current is greater than zero. Therefore, Qloss obtained in Figure 12 is more intense than the battery current fluctuation. At room temperature of 25 °C, the battery degradation percent in one driving cycle is 2.16 × 10⁻⁴%.
In order to verify the effectiveness of the proposed optimization method in this paper for the electric bus equipped with semi-active HESS, it is compared with the rule-based strategy in Harbin driving cycle. The rule-based strategy is shown in Figure 13 [9,29]. When the power demand Pdem ≥ 0, the battery only provides the threshold power Pthr, and when Pdem > Pthr, the battery will provide the part of power demand exceed according to the SOCcap. When the power demand Pdem < 0, it is also need to charge for SC according to the charge of state of the SC, when the SC pack is fully charged and then to the battery pack for energy braking. According to the characteristics of the SC power and the power demand relationship obtained from the convex optimization, the threshold power Pthr in the rule-based strategy is set to 20 kW, and the same power system model and initial parameters are used to calculate the power distribution based on the rules strategy, as shown in Figure 14.
Figure 15 shows the battery current and battery degradation percent at 25 °C based on the rule strategy. In the latter part of the driving cycle, it can be seen that the SC obtained the energy from braking cannot satisfy the power demand; this part of the power demand difference can only be borne by the battery. Therefore, the battery experiences a large output power fluctuation. The battery current and battery decay percentages have several significant peaks in the later stages based on the rule strategy. However, in contrast, the SC satisfies the instantaneous high power ripple and the battery outputs a smaller power fluctuation in the convex optimization. According to the energy management strategy evaluation method in Ref. [30], the standard deviation of the battery current in two strategies has been calculated, as shown in Equation (25), where the Ib_avg is the average of battery current, s is the standard deviation of battery current.
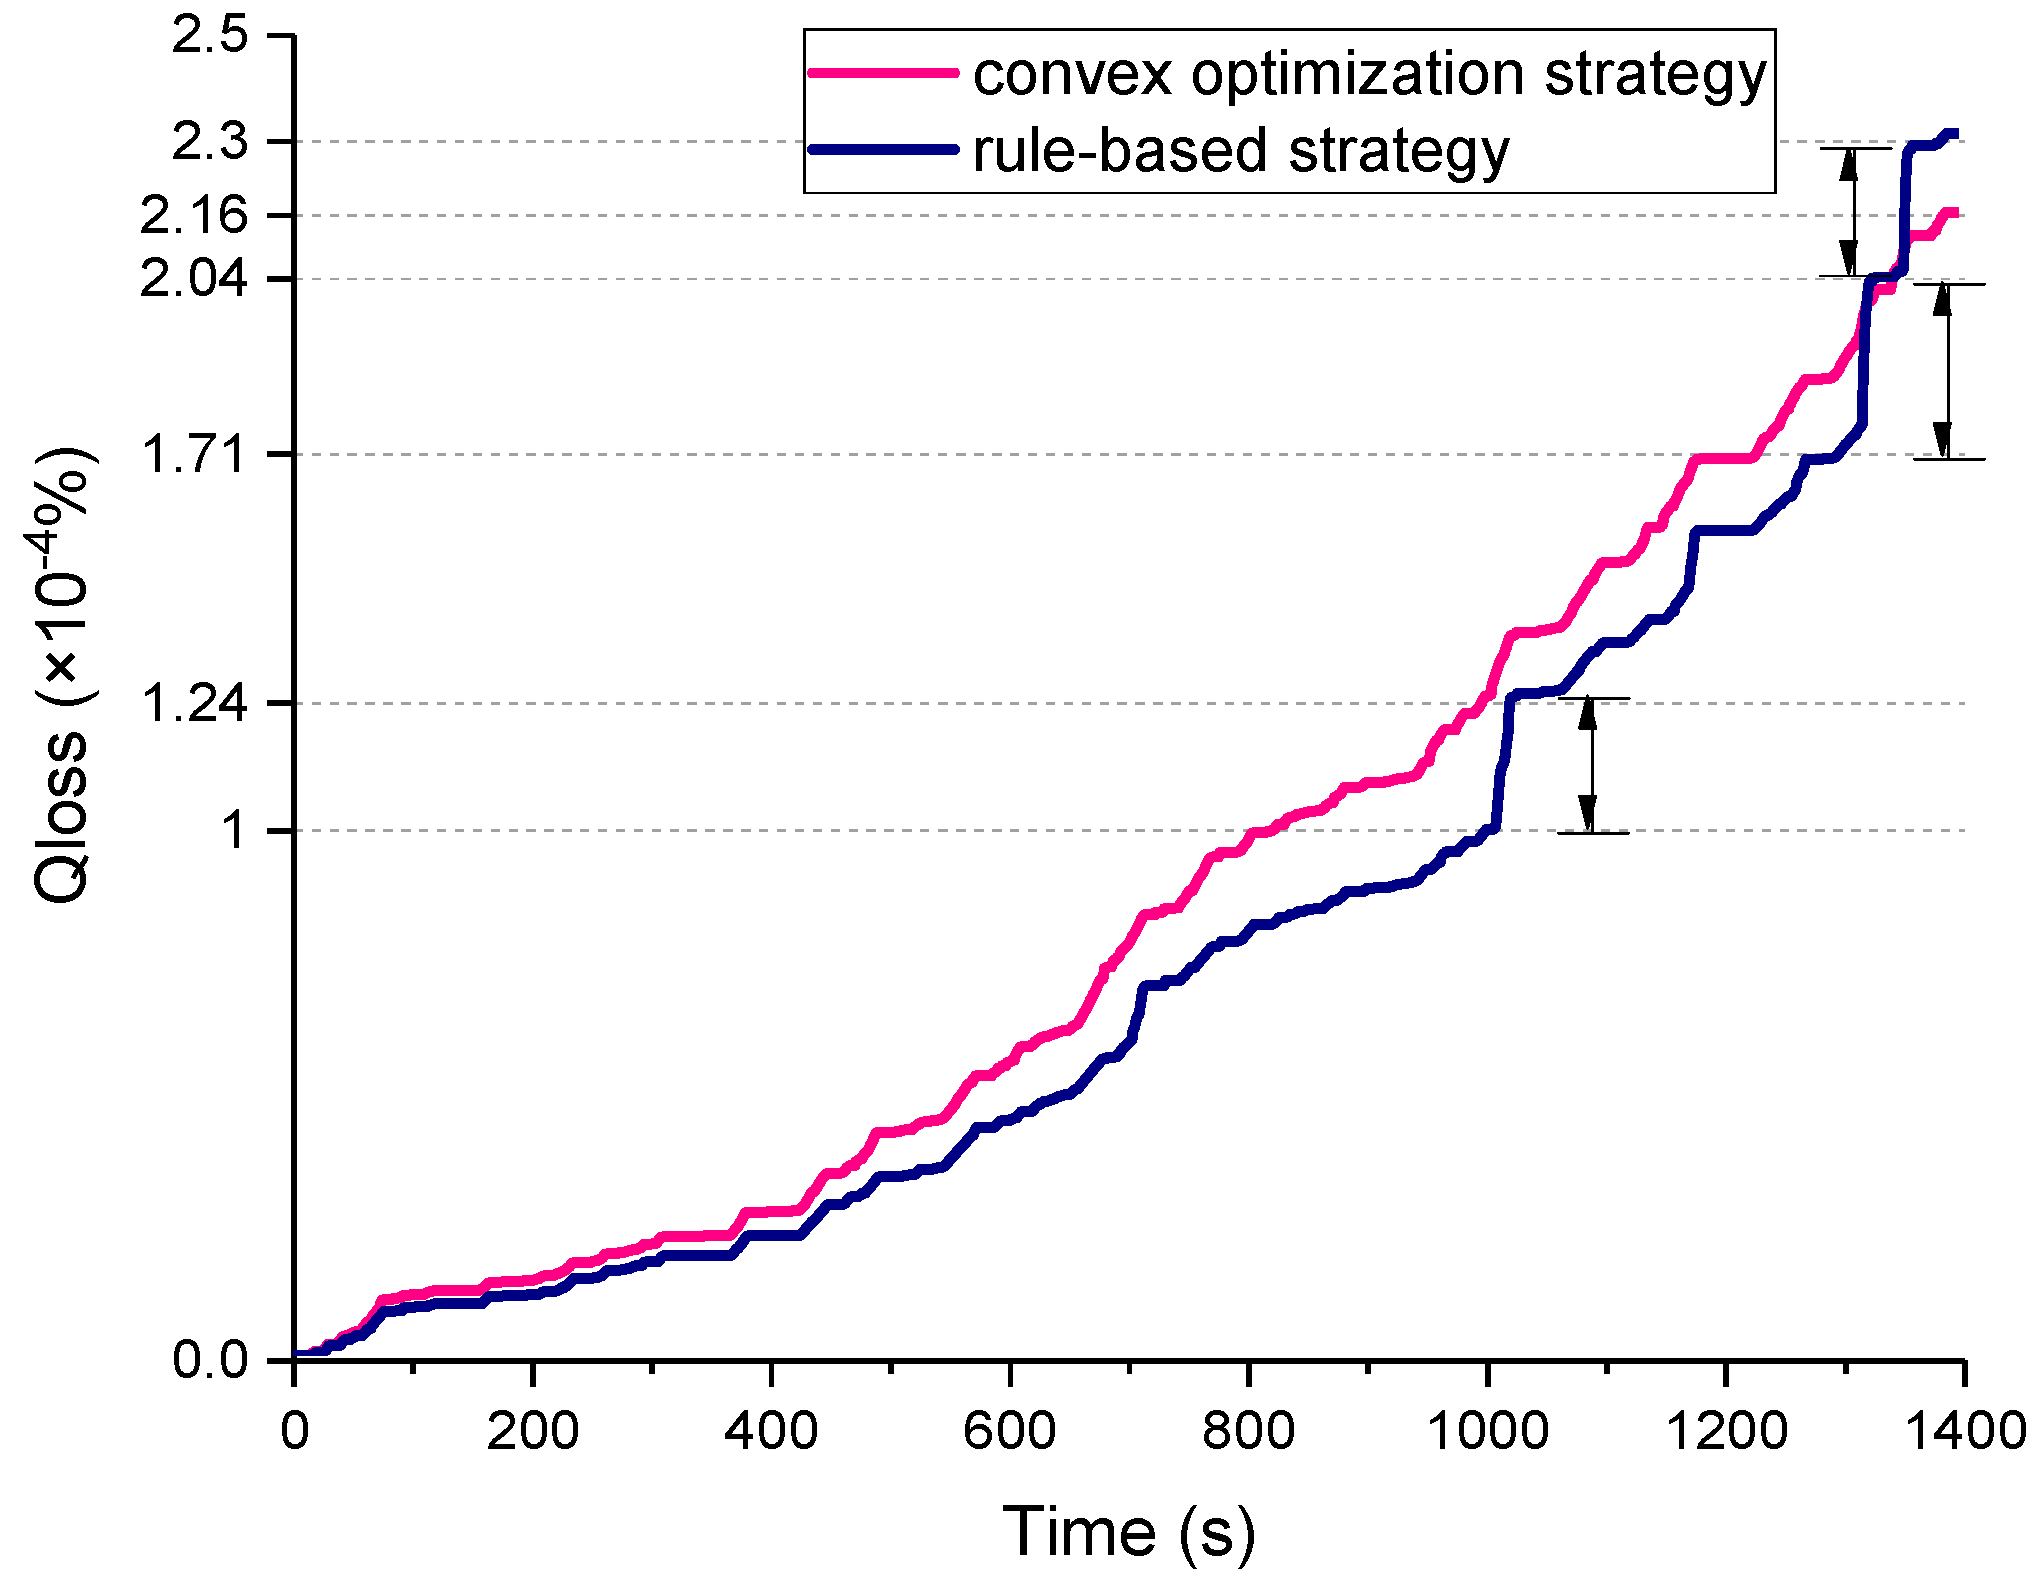
The standard deviation of the battery current based on the convex optimization strategy and rule-based strategy is 31.03 and 43.99, respectively, the battery current fluctuation based on the convex optimization strategy is smaller than rule-based strategy. Figure 16 shows the battery capacity degradation curve based on convex optimization and rule-based strategy. At approximately t = 1050 s, t = 1320 s, and t = 1360 s, the battery degradation percent based on the rule strategy has three significant rising intervals, which correspond to three battery current pulses based on the rules strategy; further, it can be reflected from the battery current and battery degradation percentage result of the rule-based strategy shown in Figure 15. In contrast, the battery power fluctuation is smoother when based on the convex optimization strategy, thus protecting the battery better. The rule-based strategy consumes 1.35 × 10⁷ J in one driving cycle, i.e., approximately 3.75 kWh, and the percentage of battery degradation is 2.31 × 10⁻⁴%.
In order to further reflect the real situation of a bus running on Harbin city roads in a day, and quantitatively analyze the potential of convex optimization relative to the rule-based strategy to improve battery life, we use nine Harbin city driving cycles (total 50.4 km) to simulate a cycle line: a bus from the bus terminal, followed by a cycle line, and subsequently back to the bus terminal. When the bus arrives at the terminal again, the CC-CV is used to recharge the battery. When the battery pack is recharged, the SOCbat returns to 0.9. Table 5 shows the indicators of the battery pack when the bus drives in one cycle line based on the two strategies.
For the LiFePO4 battery pack with 120 cells in series and one in parallel, the SOC of the battery varies from SOCbat = 0.9 to SOCbat = 0.4223 through one cycle line under convex optimization, and the SOC of the battery varies from SOCbat = 0.9 to SOCbat = 0.4112 through one cycle line under rule-based strategy. In the process of the recharge phase, the recharge magnification is set to 1C. The entire recharge state continues for 1561 s in convex optimization and 1598 s in rule-based strategy. After the recharge, the battery SOC of the convex optimization strategy and the rule-based strategy are returned from SOCbat = 0.4223 and SOCbat = 0.4112 to SOCbat = 0.9, respectively. According to the actual operation, the electric bus run four line cycles (approximately 200 km) in one day, and the electric bus needs to recharge the battery four times. Assuming that the battery is fully charged (SOCbat = 0.9) in the first trip every day, the battery SOC change curve based on the convex optimization strategy and rule-based strategy can be obtained as shown in Figure 17.
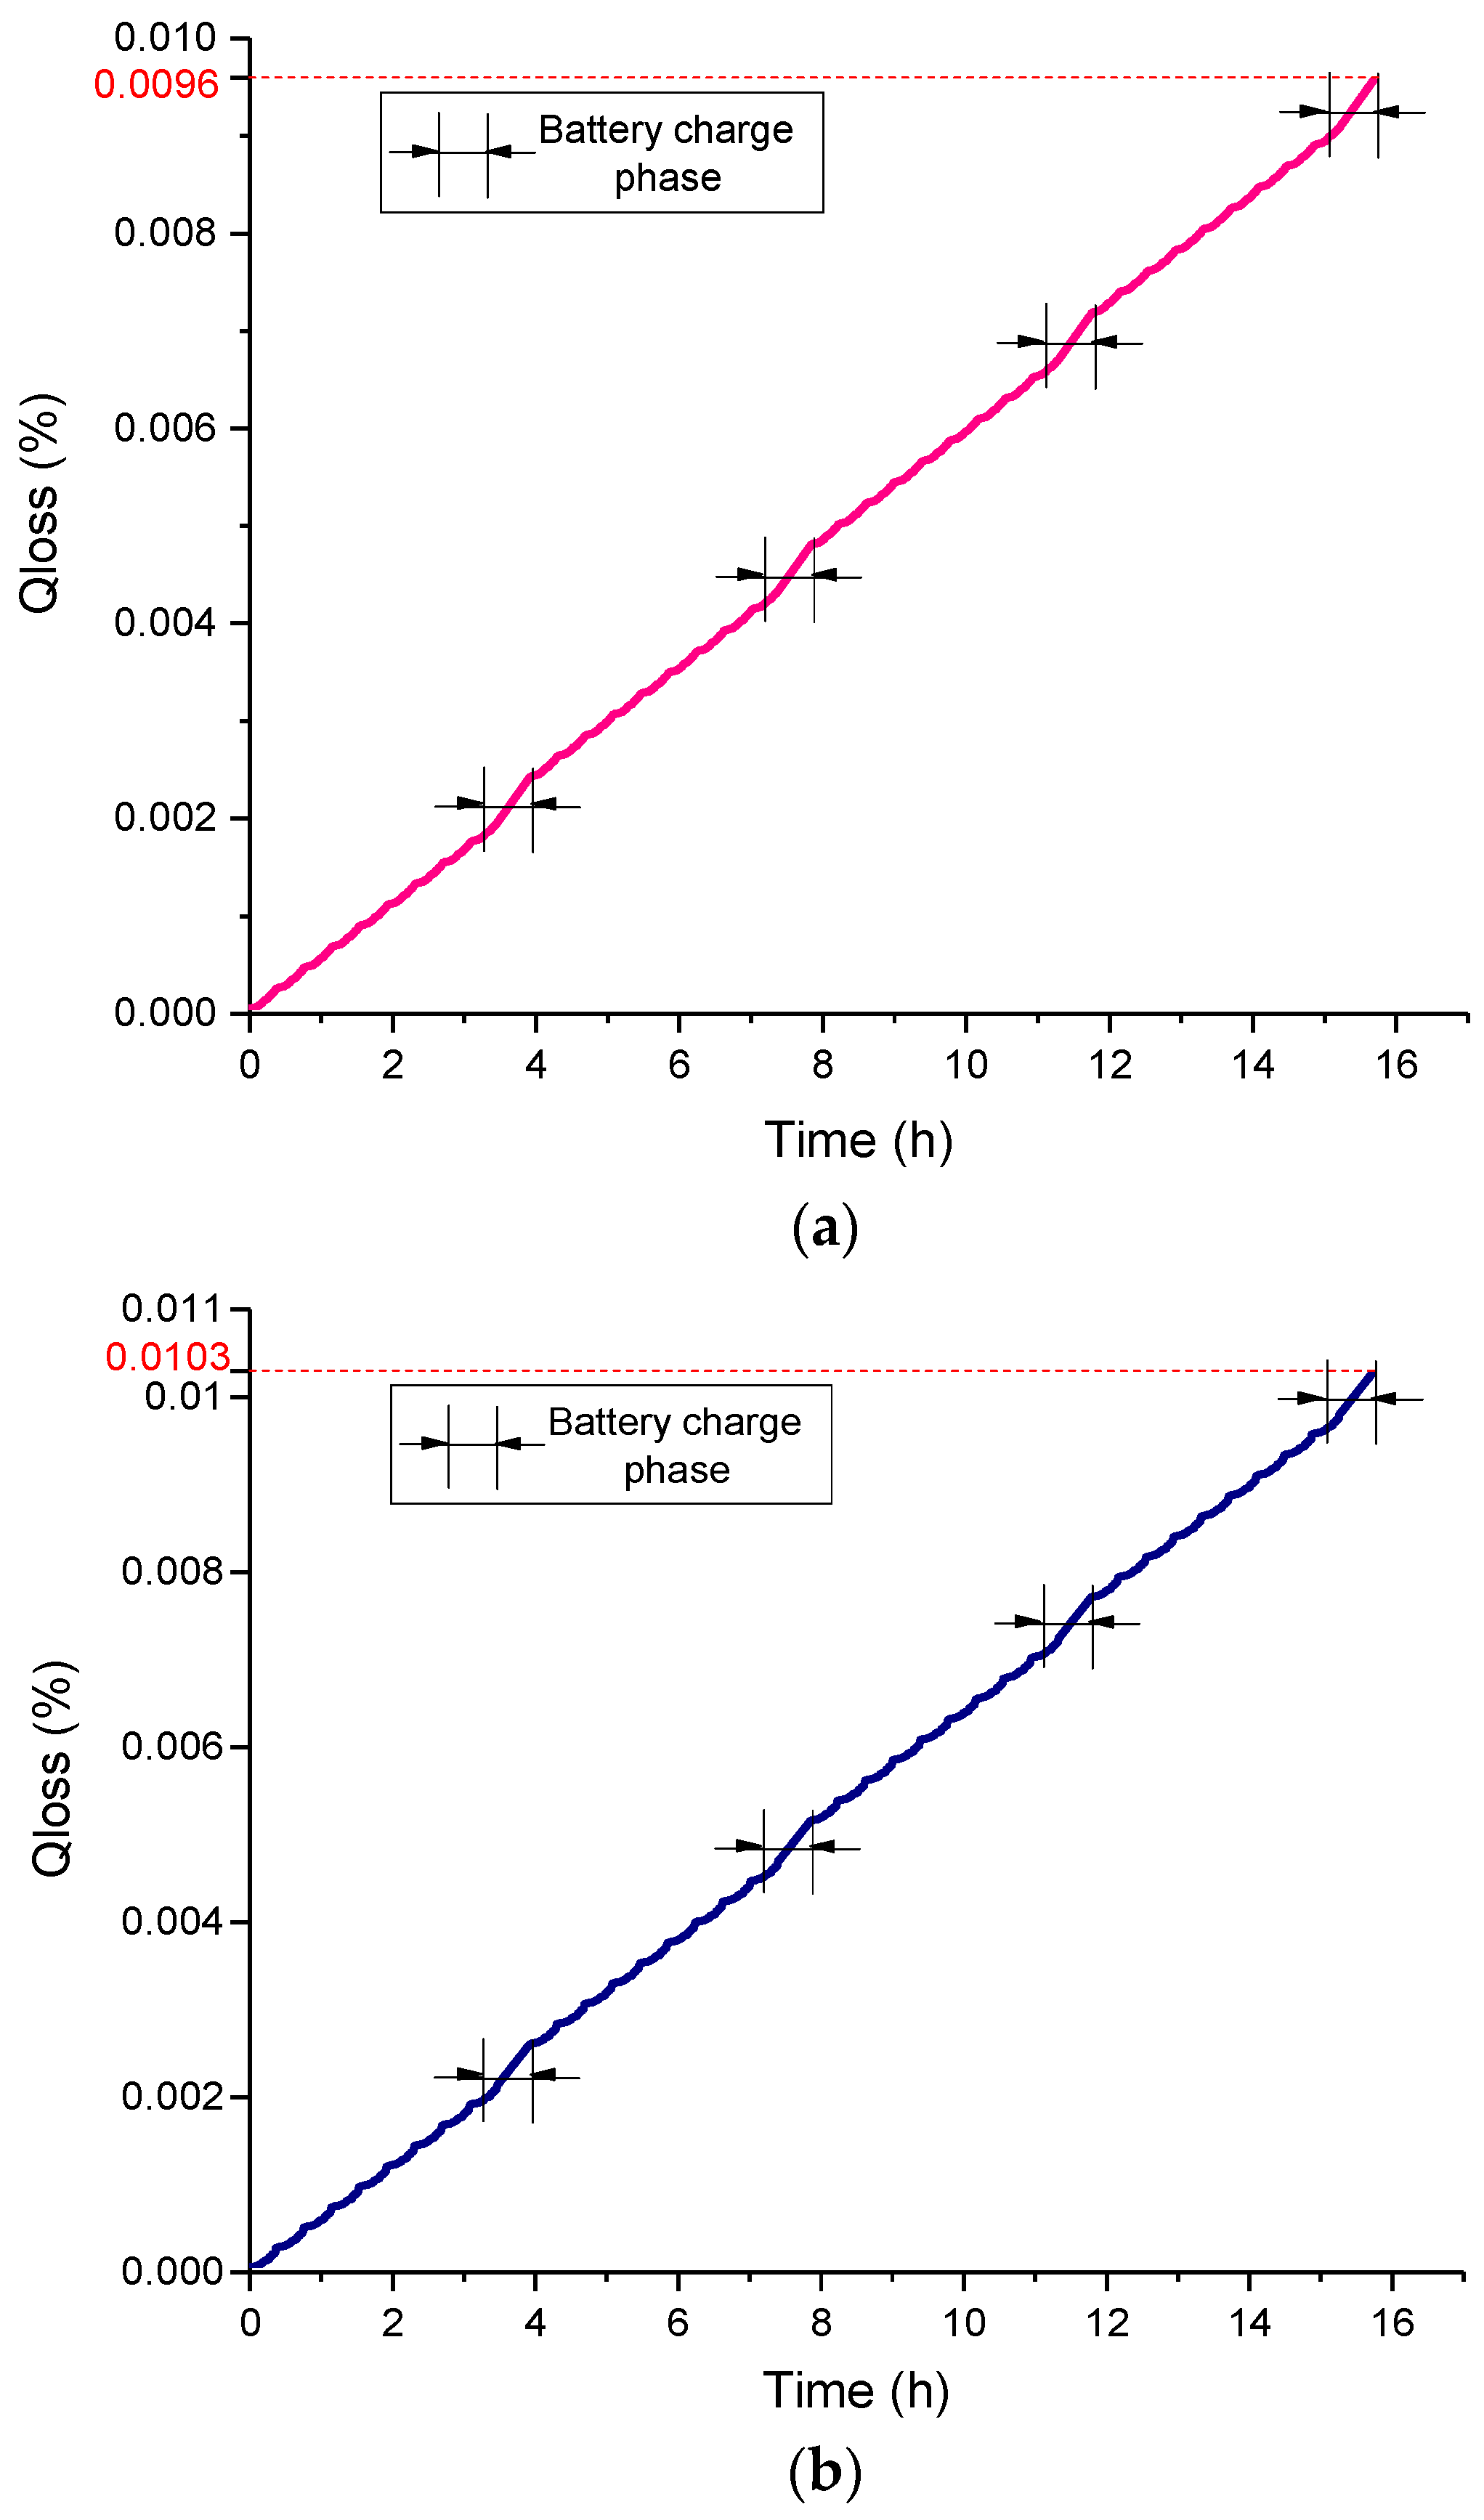
The battery capacity degradation will occur during the entire charge/discharge process. Therefore, we can obtain the battery degradation percentage curve of the battery pack using the semi-empirical model in one day according to the battery charge/discharge situation. At room temperature of 25 °C, Qloss base on the convex optimization strategy and the rules strategy are shown in Figure 18. After a day of operation (four cycle lines and four charging phases), Qloss based on convex optimization is 9.6 × 10⁻³%, and the battery pack can be used for approximately 2.08 × 10³ days when the battery degradation is attenuated to 80% of its initial capacity, whereas Qloss based on rules strategy is 10.3 × 10⁻³%, and the battery pack can be used for approximately 1.94 × 10³ days when the battery is attenuated to 80% of its initial capacity.
Notably, there are two main causes of the greater battery degradation under rule-based strategy: (1) The battery current Ibat based on the convex optimization is more stable; hence, this results in a smaller Qloss than the rule-based strategy, and this is reflected in the comparison of battery degradation under the two strategies shown in Figure 16; (2) Since the rule-based strategy consumes more energy in one day, the battery discharges deeper during operation (SOCbat [0.4223, 0.9] during one cycle line based on convex optimization and SOCbat [0.4112, 0.9] during one cycle line based on rules). Similarly, in order to return the battery back to the initial SOC, the rule-based strategy must be charging deeper than the convex optimized strategy (charging time t = 1561 s based on the convex optimization and t = 1598 s based on the rules). Consequently, the rule-based strategy increases the SOC operating range of the battery used in the same road cycle as compared to the strategy based on the convex optimization, which also increases the percentage of battery capacity degradation.
The battery usage time based on the two strategies is approximately 15 h in one day, but the usage time of the rule-based strategy is slightly longer because the charging time is longer. In Figure 18, Qloss slope of the battery charging phase is larger than Qloss at the time of traveling on the road; hence, the battery degradation caused by charging the battery at a charging magnification of 1C is greater than that caused by running on the road.
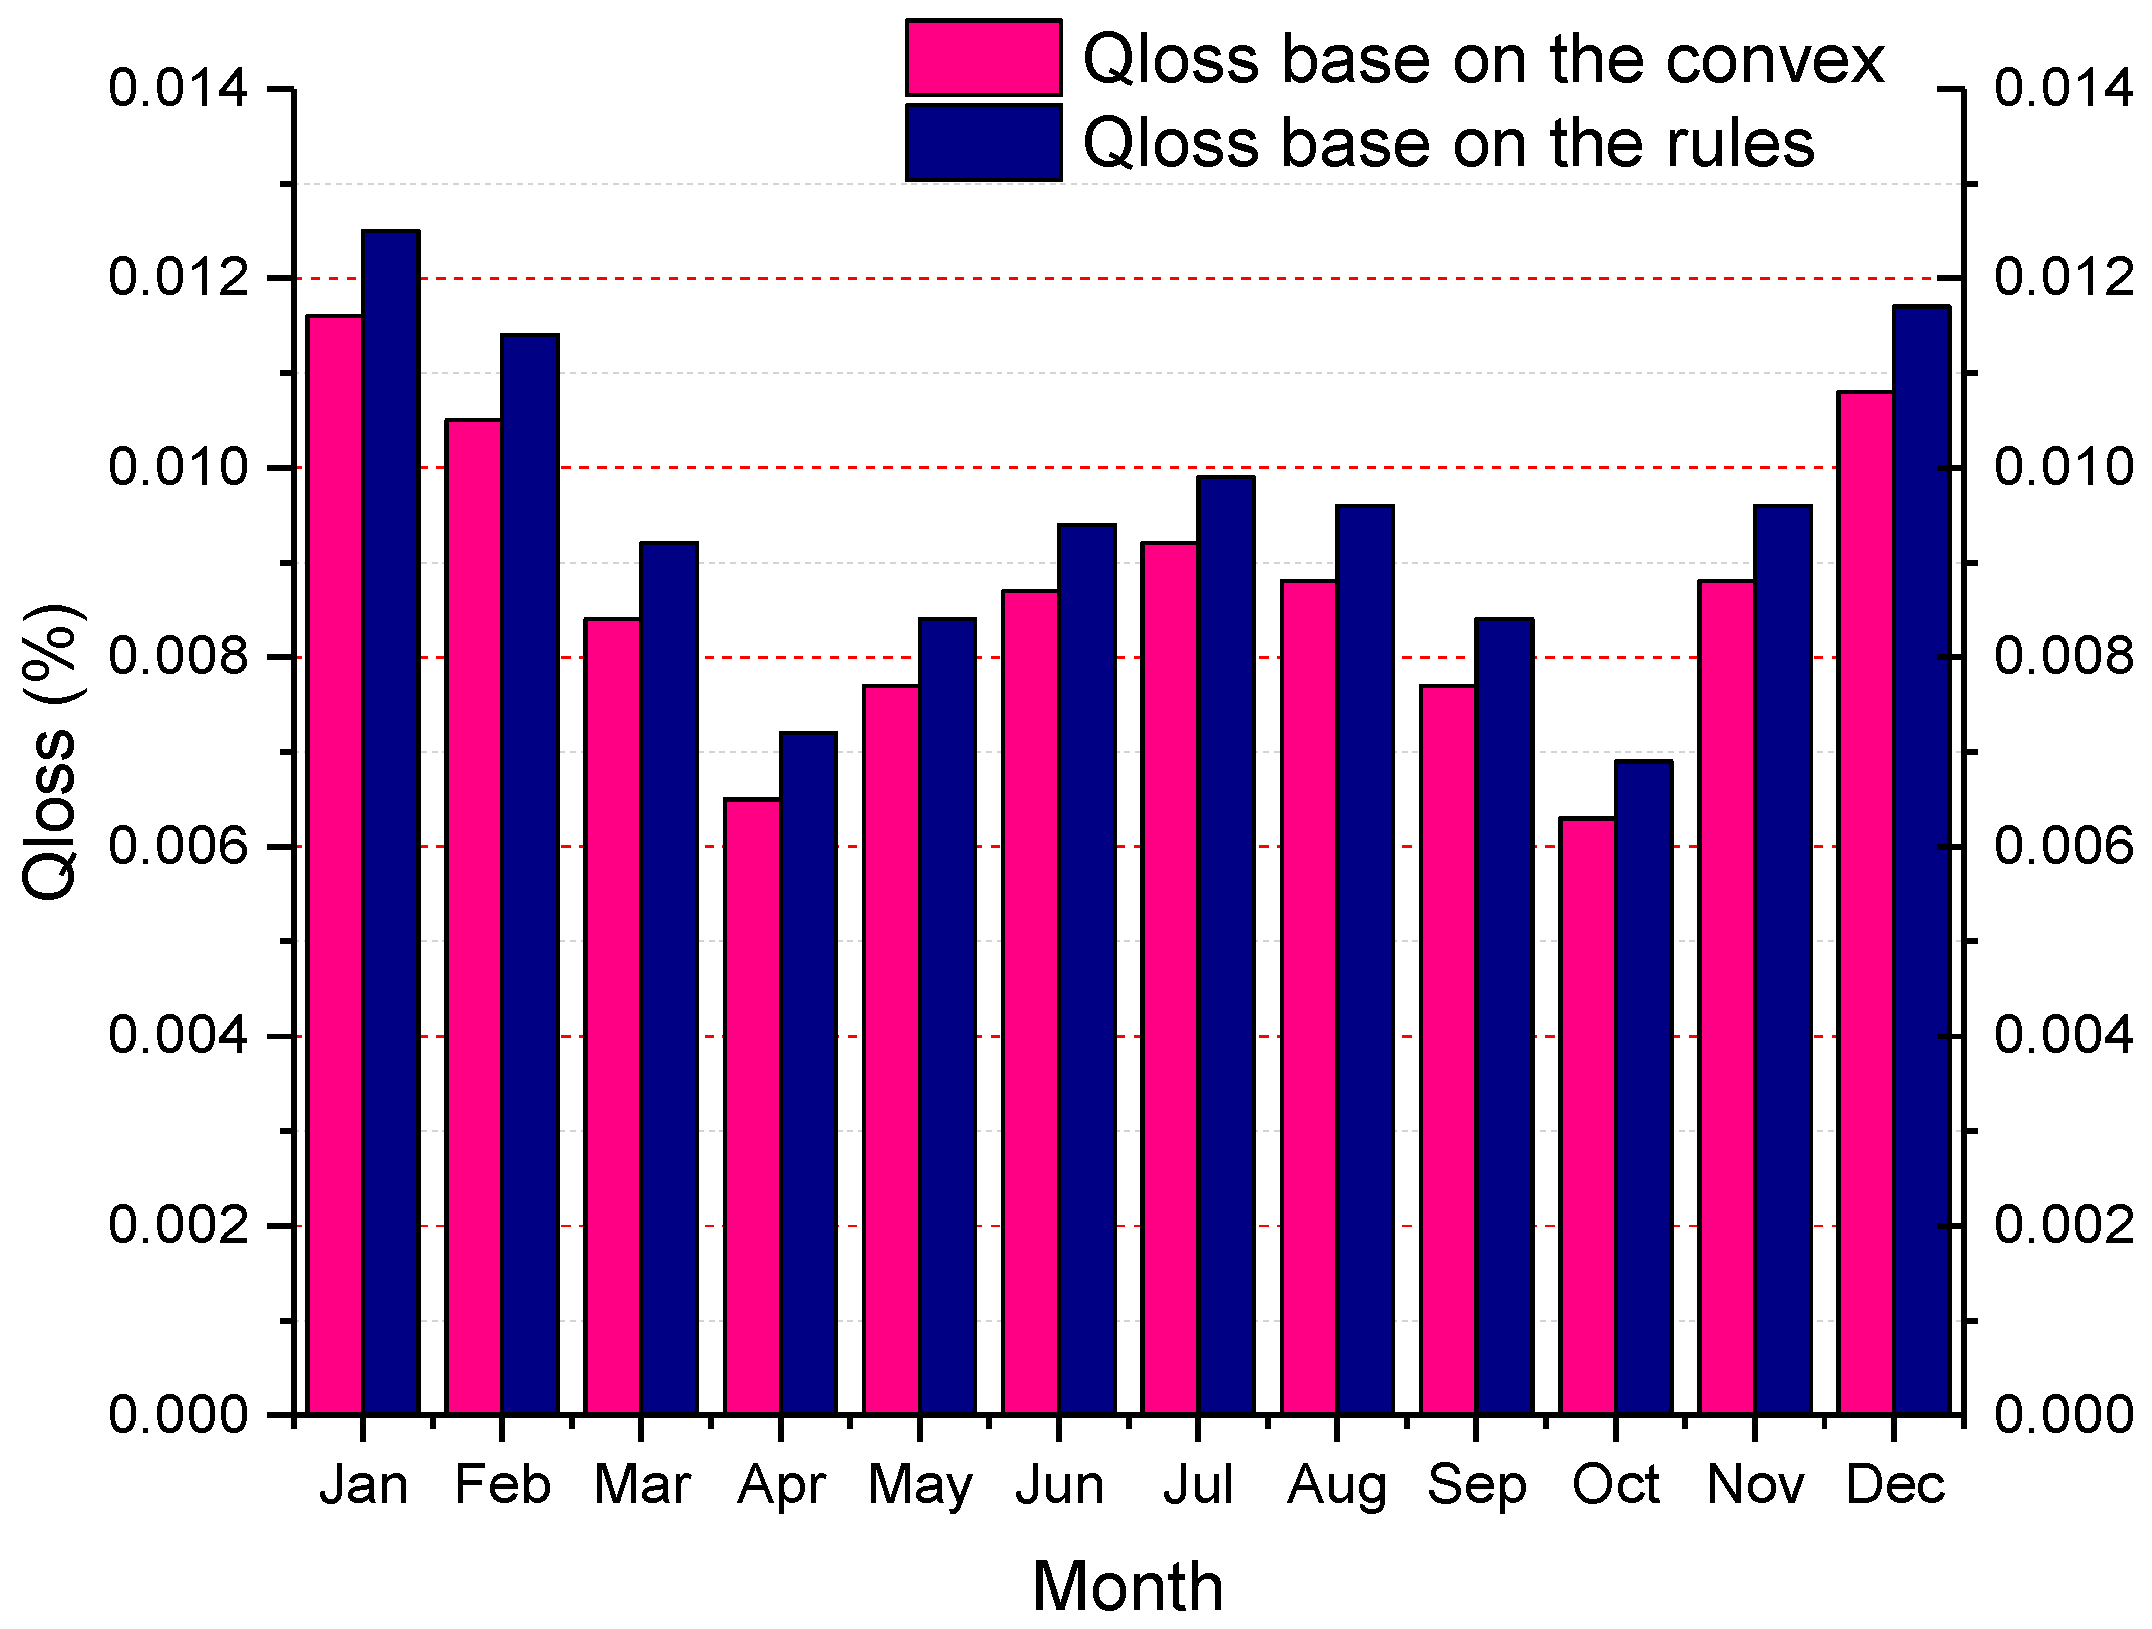
In order to obtain further analysis of Qloss for one year in Harbin, we assume that the Harbin city bus will run for cycle lines in one day, and the bus operates for 30 days in a month. Therefore, the bus will operate for 360 days in a year. According to the average temperature of different months in Harbin, the daily value of Qloss for every month can be calculated. It is assumed that the vehicle in each month is running at the monthly average temperature value and ignores the self-heating effect of the battery [31]. The semi-empirical model is also used to calculate the battery degradation. The average monthly temperature in Harbin is given in Table 6 [32], i.e., the temperature range of T [−18.3 °C, 23.0 °C].
According to the different average temperatures in different months, we can calculate the electric bus battery degradation percentage in one day for different months, as shown in Figure 19.
As evident in Figure 19, Qloss in different months based on the rules strategy is larger than that based on the convex optimization strategy. It can also be observed that, when the temperature is within ±10 °C during spring and autumn, Qloss is minimal, whereas Qloss is large in summer and winter with higher or lower temperatures. Especially in the winter months of December, January, and February, the two strategies under daily operation of the battery degradation reached ≥ 0.01%. This directly reflects the problem of large degradation of LiFePO4 battery at low temperatures. The total battery degradation percentage of the year is shown in Table 7.
In Table 7, Qloss in one year based on the convex optimization strategy is 3.15%, and Qloss based on the rules strategy is 3.43%. A quantitative analysis of battery life extension is addressed in this paper, assuming that the battery cannot be used when its capacity reduces to 80% of the initial value. Subsequently, the year of usage of the battery can be calculated using Equation (26).
6. Conclusions
This paper used the electric bus power system with semi-active HESS as the research object, in the Harbin city driving cycle and proposed a convex optimization power distribution strategy target to optimize the battery current that represents battery degradation. According to the average temperature of different months of the year in the northern city of Harbin, the percentage of battery degradation of the electric bus with the HESS is analyzed and calculated. Simulation results show that using the convex optimization strategy proposed in this paper, at a room temperature of 25 °C, in a daily trip composed of the Harbin City Driving Cycle—including four cycle lines and four charging stages—the percentage of the battery degradation is 9.6 × 10⁻³%, whereas the battery degradation is 10.3 × 10⁻³% based on the rules under the same conditions. Assuming the daily mileage of an electric bus is approximately 200 km, and it will operate for 360 days in a year, the percentage of battery degradation is 3.15% in one year in Harbin. Before the battery capacity reduces to 80% of the initial value, the electric bus can run for 6.35 years based on the strategy proposed in this paper. However, the battery degrades 3.43% per year in Harbin using the rule-based strategy, and the bus can run for 5.84 years. Thus, the convex-based optimization strategy can operate for 0.51 year more than the rule-based strategy.
Acknowledgments
This work was supported by the State Key Laboratory of Automotive Safety and Energy under Project No. KF16062 and Science Funds for the Young Innovative Talents of HUST, No. 201503.
Author Contributions
Xiaogang Wu and Tianze Wang conceived and designed the simulations; Xiaogang Wu analyzed the data; Tianze Wang wrote the paper.
Conflicts of Interest
The authors declare no conflict of interest.
References
- Conte, M.; Genovese, A.; Ortenzi, F.; Vellucci, F. Hybrid battery-supercapacitor storage for an electric forklift: A life-cycle cost assessment. J. Appl. Electrochem. 2014, 44, 523–532. [Google Scholar] [CrossRef]
- Yutao, L.; Feng, W.; Hao, Y.; Xiutian, L. A Study on the Driving-cycle-based Life Model for LiFePO4 battery. Automot. Eng. 2015, 37, 881–885. [Google Scholar]
- Abeywardana, D.B.W.; Hredzak, B.; Agelidis, V.G.; Demetriades, G.D. Supercapacitor Sizing Method for Energy-Controlled Filter-Based Hybrid Energy Storage Systems. IEEE Trans. Power Electron. 2017, 32, 1626–1637. [Google Scholar] [CrossRef]
- Henson, W. Optimal battery/ultracapacitor storage combination. J. Power Sources 2008, 179, 417–423. [Google Scholar] [CrossRef]
- Xiong, R.; Sun, F.; Chen, Z.; He, H. A data-driven multi-scale extended Kalman filtering based parameter and state estimation approach of lithium-ion olymer battery in electric vehicles. Appl. Energy 2014, 113, 463–476. [Google Scholar] [CrossRef]
- Zhang, Y.; Xiong, R.; He, H.; Shen, W. Lithium-Ion Battery Pack State of Charge and State of Energy Estimation Algorithms Using a Hardware-in-the-Loop Validation. IEEE Trans. Power Electron. 2017, 32, 4421–4431. [Google Scholar] [CrossRef]
- Choi, M.; Kim, S.; Seo, S. Energy Management Optimization in a Battery/Supercapacitor Hybrid Energy Storage System. IEEE Trans. Smart Grid 2012, 3, 463–472. [Google Scholar] [CrossRef]
- Song, Z.; Li, J.; Han, X.; Xu, L.; Lu, L.; Ouyang, M.; Hofmann, H. Multi-objective optimization of a semi-active battery/supercapacitor energy storage system for electric vehicles. Appl. Energy 2014, 135, 212–224. [Google Scholar] [CrossRef]
- Song, Z.; Hofmann, H.; Li, J.; Han, X.; Zhang, X.; Ouyang, M. A comparison study of different semi-active hybrid energy storage system topologies for electric vehicles. J. Power Sources 2015, 274, 400–411. [Google Scholar] [CrossRef]
- Hu, X.; Murgovski, N.; Johannesson, L.; Egardt, B. Energy efficiency analysis of a series plug-in hybrid electric bus with different energy management strategies and battery sizes. Appl. Energy 2013, 111, 1001–1009. [Google Scholar] [CrossRef]
- Lu, L.; Han, X.; Li, J.; Hua, J.; Ouyang, M. A review on the key issues for lithium-ion battery management in electric vehicles. J. Power Sources 2013, 226, 272–288. [Google Scholar] [CrossRef]
- Amjadi, Z.; Williamson, S.S. Prototype Design and Controller Implementation for a Battery-Ultracapacitor Hybrid Electric Vehicle Energy Storage System. IEEE Trans. Smart Grid 2012, 3, 332–340. [Google Scholar] [CrossRef]
- Ma, T.; Yang, H.; Lu, L. Development of hybrid battery-supercapacitor energy storage for remote area renewable energy systems. Appl. Energy 2015, 153, 56–62. [Google Scholar] [CrossRef]
- Hung, Y.; Wu, C. An integrated optimization approach for a hybrid energy system in electric vehicles. Appl. Energy 2012, 98, 479–490. [Google Scholar] [CrossRef]
- Vinot, E.; Trigui, R. Optimal energy management of HEVs with hybrid storage system. Energy Convers. Manag. 2013, 76, 437–452. [Google Scholar] [CrossRef]
- Yoo, H.; Sul, S.; Park, Y.; Jeong, J. System integration and power-flow management for a series hybrid electric vehicle using supercapacitors and batteries. IEEE Trans. Ind. Appl. 2008, 44, 108–114. [Google Scholar] [CrossRef]
- Li, Y.; Han, Y. A Module-Integrated Distributed Battery Energy Storage and Management System. IEEE Trans. Power Electron. 2016, 31, 8260–8270. [Google Scholar] [CrossRef]
- Zhao, N.; Li, Y.; Zhao, X.; Zhi, X.; Liang, G. Effect of particle size and purity on the low temperature electrochemical performance of LiFePO4/C cathode material. J. Alloys Compd. 2016, 683, 123–132. [Google Scholar] [CrossRef]
- Chen, C.; Xiong, R.; Shen, W. A lithium-ion battery-in-the-loop approach to test and validate multi-scale dual H infinity filters for state of charge and capacity estimation. IEEE Trans. Power Electron. 2017, PP, 1. [Google Scholar] [CrossRef]
- Marzougui, H.; Amari, M.; Kadri, A.; Bacha, F.; Ghouili, J. Energy management of fuel cell/battery/ultracapacitor in electrical hybrid vehicle. Int. J. Hydrogen Energy 2017, 42, 8857–8869. [Google Scholar] [CrossRef]
- Wen-gang, L.; Bo, Z.; Xiao-dan, W.; Jun-kui, G.; Xing-jiang, L. Capacity fading of 18650 Li-ion cells with cycling. Chin. J. Power Sources 2012, 3, 306–309. [Google Scholar]
- Wang, J.; Liu, P.; Hicks-Garner, J.; Sherman, E.; Soukiazian, S.; Verbrugge, M.; Tataria, H.; Musser, J.; Finamore, P. Cycle-life model for graphite-LiFePO4 cells. J. Power Sources 2011, 196, 3942–3948. [Google Scholar] [CrossRef]
- Ramadass, P.; Haran, B.; Gomadam, P.M.; White, R.; Popov, B.N. Development of First Principles Capacity Fade Model for Li-Ion Cells. J. Electrochem. Soc. 2004, 151, A196–A203. [Google Scholar] [CrossRef]
- Song, Z.; Hofmann, H.; Li, J.; Hou, J.; Zhang, X.; Ouyang, M. The optimization of a hybrid energy storage system at subzero temperatures: Energy management strategy design and battery heating requirement analysis. Appl. Energy 2015, 159, 576–588. [Google Scholar] [CrossRef]
- New Energy Vehicles Pure Electric Driving Range and Special Inspection Standards, N.E.V.P. Available online: http://news.xinhuanet.com/auto/2015-05/19/c_127817177.htm (accessed on 6 June 2017).
- Boyd, S. Convex Optimization; Cambridge University Press: Cambridge, UK, 2004; pp. 7–13. [Google Scholar]
- Sun, F.; Xiong, R.; He, H. A systematic state-of-charge estimation framework for multi-cell battery pack in electric vehicles using bias correction technique. Appl. Energy 2016, 162, 1399–1409. [Google Scholar] [CrossRef]
- Hu, C.; Wu, X.; Li, X.; Wang, X. Construction of Harbin City Driving Cycle. J. Harbin Univ. Sci. Technol. 2014, 19, 85–89. [Google Scholar]
- Song, Z.; Hofmann, H.; Li, J.; Han, X.; Ouyang, M. Optimization for a hybrid energy storage system in electric vehicles using dynamic programing approach. Appl. Energy 2015, 139, 151–162. [Google Scholar] [CrossRef]
- Choi, M.; Lee, J.; Seo, S. Real-Time Optimization for Power Management Systems of a Battery/Supercapacitor Hybrid Energy Storage System in Electric Vehicles. IEEE Trans. Veh. Technol. 2014, 63, 3600–3611. [Google Scholar] [CrossRef]
- Forgez, C.; Vinh Do, D.; Friedrich, G.; Morcrette, M.; Delacourt, C. Thermal modeling of a cylindrical LiFePO4/graphite lithium-ion battery. J. Power Sources 2010, 195, 2961–2968. [Google Scholar] [CrossRef]
- Analysis of Climate Background in Harbin. Available online: http://www.weather.com.cn/cityintro/101050101.shtml (accessed on 6 June 2017).
Figure 1.
The topology of the electric vehicle HESS: (a) fully active topology; (b) passive parallel topology; (c) semi-active topology 1; and (d) semi-active topology 2.
Figure 1.
The topology of the electric vehicle HESS: (a) fully active topology; (b) passive parallel topology; (c) semi-active topology 1; and (d) semi-active topology 2.
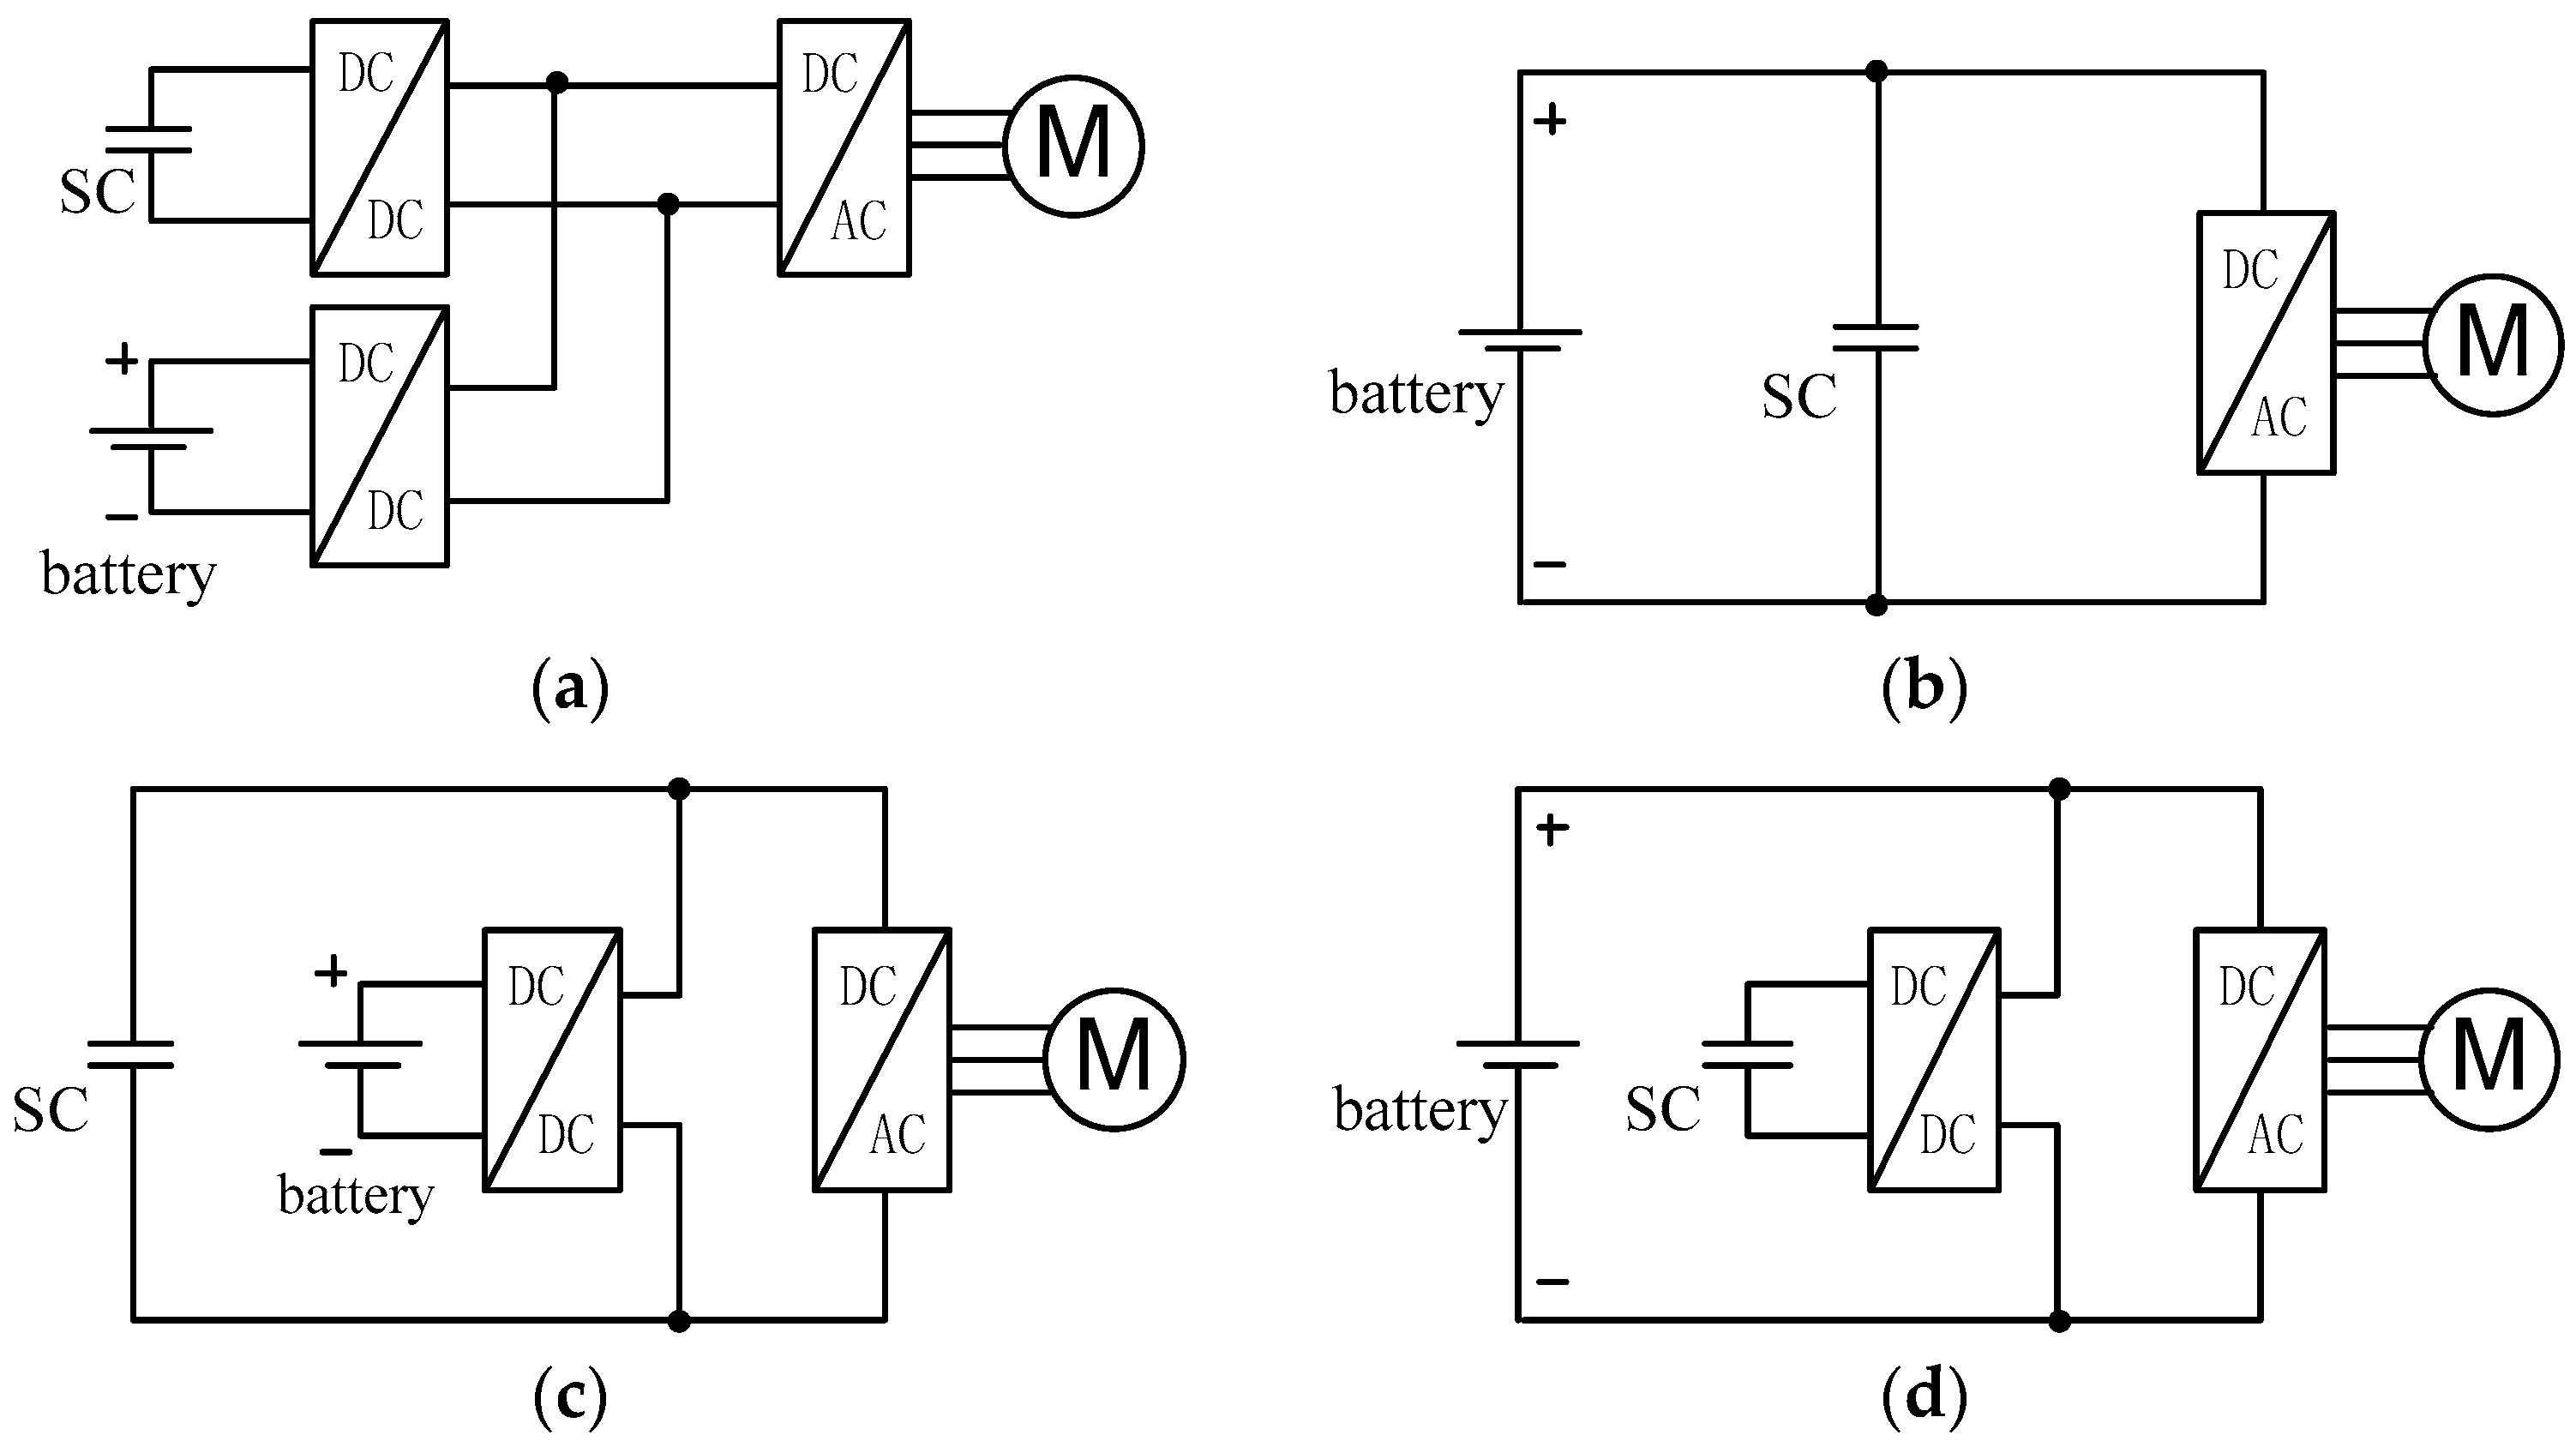
Figure 2.
The different modes of operation of semi-active topology: (a) power flow based on driving mode; and (b) power flow based on braking mode.
Figure 2.
The different modes of operation of semi-active topology: (a) power flow based on driving mode; and (b) power flow based on braking mode.
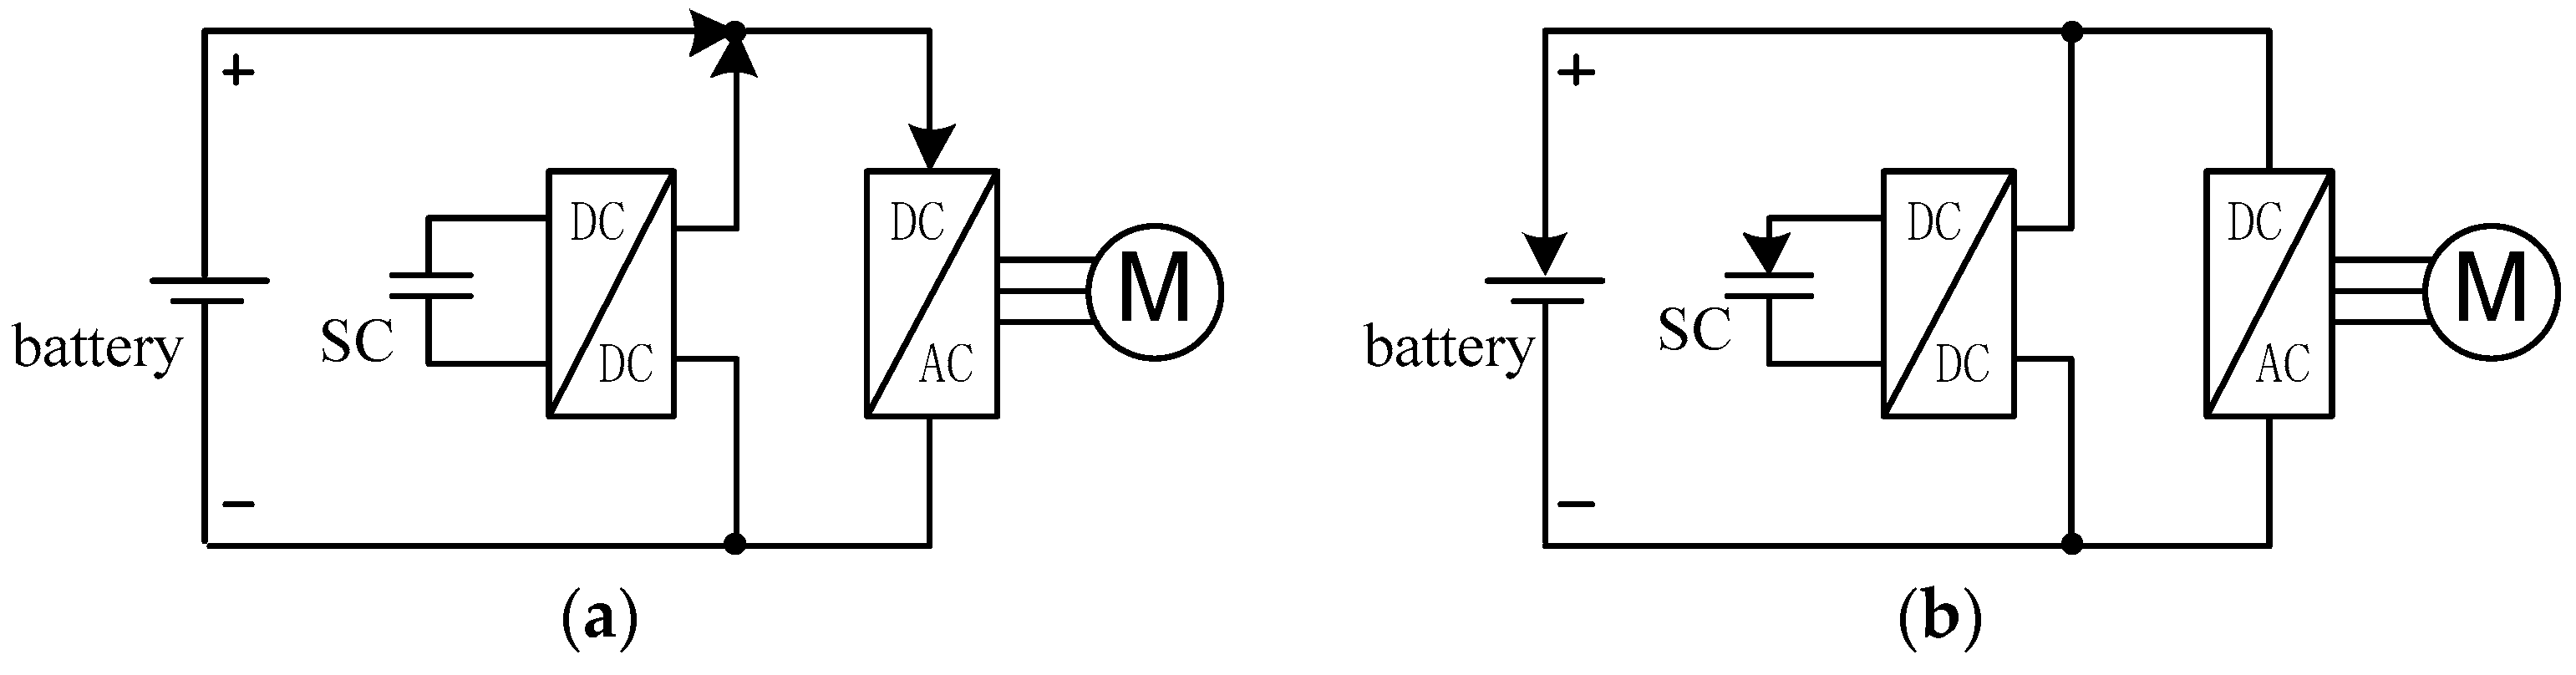
Figure 3.
Rint model of the LiFePO4 battery.
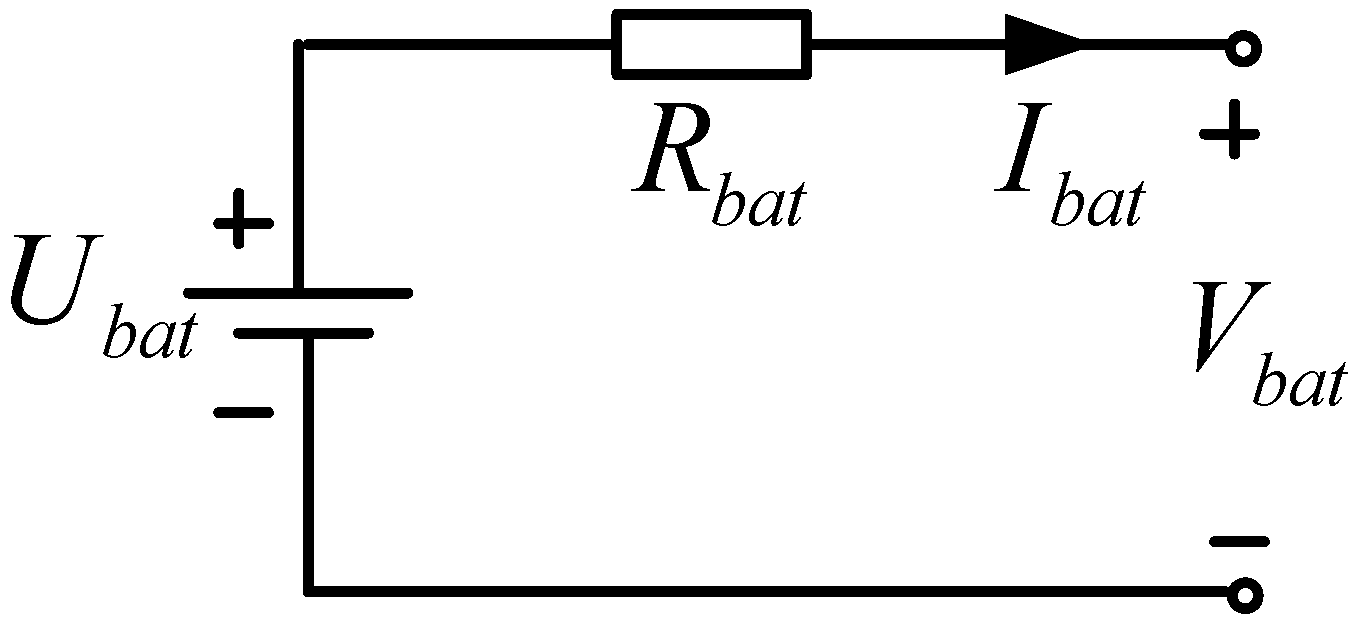
Figure 4.
The relationship between Vbat and SOC.

Figure 5.
Charge and discharge resistances of the LiFePO4 cell at room temperature of 25 °C.
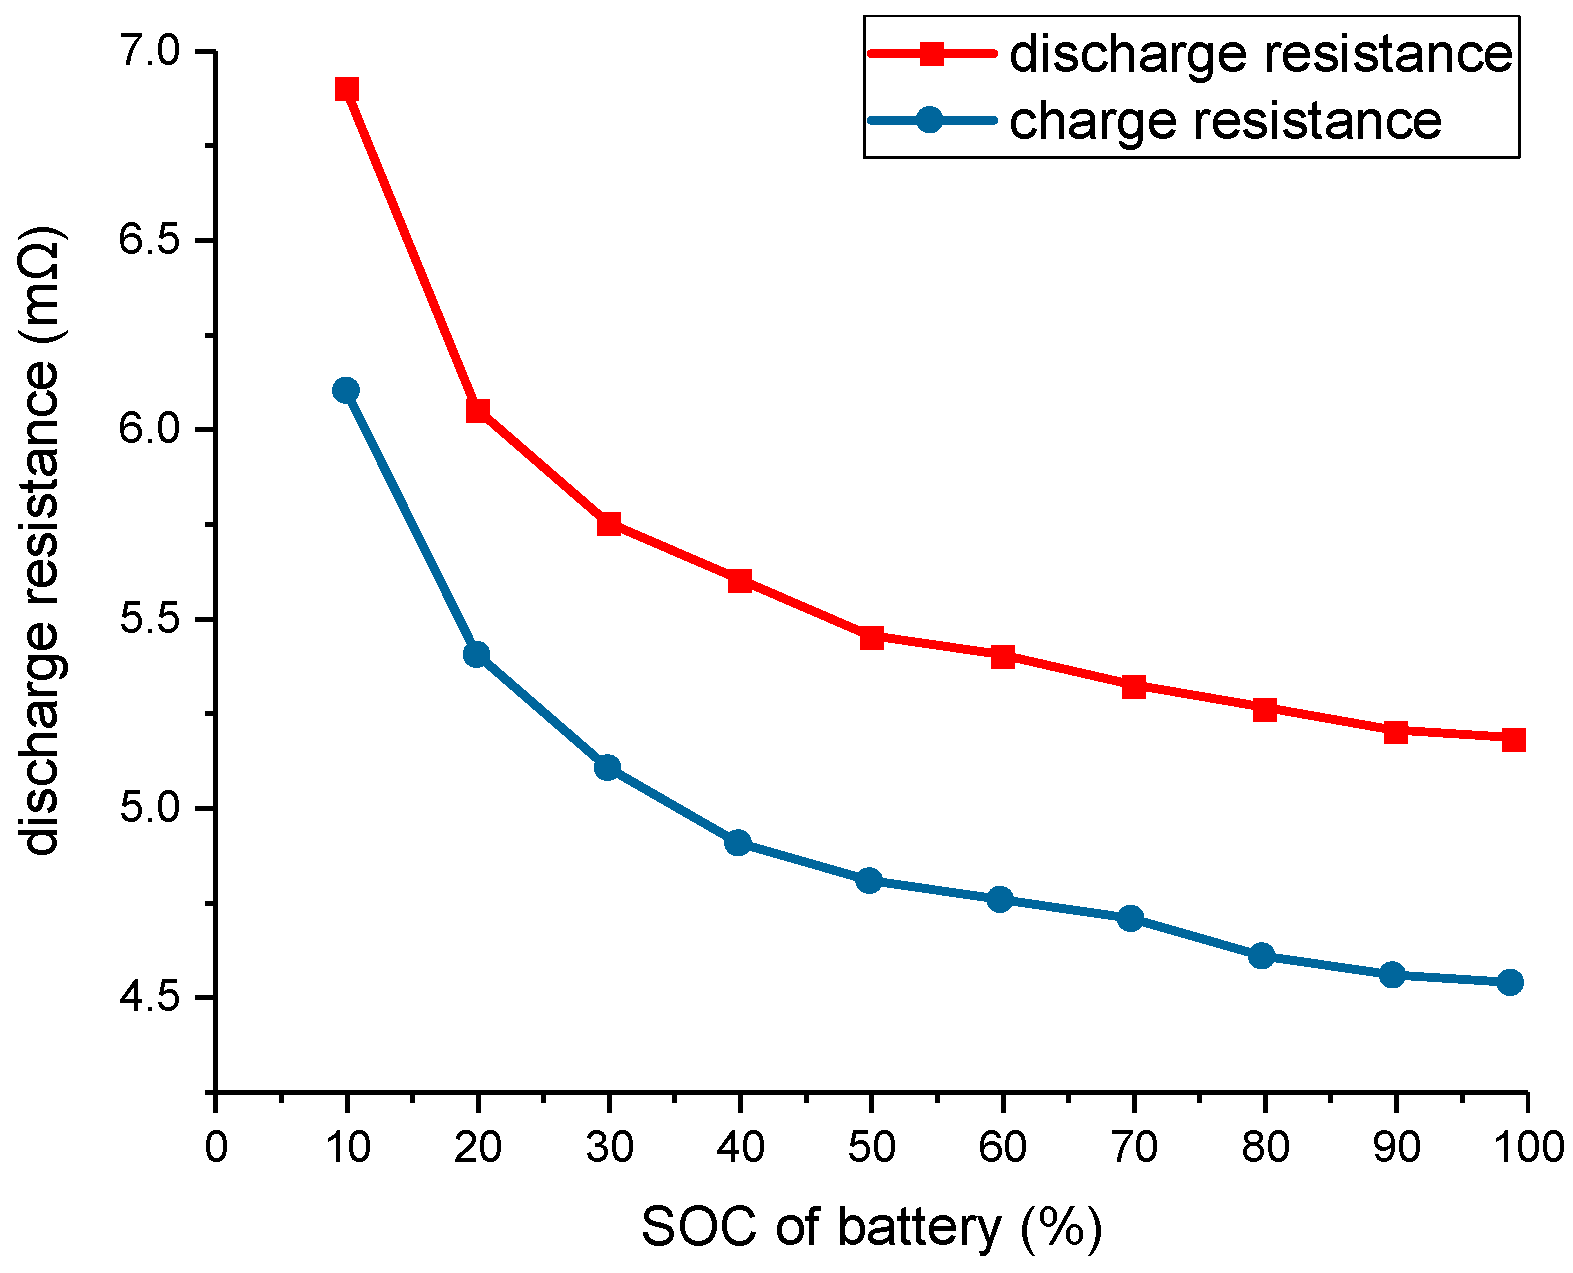
Figure 6.
Equivalent circuit modelof the SC.
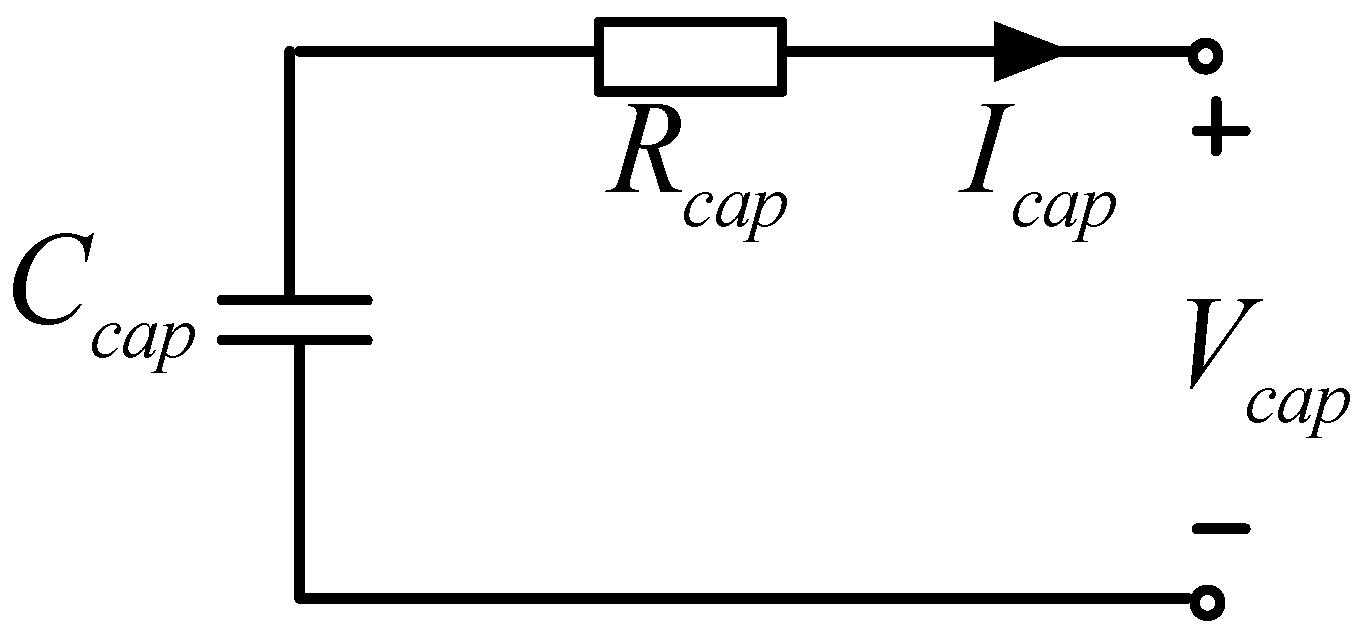
Figure 7.
The relationship between battery charge/discharge current Ibat and battery degradation percentage Qloss.
Figure 7.
The relationship between battery charge/discharge current Ibat and battery degradation percentage Qloss.
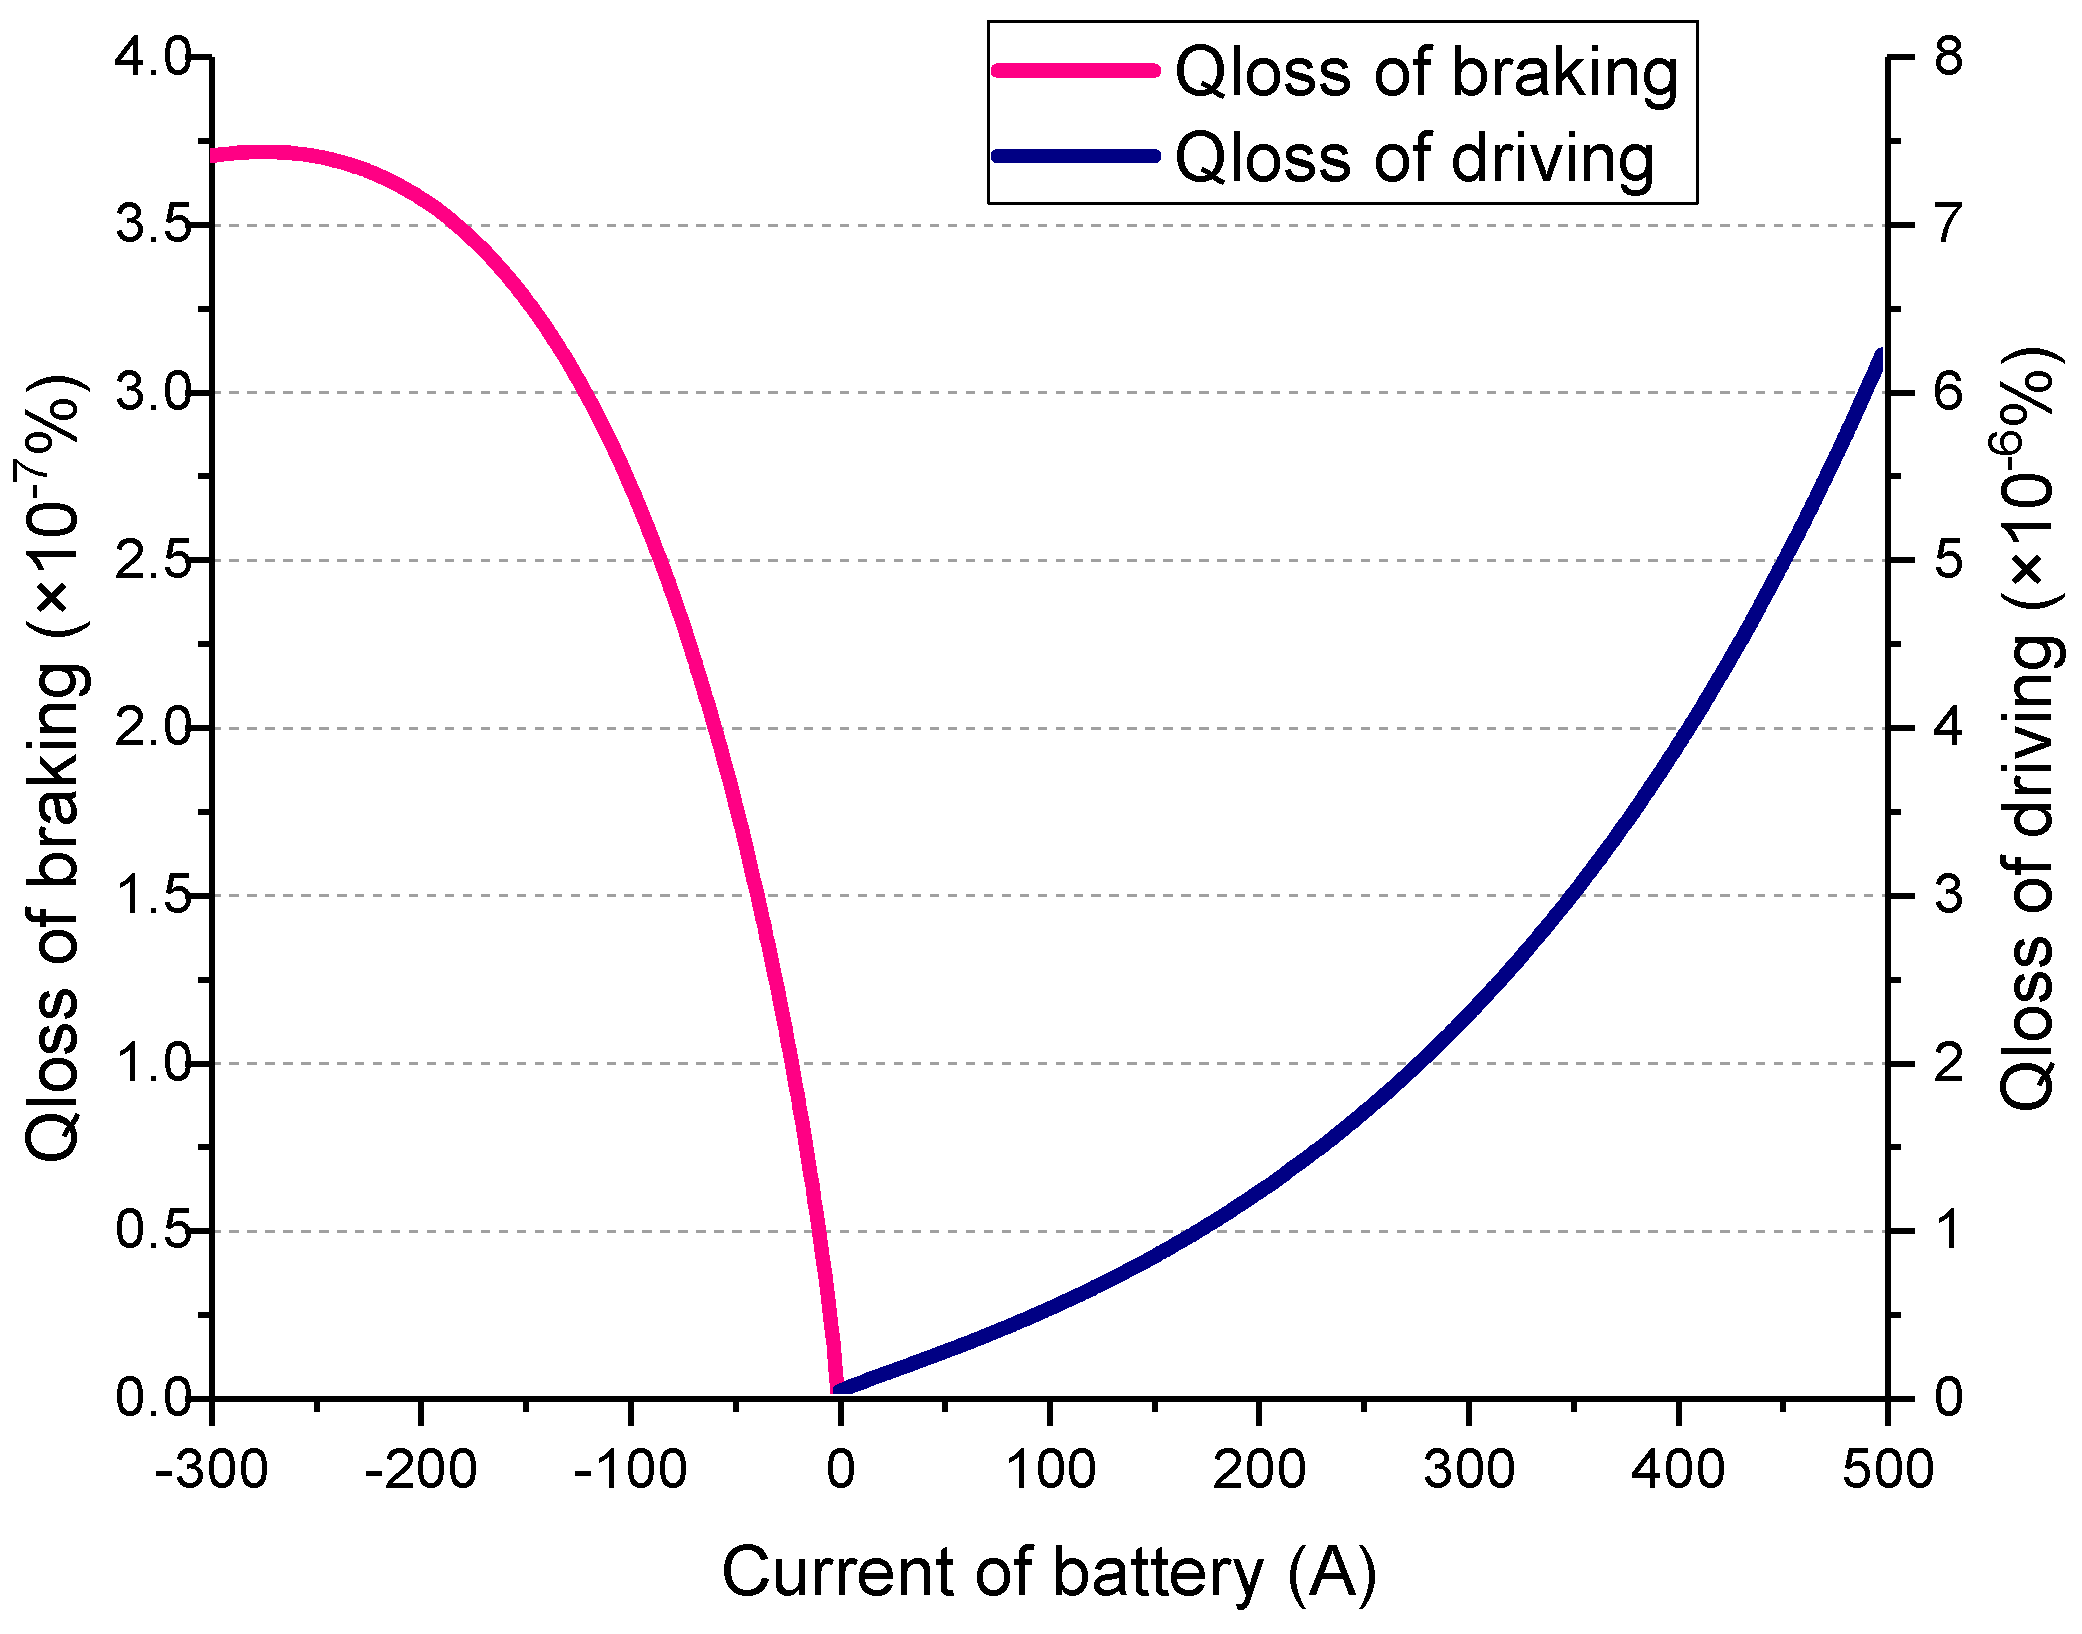
Figure 8.
The implementation process of the convex optimization strategy.
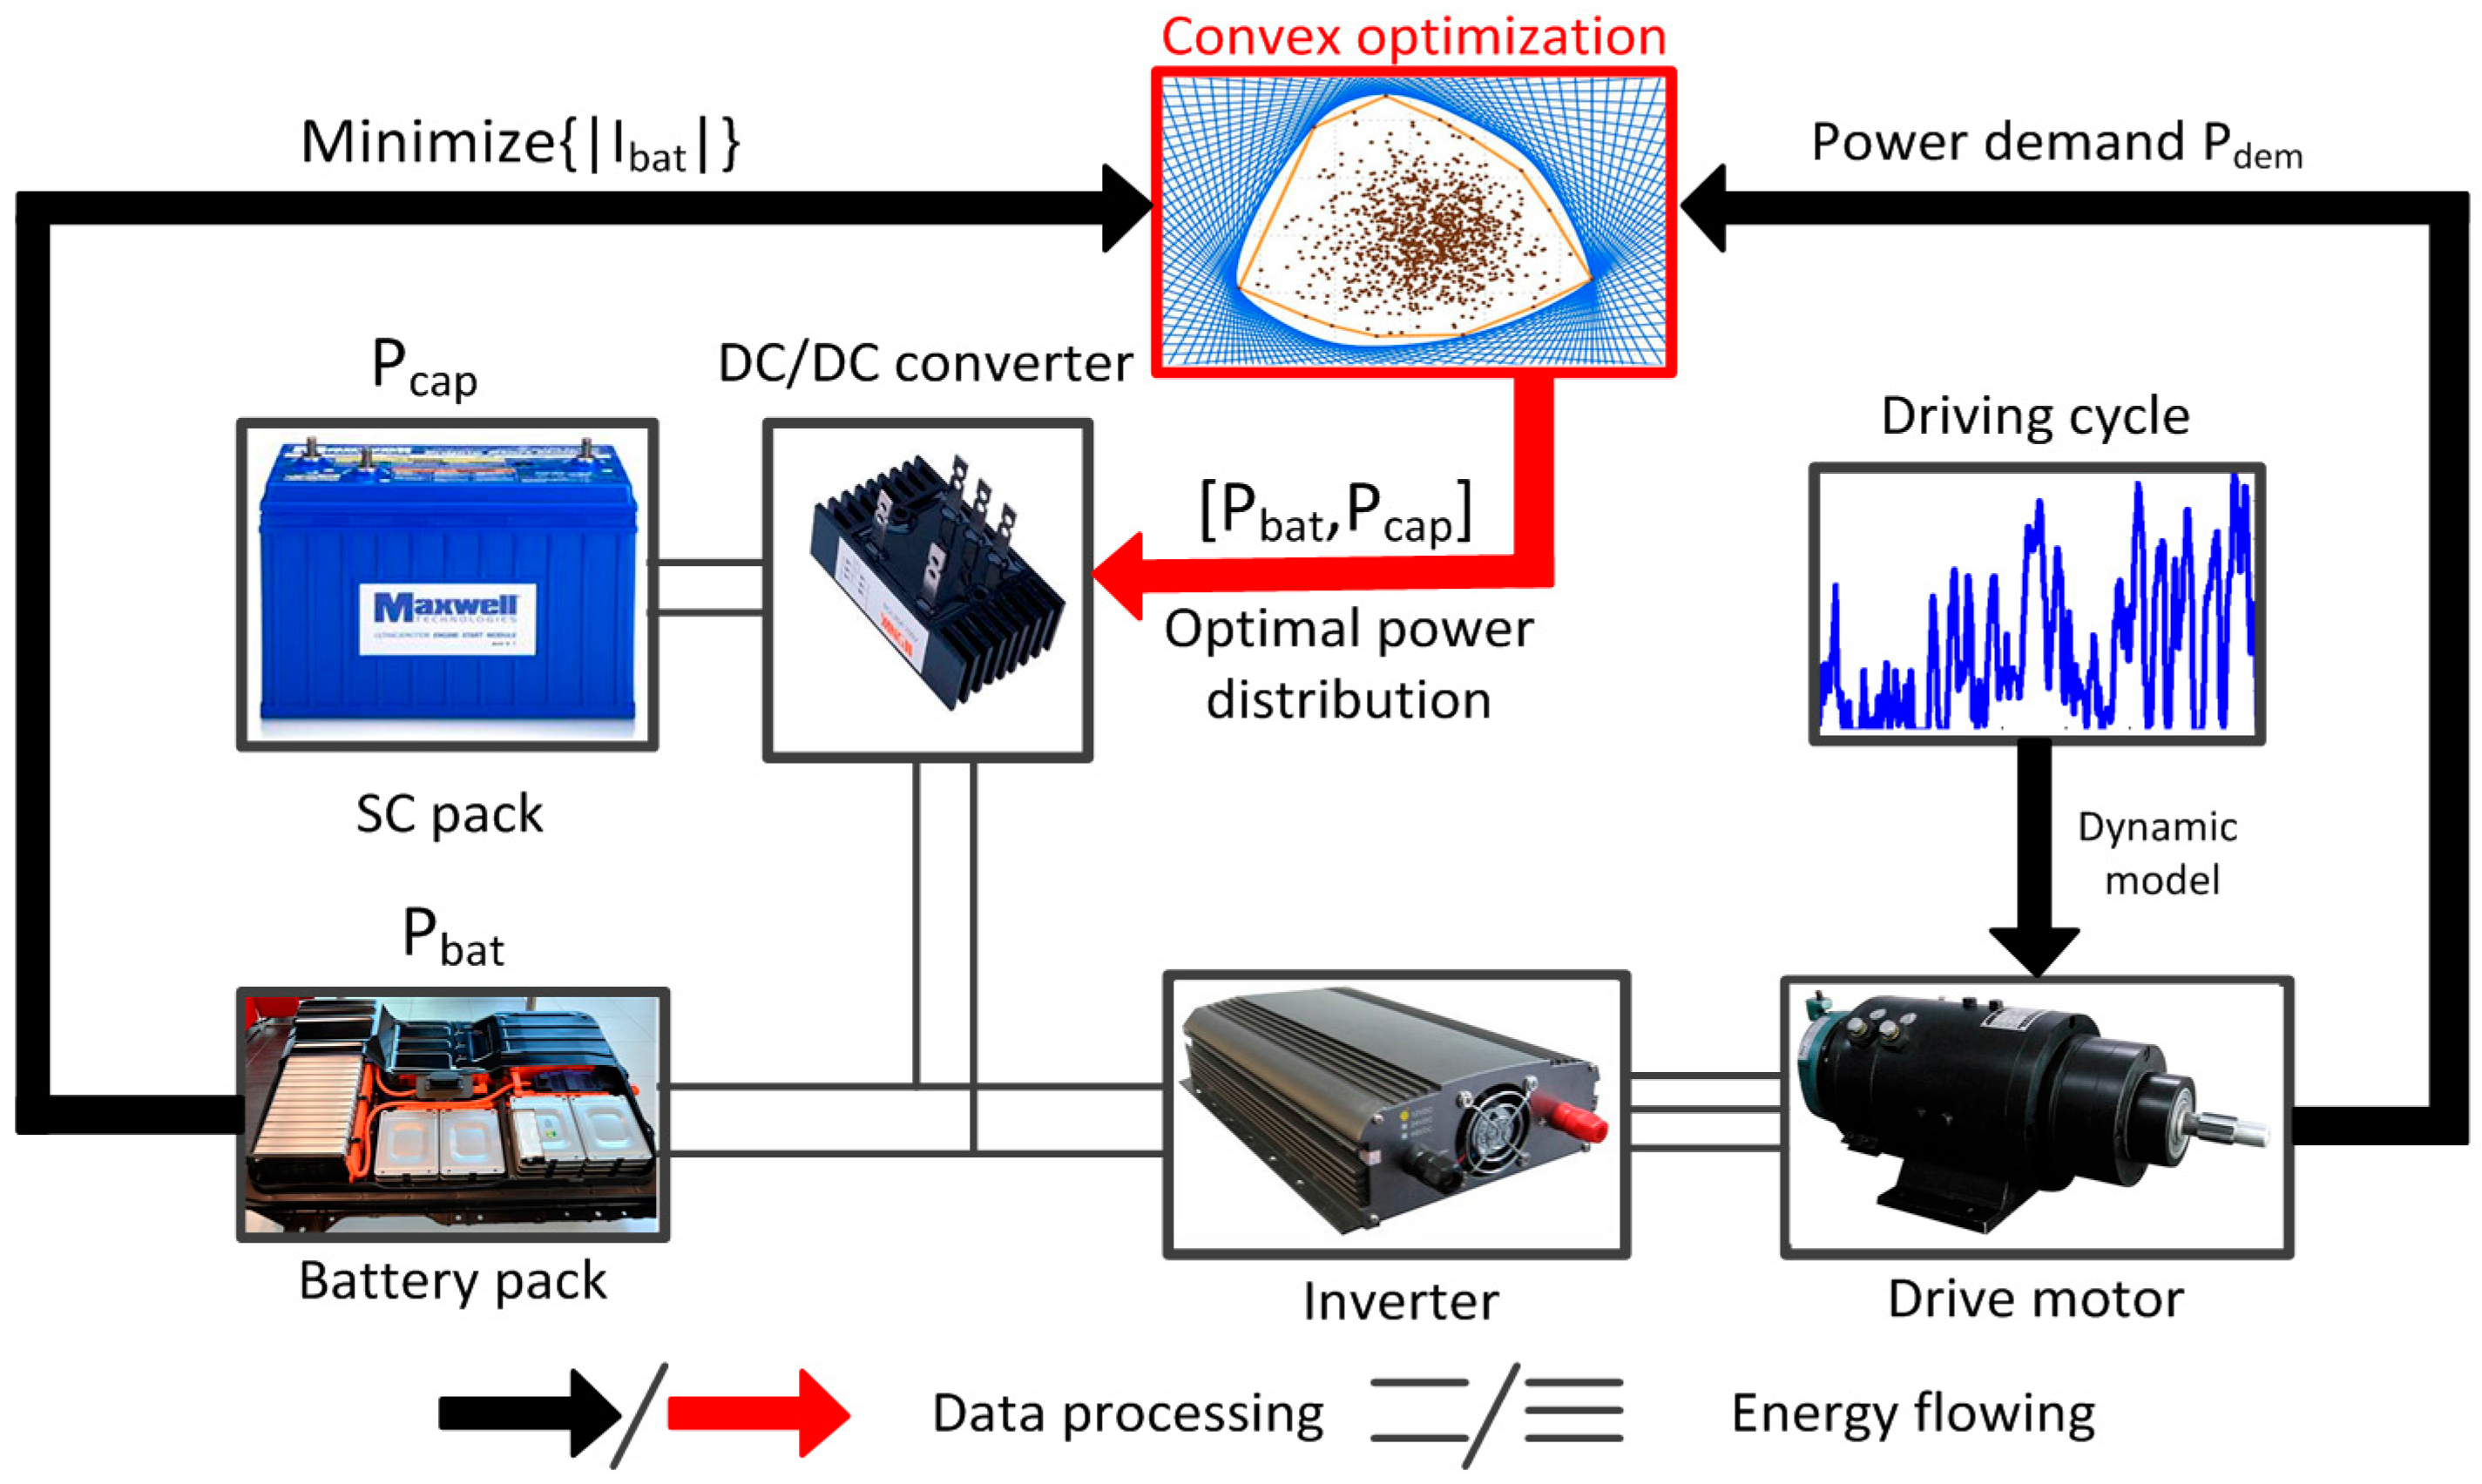
Figure 9.
Convex optimization implementation flow.
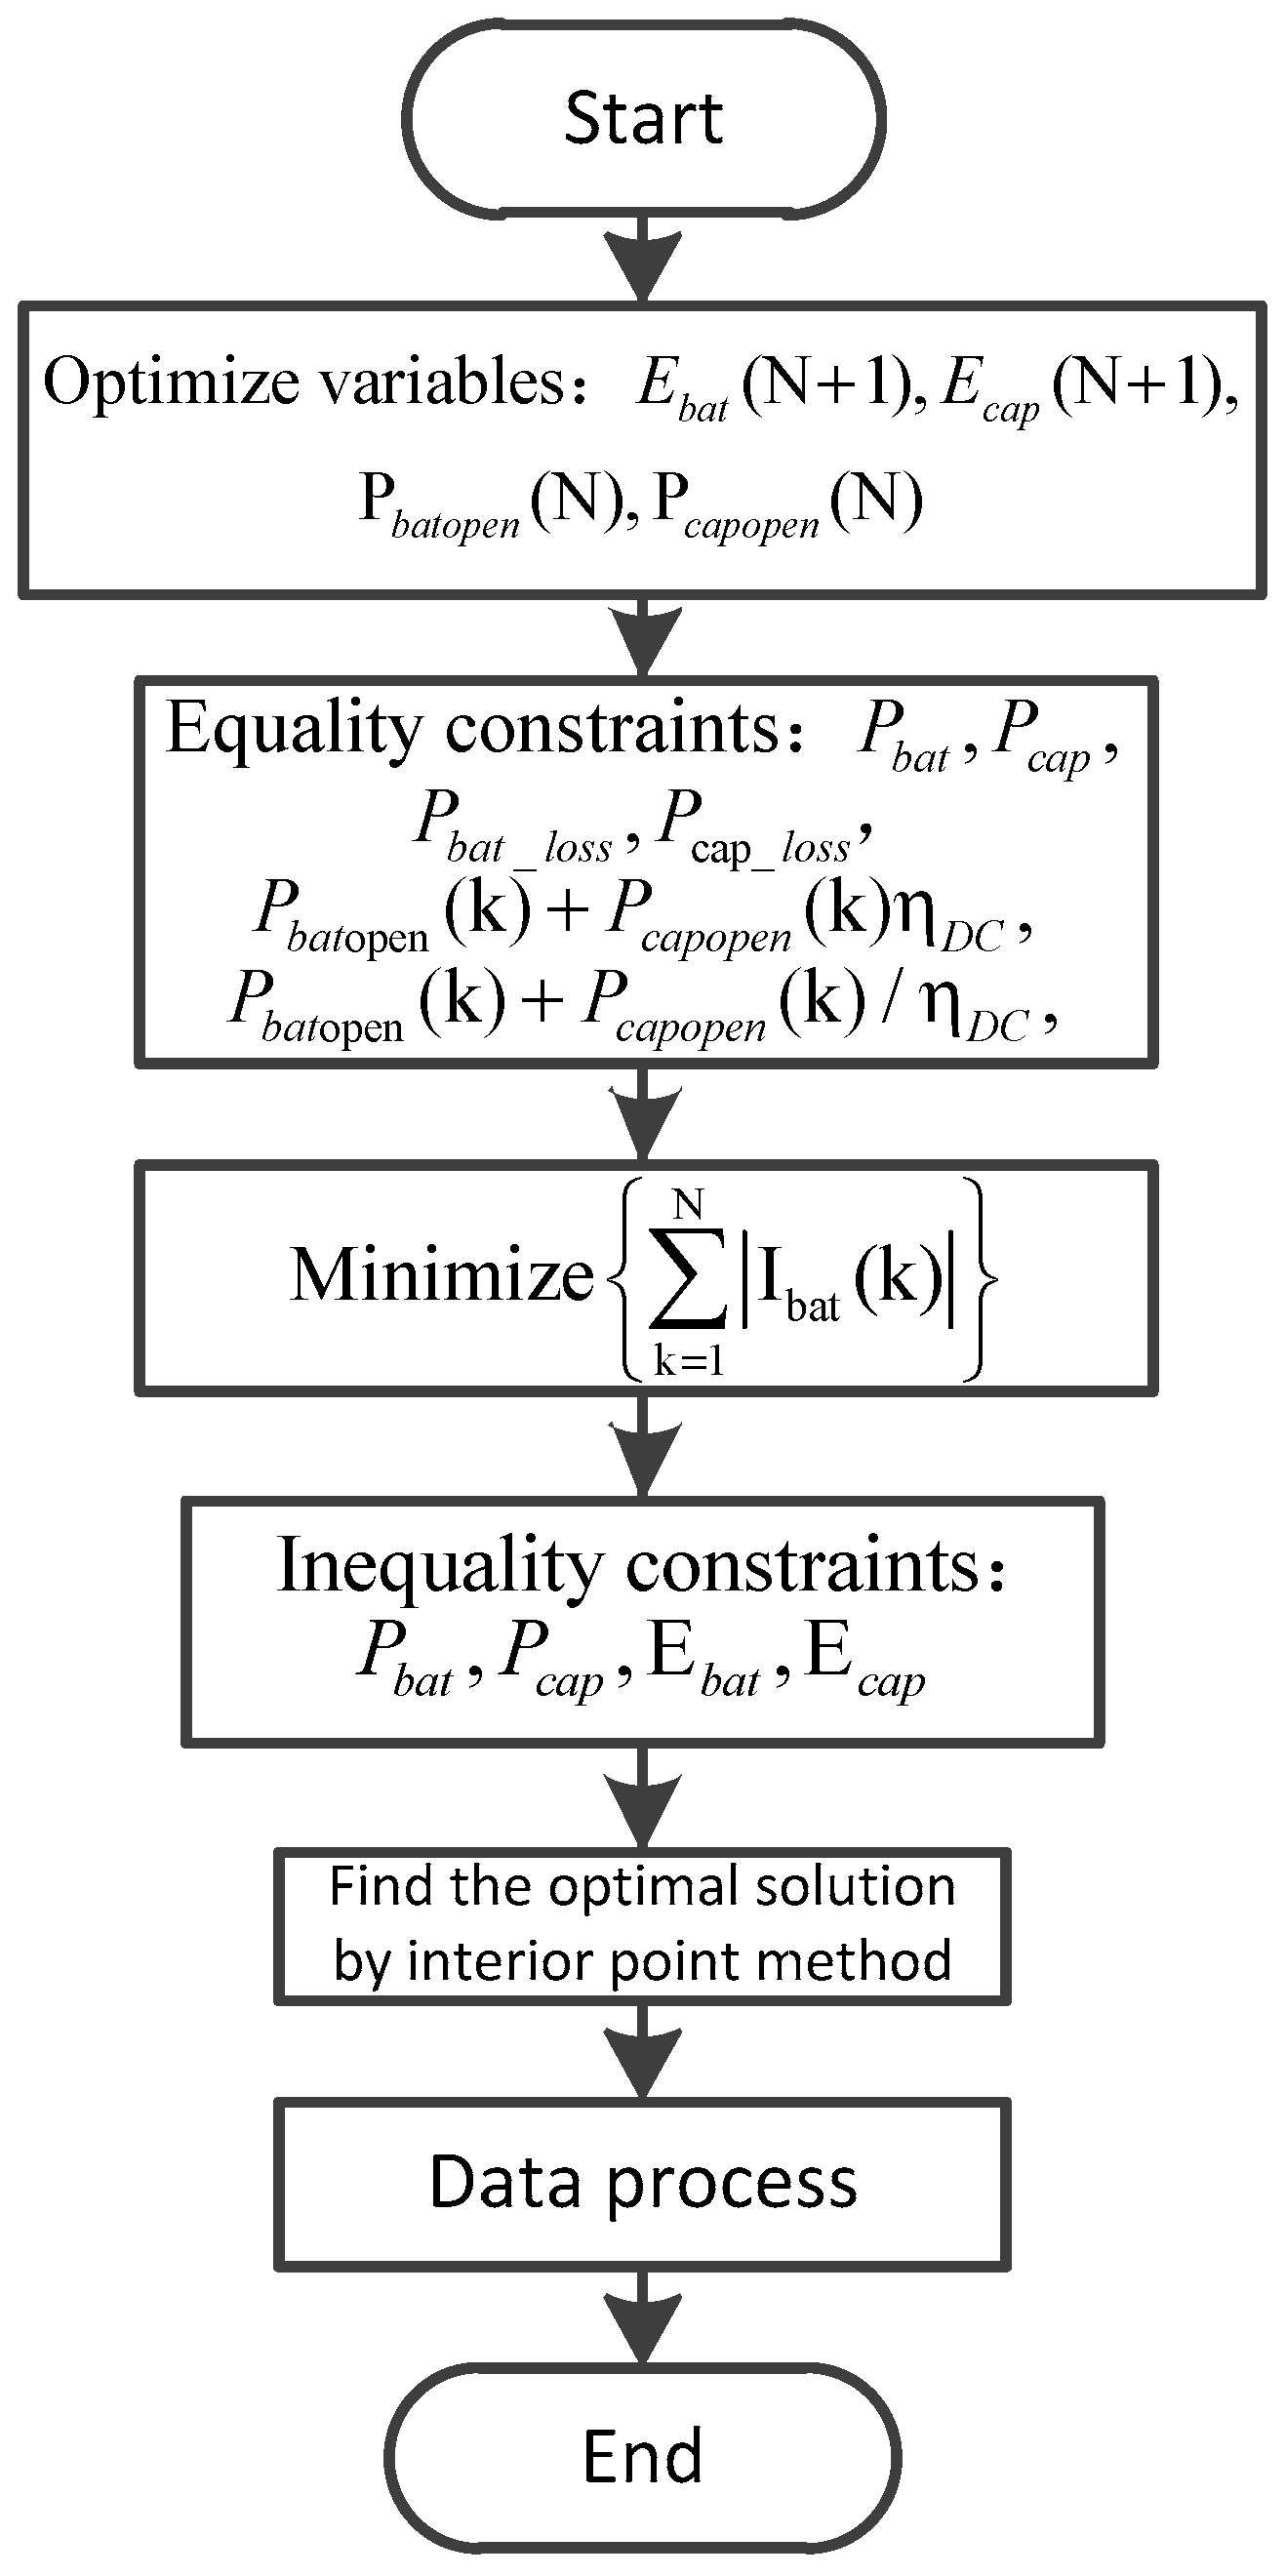
Figure 10.
Harbin city driving cycle and the power demand.

Figure 11.
Convex optimization results: (a) power distribution results based on convex optimization; and (b) the relationship between power demand and SC power.
Figure 11.
Convex optimization results: (a) power distribution results based on convex optimization; and (b) the relationship between power demand and SC power.
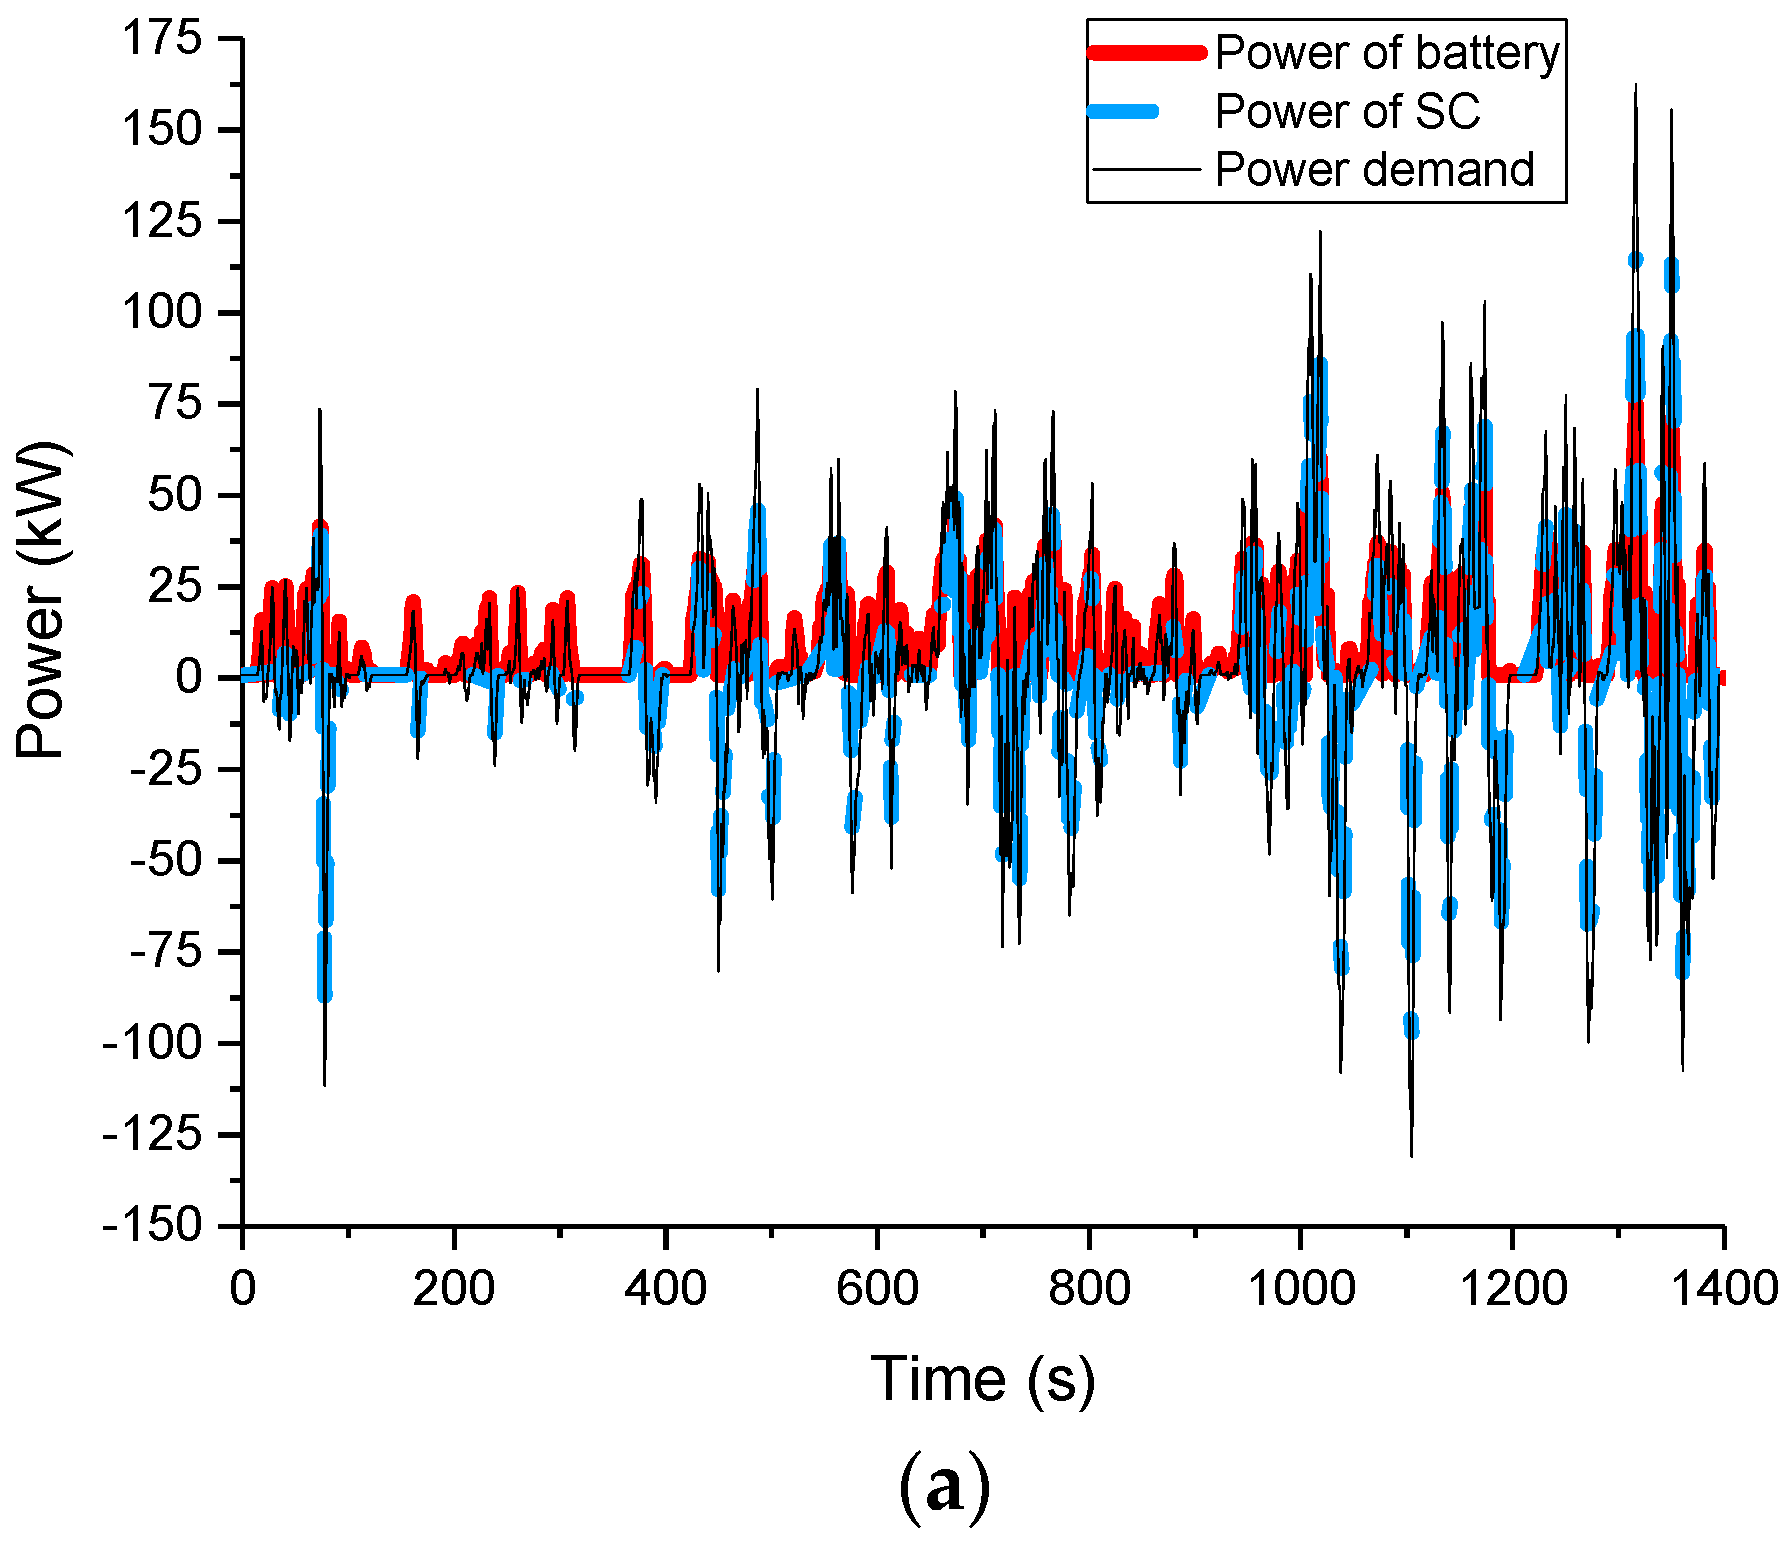
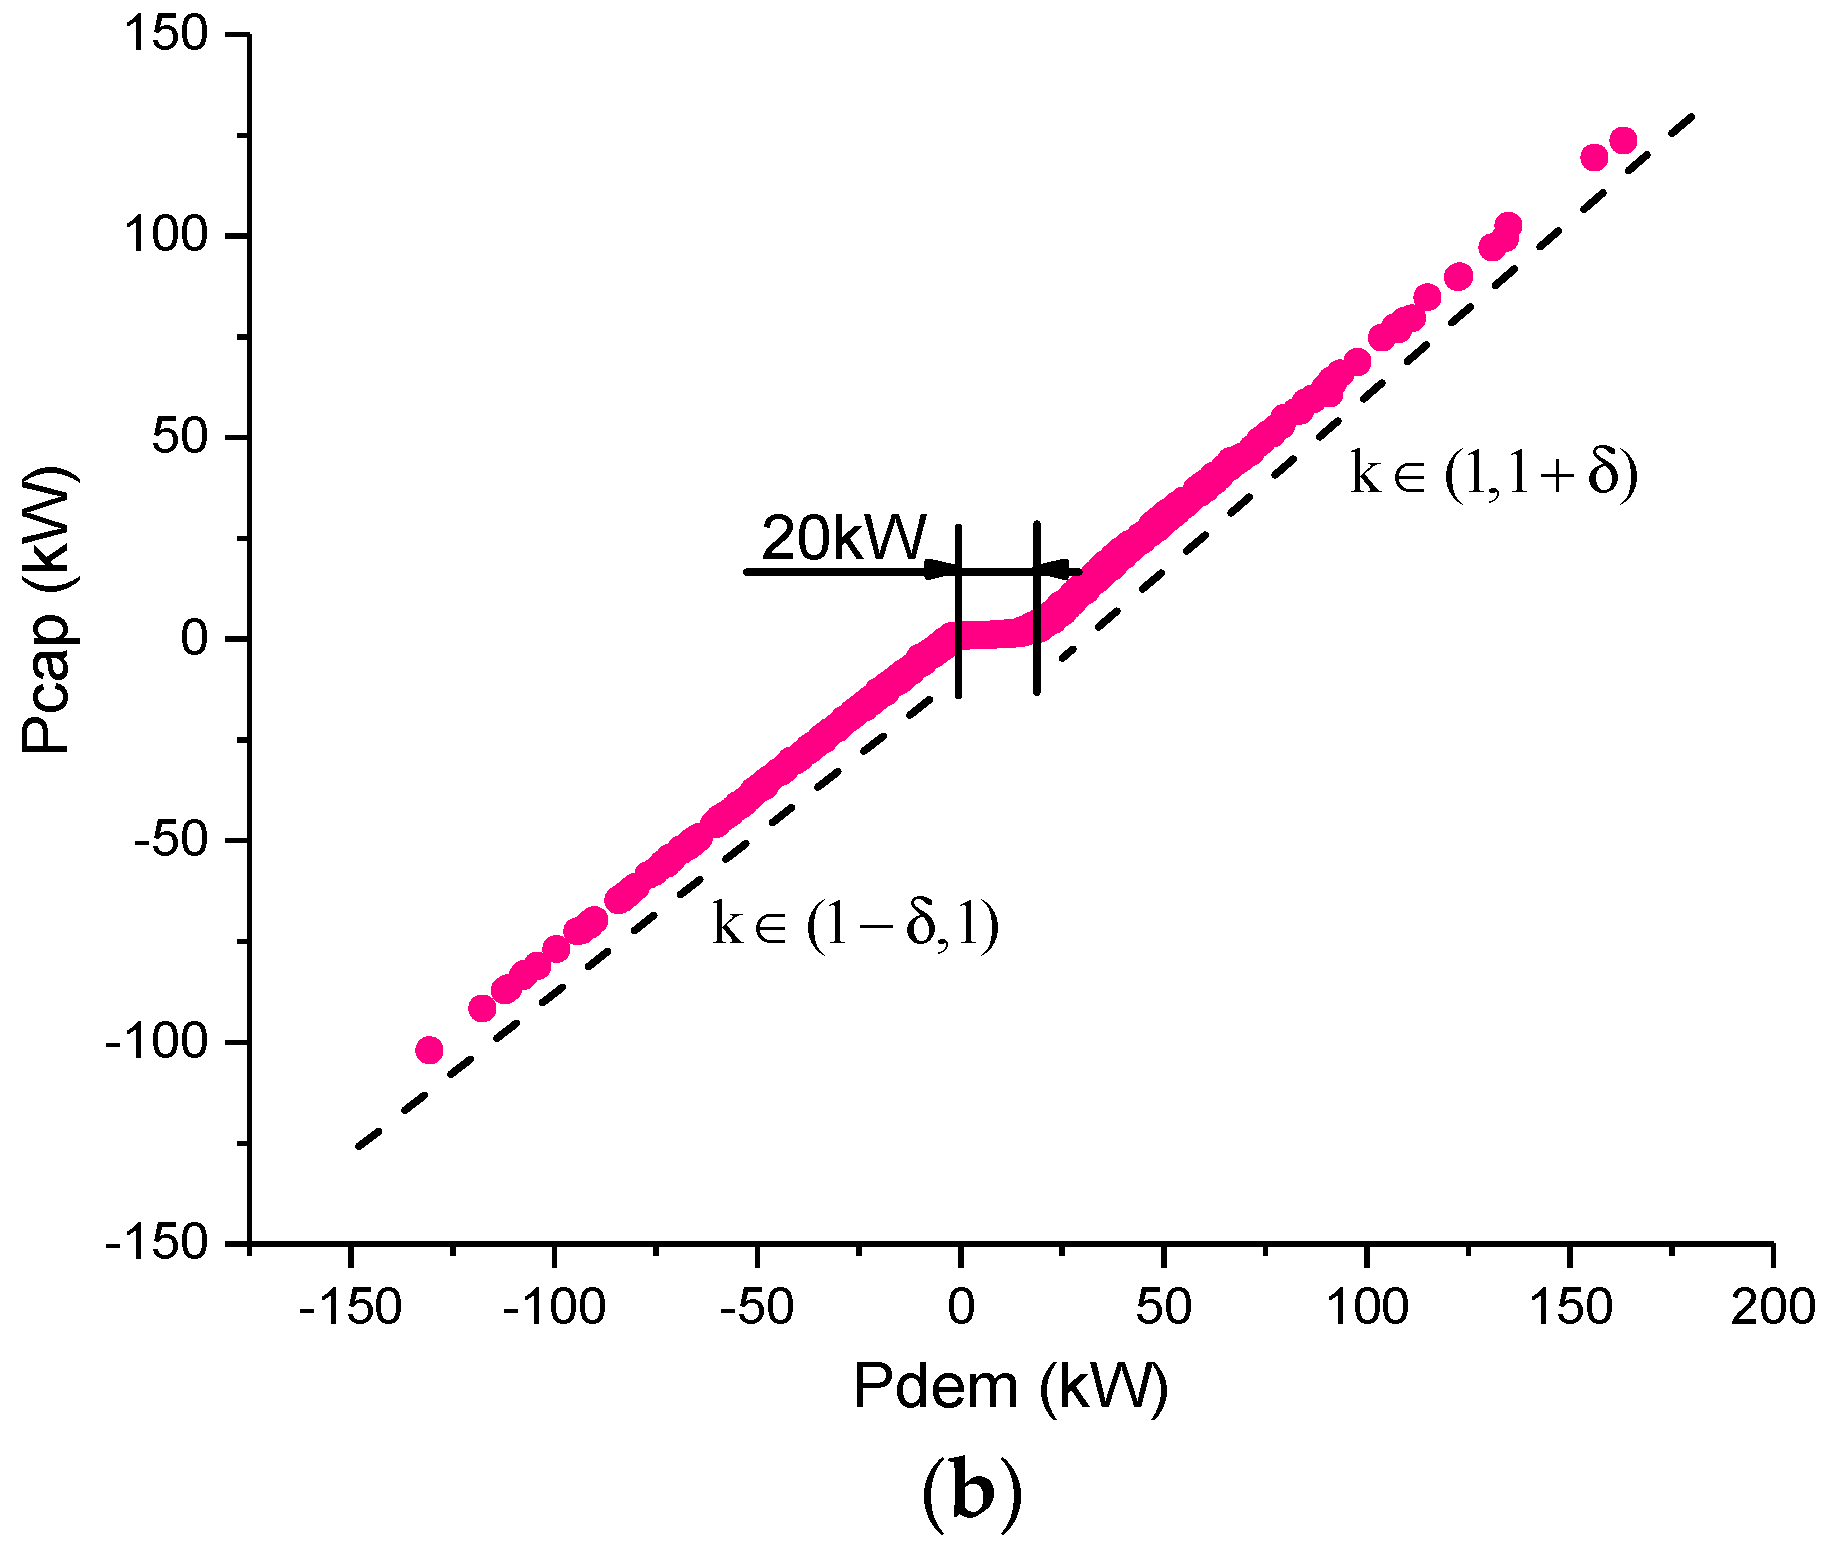
Figure 12.
Battery current and battery degradation percentage at room temperature of 25 °C based on convex optimization.
Figure 12.
Battery current and battery degradation percentage at room temperature of 25 °C based on convex optimization.

Figure 13.
The implementation process of rule-based strategy.
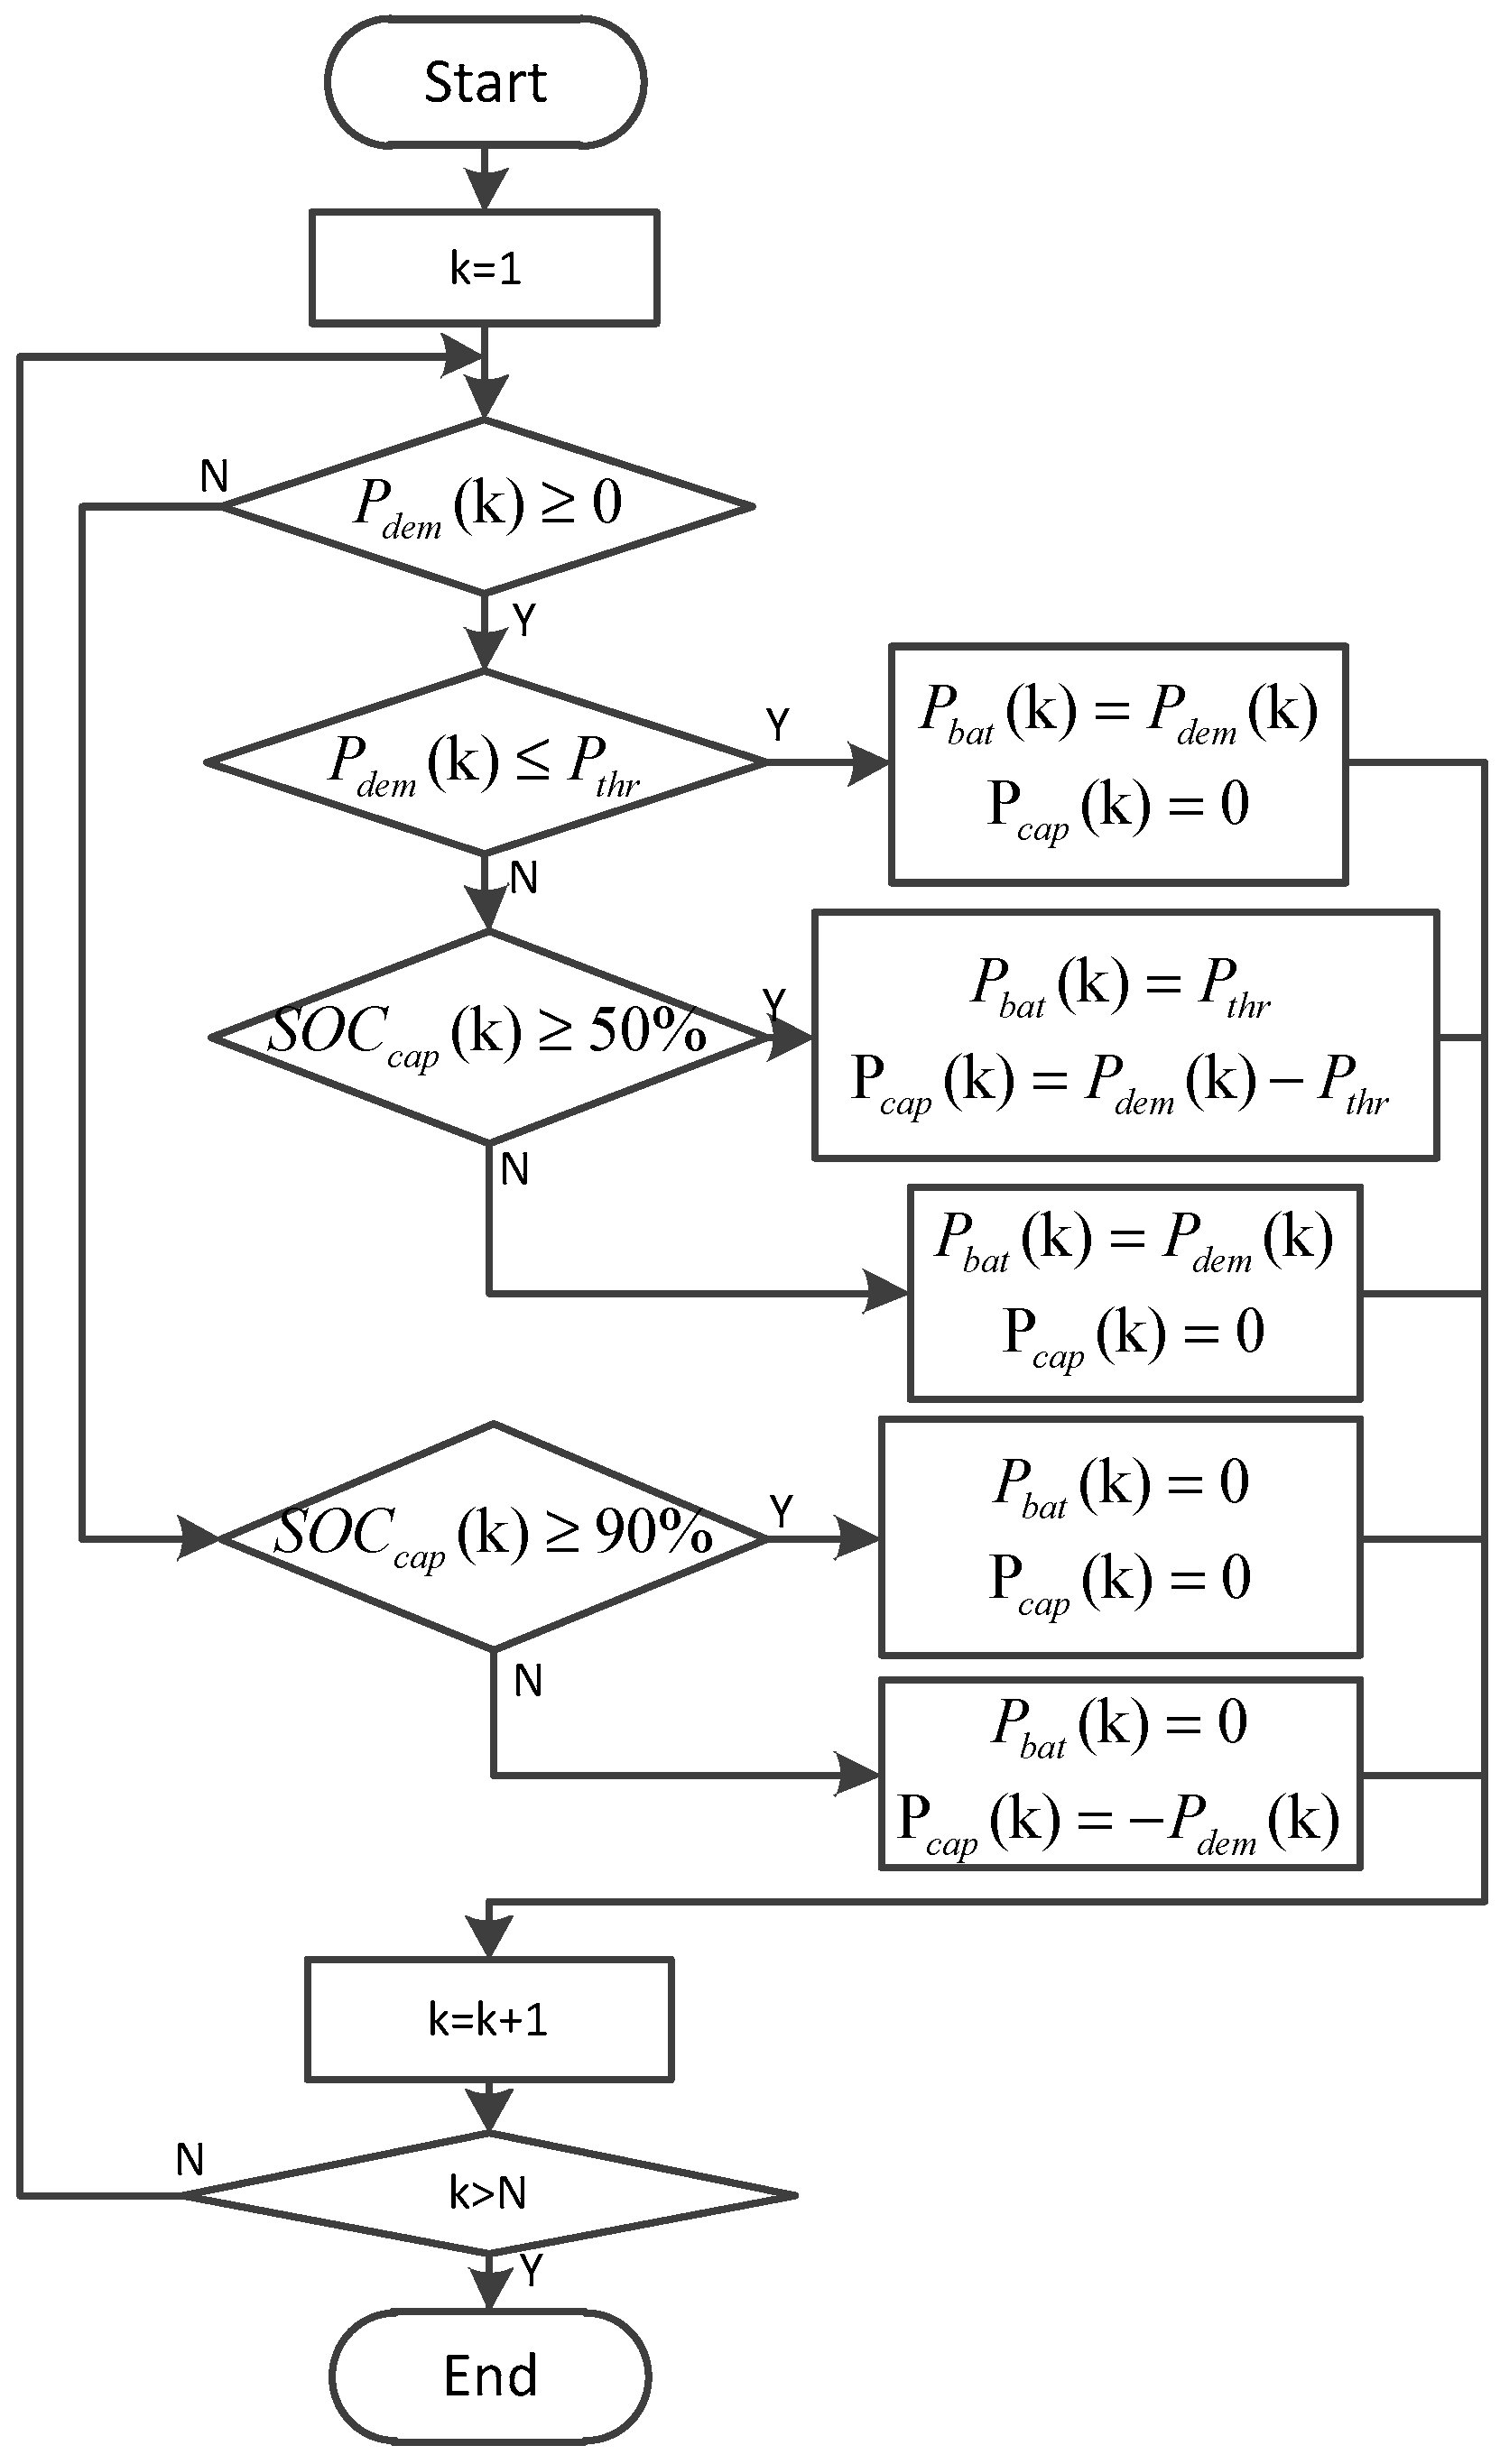
Figure 14.
Power distribution results based on the rule-based strategy.
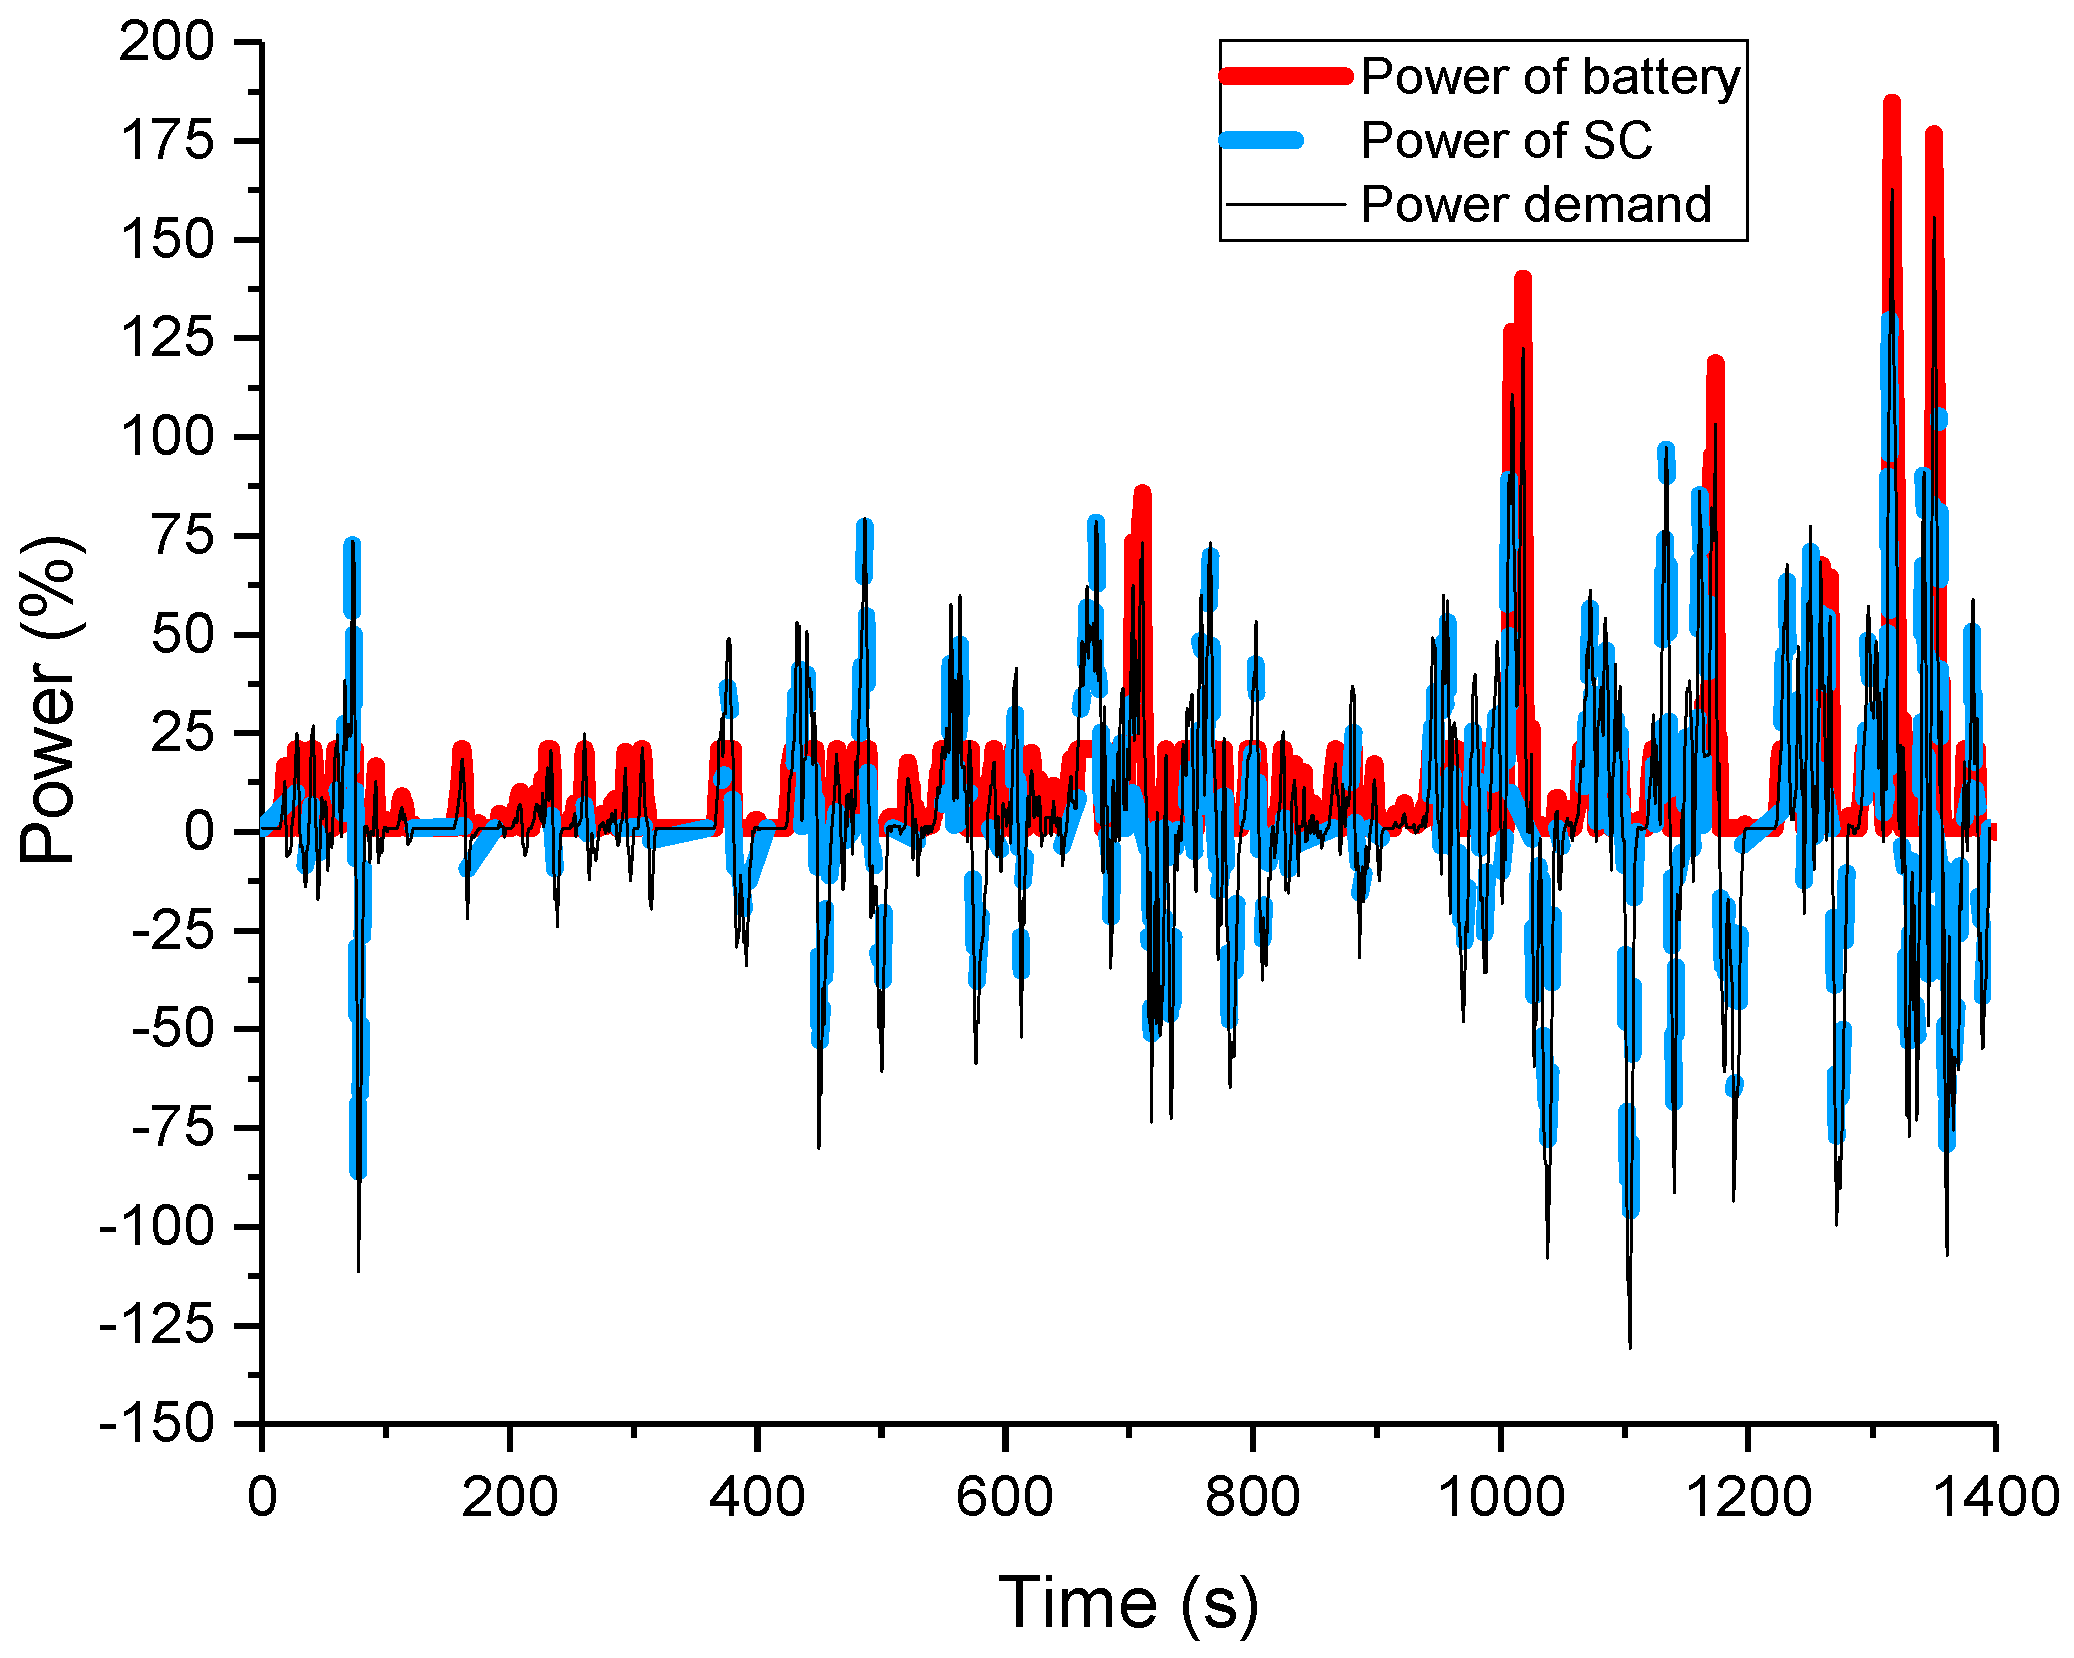
Figure 15.
Battery current and battery degradation percentage at room temperature of 25 °C based on the rule strategy.
Figure 15.
Battery current and battery degradation percentage at room temperature of 25 °C based on the rule strategy.
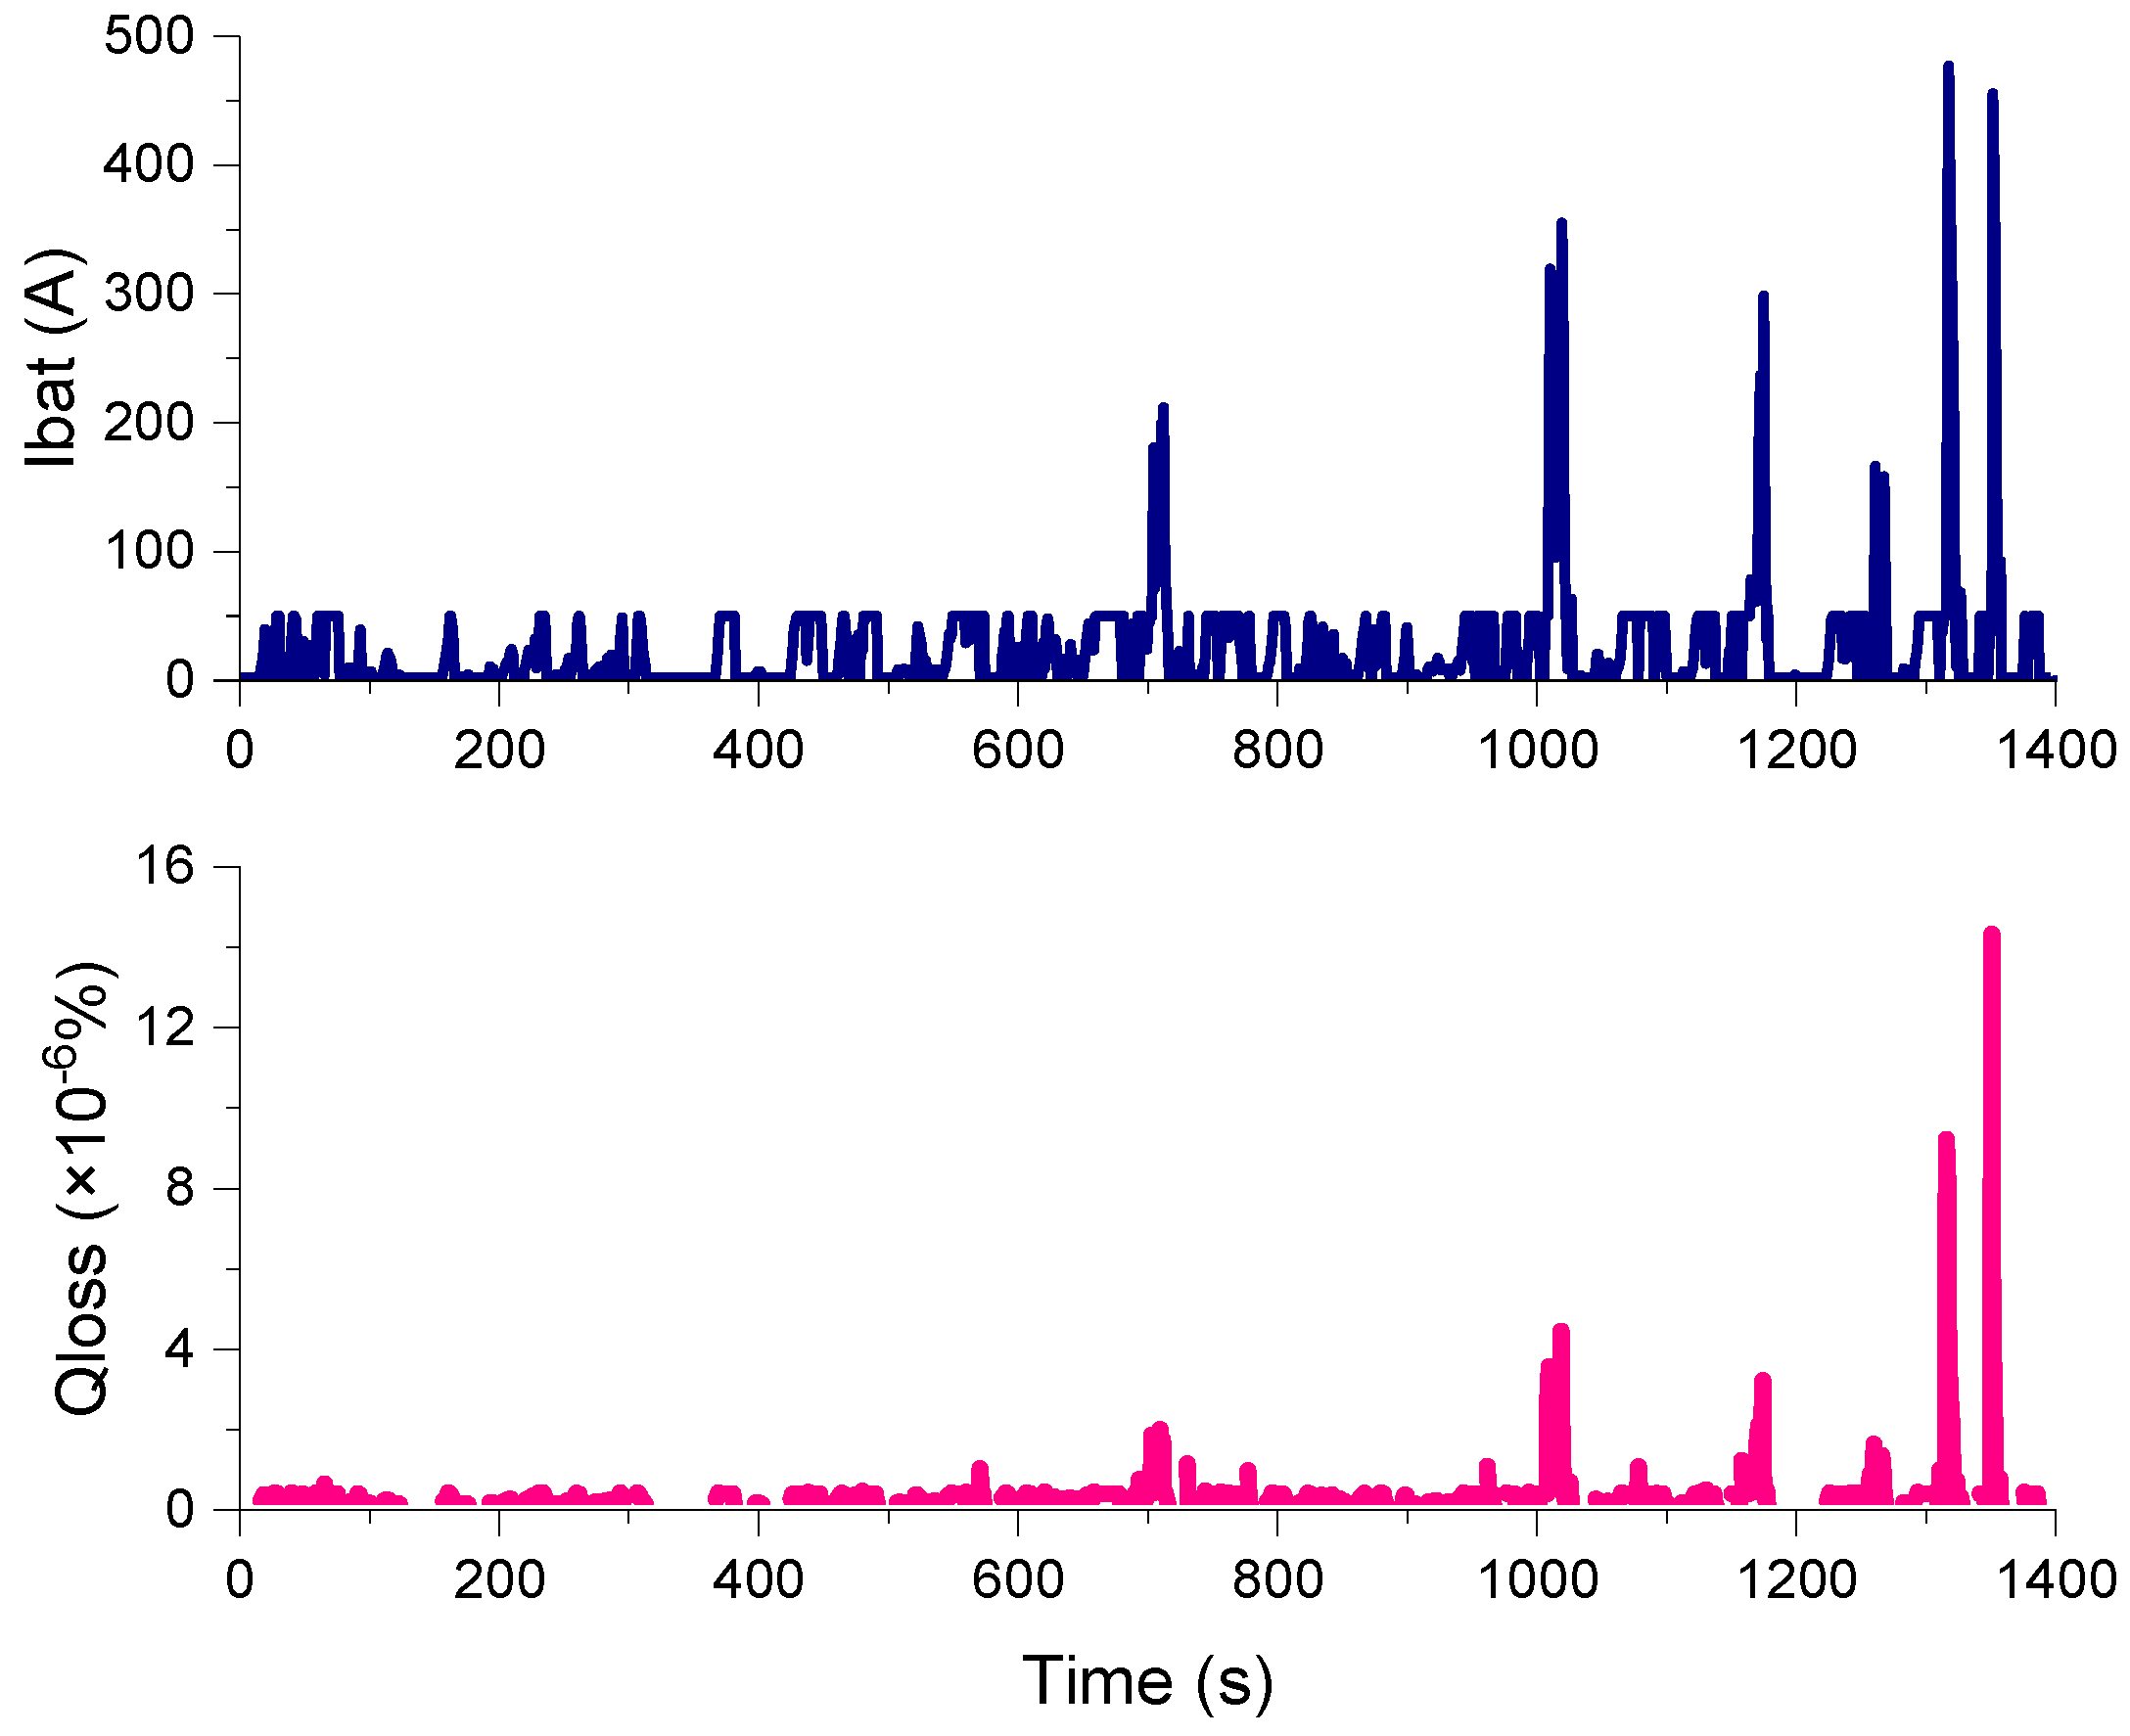
Figure 16.
The percentage of battery degradation under two strategies.

Figure 17.
The battery SOC change based on different power distribution strategies in one day: (a) the battery SOC based on the optimization strategy described in this paper; and (b) the battery SOC based on the rules of the power distribution strategy.
Figure 17.
The battery SOC change based on different power distribution strategies in one day: (a) the battery SOC based on the optimization strategy described in this paper; and (b) the battery SOC based on the rules of the power distribution strategy.
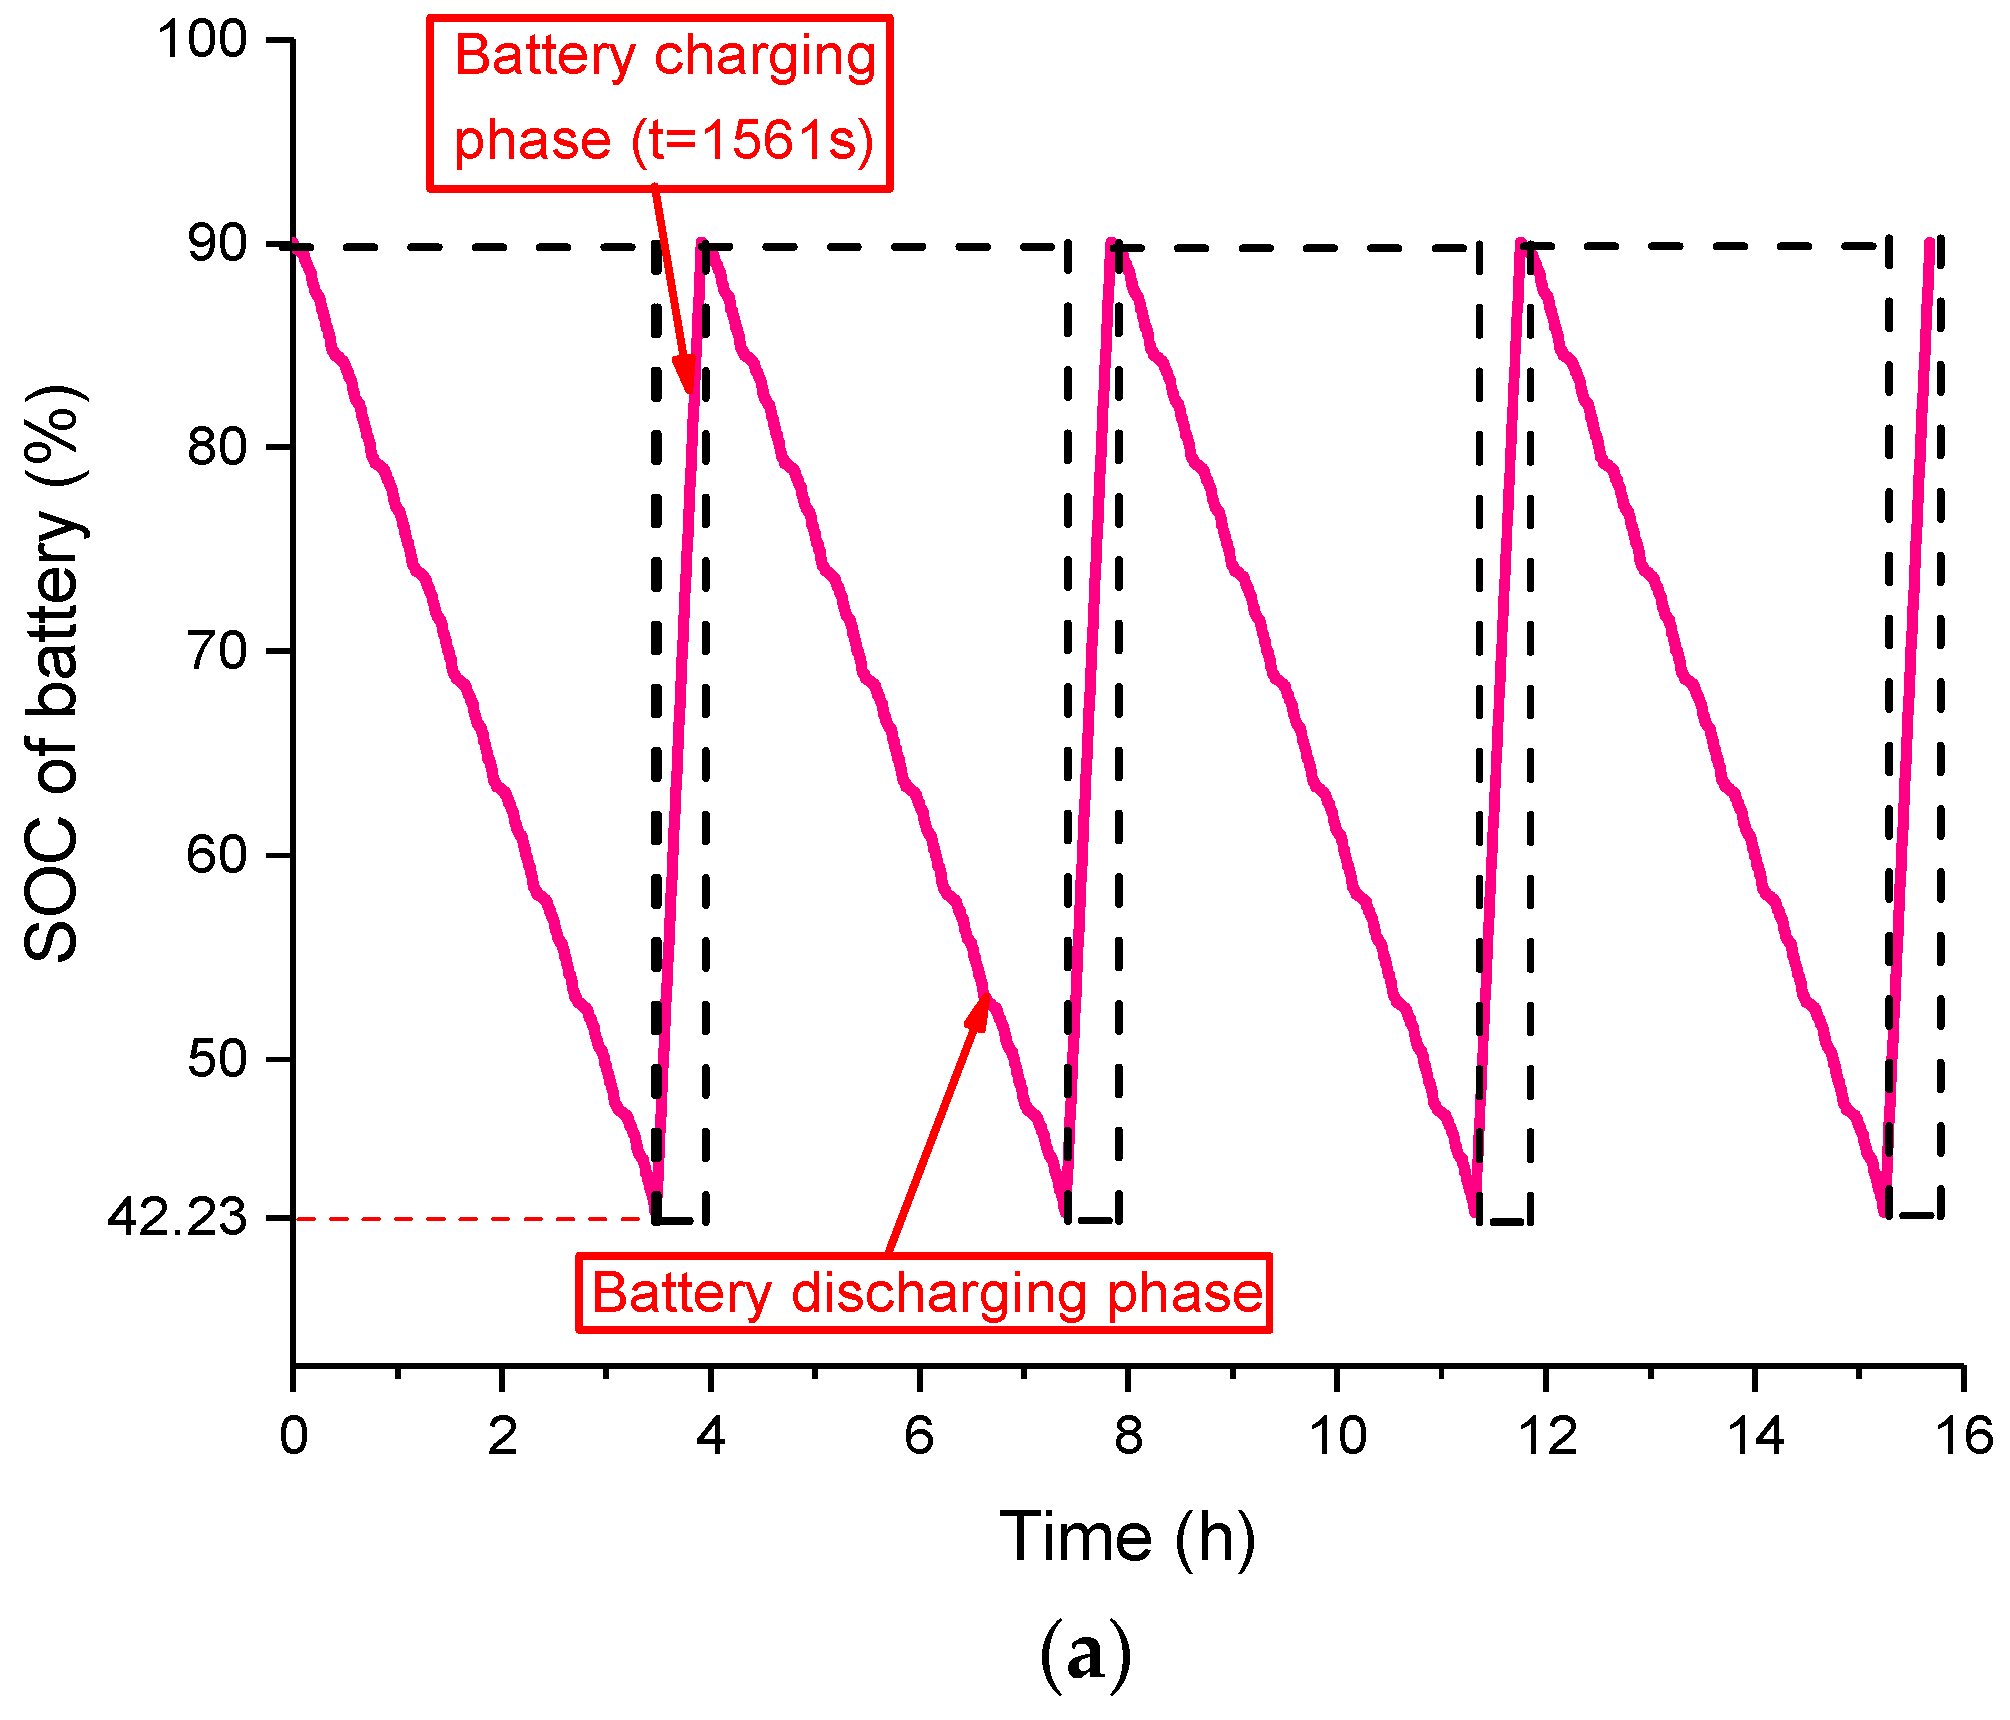
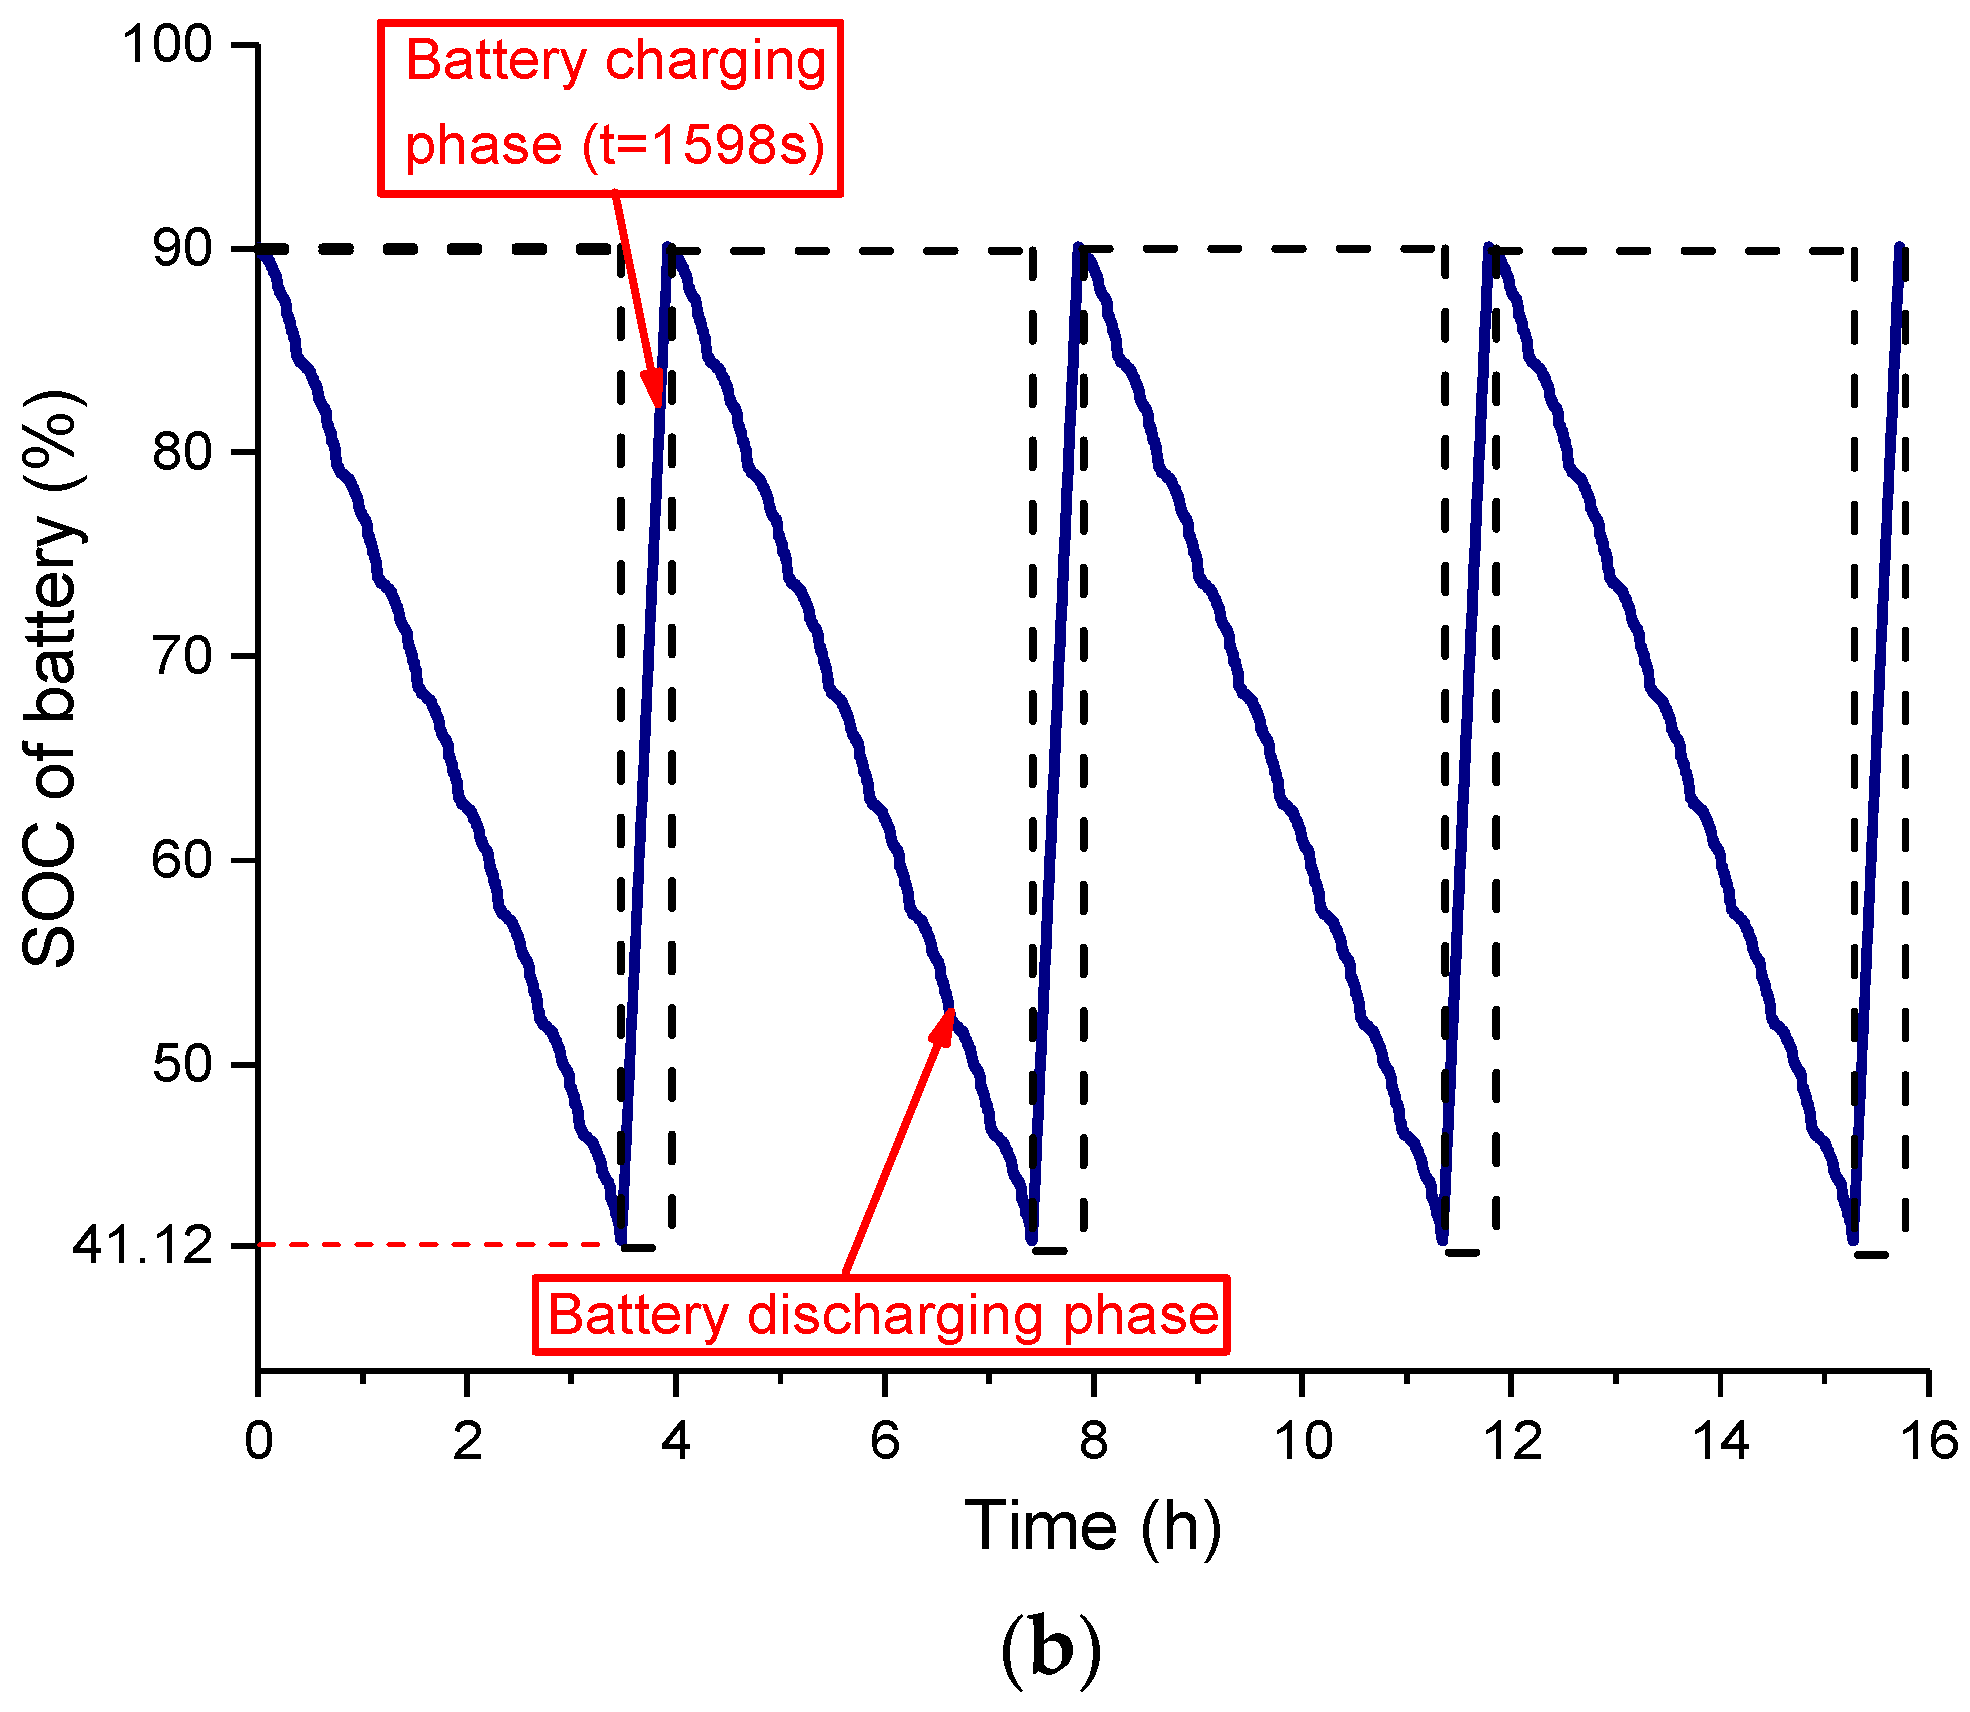
Figure 18.
Qloss based on the two strategies in one day: (a) battery degradation percentage based on convex optimization strategy; and (b) battery degradation percentage based on rules strategy.
Figure 18.
Qloss based on the two strategies in one day: (a) battery degradation percentage based on convex optimization strategy; and (b) battery degradation percentage based on rules strategy.

Figure 19.
Percentage of battery degradation Qloss in one day for different months.

Table 1.
Basic parameters of the LiFePO4 battery cell.
| Item | Value |
|---|---|
| Vbat_norm, nominal voltage (V) | 3.2 |
| Qbat, capacity (Ah) | 180 |
| mbat_cell, cell mass (kg) | 5.6 |
| Ibat_max,min, max dis/charge current (A) | ±540 |
Table 2.
Basic parameters of the SC cell.
| Item | Value |
|---|---|
| Vcap_norm, nominal voltage (V) | 2.7 |
| Ccap, capacity (F) | 2 × 10³ |
| Rcap, resistance (Ω) | 3.5 × 10⁻⁴ |
| mcap_cell, cell mass (kg) | 0.36 |
| Icap_max,min, max dis/charge current (A) | ±1.6 × 10³ |
Table 3.
Basic parameters of the vehicle.
| Item | Value |
|---|---|
| mveh, body quality | 1.3 × 10⁴ |
| mp, passenger quality (F) | 3 × 10³ |
| cr, rolling resistance coefficient | 0.007 |
| ρ, air density (kg/m3) | 1.18 |
| J, total inertia (kgm2) | 143.41 |
| A, frontal area (m2) | 7.83 |
| cd, aerodynamic drag coefficient | 0.75 |
| Rw, wheel radius (m) | 0.51 |
| gfinal ,final gear ratio | 6.2 |
| ηDC, DC/DC converter efficiency | 0.9 |
| ηT, powertrain efficiency | 0.9 |
Table 4.
Convex optimization function of hybrid energy storage system
| Variables | |
| Minimize | |
| Subject to | |
Table 5.
The indicators of two strategies under one cycle line.
| Strategy | Total Length | Initial SOC | Final SOC | ΔSOC | Recharge Time |
|---|---|---|---|---|---|
| Based on convex | 50.4 km | 0.9 | 0.4223 | 0.4777 | 1561 s |
| Based on rules | 50.4 km | 0.9 | 0.4112 | 0.4888 | 1598 s |
Table 6.
The average temperature of the city in Harbin.
| Month | Jan | Feb | Mar | Apr | May | Jun |
|---|---|---|---|---|---|---|
| Temp (°C) | −18.3 | −13.6 | −3.4 | 7.1 | 14.7 | 20.4 |
| Month | Jul | Aug | Sep | Oct | Nov | Dec |
| Temp (°C) | 23.0 | 21.1 | 14.5 | 5.6 | −5.3 | −14.8 |
Table 7.
The total battery degradation percentage in different month of the year.
| Month | Jan | Feb | Mar | Apr | May | Jun |
| Qloss base on the convex/rules (%) | 0.348/0.375 | 0.315/0.342 | 0.252/0.276 | 0.195/0.216 | 0.231/0.252 | 0.261/0.282 |
| Month | Jul | Aug | Sep | Oct | Nov | Dec |
| Qloss base on the convex/rules (%) | 0.276/0.297 | 0.264/0.288 | 0.231/0.252 | 0.189/0.207 | 0.264/0.288 | 0.324/0.351 |
© 2017 by the authors. Licensee MDPI, Basel, Switzerland. This article is an open access article distributed under the terms and conditions of the Creative Commons Attribution (CC BY) license (http://creativecommons.org/licenses/by/4.0/).
Share and Cite
MDPI and ACS Style
Wu, X.; Wang, T. Optimization of Battery Capacity Decay for Semi-Active Hybrid Energy Storage System Equipped on Electric City Bus. Energies 2017, 10, 792. https://doi.org/10.3390/en10060792
AMA Style
Wu X, Wang T. Optimization of Battery Capacity Decay for Semi-Active Hybrid Energy Storage System Equipped on Electric City Bus. Energies. 2017; 10(6):792. https://doi.org/10.3390/en10060792
Chicago/Turabian StyleWu, Xiaogang, and Tianze Wang. 2017. "Optimization of Battery Capacity Decay for Semi-Active Hybrid Energy Storage System Equipped on Electric City Bus" Energies 10, no. 6: 792. https://doi.org/10.3390/en10060792
Note that from the first issue of 2016, this journal uses article numbers instead of page numbers. See further details here.