
The Influence of Small-Scale Power Plant Supporting Schemes on the Public Trader and Consumers

1
Institute of Power Engineering, Riga Technical University, Azenes Str. 12/1, LV-1069 Riga, Latvia
2
Mmeka Construction and Industry Trade Inc. Orucreis Mah. Tekstilkent Koza Plaza. A Blok. Kat 12. No.:46, Esenler, 34220 Istanbul, Turkey
*
Author to whom correspondence should be addressed.
Energies 2017, 10(6), 800; https://doi.org/10.3390/en10060800
Submission received: 13 February 2017
/
Revised: 2 June 2017
/
Accepted: 6 June 2017
/
Published: 12 June 2017
(This article belongs to the Special Issue Selected Papers from 16 IEEE International Conference on Environment and Electrical Engineering (EEEIC 2016))
Abstract
:The mechanism of support schemes for achieving the required share of renewable energy sources (RES) was implemented into the energy sector. The issued amount of support requires state subsidies. The end-users of electricity are paying the mandatory procurement component taxes to cover these subsidies. The article examines the way of minimizing the influence of the existing RES supporting schemes on the consumers. The fixed purchased electricity price in the case of RES does not encourage producers to operate at hours of peak consumption or when the price is high. Modification of the RES support mechanisms at the legislative level, firstly, could minimize the influence of the mandatory procurement component on the end-users’ electricity price, and secondly, could provide a great opportunity for the public trader to forecast the operation of small power plants and their generation abilities. Numerical experiments with models of two types of power plants (biofuel and hydropower) prove the existence of a problem and the presence of a solution. This problem constitutes the main subject of the present paper.
1. Introduction
In the development of the power industry, the modern community is striving to achieve four main goals [1,2,3]: increasing of efficiency; increasing of the reliability level; decreasing of the harmful environmental impact and climate change; ensuring of sustainability.
To improve the efficiency of energy supply, power systems have been restructured and a competitive electricity market has been created. The traditional centralised management of the sector is being superseded by management that is based on adequate reflection of the price signals of the market subjects. The task of ensuring reliability is entrusted to operators of transmission networks. To reduce the impact of the energy sector on climate change and to ensure the conditions for its sustainability, ambitious renewable energy development programs have been adopted [4,5,6].
Looking beyond 2020 and striving to implement the above-mentioned programs, the European Commission has developed a network of renewable energy sources (RES) supporting schemes [7]. After several years of working with RES supporting schemes, the Commission has recognized the need for a more harmonized approach to RES support in the European Union (EU) [4]. In this article, an attempt is made to justify the necessary changes in the rules of support of renewable energy sources. To do this, an analysis of existing support mechanisms, identification of their deficiencies and a search for ways to eliminate them was made. As a result, we justified the solution suitable for small power plants, which are forced to operate at the conditions of limited primary energy resources. When resources are limited, the power plant operator can select the hours of operation or non-operation. The hydroelectric (HPP) and biofuel cogeneration power plants (CHPP) can be attributed to this type of plant [8]. A HPP is operating at the conditions of limited water inflow. CHPP often use primary resources that are a by-product of urban activities (waste processing for example), agricultural or industrial production, the volume of which is limited and subject to seasonal fluctuations. Over the past decade, there has been a steady and intensive growth in the number of such power plants [9]. Europe is the leader in energy production from biomass as almost 18 GW capacity is installed [10].
The effective operation of small power plants could solve tasks related to the regulation, planning and balancing of the system. An advanced supporting scheme can increase the effectiveness of using the state subsidies and the optimal distribution of the energy resources. The papers [4,5,6,7] have discussed the various aspects of selecting a support scheme for RES according to the importance of energy generation in the region and its capacity selection. The authors of [4] have collected data about the existing RES supporting schemes, breaking them up into policy objectives; according to the design element, the decision tree method has been implemented in order to understand exactly how relevant each type of support of RES is and which of them should be harmonized on the EU level. Almost the same as in [4] is analyzed in [6], discussing an appropriate instrument of solutions that can be implemented for RES. As the most important aspect, the authors of [5] single out the timing barrier of RES and the uncertainty regarding future targets. Here, the value of RES credits is stressed, as well as its effect on the prices for the consumers of 2020. In [7], the interaction of the European Emissions Trading Scheme (ETS) and national RES policies has been analyzed; the ETS proposes more rigorous rules for the supports to achieve more effective distribution of support.
The most common scheme for supporting RES is feed-in tariff [4], according to which the producer is paid a guaranteed price for electricity. It is obvious that with such a support scheme the manufacturer is not interested in generating power during the hours of its maximum demand. This is the main drawback of this scheme. Improvement of existing RES supporting schemes can reduce balancing costs in the peak hours. In this article, it is this task that we are striving to solve. The feed-in premium tariff described in [11] solves this problem, but not for the existing plants, to which feed-in tariff support subsidies were assigned before. Suggesting changes in the support mechanisms, one should see the impossibility of reducing payments to already operating (and licensed) power plants because it is impossible to revoke a license that has already been issued. From this, a task arises—to change the rules without breaking the law. To solve this problem, we propose a revision of the existing supporting schemes through the development of cooperation between the public trader and the RES operator at liberalized market conditions. In this case, after operational mode adjustment according to market prices, an additional income can be received. To further support the RES operator, cooperative game theory should be used (Shapley value [12,13,14]), which prescribes an equitable distribution from the additional profits generated by joint efforts of the members of the coalition.
The results show that the proposed approach reduces the necessary support, thereby reducing the tariff to the consumer and providing additional income for the plant. To the RES operators it means planning their generation during the day in such a way as to ensure reduction or increase of generation in accordance with the needs of the entire power system [15]. The above-described methodology can be considered the main contribution of the paper.
The second contribution is related to numerical experiments with models of biofuel and hydropower plants considering all the environmental and technical limitations. The ability of the producers to adjust the operational mode to the market price schedule proves the existence of drawbacks in the existing supporting scheme and the need to reconsider it.
The structure of the remaining part of the paper is as follows: Section 2 represents the topicality of the existing problem regarding the support of renewable generation; Section 3 represents a statement of the problem and the structure of the developed algorithm; Section 4 describes the results of the case study; and Section 5 concludes the paper.
2. Support of Renewable Generation
The right of the electricity producer using renewable energy sources to sell all the produced electricity at a guaranteed purchase price exists in all the European countries. The energy market competitiveness rules prescribe that all the power generated from RES should be sold to the public trader (which leads its activities in the interests of the consumers) at a guaranteed purchase price. Every day, the public trader sells and buys energy at the hourly market price; the difference between the guaranteed and market prices is covered by the electricity consumers. The guaranteed purchase price does not encourage the producer to choose the operating mode according to the market price because RES power plants are maximizing the amount of generated energy to receive higher profits. The absence of coordination of power plant operation according to the electricity market price is the main drawback of the support scheme [4]. The producers of electricity from RES do not suffer from the price fluctuations since they receive from the public trader, on an hourly basis, the same purchased electricity price. The important aspect is that such kind of regulation will not affect the income received by the producer but, on the other hand, it will affect the reduction of the difference between the trading prices, thus reducing the mandatory procurement component (MPC) or leaving it at the same level. The operation of such power plants at the operators’ own discretion affects not only the operation of the whole power system but also the individual plants because, as a result, they do not receive optimal operational control and distribution of the energy resources.
The scope of support can be divided into different types: feed-in tariffs (FIT), feed-in premiums (FIP), green certificates, etc. [2,3]. The total value of the support issued for RES dictates the value of the MPC. Almost every country in the EU has its own supporting approaches to RES. In our article, the support schemes and their influence will be examined on the basis of the example of Latvia; however, the results provided in this study could be useful for any supported power plant. Latvia has the fourth highest MPC payment in the EU and the non-competitive situation is still intensifying for the large electricity consumers. The total amount of the existing support (in Latvia) above the market price in millions of € in 2015 was 254.9. The distribution of the MPC among the recipients in 2015 is presented in Figure 1 [16]. The mandatory procurement from RES including biogas power plants, biomass power plants, wind power plants and small hydropower plants equaled 37.1% of the total support amount in 2015. The mandatory procurement from the fossil-fueled combined heat and power plants equaled 18.6% of the total support amount in 2015, whereas the capacity payment (RES) equaled only 2.0%. The capacity payment for the fossil-fueled combined heat and power plants equaled 42.3% of the total support amount in 2015 [16].
The total support to renewable energy, given the small dimensions of the country, should be recognized as very significant. An indirect confirmation of that can be seen in the rapid increase in the number of new small power plants [1]. Unfortunately, the considered process directly affects the electricity tariff. The total price of the consumed electricity for the end-user is formed by a number of significant factors and the final tariff consists of the following: the electricity trade price, €/kWh [1]; the tariff for the services of the distribution system, €/kWh; the tariff for the mandatory procurement component (MPC), €/kWh [1,17]; the value-added tax, €/kWh—traditionally, the most significant component in this cost category consists in the value-added tax (VAT) as well as the electric energy and emissions taxes [1].
Within the support to the environment-friendly producers it is necessary to significantly increase the electricity price. The income of the supported energy producers who receive support from the government is not affected by the hourly market prices. As a result, energy is produced at the hours when the price is low and at periods of low demand, instead of periods when the prices are high or at peak hours. This fact affects not only the operation of the whole power system but also the individual plants, because, consequently, they do not receive optimal operational control and distribution of the energy resources (Figure 2).
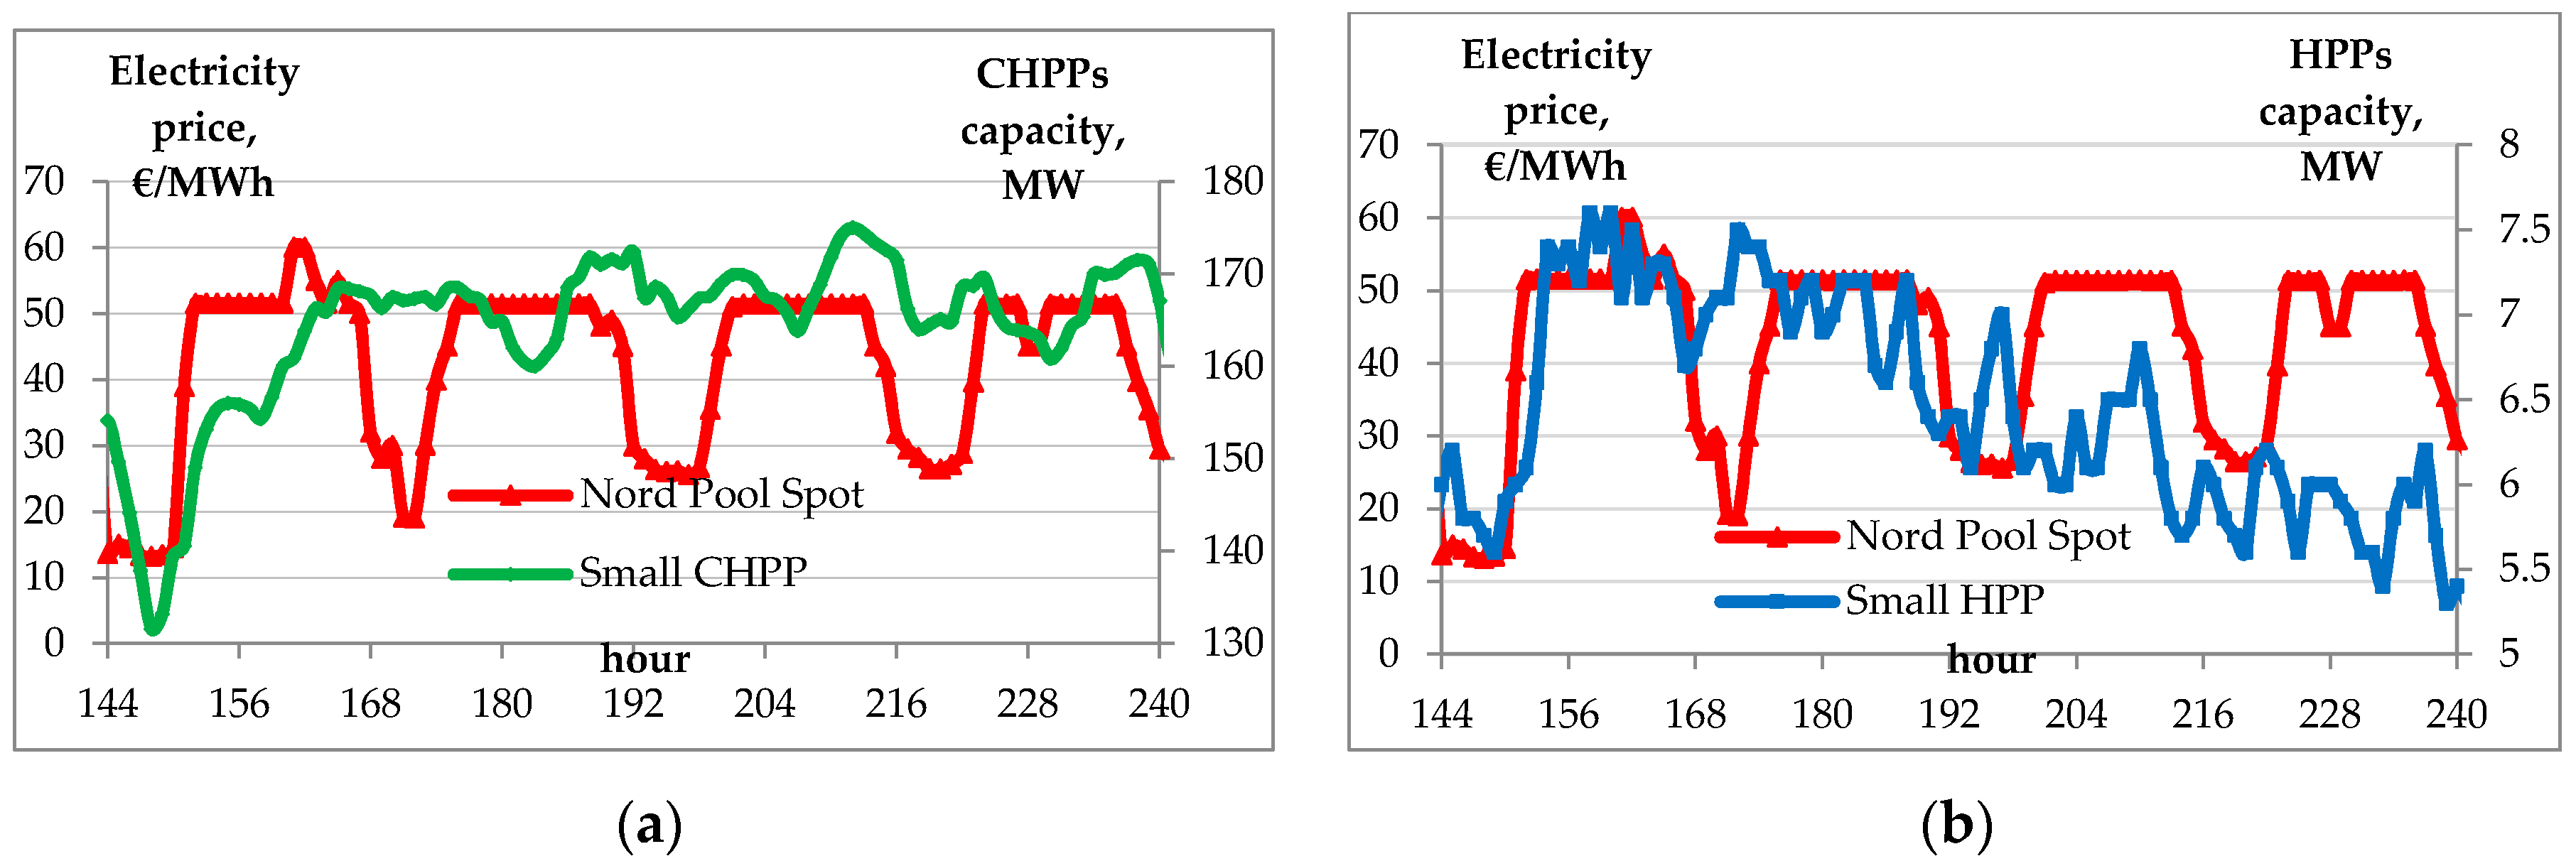
Figure 2 shows a schedule of electricity generation by a group of small HPPs and CHPPs with a total capacity of 9.2 MW and 175 MW, respectively, for the year 2015. An analysis of the processes of change in the prices and the amount of generated energy enables a conclusion about insufficient co-ordination of the observed processes.
3. Task Statement
Three formulations of the task of optimizing the operating mode of power plants are possible:
- The problem of optimization under operating conditions at a fixed price of the generated energy.
- Using market prices as the main signal that influences the schedule of generated energy.
- Optimization at the conditions of forming a coalition, which includes the operator of a power plant and an electricity trader. We assume that the trader represents the interests of society.
The first problem formulation supposes that the price is fixed (RES are supported by the feed-in tariff). In this case, the producer strives to maximize profit R by choosing the amount of generated energy; thus:
Subject to the inequalities: regarding the limits of capacity of the i-th unit over every t-th hour, MW: , regarding the summary used energy resource limitation (for example, at a CHPP it is biofuel, whereas at a SHPP it is the amount of water used in the reservoir over the whole day period, m3): ; where , the fixed electricity price, €/MWh; , the electricity market price over every t-th hour, €/MWh; , the energy generated by the i-th unit over every t-th hour, MWh; , the maximum/ minimum capacity limits of the i-th unit, MW; , , the energy produced that corresponds to the maximal revenue, MWh; , the energy production cost function, €/h; , the amount of energy resource used over hour t, m3/h; , the amount of the energy resource available for use during the optimization period T (it can be expressed in m3 of bio fuel or water). It is assumed that the producer has N production units, and those are using the same energy resource.
The energy is generated by the schedule chosen using (1); the trader sells it on the market, receiving income :
however, the power plant is paid a different amount , which is calculated using the guaranteed prices:
as a rule, MT2 > MT1. The difference between incomes such as: is paid by the community.
If the second problem formulation is used, the objective function is formulated striving to maximize the profit received by the power plant from selling the energy at the market price together with the consideration of the constraints as in (1):
The energy generated by the schedule chosen using (1) is sold by the trader on the market, receiving income :
as a rule, .
It has to be pointed out that when selecting the operating mode according to (4), the amount of generated energy may somewhat diminish. However, in this case the energy will be sold at the hours when the prices are higher and, hence, the public trader will receive additional income: , which can be distributed among the public trader and the producers or can be used to repay the state’s RES subsidies and reduce the MPC.
Unfortunately, according to the mandatory procurement conditions, all the energy generated from RES is purchased by the public trader at a fixed price . It means that the power plant, regardless of the operating mode, which has been selected according to the market price, will receive revenue calculated according to the fixed price. As a result, the energy producer is not interested in choosing such a regime because it can reduce its profit. In addition, power plant control in the second case is more complicated. In order to change the situation and make the power generator interested in the operating mode, taking into account the market price, the public trader must share with him part of the additional profit. This is possible if a coalition (the third formulation of the optimization problem) is created that establishes a contractual relationship between the trader and the producer. In this case, transition from the first regulatory regime to the second one is possible and ensures an increase in revenue that must be distributed between the trader and the producer. The new task of a fair distribution of additional profits arises. The Shapley value is one way to distribute the total gains to the players, assuming that they all collaborate [12,13,14]. In this paper, the description of power system relations between a public trader and a power plant is considered. The public trader is purchasing all the energy produced from RES. The contribution of the power plant to the reception of additional profit is only possible in a coalition with the public trader and is independent of the participation or non-participation of other power plants in the coalition. Thus, the game includes only two players and the Shapley distribution value and for both players in that coalition leads to the very simple equation:
Therefore, the additional income from establishing the coalition has to be split in half. We suppose that the public trader represents the community’s interests; as a result, some part of the additional income is aimed at reducing the mandatory procurement components.
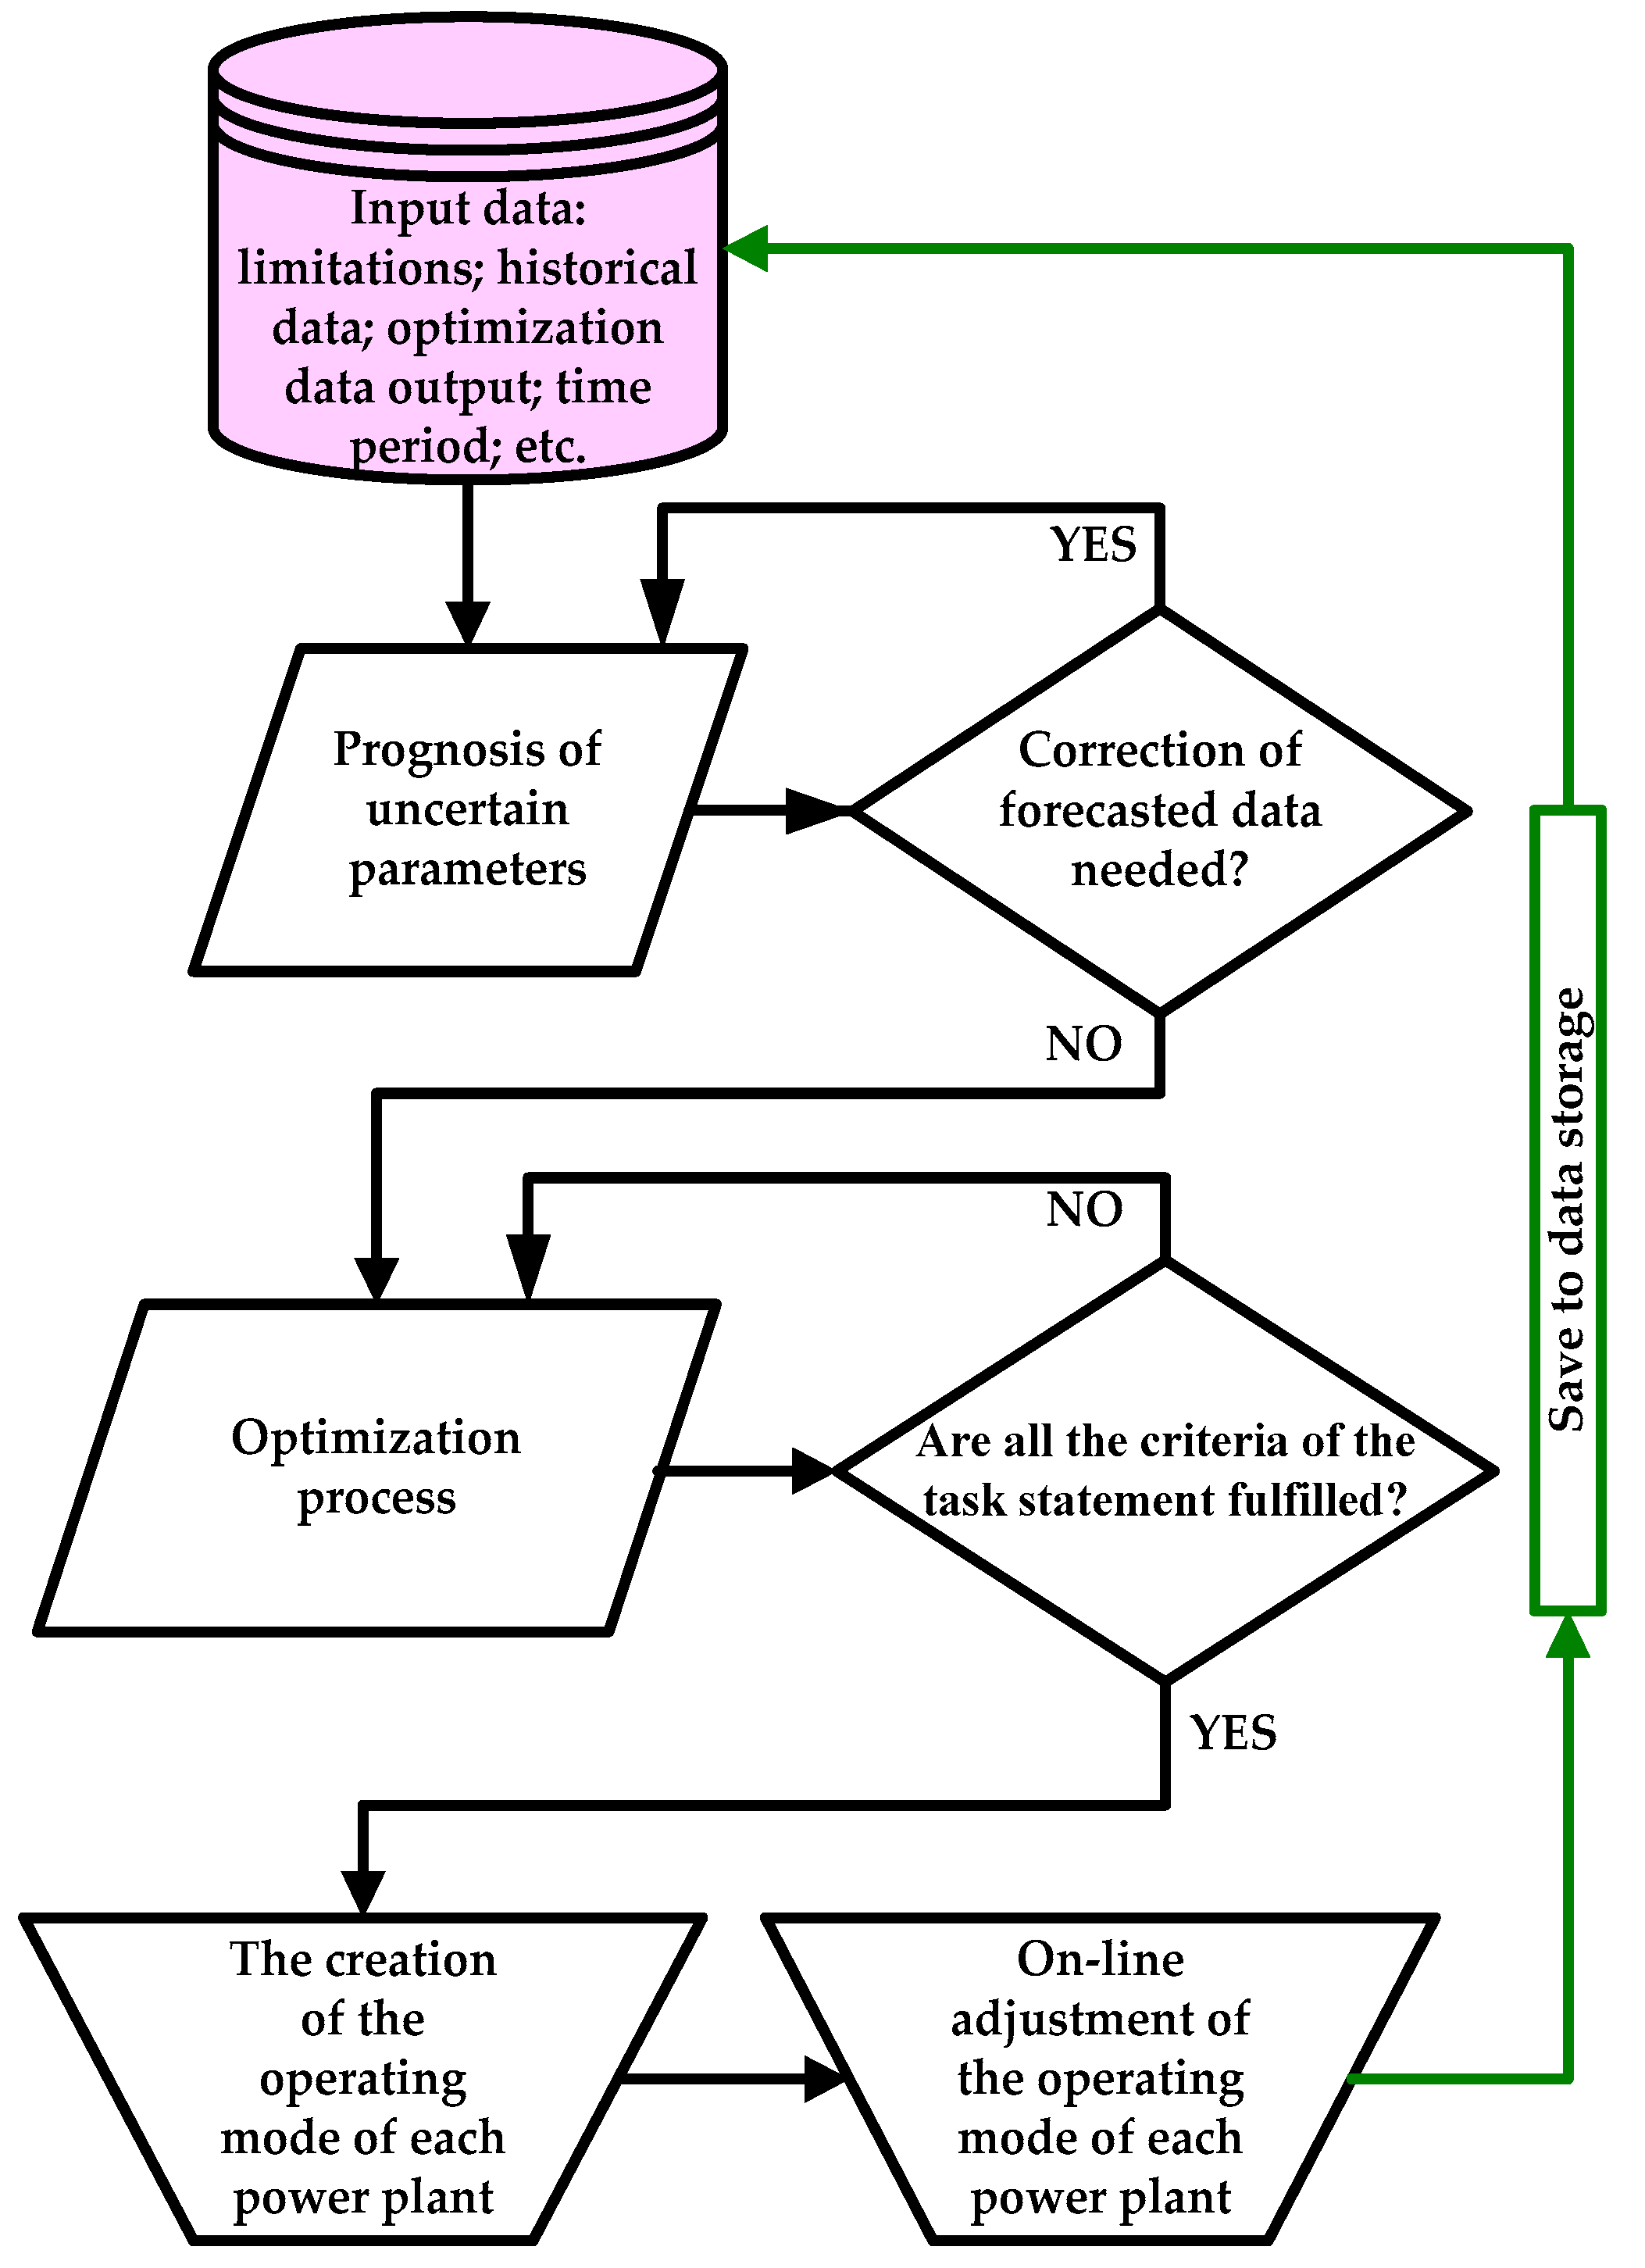
A simplified structure of the power plant optimization process is presented in Figure 3.
Currently, the management of small power plants is largely autonomous and does not require the use of highly qualified personnel and complex software tools. The optimization model of power plant operation according to market prices will complicate the personnel’s work. To resolve this issue, we can use the services of a special company (aggregator), which serves many power plants and can generate the station’s operation mode online.
The optimization objectives, the structure of the power plant and the characteristics of fuel dictate the specific task statement. The first factor to be considered for choosing the formulation of the problem is the time range. This time range can vary widely. In generation schedules, planning time can vary from 24 h to 2 weeks or even longer (for example, the operation of a biogas power plant should be determined for a planning horizon within one week (T = 168 h) or a longer period, since the process of biogas production from raw materials should be considered). In tasks of estimating the economic efficiency of a power plant, selecting the structure and power of equipment, the planning time may reach the values of several decades of planning. In such cases, the above-mentioned expressions can serve as a basis for evaluating economic indicators, for example, net present value (NPV) or internal rate of return (IRR) [15]. The second factor that influences the formulation of the task consists in uncertain variables such as: water inflow, ambient temperature, wind, etc. The uncertainty renders our task stochastic. The third factor that should be considered is the subtask of maximization of the objective functions taking into account the technological and environmental limitations.
The task solution starts from the prediction of the random processes (a forecast of the water inflows, the market prices and the heat demand). A significant number of publications have been devoted to the solution of prediction and optimization issues [18,19,20]; a detailed description of the procedures used in the present article is beyond its scope. The volatility and uncertainty of the electricity price is widely discussed in [19]. Prediction can be performed using an artificial neural network. The algorithm and procedures used have been described in our previous works [21,22,23,24].
4. Case Study and Results
The case studies based on the regulation of RES according to market prices will demonstrate the opportunity to reconsider the mandatory procurement component in the future. The example of optimization is based on a real-life small-scale biogas power plant (CHPP) and a small hydropower plant (SHPP). First of all, we maximize the income received by the producer of electricity from RES. At the same time, indirectly, we reduce the influence of the MPC on the electricity market price [21]. The results based on the examples of a small CHPP and a small HPP prove the existence of the problems and of ways of solving them. It is assumed that the cost characteristics remain the same during the considered time horizon.
4.1. Biogas CHPP Description
The first example is based on the optimization of a real-life biogas CHPP to show the dependence on the raw material used in the production of energy. We take into account that the total amount of thermal and electrical energy produced depends on the type of biomass resource loaded into the fermenter over a planning time horizon of one week [25,26,27].
The potential energy output depends on the type and amount of raw material (m3) and its calorific value (kWh/m3) [28]. In our case study, it is assumed that the biogas CHPP operates in cogeneration regime. The input data for the considered small CHPP is provided in Table 1. The selected time period depending on the biogas production peculiarities is 168 h. The biogas yield value is needed to create the optimization model of the power plant. The production of electricity and heat depends on the amount of biogas used, the efficiency of the gas turbine and the calorific value of the biogas.
The main criterion of our optimization problem is based on the restricted amount of biomass used; it should be equal to the total input of chicken manure for fermentation for the whole optimization period.
4.2. Small-Scale HPP Description
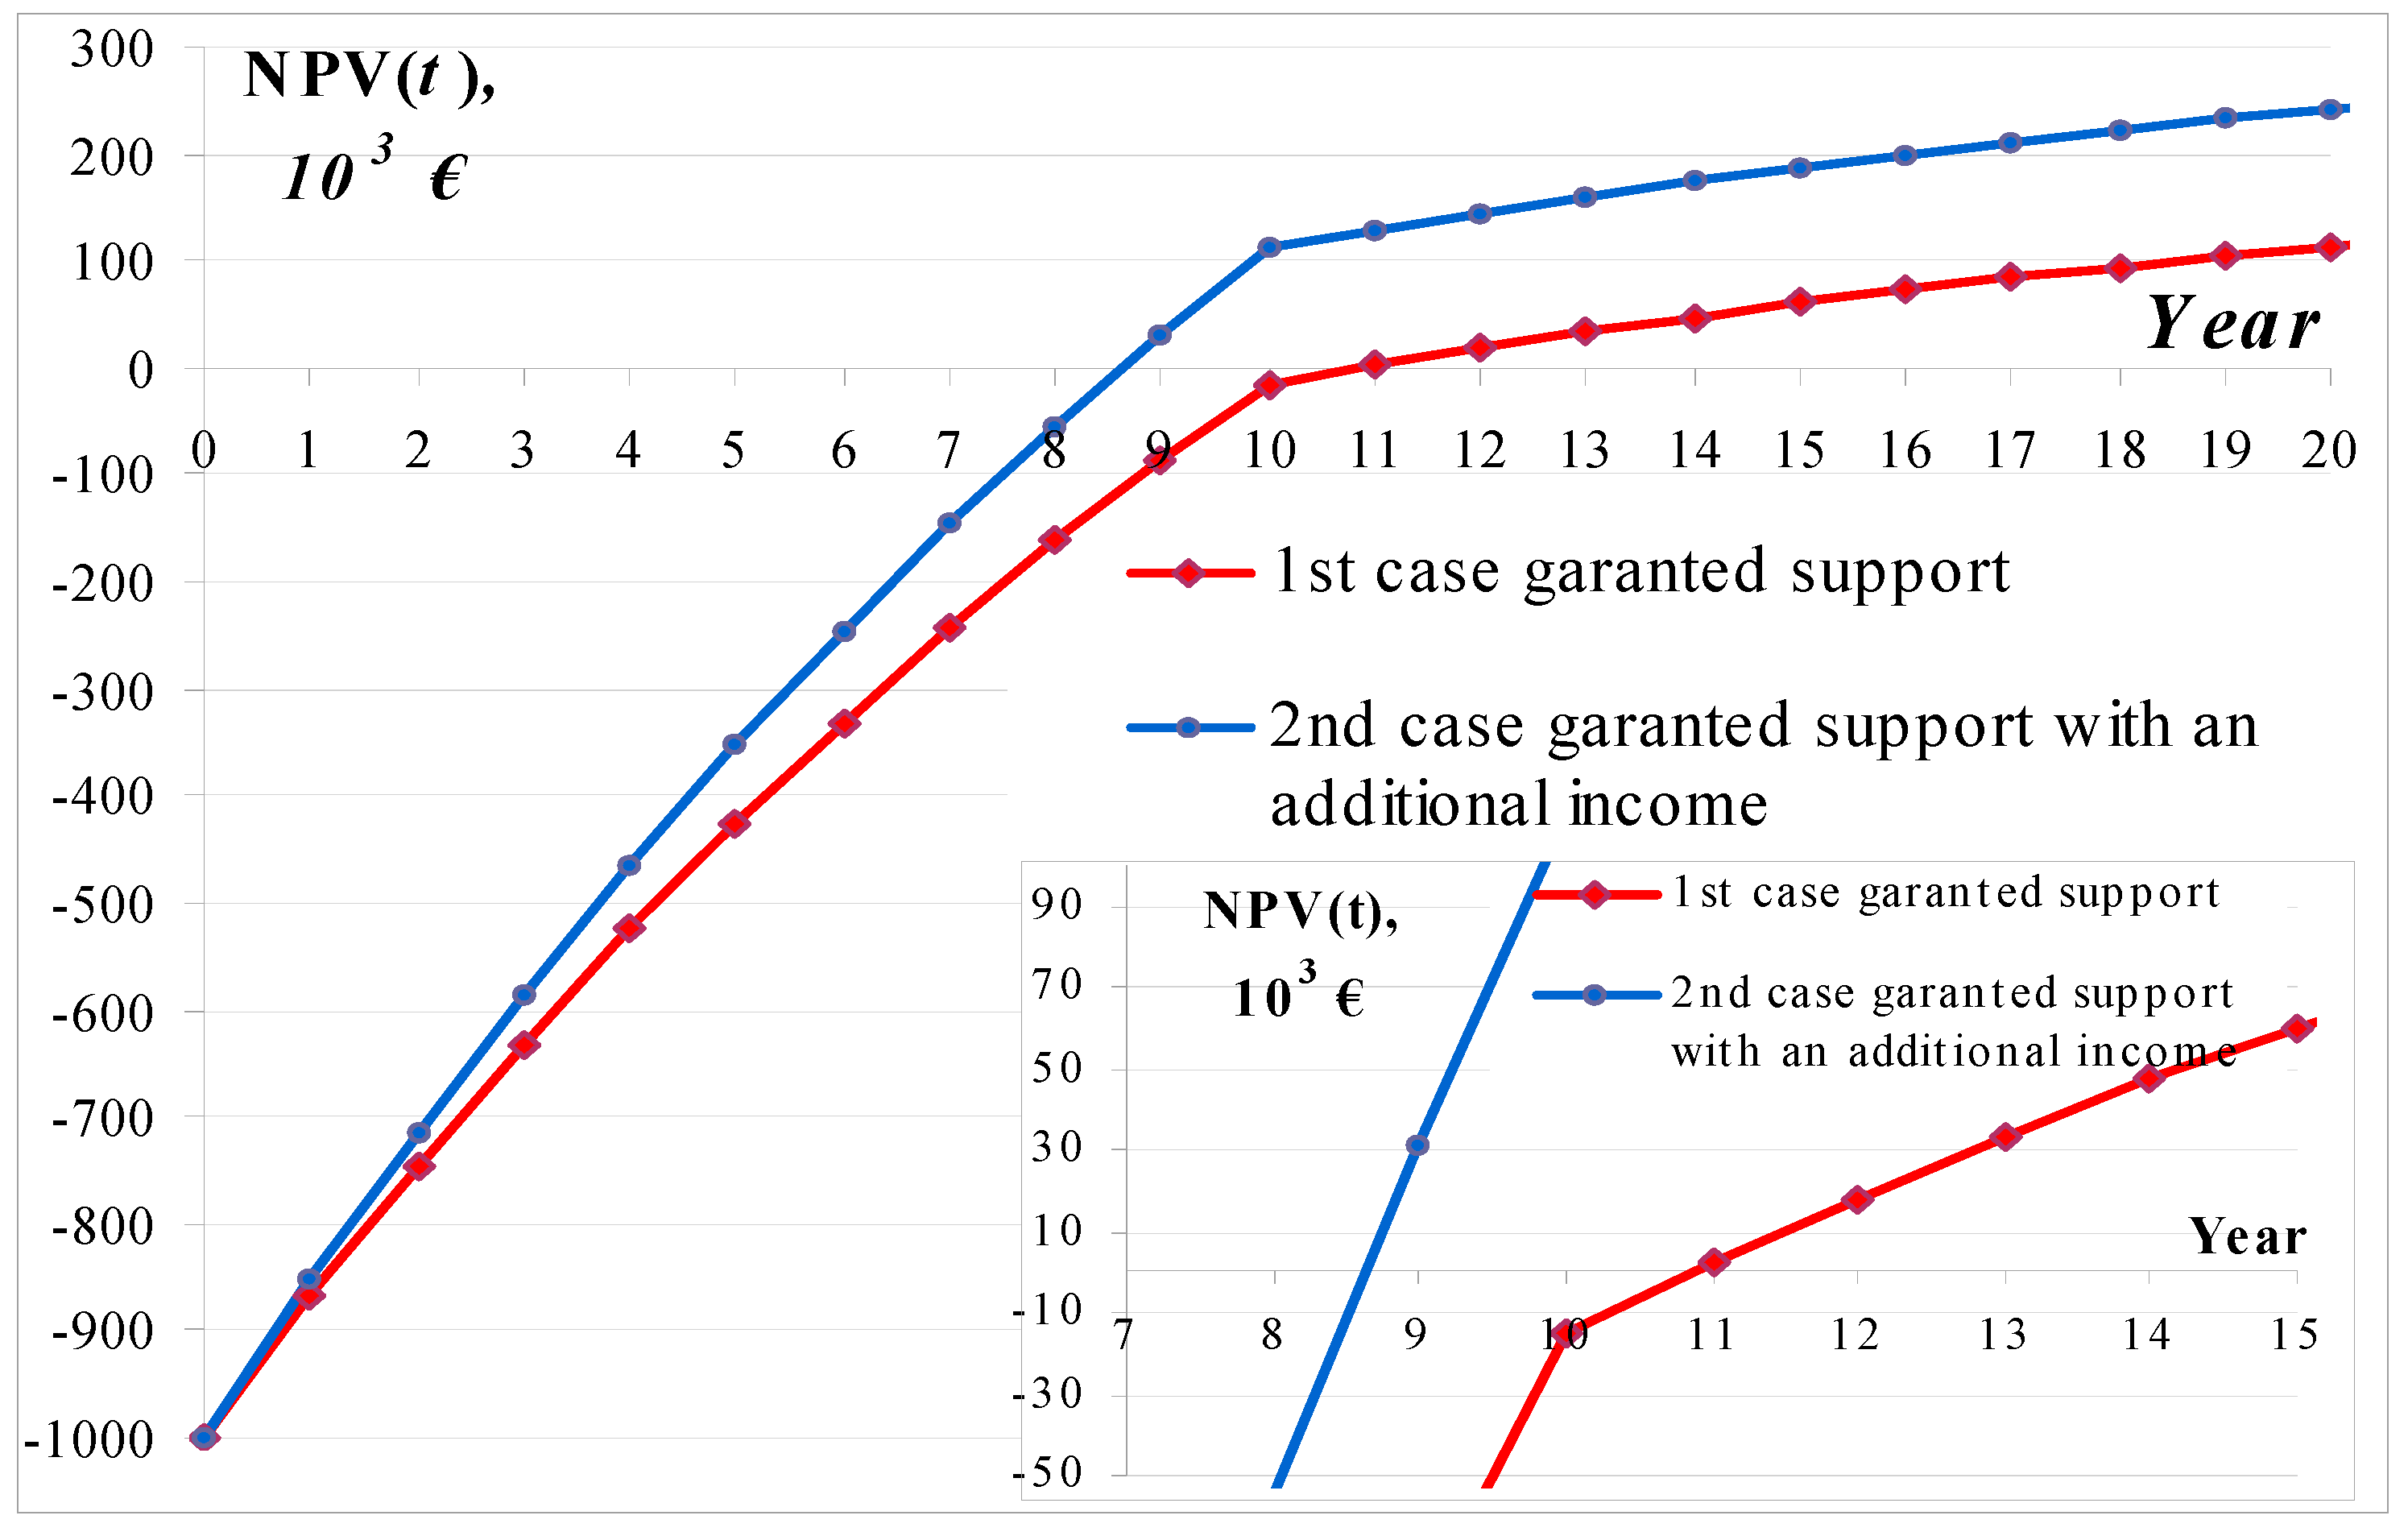
The second example shows the effect of the existing supporting schemes on the income received and is based on an economic feasibility study for a SHPP and calculates the difference between the income from fixed and market prices. We show the income computed by (1) and (2) and the net present value (NPV). If the producer receives additional income, the growth of the NPV accelerates. It is necessary to determine the rate of profit from the construction of the SHPP. The NPV calculation time period is 20 years. During the first ten years, the generated energy is sold at a fixed price. For the remaining ten years, it is sold at the market price.
The distinction from the already existing study lies in optimization, which is performed hourly for each year; the producer is planning their regime by assuming the day-ahead market results. The first case shows generation maximization according to a fixed price (the first ten years) and after ten years, the energy is sold at the market price. The second case concerns generation planning according to a market price schedule; NPV has been calculated for ten years with additional income and in the remaining ten years, the market price is used.
The SHPP’s data are as follows: the plant has a dam as a water storage facility; SHPP construction time: 1 year; the investments have been 1 × 10⁶ €; reservoir area: 274,000 m2; nominal capacity: 300 kW; dam water head: 7.9–8.2 m; water discharge through the turbine: 4.5 m3/s; SHPP efficiency: 0.85.
To comply with the environmental restrictions during a two-week period, it is necessary to optimize the water level in the first and the last hour and it equals 8 m. To achieve the objectives set in this article, we assume a plant construction period of one year. The discount rate for Latvia’s economic situation can be chosen as 7% for all the 20 years.
Thus, the optimization model takes into account the technical constraints and limitations of the environment, such as: the installed capacity limits, the water levels in the reservoir, the decrease or increase of the water level, the amount of water used, the ability to store water in the reservoir and the peculiarities of the selected operating mode of the SHPP at the considered time interval.
4.3. Biogas Power Plant Optimization Results
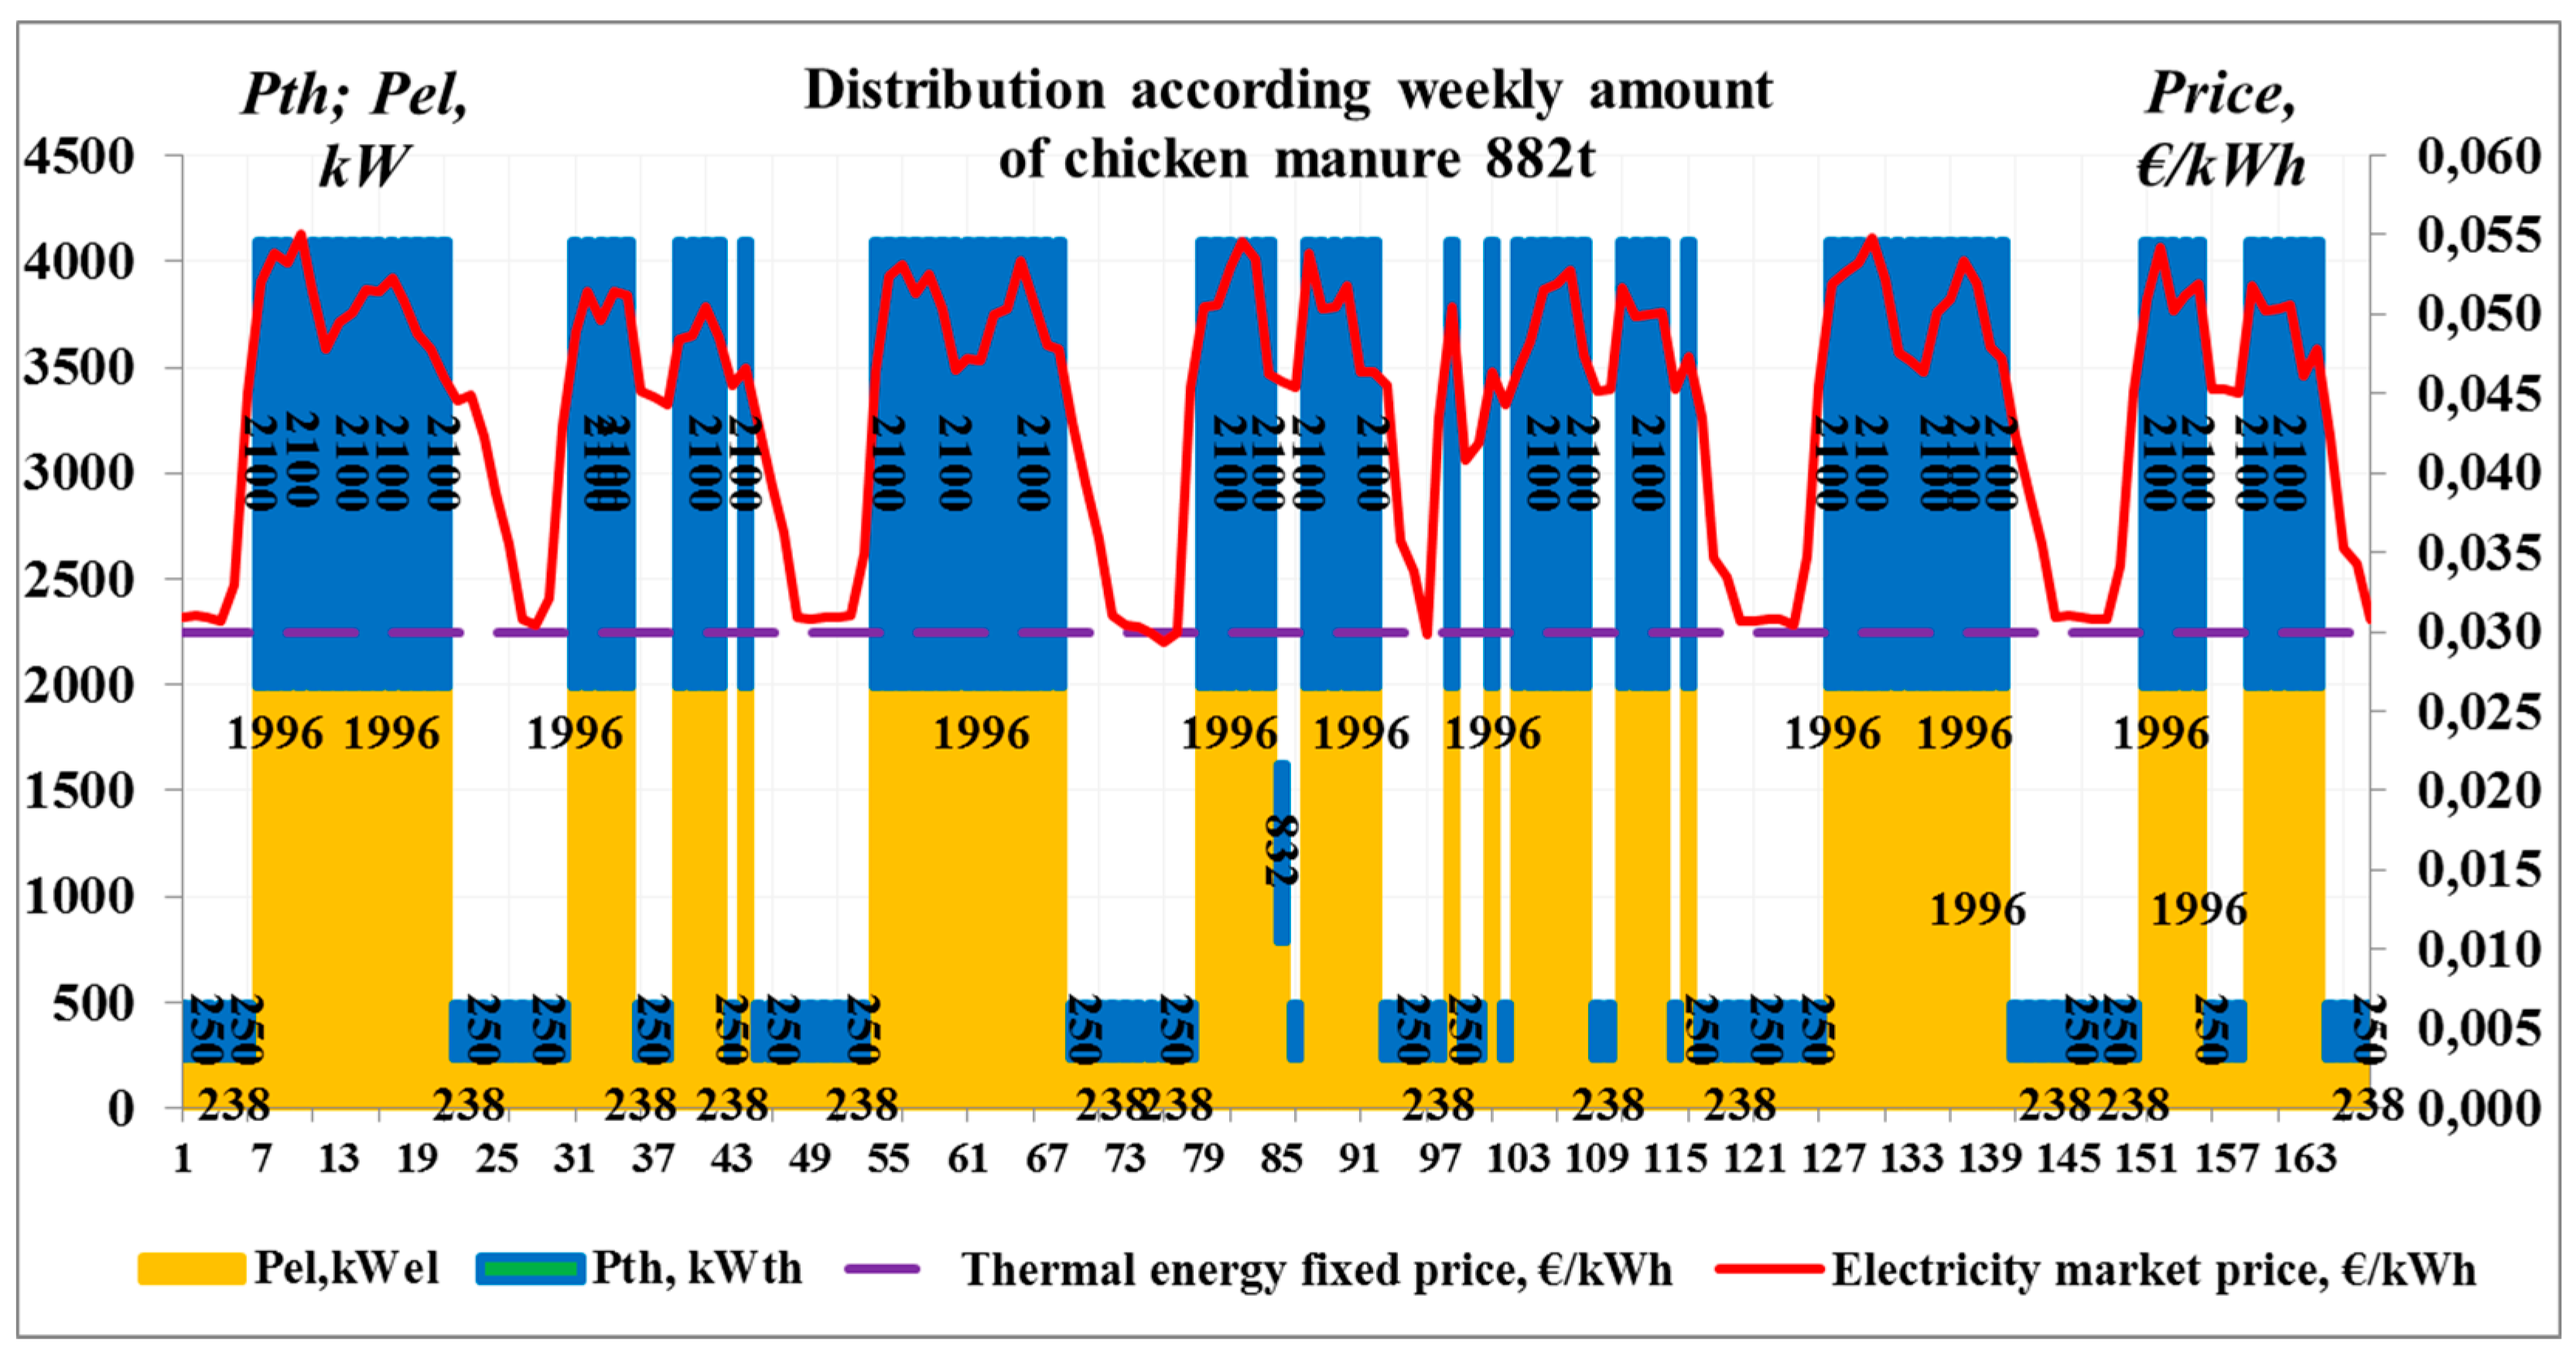
In our optimization, it is considered that a certain minimal amount of thermal energy should be provided by the power plant, which equals Qth = 250 kWh. An interruption of heat supply for 2–3 h leads to fluctuations of the permissible temperature because the inertia of heated spaces is used. We use the parameters of the power plant given in Table 1. The linear programming method is used for the optimization of the biogas CHPP.
During the hours when the electricity price is the highest, we produce the maximum amount of electricity and thermal energy (Figure 4). In contrast, when the electricity price is low, we do not utilize the whole resource of the biogas available and produce a minimum amount of electricity while providing the thermal energy needed for maintenance. The uniform distribution of raw material for the week ahead is presented in Figure 5. Biofuel is distributed uniformly despite the electricity price schedule; such kind of CHPP regulation provides normal distribution from the maintenance point of view but does not ensure maximum profit [29].
The electricity production from bio-resources is determined by the time required for the biomass fermentation process, since production of biogas from chicken manure can take a week or longer. Thus, the optimization process implementation needs to be extended from 24 h to a week or longer in order to increase the quality of biomass distribution.
According to the results of the optimization considered for the week ahead (Figure 4), the income from the sold energy is 16,005.89 €. If the bio-resource is uniformly distributed over the planning horizon (Figure 5), it provides 15,040.37 €. However, when the producer distributes the raw material uniformly, the income decreases by 965.53 €. The distribution of biofuel according to the planned time schedule could provide more efficient use and an increase in the income.
4.4. SHPP Feasibility Study Considering Market and Fixed Prices
During this study, we have developed a model for calculating the economic feasibility of a SHPP, which sells electrical energy to the public trader according to a fixed and/or market price. The technical and financial parameters of the project are collected and the water inflow predictions are performed. When building relatively small plants, the calculation of NPV and IRR is topical. Due to this, the present article offers an example of calculating the expected revenue based on the developed algorithm, as well as the impact of that revenue on the return rate of the plant itself. The feasibility results are generalized for the whole year to find the expected annual income; and the feasibility study is done for a period of twenty years.
The generation distribution example for a two-week period is presented in Figure 6. Obviously, we can see that the generation is stopped at hours of low prices The difference between the two NPVs (Figure 7) at the 20th year is suitable, the first gained by the fixed price is 114,117 € and the second gained by market prices is significantly higher, namely, 241,079 €.
4.5. The Influence of the Capacity of the SHPP Generators on the Received Income
At the different steps of power plant designing, the main part is to choose the reservoir volume and the installed capacity of each equipment unit. The influence of the chosen generator capacity on the received income will be shown below. The selection of a powerful generator could provide flexibility of production at maximum price hours. We considered generators with an installed capacity of 250 kW (water discharge—4 m3), 300 kW (water discharge—4.5 m3) and 500 kW (water discharge—8 m3) to find the influence of the capacity limitations. The three optimization results for 360 h show that the summary-generated power for the whole period is the same and equals 87.41 MWh because of the limited reservoir volume and its water level restrictions (the start and end point of water level for the considered optimization period is 8 m). The income amount changes along with the selected generator capacities; for the 250 kW generator, the income is 2825.13 €; for the 300 kW generator, the income is 2970.18 € and the 500 kW generator could provide 3172.81 €. The 500 kW generator could produce more electricity at the hours of the maximum price; however, in that case it discharges much more water from the reservoir. The above-mentioned situation appears at the conditions when the operation of the power plant is done according to the market price. In a real-life situation, the installed capacity of the SHPP considered in the feasibility study equals 300 kW, but with this example, we show that it is more effective to use 500 kW (in that case, the rate of return increases). Let us note that a similar situation can be observed in the analysis of the efficiency of the biogas CHPP.
5. Conclusions
The formation of a coalition consisting of an energy trader and an operator of a power plant ensures the interest in energy generation during the hours of its maximum demand and revenue growth. The formation of a coalition does not contradict the interests of society. On the contrary, part of the additional income can be used to reduce fees for the use of renewable energy. Using the proposed approach reduces the payback period of projects and contributes to the selection of generators of increased capacity.
Acknowledgments
The work presented in this paper has been co-financed by the National Research Program LATENERGI (2014–2017).
Author Contributions
All authors contributed equally to this work. Renata Varfolomejeva has made introduction, mathematical task statement and case study and results; Antans Sauhats has made introduction, mathematical task statement; Nikita Sokolovs has made introduction and case study; Hasan Coban has made results of SHPP feasibility study considering market and fixed prices.
Conflicts of Interest
The authors declare no conflict of interest.
References
- Ministry of Economy of Republic of Latvia. Informative Report of the Electricity Price Increases Risks and Those Restriction. Available online: http://www.em.gov.lv/em/2nd/?cat=30175 (accessed on 12 June 2017).
- Statistical Data from Central Statistical Bureau of Latvia. Available online: http://www.csb.gov.lv/en/dati/statistics-database-30501.html (accessed on 16 February 2016).
- Statistical Data from European Commission of Eurostat. Available online: http://epp.eurostat.ec.europa.eu/statistics_explained/index.php/File:Half-yearly_electricity_and_gas_prices.png (accessed on 1 December 2016).
- Iychettira, K.K.; Linres, P.; Hakvoort, A.R. Harmonising RES-E Support Schemes Using Design Elements. In Proceedings of the 2015 12th International Conference on the European Energy Market (EEM), Lisbon, Portugal, 19–22 May 2015; pp. 1–5. [Google Scholar]
- Jacobseen, H.K.; Pade, L.L.; Scroder, S.T.; Kitzing, L. Cooperation mechanisms to achieve EU renewable targets. Int. J. Renew. Energy 2014, 345–352. [Google Scholar] [CrossRef]
- Harabut, C. Legal and Policy Instruments to Facilitate Development for Renewables Energy. In Proceedings of the 2015 5th International Youth Conference on Energy (IYCE), Pisa, Italy, 27–30 May 2015; pp. 1–5. [Google Scholar]
- Gawel, E.; Strunz, S.; Lehmann, P. A Public Choise View on the Climate and Energy Policy Mix in the EU—How do the emissions trading scheme and support for renewable energies interact? J. Energy Policy 2014, 64, 175–182. [Google Scholar] [CrossRef]
- Competition Council of Republic of Latvia. Informative Report of Monitoring Results of Electricity Trading in the Open Market. Available online: http://www.kp.gov.lv/documents/966f07bf008efdc8b768b8b79e6612a4c7b6d61a (accessed on 25 April 2017).
- Statistical Data from Central Statistical Bureau of Latvia. A_ENG06. Production, Imports, Exports and Consumption of Renewable Energy Resources, Charcoal and Wastes, in Natural Units (NACE Rev.1.1.), 1990–2008. Available online: http://www.csb.gov.lv/en/dati/statistics-database-30501.html (accessed on 25 April 2017).
- International Renewable Energy Agency (IRENA). Volume 1: Power Sector Issue 1/5. Biomass for Power Generation. Available online: http://www.docucu-archive.com/view/55f67eb30c7b03e9dfbcbbdd2ea209c0/W-ind-P-o-w-er-Biomass-for-Power-Generation.pdf (accessed on 13 June 2017).
- Norton Rose Fulbright. Proposed New Support Scheme for Renewable Electricity in Greece. 14 March 2016. Available online: http://www.nortonrosefulbright.com/knowledge/publications/137972/proposed-new-support-scheme-for-renewable-electricity-in-greece (accessed on 28 April 2017).
- Lloyd, S.; Shapley, A. Value for n-person Games. In Contributions to the Theory of Games, Volume II; Annals of Mathematical Studies v. 28; Dresher, M., Tucker, A.W., Wolfe, P., Eds.; Princeton University Press: Princeton, NJ, USA, 1957; pp. 307–317. [Google Scholar]
- Faria, E.; Barroso, L.A.; Kelman, R.; Granville, S.; Pereira, M.V. Allocation of Firm-Energy rights among hydro plants: An Aumann-Shapley approach. IEEE Trans. Power Syst. 2009, 24, 541–551. [Google Scholar] [CrossRef]
- Junqueira, M.; da Costa, L.C.; Barroso, L.A.; Oliveira, G.C.; Thome, L.M.; Pereira, M.V. An Aumann-Shapley approach to allocate transmission service cost among network users in electricity markets. IEEE Trans. Power Syst. 2007, 22, 1532–1546. [Google Scholar] [CrossRef]
- Varfolomejeva, R.; Iljina, I.; Coban, H.; Sokolovs, Ņ.; Sauhats, A. The Limiting Factors and Supporting Schemes Influence on Small-Scale Power Plant Work. In Proceedings of the 2016 IEEE International Conference on Environment and Electrical Engineering, Florence, Italy, 7–10 June 2016; pp. 1893–1898. [Google Scholar]
- Iljina, I. OIK pielietošanas kārtības paredzamās izmaiņas un to pamatojums Ekonomikas ministrijas. Minist. Econom. Repub. Latvia Renew. Energy Effic. Dep. 2016, 8, 1–12. (In Latvian) [Google Scholar]
- TARIFI Pazemināts Sadales Sistēmas Pakalpojumu Tarifs. Pazemināta Elektroenerģijas Sistēmas Pakalpojuma Tarifa Piemērošana. Available online: http://sadalestikls.lv/lat/sistemas_pakalpojuma_tarifi/pazeminata_elektroenergijas_tarifa_piemerosana/ (accessed on 28 January 2017).
- Seifert, W.; Carl, W.; Steeg, W. Control Systems Engineering; McGraw-Hill Book Company, Inc.: New York, NY, USA; Toronto, ON, Canada; London, UK, 1960. [Google Scholar]
- Zheng, Q.P.; Wang, J.; Liu, A.L. Stochastic Optimization for unit commitment—A review. IEEE Trans. Power Syst. 2015, 30, 1–6. [Google Scholar] [CrossRef]
- Vardanyan, Y.; Amelin, M.; Hesamzadeh, M. Short-term hydropower planning with uncertain wind power production. In Proceedings of the 2013 IEEE Power and Energy Society General Meeting (PES), Vancouver, BC, Canada, 21–25 July 2013; pp. 1–5. [Google Scholar] [CrossRef]
- Coban, H.H.; Varfolomejeva, R.; Sauhats, A. Comparing and optimizing hydroelectricity power production models. In Proceedings of the ECRES—3. European Conference on Renewable Energy Systems, Kemer, Antalya, 7–10 October 2015; pp. 1–7. [Google Scholar]
- Varfolomejeva, R.; Zima-Bočkarjova, M.; Sauhats, A.; Petričenko, R.; Umbraško, I.; Coban, H. Reconsideration of supporting scheme for renewable energy producers. In Proceedings of the 4th International Symposium on Environmental Biotechnology and Engineering, Meksika, Mexico, 9–12 September 2014. [Google Scholar]
- Sauhats, A.; Coban, H.H.; Baltputnis, K.; Broka, Z.; Petrichenko, R.; Renata Varfolomejeva, R. Optimal investment and operational planning of a storage power plant. Int. J. Hydrog. Energy 2016. [Google Scholar] [CrossRef]
- Sauhats, A.; Varfolomejeva, R.; Petričenko, R.; Kucajevs, J. A stochastic approach to hydroelectric power generation planning in an electricity market. In Proceedings of the 15th International Conference on Environment and Electrical Engineering, Rome, Italy, 10–13 June 2015; pp. 883–888. [Google Scholar]
- Rasburskis, N.; Lund, H.; Prieskienis, Š. Optimization methodologies for national small-scale CHP strategies. Energetika 2007, 53, 16–23. [Google Scholar]
- Vindiš, P.; Muršec, B.; Rozman, Č.; Čus, F. A Multi-Criteria Assessment of Energy Crops for Biogas Production. Strojniški Vestnik J. Mech. Eng. 2010, 56, 63–70. [Google Scholar]
- Coelho, S.T.; González Velázquez, S.M.S.; Martins, O.S. Biogas from sewage treatment used to electric energy generation, by a 30 kW (ISO) Microturbine. In Proceedings of the World Bioenergy Conference and Exhibition, George, BC, Canada, 31 May–1 June 2006; pp. 1–6. [Google Scholar]
- Dubrovskis, V.; Niklass, M.; Emsis, I.; Kārkliņš, A. Biogas Production and Effective Use; Latvian Biogas Association: Riga, Latvia, 2014; p. 88. (In Latvian) [Google Scholar]
- Varfolomejeva, R.; Sauhats, A.; Umbraško, I.; Broka, Z. Biogas power plant operation considering limited biofuel resources. In Proceedings of the IEEE 15th International Conference on Environment and Electrical Engineering, Rome, Italy, 10–13 June 2015; pp. 570–575. [Google Scholar]
Figure 1.
Mandatory procurement component in 2015 [16]. HPP: hydroelectric power plant; RES: renewable energy sources.
Figure 1.
Mandatory procurement component in 2015 [16]. HPP: hydroelectric power plant; RES: renewable energy sources.
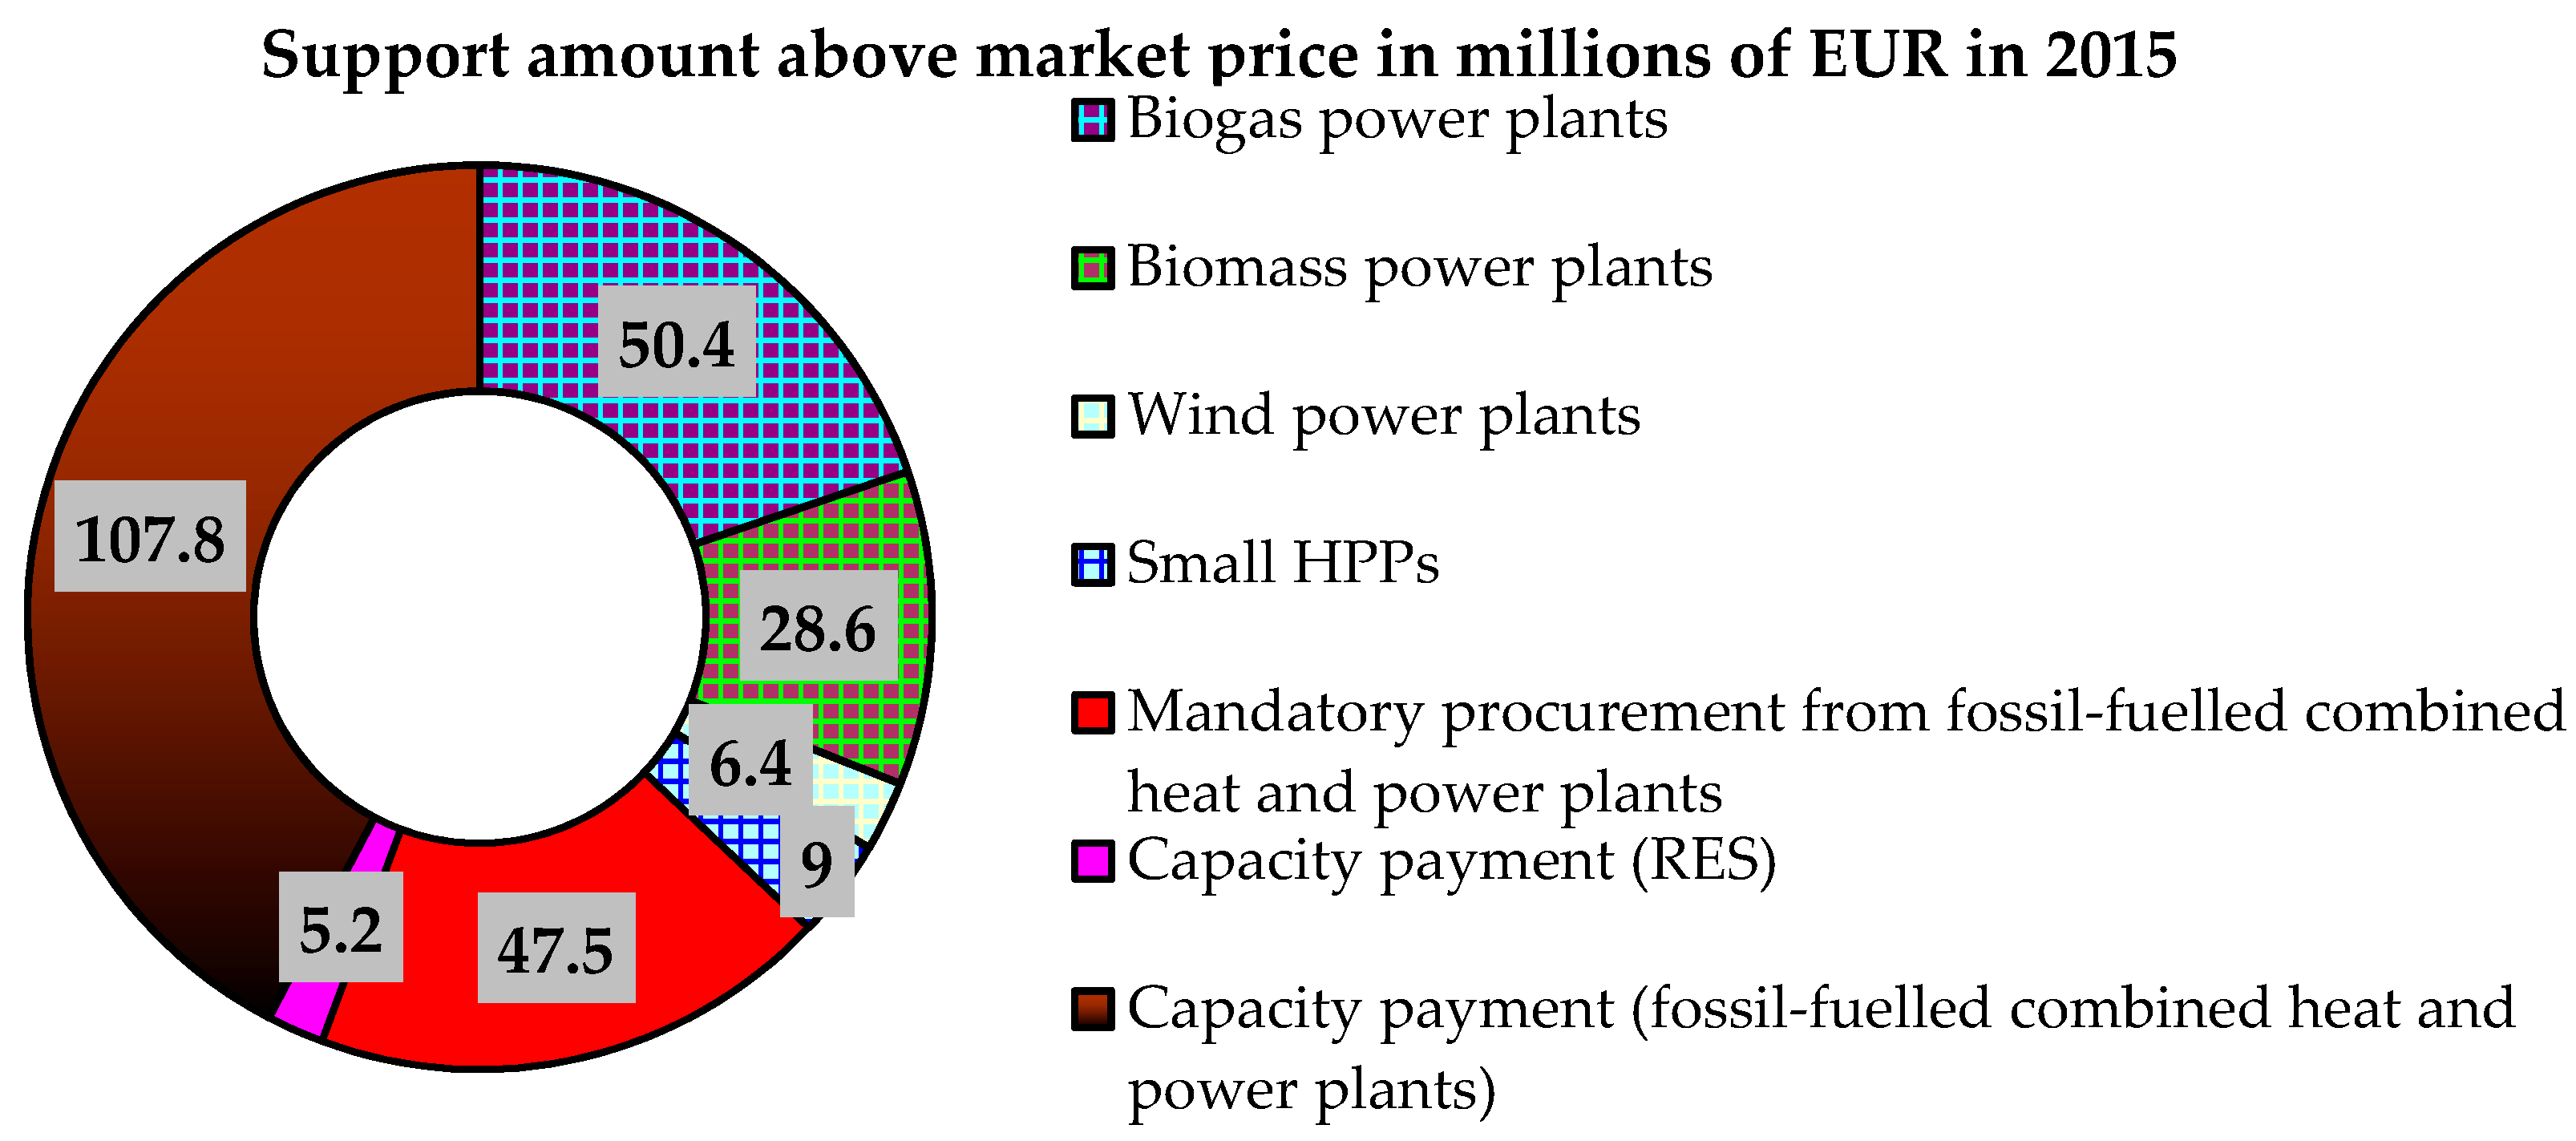
Figure 2.
An example of summary electricity production (a) small combined heat and power plants and (b) small hydropower plants in Latvia.
Figure 2.
An example of summary electricity production (a) small combined heat and power plants and (b) small hydropower plants in Latvia.

Figure 3.
A simplified structure of the power plant optimization process.

Figure 4.
Electrical and thermal energy production considering weekly distribution of chicken manure.
Figure 4.
Electrical and thermal energy production considering weekly distribution of chicken manure.

Figure 5.
Electrical and thermal energy production according to the uniform distribution of chicken manure of 5.25 t/h.
Figure 5.
Electrical and thermal energy production according to the uniform distribution of chicken manure of 5.25 t/h.
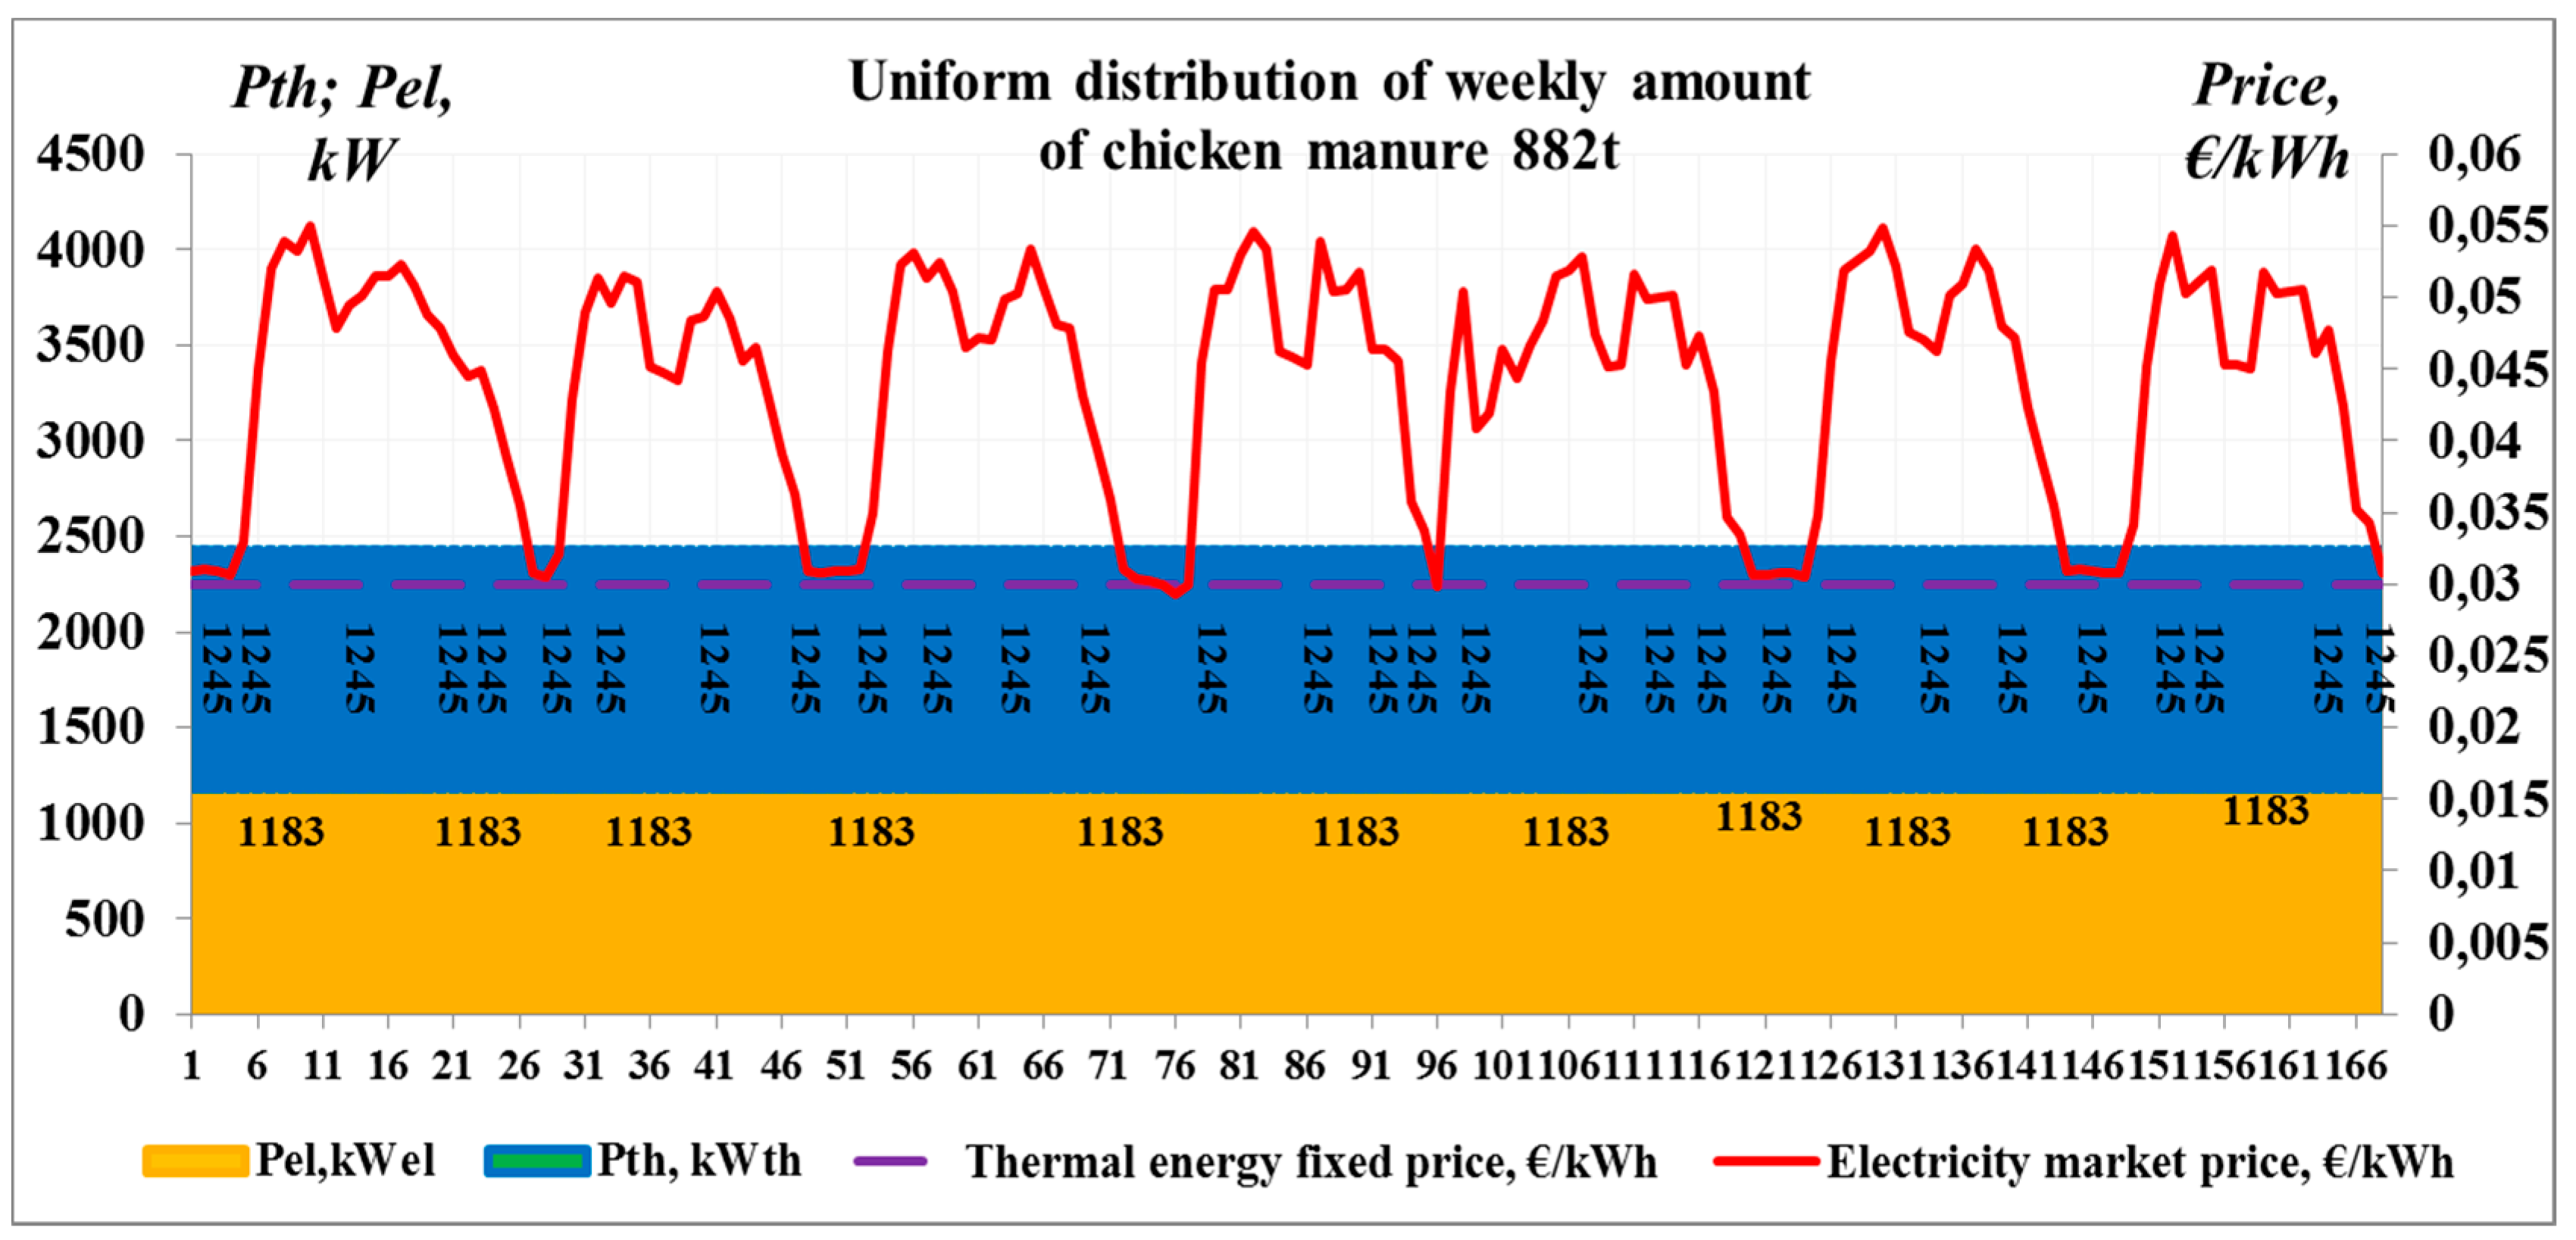
Figure 6.
Energy production planning of small hydropower plant (a) according to market price for 360 h and (b) selected production for 24 h.
Figure 6.
Energy production planning of small hydropower plant (a) according to market price for 360 h and (b) selected production for 24 h.
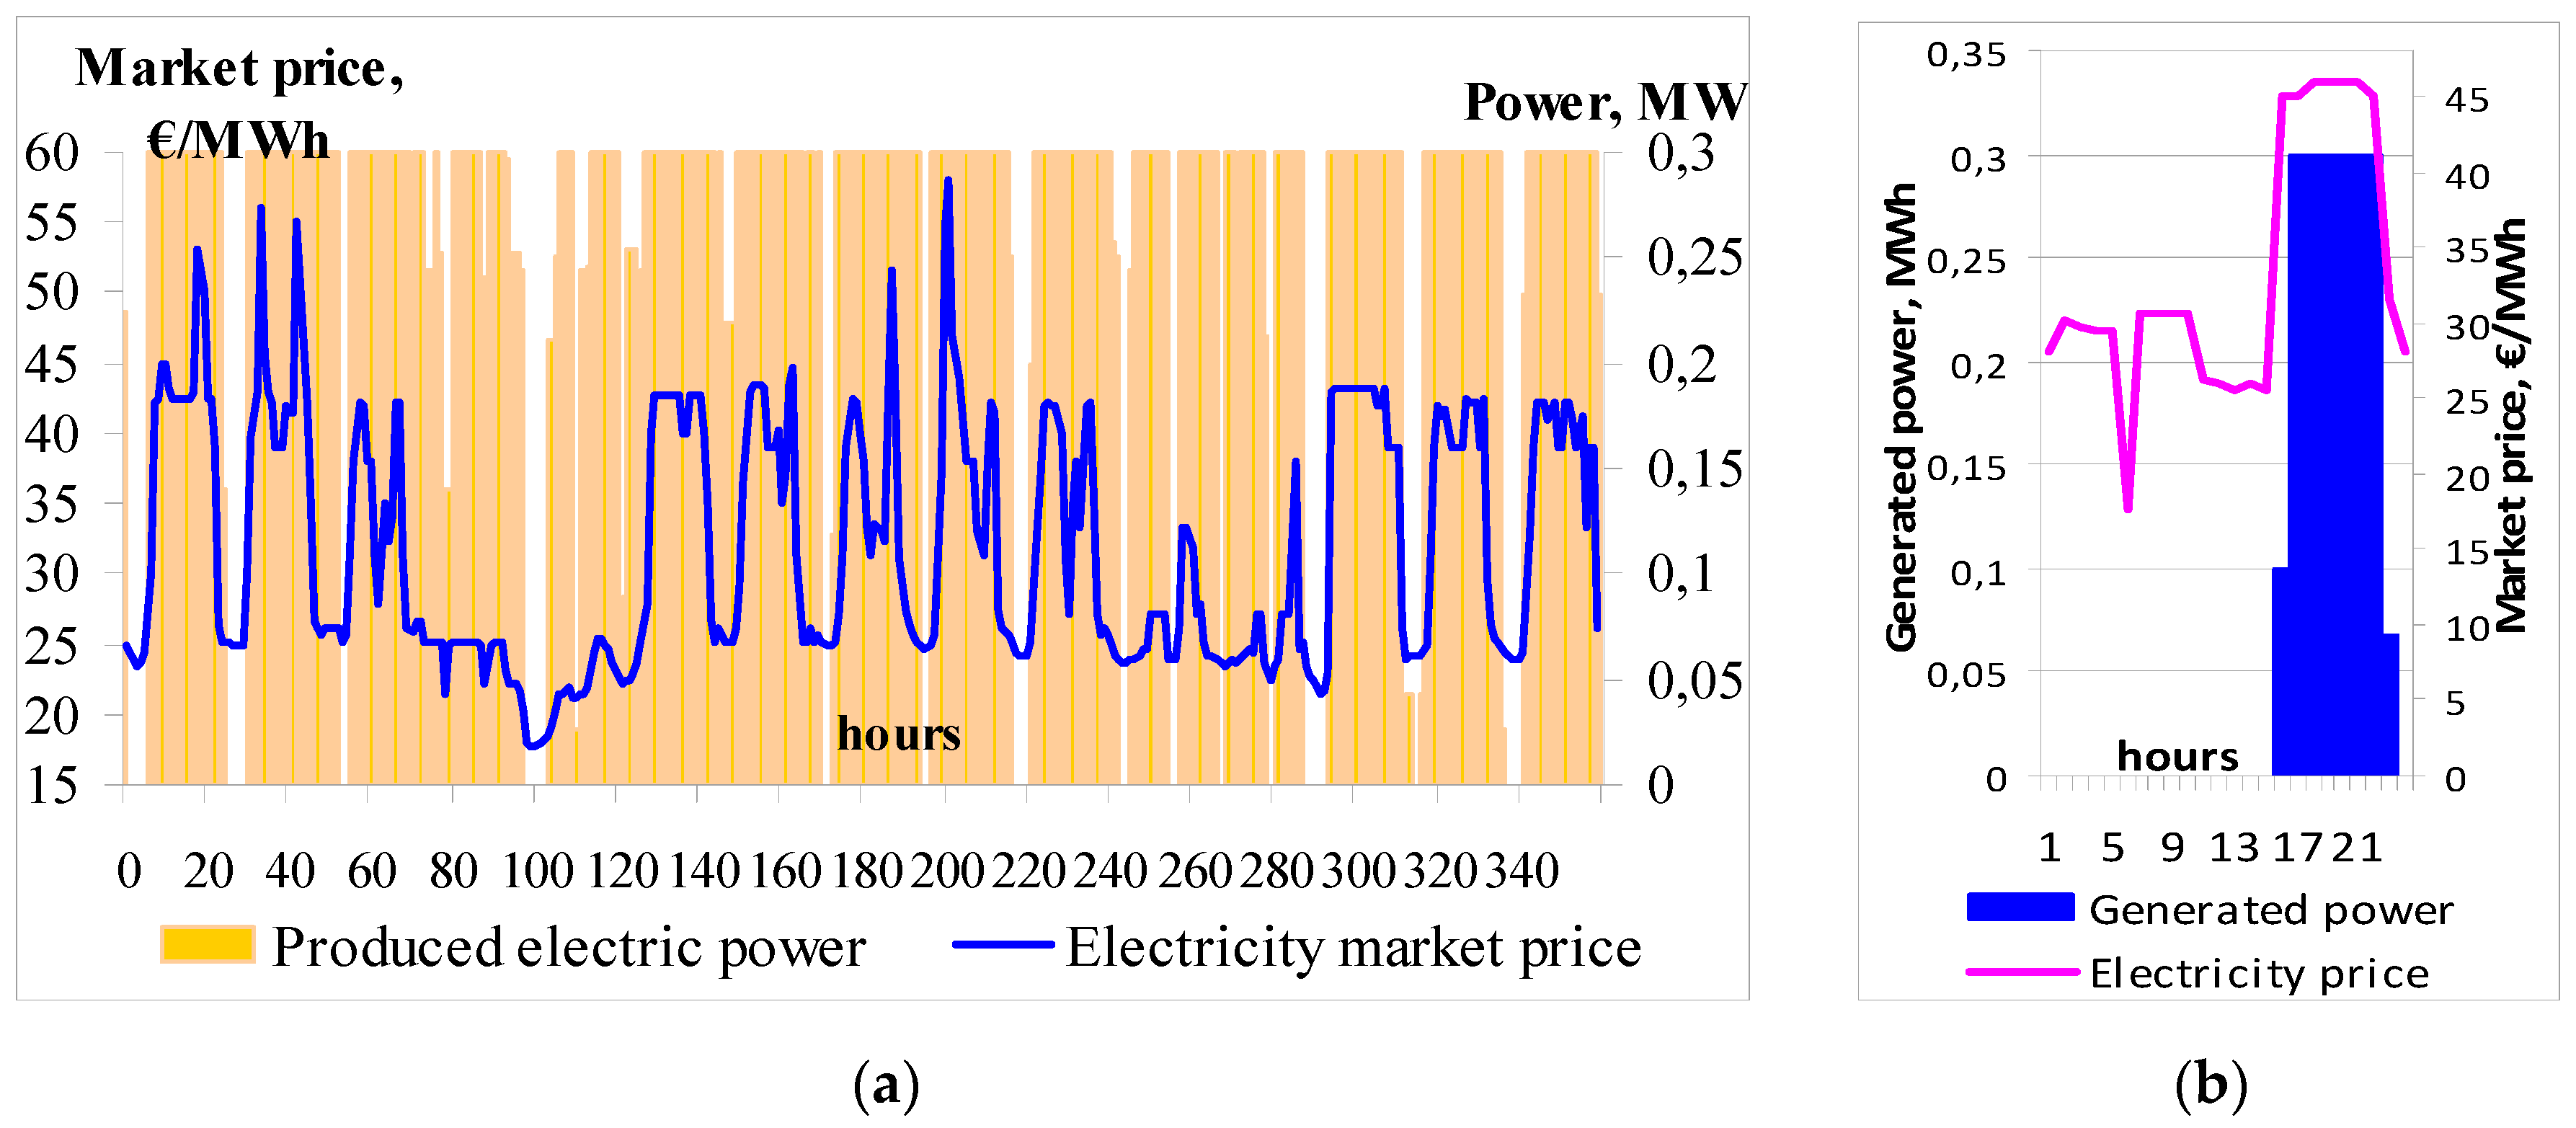
Figure 7.
NPV in two cases: (1) generated power according to granted supports (IRR1st = 9.96%); (2) generation planning according to the market price, yet with all the energy sold at a fixed price, plus an additional income from the public trader (IRR2nd = 11.82%).
Figure 7.
NPV in two cases: (1) generated power according to granted supports (IRR1st = 9.96%); (2) generation planning according to the market price, yet with all the energy sold at a fixed price, plus an additional income from the public trader (IRR2nd = 11.82%).


Table 1.
Main parameters of the power plant.
| No. | Parameter | Value |
|---|---|---|
| 1 | Installed capacity (kW) | 4911 |
| 4 | Calorific value of the gas containing 55.8% of CH4 (kWh/m3) | 6.16 |
| 5 | Biogas yield (m3/t) | 90 |
| 6 | Thermal efficiency coefficient | 0.428 |
| 7 | Electrical efficiency coefficient | 0.406 |
| 8 | Tanks | 2 |
| 9 | The amount of chicken manure used (t) | 882 |
© 2017 by the authors. Licensee MDPI, Basel, Switzerland. This article is an open access article distributed under the terms and conditions of the Creative Commons Attribution (CC BY) license (http://creativecommons.org/licenses/by/4.0/).
Share and Cite
MDPI and ACS Style
Varfolomejeva, R.; Sauhats, A.; Sokolovs, N.; Coban, H. The Influence of Small-Scale Power Plant Supporting Schemes on the Public Trader and Consumers. Energies 2017, 10, 800. https://doi.org/10.3390/en10060800
AMA Style
Varfolomejeva R, Sauhats A, Sokolovs N, Coban H. The Influence of Small-Scale Power Plant Supporting Schemes on the Public Trader and Consumers. Energies. 2017; 10(6):800. https://doi.org/10.3390/en10060800
Chicago/Turabian StyleVarfolomejeva, Renata, Antans Sauhats, Nikita Sokolovs, and Hasan Coban. 2017. "The Influence of Small-Scale Power Plant Supporting Schemes on the Public Trader and Consumers" Energies 10, no. 6: 800. https://doi.org/10.3390/en10060800
Note that from the first issue of 2016, this journal uses article numbers instead of page numbers. See further details here.