
A Novel Multi-Point Excitation Fatigue Testing Method for Wind Turbine Rotor Blades

School of Mechanical Engineering, Tongji University, Shanghai 200092, China
*
Author to whom correspondence should be addressed.
Energies 2017, 10(7), 1058; https://doi.org/10.3390/en10071058
Submission received: 13 June 2017
/
Revised: 5 July 2017
/
Accepted: 17 July 2017
/
Published: 21 July 2017
(This article belongs to the Special Issue Wind Turbine 2017)
Abstract
:Wind turbine blades have to withstand the rigorous test of 20–25 years of service. Fatigue testing is an accurate method used to verify blade reliability. Multi-point excitation could better fit the fatigue damage distribution, which reduces the power output of a single exciter and saves testing energy consumption. The amplitude, phase, and frequency characteristics of the fatigue test system and, moreover, the relationship between the excitation force, damping, and the amplitude variation of the blade, are analyzed by the Lagrangian equation and the finite element simulation method. The full-scale fatigue test of an equivalent full cycle life in the flapwise direction is carried out by multi-excitation. When the frequency and phase of the multi-point exciters are consistent, the maximum vibration effect can be exerted. When the phase difference of the dual exciters is 180°, the vibration effect produced by the dual exciters can be equivalent to each other. The blade amplitude is proportional to excitation forces, while inversely proportional to the damping ratio. The bending moment deviation of the blade is controlled within 9.2%; moreover, the energy consumption is 40% lower than that of the single-point excitation. The use of multi-point excitation allows loading the blade with high precision, stable operation, and low cost, which provides the theoretical and experimental basis for the fatigue test of large wind turbine blades.
Highlights: (1) The multi-point excitation fatigue testing method renders an equal fatigue damage distribution with a higher degree of fidelity; (2) The program fits the fatigue damage distribution by adjusting the parameters of multi-point exciters rather than tuning masses, which could reduce each exciter power and save energy; (3) The multi-point excitation has the characteristics of high loading accuracy and stable operation, which are able to meet the large blade fatigue test requirements by adding exciters.
1. Introduction
Wind power, as a new green energy in the world, has developed rapidly. The blades of wind turbines are subjected to a variety of dynamic loads, such as inertial force, centrifugal force, and aerodynamic force, during the operation of the wind turbine. They have experienced rigorous testing over their whole life cycle of 20–25 years. The wind turbine blade as a key component of the machine, which induces problems that will not only affect its own performance, but could lead to a catastrophic accident. Therefore, it must undergo reliability verification through a full-scale fatigue test.
Equivalent life cycle fatigue testing on the test platform is the best way to verify reliability. The dynamic load which is subjected upon the blade is converted into the equivalent fatigue damage load by using the rain-flow counting method. According to the Palmgren-Miner damage accumulation rule, the equivalent fatigue damage load of 20–25 years is transformed into the test target loads of several million cycles, which can be simulated in the laboratory. The equivalent damage of the blade fatigue load includes the force and moment in three directions, respectively. Here we only discuss the bending moment in the flapwise direction.
At present, the world’s longest blade for mass production is LM 88.4 m (LM wind power), which is developed by Adwen wind turbines. Blade fatigue performance is composed of a complex interplay of several aspects, such as the taper, rich resin, wrinkles, overlap, manufacturing flaws, geometrical imperfections, material mismatch, and so on. According to the GL/IEC (Germanischer Lloyd/International Electrotechnical Commission) specifications of wind turbine blades [1,2], new types of blades need to pass the fatigue test to verify their reliability. Fatigue tests for large blades must meet the minimum number of cycles, maximum strain threshold, limits on adiabatic heating, and covering the verification area, which occupies 70% of the fatigue damage distribution along the blade. The multi-point excitation of the fatigue testing method has been investigated from several different angles. Zhang Lei-an et al. [3,4] studied the blade dual-point loading system for MW (megawatt)-level wind turbines, of which the coupling characteristics were summarized. Liao Gao-hua [5,6] investigated the electromechanical coupling characteristics of multi-point excitation fatigue loading systems by means of experiments and numerical simulation. Wang Na and Kong Xiaojia [7,8] studied the coupling mechanism and decoupling control of a dual-excitation fatigue loading coupling system for wind turbine blades. Eder [9] proposed a novel multi-frequency fatigue testing method by tuning the excitation forces, which shortened the testing time and rendered the damage evolution with a higher degree of fidelity. Hughes [10] invented a biaxial resonant loading device. Greave [11,12,13] studied the principle of biaxial loading, the strain calibration method, and the development of biaxial resonant equipment. White [14,15] developed a new hybrid fatigue testing system called the Blade Resonance Excitation (B-REX) test system, which used 65% less energy to test large wind turbine blades in half the time of NREL’s (National Renewable Energy Laboratory) dual-axis forced-displacement test method, with lower equipment and operating costs. Pan [16] found that aerodynamic fairing installed in the tip of the blade could reduce air resistance; the results showed that the required exciting force could be decreased by 45.4% when the target equivalent fatigue damage was reached. Zarouchas [17] numerically and experimentally investigated the prismatic composite I-beams and the mechanical behavior of adhesive bond lines. The global failure of the first I-beam was caused by undesirable local failure which concentrated in the supports and to the loading points. In order to accurately predict and improve the wind turbine blade behavior, an experimental test and numerical models were established by Mishnaevsky [18] to predict the residual strength and failure probability of the blades. Asl [19] carried out subcomponent testing, which had been proposed as a supplement to the structural analysis and material characterization. The results show that established scaling laws could be applied in complete similarity conditions and had a good accuracy to predict the fundamental frequency of a laminated plate. Hughes [20] implemented a two-axis servo-hydraulic system for full-scale fatigue testing of wind turbine blades, which enabled conducting more realistic fatigue blade testing. AE Jayantha [21] studied a 2.5-m composite wind turbine blade that was fatigue tested by means of a mechanically-operated test rig that used a crank eccentric mechanism to flex the blade. The results showed that predictions are close to the measured fatigue life of the blade. In this paper, the effects of phase, frequency, and exciting force of the exciter on the spatial damage distribution along the blade are studied by means of the Lagrange equation and the finite element model. The qualitative analysis is carried out using the kinetic principle, the exact solution of the theoretical model is obtained by finite element simulation, and the correctness of these theoretical analyses is verified by the experiment. Finally, the method of multi-point excitation is used as an equivalent life fatigue test of the blade in the flapwise direction. The loading spectrum is calculated by the method of rain-flow counting, and the loading effect of multi-point excitation is evaluated.
2. Comparison of the Multi-Point Excitation and Traditional Fatigue Tests
In contrast to traditional fatigue tests, the exciter of this experiment is a linear motor rather than a pendulum for resonant loading, as shown in Figure 1. The exciting force is produced through the linear motors, which drive dynamic masses to conduct a reciprocating motion. The linear motor has the advantage of the orientation of the loading force holding in one direction, which eliminates the influence of an additional torsional force on the exciter’s coupling.
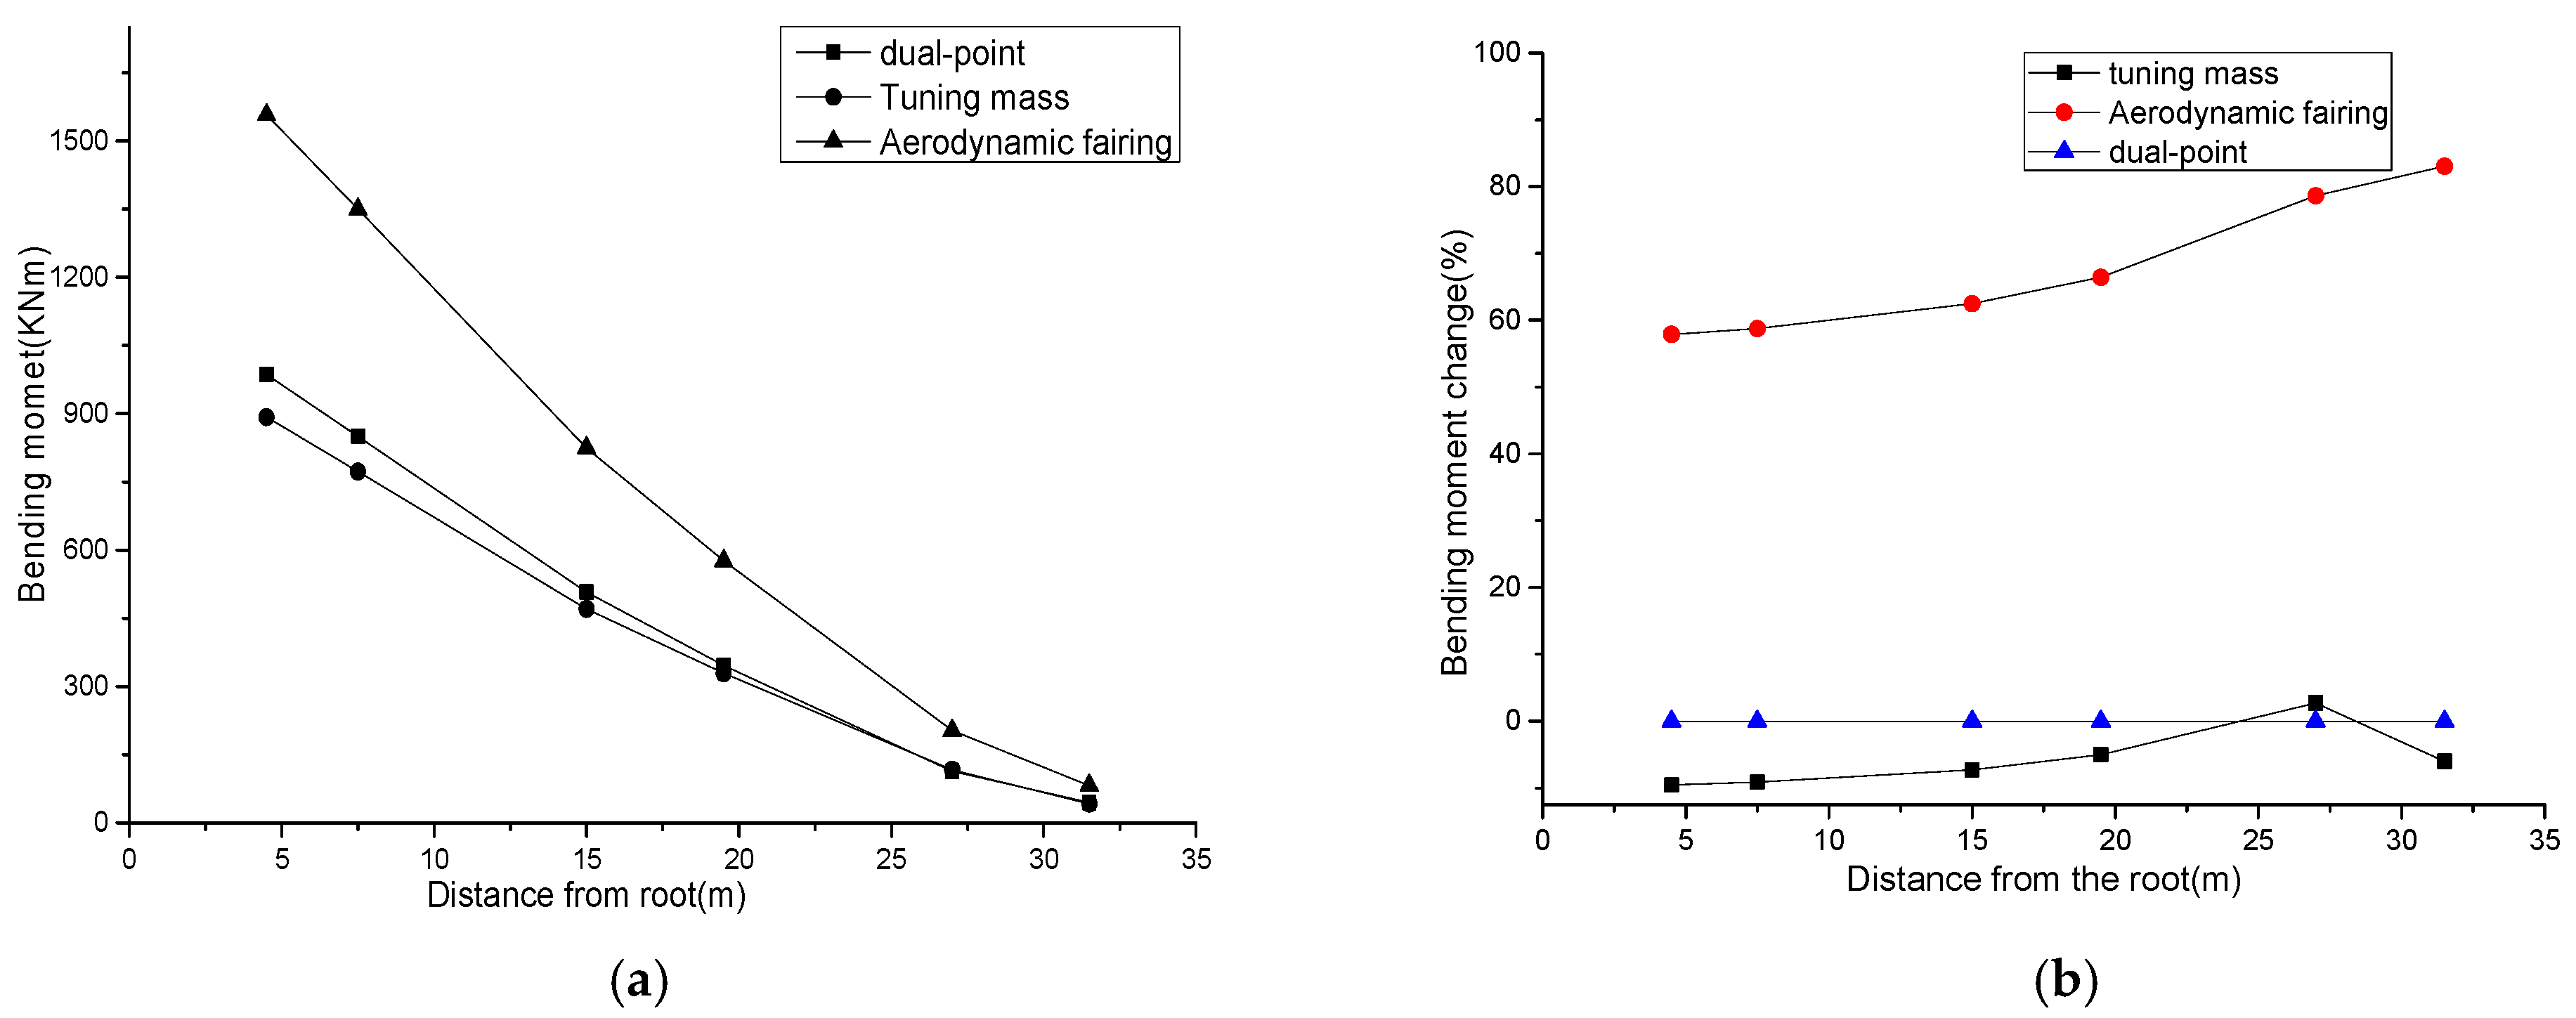
As shown in Figure 2a, through single-point excitation only, it is difficult to cover the minimum verification area that the test load requires for each point in the range from the root to 70% of the blade length without the addition of tuning masses [1]. Even the common approach to improve the exciting force would render the damage evolution with a higher fitting deviation, which remains a time-consuming and costly endeavor. The single-point excitation approach requires the introduction of tuning masses, which serve the purpose of adjusting the dynamic bending moment in cross-section along the blade. While this decreases the frequency of the blade, it increases the entire test period and energy consumption. Figure 3 depicts that the distribution of vibrational bending moments in three cases, including dual-point excitation, additional tuning masses, and an aerodynamic fairing. The bending moment is obtained from strain transformed according to Equation (14). Although the bending moment is slightly increased at the cross-section at 27 m in the case of the additional tuning masses, the overall bending moment is reduced. The installation of the aerodynamic fairing in the tip can greatly improve the blade vibration bending moment, thus the study of multi-point excitation is based on the installation of an aerodynamic fairing at the tip. For large blade fatigue testing, multi-point excitation can be achieved through parallel exciter modules. The novel method would render the fatigue damage with a higher degree of fidelity, in which the power requirement of the exciter is reduced. The actual spatial damage distribution can be more realistically simulated in the tests by tuning the frequency, phase, excitation force, and position of the multi-point excitation rather than by adding tuning masses.
3. Dynamic Analysis of Multi-Point Excitation Systems
3.1. Dynamic Model
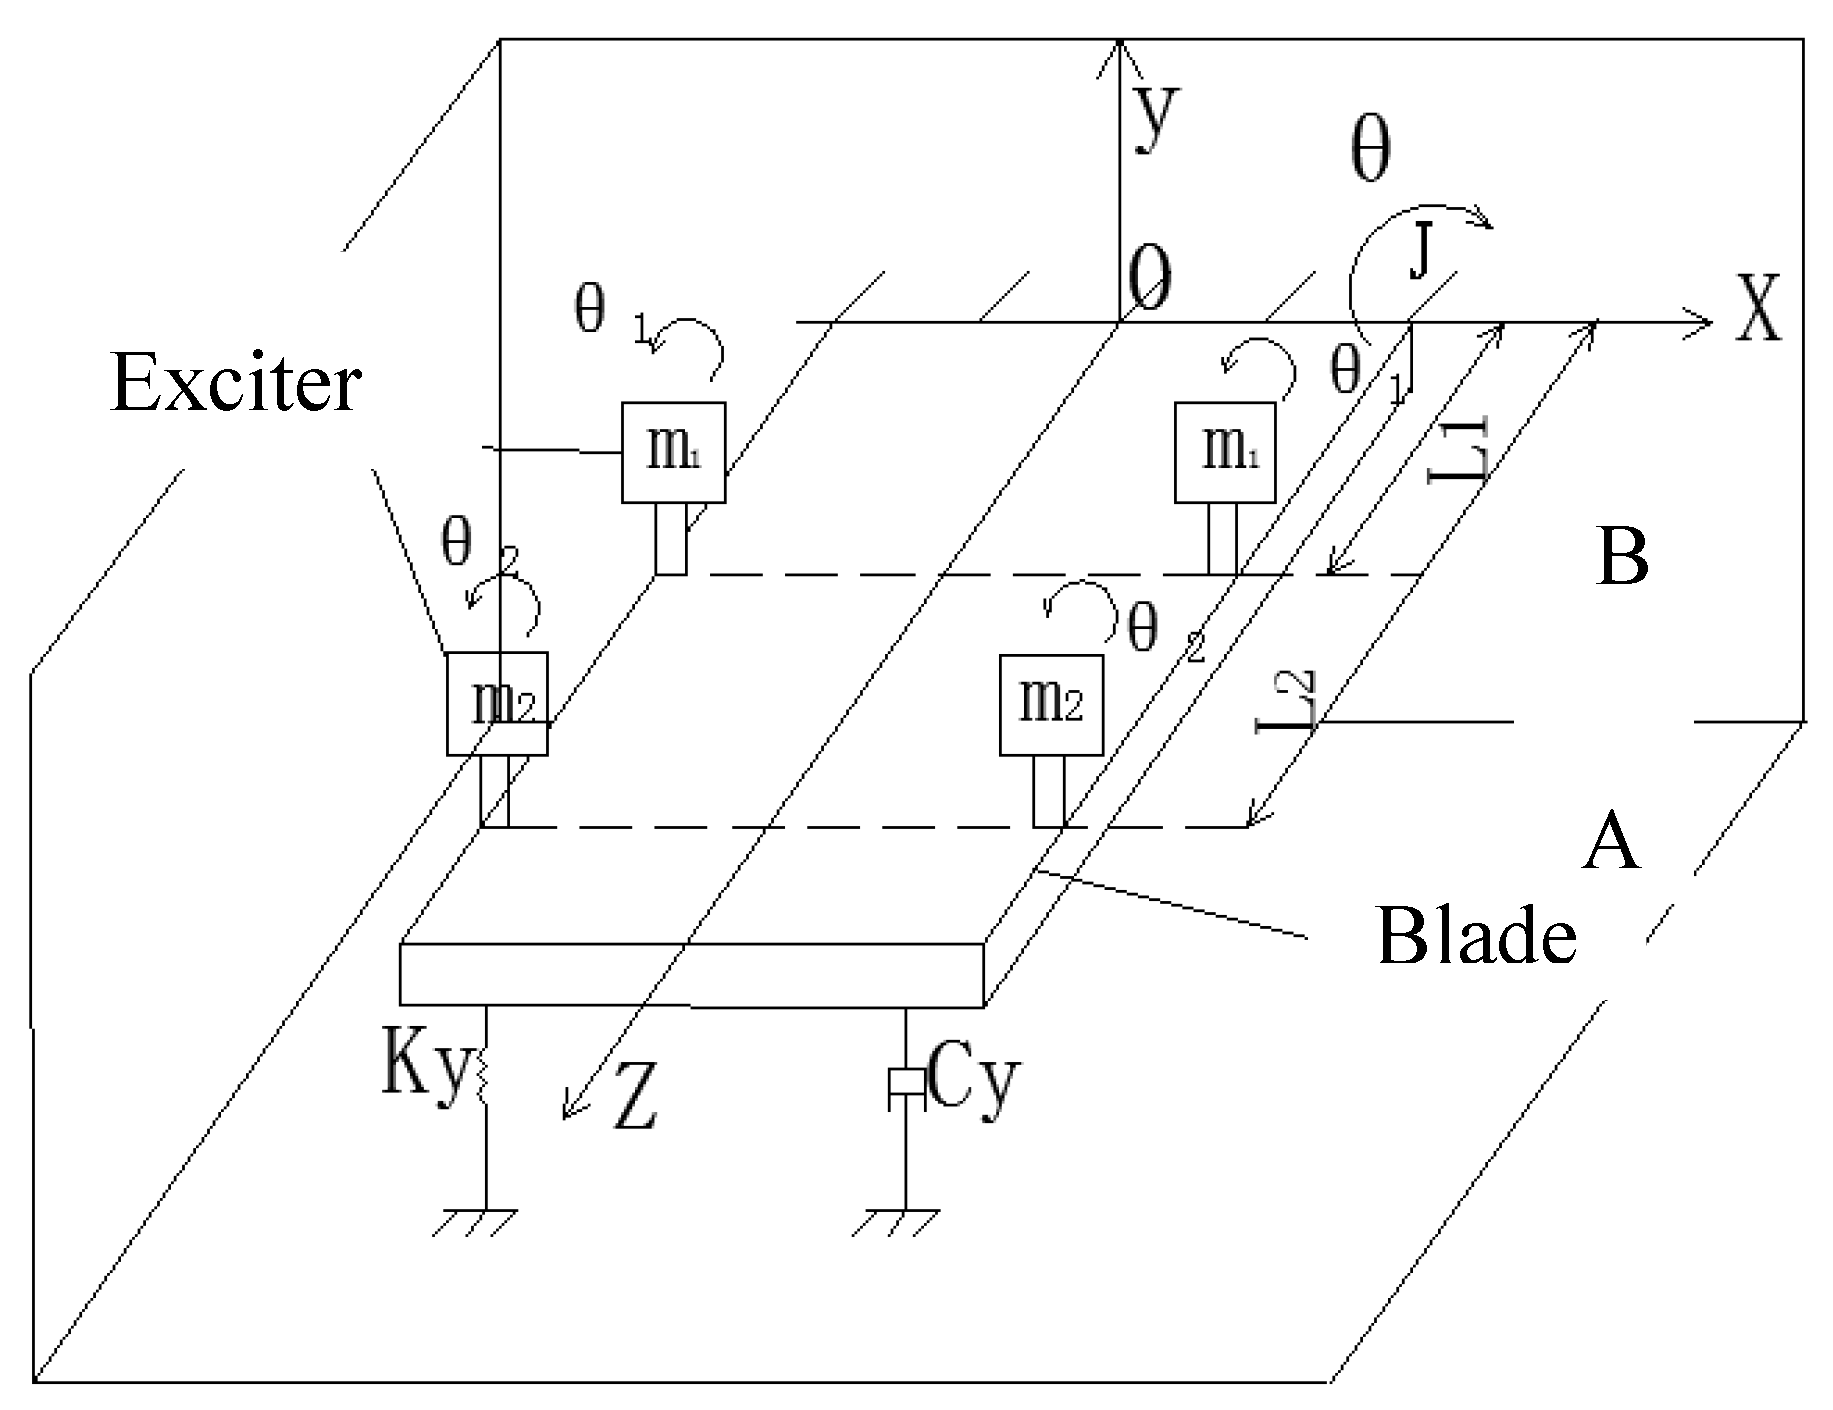
During the multi-point excitation fatigue test, all excitation forces are applied at the natural frequency of the test system in order to obtain the maximum amplitude with minimum energy consumption. The blade is simplified as a model of a cantilever beam with a multi-point lump mass. The exciters are, respectively, mounted on the leading and trailing edges of the blade cross-section positions A and B, in which the dynamic mass is cycled along the vertical direction.
The excitation forces generated by the dual exciters are, respectively, and . Under the action of dual exciting forces, the blade is under reciprocating synthetic motion combined with vertical movement in the direction in the plane, and swinging around the x-axis. As shown in Figure 4, the dynamic model is established in the absolute coordinate system where the ground is selected as the reference system.
According to the analysis of the motion characteristics of the system, it is known that the blade swings around the x-axis while dynamic mass reciprocates in the vertical direction.
Displacement of dynamic mass relative to the blade: .
Displacement of dynamic mass relative to the ground: .
According to the Lagrangian equation:
The kinetic energy of the system:
The potential energy of system:
The damping dissipated energy of system:
The generalized force of system:
Equations (2)–(4) are partial derivatives, respectively, in the direction, and are subsequently simplified and substituted into Equation (5). Following this, the system dynamic equations are obtained:
3.2. Analysis of Kinetic Parameters
The multi-point excitation fatigue loading system of the blade is simplified as a linear system with multiple excitation forces. From the principle of mechanical vibration [22], we can see that when the system is excited by dual, completely irrelevant excitation sources, the excitation effect of the system can be simply superimposed.
The interaction between the exciter and blade can affect the phase and frequency differences of the exciter modules in the system. From the kinetic Equations (7)–(10), we can see that the kinetic equation established with as the degree of freedom contains only the term . Therefore, we can find the relationship between and the other three parameters , , , the term can be eliminated, and the equations are thus simplified.
Equation (8) is simplified first:
Equation (11) is substituted into Equation (7) to eliminate the term :
From Equation (13), we can derive that the main factors affecting the system are the exciting forces of the exciters. Therefore, the specific analysis is as follows: if the excitation frequency and phase of the exciters are the same, that is = , = , then the effect of the exciting force of the system can be completely superimposed. The response frequency of the system is exactly the same as the excitation frequency of the exciters; that is, the system excitation force, , and the system resonance frequency, .
If the excitation frequency is the same, the phase has a hysteresis and the lag time is , the natural frequency of the loading system is the same as the excitation frequency, and the excitation effect of the loading system is weakened; that is, the system excitation force, , and the resonance frequency of the system is .
4. Finite Element Method (FEM) Simulation
The technique of multi-point excitation is applied to an Al 40.3 m test blade. Table 1 shows the technical data of the test blade. Figure 5 shows the finite element model of the test blade with different cross-sections. The spar cap and trailing edges beam are laid with unidirectional fabric cloth. The blade shell and shear web are sandwich structures that are made of biaxial glass fabrics and balsa wood/PVC (polyvinyl chloride) core materials. The bonding joints of adhesive in the trailing edge is modeled as a solid structure. The pressure side and suction side of the blade are bonded together by structural adhesive. The model element is shell 91. As shown in Figure 6, the chord width and thickness distribution along the blade length can be seen from Figure 6a. The blade mass and flapwise bending stiffness distribution along the blade length is shown in Figure 6b.
4.1. Resonant Frequency
The resonance Bode diagram is shown in Figure 7. The excitation forces of the blade at the positions 16.5 m and 24 m are 1000 N and 300 N, respectively, the damping ratio is 0.25%, and the phase difference between the dual exciters is zero. The resonant frequency of the test system is 0.55 Hz. The maximum deflection in the tip is 1.74 m, and the phase is π/2.
4.2. Phase Coupling
The excitation forces of exciters A and B are 1000 N and 300 N, respectively. When the damping ratio is 0.25%, the relationship between the dual exciters at different phase differences and the vibration amplitude of the blade is as shown in Figure 8. When the phase difference is at 60°, the amplitude decreases by 15%. The excitation effect driven by the excitation exciters A and B cancel each other out at 180°. The excitation effect of exciting force 300 N placed at 24 m is equivalent to an excitation force of 1000 N placed at 16.5 m.
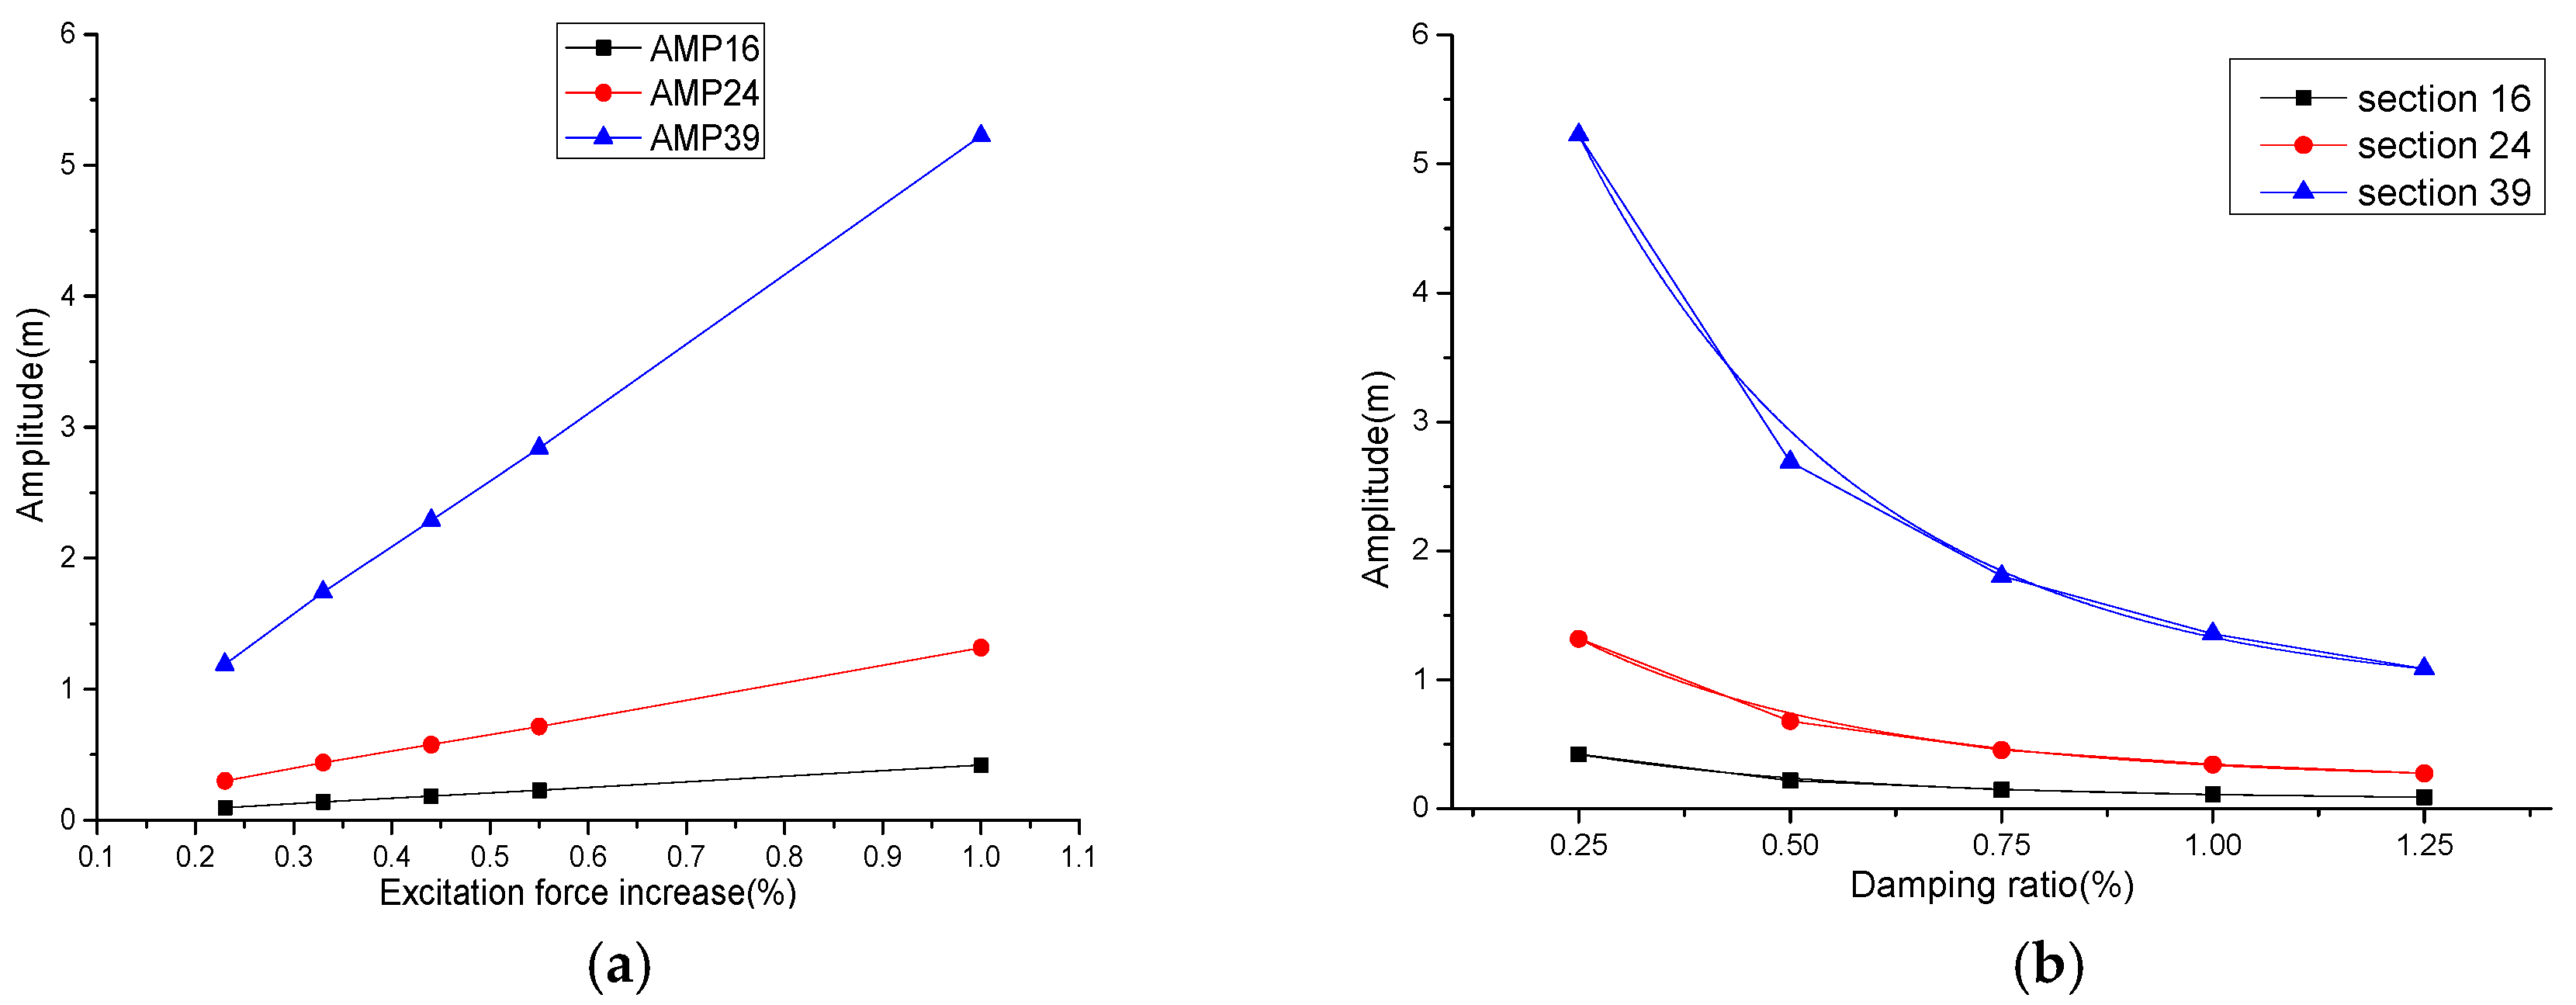
4.3. The Effects of Excitation Forces and Damping Ratio on the Amplitude of the Blade
When the blade is loaded at the resonant frequency and the damping ratio is 0.25%, the relationship between the increase of the excitation force and the amplitude of the blade is as shown in Figure 9a. The excitation force is linearly related to the amplitude of the blade. When the exciting forces of exciters A and B are 3000 N and 900 N, respectively, the relationship between the blade amplitude and the damping ratio of the fatigue test system is as shown in Figure 9b. The blade amplitude is inversely proportional to the damping ratio. When the fatigue test system reaches harmonic resonance, the energy consumption of the exciter is maintained in a dynamic equilibrium with the energy dissipation of the blade structure and aerodynamic resistance.
5. Experimental Verification
5.1. The Influence of Phase Difference on Vibration
The great difference in the cross-section stiffness of the large blade is likely to cause the phase difference between the exciter and the vibrating blade. According to the qualitative analysis of the dynamic equation, the phases of the exciters should be consistent to produce the best excitation effect. From the finite element simulation results, it is known that the phase difference will affect the dynamic moment amplitude in the cross-section along the blade in the case of the same excitation force. The bending moment is obtained by converting the value of the strain gauge attached to the blade according to Equation (14) (Euler-Bernoulli beam theory). The finite element model of the section is elongated by 20 times the chord length, and the deflection of the section under the force of 1 N is computed. The EI (z) of the section is obtained according to the deflection formula of a cantilever.
Figure 10 shows the bending moment distribution along the blade length by setting the phase difference between the exciters to perform multi-point excitation loading. The deviation between the experimental values and the computed value of the FEM is within 15%. The phase difference of exciters is adjusted from 0° to 180° with a 30° interval. The phase difference within 30° has little effect on the bending moment amplitude distribution. When the phase difference is 180°, the bending moment amplitude distribution generated by the dual exciting forces is, respectively, the peak and the valley, which cancel each other out after the superposition of the excitation effect. That is, the excitation effect of the exciter at position A can be equivalent to that at position B by tuning the excitation forces. Through the multi-point excitation fatigue test, the bending moment distribution on the blade can be obtained by superimposing the vibration effect produced by the exciting force in different cross-sections. Multi-point excitation provides more approaches for fitting the target bending moment. In general, the effect of phase change on the bending moment distribution is basically linear. The bending moment amplitude distribution fluctuates between the dual exciting force cross-sections along the blade. The local bending moment can be adjusted by using the phase difference when fitting the target bending moment.
5.2. The Relationship between the Excitation Force and Bending Moment Amplitude along the Blade
In Figure 11a, the horizontal axis denotes the excitation force, which is calculated by the mean of the dual exciting force increase. The vertical axis denotes the increase of the bending moment amplitude along the blade. Figure 11a depicts four group experiments of single-point A, single-point B, dual-point with the same excitation forces, and dual-point with different excitation forces. The amplitude of the exciting force is linearly related to the amplitude of the blade bending moment. The resulting bending moment of the multi-point excitation method can be superimposed by the bending moments generated by each of the exciting forces. The position of the excitation force has an effect on the amplitude of the test blade; the farther away from the blade root, the smaller the excitation force used to achieve the same amplitude. The positions at 16 m, 24 m, and 32 m require exciting forces of 1000 N, 300 N, and 120 N, respectively, when the same amplitude of the test blade is reached. As can be seen from Figure 11b, the slope of the functions between the excitation force and the amplitude of the blade at different positions are the same. In the harmonic resonance state, the excitation energy consumption of the system is equal to the energy of damping dissipation; therefore, the blade damping ratio is related to the amplitude of the excitation force.
The damping ratio is tested by the following method: a static force is applied at the position of the blade at 32 m, and suddenly released when the deflection of this position reaches 1.2 m. At the same time, sensors installed in the position of the blade at 16.5 m and 24 m begin to collect the acceleration data. The damping ratio of the blade at different deflection positions are obtained by the amplitude attenuation ratio according to Equation (15). As shown in Figure 11c, the x-axis is the deflection amplitude attenuation of the blade at the 32-m position, as measured by the laser sensor. The y-axis is the damping ratio, obtained by the acceleration from the sensors.
Damping ratio calculation equation:
6. Fatigue Test of the Equivalent Life Cycle
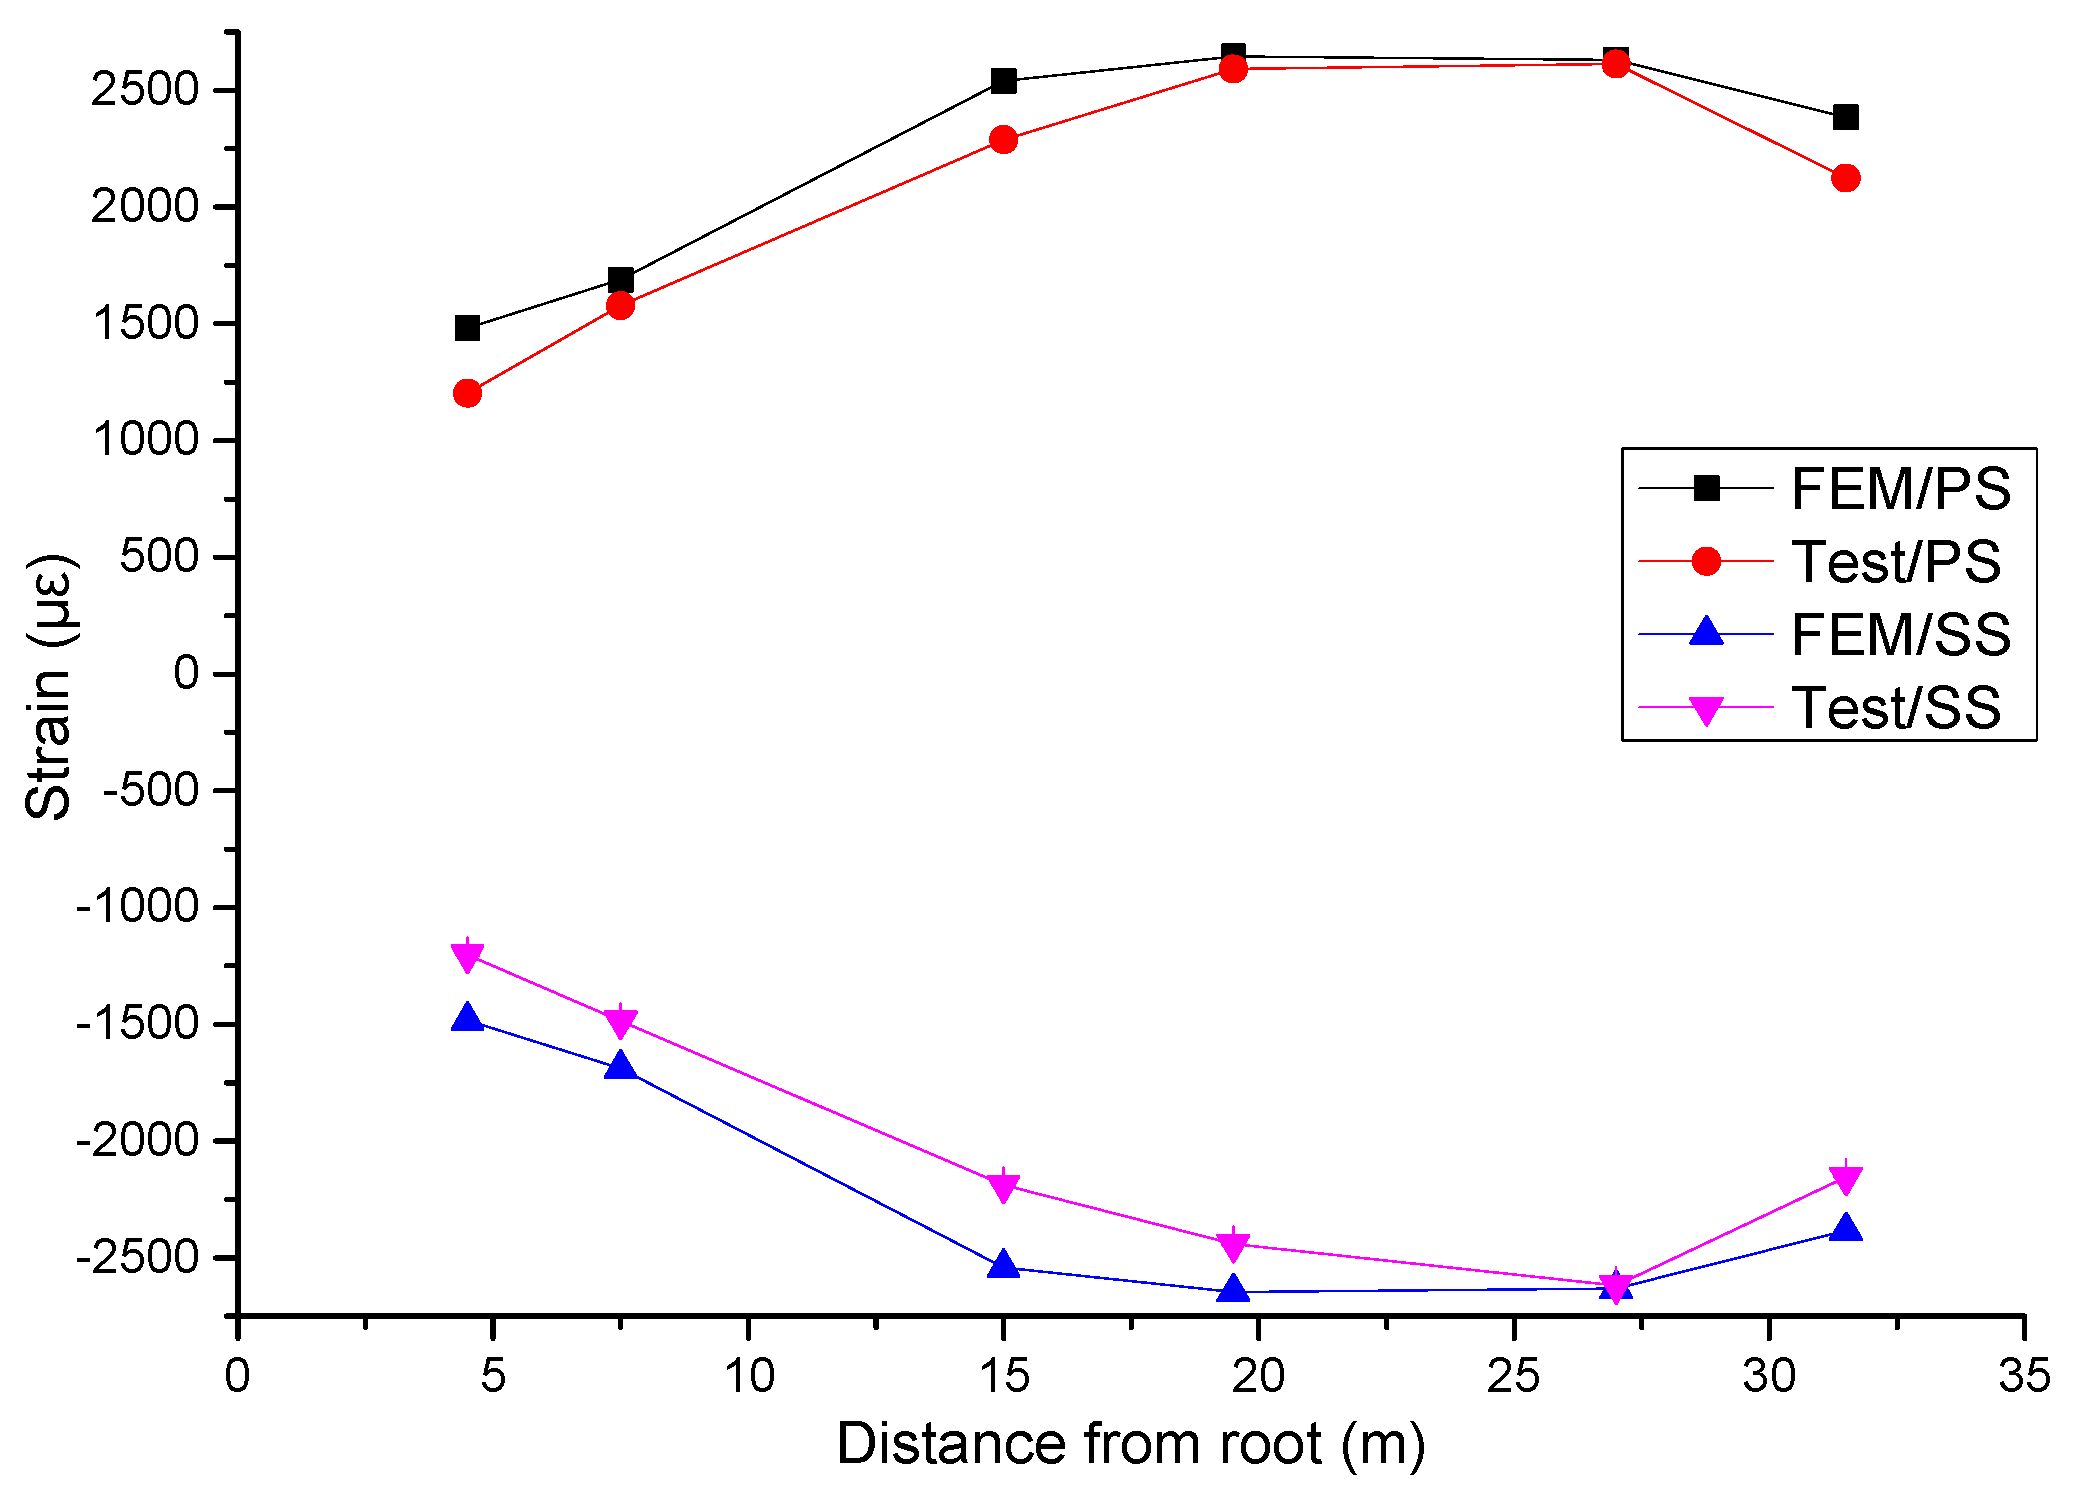
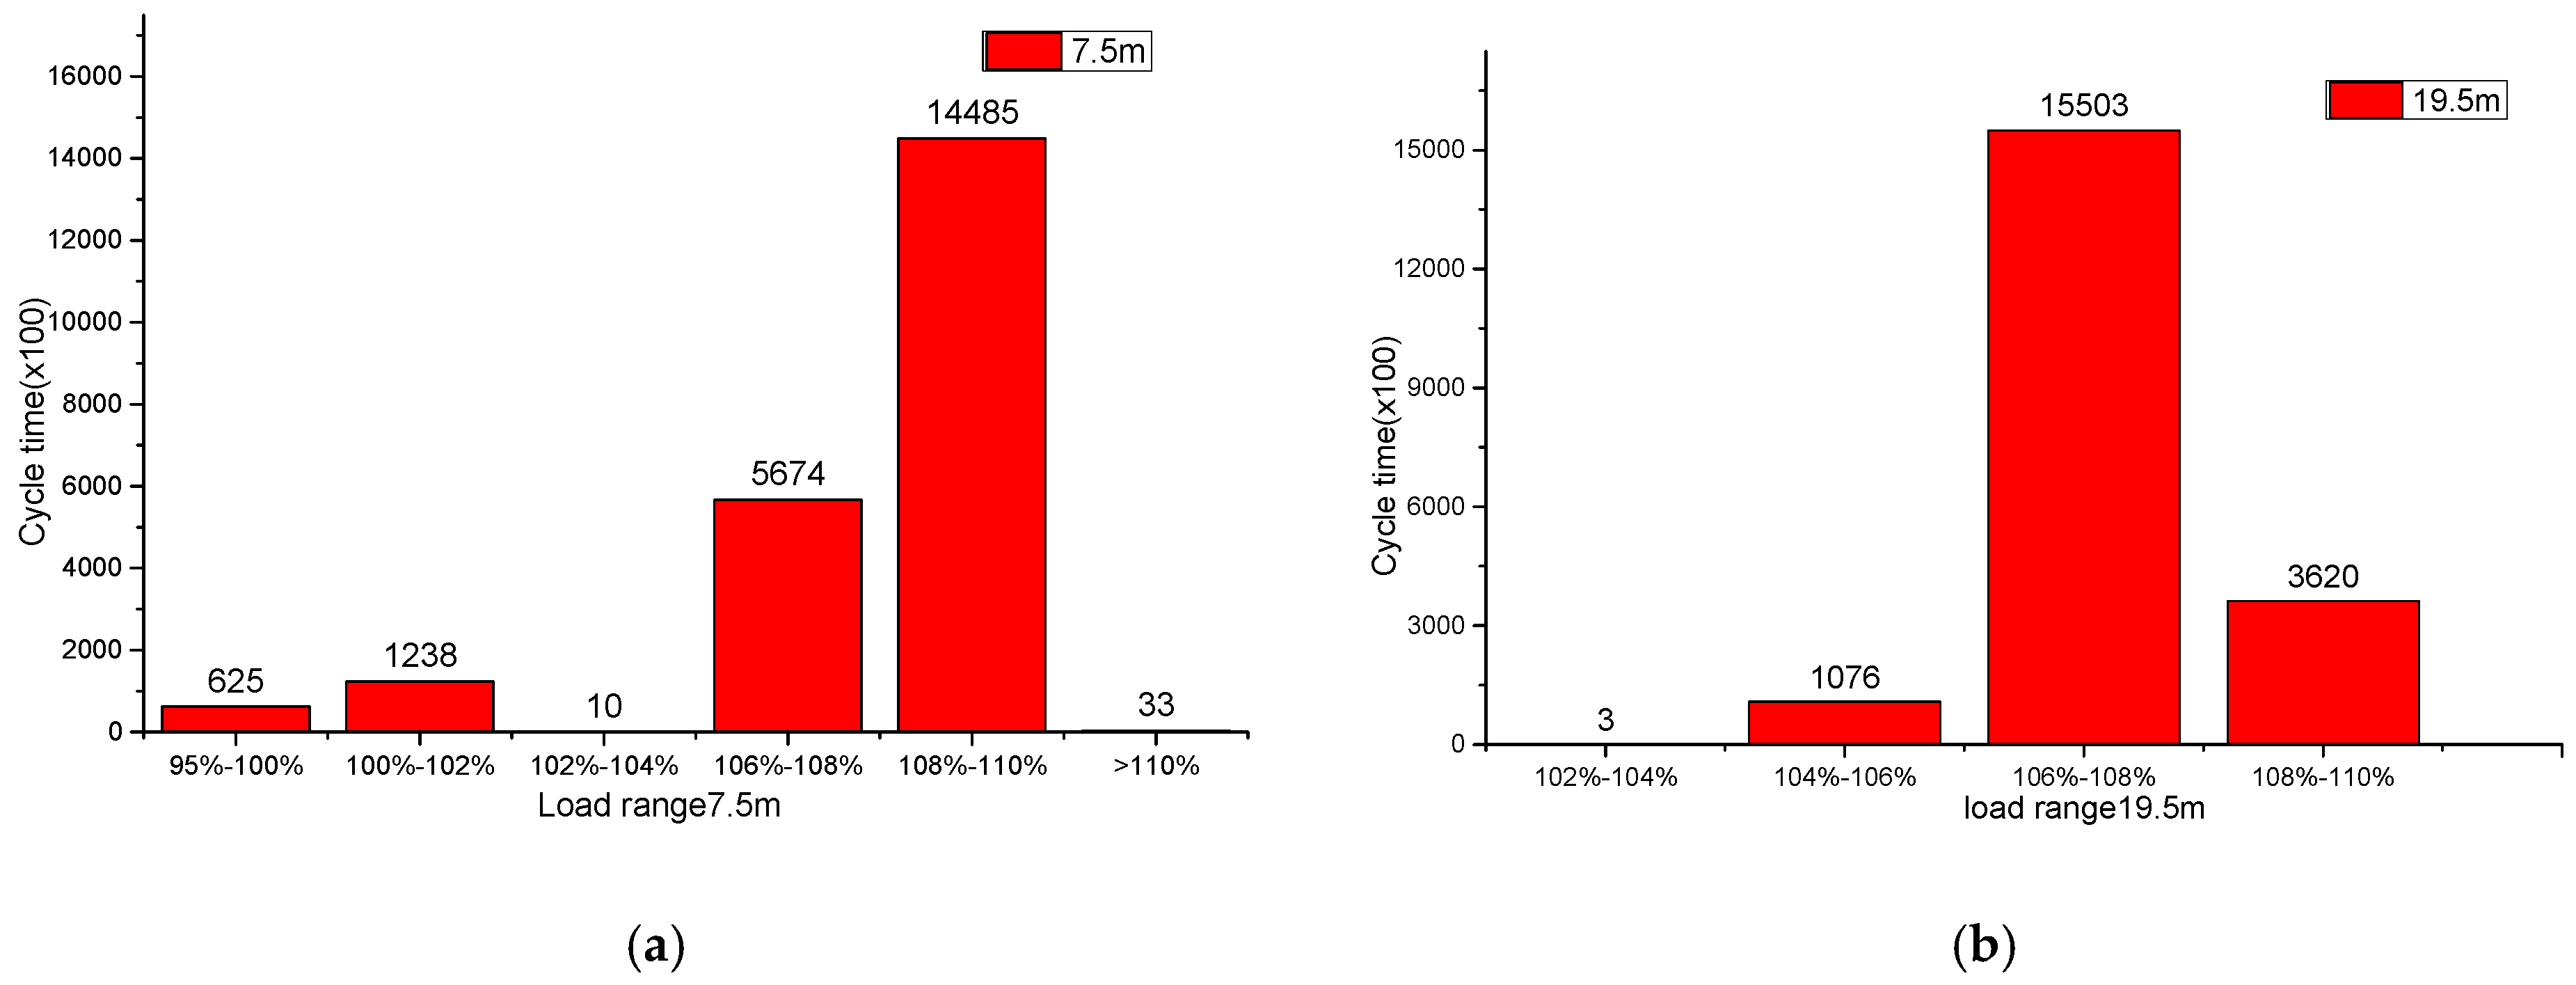
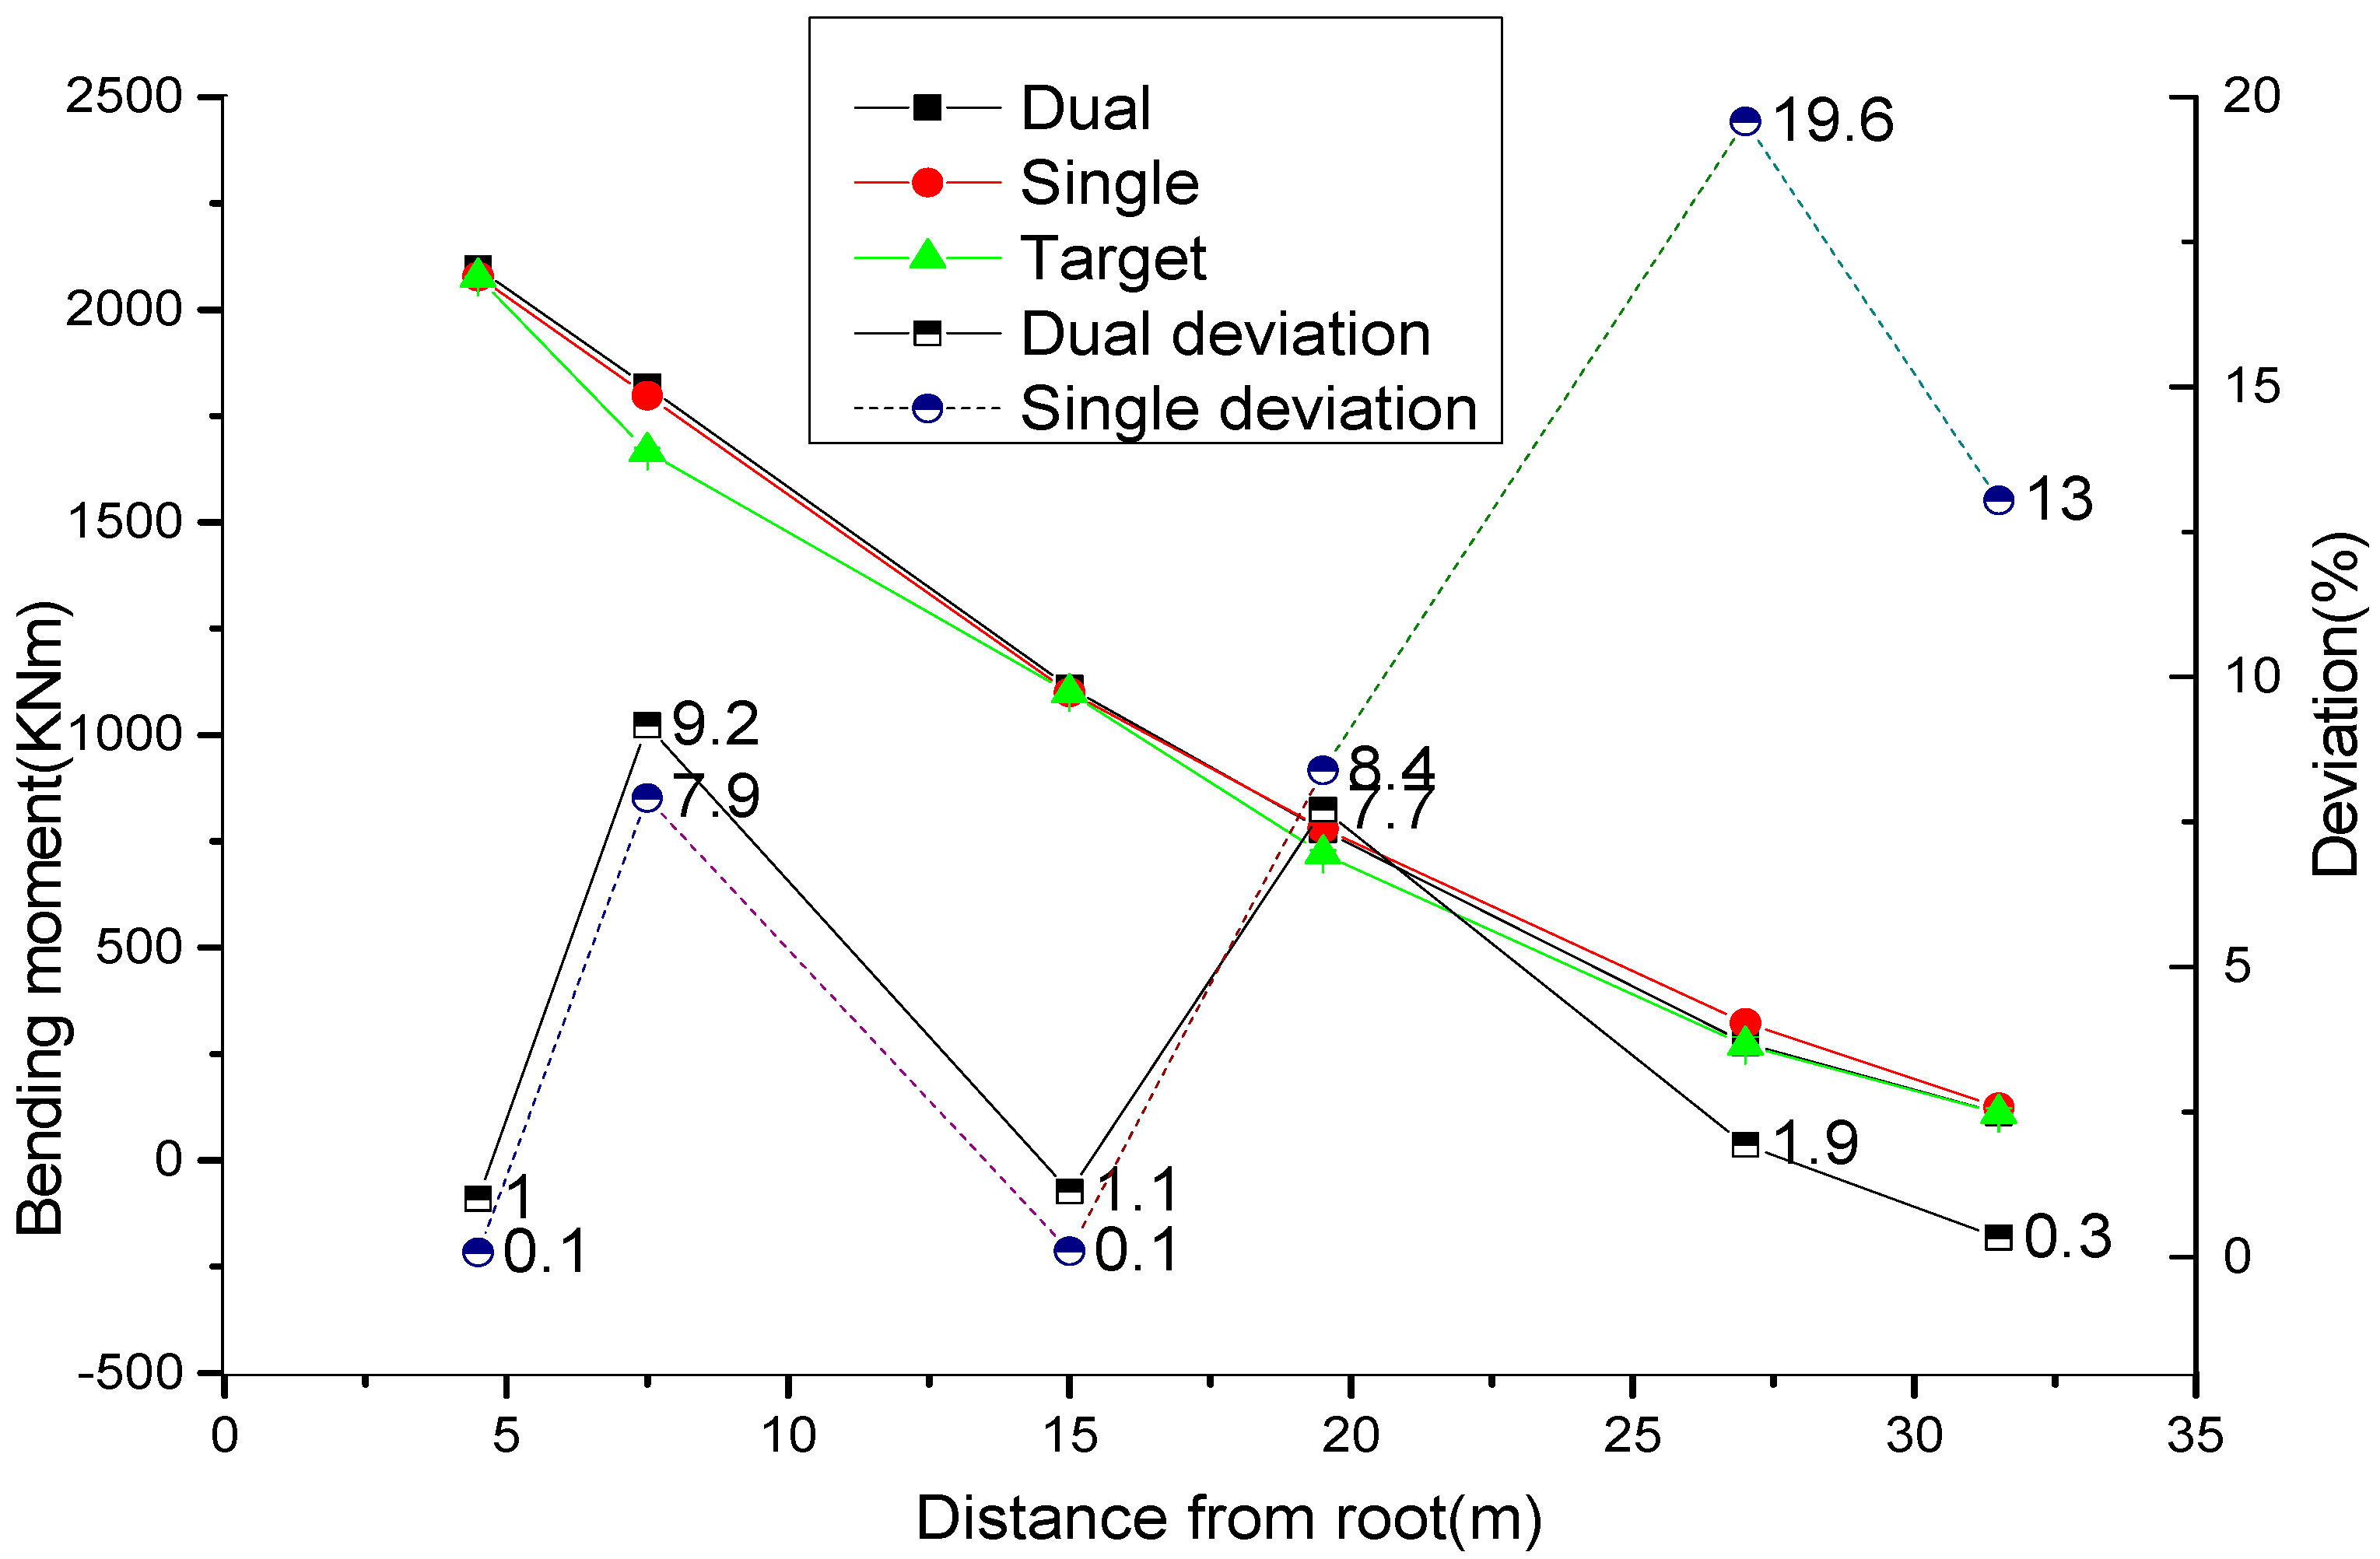
A multi-point excitation fatigue test program was verified on the Al 40.3 m blade. The spar cap is mainly subjected to bending moments during the fatigue test in the flapwise direction. The blade root of the model is fully displaced, and the excitation forces applied at 16-m and 24-m positions are 1680 N and 530 N, respectively. Figure 12 shows the comparison between the FEM-computed strain in the spar cap and the measured results. The transformation of strain and bending moments are shown in Equation (14). Figure 13 shows the bending moment of two million cycles in the cross-section along the blade. Section 7.5 m is the position of the maximum chord of the blade. The spar cap in the cross-section that is 19.5 m away from the blade root is the most dangerous area. The frequency distribution of the bending moment is shown in Figure 14, where = 10. The statistical gradient of the bending moment is 2%. The frequency distribution of each bending moment is converted into a cumulative equivalent bending moment according to Equation (16). Figure 15 depicts the comparison of the spatial damage distribution with the target distribution for single-point excitation and dual-point excitation. It must be stressed that the practical approach to fit the target bending moment amplitude gives rise to considerable deviations from the desired damage distribution. A deviation of only 1% from the bending moment amplitude causes an intensified deviation of 10% from the target damage index. Both the single-point excitation and the dual-point excitation can cover the target distribution. The deviation of the single-point excitation and the target bending moment is 19.6%, and the deviation of the dual-point excitation and the target excitation can be controlled to be within 9.2%, which shows that the dual-point excitation is more suitable for fitting the target bending moment.
Miner’s damage accumulation rule:
The entire test system is in a harmonic resonance state, and the system energy input is proportional to the energy dissipated. The excitation force on the system does positive work, which sends energy continually to the system. When the entire test system is in a stable state of harmonic resonance, there is a dynamic balance in the system between the input energy of excitation forces and the dissipated energy. The harmonic excitation force is assumed to be . The steady-state response of the vibration amplitude is .
The work of excitation forces in a period:
The dissipated energy by damping in a period:
As the work of the excitation force is equal to the energy dissipated by damping in a period, Equations (17) and (18) are simplified:
Table 2 depicts the experiment variables of single-point excitation and dual-point excitation. The energy consumption, excitation force, and axial force of the exciter are computed according to Equations (17), (19), and (20). As shown in the Table 3, when the blade reaches the same vibration bending moment amplitude, the maximum excitation force for a single-point system is 4730 N, while the maximum excitation force for a dual-point system is 1669 N. The decrease in the excitation force is beneficial to improve the service life of the equipment and to reduce spare part replacement. Compared with the single-point excitation approach, the axial force and energy consumption of the exciter in the dual-point excitations are only 60% of the single-point excitations, which is beneficial to improve the fatigue life of the equipment and reduce the cost of fatigue testing.
7. Conclusions
The multi-point excitation test system model is established by the Lagrangian equation. According to the results of kinetic analysis, it was found that the dual-point excitation effect can reach the maximum at the same frequency and phase. When the frequency of the exciter is the same as the resonant frequency of the system, the amplitude of the blade is the maximum and the phase is π/2.
The phase difference between the dual exciters in the resonant state is simulated by the finite element method. The experimental results show that the phase difference between the exciters can cause the fatigue damage distribution to be offset from each other. The fatigue damage distribution produced by the exciter at position A and B can be equivalent to each other. The fatigue damage distribution of multi-point excitation is obtained by superimposing the damage distribution generated by the each position excitation force. The local bending moment can be adjusted using the phase difference when fitting the target bending moment. The fatigue damage distribution of the blade is proportional to the excitation force, while inversely proportional to the damping ratio.
The equivalent full life fatigue test of a full-size blade is carried out by the dual-point excitation approach. The dual exciters provide a stable operation. The deviation of fitting the target moment of the dual-point excitation is better than that of a single point excitation. During the whole fatigue test, the load fluctuation level of the dual-point excitation is small. The excitation energy of the dual-point excitation uses 60% less energy than that of the single-point excitation when the same damage distribution is reached. Therefore, the excitation energy of the exciter is reduced, which is conducive to improving equipment service life and test cost.
With the rise of offshore wind power, the reliability requirements of large blades are becoming higher. Full-scale blade tests are the most accurate means to experimentally simulate damage evolution and are, therefore, used to demonstrate that a blade type fulfils the reliability requirements. Multi-point excitation can meet the requirements of large blade fatigue testing, which is a very promising application for offshore wind turbine blades.
Acknowledgments
The work was supported by the Aeolon wind turbine blade test center, which provided experimental equipment to complete the test. Moreover, the authors are very grateful for the support of Zhao Xinhua for his helpful guidance.
Author Contributions
Zujin Pan proposed the research, wrote, and revised the paper; Jianzhong Wu supervised the research.
Conflicts of Interest
The authors declare no conflict of interest.
Abbreviations
| Excitation force where index indicates actuator No.1 | |
| Excitation force where index indicates actuator No.2 | |
| The angle of the blade rotates around the -axis when it is relative to the ground | |
| The equivalent mass of the blade | |
| Equivalent stiffness in the direction of -axis | |
| Equivalent damping in the direction of -axis | |
| Displacement of blade in flapwise direction in the plane | |
| The rotation moment of the blade rotates around the -axis | |
| The total dynamic mass of the dual exciter | |
| The distance away from the rotation axis | |
| The displacement of dynamic mass block of the dual actuator relative to the ground | |
| Motor angular velocity | |
| Ball-screw travel | |
| The displacement of dynamic mass block relative to the blade | |
| Kinetic energy of the test system | |
| Potential energy of the test system | |
| Dissipation energy of the test system | |
| Generalized coordinates | |
| Generalized force | |
| Generalized velocity | |
| Loading torque of motor m1 | |
| Loading torque of motor m2 | |
| Excitation frequency of motor m1 | |
| Excitation frequency of motor m2 | |
| Phase of motor m1 | |
| Phase of motor m2 | |
| Response frequency of system | |
| Time lag between exciter | |
| Time | |
| The excitation force in time of the test system | |
| Angular natural Eigen frequency of the test system | |
| Angular frequency of the actuator | |
| The ratio of angular frequency of actuator to the angular natural Eigen frequency | |
| The amplitude of the blade | |
| The maximum exciting force | |
| The stroke of dynamic mass | |
| Single cycle work of the actuator | |
| Single cycle work of damping | |
| Damping | |
| Stiffness | |
| Amplitude of the system | |
| Phase | |
| Period | |
| Damping ratio | |
| Cycles | |
| The amplitude of the th cycle | |
| The amplitude of the ()th cycle | |
| The strain in the position and time | |
| The bending moment in the position and time | |
| The distance between the strain gauges and the central axis in the position . | |
| Inertia axis in the position | |
| Equivalent bending moment | |
| The number of equivalents | |
| Slope of double logarithmic SN-diagram | |
| Number of load cycles | |
| Average bending moment amplitude per bin | |
| Maximum number of load cycles | |
| Maximum axial force of the motor | |
| Dynamic mass | |
| i, j | Node index. i, j = 1, 2, …, n |
| EI(z) | Stiffness of cross section in z position along the blade long direction |
References
- International Electrotechnical Commission. International Standard IEC 61400-23 Wind Turbines–Part 23: Full-Scale Structural Testing of Rotor Blades; IEC: Geneva, Switzerland, 2014. [Google Scholar]
- Germanischer Lloyd. Rules and Guidelines IV Industrial Services 1, Guideline for the Certification of Wind Turbines; Germanischer Lloyd: Hamburg, Germany, 2010. [Google Scholar]
- Zhang, L.-A.; Wei, X.-T.; Tao, L.-M.; Huang, X.-M. Coupling Characteristics and Test on Dual-Excitation for Large Wind Turbine Blade fatigue Test. Opt. Precis. Eng. 2016, 24, 503–510. [Google Scholar]
- Zhang, L.-A.; Huang, X.-M.; Yao, J.-K. Vibration Coupling Features for a Dual-Point Fatigue Loading System of Wind Turbine Blades. J. Vib. Shock 2015, 34, 83–87. [Google Scholar]
- Liao, G.H.; Wu, J.Z.; Lai, X. Experiment and Electromechanical Coupling Characteristics of Multi-Point Excitation Fatigue Loading System. J. Tongji Univ. (Nat. Sci.) 2015, 43, 1582–1587. [Google Scholar]
- Liao, G.H.; Wu, J.Z.; Lai, X. Experimental Study and Coupling Characteristics of Double Hammer Excitation Fatigue Loading System. J. Cent. South Univ. (Sci. Technol.) 2016, 47, 3692–3699. [Google Scholar]
- Wang, N. Coupling Mechanism of Dual-Excitation Fatigue Loading System of Wind Turbine Blades. Ph.D. Thesis, Shandong University of Technology, Zibo, Shandong, China, 2015. [Google Scholar]
- Kong, X.J. Decoupling Control Research on Dual-Excitation Fatigue Loading Coupling System for Wind Turbine Blades. Ph.D. Thesis, Shandong University of Technology, Zibo, Shandong, China, 2016. [Google Scholar]
- Eder, M.A.; Belloni, F.; Tesauro, A.; Hanis, T. A Multi-Frequency Fatigue Testing Method for Wind Turbine Rotor Blades. J. Sound Vib. 2017, 388, 123–146. [Google Scholar] [CrossRef]
- Hughes, S.; Musial, W.; White, D. Dual-Axis Resonance Testing of wind Turbine Blades. U.S. Patent 8,621,934, 9 December 2008. [Google Scholar]
- Greaves, P.; Prieto, R.; Gaffing, J.; van Beveren, C.; Dominy, R.; Ingram, G. A Novel Method of Strain-Bending Moment Calibration for Blade Testing. J. Phys. Conf. Ser. 2016, 753, 042014. [Google Scholar] [CrossRef]
- Greaves, P. Fatigue Analysis and Testing of Wind Turbine Blades. Ph.D. Thesis, Durham University, Durham, UK, 2013. [Google Scholar]
- Greaves, P.; Prieto, R.; McKeever, P.; Dominy, R.; Ingram, G. Bi-Axial Fatigue Testing of Wind Turbine Blades; EWEA: Paris, France, 2015. [Google Scholar]
- White, D. New Method for Dual-Axis Fatigue Testing of Large Wind Turbine Blades Using Resonance Excitation and Spectral Loading; No. NREL/TP-500-35268; National Renewable Energy Laboratory: Golden, CO, USA, 2004.
- White, D.; Musial, W.; Engberg, S. Evaluation of the New B-REX Fatigue Testing System for Multi-Megawatt Wind Turbine Blades. In Proceedings of the ASME/AIAA Wind Energy Symposium, Reno, NV, USA, 10–13 January 2005. [Google Scholar]
- Pan, Z.J.; Wu, J.Z.; Sun, Y.R.; Liu, J. Effects of Aerodynamic Fairing on Full Scale Blade Fatigue Test; IOP Conference Series: Materials Science and Engineering; IOP Publishing Ltd.: Bristol, UK, 2017; Volume 207. [Google Scholar]
- Zarouchas, D.S.; Makris, A.A.; Sayer, F.; Van Hemelrijck, D.; Van Wingerde, A.M. Investigations on the Mechanical Behavior of a Wind Rotor Blade Subcomponent. Compos. Part B Eng. 2012, 43, 647–654. [Google Scholar] [CrossRef]
- Leon, M.; Brøndsted, P.; Nijssen, R.; Lekou, D.J.; Philippidis, T.P. Materials of Large Wind Turbine Blades: Recent Results in Testing and Modeling. Wind Energy 2012, 15, 83–97. [Google Scholar]
- Asl, M.E.; Niezrecki, C.; Sherwood, J.; Avitabile, P. Predicting the Vibration Response in Subcomponent Testing of Wind Turbine Blades. In Special Topics in Structural Dynamics; Springer: Orlando, FL, USA, 2015; Volume 6, pp. 115–123. [Google Scholar]
- Hughes, S.D.; Musial, W.D.; Stensland, T. Implementation of two-axis servo-hydraulic system for full-scale fatigue testing of wind turbine blades. In Proceedings of the Windpower 99, Burlington, VT, USA, 20–23 June 1999. [Google Scholar]
- Jayantha, A.E.; Philip, D.C. Accelerated Full Scale Fatigue Testing of a Small Composite Wind Turbine Blade Using a Mechanically Operated Test Rig. In Proceedings of the SIF 2004 Structural Integrity and Fracture, Brisbane, Australia, 26–29 September 2004. [Google Scholar]
- Liu, Y.Z.; Chen, L.Q.; Chen, W.L. Vibration Mechanics; Higher Education Press: Beijing, China, 2010. [Google Scholar]
Figure 1.
Comparison of two types of loading systems: (a) Linear exciter loading system; (b) Rotation pendulum loading system.
Figure 1.
Comparison of two types of loading systems: (a) Linear exciter loading system; (b) Rotation pendulum loading system.
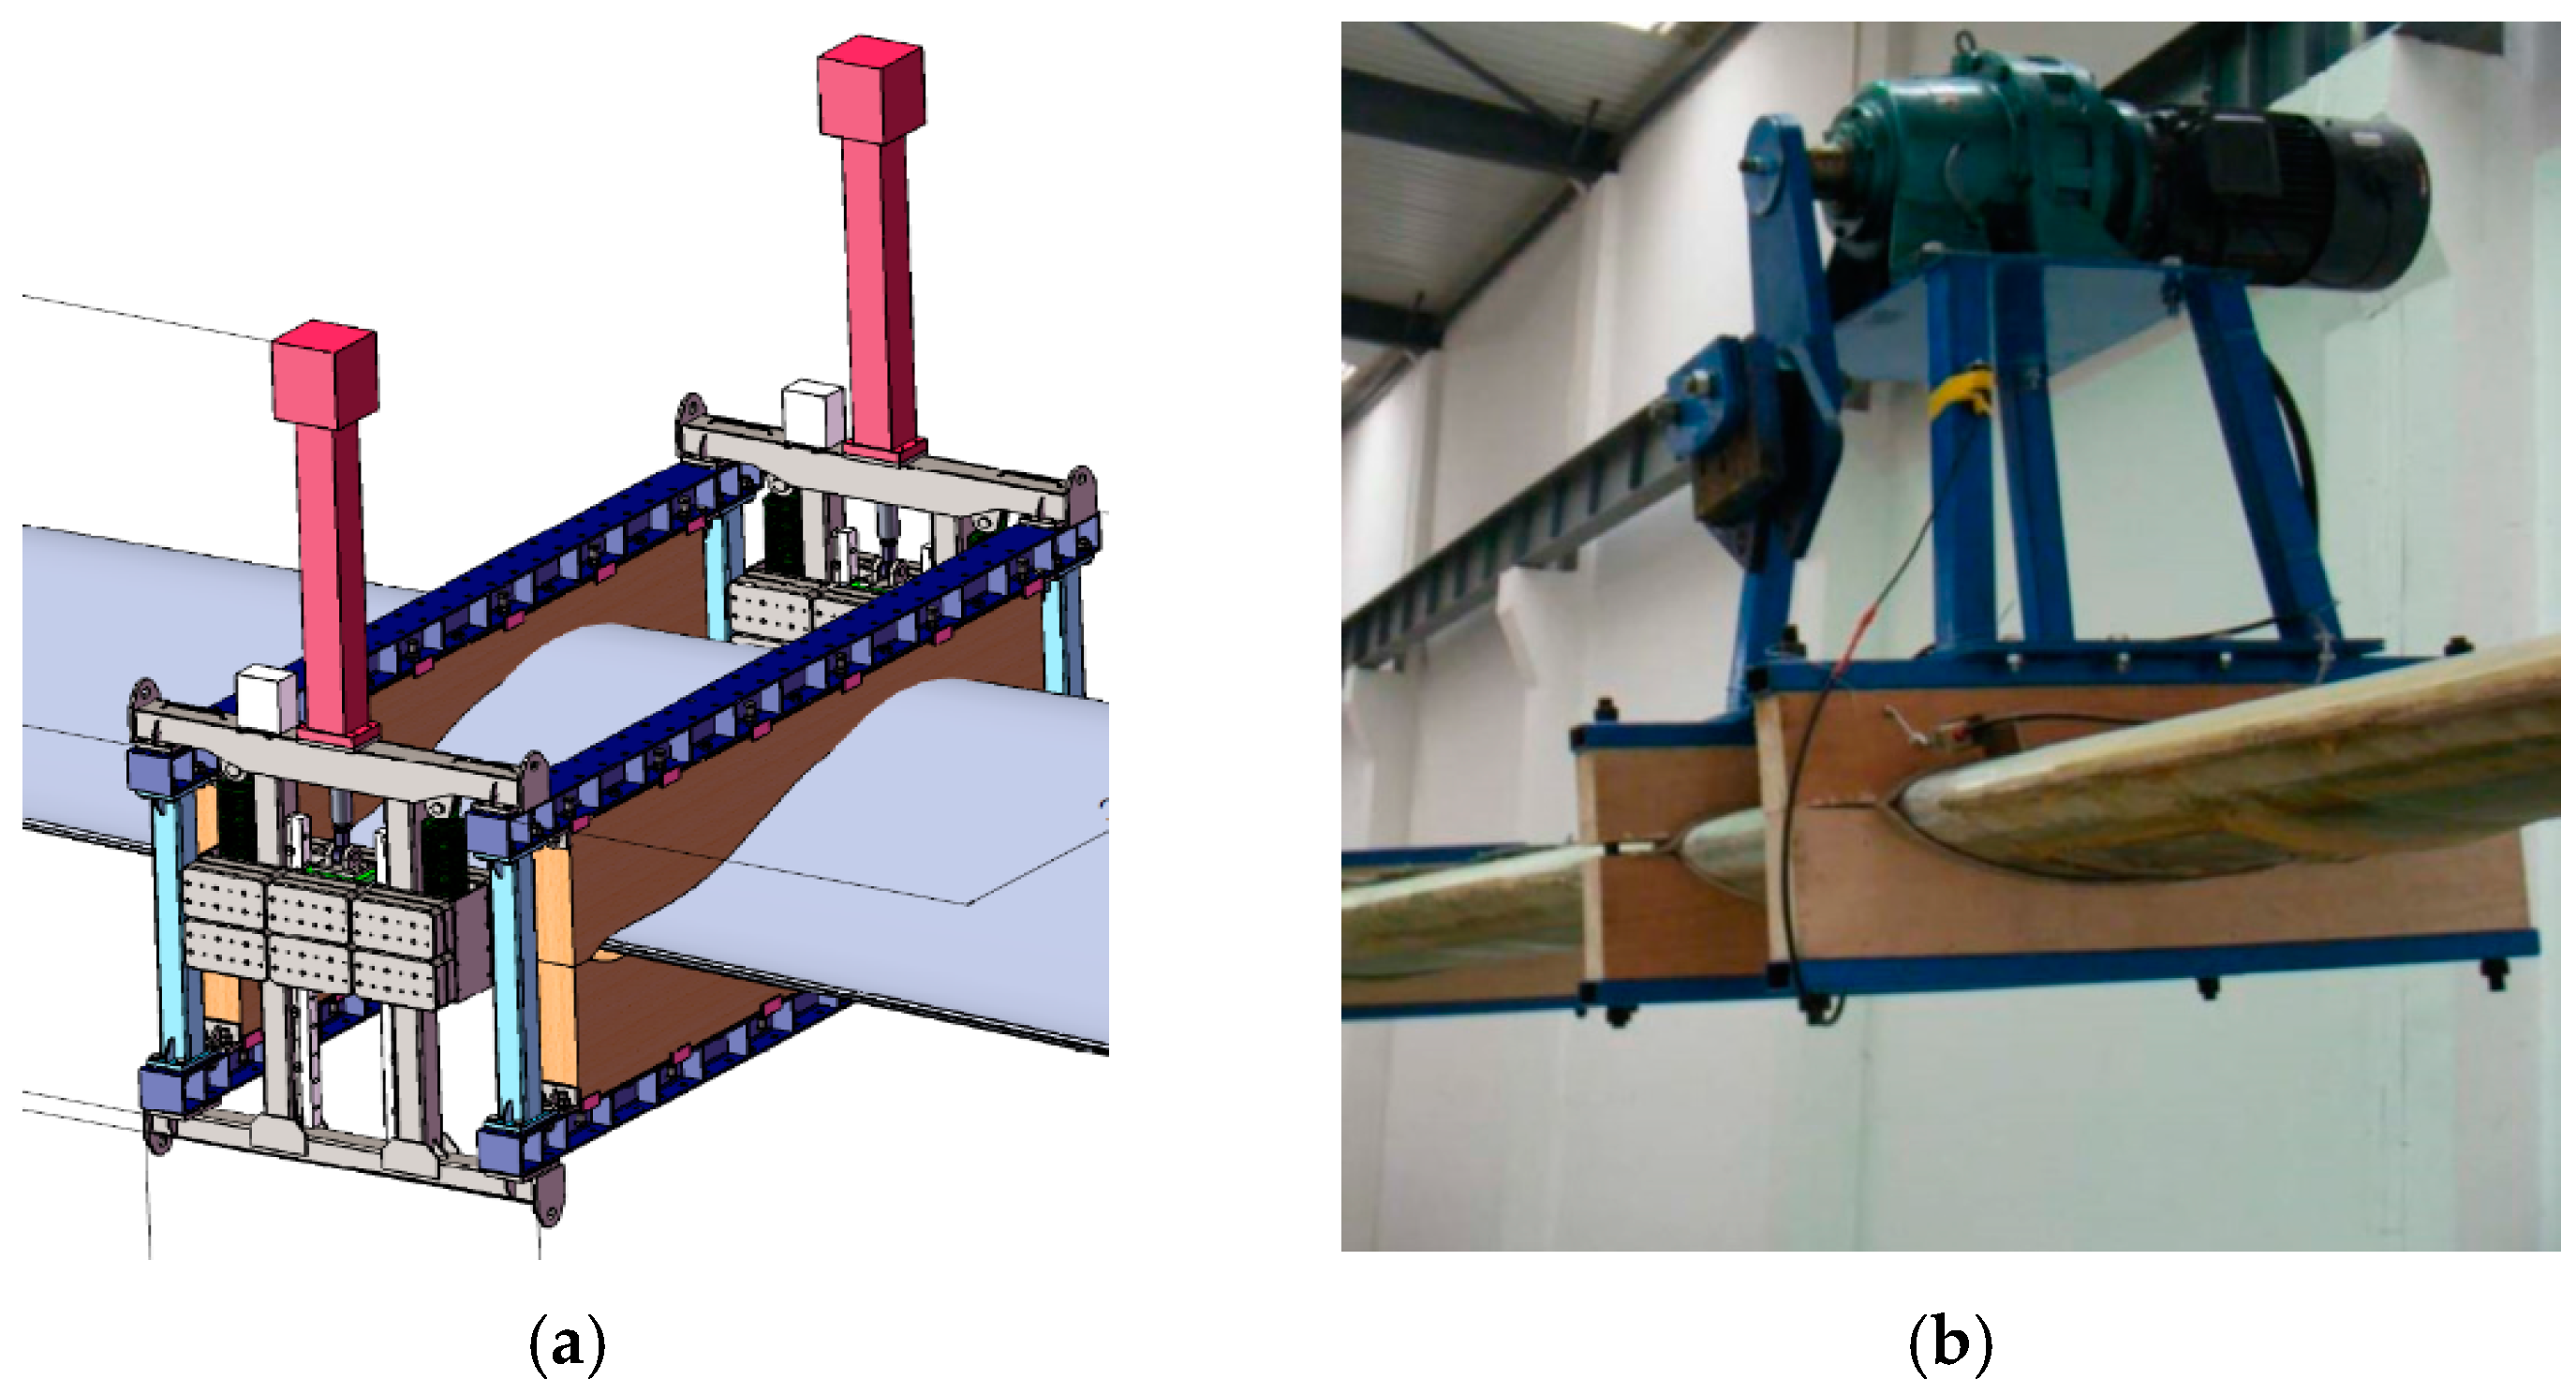
Figure 2.
Comparison of multi-point excitation and single-point excitation system: (a) Single point excitation and tuning mass; (b) Multi-point excitation.
Figure 2.
Comparison of multi-point excitation and single-point excitation system: (a) Single point excitation and tuning mass; (b) Multi-point excitation.
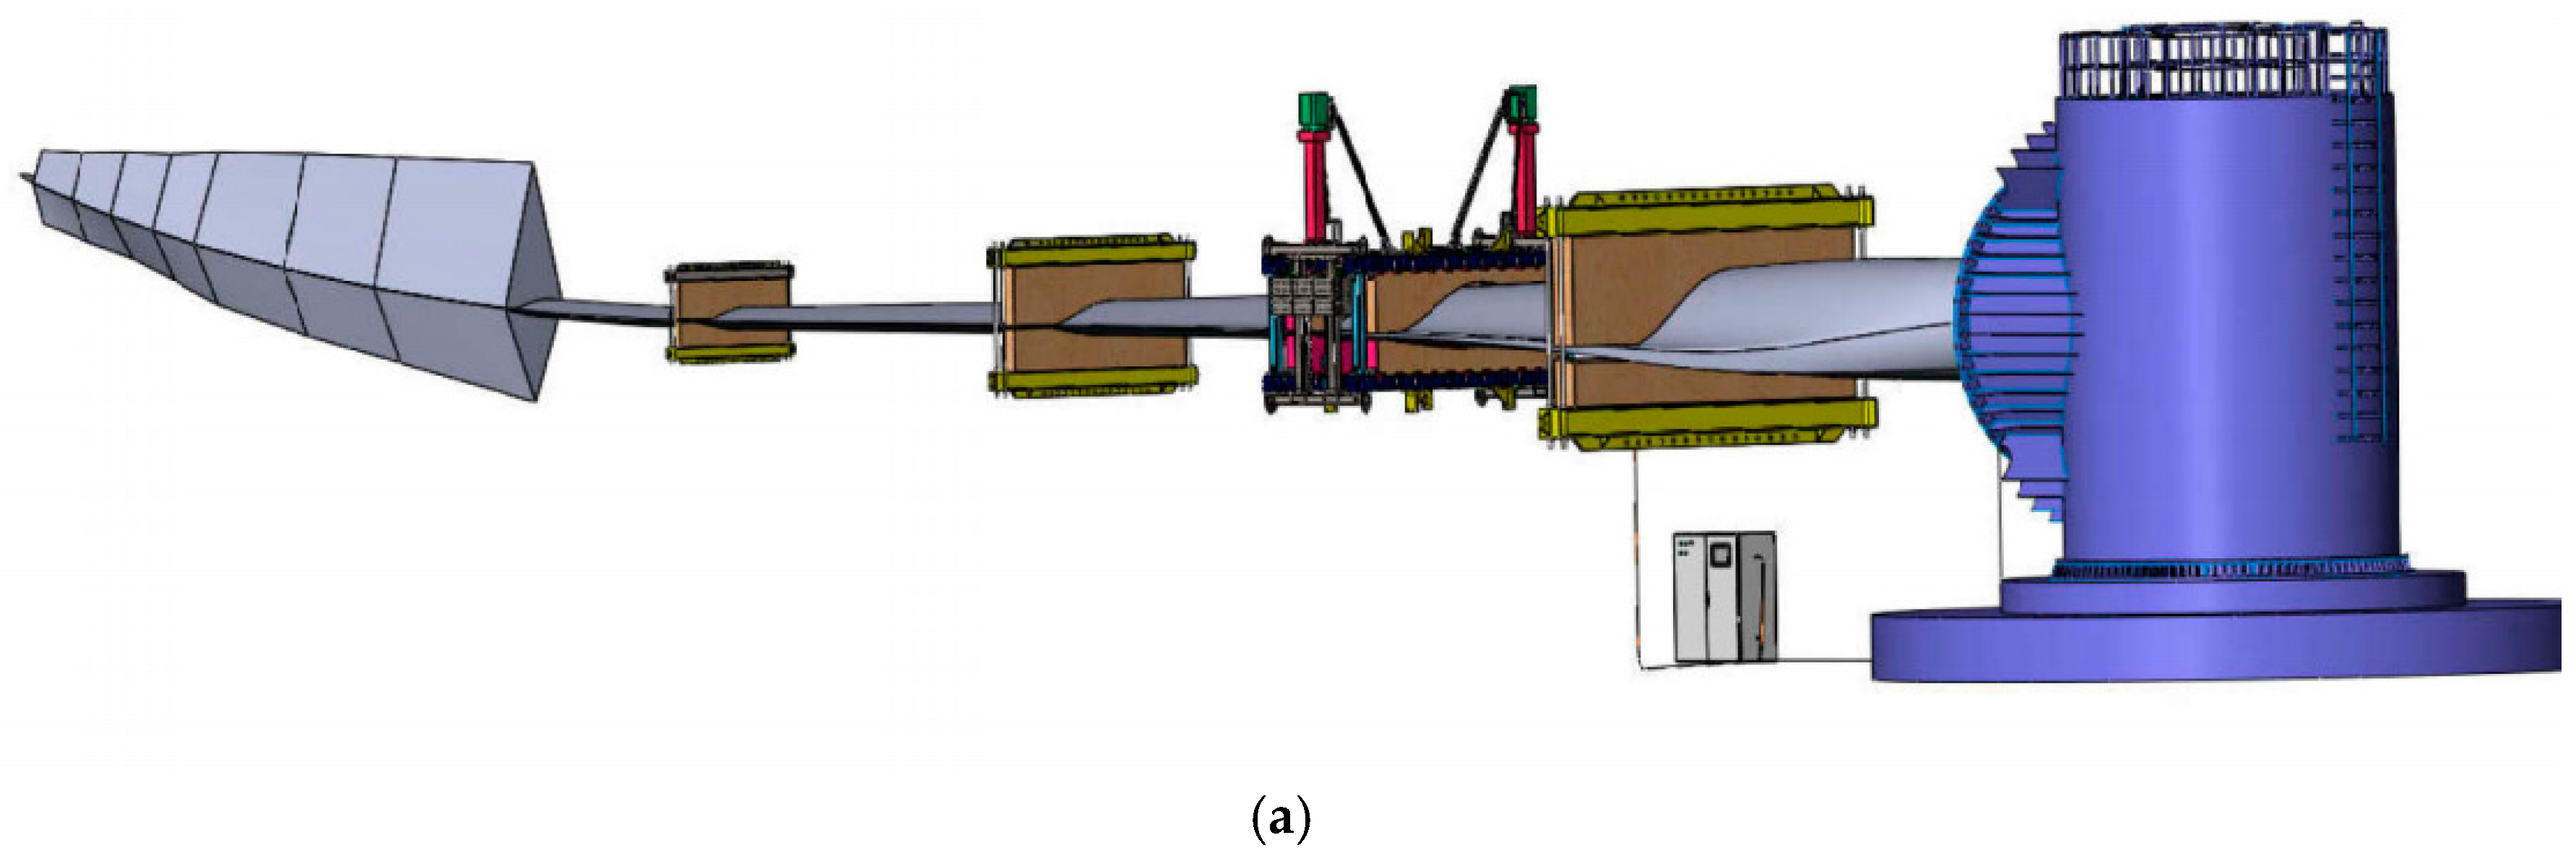
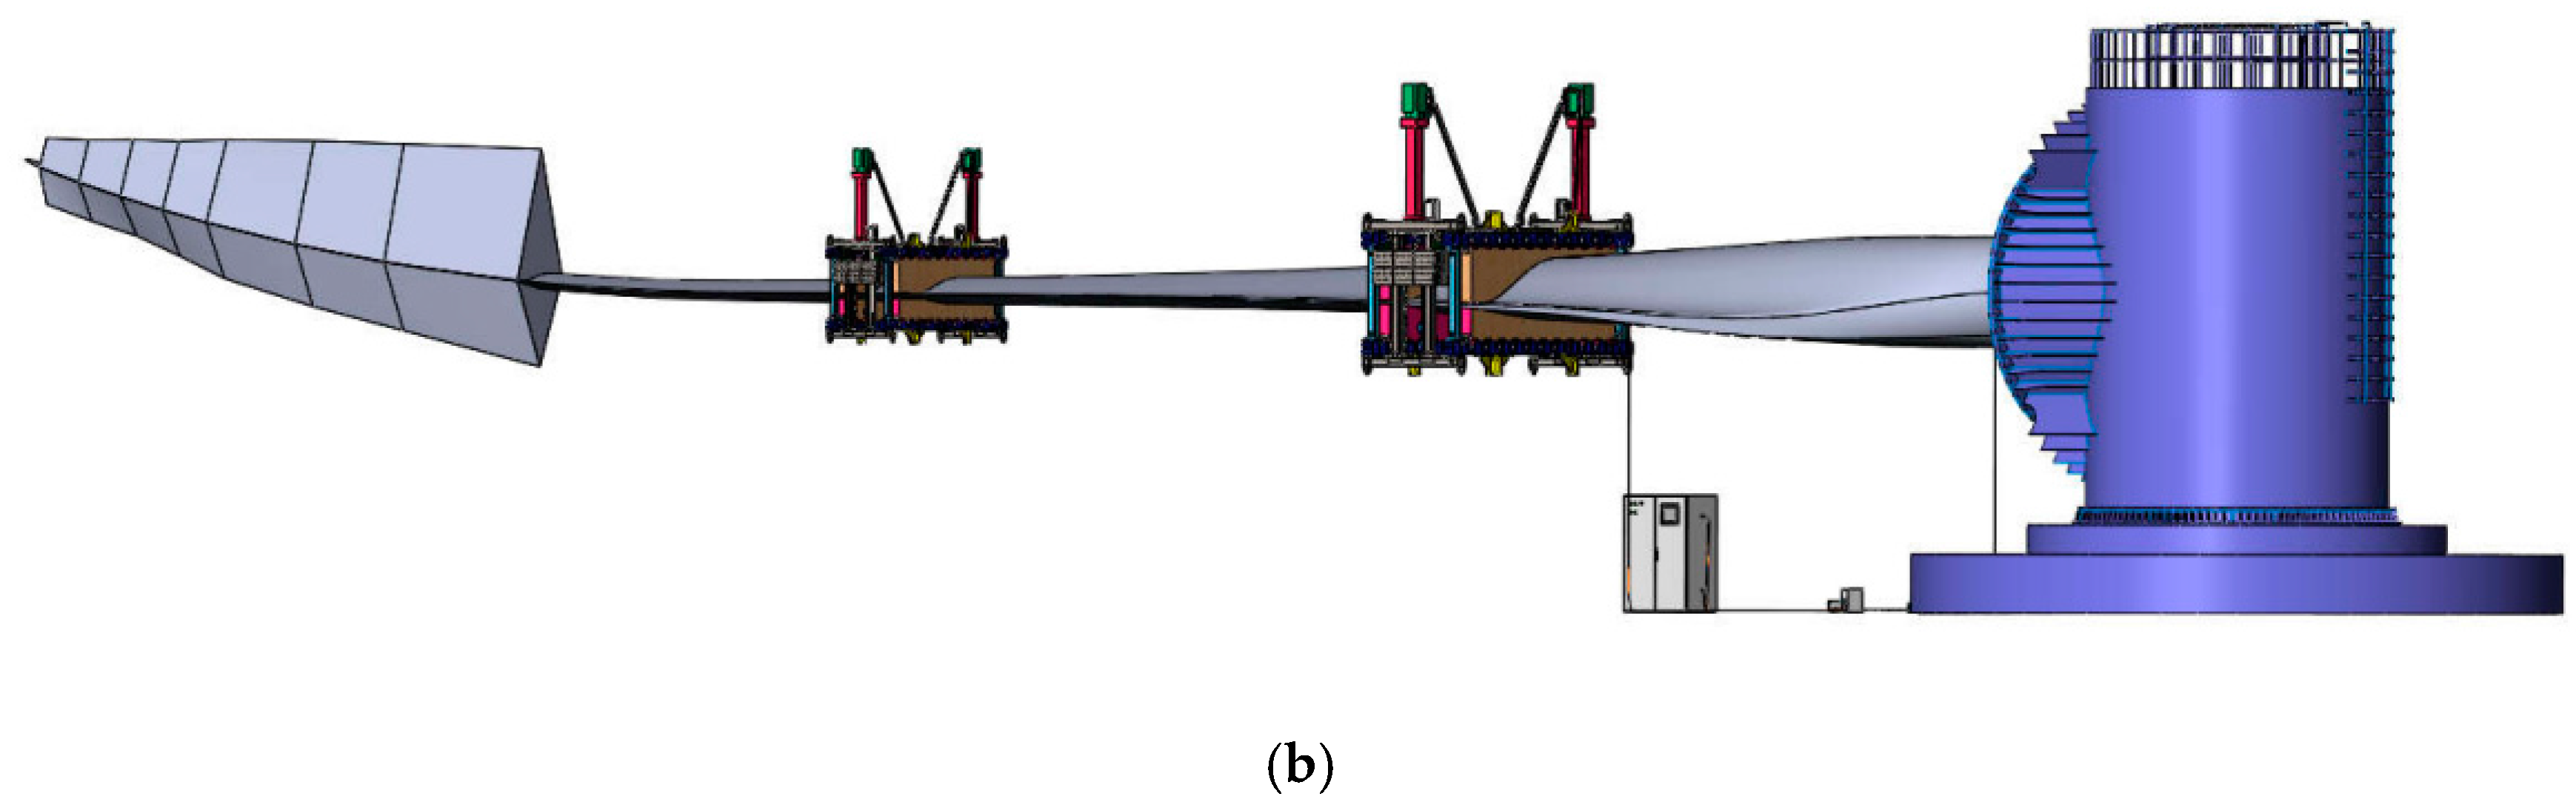
Figure 3.
Bending moment distribution for different methods. (a) Bending moment distribution for different methods; (b) The change of moment distribution for different methods.
Figure 3.
Bending moment distribution for different methods. (a) Bending moment distribution for different methods; (b) The change of moment distribution for different methods.

Figure 4.
The dynamic model of the multi-point excitation system.

Figure 5.
Finite Element Method (FEM) mesh of the test blade with different cross-sections.
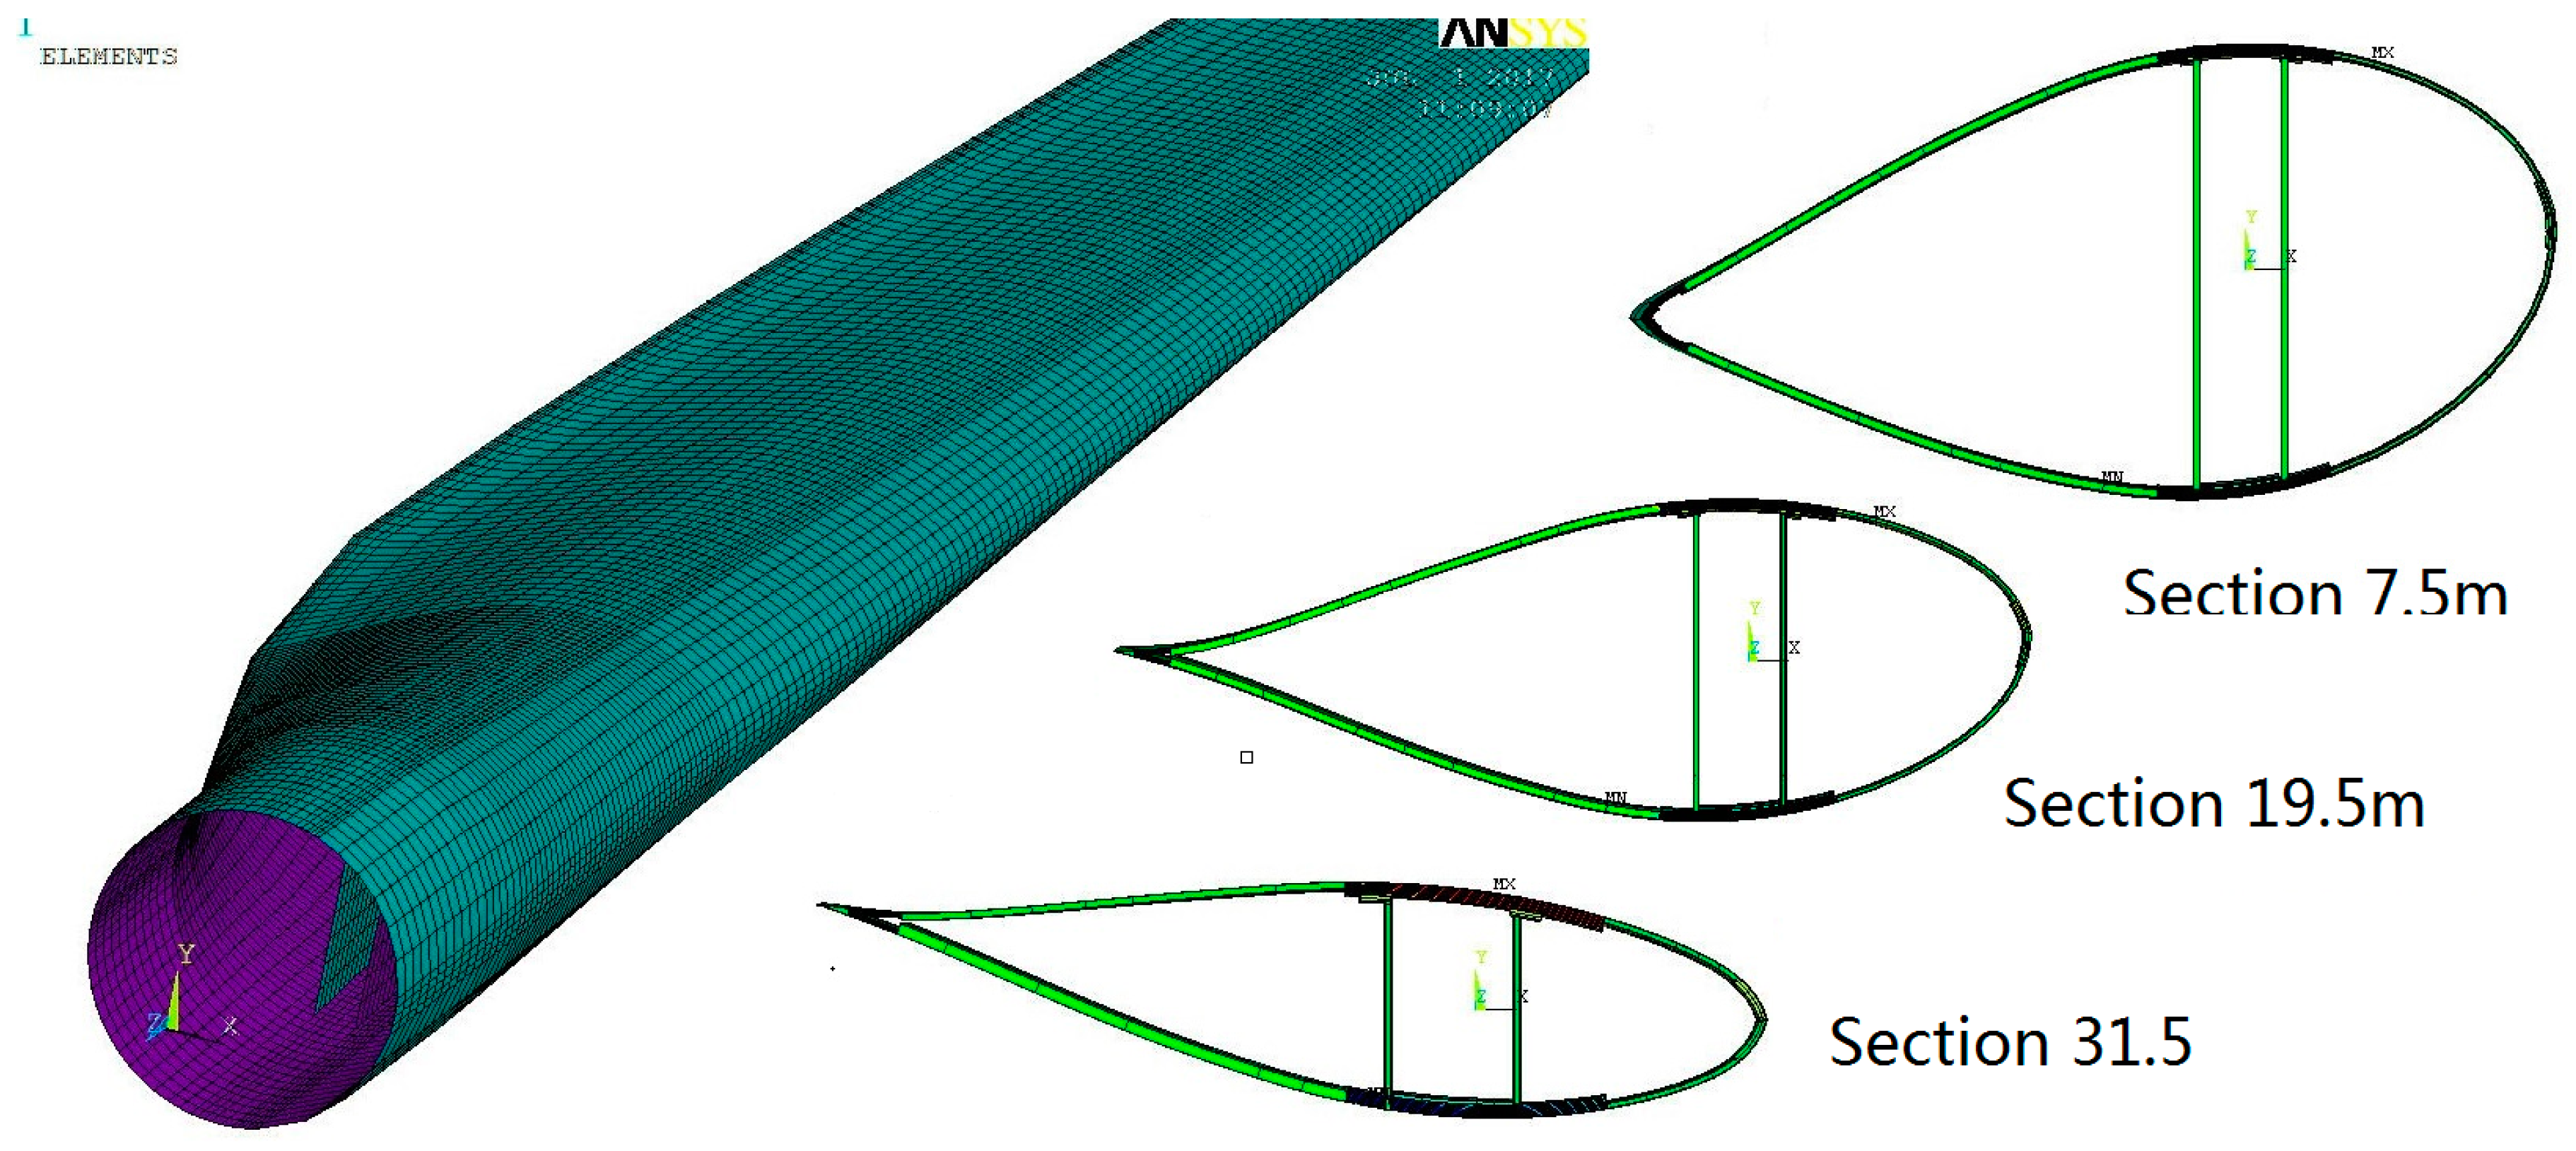
Figure 6.
Al 40.3 m structure distribution along the blade length. (a) Chord width and thickness distribution along blade length; (b) Blade mass and flapwise bending stiffness distribution along the blade length.
Figure 6.
Al 40.3 m structure distribution along the blade length. (a) Chord width and thickness distribution along blade length; (b) Blade mass and flapwise bending stiffness distribution along the blade length.
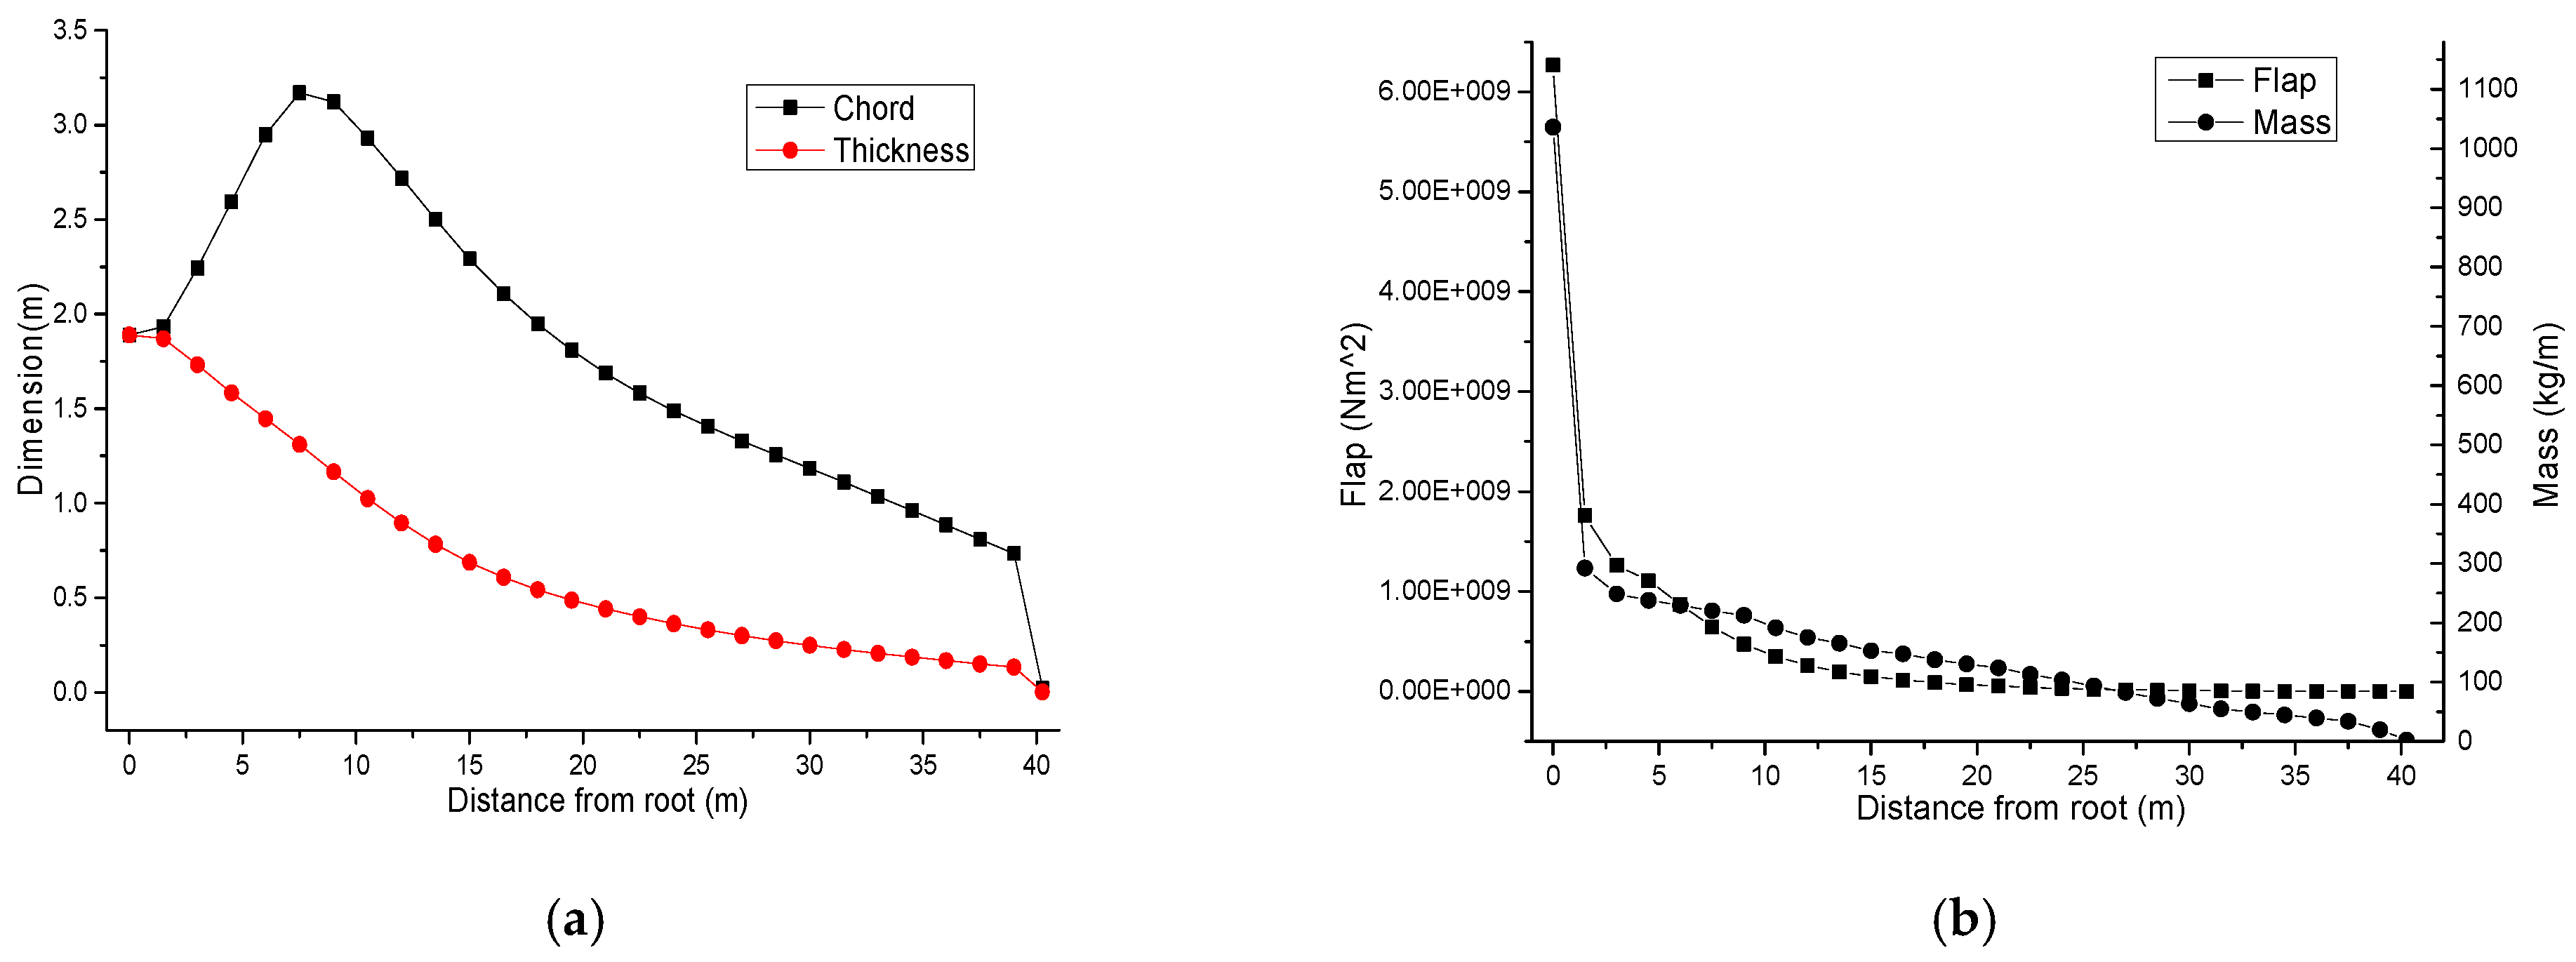
Figure 7.
The resonant Bode diagram. (a) Amplitude-frequency diagram; (b) Phase-frequency diagram.
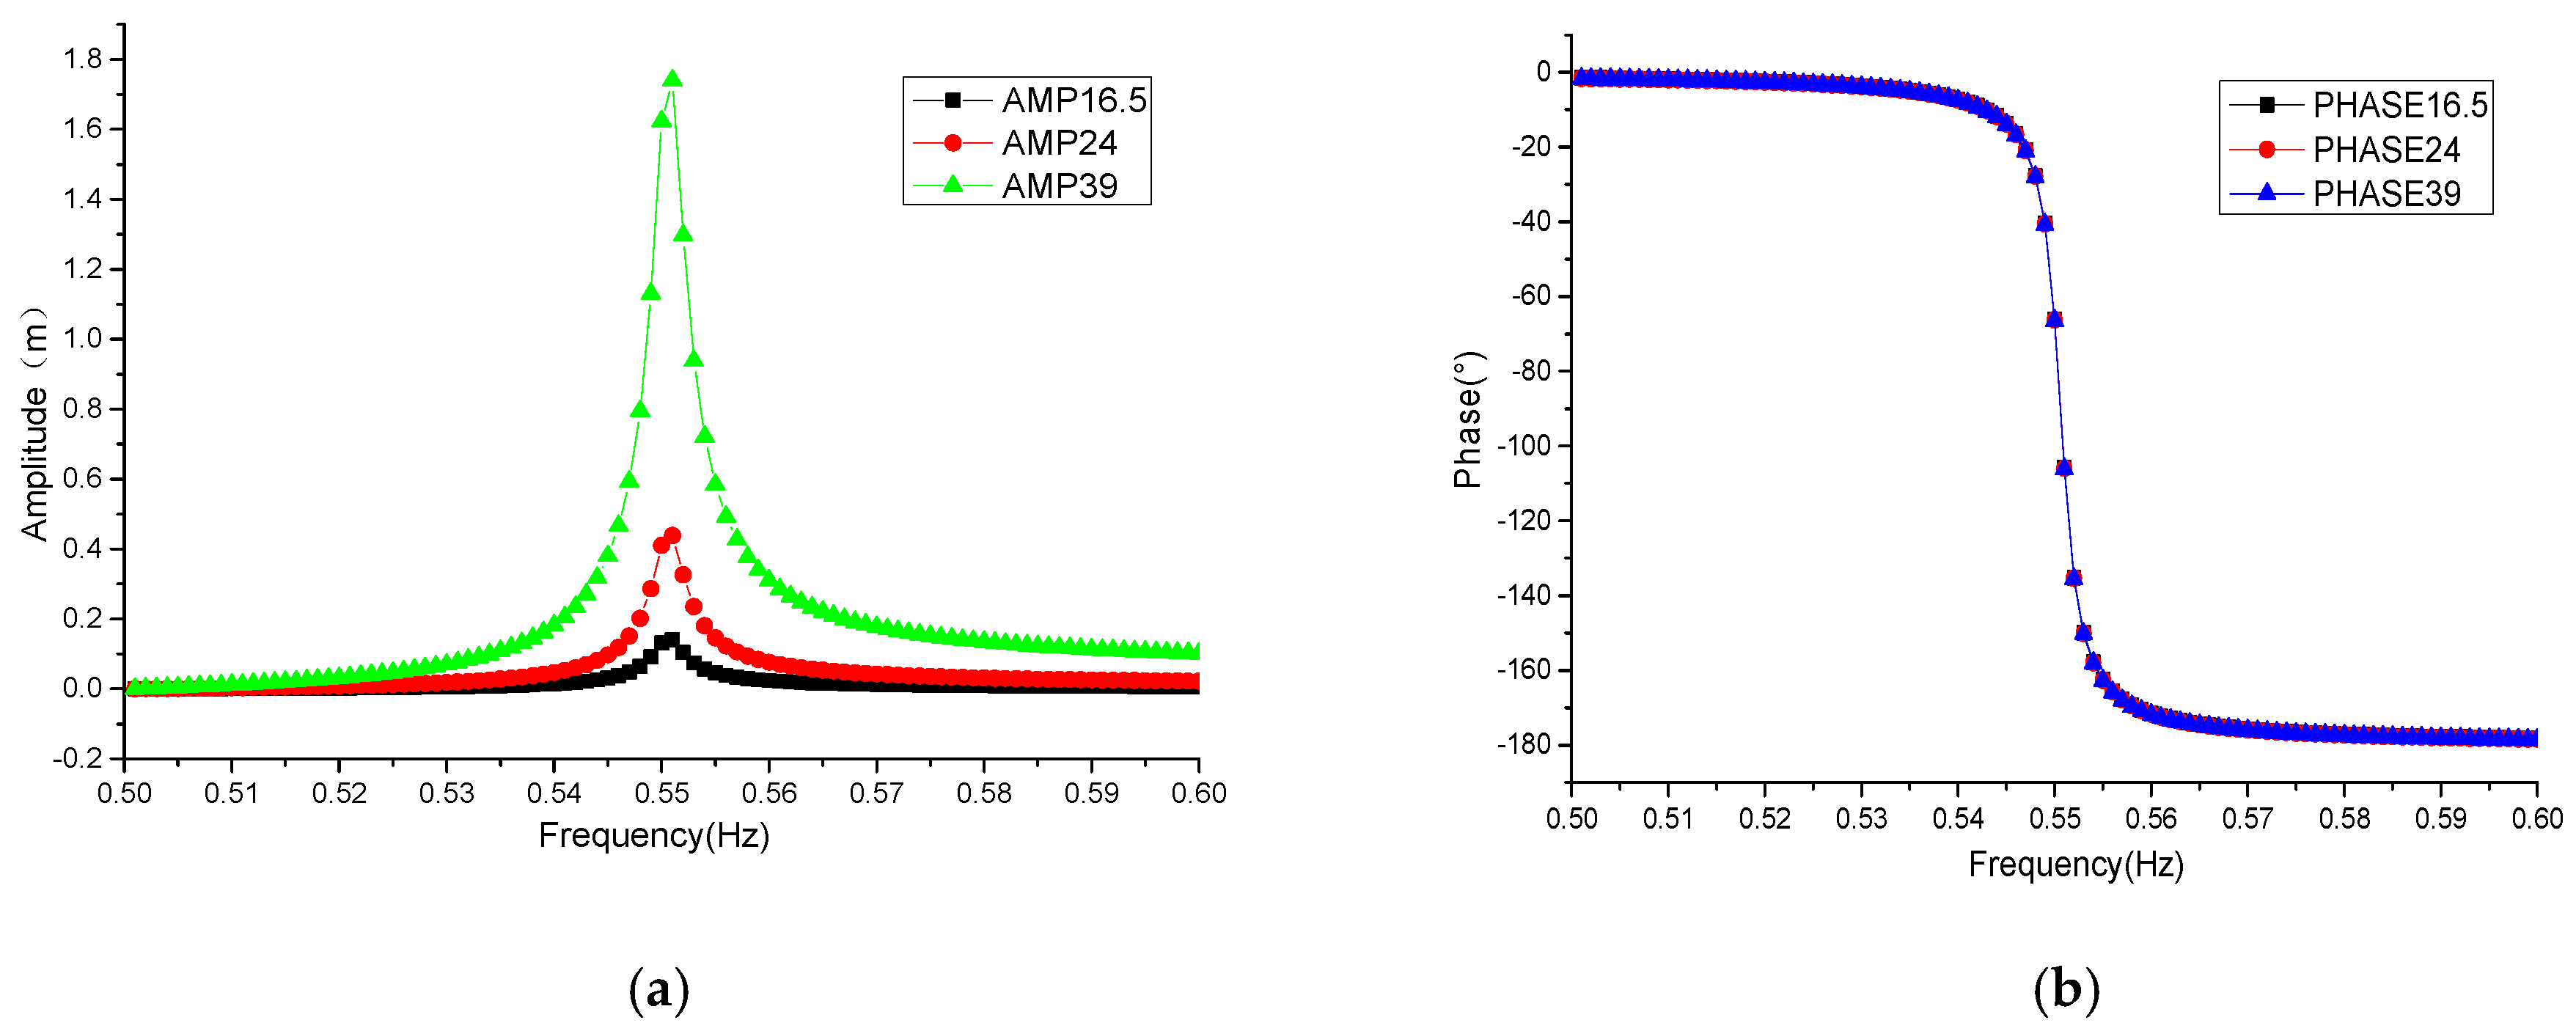
Figure 8.
The relationship between the phase difference of exciters and the amplitude of the blade. (a) Phase difference of exciters and amplitude of the blade; (b) Phase difference of exciters and amplitude change of the blade.
Figure 8.
The relationship between the phase difference of exciters and the amplitude of the blade. (a) Phase difference of exciters and amplitude of the blade; (b) Phase difference of exciters and amplitude change of the blade.
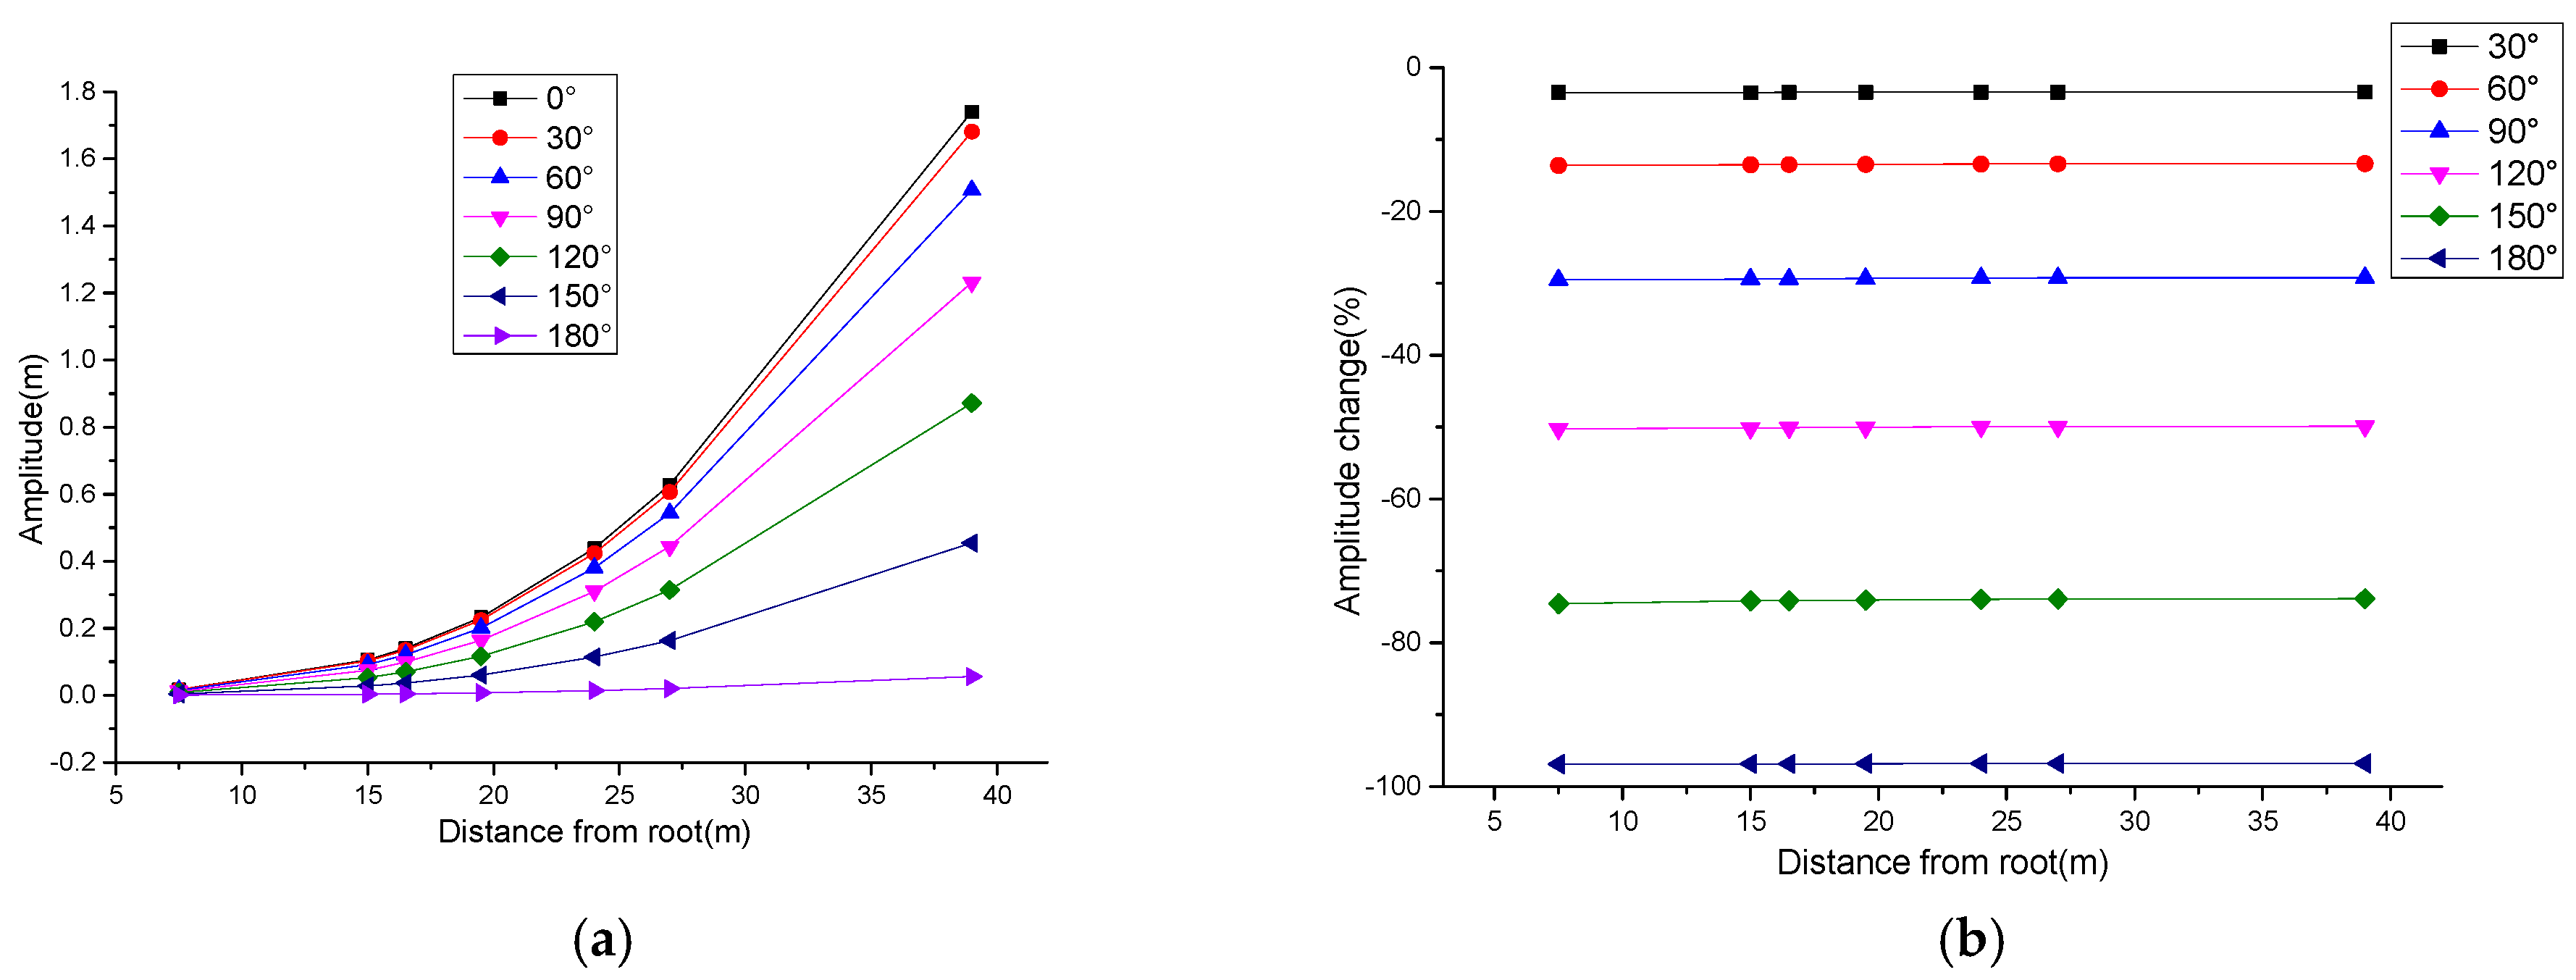
Figure 9.
The relationship between exciting forces, damping ratio, and amplitude. (a) Excitation force and amplitude; (b) Damping ratio and amplitude.
Figure 9.
The relationship between exciting forces, damping ratio, and amplitude. (a) Excitation force and amplitude; (b) Damping ratio and amplitude.

Figure 10.
Phase difference and bending moment distribution. (a) Bending moment distribution with phase difference; (b) Bending moment decrease with phase difference, compared with FEM results.
Figure 10.
Phase difference and bending moment distribution. (a) Bending moment distribution with phase difference; (b) Bending moment decrease with phase difference, compared with FEM results.
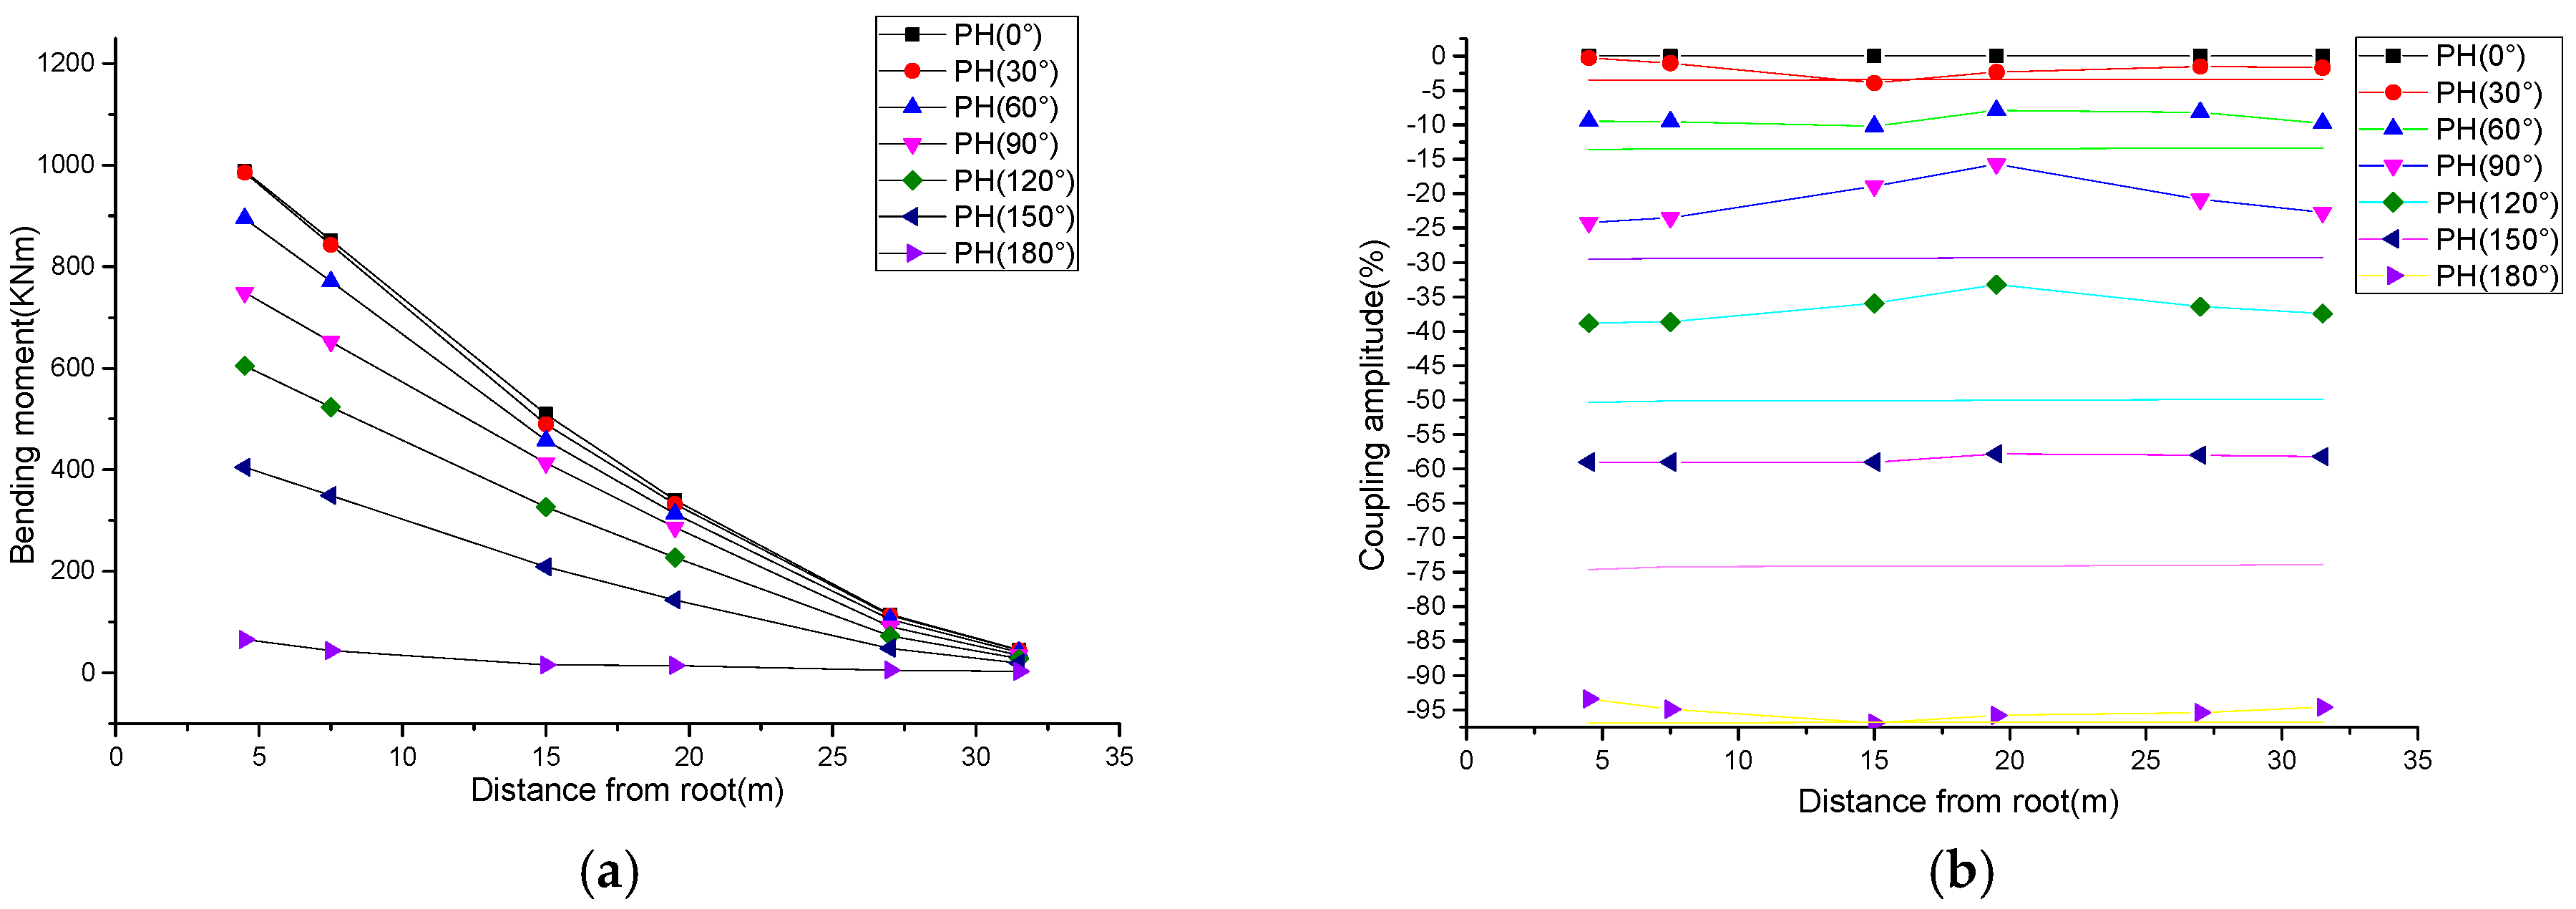
Figure 11.
Relationships between excitation forces, damping ratio, and moment amplitude along the blade. (a) Relationships between excitation forces and moment amplitude; (b) Relationships between the exciting forces at different positions with the amplitude of the blade; (c) Relationships between the damping ratio and moment amplitude.
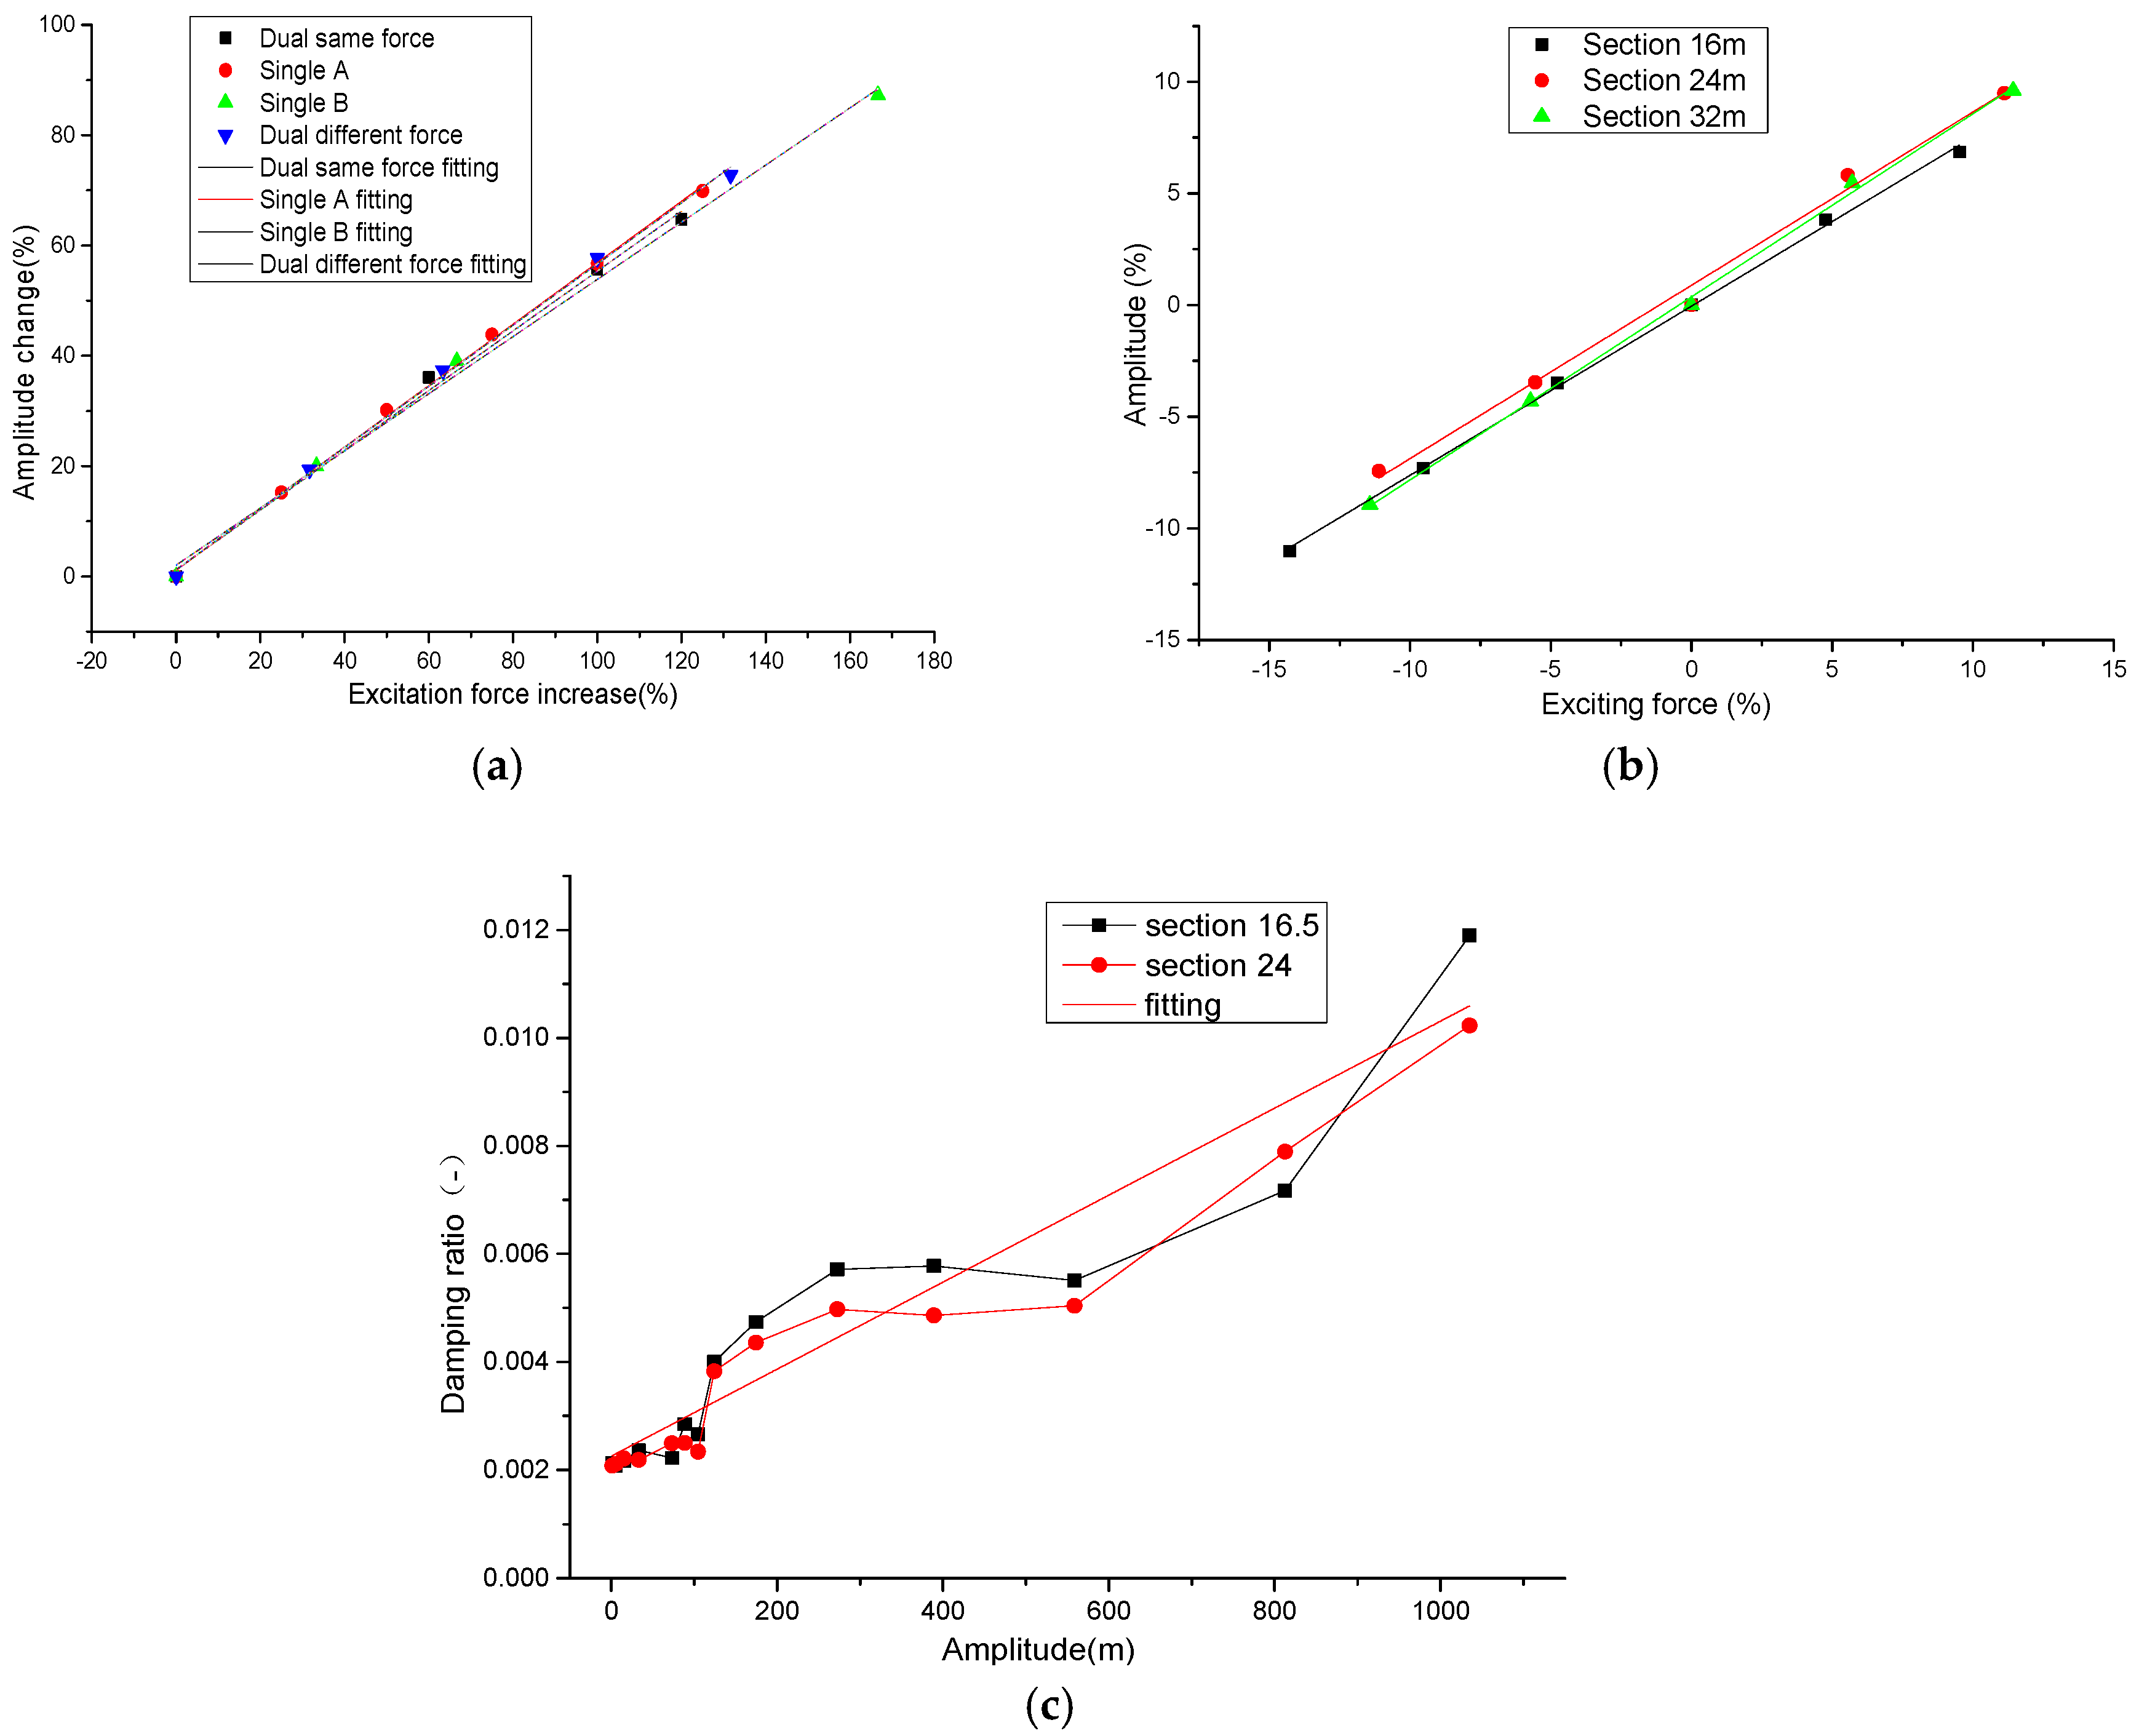
Figure 12.
Comparison of the strain value on the spar cap between FEM and measured results.

Figure 13.
Two million cycle bending moment distribution. (a) Two million cycle bending moment distribution of section 7.5 m; (b) Two million cycle bending moment distribution of section 19.5 m.
Figure 13.
Two million cycle bending moment distribution. (a) Two million cycle bending moment distribution of section 7.5 m; (b) Two million cycle bending moment distribution of section 19.5 m.
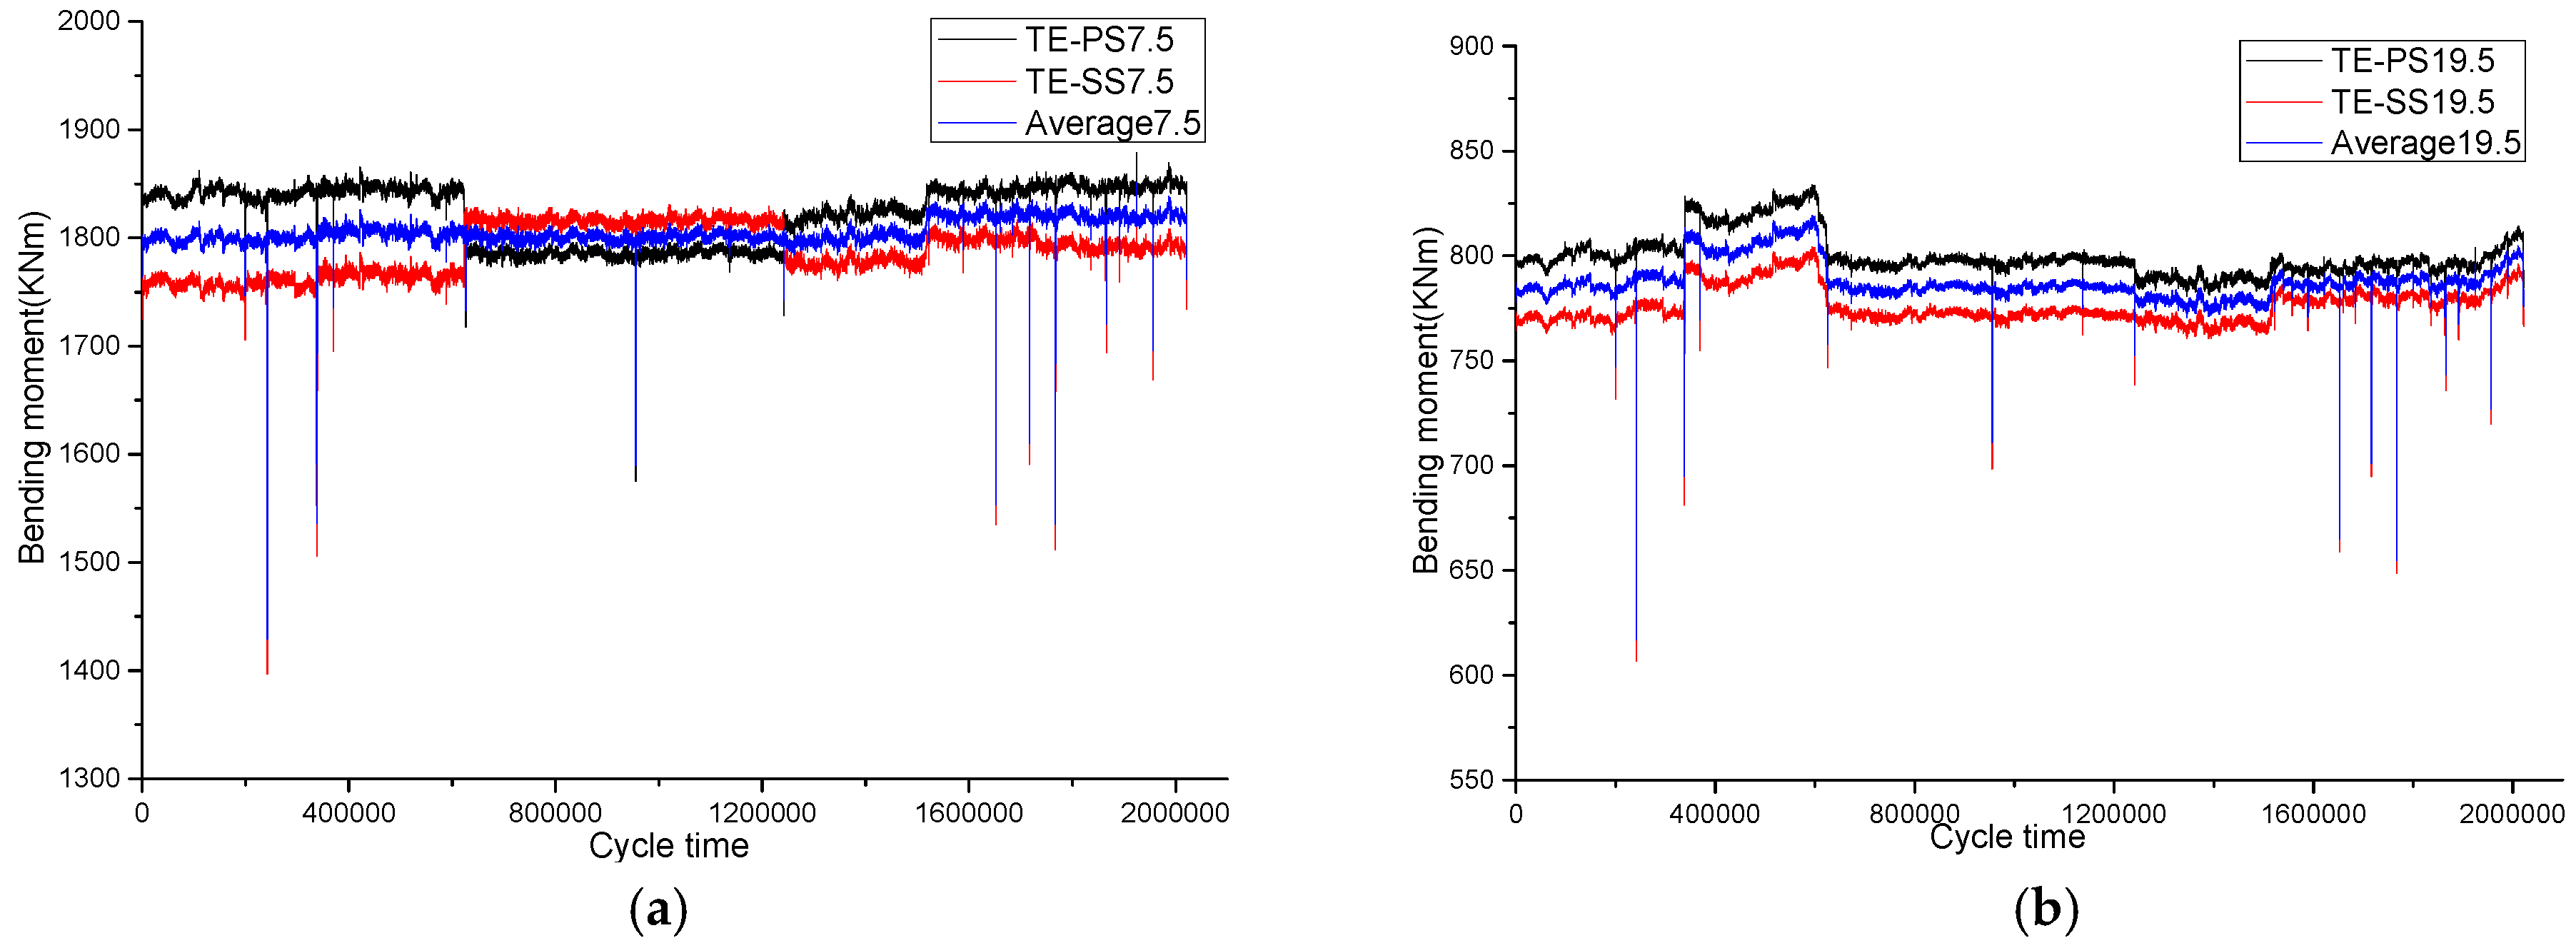
Figure 14.
Two million cycle frequency distribution of the bending moment. (a) Frequency distribution of the bending moment in section 7.5 m; (b) Frequency distribution of the bending moment in section 19.5 m.
Figure 14.
Two million cycle frequency distribution of the bending moment. (a) Frequency distribution of the bending moment in section 7.5 m; (b) Frequency distribution of the bending moment in section 19.5 m.

Figure 15.
Comparison of the spatial damage distribution against the target distribution for single-point excitation and multi-point excitation.
Figure 15.
Comparison of the spatial damage distribution against the target distribution for single-point excitation and multi-point excitation.


Table 1.
Al 40.3 m blade data.
| Blade Type | Al 40.3 |
|---|---|
| Turbine rated power | 1.5 MW |
| Blade length | 40.25 m |
| Bolt circle diameter | 1.8 m |
| Max chord | 3.183 m |
| Total twist | 16° |
| Pre-bend | 1.67 m |
| Blade mass | 5943 kg |
Table 2.
Experiment variables of single-point excitation and dual-point excitation.
| No. | Exciting Type | T-Mass m1 (kg) | T-Mass m2 (kg) | T-Mass m3 (kg) | T-Mass m4 (kg) | P1 (m) | P2 (m) | P3 (m) | P4 (m) | Frequency (Hz) | Phasediffer (°) |
|---|---|---|---|---|---|---|---|---|---|---|---|
| 1 | Single loading | 3080 | 1860 | 962 | 650 | 12 | 16.5 | 24 | 32 | 0.568 | ~ |
| 2 | Dual loading | ~ | 900 | 1300 | ~ | ~ | 16.5 | 24 | ~ | 0.616 | 3° |
Table 3.
Performance parameters of single- and dual-point excitation.
| No. | Excitation Type | Exciting Position (m) | Exciter Stroke (m) | Mass (kg) | Frequency (Hz) | Excitation Forces (N) | Amp (m) | Axis Forces (N) | Work per Period (J) | Energy Consume (KWh) |
|---|---|---|---|---|---|---|---|---|---|---|
| 1 | Single | 16.5 | 0.210 | 1800 | 0.563 | 4730 | 0.6 | 31,958 | 8916 | 4953 |
| 2 | Dual-A | 16.5 | 0.168 | 780 | 0.568 | 1669 | 0.6 | 13,834 | 3146 | 1748 |
| Dual-B | 24 | 0.053 | 780 | 0.568 | 527 | 1.3 | 20,569 | 2150 | 1195 |
© 2017 by the authors. Licensee MDPI, Basel, Switzerland. This article is an open access article distributed under the terms and conditions of the Creative Commons Attribution (CC BY) license (http://creativecommons.org/licenses/by/4.0/).
Share and Cite
MDPI and ACS Style
Pan, Z.; Wu, J. A Novel Multi-Point Excitation Fatigue Testing Method for Wind Turbine Rotor Blades. Energies 2017, 10, 1058. https://doi.org/10.3390/en10071058
AMA Style
Pan Z, Wu J. A Novel Multi-Point Excitation Fatigue Testing Method for Wind Turbine Rotor Blades. Energies. 2017; 10(7):1058. https://doi.org/10.3390/en10071058
Chicago/Turabian StylePan, Zujin, and Jianzhong Wu. 2017. "A Novel Multi-Point Excitation Fatigue Testing Method for Wind Turbine Rotor Blades" Energies 10, no. 7: 1058. https://doi.org/10.3390/en10071058
Note that from the first issue of 2016, this journal uses article numbers instead of page numbers. See further details here.