Thermal and Performance Analysis of a Gasification Boiler and Its Energy Efficiency Optimization
by
Jan Valíček
1,2,3,*, 
Zuzana Palková
1,
Marta Harničárová
2,3,
Milena Kušnerová
2,3 and
Ondrej Lukáč
1 1
Technical Faculty, Slovak University of Agriculture in Nitra, Tr. A. Hlinku 2, 949-76 Nitra, Slovakia
2
Faculty of Mining and Geology, Vysoká škola báňská—Technical University of Ostrava, 17. Listopadu 15, 708-33 Ostrava, Czech Republic
3
Regional Materials Science and Technology Centre, Vysoká škola báňská—Technical University of Ostrava, 17. Listopadu 15, 708-33 Ostrava, Czech Republic
*
Author to whom correspondence should be addressed.
Energies 2017, 10(7), 1066; https://doi.org/10.3390/en10071066
Submission received: 14 June 2017
/
Revised: 14 July 2017
/
Accepted: 20 July 2017
/
Published: 22 July 2017
(This article belongs to the Section L: Energy Sources)
Abstract
:The purpose of this study was to determine a method for multi-parametric output regulation of a gasification boiler especially designed for heating or for hot water heating in buildings. A new method of regulation is offered, namely more parametric regulation via proportional-integral-derivative (PID) controllers that are capable of controlling the calculated values of pressure, temperature and fan speed. These values of pressure, temperature and fan speed are calculated in a completely new way, and calculations of setpoints for determination of optimal parameters lead to an increase in boilers efficiency and power output. Results of measurements show that changes at the mouth of the stack draft due atmospheric influences occur in times with high intensity and high frequency, while power parameters, or boiler power output amplitudes and fan speed automatically “copy” those changes proportionally due to instantaneous fan speed changes. The proposed method of regulation of the gasification boiler power output according to the technical solution enables a simple, cheap, express and continuous maintenance of high power output at low concentrations of the exhaust gases of the gasification boilers from the viewpoint of the boiler user, as well as from the perspective of development and production it allows a continuous control monitoring of these parameters.
1. Introduction
Fossil fuels, coal and gas are key contributors to global warming. One way to control climate change is to reduce the consumption of fossil fuels. Biomass is organic material made from plants and organisms. Biomass energy is the only energy source that is completely CO2 neutral. The most common form of biomass is wood. Different processes exist that allow the transformation of biomass into desirable energy [1,2].
The European market for biomass boilers has grown rapidly in recent years [3]. Gasification boilers are designed exclusively for the combustion of wood, mostly for a heat output from 10 to 100 kW. The fuel can be the dry wood of any kind, logs up to a maximum length of 500 mm are particularly suitable, as well as wood waste in the form of sawdust or shavings, but always in combination with pieces of wood. Moist wood can also be used, but at a cost of increased fuel consumption. The time and physical effort of the user exerted during cutting and shaping the wood are significantly saved by the use of a boiler feed chamber. The ash in these types of boilers represents only approx. 1% to 2% of the amount of fuel supplied, and cleaning is required only once or twice a week. If these boilers are operated correctly, they produce low amounts of pollutants and their operation is a valuable asset, especially for the environment [3,4,5]. The reason is that their combustion uses the principle of generator-based gasification of wood (at a temperature of approximately 1100 °C). Such a combustion system is more economical than conventional boiler systems and it achieves fuel savings of even up to 40%. Combustion of wood gas is supported by a fan that feeds combustion primary air into the upper hearth, while the secondary air is fed through the nozzle to the lower hearth. Air flow rate and draft in the stack depend on the fan speed, which can be smoothly controlled by the frequency converter. Thermodynamic, power and oxygenation perfection of combustion depends strongly on the parameters of the exhaust of fumes through the stack. The stack draft changes very rapidly, depending on the changes in atmospheric pressure, temperature and humidity of the atmospheric air, as well as on the intensity and direction of the wind. Results of measurements show that these changes take place in time with high intensity and high frequency, with performance parameters, or amplitudes of the boiler output and fan speed automatically “copy” these changes proportionally as a result of momentary speed changes. Regulation fan speed is, according to the authors’ new solution, an instantaneous function of the flue gas temperature, draft and pressure of flue gases in the stack exhaust, including the associated oxygen balance of combustion. From this point of view, a sufficiently powerful balancing fan can be considered as a very important structural element. However, the direct functional link between the momentary fan output and some important technological parameter (stack exhaust, instantaneous boiler output, flue gas pressure or flue gas temperature in the stack throat) is currently not ensured by design. So far, even the mutual functional relationships between the technological and thermodynamic parameters of the system have not yet been sufficiently investigated. Therefore, the balancing (regulating) function of the fan is not yet sufficiently ensured, and consequently too low or too high stack draft can occur when the fan speed is set inadequately. Incorrect stack draft has a negative impact on the combustion parameters, as well as on the thermodynamic equilibrium parameters of the system. At present, determination of the performance and concentration of the emission products of gasification boilers is performed only in specialized testing facilities upon the request of manufacturers or users. Such measurements, however, require the use of special measuring instruments and means, is time-consuming, labour-intensive and costly. Within the operation of gasification boilers, users so far prefer dual-mode automatic and/or manual control. Two thermostats are installed in the boilers, i.e. an indoor thermostat for monitoring the hot water outlet temperature of the boiler and an external thermostat for monitoring the temperature in the heated room. Regulation is performed with the use of an internal sensor of the boiler temperature when the outlet water temperature reaches 90 °C and/or when setting the specified room temperature (by switching off the fan ensuring air supply to the hearth or by switching to the external circuit of the gasification boiler). Various types of digital lines are used for transfer of temperature parameters between the boiler and the controller, such as boiler controller with built-in “On/Off” equithermal regulation or a more modern “OpenTherm” type of control. The “On/Off” type of regulation determines, under what circumstances and for what desired indoor temperature the boiler should ensure heating, i.e., in other words: in principle, using this regulation it is possible to achieve an automatic heating of rooms in dependence on the outside temperature. The “OpenTherm” type of control determines the minimum required output of the given boiler necessary at a given time, with the controller being always superior to the installed automatic regulation of the boiler. The state-of-the-art wireless digital temperature regulators are not yet used in practice. The “OpenTherm” type of control regulates the water pump output only indirectly through the boiler automatic regulation system, the controller determines only the required output temperature. The outdoor sensor is only recommended and it is connected to the boiler automatic regulation system via the so-called “Opentherm Plus” line. The controller receives the outdoor temperature data indirectly through the boiler. The operation of the boilers without an external temperature sensor is theoretically and practically possible, but it is economically very disadvantageous from the user’s point of view (compared to the use of an external sensor). The boiler normally operates in a set mode, in which the output temperature in the building changes according to the user’s requirements. The regulator recalculates the current minimum amount of heat required so that the boiler operates according to the possibilities in a “one start” mode all day, but this is an ideal situation, which is not guaranteed under all circumstances. A correctly configured control, therefore, does not switch off the boiler “according to the proportional-integral-derivative (PID) algorithms”, but it switches off the boiler because a need for heat off-take is lower than required for the minimum boiler output. The boiler in such case cannot reach the desired, already very relatively low output temperature, so it must be shut down and it is necessary to wait for cooling of the reverse before its new restart [2]. The way how the boiler will behave in a particular building, depends on many factors (heat losses, sizes of radiators, etc.). For trouble-free operation of the boiler it is always useful not to over-size it. The low bottom boiler power output is more important than its power reserve upwards. The smoother the boiler operation is over time, the greater the fuel savings are. The majority of the currently used gasification boilers do not operate on the principle of “On/Off” or “OpenTherm” type of regulation. If it is not possible to obtain a feedback report about the outside temperature, then the regulation is imperfect and incomplete, meaning it is insufficiently comfortable and economical. Such regulation causes an incomplete combustion and low efficiency of the boiler, as well potentially exceeding of the permissible emissions of the flue gases and, of course, it does not ensure the desired permanent thermodynamic equilibrium of the combustion system. The method of automatic control of combustion in the furnace and a system for realization of this method is also known, according to a patented process [6], which concerns reduction of the defined concentration of carbon oxide in the waste gases. Then, the defined free oxygen concentration increases, while after a decrease of the carbon oxides concentration the defined concentration of free oxygen is again reduced. The system includes a programming device with a program for a change of the defined free oxygen concentration in the waste gases depending on the carbon dioxide concentration ratio. This method is, however, for gas boilers up to 100 kW, technically demanding, costly and therefore unusable by common users [7,8,9].
2. Materials and Methods
The object of the power, emission and safety operation tests was the MA 23 later is called MAGA 23—be consistent hot-water boiler for gasification of wood pieces with a nominal heat output of 23 kW. The conditions of the boiler and its equipment were tested in accordance with the supplied standard technical documentation. During the tests, the effect of conditions of the fuel combustion on the production of emissions, resistance to thermal overloading of the boiler and the surplus heat exchanger was experimentally verified. Pine wood with a moisture content of 10% and a calorific value of 15.266 MJ∙kg−1 was used as a test fuel.
Method of Measurement, Measuring Devices
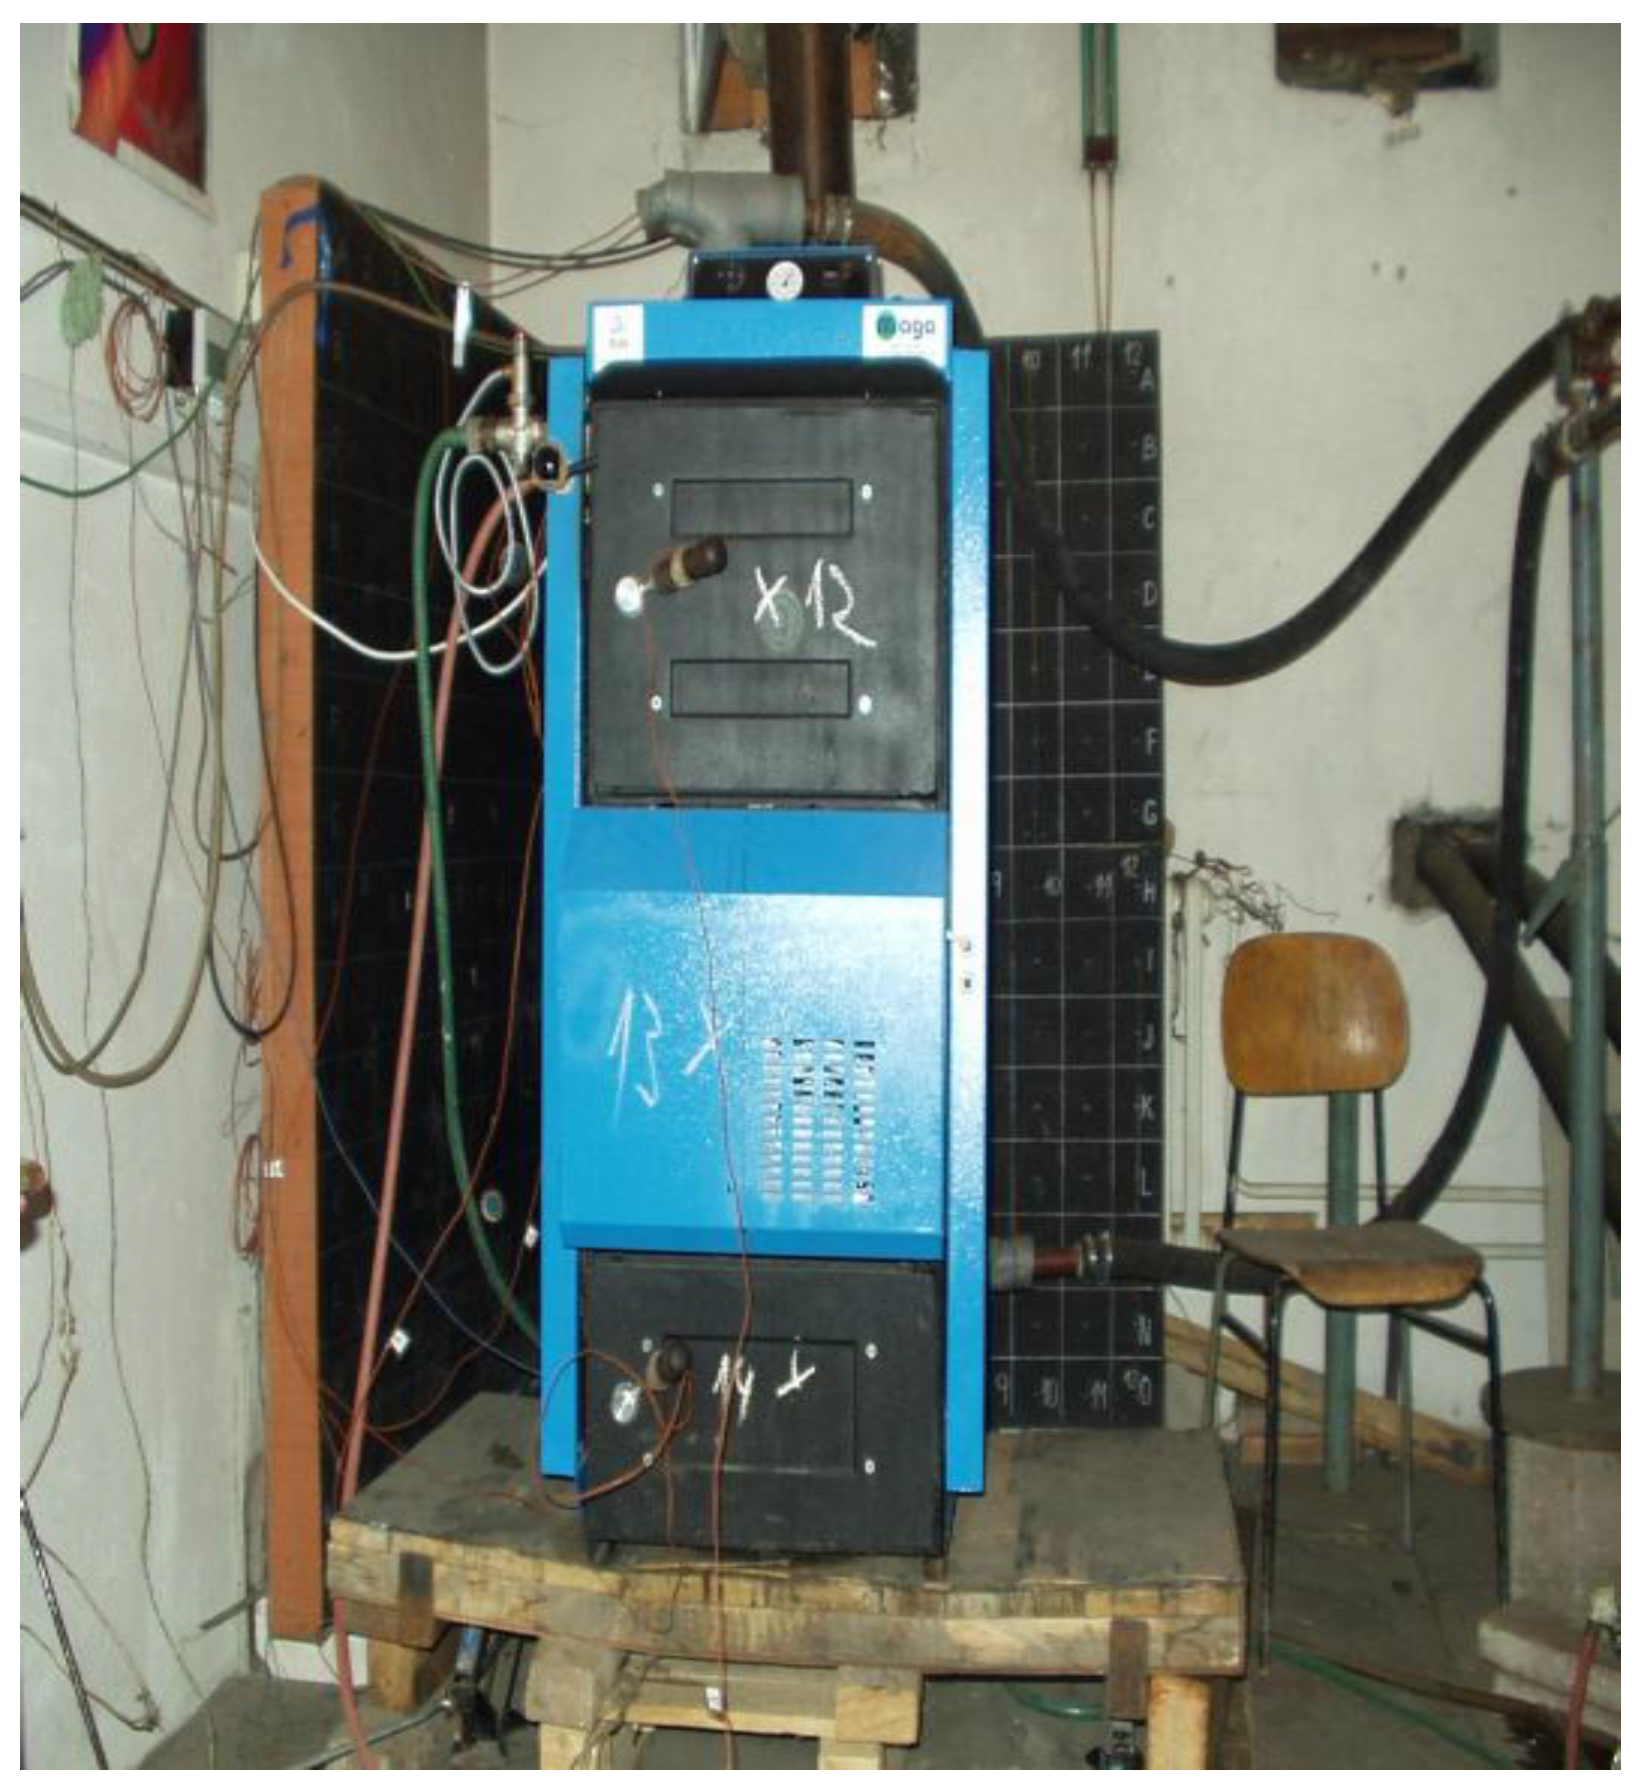
The air temperature in the test room, and hence the intake air drawn into the combustion chamber (Figure 1), was between 15 and 30 °C. The exhaust pipe of a hot-water boiler with diameter of 150 mm was connected to a flue gas measuring section and it was connected to a stack with a diameter of 300 mm and a height of 6 m. When determining the heat output, boiler efficiency, combustion time, combustion gas components and exhaust gas temperature, the boiler was operated at thermal output within its power range. All tests of hot water boilers were performed at the Department of Energy Technology of the Faculty of Mechanical Engineering of Žilina University in Slovakia. This working site has the necessary testing and modern instrumentation. The thermal efficiency of the tested hot water boiler was evaluated by a direct method. Fuel mass flow was measured with a digital scale (Janiš & Granit Ltd., Žilina, Slovakia) with a range from 0 to 500 kg and a deviation of 10 g, the measured boiler stood on it. The flow of the heated water was measured with a nominal diameter (DN) 25 ultrasonic flow meter (300 impulses per litre, Kamstrup, Prague, Czech Republic) with a temperature range from 0 to 130 °C and a nominal flow rate of 5 m3·h−1. The hot water boiler testing of consisted of tests of the nominal and minimum heat output and a test of safe operation of the combustion equipment, which verified the boiler resistance against thermal overload. The evaluation parameters of the test included the determination of efficiency, the conversion of emissions and the functional test on the waste heat exchanger of the hot-water boiler. Combustion in the boilers must ensure low emissivity, even with a minimum heat output that may not be less than 30% of the nominal thermal output.
The tested hot water boiler was put on the scale in order to measure fuel consumption. The flue outlet was connected to an insulated flue gas meter with flue gas measuring points (stack temperature), stack draught, flue gas composition (carbon dioxide, oxygen, carbon monoxide, nitric oxide and also NOx), and solid unburned particle samples collection. In order to ensure a constant stack draught, a flue gas exhaust fan was located in the exhaust, and its speed was controlled by the frequency converter. The flue gas temperature was measured by the temperature sensor located inside the flue gas probe. This probe had three sampling openings, one hole being located in the centre of the flue gas ducting. The other two openings were located at one quarter of the diameter of the distance of the flue pipe diameter from the edge of the wall of the measured flue gas section. The flue gas composition was measured by a flue gas analyser (PHOTON, Skedsmokorset, Norway) which evaluated the concentrations of carbon monoxide (CO), carbon dioxide (CO2), nitric oxide (NO), sulphur dioxide (SO2) by the non-dispersive infrared radiation (NDIR) technique. Evaluation of the concentrations of oxygen (O2) and nitrogen dioxide (NO2) was performed by an electrochemical sensor. The measured concentrations were recalculated to normal state conditions (pressure of 101,325 Pa, temperature of 273.15 K) and to the reference oxygen content (for biomass burning boilers it was 11%). The mean value of the volume parts of emissions (ppm) was converted to mass units (mg·m−3) according to the conversion commonly used in technical practice for acceleration of measurement. Measurement of solids was performed using an Isostack Basic-type apparatus. The content of solids in the flue gas was measured and evaluated by a gravimetric method. This method is based on the difference in mass of the solid residues that are trapped on the filter before and after sampling.
At present, only dual-mode control of boilers exists, i.e., the controller switches the boiler on/off. A temperature sensor is built-in inside the boiler, which, when the temperature reaches 90 °C, gives an impulse to the controller to switch to the external circuit or to switch off the fan. The boilers have two thermostats, one inside the boiler and the other outside the boiler (in the room). A new method of regulation is offered, namely more parametric regulation via PID controllers that are capable of controlling the calculated values of pressure, temperature and fan speed. These values of pressure, temperature and fan speed are calculated in a completely new way, and calculations of setpoints for determination of optimal parameters lead to an increase in boilers efficiency and power output. Specific requirements concerning the speed of PID controllers are not given, as this is a relatively slow regulation process. A regulation block is given, where the setpoint values “w” are calculated for temperature, pressure and fan speed on the basis of a proprietary algorithm, and for PID controllers for each variable (for temperature, pressure and fan speed). The input to the PID controller is the control deviation e = w − y, on the basis of which the PID controller calculates how the actuator must adjust the values for each variable. The PID controller output then comprises temperature, pressure and fan speed. The measured values of pressure, temperature and fan speed y are fed back to the controller, where new setpoints are again determined on the basis of the current output values. Equations of time functions (Table 1) are contained in the computer or micro-computer software. Graphic visualization of the evolution of functions for individual parameters is shown in Figure 2, Figure 3, Figure 4 and Figure 5. Derivation of the relation equations was made according to the temperature changes of the lower door handle temperature Tdvsp (°C), see the schematic photo in Figure 1. Derivation of other relation equations (Table 2) and (Table 3) was made according to the values of temperature change in the stack outlet tk (°C) see the schematic photo in Figure 1.
3. Working Methodology
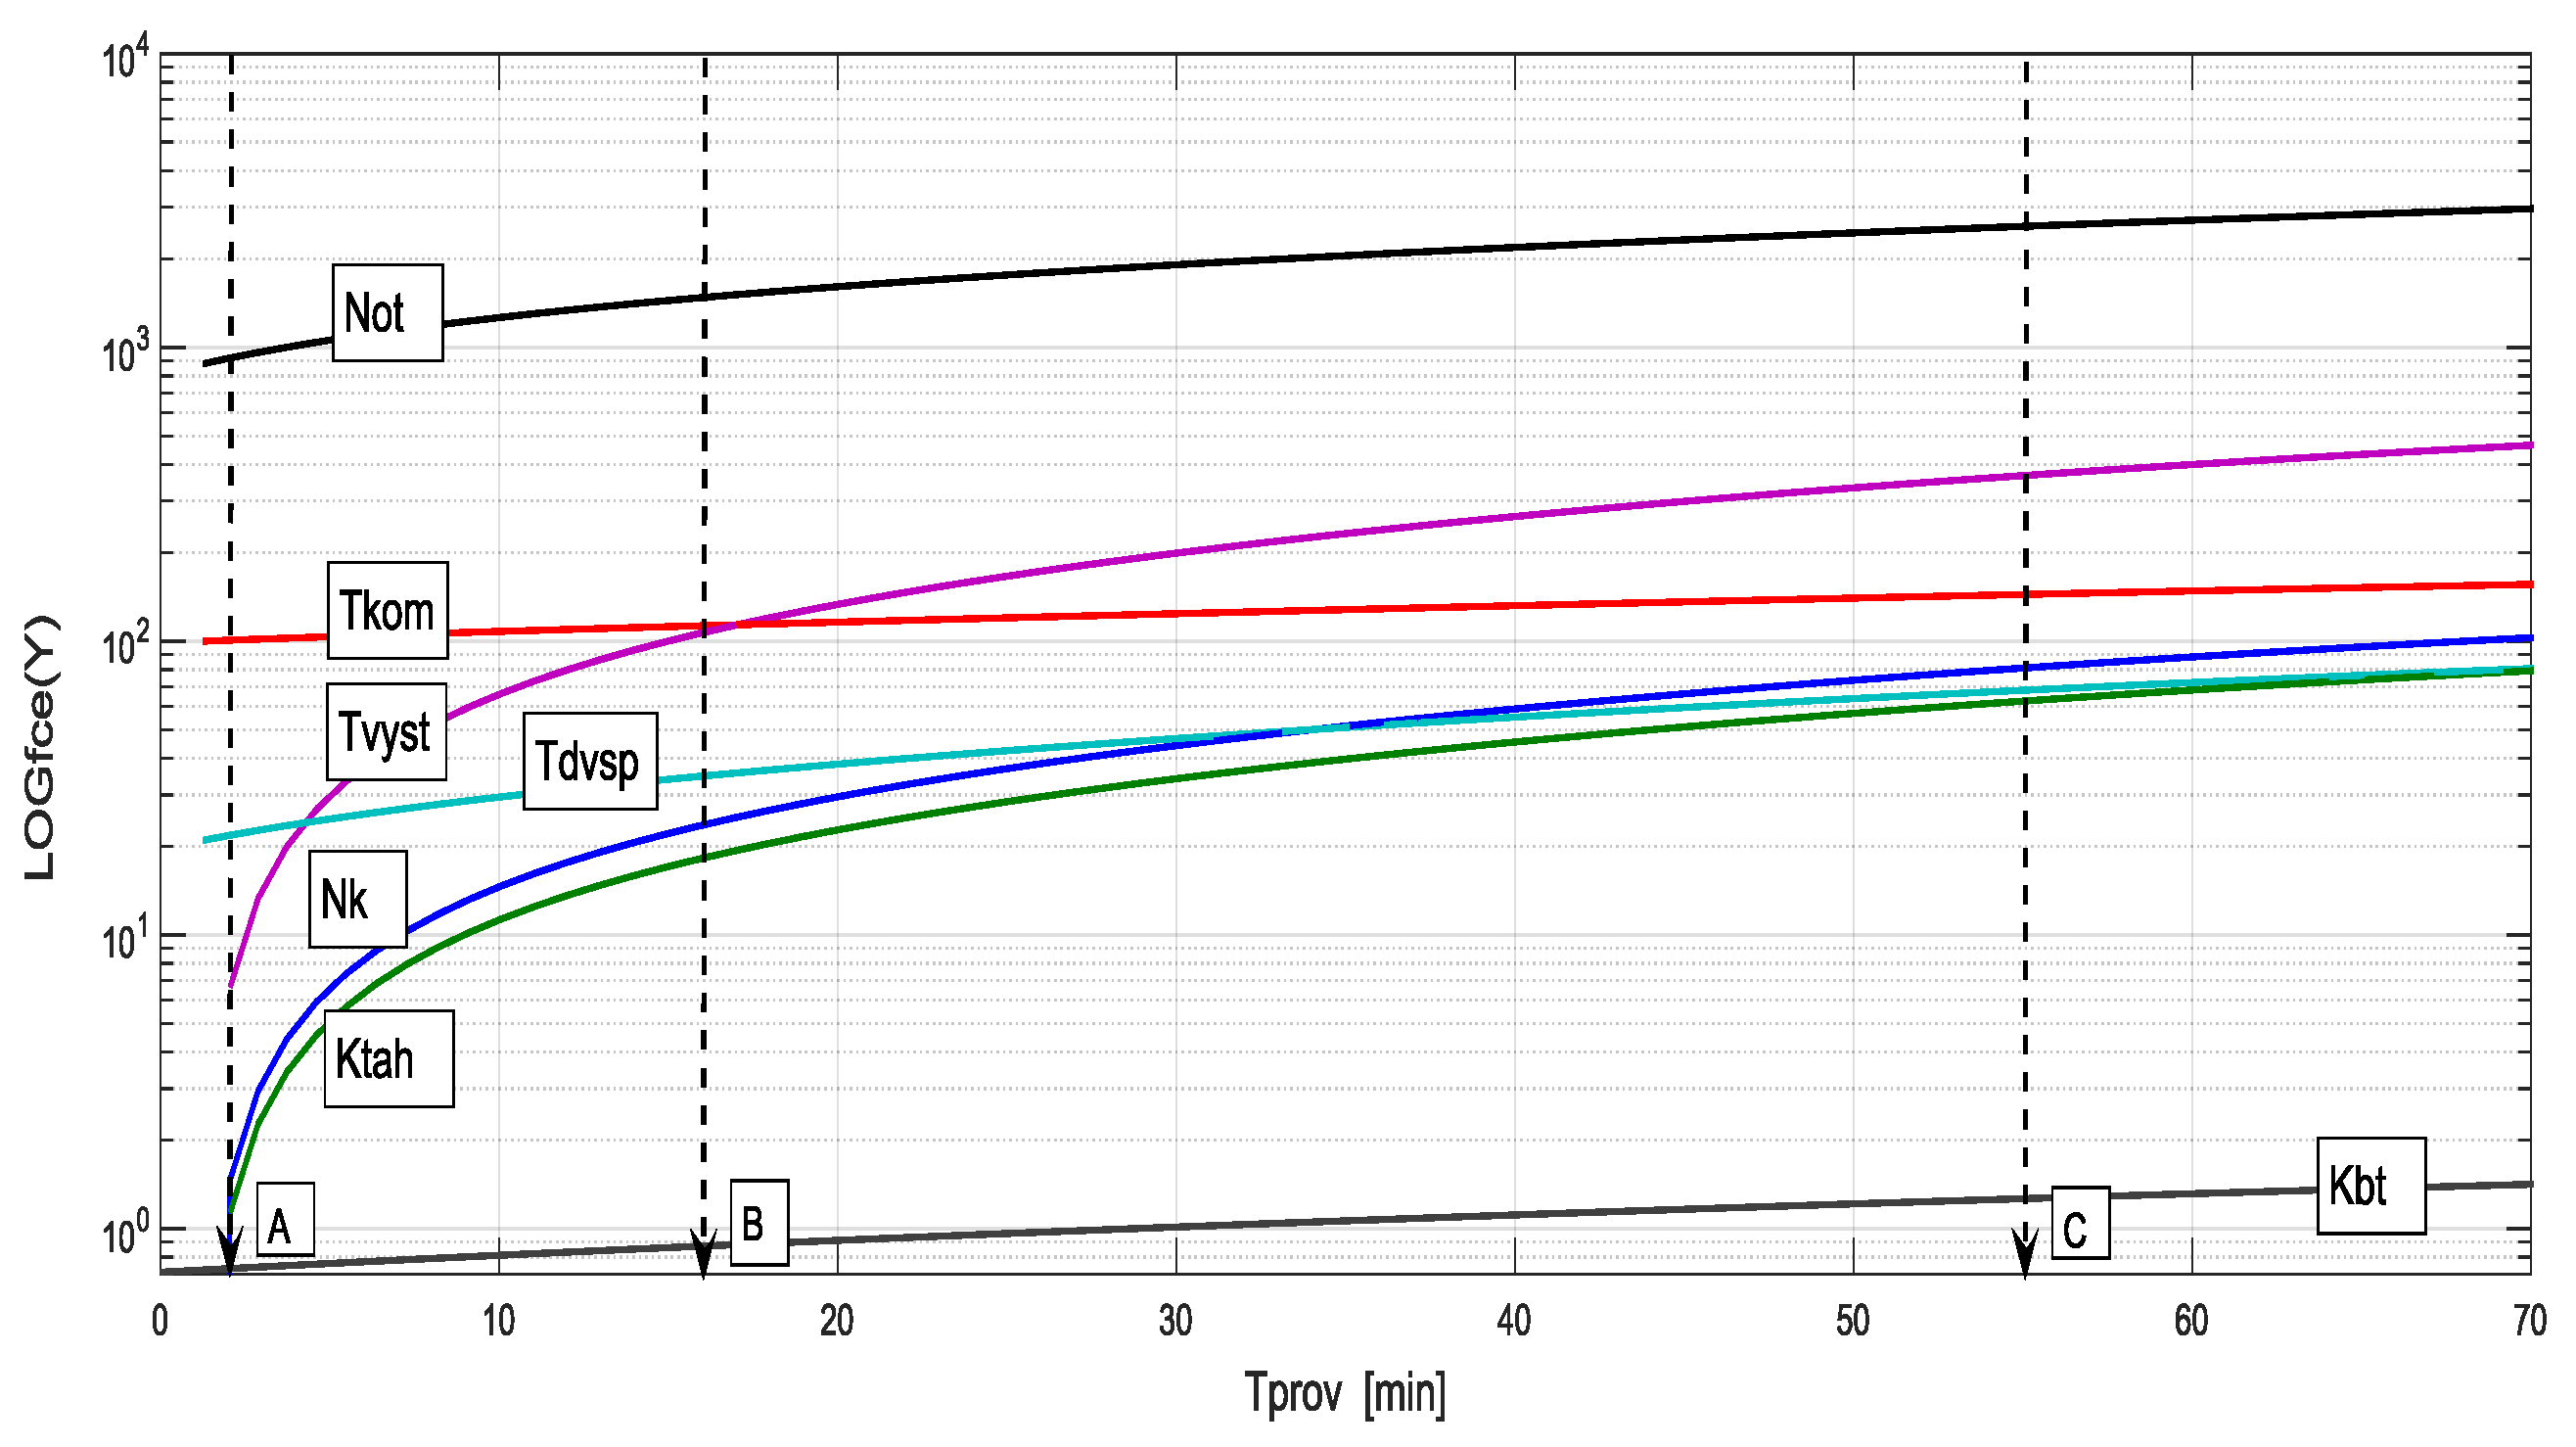
Relations of the main regulation parameters of the boilers with power output up to 100 kW with fan speed control Not (rpm) including time evolution of the control and controlled functions are illustrated graphically in Figure 6, Figure 7 and Figure 8. Numerical values of the regulation differences and the regulation speed can be read from the diagrams. This is a demonstration of a model solution of regulation of boilers between the operating states A-B (smaller control range) and B-C (distinct control. Vertical sections, for example in A-B-C positions, as shown in Figure 6, serve for deeper analyses of the combustion process. They are used for reading the values of discrete parameters. The graphical form does not provide sufficient confidence of reading off the values. For this purpose, it is possible to use progressive relation equations [6,7,8,9] for accurate calculation of discrete values. For example for the boiler output in dependence on duration of the operating time according to the Equation (1) the following is valid:
- Continuously: Nk = 1.10667 × 10⁻⁹ + 1.47164 × Tprov (kW),
- Discreetly: NkABC = 1.10667 × 10⁻⁹ + 1.47164 × TprovABC (kW),
- Then for: TprovA = 2 min, NkA = 2.94 kW, TprovB = 16 min, NkB = 23.55 kW,
- TprovC = 55 min, NkC = 80.96 kW.
If the designer or the user needs to determine the speed of parameter changes, e.g., for comparison of different types of boilers, then the discrete value of the selected parameter must be divided by the time Tprov.
4. Relationship Derivation
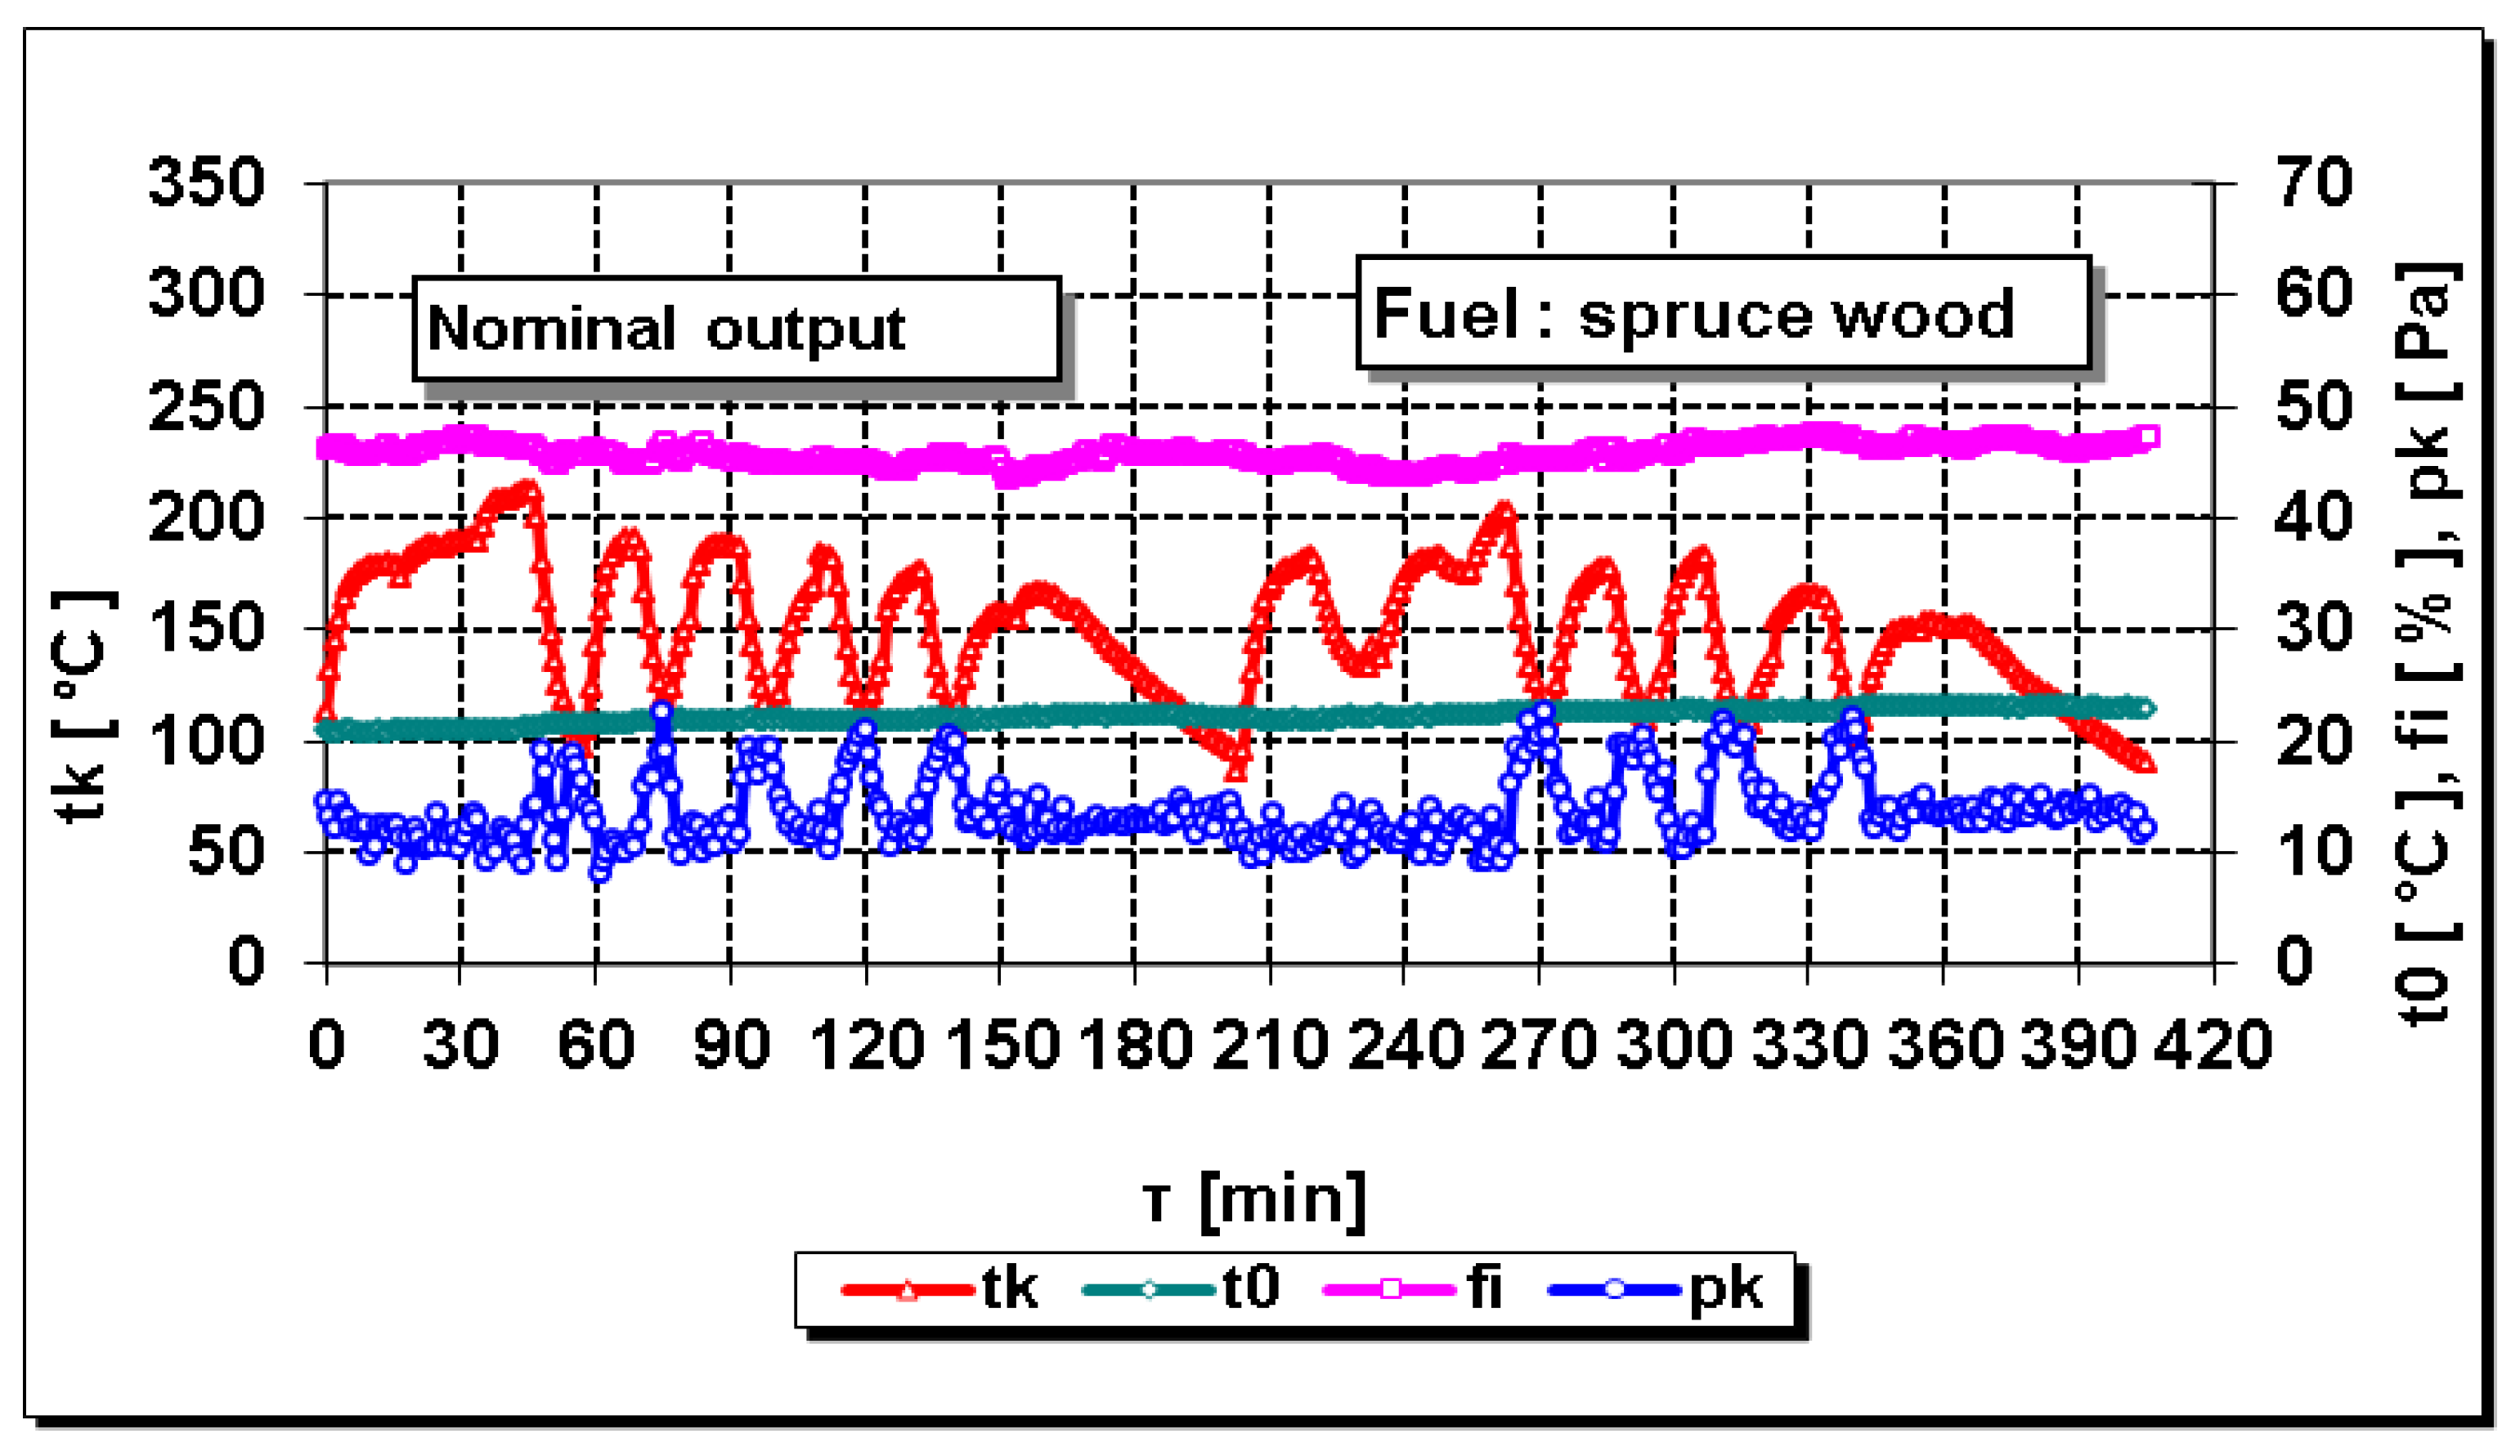
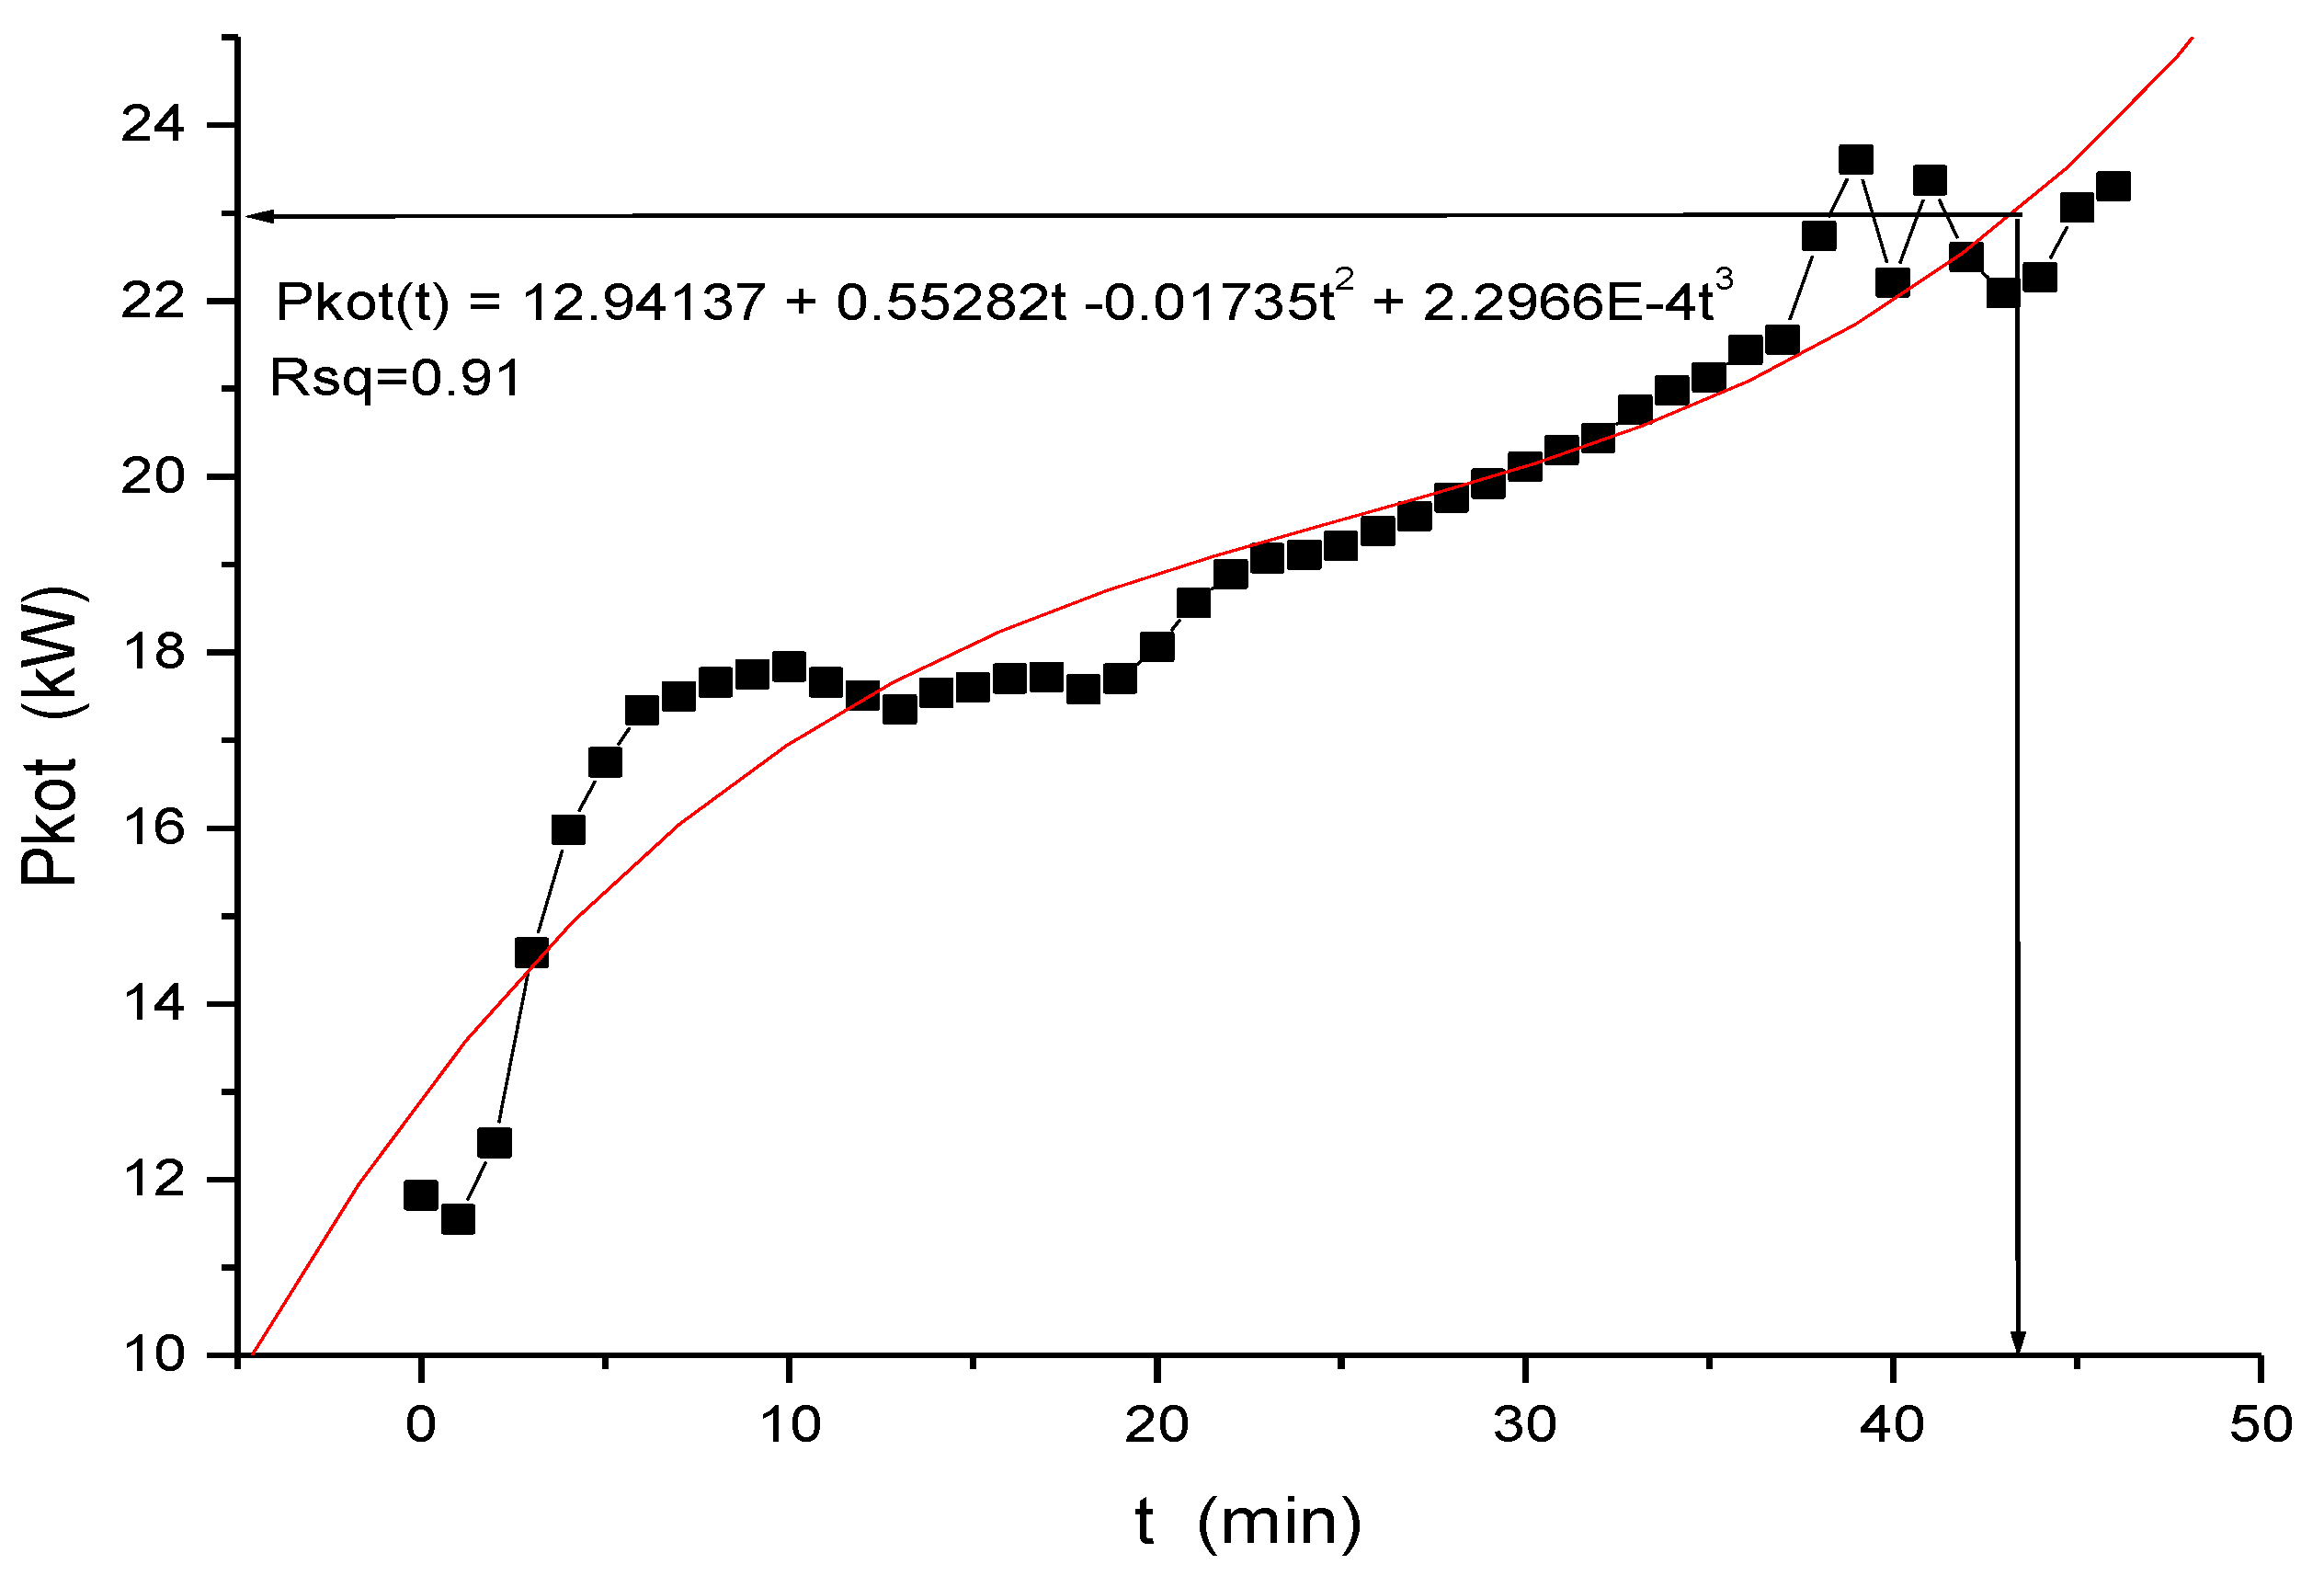
On the basis of the analysis of the measured data, including the use of Fast Fourier transform (FFT) frequency analysis, a good correlation to the operating time τ (min) was found. The τ was also considered as an independent variable. Other measured parameters were considered as dependent variables. In the total time range τ = 0–405 min, the sections of boost of the boiler output Pkot (kW) were recorded, as well as the dependent parameters from the ignition of the fuel till reaching of the nominal output. In the case of the MAGA 23 boiler, the nominal output Pkot = 23 kW. This was achieved at τ = 45 min (Figure 9).
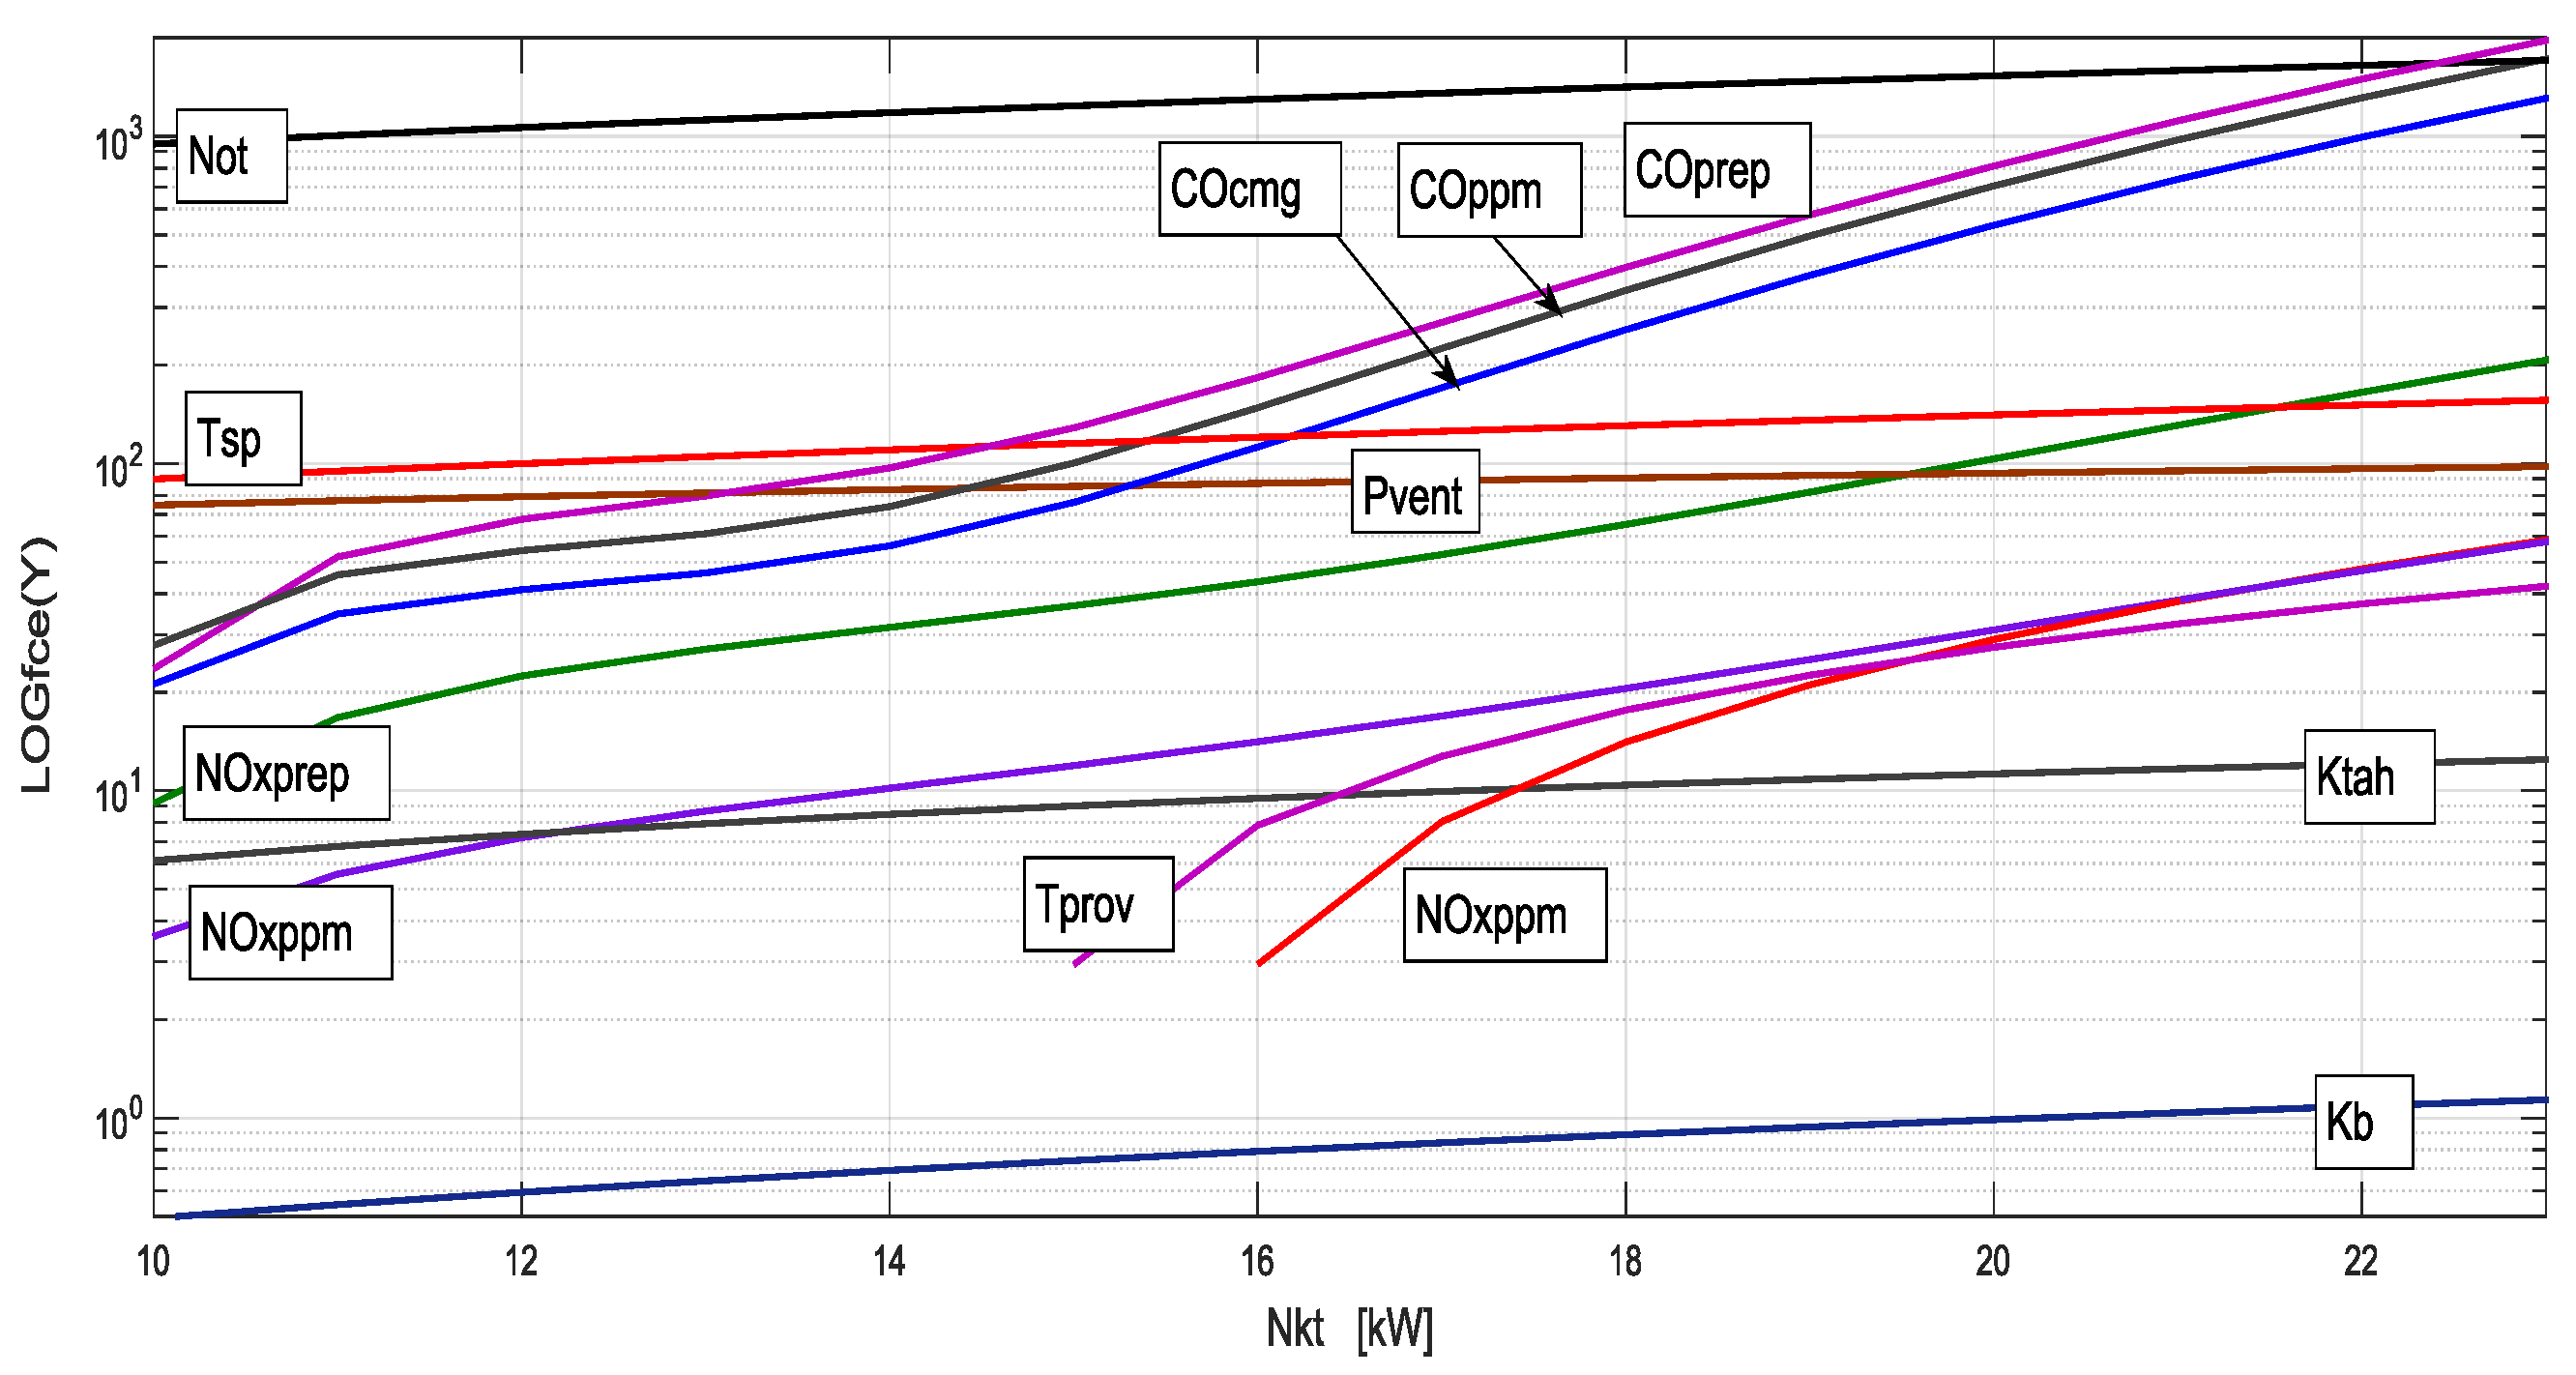
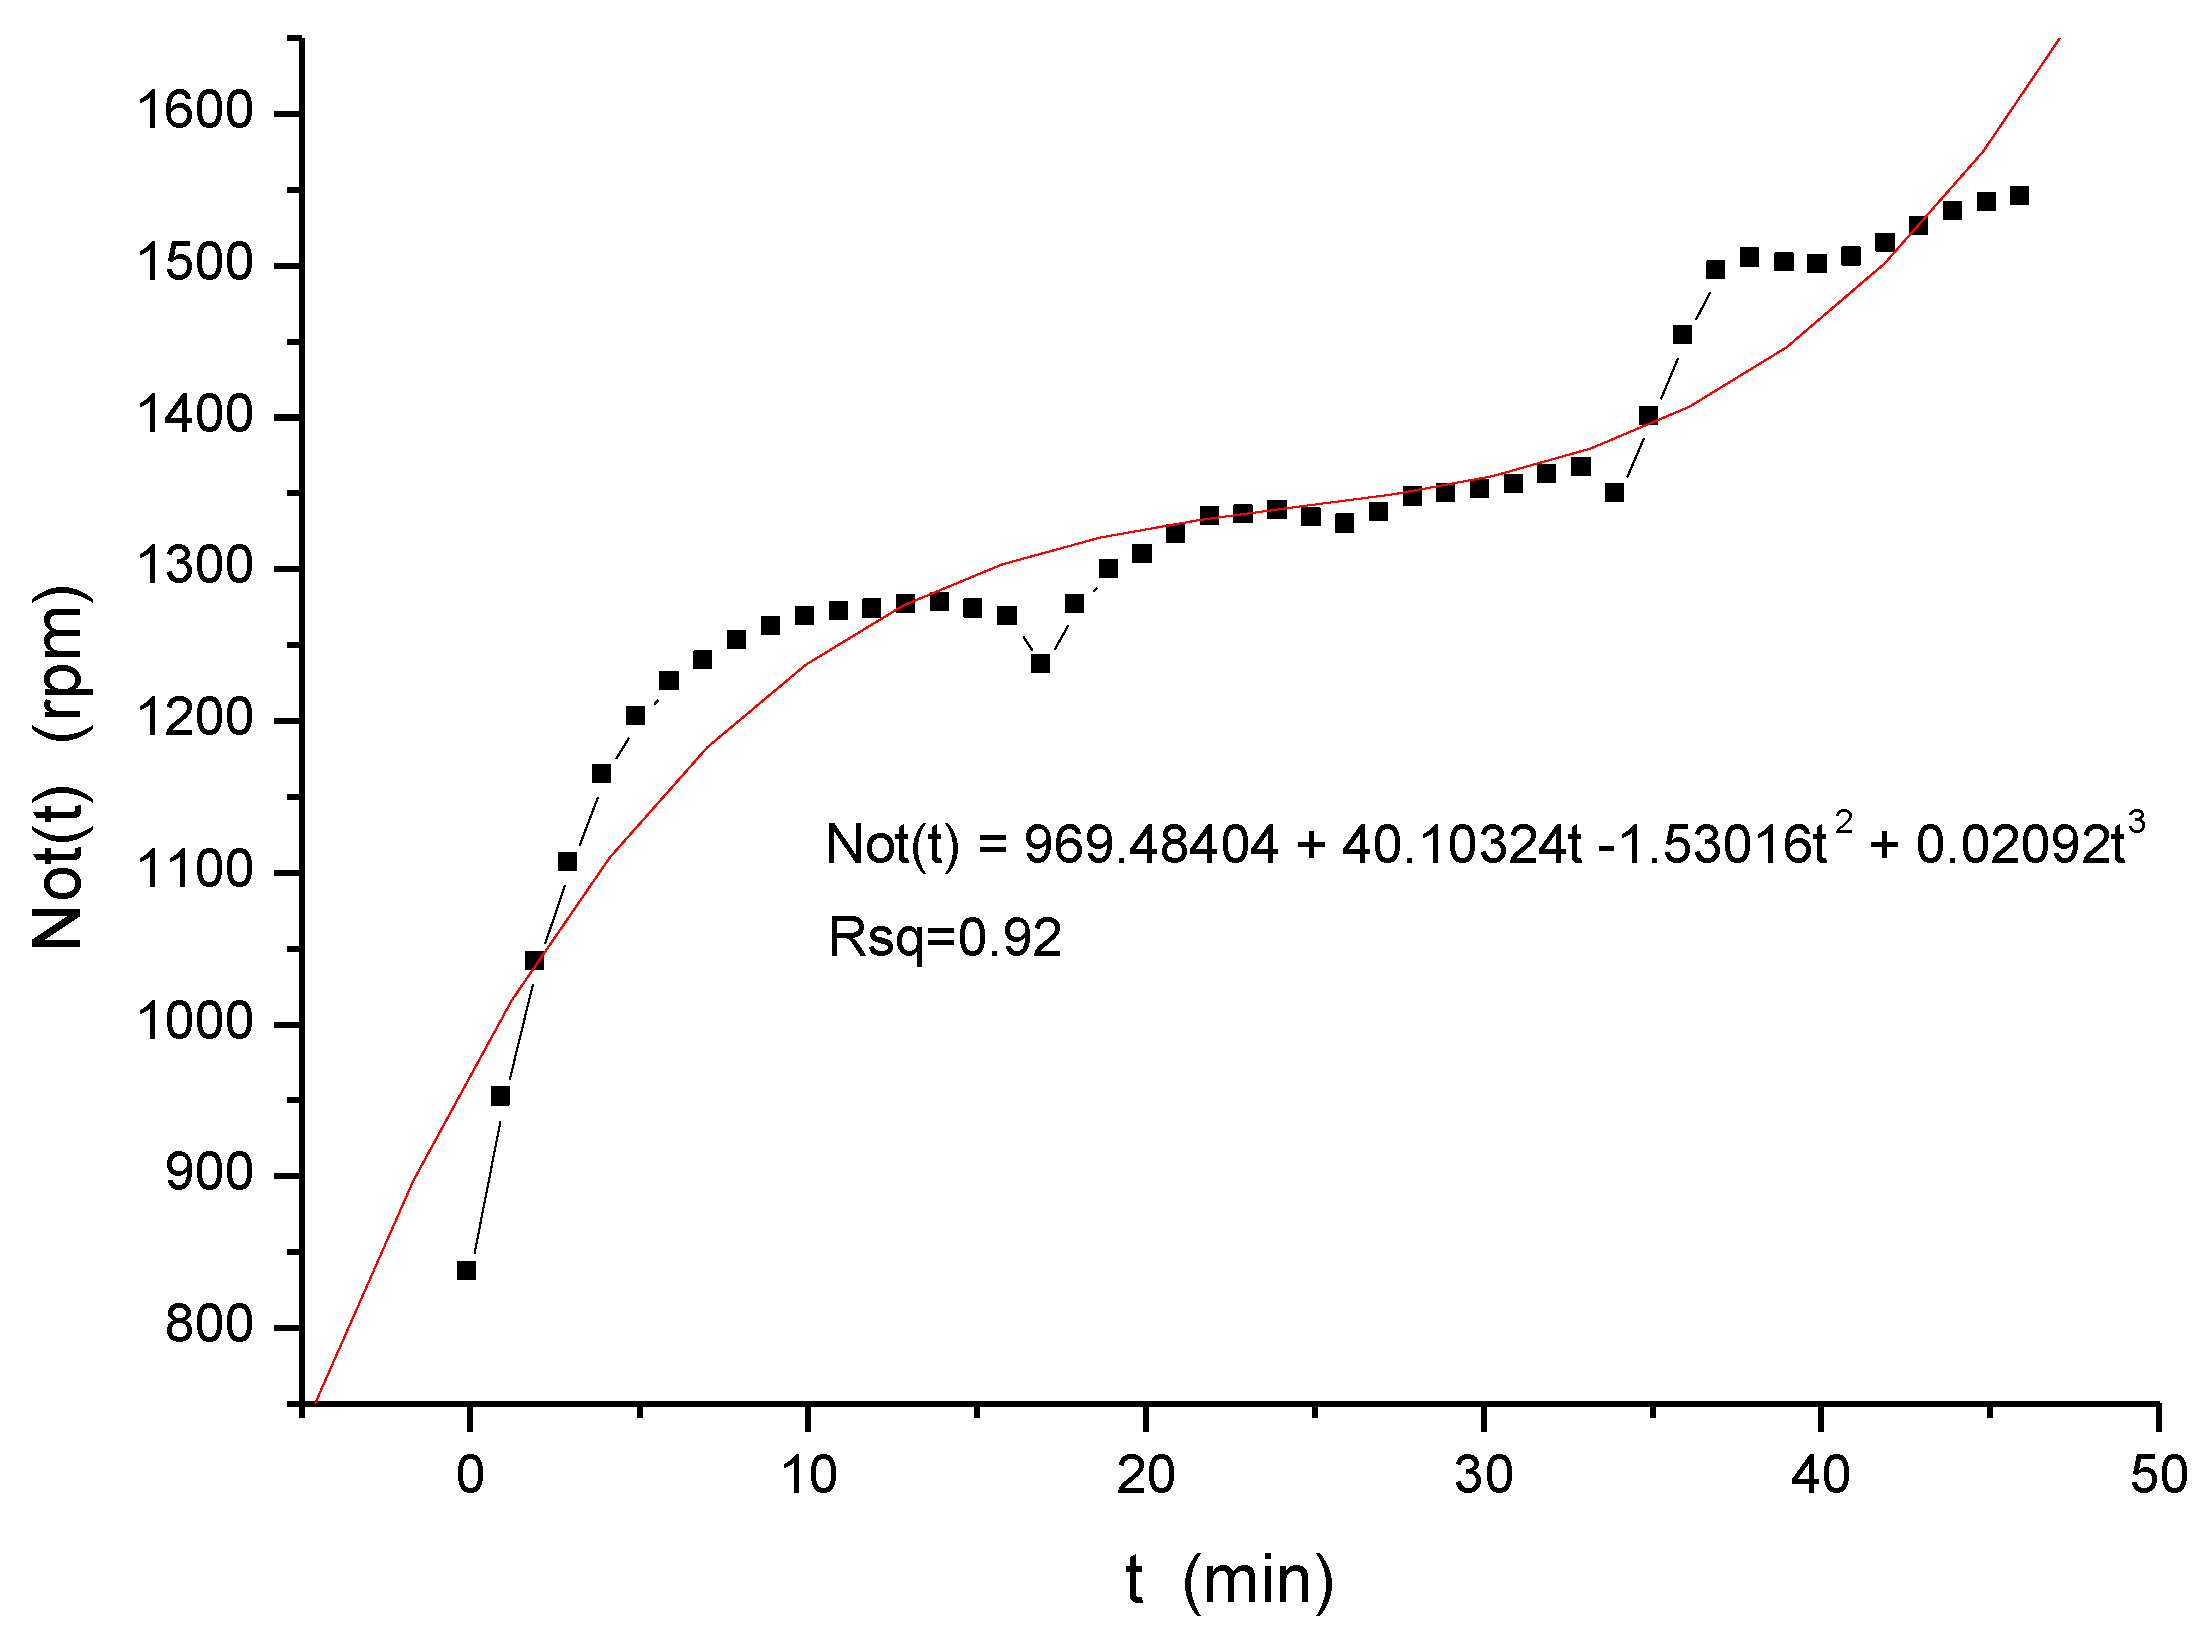
This was followed by the fuel combustion section with fluctuations of the output Pkot with proportional changes of the dependent combustion parameters, including emissions, up till τ = 180 min. Burning out of the first dose of the fuel at τ = 210 min resulted in an output drop to a minimum, i.e., to 16 kW. After delivery of a new dose of fuel, the cycle was repeated. The output and emission fluctuations are due not only to the combustion conditions in the boiler itself, but also to changes in the atmosphere at the mouth of the stack. Particularly the atmospheric changes in the stack mouth should be according to the relevant literature and granted patents, e.g., [6,7,8,9], eliminated by the instantaneous change of the regulating fan rpm Not = f(tk), while tk = f(Pkot, pk, ...). We performed the basic correlation analysis for the section of the boiler output increase Pkot (kW) and for the dependent parameters from the ignition of the fuel till the nominal output was reached, and thus to τ = 45 min. Correlation equations show polynomials of the 3rd order with average correlation proximity Rsq = 0.92. The τ parameter acts in the correlation equations as an independent variable and as a proportionality constant. The correlation relations of the measured data for the individual parameters XY = f(τ), therefore consequently allow a mutual transformation of the variables. It is then possible to examine related functions, such as XY = f(Pkot, tk, pk, Tdvsp, Not ...) or XY = f(Not). The operating diagrams for controlling the boiler by regulating fan rpm can then be plotted in dependence on the various selected variables. The variable on the axis (x) is plotted in the operating diagrams in linear manner. We use the decimal logarithm on the axis (y). Figure 10, Figure 11, Figure 12, Figure 13, Figure 14, Figure 15, Figure 16 and Figure 17 present examples of correlation diagrams and derived equations for the MAGA 23 boiler.
5. Conclusions
The method of regulation of the boiler output and emissions by instantaneous fan rpm depending on the temperature in the stack outlet, which is described in the article, enables reduction of fuel consumption, increases the efficiency of boilers and reduces the emission load from local heat sources. The manner of multi-parametric regulation of the gasification boiler power output is particularly suitable for heating or for hot water heating in local buildings, housing, restaurant and hotel facilities, agricultural buildings and food, chemical, textile or pharmaceutical industries. Measurement results show that changes at the mouth of the stack draft due to atmospheric influences occur over time with high intensity and high frequency, while power parameters, or boiler power output amplitudes and fan speed automatically “copy” those changes proportionally due to instantaneous fan speed changes. The regulation fan speed is, according to the new solution of the authors, an instantaneous function of the flue gas temperature, draft and pressure in the stack draft, including the associated oxygen combustion balance.
Acknowledgments
This research has been elaborated in the framework of the project RMTVC No. LO1203.
Author Contributions
Jan Valíček, Ondrej Lukáč and Zuzana Palková conceived, designed the experiments and wrote the paper; Marta Harničárová and Milena Kušnerová performed the experiments and analyzed the data.
Conflicts of Interest
The authors declare no conflict of interest.
References
- Guizani, C.H.; Jeguirim, M.; Valin, S.; Limousy, L.; Salvador, S. Biomass chars: The effects of pyrolysis conditions on their morphology, structure, chemical properties and reactivity. Energies 2017, 10, 796. [Google Scholar] [CrossRef]
- Boriouchkine, A.; Jämsä-Jounela, S.L. Simplification of a mechanistic model of biomass combustion for on-line computations. Energies 2016, 9, 735. [Google Scholar] [CrossRef]
- Míguez, J.L.; Morán, J.C.; Granada, E.; Porteiro, J. Review of technology in small-scale biomass combustion systems in the European market. Renew. Sustain. Energy Rev. 2012, 16, 3867–3875. [Google Scholar] [CrossRef]
- Madanayake, B.N.; Gan, S.; Eastwick, C.; Ng, H.K. Biomass as an energy source in coal co-firing and its feasibility enhancement via pre-treatment techniques. Fuel Process. Technol. 2017, 159, 287–305. [Google Scholar] [CrossRef]
- Hupa, M.; Karlström, O.; Vainio, E. Biomass combustion technology development—It is all about chemical details. Proc. Comb. Inst. 2017, 36, 113–134. [Google Scholar] [CrossRef]
- Valíček, J.; Maga, S.R.O.; Müllerová, J.; Borovička, A.; Valíček, J.; Müller, M.; Hloch, S.; Lupták, M. Method of power regulation of a gasification boiler. CZ Patent 302544 B6, 26 May 2011. [Google Scholar]
- Müllerová, J.; Hloch, S.; Valíček, J. Reducing emissions from the incineration of biomass in the boiler. Chem. Listy 2010, 104, 876–879. [Google Scholar]
- Valíček, J.; Müllerová, J.; Kuběna, V.; Koštial, P.; Harničárová, M.; Mikulík, M. Emission distribution and regulation of local heat source. Defect Diffus. Forum 2012, 326, 330–334. [Google Scholar] [CrossRef]
- Kuběna, V.; Müllerová, J.; Valíček, J.; Harničárová, M.; Hryniewicz, T.; Rokosz, K.; Václavik, V.; Michalovič, R. Modifications concerning the combustion air from the pyrolysis boiler. Rocz. Ochr. Srodowiska 2012, 14, 182–201. [Google Scholar]
Figure 1.
MA 23 hot-water boiler—connection of measuring probes.

Figure 2.
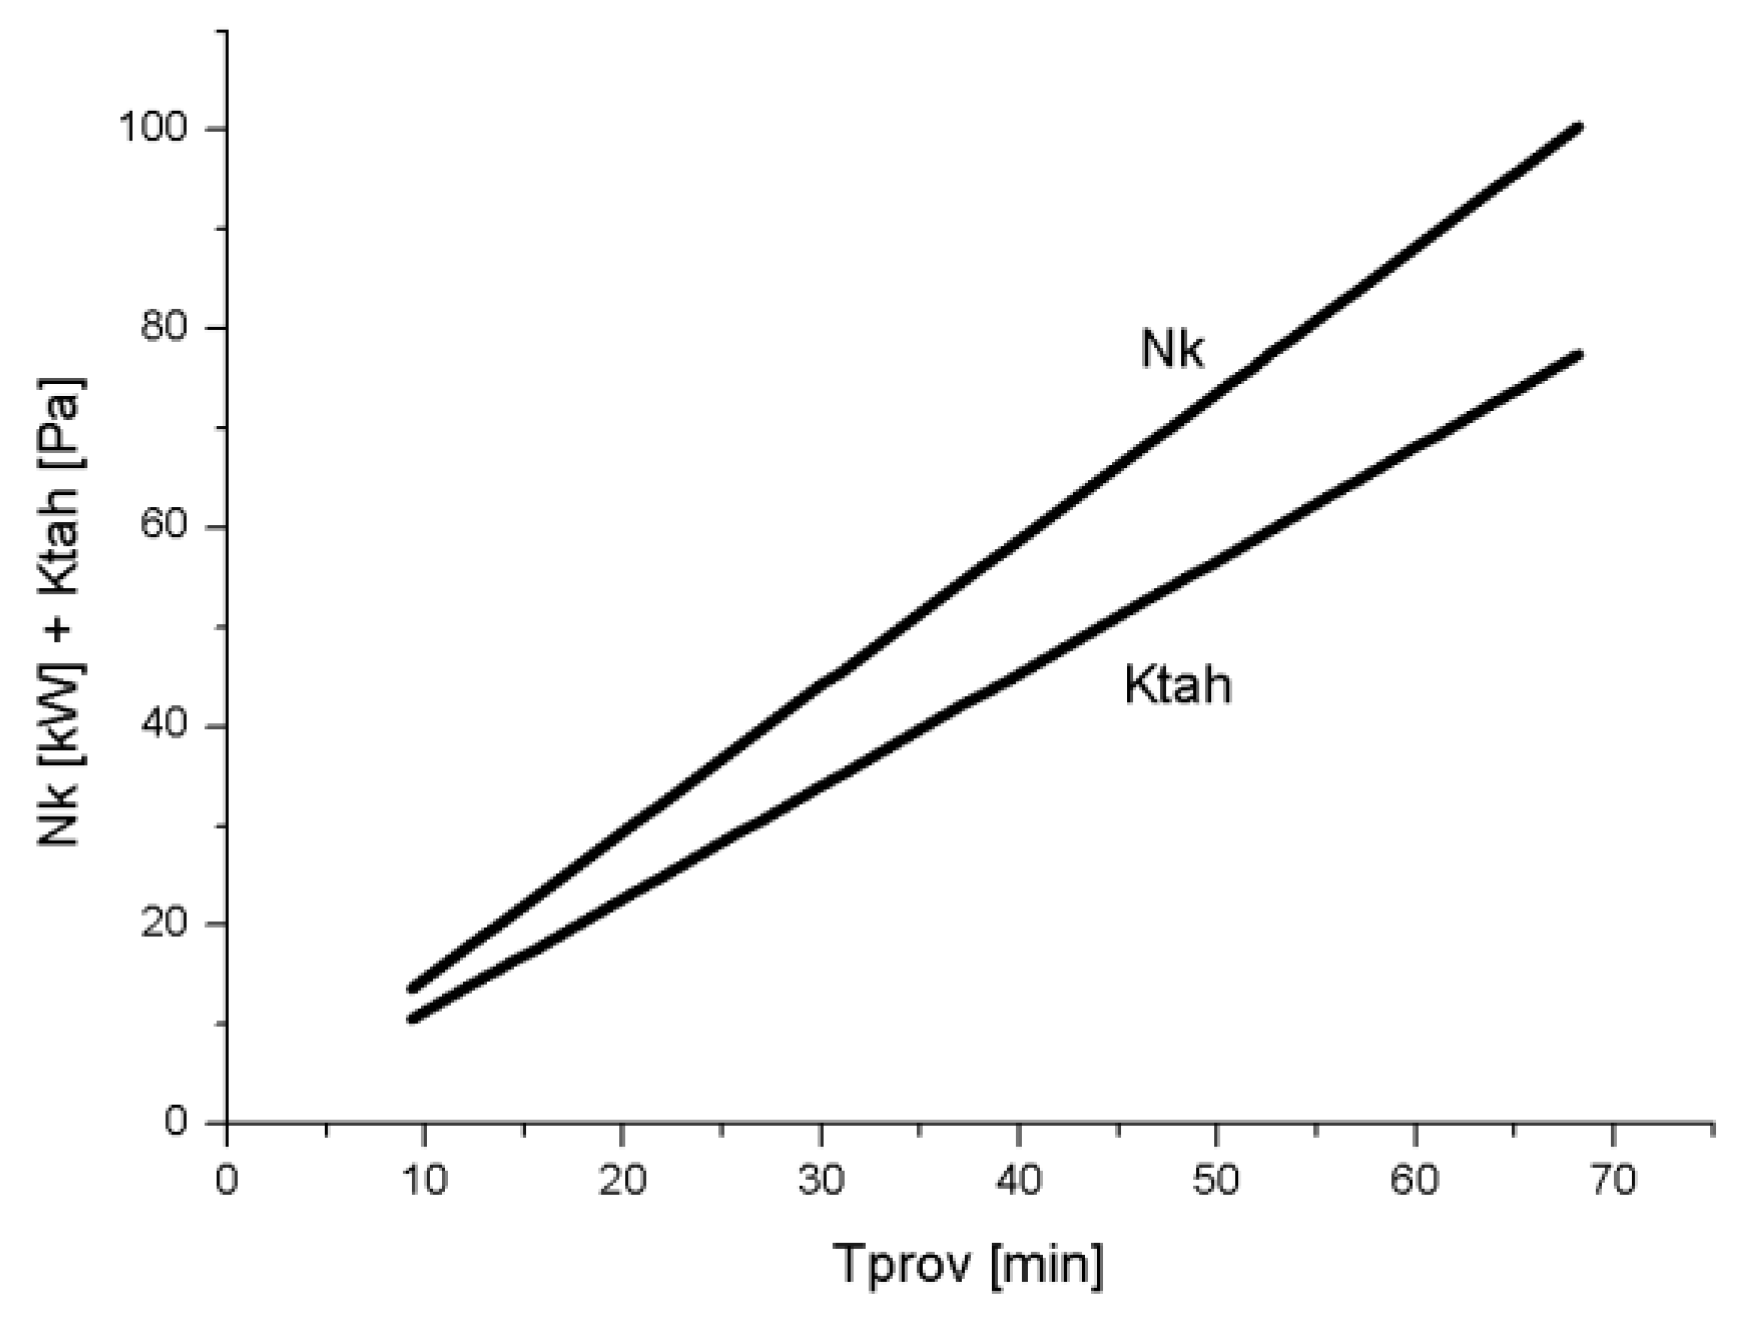
Dependence of the boiler power output Nk (kW) and stack draft Ktah (Pa) to the working time Tprov (min), for the boilers with power output up to 100 kW.
Figure 2.
Dependence of the boiler power output Nk (kW) and stack draft Ktah (Pa) to the working time Tprov (min), for the boilers with power output up to 100 kW.

Figure 3.
Dependence of water temperature on the output Tvyst (°C) and temperature of the handle of bottom doors Tdvsp (°C) on the working time Tprov (min), for the boilers with power output up to 100 kW.
Figure 3.
Dependence of water temperature on the output Tvyst (°C) and temperature of the handle of bottom doors Tdvsp (°C) on the working time Tprov (min), for the boilers with power output up to 100 kW.

Figure 4.
Dependence of flue gasses temperature in the stack throat and in the stack Tkom (°C) on the working time Tprov (min), for the boilers with power output up to 100 kW.
Figure 4.
Dependence of flue gasses temperature in the stack throat and in the stack Tkom (°C) on the working time Tprov (min), for the boilers with power output up to 100 kW.

Figure 5.
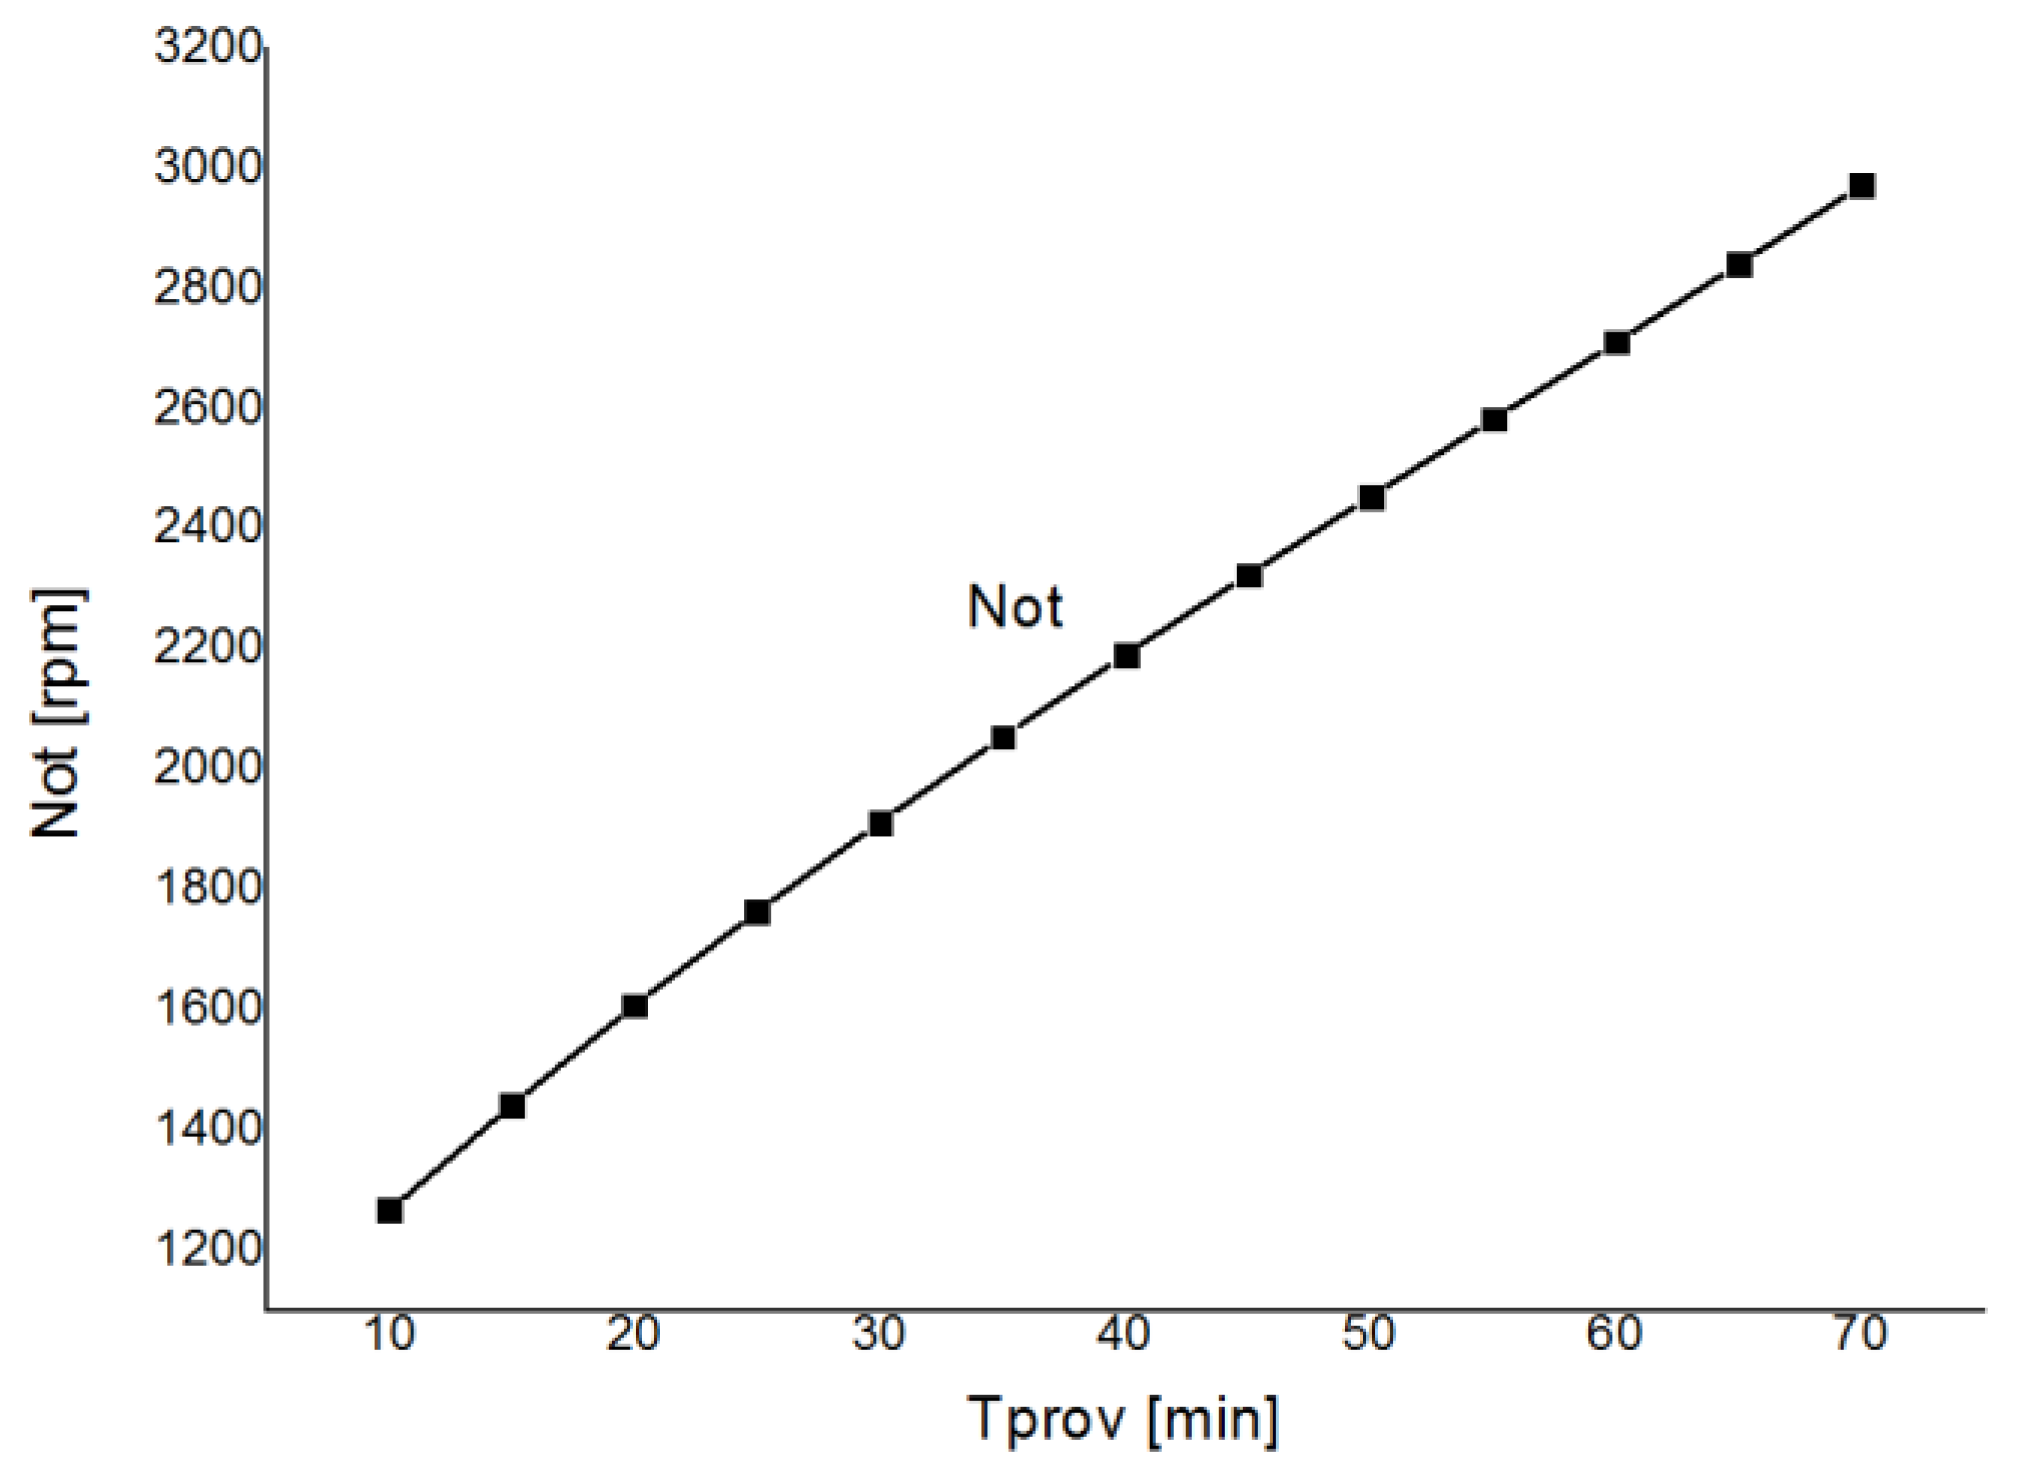
Dependence of change of the fan speed on the working time Tprov (min), for the boilers with power output up to 100 kW.
Figure 5.
Dependence of change of the fan speed on the working time Tprov (min), for the boilers with power output up to 100 kW.

Figure 6.
Relations between the main regulation parameters of boiler with power output up to 100 kW.
Figure 6.
Relations between the main regulation parameters of boiler with power output up to 100 kW.

Figure 7.
Method of power output regulation for gasification boiler MAGA 23 according to the technical solution.
Figure 7.
Method of power output regulation for gasification boiler MAGA 23 according to the technical solution.

Figure 8.
Distribution of functions depending on operation time Tprov; boiler MAGA 23.

Figure 9.
Course of measured variables for hot water boiler MAGA 23 where: tk—stack temperature (°C), t0—room temperature (°C), fi—relative humidity (°C), pk—stack draught (Pa).
Figure 9.
Course of measured variables for hot water boiler MAGA 23 where: tk—stack temperature (°C), t0—room temperature (°C), fi—relative humidity (°C), pk—stack draught (Pa).

Figure 10.
Dependence of Not on operation time.

Figure 11.
Dependence of Pkot on operation time.

Figure 12.
Dependence of tk on operation time.

Figure 13.
Dependence of Pkot on operation time.

Figure 14.
Dependence of COprep on operating time.

Figure 15.
Dependence of CO2 on operating time.

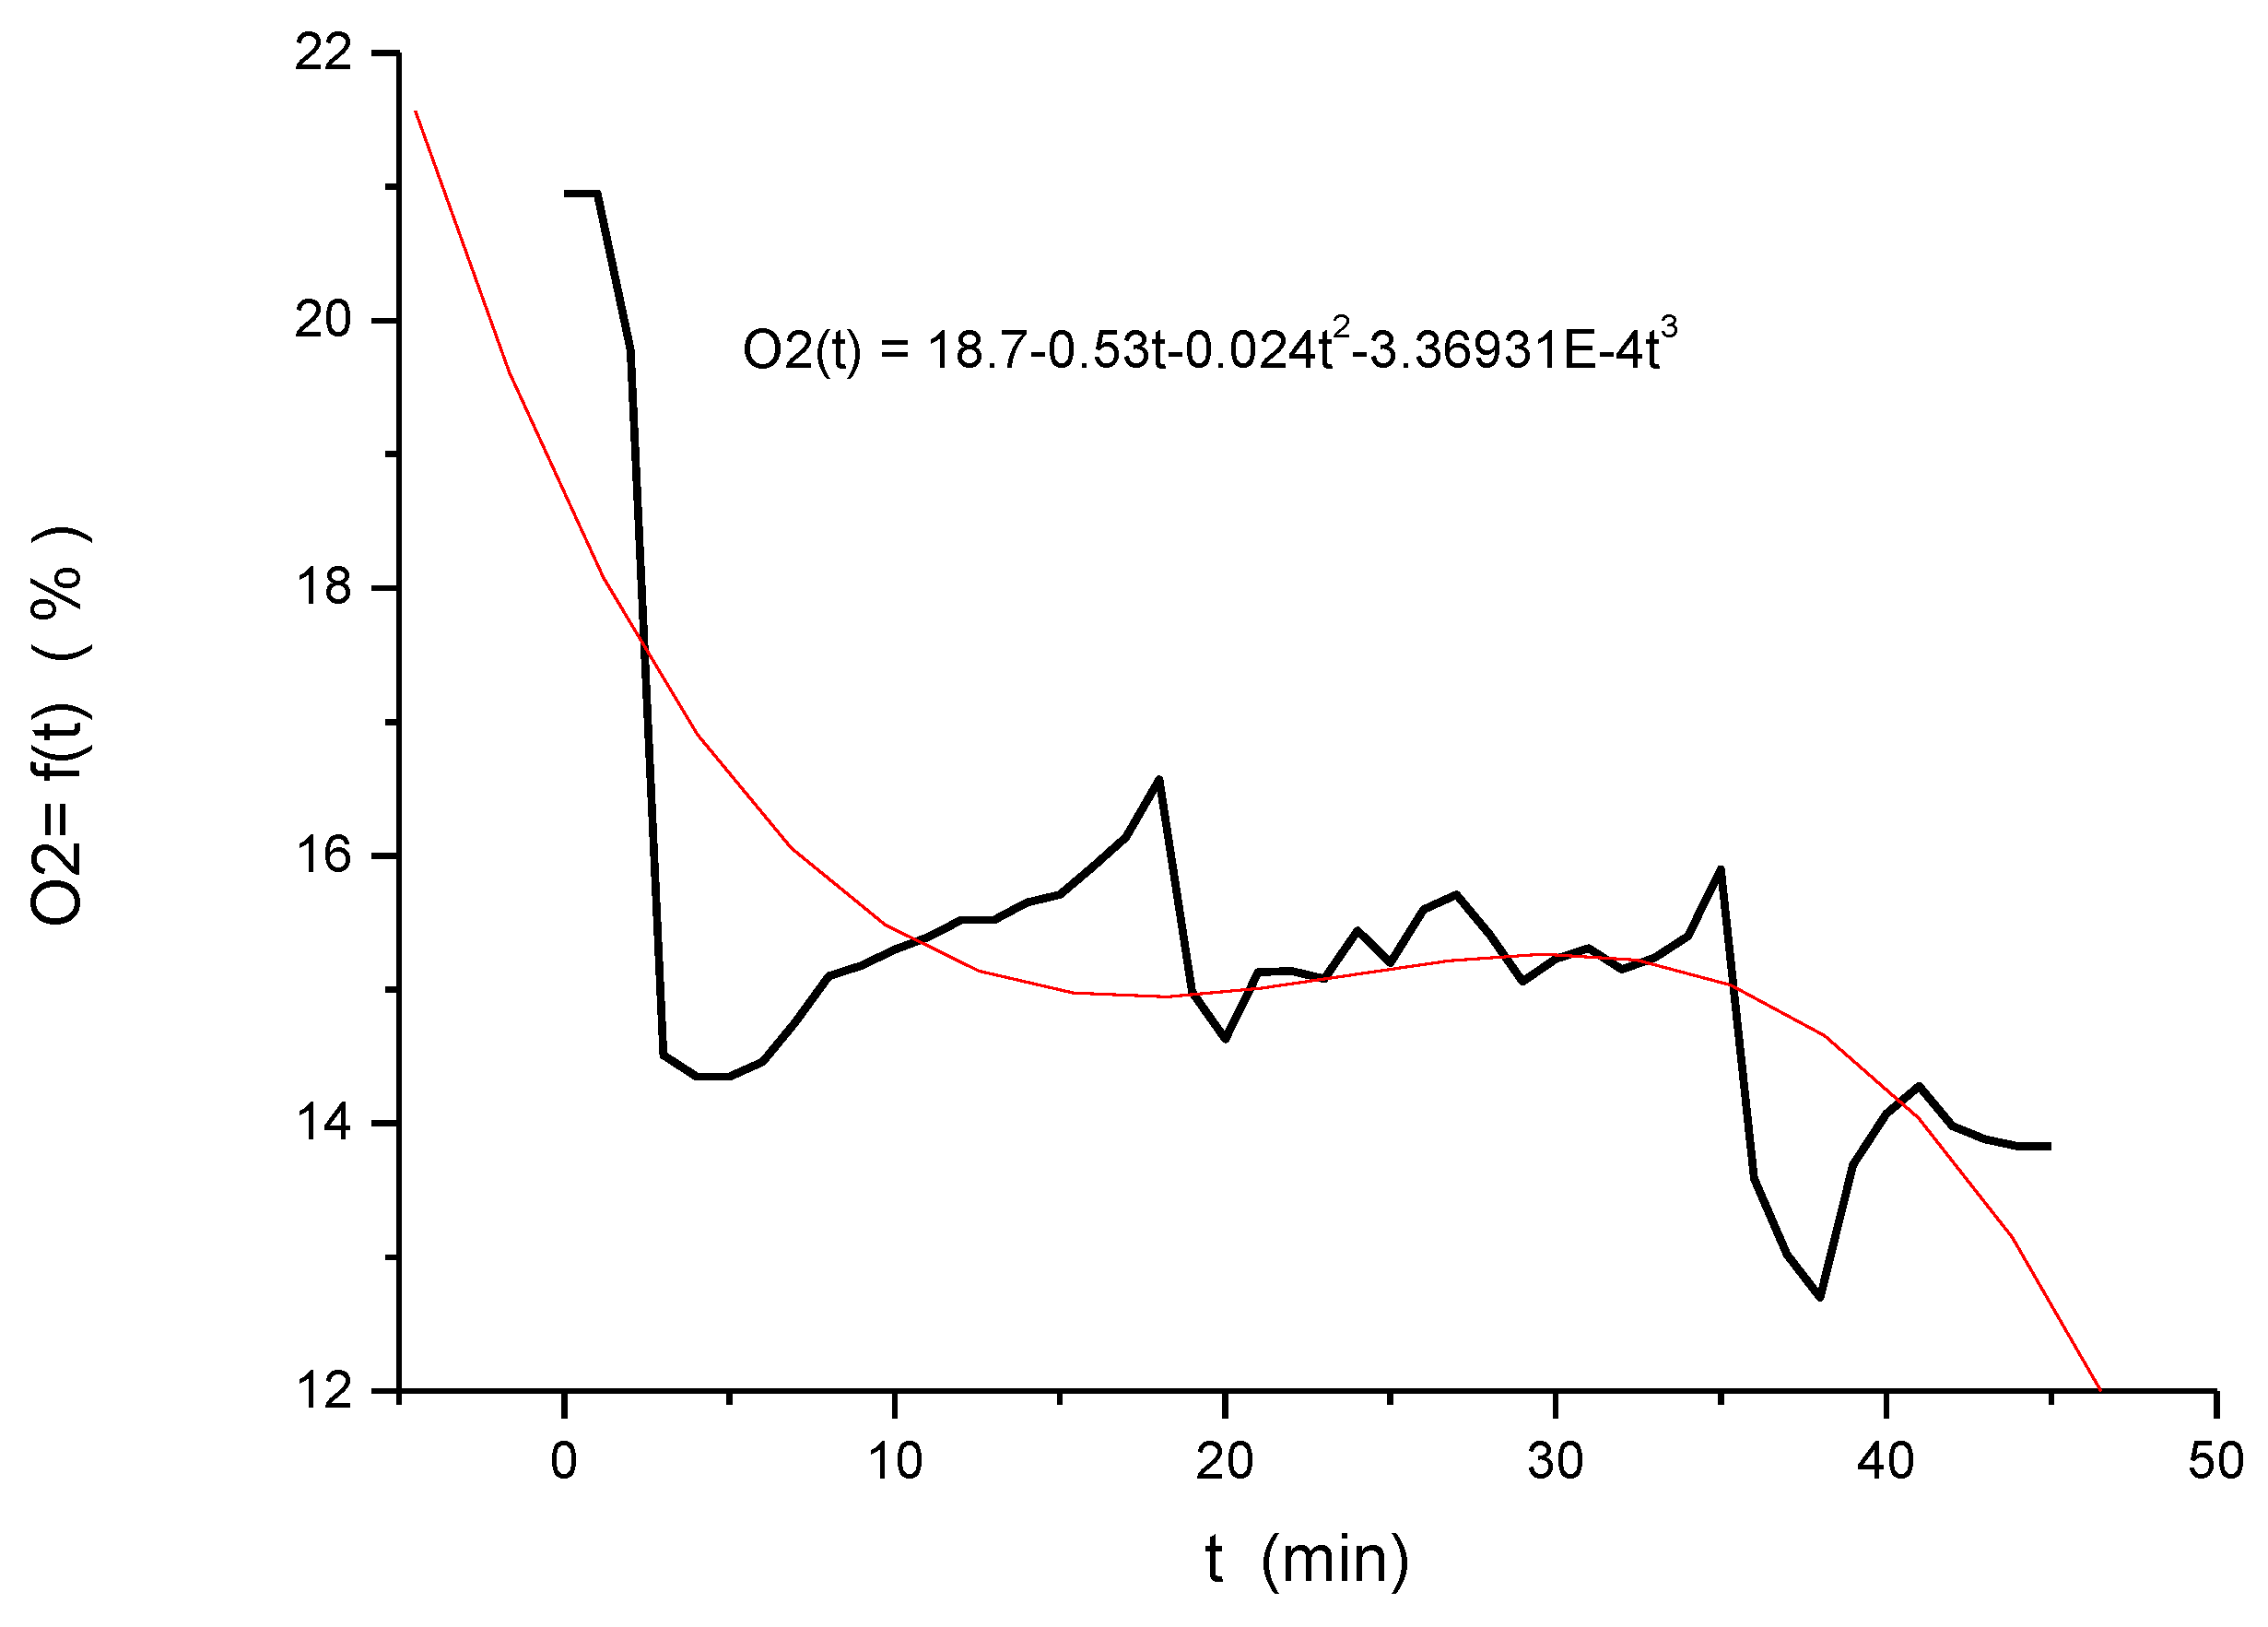
Figure 16.
Dependence of O2 on operating time.

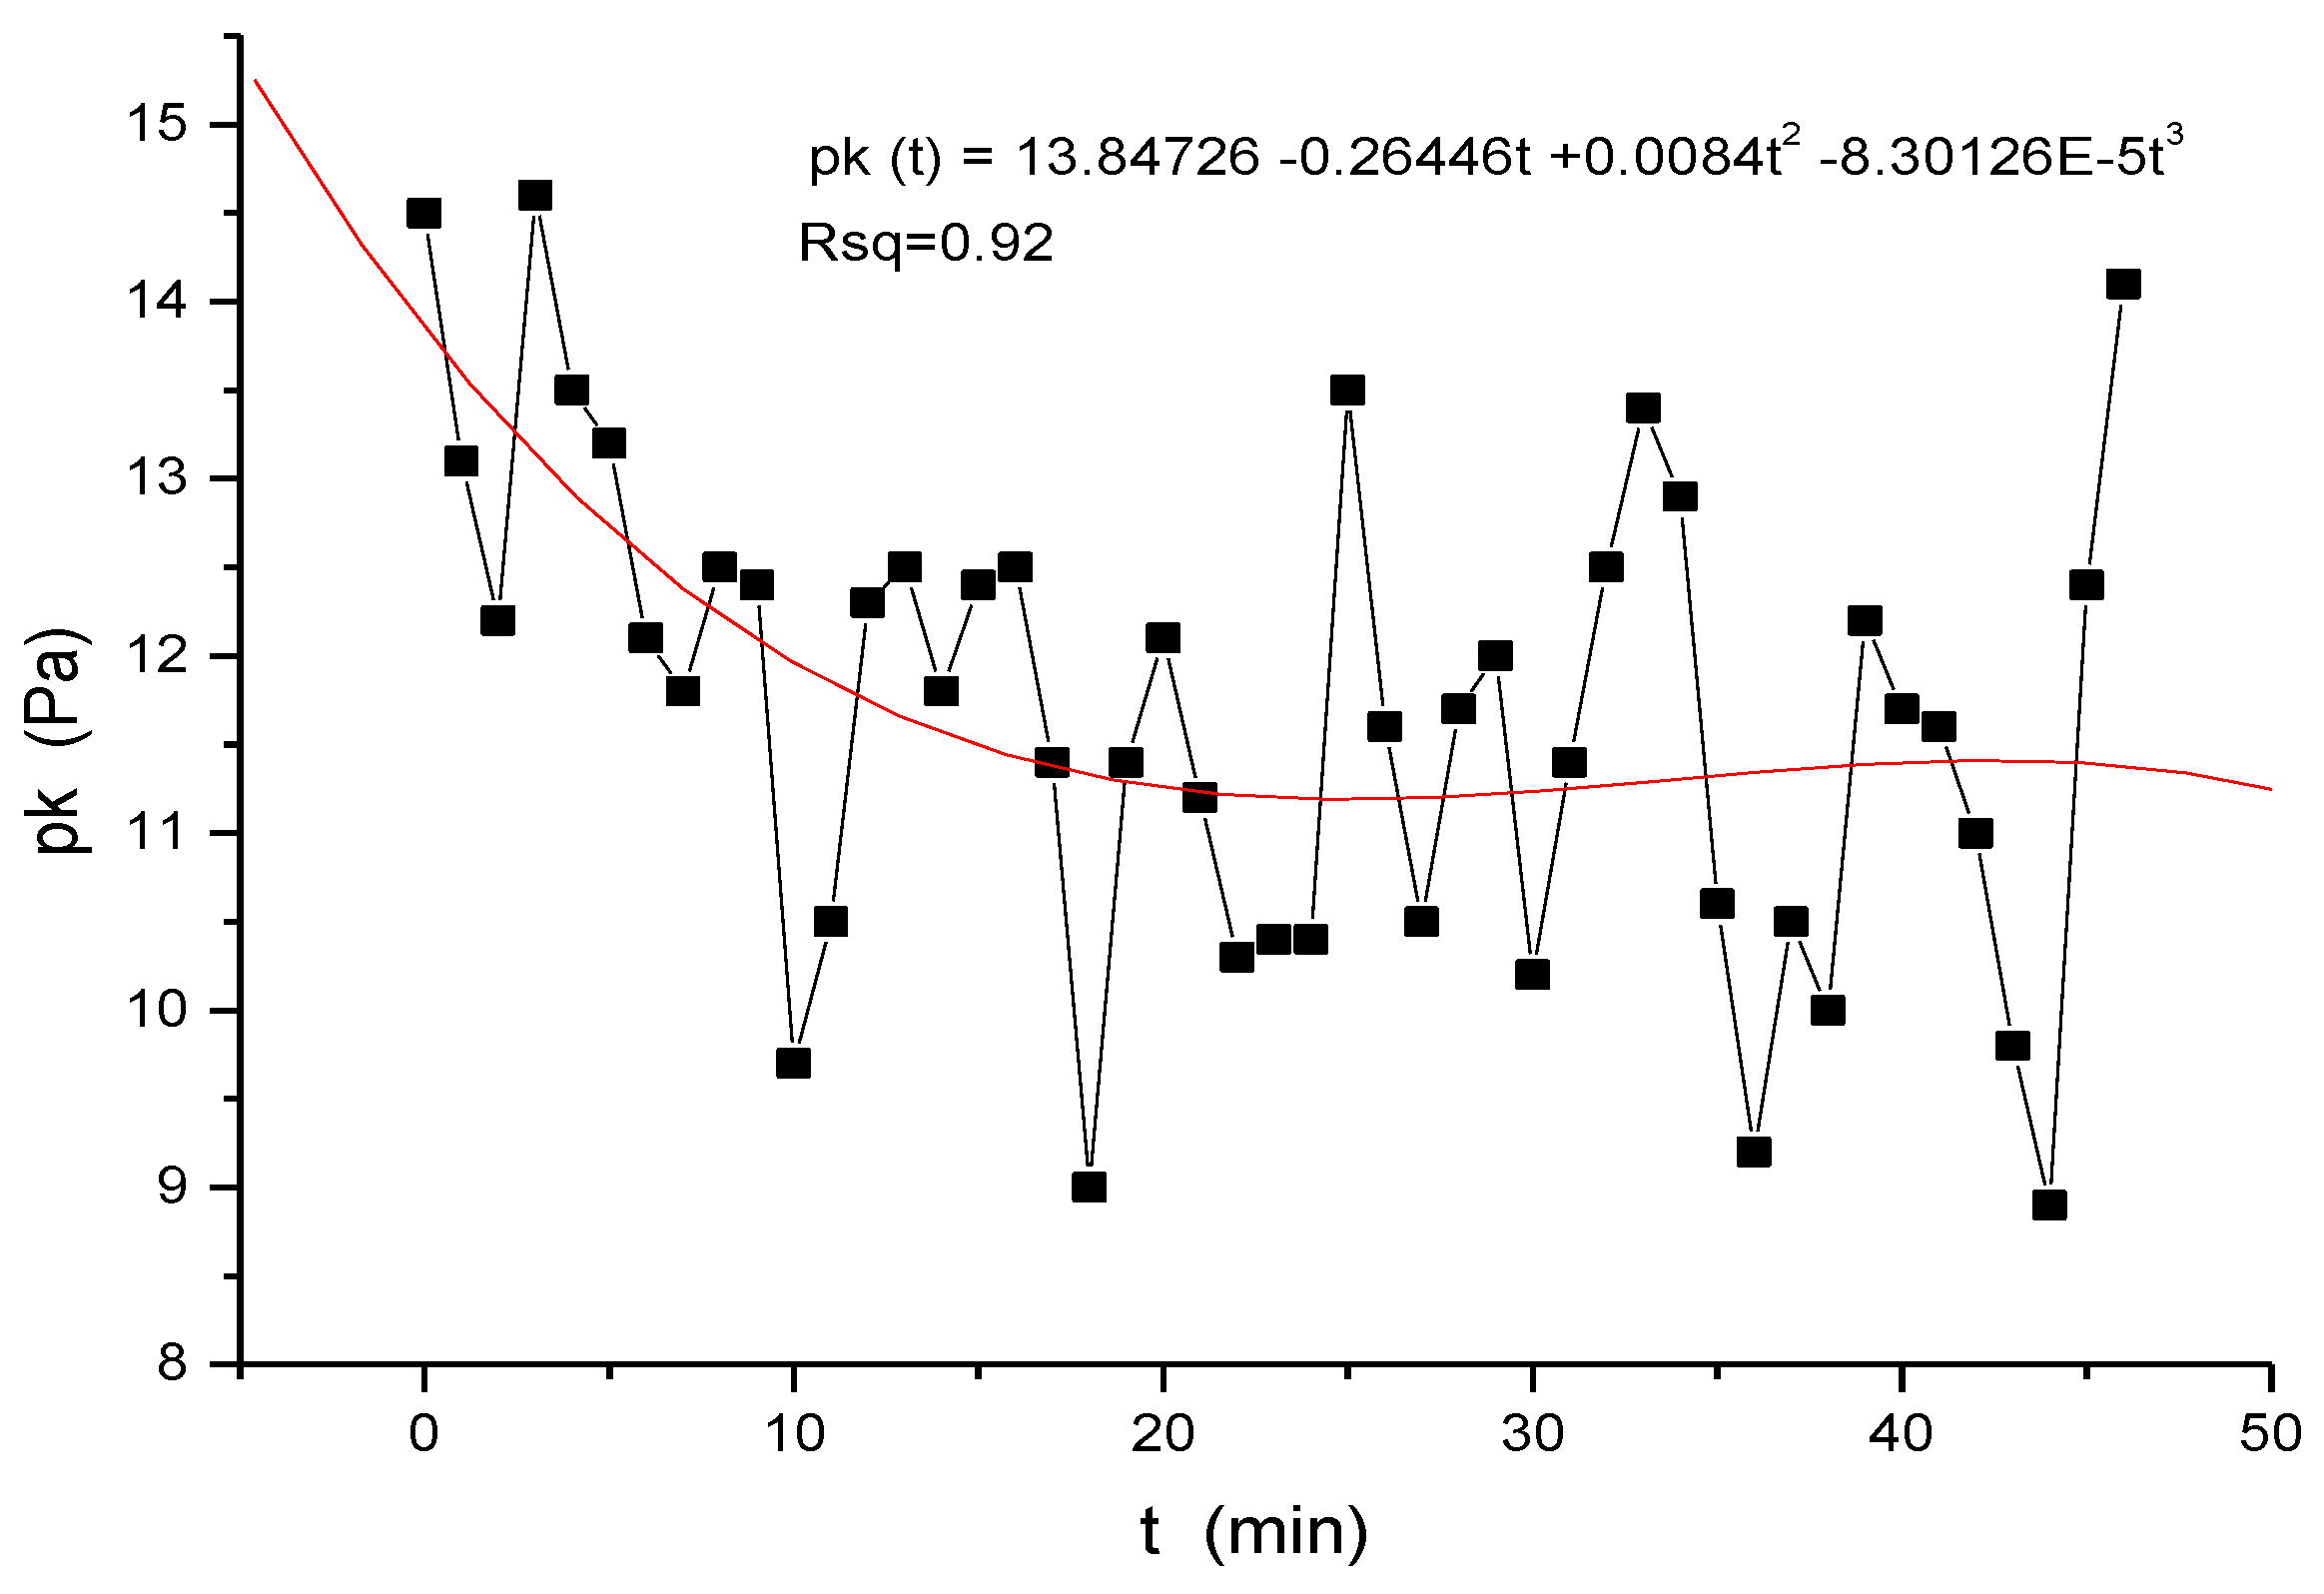
Figure 17.
Dependence of pk on operating time.


Table 1.
Working times of parameters for boilers 10–100 (kW) (Figure 6).
Table 1.
Working times of parameters for boilers 10–100 (kW) (Figure 6).
| Equation | Unit | Equation |
|---|---|---|
| Nk = 1.10667 × 10⁻⁹ + 1.47164 × Tprov | kW | (1) |
| Ktah = −5.58565 × 10⁻¹⁰ + 1.13549 × Tprov | Pa | (2) |
| Tkom = 100 + 0.80338 × Tprov | °C | (3) |
| Tdvsp = 21 + 0.85476 × Tprov | °C | (4) |
| Tvyst = −7.51356 × 10⁻¹⁰ + 6.65153 × Tprov | °C | (5) |
| Not = 879.61549 + 41.37598 × Tprov − 0.28119∙× Tprov2 + 0.00167 × Tprov3 | rpm | (6) |
| Tprov = −24.56827 + 1.16992 × Tdvsp | min | (7) |
| Tprov = 1.12948 × 10⁻¹⁰ + 0.15034 × Tvyst | min | (8) |
| Tprov = 4.9193 × 10⁻¹⁰ + 0.88067 × Ktah | min | (9) |
| Tprov = −124.47426 + 1.24474 × Tkom | min | (10) |
| Tprov = −7.5196 × 10⁻¹⁰ + 0.67951 × Nk | min | (11) |
| Tprov = −6.37025 − 0.00308 × Not + 1.48964 × 10⁻⁵ × Not2 − 1.74707 × 10⁻⁹ × Not3 | min | (12) |
| Kb = 1.136 × (14.4 + 0.204 × t) × Nkopt−1 | - | (13) |
Nk—boiler output, function (Tprov) (kW); Ktah—stack draft (Pa); Tsp, Tkom—flue gas temperature in the stack mouth (°C); Tprov, t—measured operation time (min); Tdvsp—temperature of the handle of bottom doors (°C); Tvyst—water temperature on the output (°C); Not—regulation of fan rotations (rpm); Kb—oxygen balance (-).
Table 2.
Working times of parameters for boilers of 23 (kW) depending on Nkt (Figure 7).
Table 2.
Working times of parameters for boilers of 23 (kW) depending on Nkt (Figure 7).
| Equation | Unit | Equation |
|---|---|---|
| Not = 10(2.365 + 0.325 × log10 × (Nkt)) | rpm | (14) |
| Ktah = −14.2421 + 0.04157 × (10(2.365 + 0.325 × log10 × (Nkt)) | Pa | (15) |
| Kb = 1.136 × Nkt × Pkotpt−1 | - | (16) |
| t = (Pkot − 14.4)/0.204; Pkot = 363.64 + 58.4 × Nkt, Tprov = t | min | (17) |
| Tsp = 38.59652 + 5.11052 × Nkt | °C | (18) |
| Pvent = MkOPT × 10(2.365 + 0.325 × log10 × (Nkt))/97,400 × μ | kW | (19) |
| COprep = −2912.68649 + 698.44724 × Nkt − 55.35295 × Nkt2 + 1.48709 × Nkt3 | mg∙m−3 | (20) |
| NOxprep = −361.15795 + 79.64852 × Nkt − 5.70241 × Nkt2 + 0.14407 × Nkt3 | mg∙m−3 | (21) |
| COppm = −2351.95047 + 578.63494 × Nkt − 46.84466 × Nkt2 + 1.27787 × Nkt3 | ppm | (22) |
| COcmg = −1782.53905 + 438.61597 × Nkt − 35.51257 × Nkt2 + 0.96881 × Nkt3 | mg∙m−3 | (23) |
| NOxppm = −77.93008 + 17.32183 × Nkt − 1.24033 × Nkt2 + 0.03233 × Nkt3 | ppm | (24) |
| NOxppm = 49.76939 − 10.47717 × Nkt + 0.47193 × Nkt2 | ppm | (25) |
Not—regulation of fan rotations (rpm); Ktah—stack draft (Pa); Kb—oxygen balance (-); Tprov, t—measured operation time (min); Nkt—boiler output, function (Tprov) (kW); Tsp, Tkom—flue gas temperature in the stack mouth (°C); MkOPT—torque of the fan motor (N·m); Pvent—fan instant output (kW); µ—efficiency of the fan operation (-); COprep—converted value of CO (mg·m−3); NOxprep—converted value of Nox (mg·m−3); COppm—CO concentration (ppm); COcmg—CO concentration (mg·m−3); NOxppm—NOx concentration (ppm); NOppm—NO concentration (ppm).
Table 3.
Working times of parameters for boilers of 23 kW depending on operation time Tprov (Figure 8).
Table 3.
Working times of parameters for boilers of 23 kW depending on operation time Tprov (Figure 8).
| Equation | Unit | Equation |
|---|---|---|
| pk = 13.84726 − 0.26446 × t + 0.0084 × t2 − 8.30126 × 10⁻⁵ × t3 | Pa | (26) |
| Not = 10(2.365 + 0.325 × log10 × (14.5 + 0.2 × t)) | rpm | (27) |
| Nkt = 12.94137 + 0.55282 × t − 0.01735 × t2 + 2.2966 × 10⁻⁴ × t3; Nkt = Pkot | kW | (28) |
| Tsp = 38.59652 + 5.11052 × Nkt | °C | (29) |
| Kb = 1.136 × Pkot × Pkotopt−1 | - | (30) |
| O2 = 18.56627 − 0.49243 × t + 0.02151 × t2 − 2.94895 × 10⁻⁴ × t3 | % | (31) |
| CO2 = 2.3 + 0.47 × t − 0.02 × t2 + 2.84536 × 10⁻⁴ × t3 | % | (32) |
| COprep = −2912.68649 + 698.44724 × PkotL − 55.35295 × PkotL2 + 1.48709 × PkotL3 | mg∙m−3 | (33) |
| NOxprep = 57.71 + 20.81 × t − 1.2 × t2 + 0.02 × t3 | mg∙m−3 | (34) |
| COppm = −2351.95047 + 578.63494 × PkotL − 46.84466 × PkotL2 + 1.27787 × PkotL3 | ppm | (35) |
| COcmg = −1782.53905 + 438.61597 × PkotL − 35.51257 × PkotL2 + 0.96881 × PkotL3 | mg∙m−3 | (36) |
| Pkot = 12.94 + 0.55282 × t − 0.01735 × t2 + 2.2966 × 10⁻⁴ × t3 | kW | (37) |
| PkotL = 14.5 + 0.2 × t | kW | (38) |
| NOxppm = 22.5 + 4 × t − 0.21 × t2 + 0.003 × t3 | ppm | (39) |
| NOppm = 17.31 + 5.87 × t − 0.34 × t2 + 0.006 × t3 | ppm | (40) |
pk—pressure inside the stack mouth (rpm); Ktah—stack draft (Pa0; Not—regulation of fan rotations (rpm); Nkt—boiler output, function (Tprov) (kW); Tprov, t—measured operation time (min); Kb—oxygen balance (-); O2—concentration of oxygen (%); CO2—concentration of carbon dioxide (%); Coprep—converted value of CO (mg·m−3); NOxprep—converted value of Nox (mg·m−3); COppm—CO concentration (ppm); COcmg—CO concentration (mg·m−3); Pkot, PkotL (linear functions)—selected outputs as independent variables for continuous calculation (kW); NOxppm—NOx concentration (ppm); NOppm—NO concentration (ppm).
© 2017 by the authors. Licensee MDPI, Basel, Switzerland. This article is an open access article distributed under the terms and conditions of the Creative Commons Attribution (CC BY) license (http://creativecommons.org/licenses/by/4.0/).
Share and Cite
MDPI and ACS Style
Valíček, J.; Palková, Z.; Harničárová, M.; Kušnerová, M.; Lukáč, O. Thermal and Performance Analysis of a Gasification Boiler and Its Energy Efficiency Optimization. Energies 2017, 10, 1066. https://doi.org/10.3390/en10071066
AMA Style
Valíček J, Palková Z, Harničárová M, Kušnerová M, Lukáč O. Thermal and Performance Analysis of a Gasification Boiler and Its Energy Efficiency Optimization. Energies. 2017; 10(7):1066. https://doi.org/10.3390/en10071066
Chicago/Turabian StyleValíček, Jan, Zuzana Palková, Marta Harničárová, Milena Kušnerová, and Ondrej Lukáč. 2017. "Thermal and Performance Analysis of a Gasification Boiler and Its Energy Efficiency Optimization" Energies 10, no. 7: 1066. https://doi.org/10.3390/en10071066
Note that from the first issue of 2016, this journal uses article numbers instead of page numbers. See further details here.