
Influence of the Steam Addition on Premixed Methane Air Combustion at Atmospheric Pressure


Department of Energy Sciences, Lund University, Ole Römers väg 1, SE-22100 Lund, Sweden
*
Author to whom correspondence should be addressed.
Energies 2017, 10(7), 1070; https://doi.org/10.3390/en10071070
Submission received: 10 June 2017
/
Revised: 7 July 2017
/
Accepted: 20 July 2017
/
Published: 23 July 2017
(This article belongs to the Section I: Energy Fundamentals and Conversion)
Abstract
:Steam-diluted combustion in gas turbine systems is an effective approach to control pollutant emissions and improve the gas turbine efficiency. The primary purpose of the present research is to analyze the influence of steam dilution on the combustion stability, flame structures, and CO emissions of a swirl-stabilized gas turbine model combustor under atmospheric pressure conditions. The premixed methane/air/steam flame was investigated with three preheating temperatures (384 K/434 K/484 K) and the equivalence ratio was varied from stoichiometric conditions to the flammability limits where the flame was physically blown out from the combustor. In order to represent the steam dilution intensity, the steam fraction Ω defined as the steam to air mass flow rate ratio was used in this work. Exhaust gases were sampled with a water-cooled emission probe which was mounted at the combustor exit. A 120 mm length quartz liner was used which enabled the flame visualization and optical measurement. Time-averaged CH chemiluminescence imaging was conducted to characterize the flame location and it was further analyzed with the inverse Abel transform method. Chemical kinetics calculation was conducted to support and analyze the experimental results. It was found that the LBO (lean blowout) limits were increased with steam fraction. CH chemiluminescence imaging showed that with a high steam fraction, the flame length was elongated, but the flame structure was not altered. CO emissions were mapped as a function of the steam fraction, inlet air temperature, and equivalence ratios. Stable combustion with low CO emission can be achieved with an appropriate steam fraction operation range.
1. Introduction
Steam-diluted combustion in gas turbine cycles is an efficient, inexpensive, and environmentally-friendly technology for power generation. The steam-diluted reactant mixtures appear in wet gas turbines because these turbines use waste heat to produce steam or humidified air to boost the power output by increasing the mass flow through the turbine [1]. The facility investment and complexity are reduced compared to the conventional combined cycle because no additional steam turbine is required. This wet cycles also achieve a short start-up time and load control capabilities because of the lack of the heat recovery steam generator and the steam turbine [2]. In addition, the steam-diluted combustion can be combined with the CCS (carbon capture and storage) and applied as an environmentally-friendly technology to reduce the greenhouse emissions (mainly CO2). In this combined technology, the gas turbine combustion operates with sufficient steam dilution to extend the operability limits of low NOx to near-stoichiometric operating conditions [3,4], where the CO2 concentration in the combustion exhaust achieves the theoretical maximum value for the combustion of hydrocarbon fuel in air-breathing gas turbines. After a steam condensation process, the CO2 purity in the exhaust is sufficiently high, which makes the post-combustion capture of CO2 into a feasible technology for practical application with an affordable cost.
Due to the potential advantages of the steam-diluted combustion, a number of numerical and experimental studies have been performed over a wide range of operating conditions to acquire a better understanding of how the steam affects the combustion process. Based on the available research results, it should be noted that the steam addition in a combustion system has two mutually contradictory impacts. One impact is that the flame temperature and chemical reaction rate are decreased due to the heat capacity of added steam and the diluted mole fraction of important chain branching radicals (e.g., O, CH, OH, etc.) [5,6]. This impact results in a lower burning velocity [7,8,9,10], which brings a higher LBO risk for burning fuels with low reaction rate. However, it provides a promising option to reduce flashback in gas turbine operation for highly-reactive fuels, such as pure hydrogen. Another impact is that the steam may enhance the combustion reaction by producing more chain branching radicals, such as OH, which come from the reaction step O + H2O → OH + OH enhanced by steam addition [11,12]. The dissociation of the steam (e.g., H2O ↔ H + OH) under high temperature has also been mentioned as an important way to produce the OH radicals along with some other species such as H and O [13]. Thus, it can be seen that the steam influence on combustion emissions and operability should be finally determined by this two mutually-conflicting effects.
The steam influence on pollutant emissions (NOx and CO) was presented in many investigations, in which steam has been proven to be one of the effective methods for the NOx emission reduction. The mechanism of steam effects on NOx formation can be summarized in two ways [14]. Firstly, steam addition reduces the flame temperature and, hence, restrains the thermal NOx formation pathway. Secondly, the steam addition decreases the concentrations of the active radicals which, therefore, affects the reaction kinetics for NOx formation [5]. As for the steam influence on the CO emission, however, people’s conclusions are divergent. Goke et al. [15] reported that CO is not affected by steam addition. Park et al. [16] found that with the increase of steam addition, CO first increased, and then decreased, after reaching a maximum value. Kobayashi et al. [17] found that the steam is effective for reducing CO and they presumed the CO reduction was probably led by the elementary reactions in the water-gas-shift reaction, i.e., CO + H2O → CO2 + H2.
In contrast to the emission issue, there were fewer studies which investigated the steam influence on combustion stability. Kuhn et al. studied the influence of steam addition with different fuels, and they found that, in order to prevent lean blowout event, higher equivalence ratios are required with increasing steam addition [18]. Göke et al. [4] studied the steam influence with a premixed natural gas flame at different pressures. Their results indicated that the higher steam to air mass ratio leads to a higher blowout equivalence ratio, and no stable flame was achieved above a maximum steam to air mass ratio.
Despite a large number of prior investigations, the steam addition effects on the combustion lean blowout limits and CO emission of the premixed CH4/air flame are not well understood. In the current study, the primary purpose is to investigate the steam dilution effect with an optical and swirl-stabilized gas turbine combustor model under atmospheric pressure. The premixed and swirl-stabilized methane/steam/air flame was investigated with three combustor inlet temperatures (384 K/434 K/484 K). Combustion experiments are conducted with the equivalence ratio variation from near-stoichiometric conditions to LBO limits. CO emissions were measured at the combustor exit with a water-cooled probe. The time-averaged CH chemiluminescence imaging was performed to visualize the flame shape and the anchored position. Inverse Abel transform was performed to obtain the CH distribution on the axisymmetric plane of the combustor. Apart from the experimental measurements, the chemical kinetic calculation (by using ChemkinTM [19]) was conducted to support and analyze the experimental results. A better understanding of the operability range with stable flame and low CO emissions for steam diluted methane/air combustion was achieved in the current work.
2. Experimental Facilities and Approach
2.1. Description of Experimental Configuration
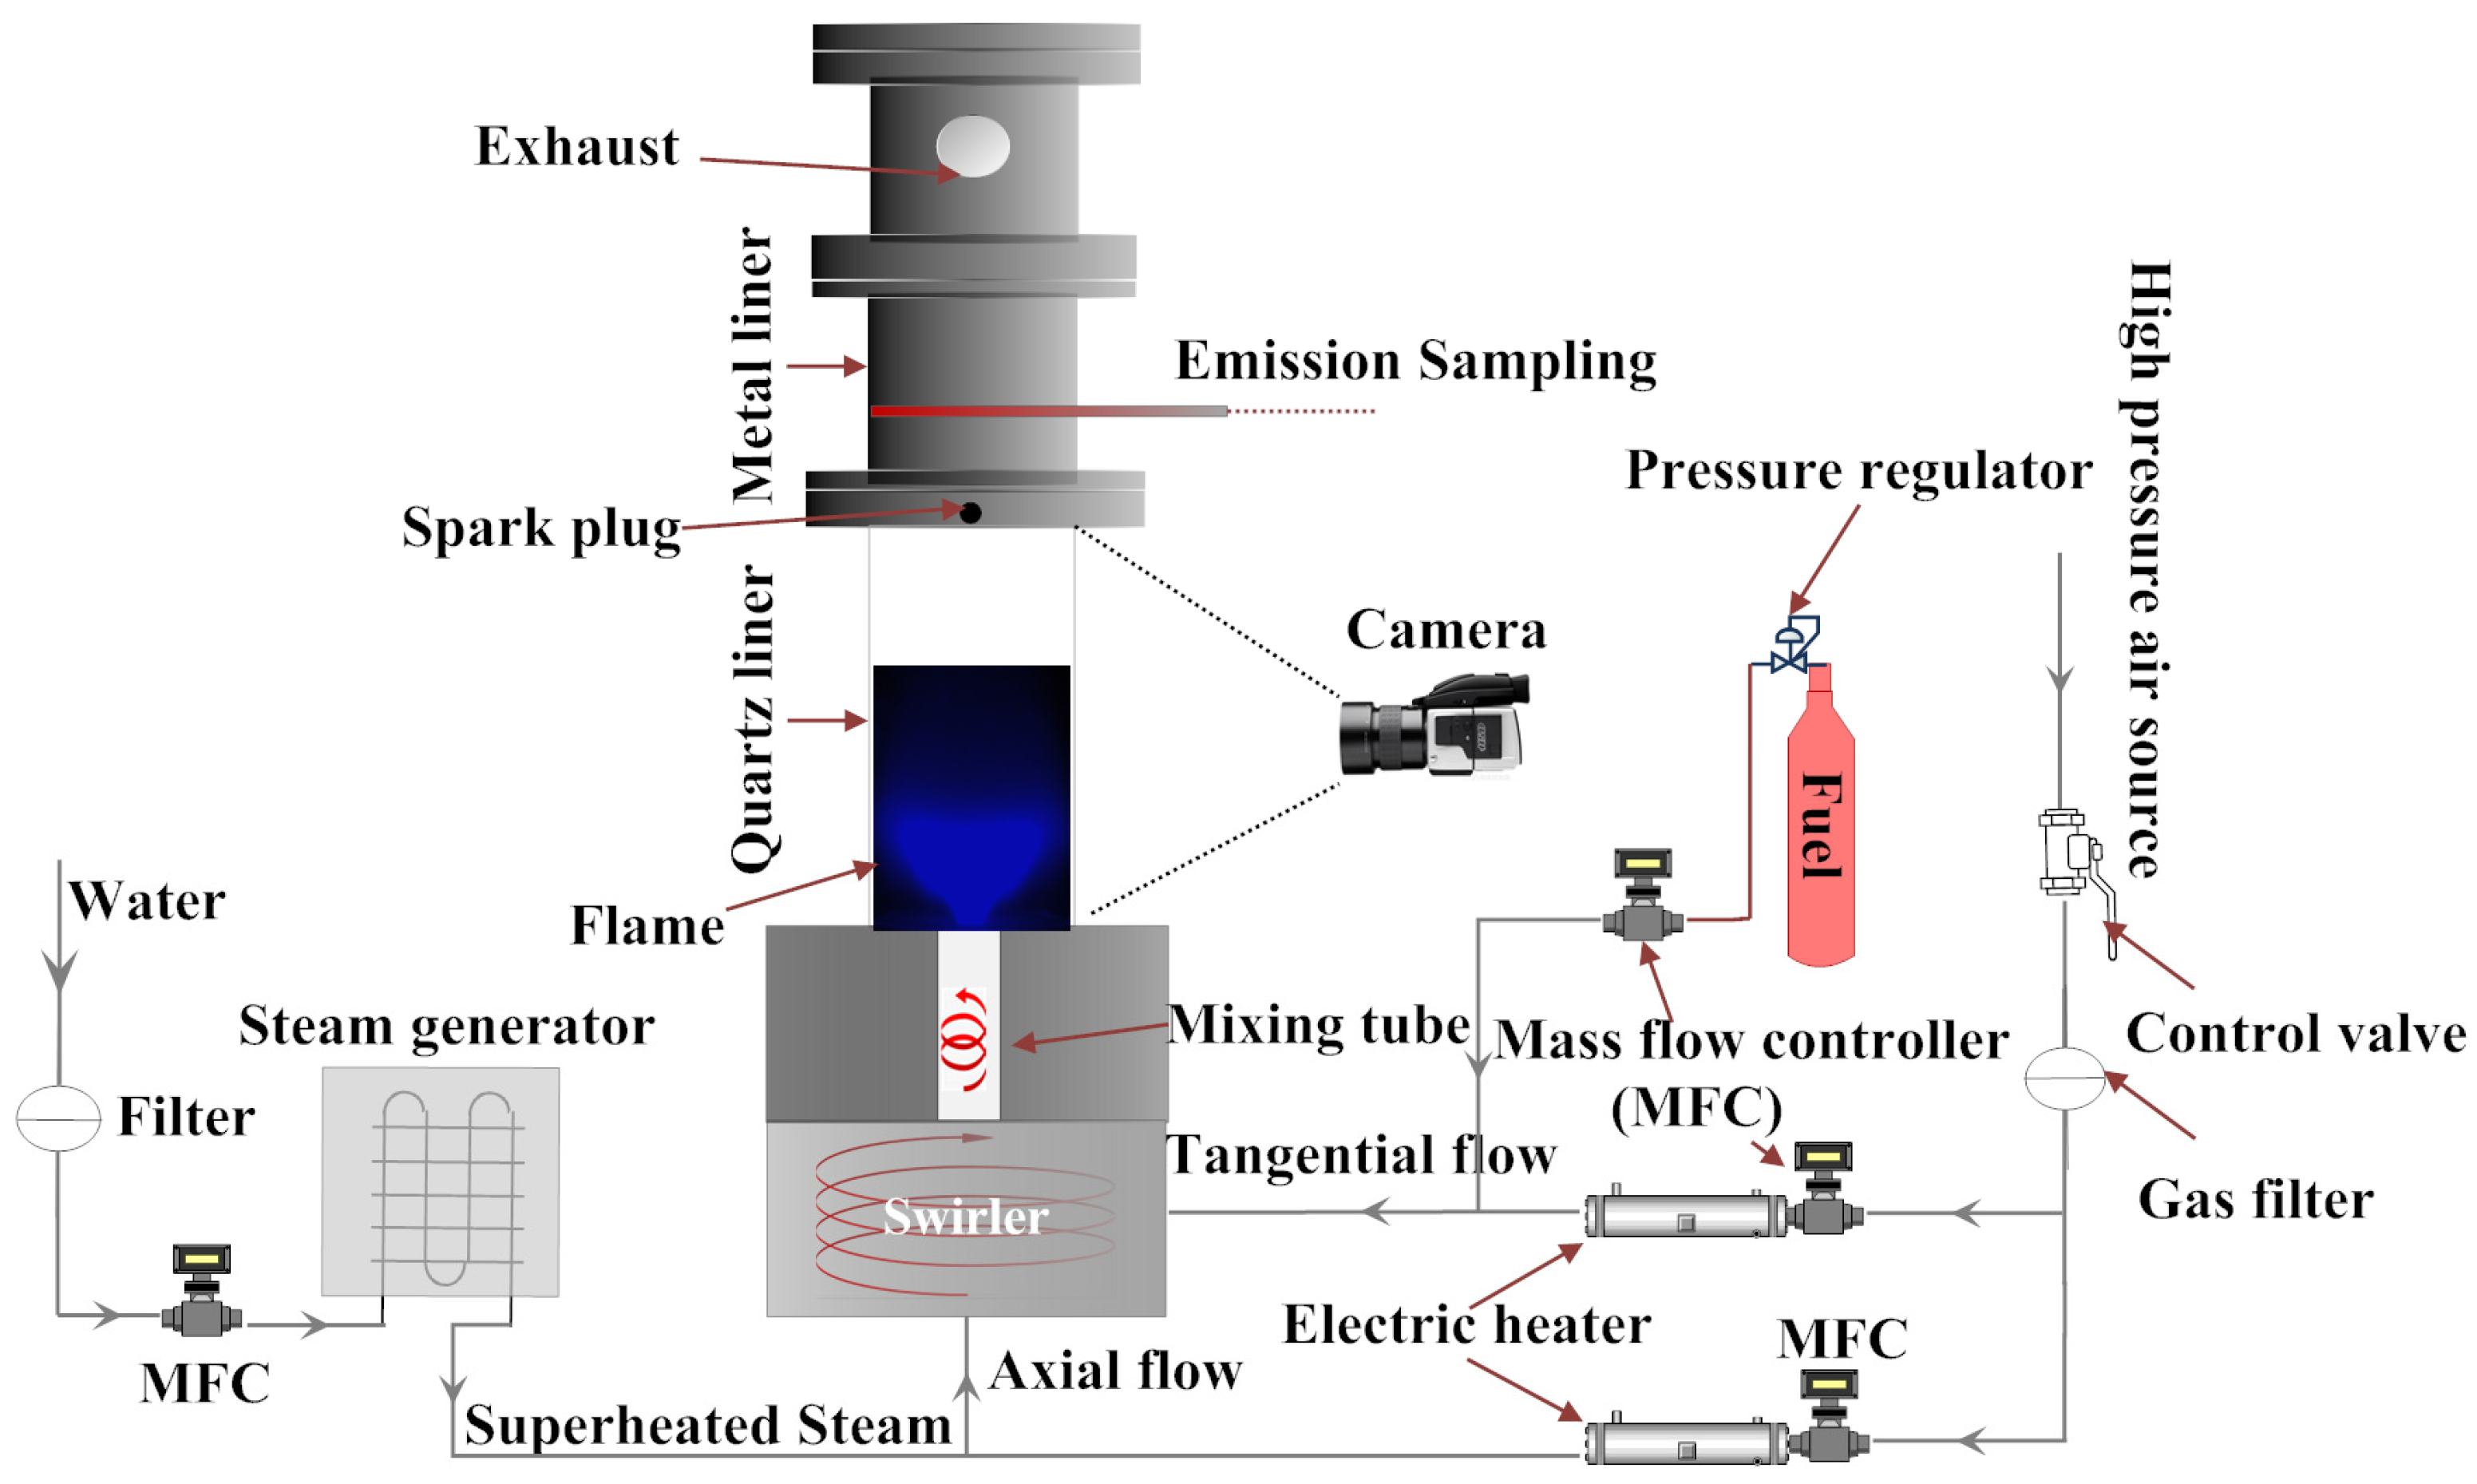
The experimental equipment and flow paths designed for the present study is shown in Figure 1. The combustor is supplied by two air streams and one fuel source. The air fed into the combustor for the flame is supplied from a pressurized lab air source. Both of the axial air stream and radial air stream are metered and controlled with differential pressure mass flow controllers (MCR250, Alicat Scientific, Tucson, AZ, USA). Pure methane with 99.98% purity is used as the fuel and it is supplied from pressurized gas bottles. The fuel stream is metered and controlled by a differential pressure mass flow controller (MCR50, Alicat Scientific, Tucson, AZ, USA). After this, the fuel is injected at the tangential flow. All reactants were mixed in the swirler, which is followed by a 60 mm long mixing tube, and then supplied to the combustor. For all the experiments, the total air mass flow rate stayed constant. Different equivalence ratios (Ф) were achieved by adjusting the setting value on the fuel mass flow controllers (MFC). The equivalence ratio used in this work is defined as:
where represents the mass flow rate, suffix stoi stands for the stoichiometric conditions.
In order to obtain a desired combustor inlet temperature, the two air streams are preheated individually by using two feedback controlled air heaters (Sureheat Jet, Sylvania, Exeter, NH, USA) of 8 kW power. A K-type thermocouple with a diameter of 1.5 mm and uncertainty of 2 K was employed in the measurement to detect the combustor inlet temperature. A force-ventilated extractor hood was used during the experiments to discharge the exhaust gases generated from the combustor.
2.2. Combustor and Swirler
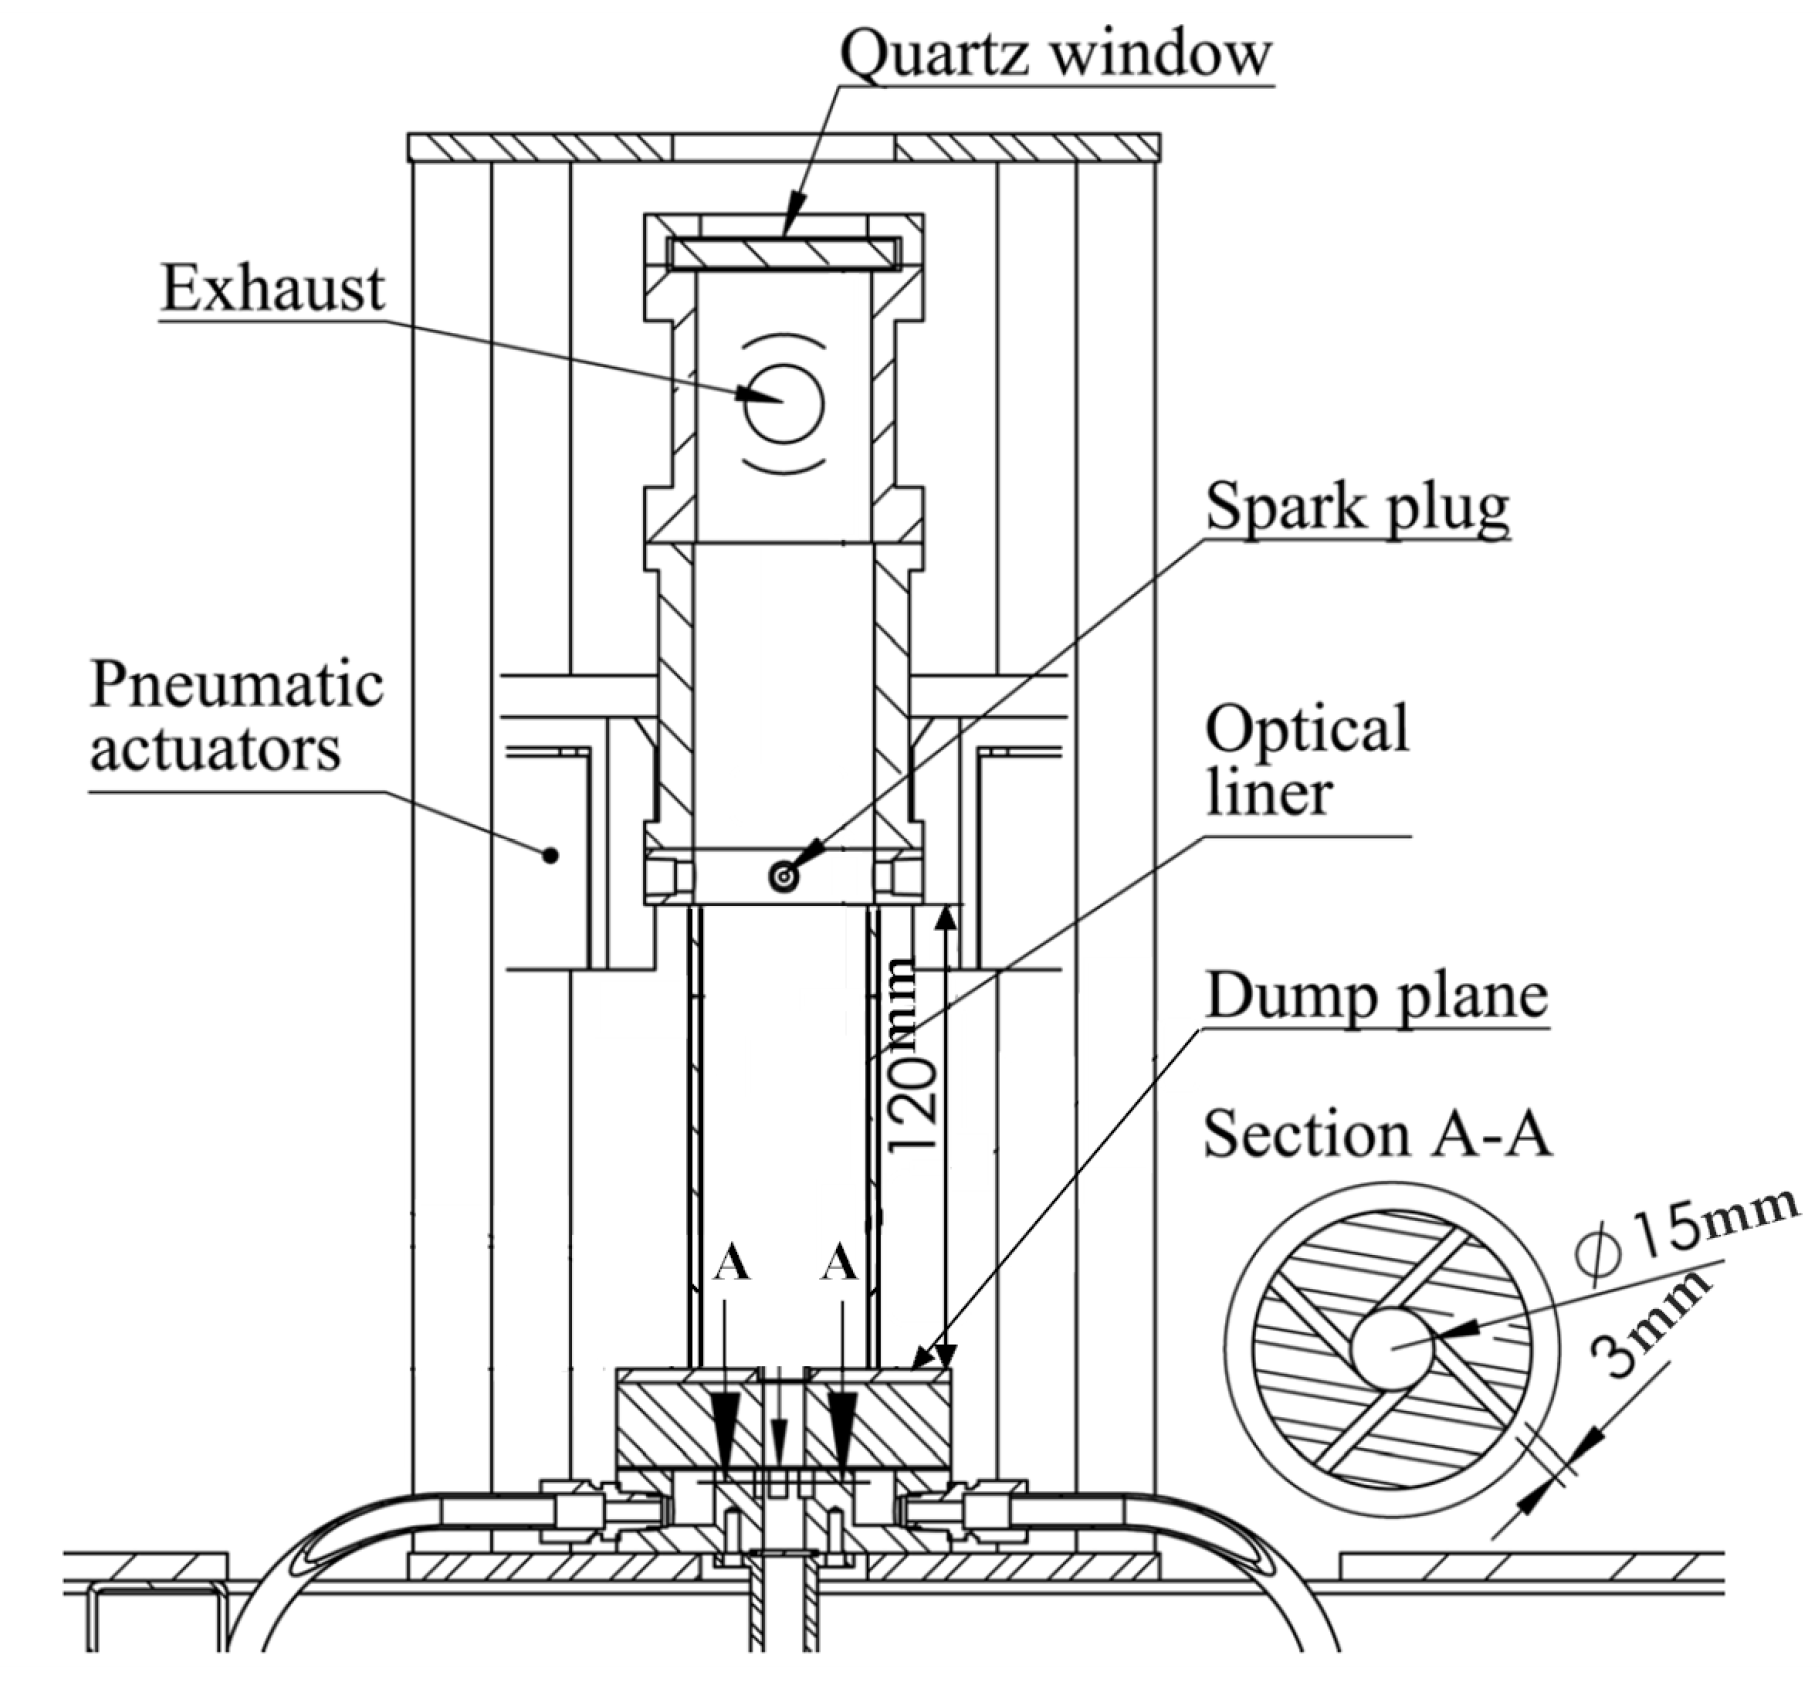
The combustor with an overall length of 350 mm is mounted on a pneumatic actuator system (shown in Figure 2). The inner surface of the combustor is a cylindrical shape. The liner of the combustor consists of two sections. With respect to the direction of the mean flow, the downstream section is made of metal, while the upstream section is 120 mm length quartz liner which provides the possibility for flame visualization and optical measurement.
A swirler is mounted upstream of the combustor entrance. One air stream comes into the swirler from the axial direction and the other air stream comes into the swirler from the radial direction. The axial air flow, before coming into the swirler, passes through a sintered flow straightener which consists of two pieces of sintered stainless steel disc with an average porosity of 200 µm. The air flow entering the swirler in the radial direction passes through four channels that are 3 mm wide and 10 mm high. In the swirler, the two air streams are combined with adjustable proportions and then supplied to the combustor. Different flow field patterns may be formed in the combustor according to different radial-axial mass flow ratios. For the purpose of describing the swirl strength quantitatively, the non-dimensional swirl number is defined [20]:
where S is the swirl number, is the axial flux of the radial momentum, R is the radius of the swirler and is the axial flux of the axial momentum. and in the above equation can be calculated as:
where is the gas density, is the axial velocity, and V is the radial velocity. In order to determine the swirl number for different flow condition, the axial and radial velocity profiles were measured with laser Doppler anemometry (LDA) in a previous work, and a relationship between the radial to axial momentum ratio and swirl number was established [21].
2.3. Steam Generation and Addition
In the present study, a direct-through heat exchanger was used as a steam generator. Ten Omega LDC00261 low-density cartridge heaters (Omega, Stamford, CT, USA) were mounted in the steam generator which provides a total maximum electrical power of 3 kW. By routing the water through multiple passes in the heat exchanger, the water was heated into steam. The steam mass flow rate was adjusted by controlling the water mass flow rate using a precision water flow controller (LC series, Alicat Scientific, Tucson, AZ, USA) with an assumption that the steam mass flow rate equals the water mass flow rate in an equilibrium state. The superheated steam temperature at the outlet of the steam generator is adjustable. An auto-tune temperature and process controller (CN63200-F1-AL, Omega, Stamford, CT, USA) was used to control and set the temperature. In order to describe the steam addition intensity in the methane-air flame, a non-dimensional number, which is the steam fraction , is defined as:
where and is the steam and air mass flow rate. The steam was added into the axial air flow upstream of the swirler. Injecting steam only into the axial air flow will influence the radial to axial mass flow ratio. According to the previous investigation of the LBO limits of methane with the same experimental setup [21], the LBO equivalence ratio was not affected within the variation range of the radial to axial mass flow ratio used in the current study.
2.4. Emission Measurement and LBO Limits Determination
The emission system consists of a Rosemount Oxynos 100 paramagnetic O2 gas analyzer, a Rosemount Binos 100 NDIR (non-dispersive infrared photometers) CO/CO2 gas analyzer. The measurement range for O2, CO, and CO2 are 0–20.95%, 0–900 ppm, and 0–16%, respectively. According to the instrument specification, the estimated measurement uncertainties are 0.17 × 10⁻² for O2 measurement, 0.1 × 10⁻² for CO2 measurement, and 5 ppm for the CO measurement. A water-cooled combustion exhaust gas sampling probe is mounted at the combustor exit. The emission probe is designed with multiple holes which can ensure an average sampling of the combustion products. To avoid condensing in the gas analyzer, collected sample gas was directed into a cooler where a simple condensation process was utilized to remove water vapor in the sample gas. In order to minimize measurement errors, the emission gas analyzers were calibrated every time prior to the experiments with standard calibration gases.
The LBO limit for a certain flow case was achieved by gradually turning down the fuel flow (reduce equivalence ratio) until the CO emission concentration in the combustion products reached 200 ppm and the equivalence ratio at this moment was defined as the lean blowout limit. In the process of approaching the LBO limits, the decrease of the fuel flow could be conducted by larger steps until the flame became unstable. Then the reduction of the fuel flow proceeded with a step of 0.006 in the equivalence ratio, which is the smallest possible step of the mass flow controller. The operating conditions of the experimental measurements are presented in Table 1.
2.5. Flame Visualization with the CH Chemiluminescence Imaging
A CCD camera (D70s, Nikon, Tokyo, Japan) equipped with an AF Nikkor lens (50 mm/F1.8D, Nikon, Tokyo, Japan) and a band-pass CH filter (430/10, LaVision, Göttingen, Germany) was used to record the time-averaged CH chemiluminescence images for CH4/air and CH4/air/steam flames. All the images were recorded with an exposure time of 0.77 s and a resolution of 3008 × 2000 pixels. The aperture was set into f/1.8 throughout all the experiments. In order to acquire CH intensity distribution on the cross section of the combustor according to the projection images, the inverse Abel transform was performed to reconstruct the CH images.
2.6. Chemical Kinetics Simulation
Chemical kinetics simulation was included in the present work to provide more extensive information, e.g., the adiabatic flame temperature, laminar flame speed, and flame thickness, for the combustion process. The computation was carried out by using Chemkin-Pro software package and the GRI-Mech 3 mechanism [22].
3. Results and Discussion
3.1. The Steam Addition Effect on the LBO Limits
In general, injecting steam into the combustor leads to three factors which may influence the LBO limit:
- To heat up the steam, it takes extra energy from the combustion, which will decrease the flame temperature. The stronger radiation ability of steam may increase the heat loss of the flame.
- The steam addition decreases the concentration of all the reactants, which results in a lower reaction rate for the same equivalence ratio compared to the combustion case without steam addition.
- The added steam increases the total mass flow rate, therefore, the flame residence time in the combustor will be reduced.
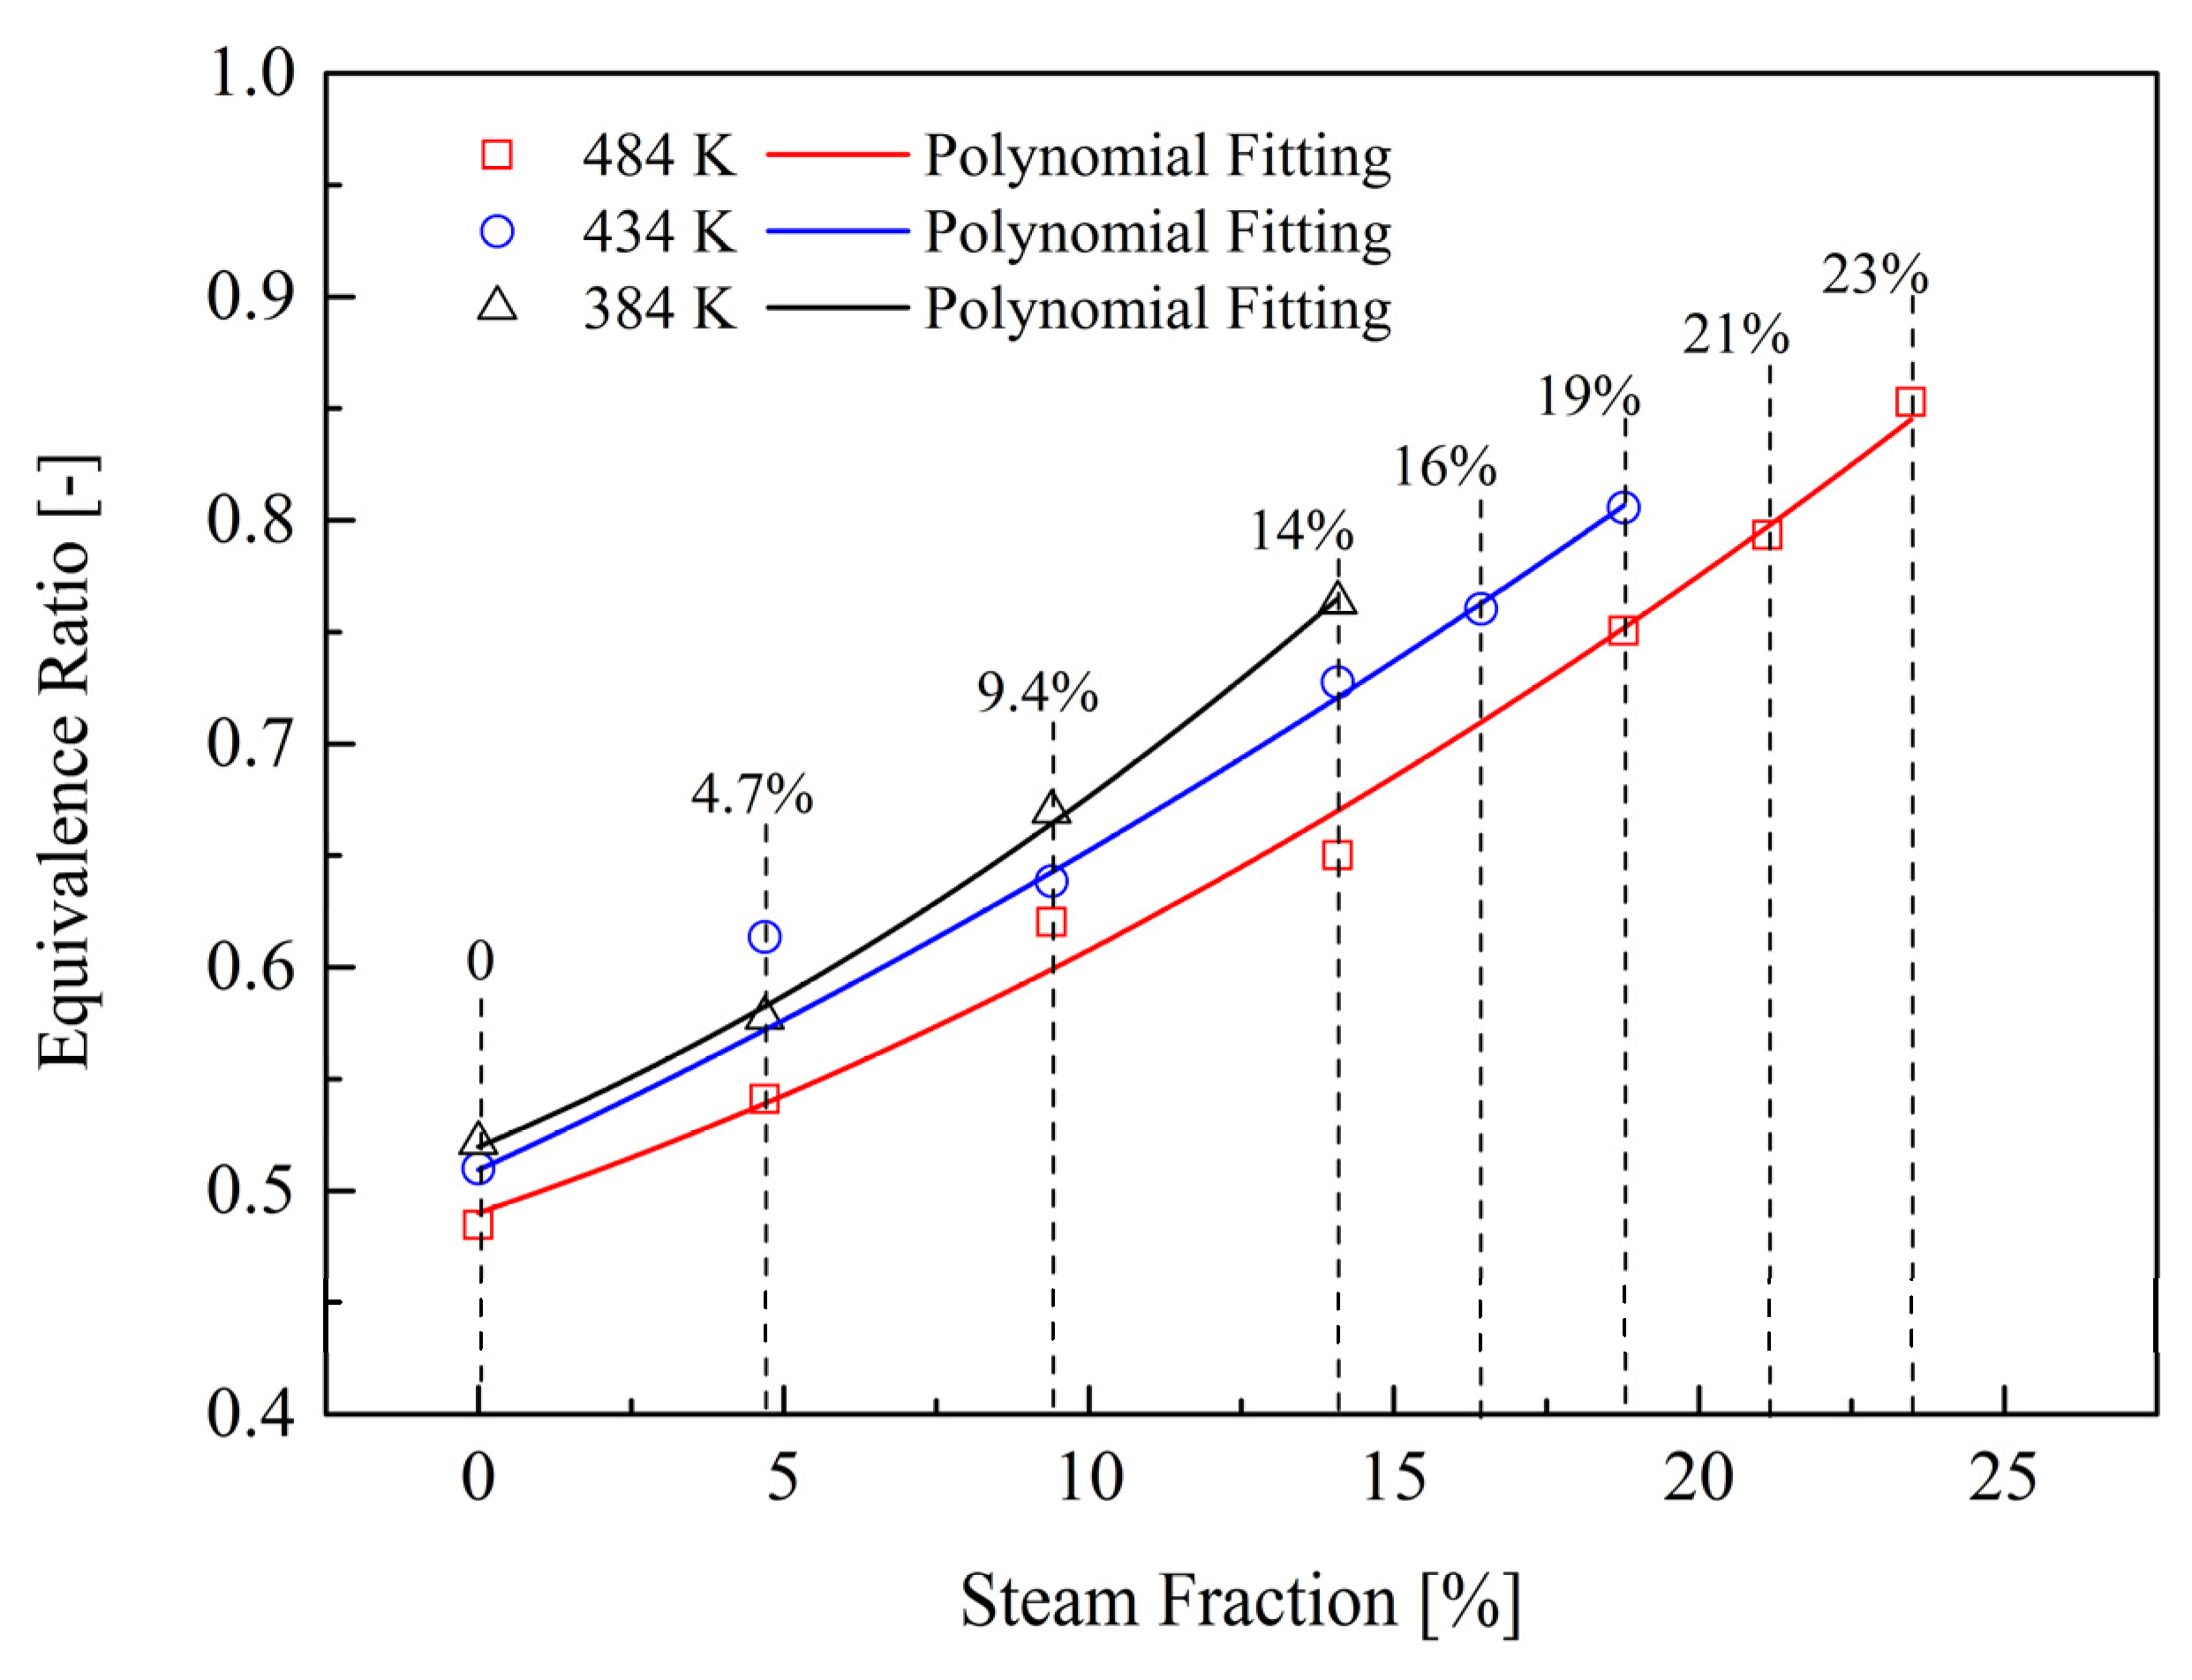
Figure 3 shows the LBO equivalence ratios as a function of the steam fraction for three inlet temperatures. In each inlet temperature, the steam fraction was initially increased in a step of 4.7%, and then in a smaller step until the steam fraction was above the steam capacity limit. Here, the steam capacity limit is defined as the critical steam fraction, above which CO emissions are higher than the normal value regardless of the equivalence ratio. The polynomial fitting curve was plotted to show the trend for each group of data. It can be observed in each inlet temperature that the LBO equivalence ratio increased along with the steam fraction monotonously. A higher combustor inlet temperature can lead to a lower LBO equivalence ratio at the same steam fraction, which then results in a wider combustion operation range.
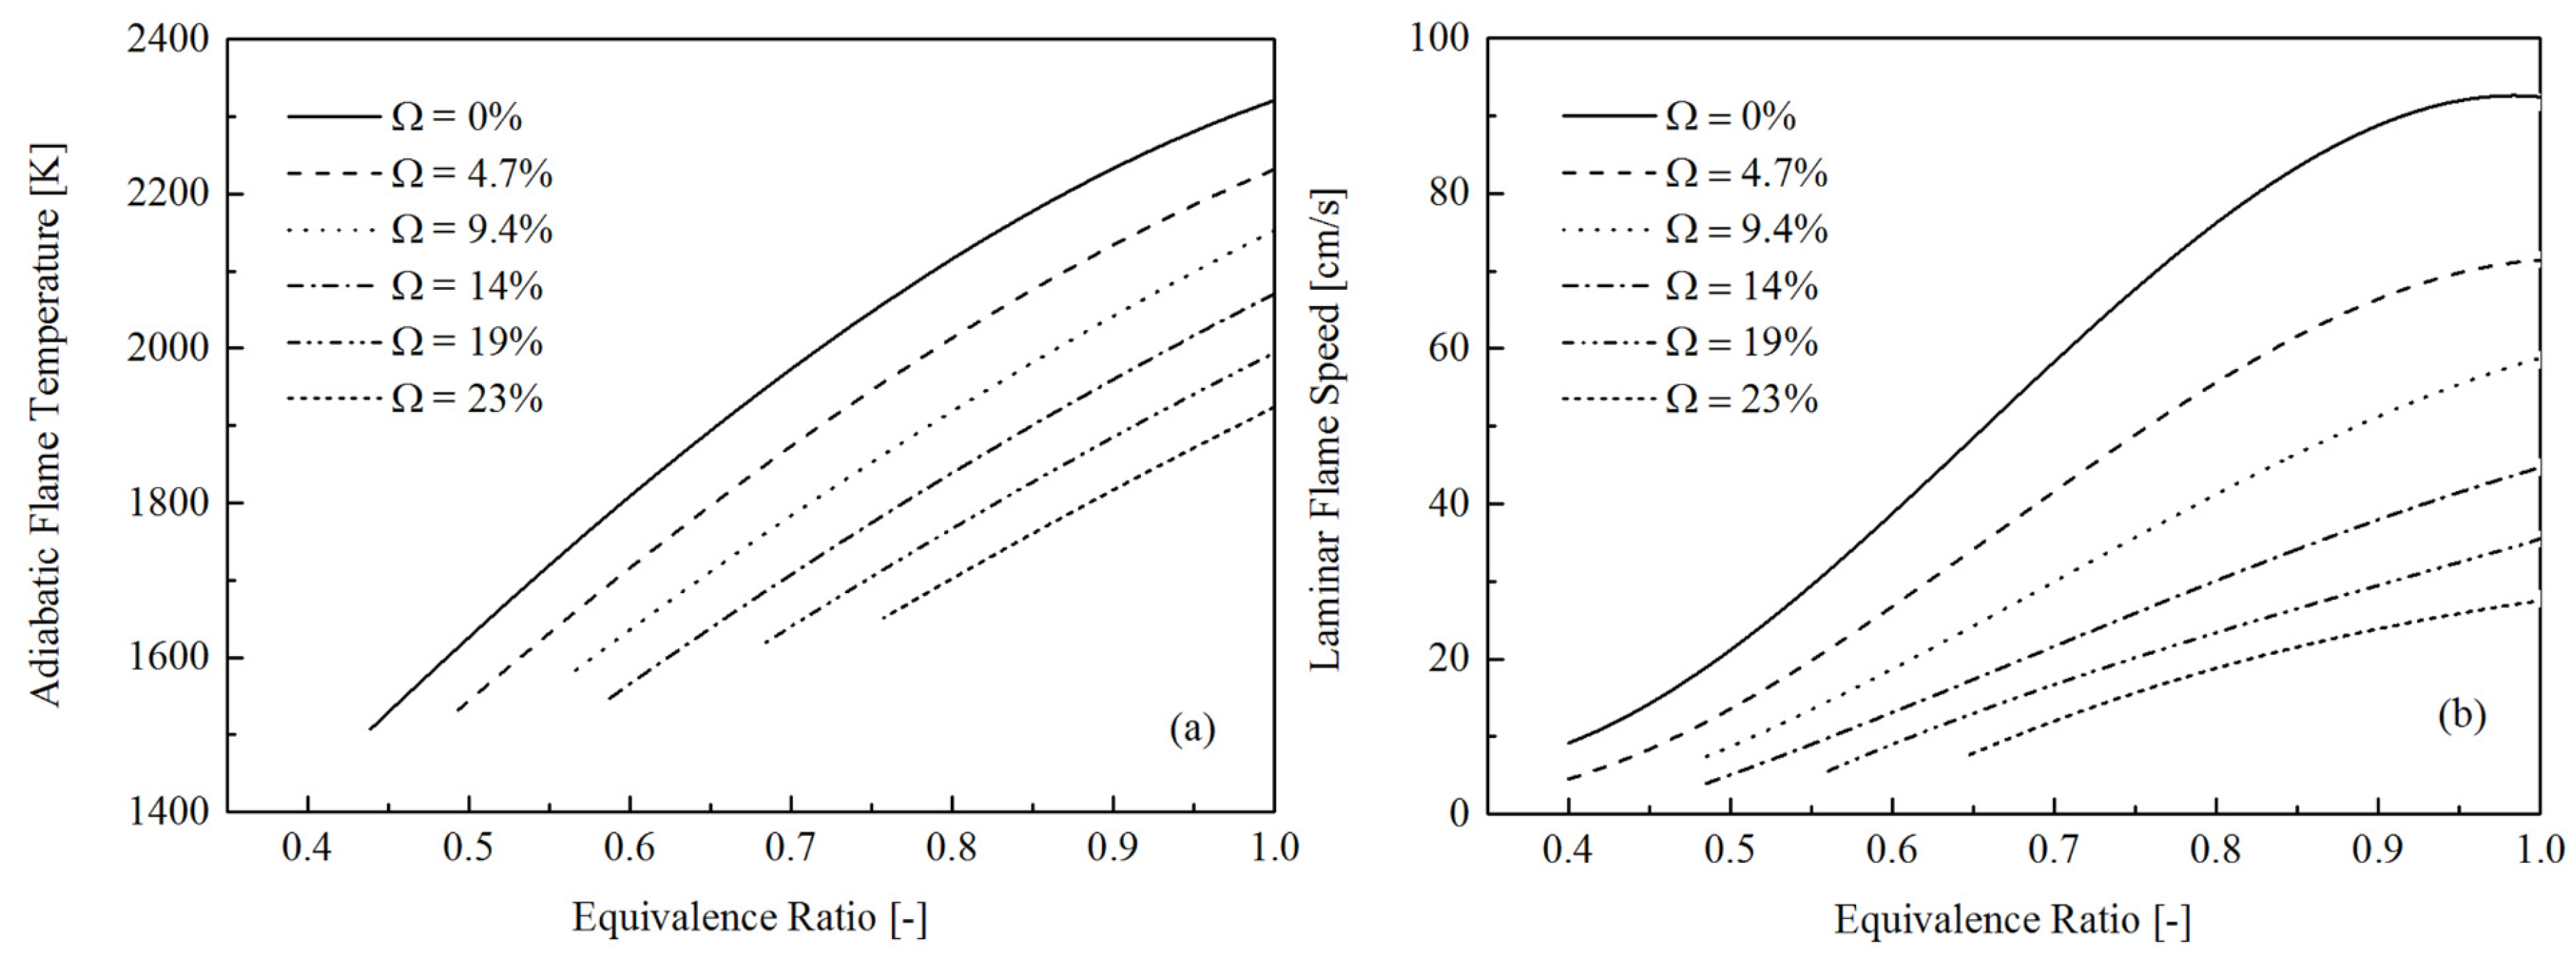
The steam influence on LBO in Figure 3 can be understood based on the flame temperature and flame velocity. The LBO can occur when the flame fails to propagate or the flow velocity exceeds the flame velocity. Due to the steam addition, the adiabatic flame temperature was decreased (Figure 4a). In order to maintain the flame propagation, higher equivalence ratios were, hence, required to provide sufficient heat release and radicals. In the experiments, the steam addition increased the flow velocity, but it led to a lower flame velocity at the same equivalence ratio compared to the methane/air flame (shown in Figure 4b). In order to sustain the flame in the combustor, the flame velocity must match the flow velocity at the anchored location within the combustor (or the residence time must be enough for completing the chemical reactions). Hence, the flame has to move to a higher equivalence ratio to reach a higher flame velocity. As a result, a dependence of LBO limits on different steam fractions was obtained, as is shown in Figure 3.
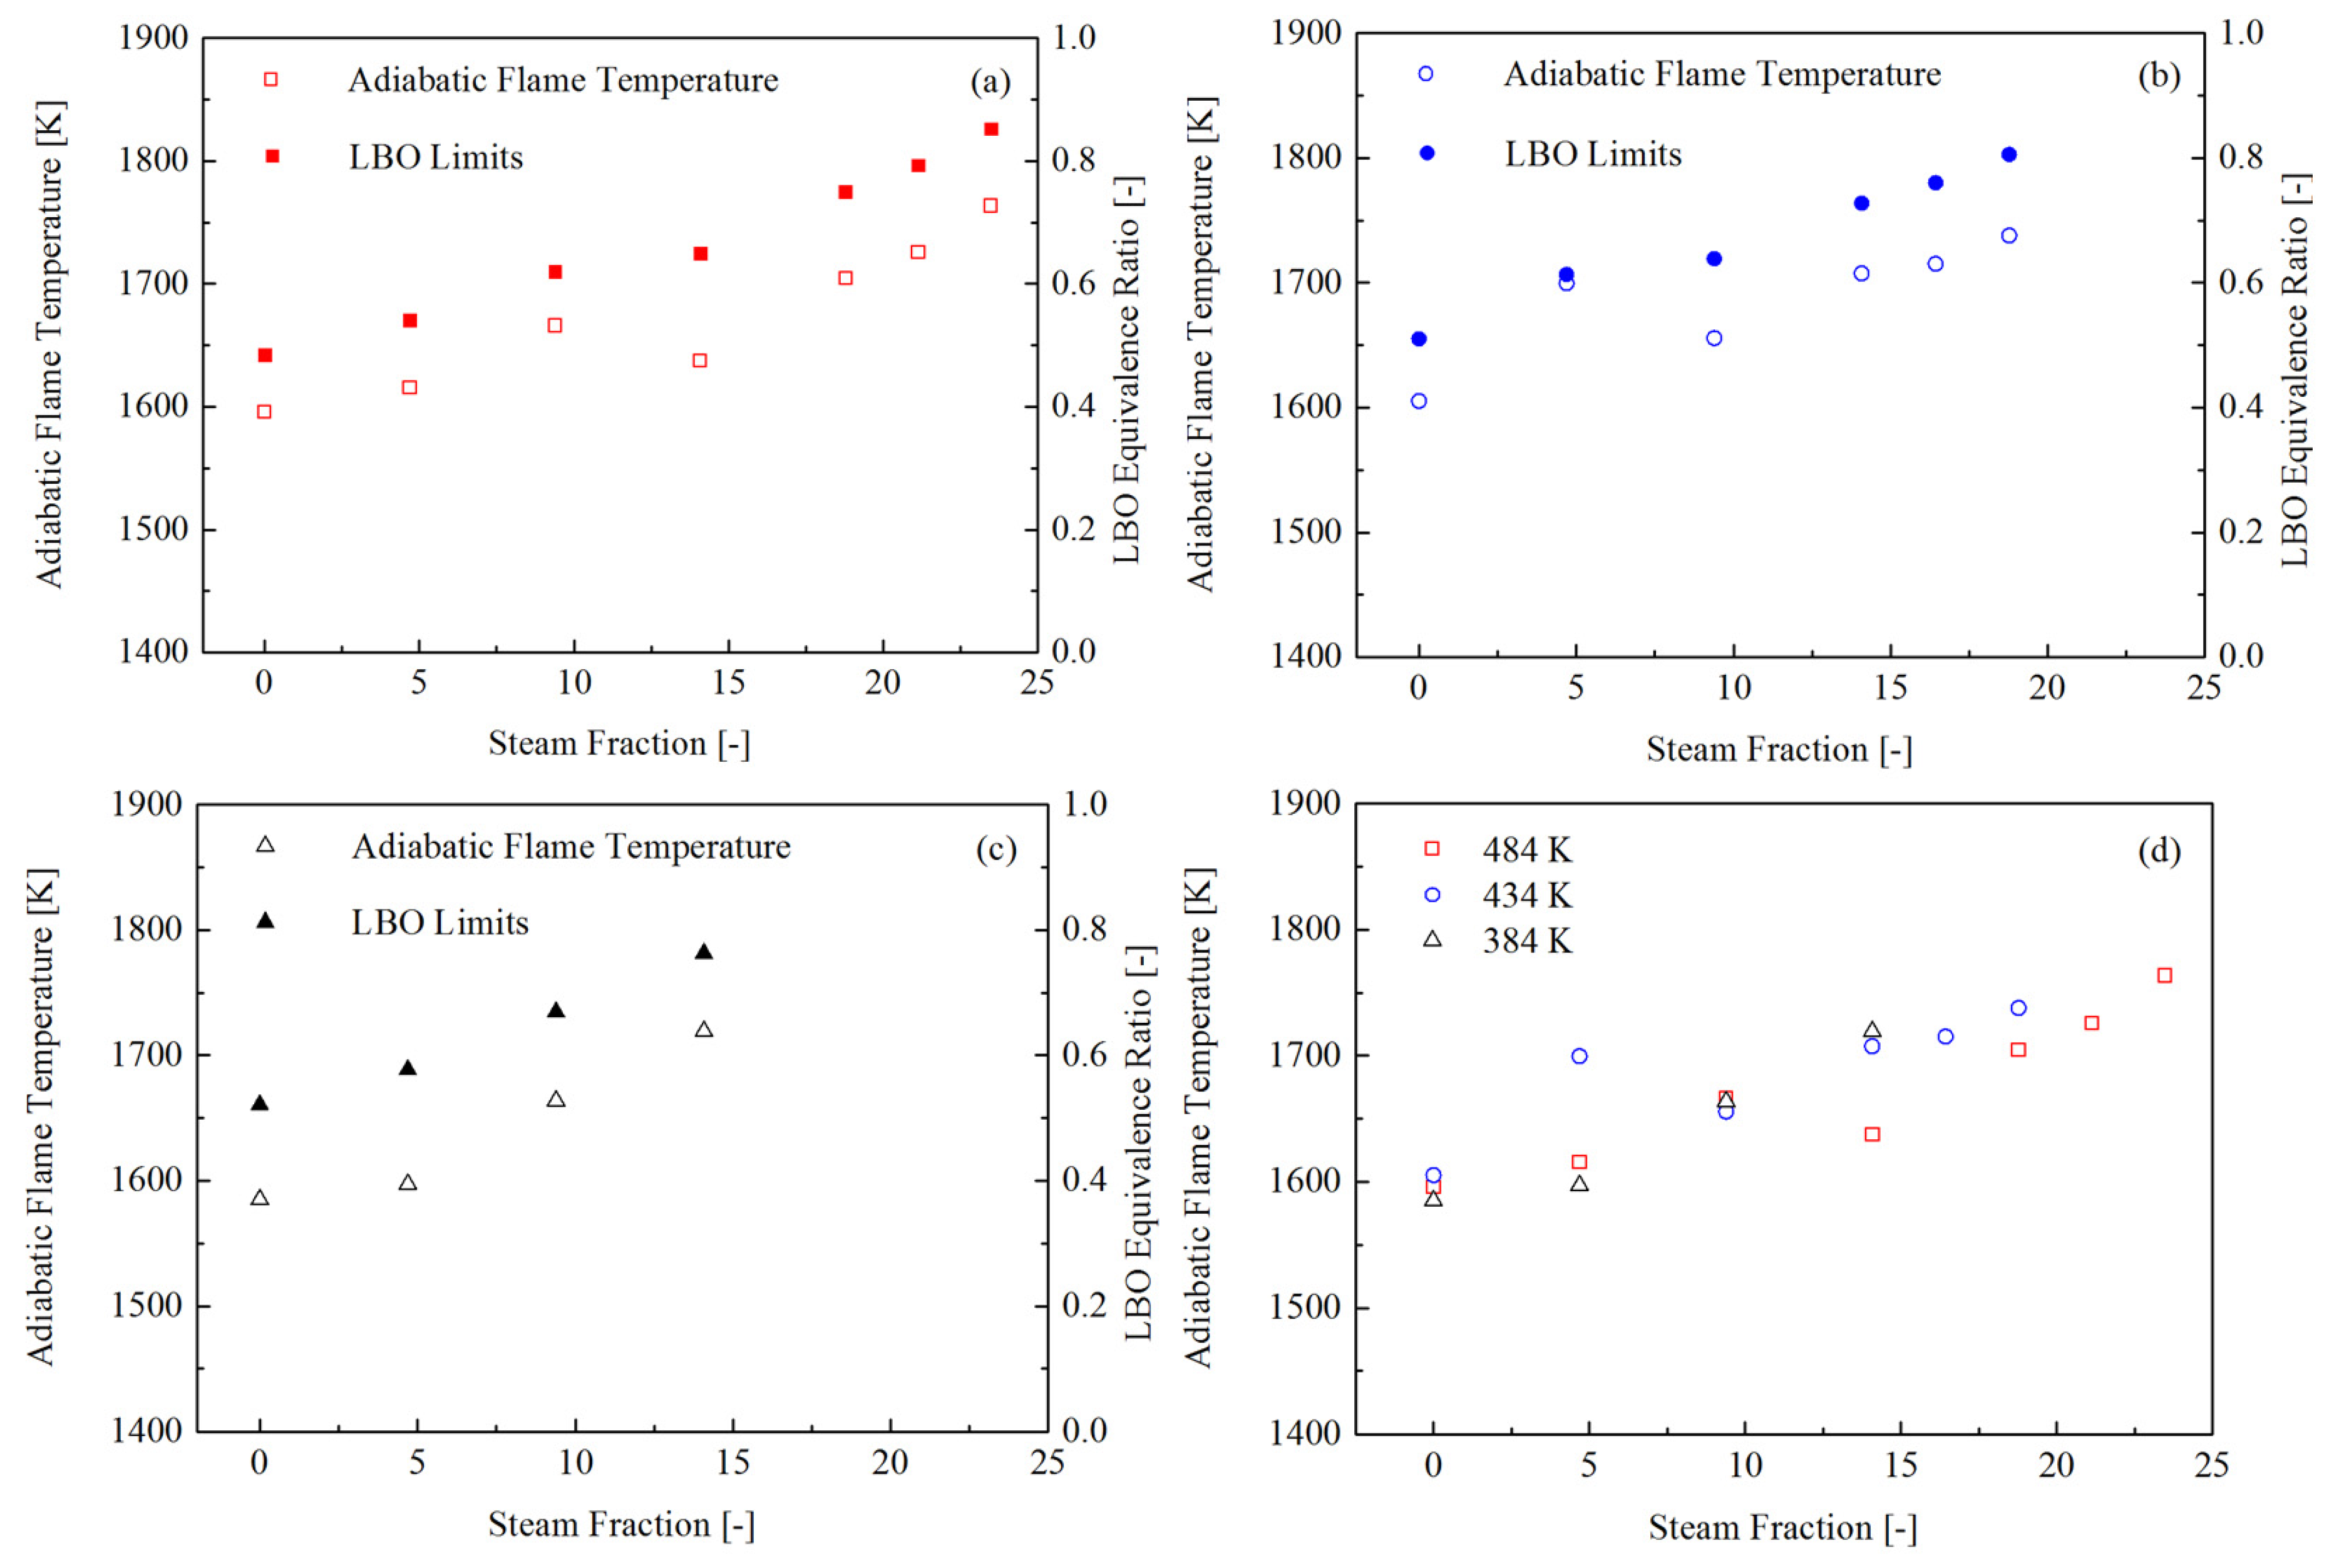
The LBO adiabatic flame temperature for different steam fractions was investigated using an equilibrium reactor. Adiabatic flame temperature and the corresponding equivalence ratios at LBO are plotted in Figure 5. It was found that the adiabatic flame temperature of the LBO limits increased monotonously with the steam fraction in all inlet temperatures (Figure 5a–c). In addition, it was also observed in Figure 5d that for a given steam fraction, the LBO tended to occur at the same adiabatic flame temperature regardless of combustor inlet temperature. When LBO occurred, the low flame temperature could lead to a flame speed that was too low to sustain at the stabilized location. It could also be sufficiently low to terminate the chain initiation reactions and the chain branching reactions. According to Figure 5d, it could be concluded that the LBO was not caused by insufficient flame velocity, since, in the experiment with inlet temperature 484 K, the combustor inlet flow velocity should be higher than the experiment with 384 K. If the LBO was led by insufficient flame speed, then a higher adiabatic flame temperature should be required to match the higher combustor inlet flow velocity. However, this trend was not shown in Figure 5. Therefore, what most likely happened at LBO was that the temperature was too low, so the chain branching reaction is slower than the chain terminating reactions.
The Damköhler number and equivalence ratio flammability boundary limits were studied in the current study. The Damköhler number was defined as:
which was a time scale ratio between the residence time and the chemical reaction time. The residence time τres used in present study was defined as:
where is the reference volume and is the reference volume flow rate. The reference volume was determined according to previous work [23]. The chemical reaction time was defined as:
where is the flame thickness (the reaction zone thickness) and is the calculated laminar flame speed.
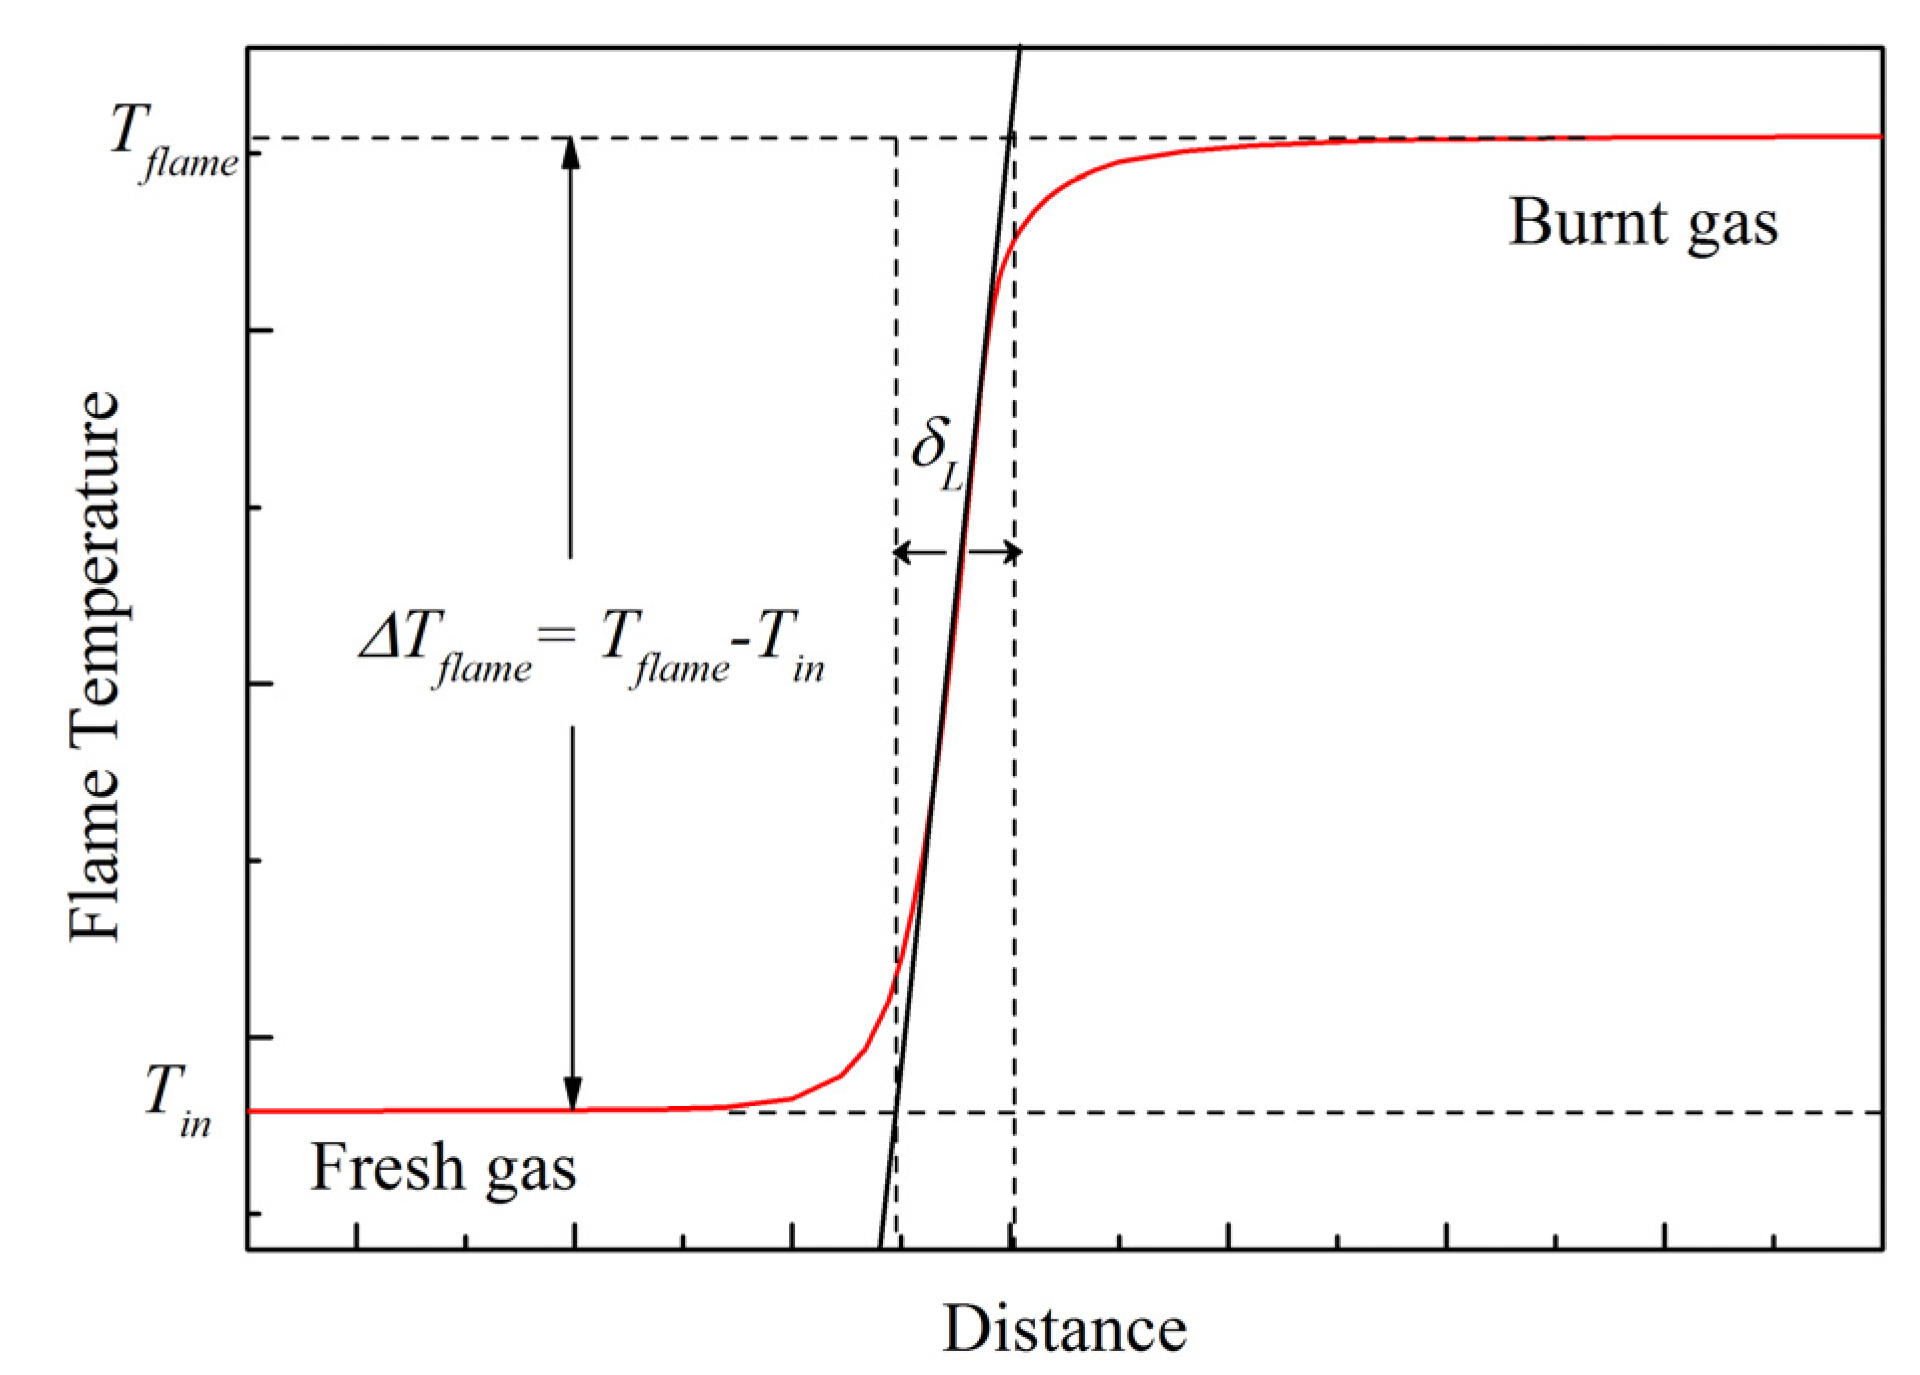
In Figure 6, a laminar flame propagates from right to left. T is plotted as a function of distance. Tflame is the flame temperature and Tin is the unburned reactant mixtures temperature. The flame thickness was obtained by using the temperature profile in Figure 6 and computing the following equation [24]:
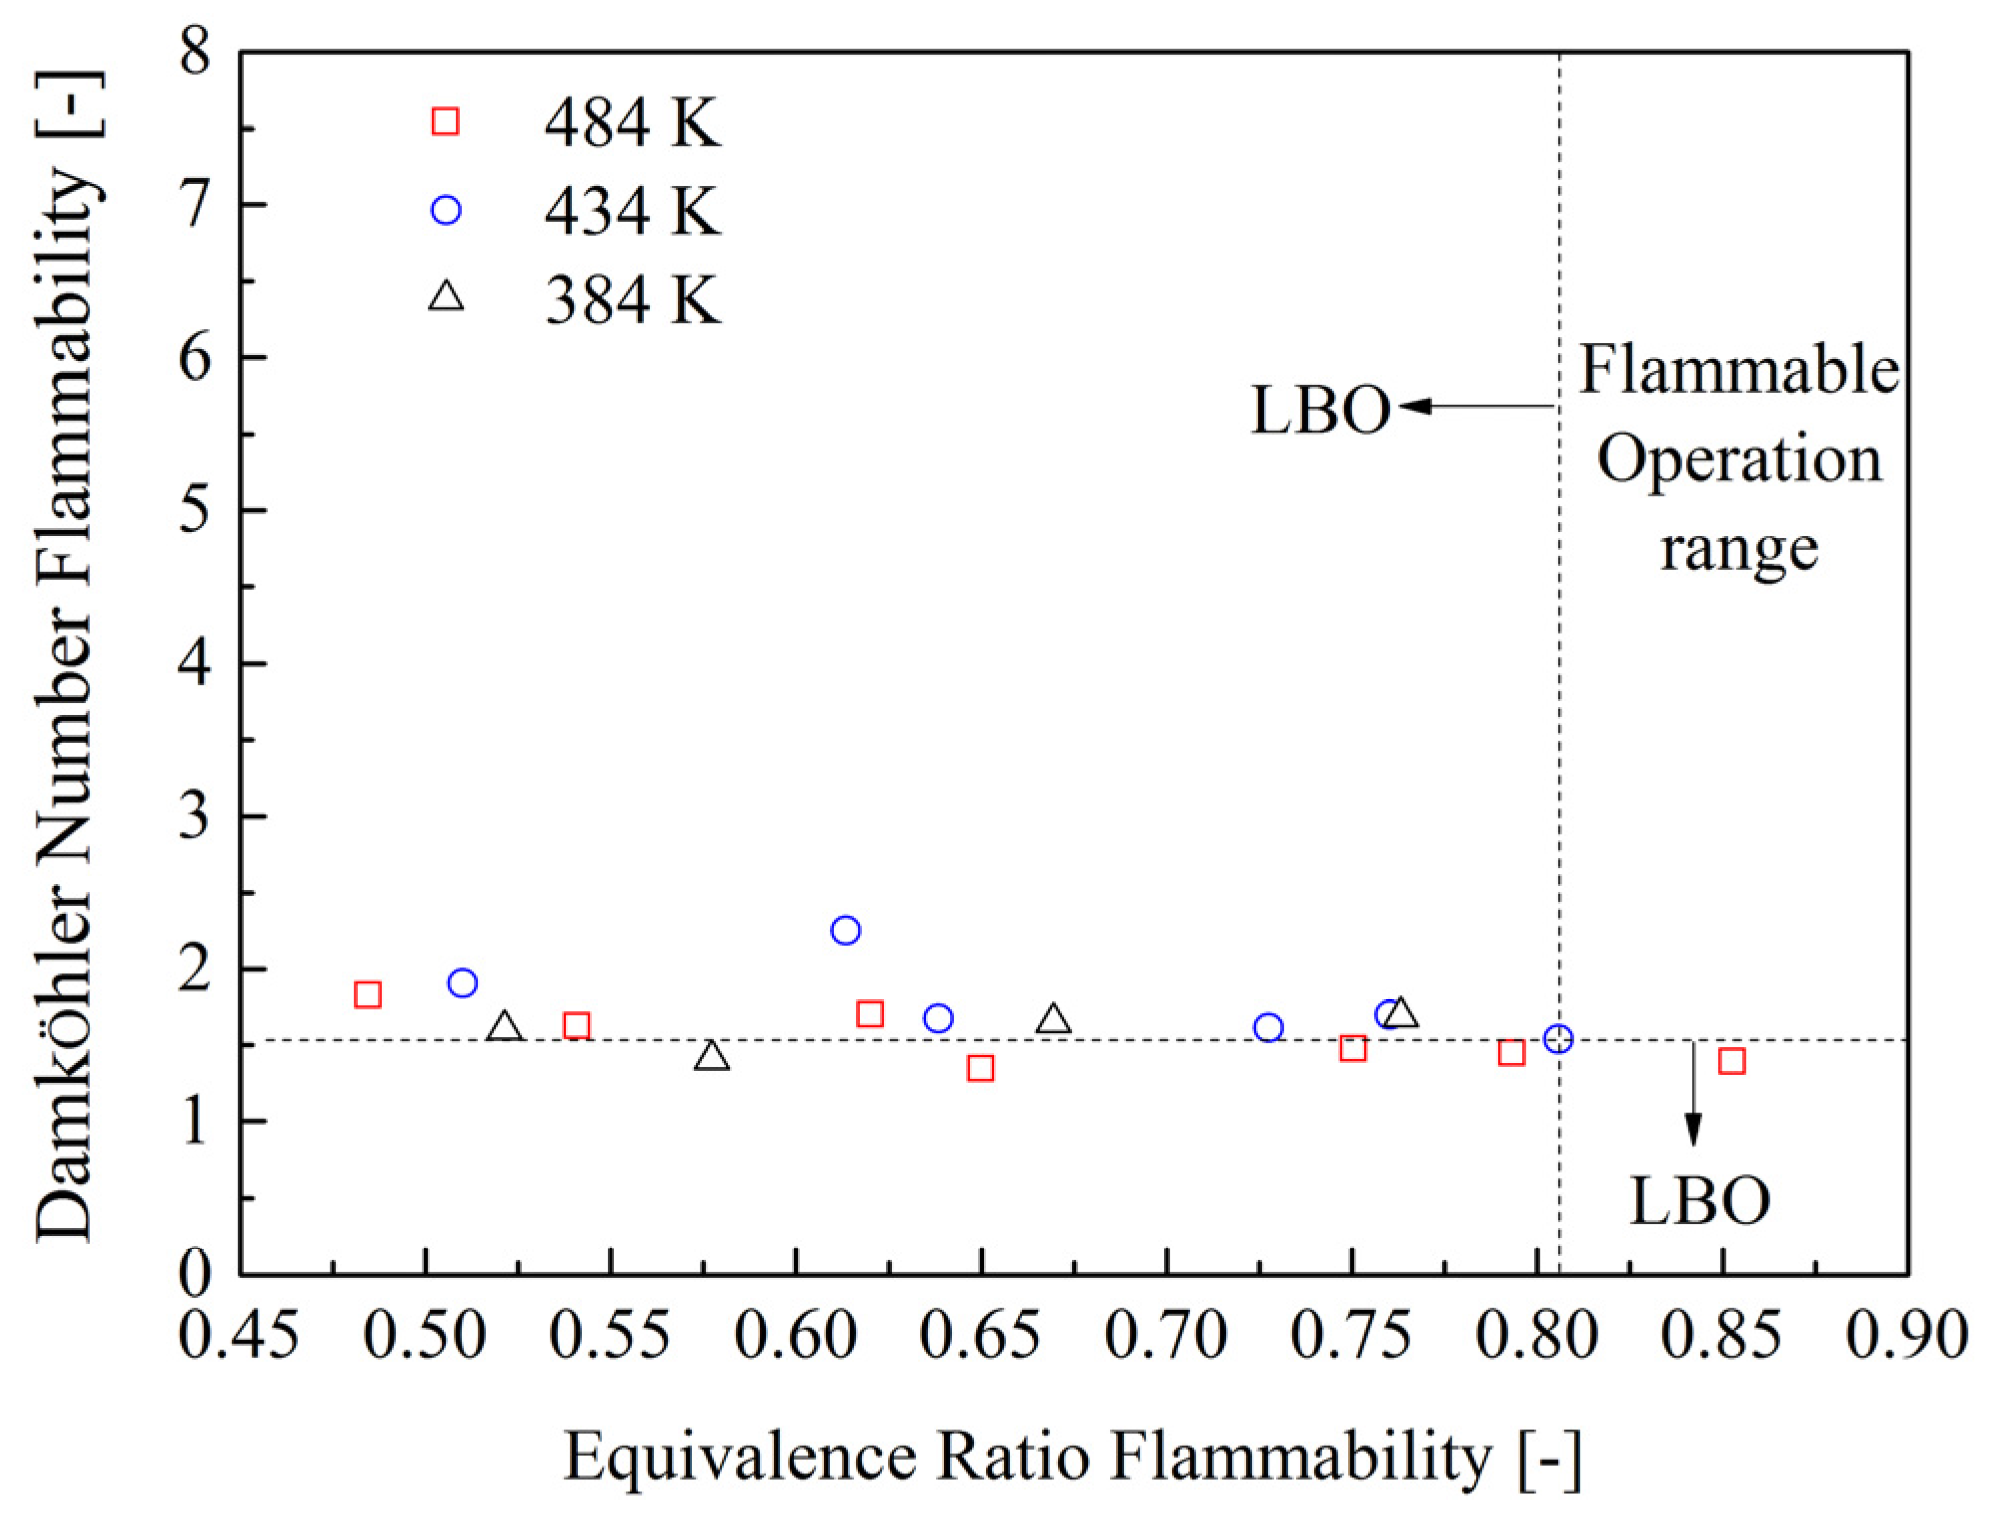
In Figure 7, two flammability limits are presented. The equivalence ratio flammability limit guarantees a high enough temperature to provide sufficient radicals and energy to the reaction zone. When the equivalence ratio decreases to ΦLBO, the flame temperature is too low to ignite the surrounding reactants. The Damköhler number flammability limit ensured an adequate time to complete the combustion. When the Damköhler number is smaller than DaLBO the flame cannot survive in the combustor and is blown out by the combustor. Compared with the LBO equivalence ratio, no significant influence of steam addition on Damköhler number flammability limits was found.
3.2. Flame Visualization
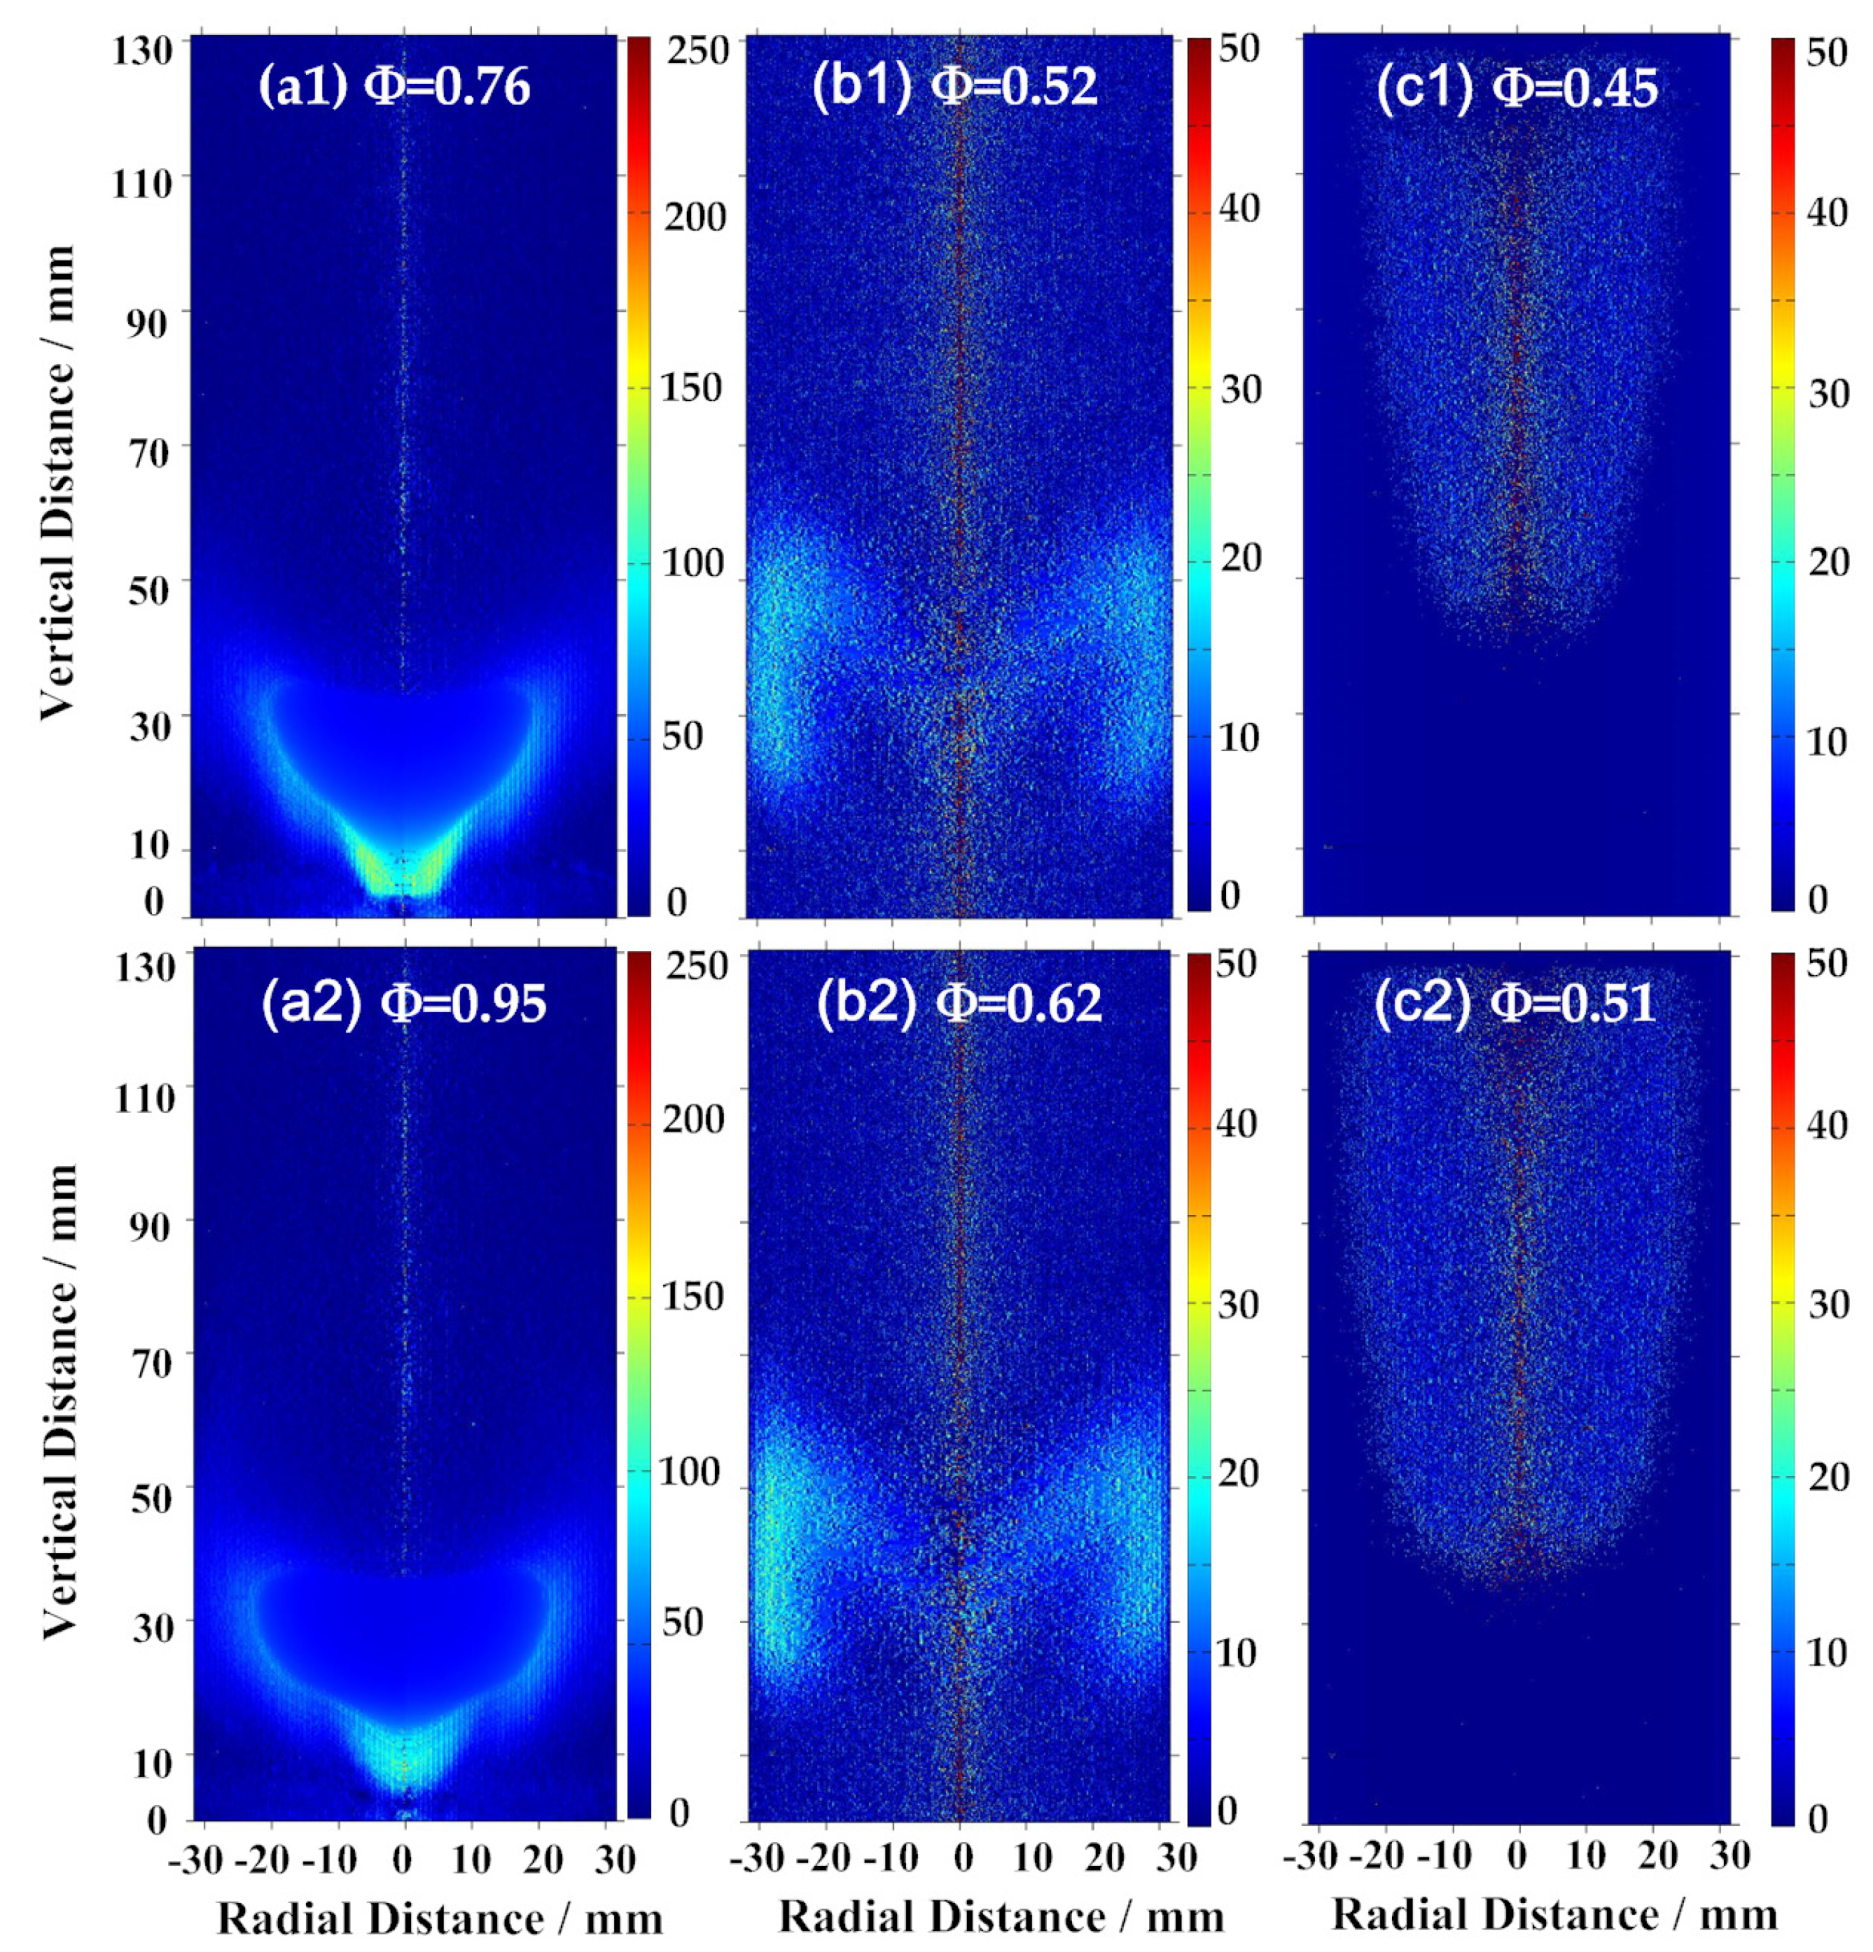
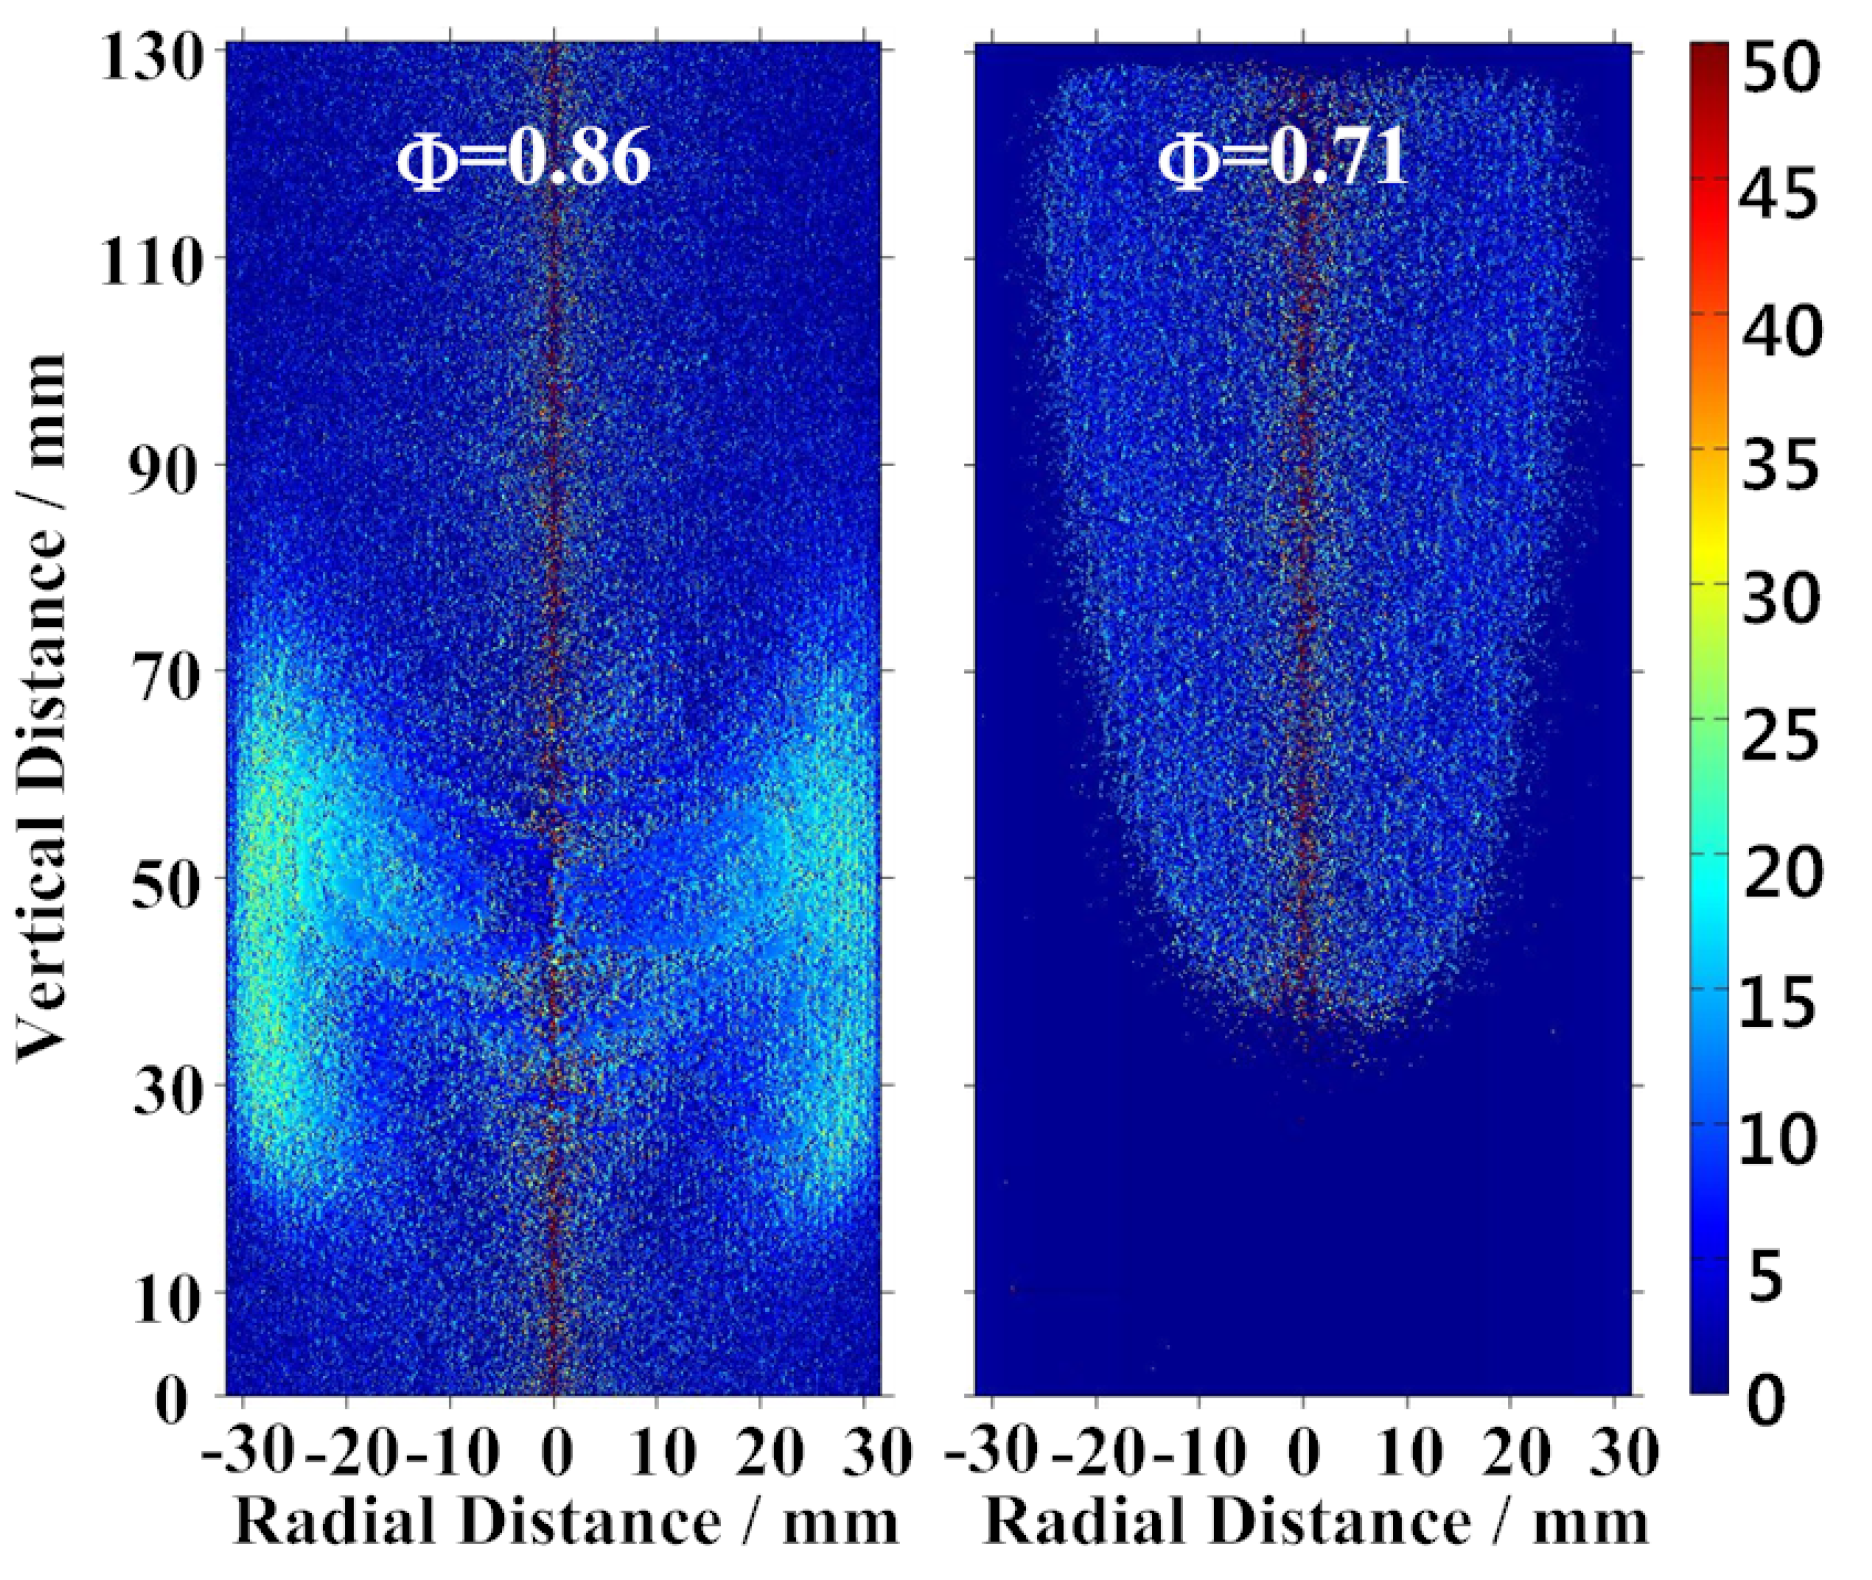
The steam dilution effect on the flame structure and location was studied by using CH chemiluminescence. The directly-acquired CH images were analyzed with the utilization of the inverse Abel transform method and the reconstructed CH images are shown in Figure 8. Different color scales were used for a better display since the CH intensity was too low to observe when the equivalence ratio was close to LBO. In the reconstructed images, the high CH intensity area represented the reaction zone where the fuel and oxidizer are consumed and the active radicals are produced. A comparison of flame structures for Ω = 0 and Ω = 4.7% is shown in Figure 8. When varying the equivalence ratio towards to LBO limits, three distinct categories of flame stabilization were identified for Ω = 0 and Ω = 4.7%. At a sufficiently high equivalence ratio, the flame attached around the edge of combustor inlet and stabilized as the “V” shape with a very short flame length (referred to as a type 1 flame). Once the equivalence ratio was turned down to the critical value, a transition process of the flame stabilized position was triggered, which made the flame detach from the anchored position, move downstream and stabilize as the “M”-shaped flame (referred to as a type 2 flame). This transition process is smooth and quiet without large amplitude oscillation. Decreasing the equivalence ratio further towards the LBO limits resulted in a second transition process of the flame-stabilized position. Unlike the first time, the second transition process was accompanied with noise and evident flame oscillation until the flame stabilized as a longer “V”-shaped flame again (referred to as a type 3 flame) which was shown in Figure 8c1,c2. The type 3 flame was very weak and quiet until the moment when LBO occurred. According to comparison in Figure 8, the combustion with a 4.7% steam fraction could have the same flame structures and locations, but with higher equivalence ratios.
With the increase of the steam fraction, it was observed that not all the steam-diluted combustion conditions have the three categories of flames. In the inlet temperature of 484 K, at a steam fraction larger than 14% and smaller than 23%, only the second and third type of flames can exist in the combustor. The flame structure with the 19% steam fraction was shown in Figure 9. Particular structure differences were not found compared to the results without steam addition (Figure 8b1,c1). However, the ‘M’ shape flame length was increased significantly. Steam capacity was achieved by further increasing the steam fraction. Above the steam capacity, no stabilized flame existed (Figure 10).
The flame’s behaviors were very similar in all inlet temperatures. With a small steam fraction, three categories of flames were observed. Above certain steam fractions, the flame can only stabilize as the second and third flame types. Noise and oscillation were accompanied with the transition process from flame type 2 to flame type 3. When the steam capacity was reached, there is no stabilized flame for the whole operation range. The flame oscillated in the IRZ (inner recirculation zone) with noise until LBO occurred.
3.3. The Steam Dilution Effect on CO Emission
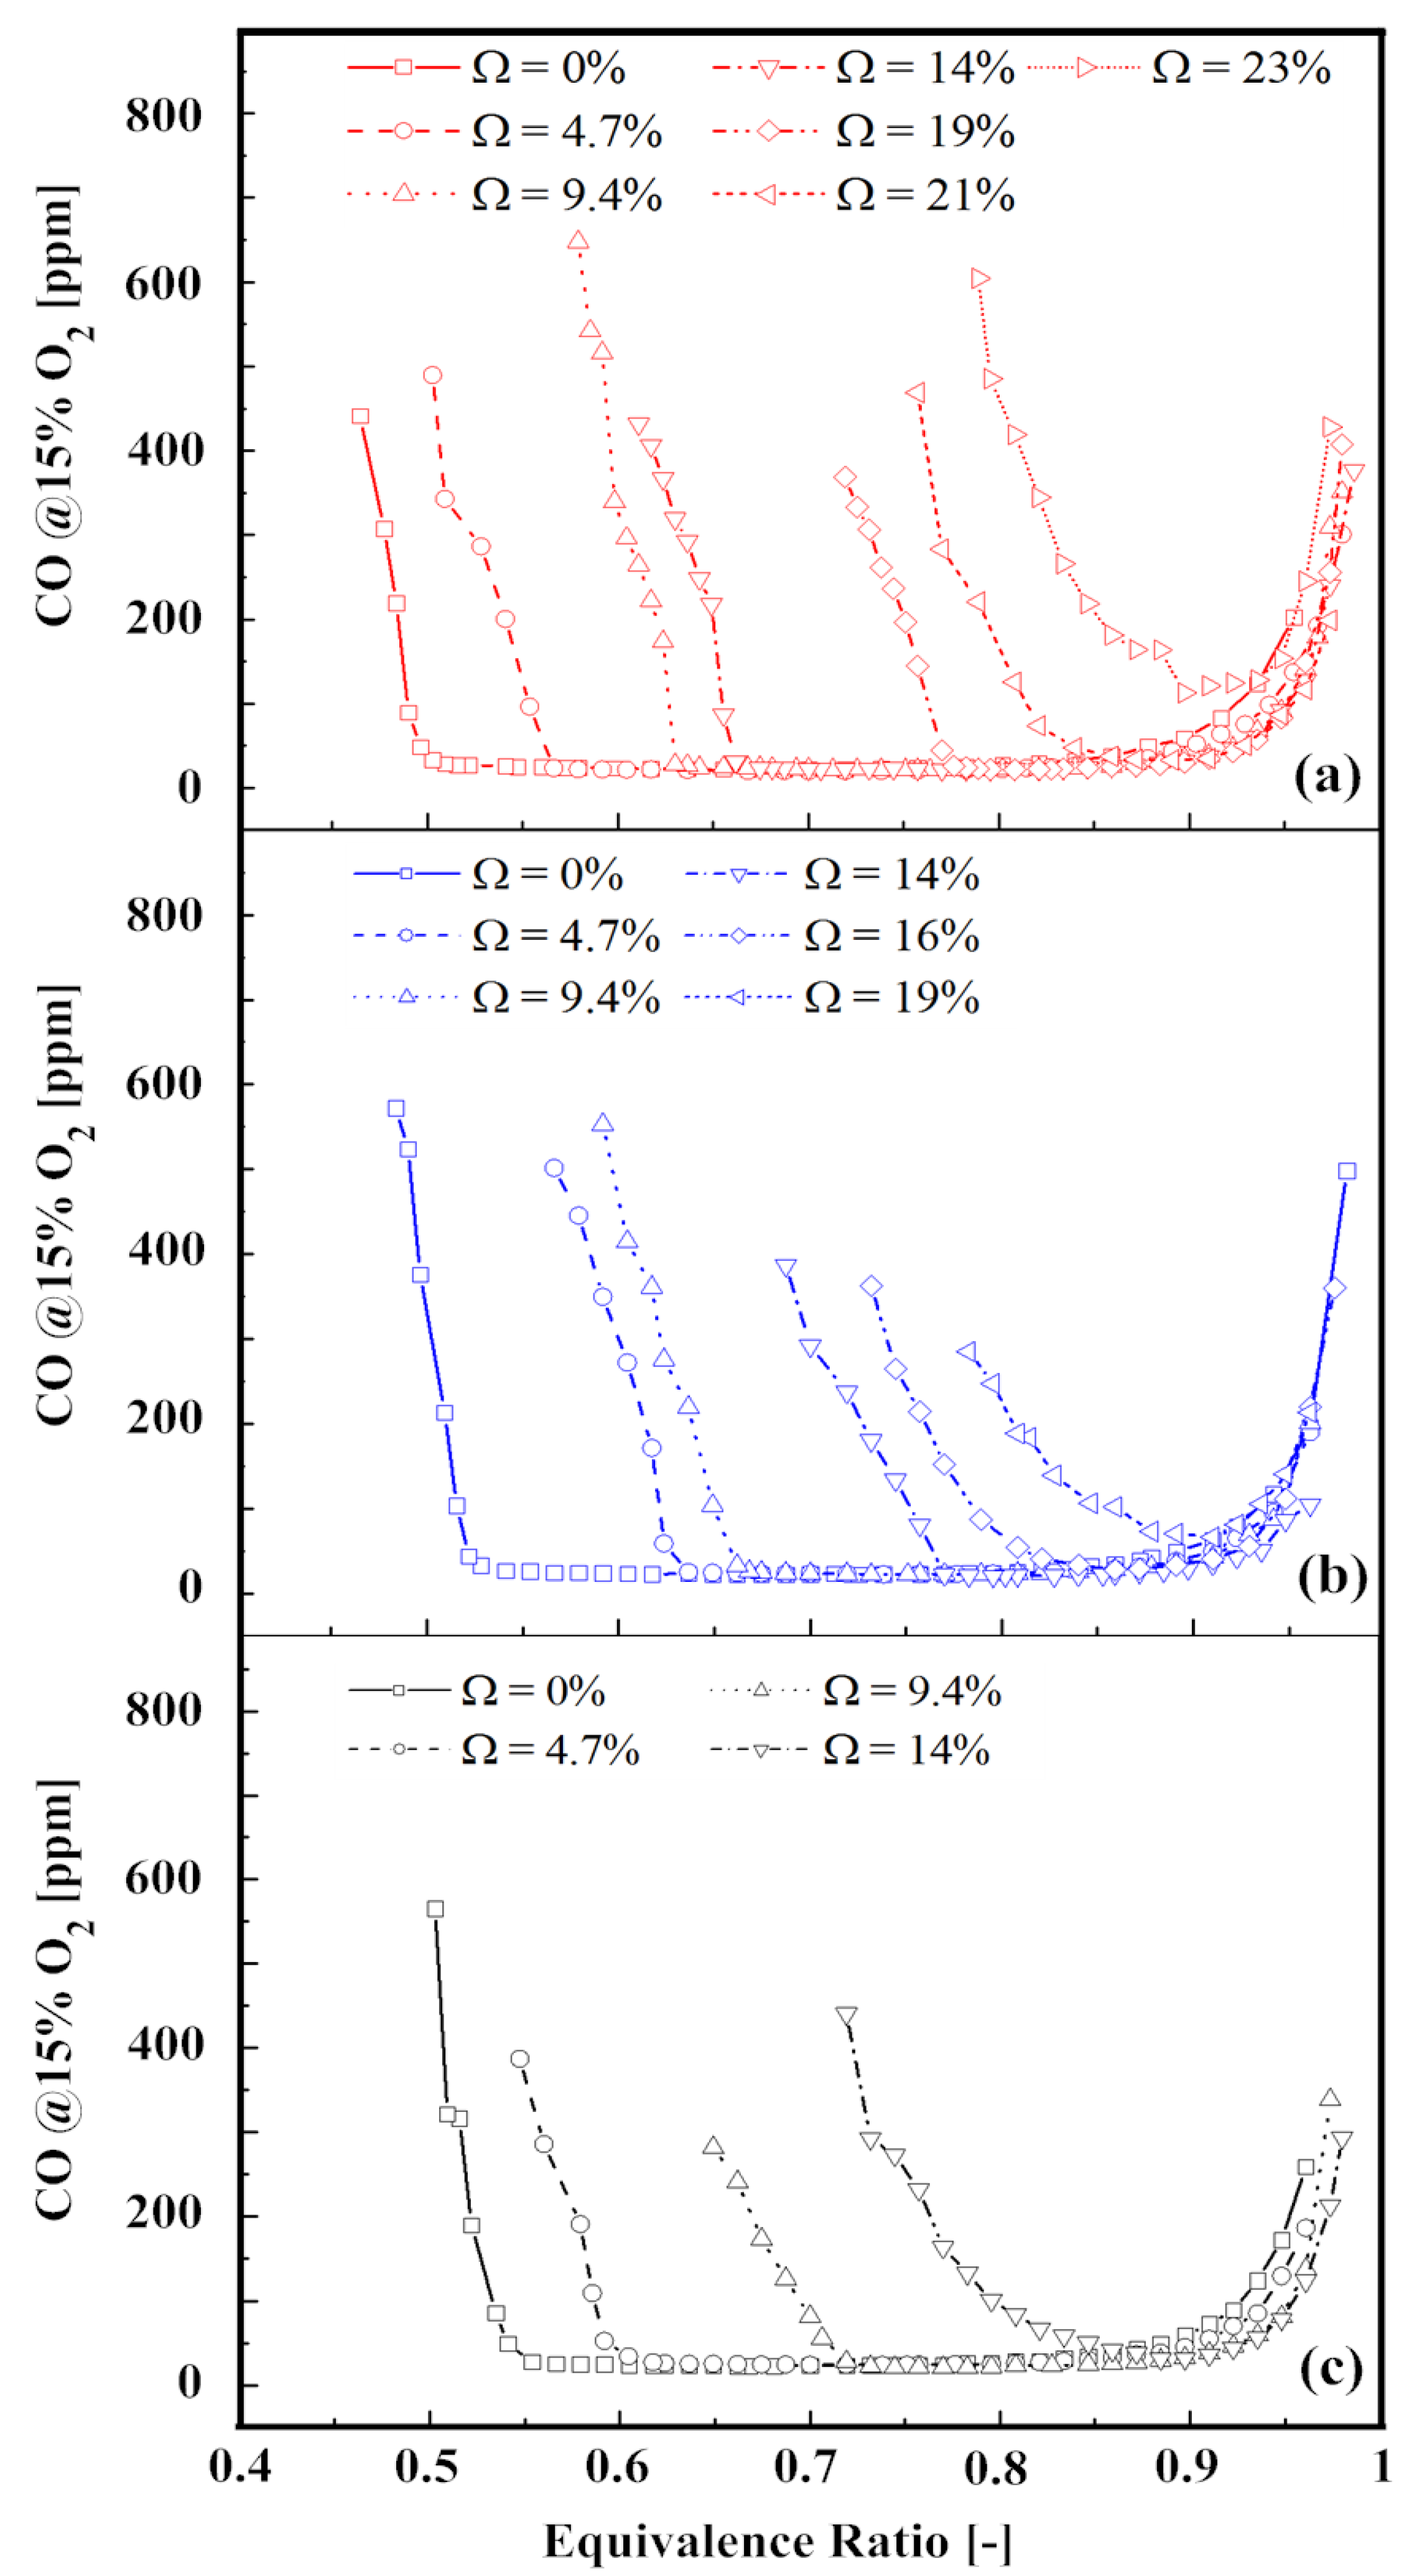
CO emission is a very important mark of the incomplete combustion and also a standard to determine the combustion efficiency. If the combustor is operated at a very low equivalence ratio, which is close to the LBO limit, the flame temperature will be very low. As a result, the reaction rate will decrease, which leads to insufficient time for the oxidation of CO. However, if operating the combustion with a very high equivalence ratio (Φ is close to 1), the flame temperature will be very high. As a consequence, the high flame temperature will have a significant inhibiting effect on the CO oxidation reaction, which is known as the main heat release reaction in methane combustion. Additionally, a sufficiently high flame temperature can lead to an observable CO2 dissociation which will contribute a higher CO concentration in the combustion products. Furthermore, under the condition where the equivalence ratio approaches 1, there is almost no extra air, which is essential for fast and complete CO oxidization with the limited residence time. Therefore, the CO cannot be consumed completely. Based on the above discussion, it can be seen that operating the combustion in the appropriate equivalence ratio range is very important for CO control.
In Figure 11, the combined effect of the steam addition and equivalence ratio was studied. The CO emission was plotted as a function of the equivalence ratio and steam fraction. With the inlet temperature of 484 K, it can be observed that, near the stoichiometric condition and the LBO equivalence ratios, the CO emission had a rapid rise in all steam fraction cases. When the equivalence ratio was located between the two CO increases, the corresponding concentration of the CO emission was almost constant and remained at a normally low level. Adding steam into the combustor made the CO rise (near the LBO side) shift to the higher equivalence ratio. Then, an obviously downward trend of the low CO emission operation range was presented along with the increasing steam fraction. When the steam fraction was up to 23%, the CO emission could never reach the low-level value. The steam capacity for each inlet temperature was not captured accurately. However, the approximate location can be estimated according to Figure 11. Based on the CO emission profile in Figure 11, it can be found that the higher inlet temperature contributed to the higher steam capacity. It should be noted that before reaching steam capacity, CO concentration was not affected by steam when the combustor was operated at adaptive equivalence ratios. The same CO emission behavior was also found in the other experimental cases with the inlet temperature of 434 K and 384 K (Figure 11b,c).
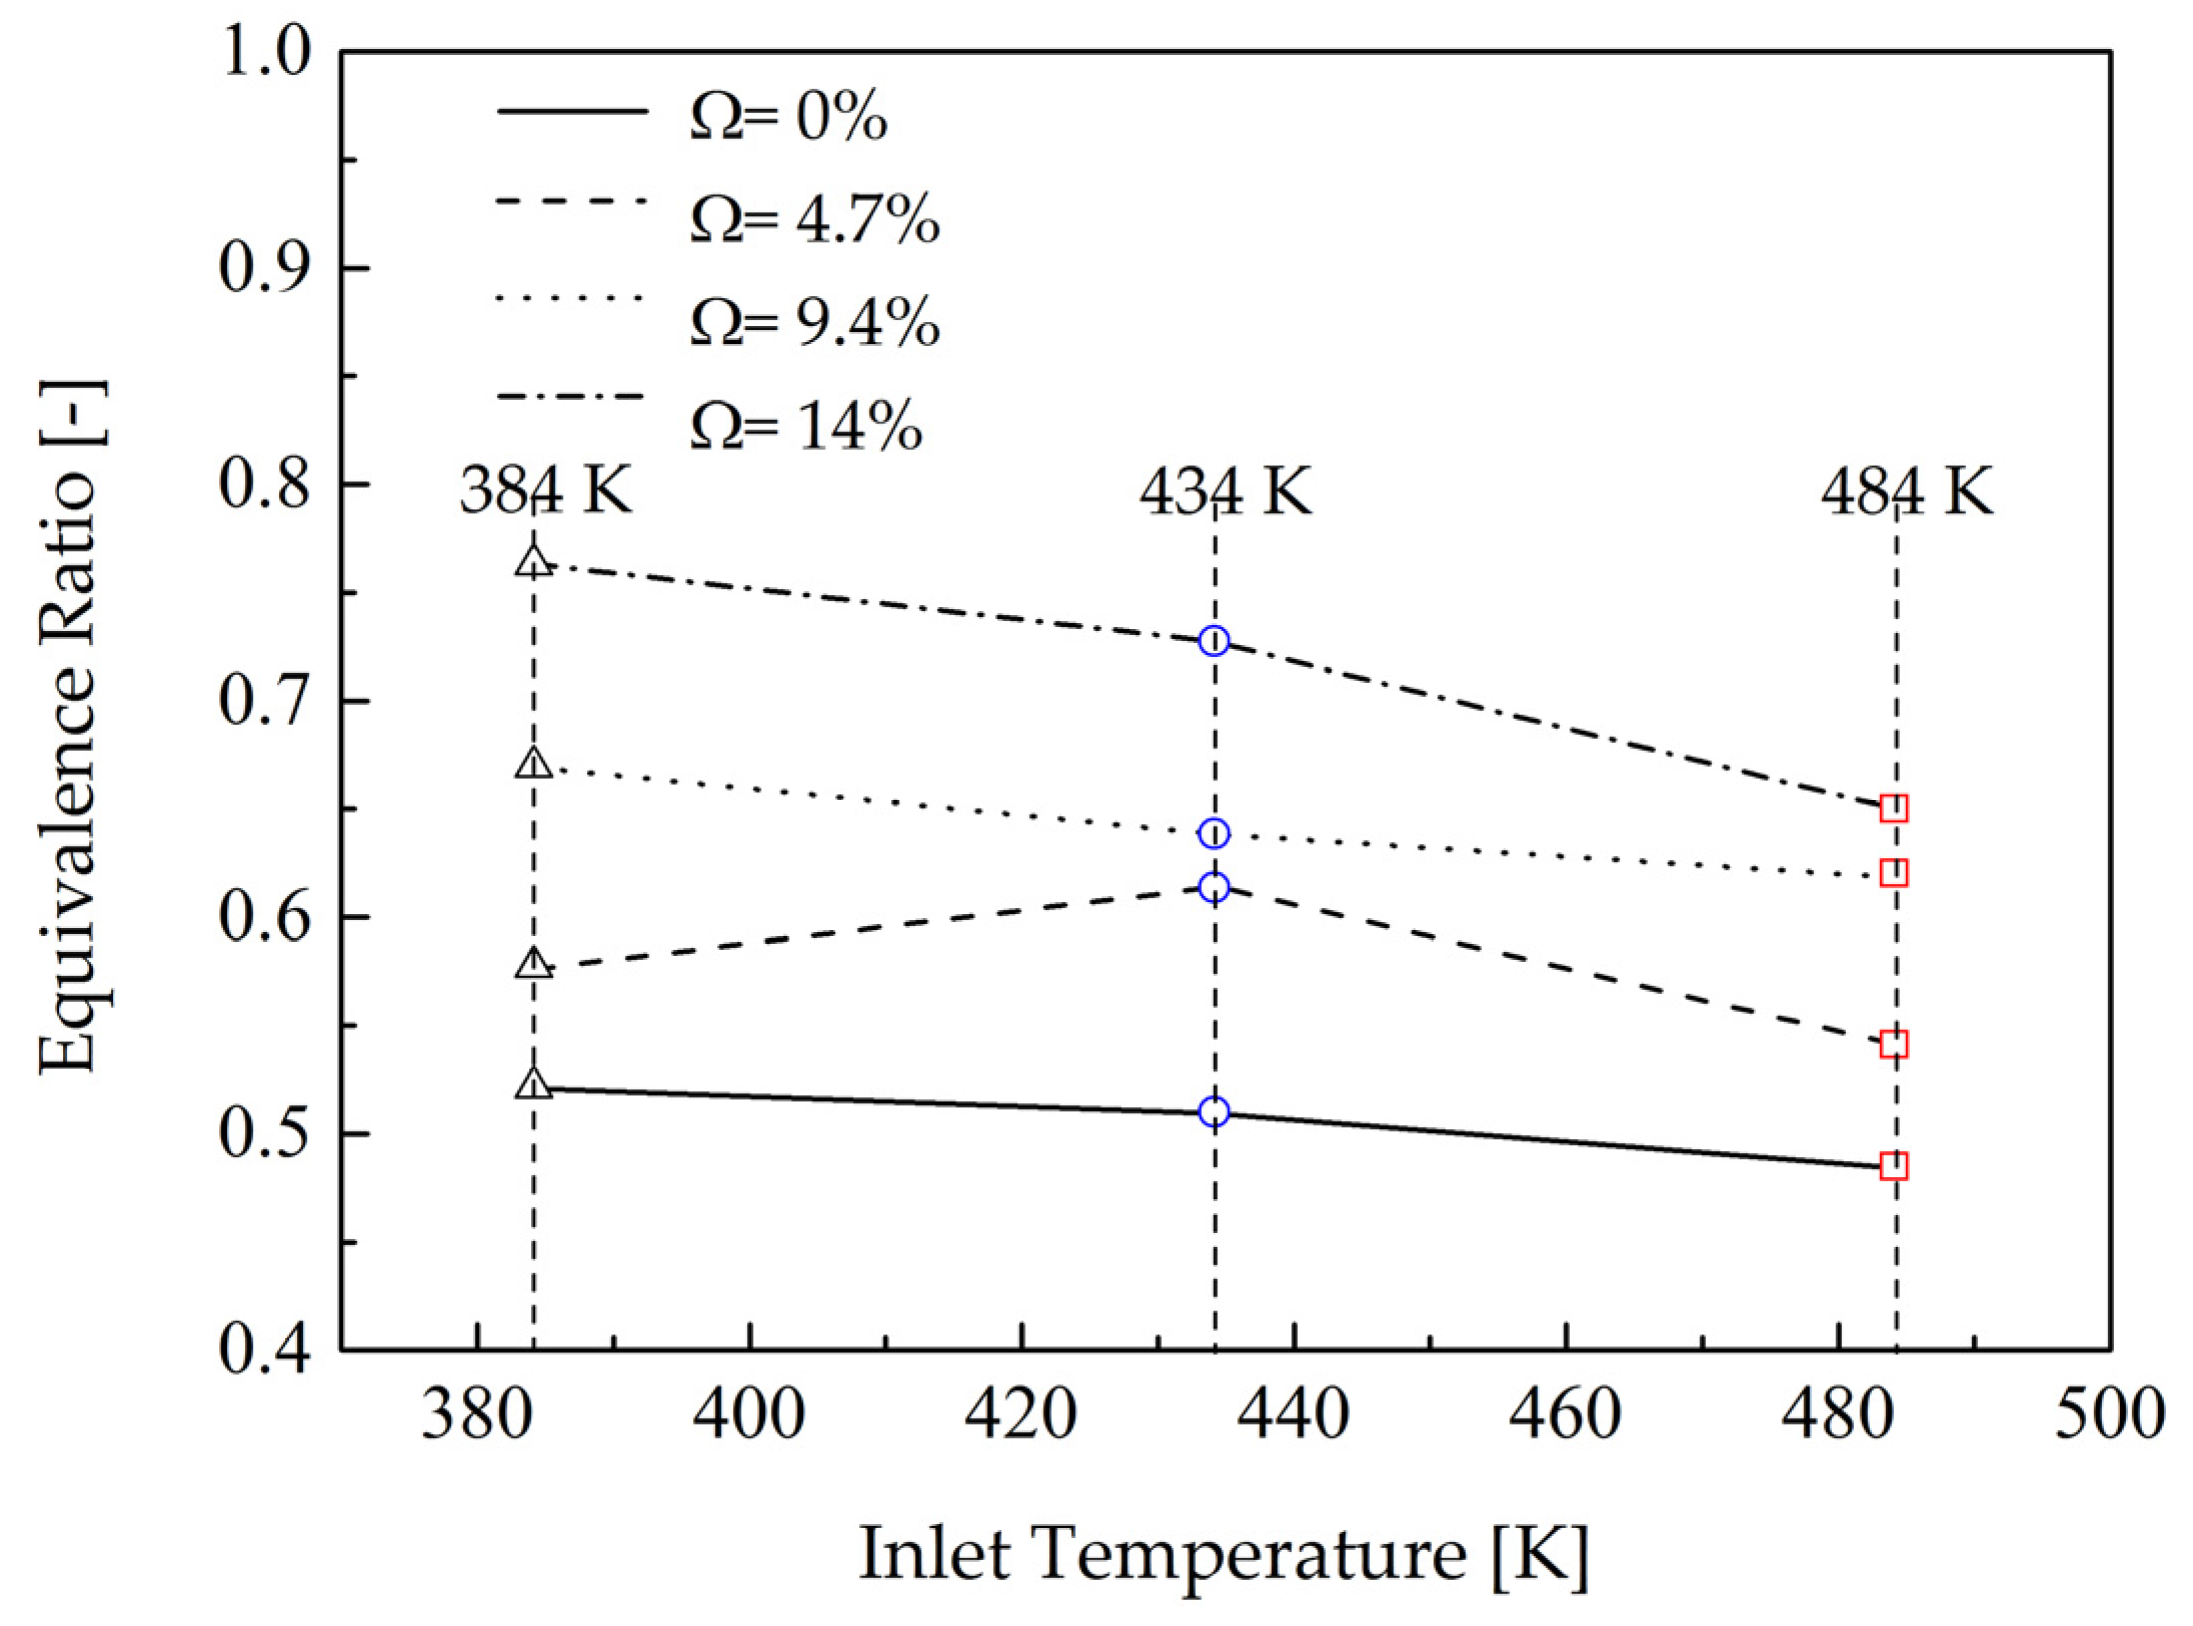
In Figure 12, the equivalence ratios where CO reached 200 ppm (at the LBO side) were plotted. The effects of combustor inlet temperatures on CO emission were compared with varied steam fractions. The results indicated that to control CO below 200 ppm at the same steam fraction, a higher inlet temperature could extend the operation range to a smaller equivalence ratio (except the case at Ω = 4.7% and 434 K). In the same inlet temperature, combustion with a higher steam fraction required a higher equivalence ratio range.
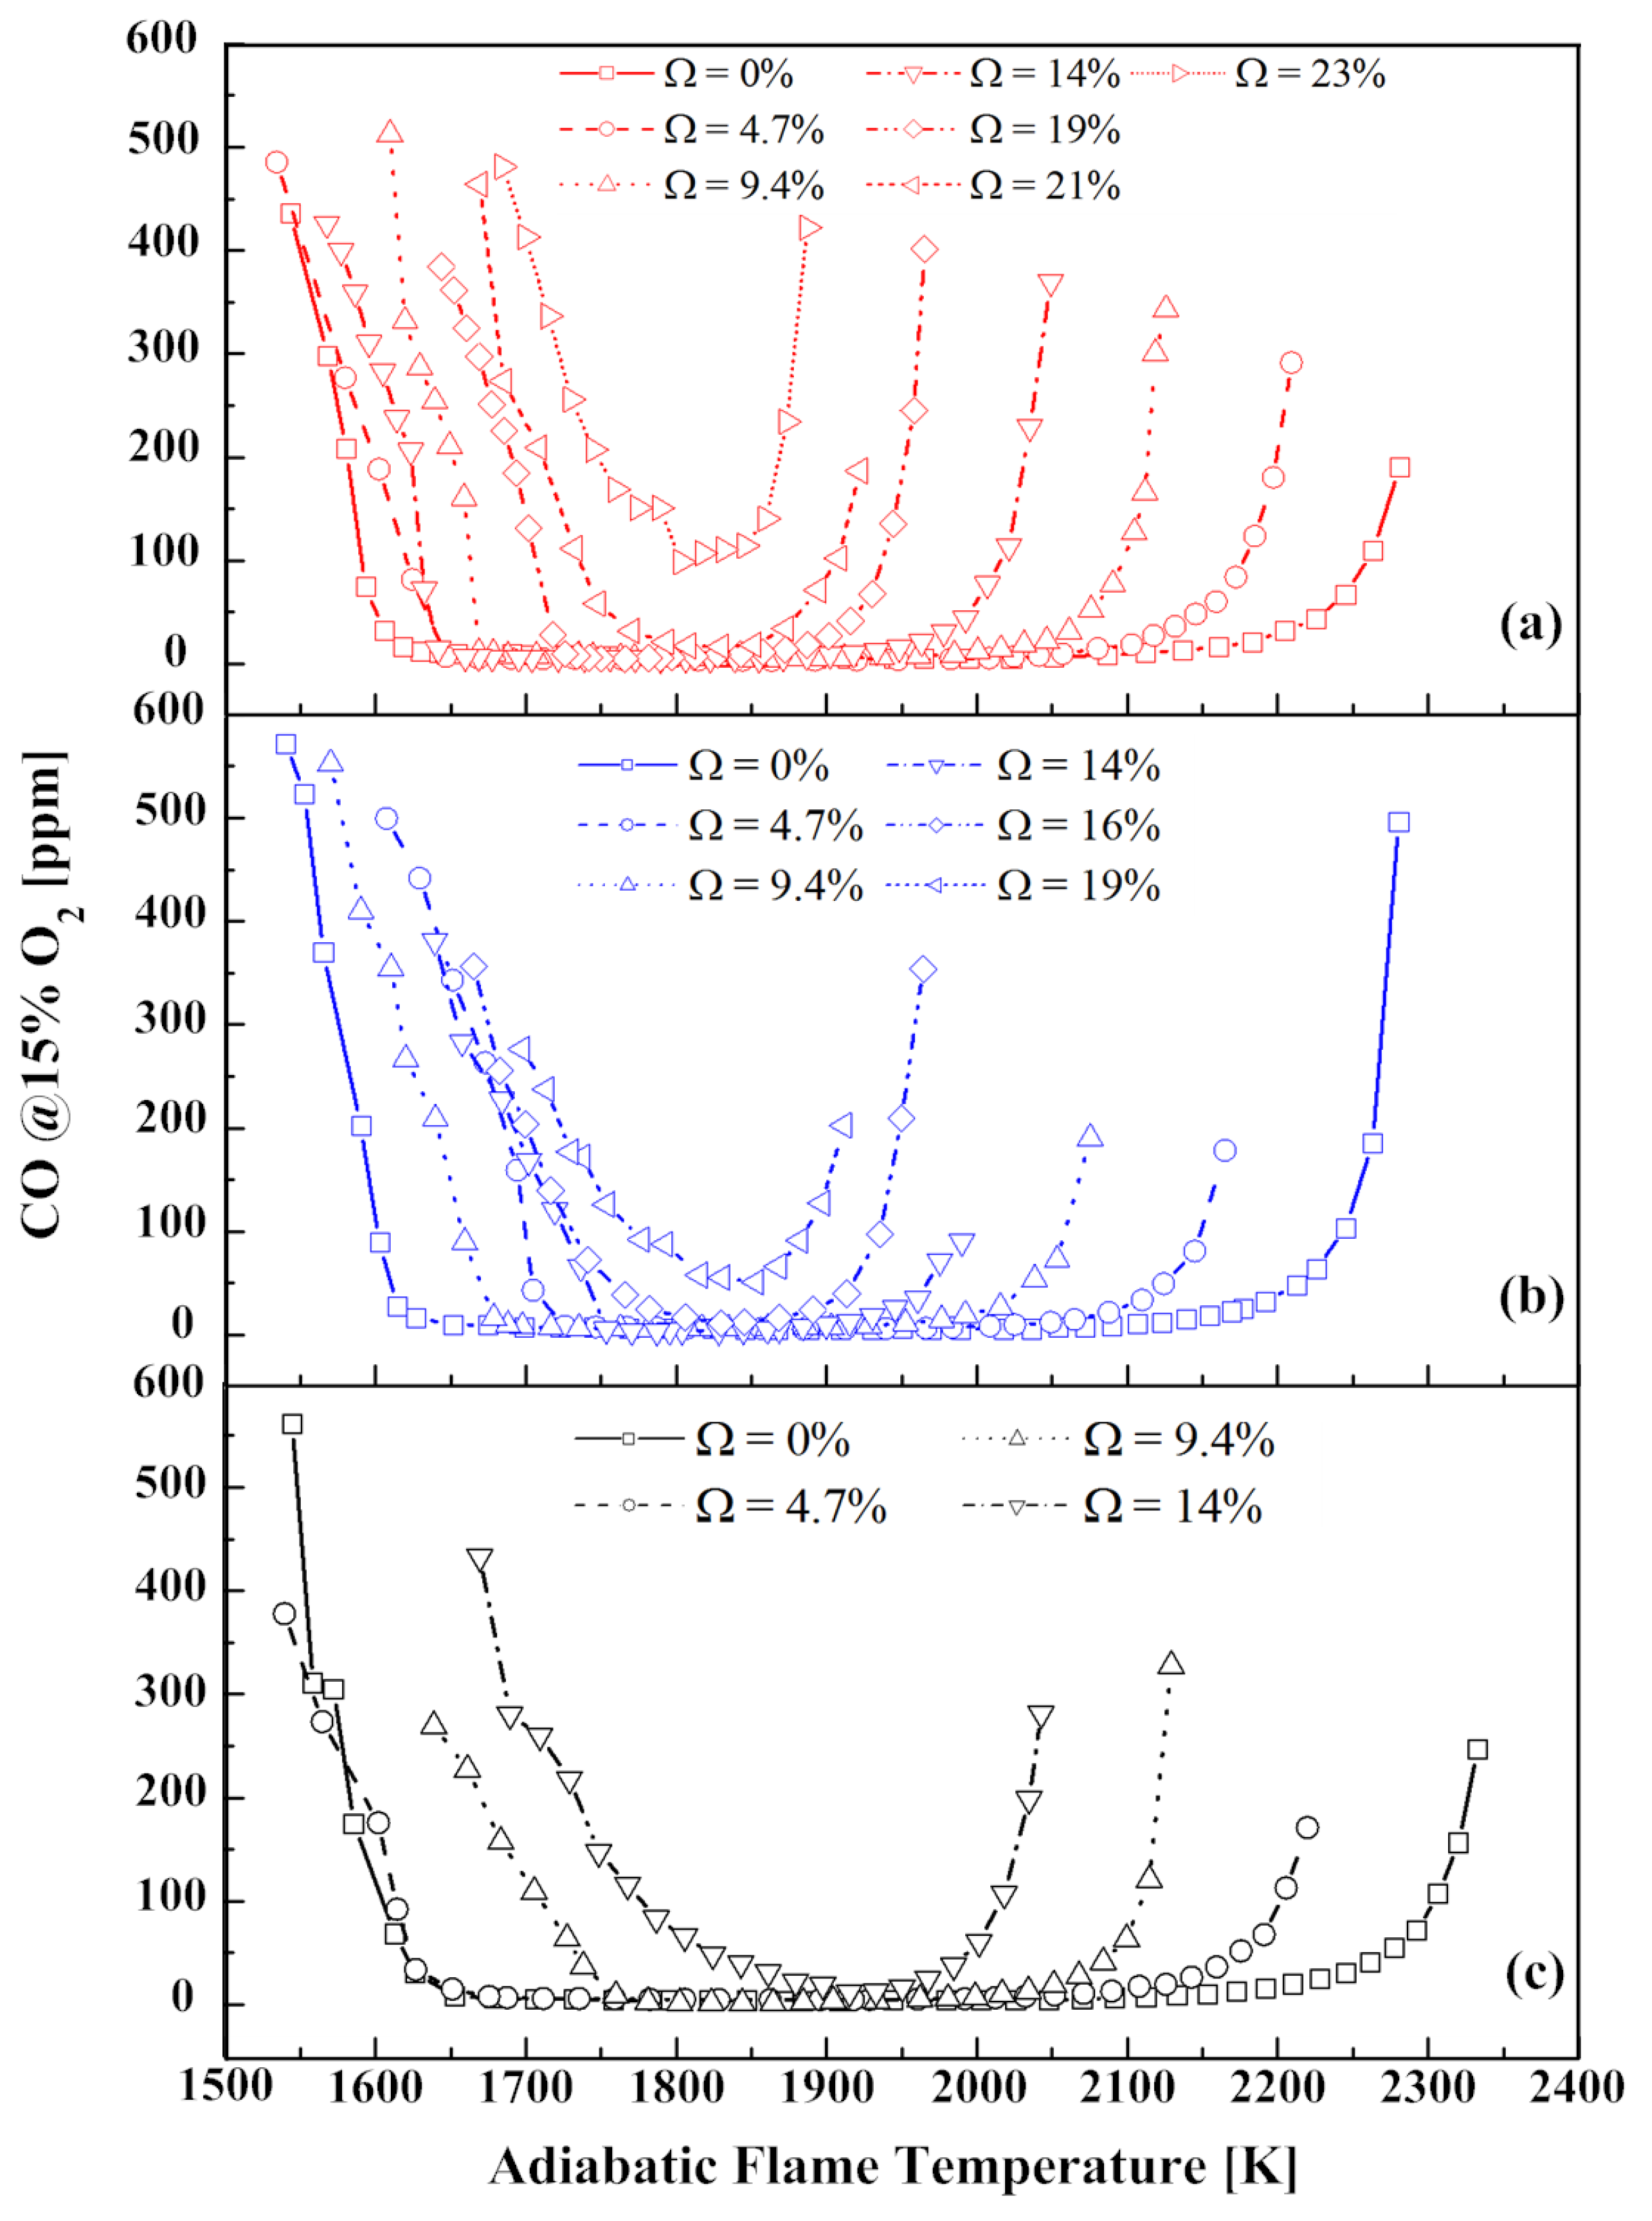
Figure 13 presents the relationship between adiabatic flame temperature and CO emissions with different steam fractions. It was observed that with a steam fraction larger than the steam capacity, CO emission can never reach the low value, although the adiabatic flame temperature was not lower than the well-functioning cases with a smaller steam fraction. In steam-diluted combustion, CO concentration may be balanced by two factors which are the reaction rate and residence time. The reaction rate depends on the flame temperature and the reactant concentration. The residence time depends on the flow field and velocity. In the experiments where the steam fraction is larger than the capacity, the reaction rate was reduced due to the lower reactant concentration. In addition, a smaller residence time was led by the higher steam mass flow rate. As a consequence, it easily led to an incomplete combustion and a CO trend in Figure 13 is presented.
4. Conclusions
Experiments have been conducted on an atmospheric and swirl-stabilized combustor to investigate the steam addition influences on a premixed methane/air flame. The LBO limits, flame structures, as well as CO emission were studied. CH chemiluminescence measurements were conducted and the results were further analyzed by using the inverse Abel transform method. Some chemical kinetics calculations were made to support and understand the experimental results. The major conclusions from present work are:
- At a given combustor inlet temperature, the LBO equivalence ratio increased with the increasing steam fraction. Higher combustor inlet temperature could extend the LBO equivalence ratios to lower values at the same steam fraction, which resulted in a wider combustion operation range.
- At a given steam fraction, the LBO events almost happened at the same adiabatic flame temperature regardless of the combustor inlet temperature. The dependence of adiabatic flame temperatures at LBO on the steam fraction was an approximately linear relationship.
- Flame observation indicated that the combustion without steam or with a small steam fraction, three types of flames were found, which are short “V”-shaped flames, “M”-shaped flames, and the long “V”-shaped flames. Further increasing the steam fraction, only “M”-shaped flames and the long “V”-shaped flames were obtained and the flame length was increased by the steam addition. Once the steam fraction was larger than the steam capacity, the flame oscillated in the combustor in the whole operation range and no stable flame structures were obtained.
- Steam addition resulted in a smaller operation range for low CO emission. When the steam fraction was smaller than the steam capacity and the combustor was operated at an adaptive equivalence ratio range, CO was as low as the combustion cases without steam. After reaching the steam capacity, CO emission was increased and could never reach the normal low level although the adiabatic flame temperature was not lower than the well-functioning cases with a lower steam fraction.
To summarize the current study, it is possible to run a stable combustion with low CO emission in a steam fraction smaller than the steam capacity. However, the combustor needs to be operated at higher equivalence ratio ranges in order to avoid LBO and maintain low CO emissions.
Acknowledgments
The authors Mao Li and Yiheng Tong gratefully acknowledge the financial support from the China Scholarship Council (CSC).
Author Contributions
Mao Li performed the experimental work and wrote the paper; Mao Li and Yiheng Tong analyzed the data; and Marcus Thern and Jens Klingmann revised the manuscript and provided the laboratory resource.
Conflicts of Interest
The authors declare no conflict of interest.
References
- Stochl, R.J. Assessment of Steam-Injected Gas Turbine Systems and Their Potential Application; NASA: Cleveland, OH, USA, 1982.
- Bartlett, M. Developing Humidified Gas Turbine Cycles; Royal Institute of Technology: Stovkholm, Sweden, 2002. [Google Scholar]
- Jonsson, M.; Yan, J. Humidified gas turbines—A review of proposed and implemented cycles. Energy 2005, 30, 1013–1078. [Google Scholar] [CrossRef]
- Göke, S.; Schimek, S.; Terhaar, S.; Reichel, T.; Göckeler, K.; Krüger, O.; Fleck, J.; Griebel, P.; Paschereit, C.O.; et al. Influence of pressure and steam dilution on NOx and CO emissions in a premixed natural gas flame. J. Eng. Gas Turbines Power 2014, 136, 091508. [Google Scholar] [CrossRef]
- Mazas, A.; Lacoste, D.; Schuller, T. Experimental and Numerical Investigation on the Laminar Flame Speed of CH4/O2 Mixtures Diluted with CO2 and H2O; American Society of Mechanical Engineers: New York, NY, USA, 2010; pp. 411–421. [Google Scholar]
- Li, S.; Williams, F. NOx formation in two-stage methane-air flames. Combust. Flame 1999, 118, 399–414. [Google Scholar] [CrossRef]
- Frassoldati, A.; Faravelli, T.; Ranzi, E. A wide range modeling study of NOx formation and nitrogen chemistry in hydrogen combustion. Int. J. Hydrog. Energy 2006, 31, 2310–2328. [Google Scholar] [CrossRef]
- Mazas, A.N.; Fiorina, B.; Lacoste, D.A.; Schuller, T. Effects of water vapor addition on the laminar burning velocity of oxygen-enriched methane flames. Combust. Flame 2011, 158, 2428–2440. [Google Scholar] [CrossRef]
- Koroll, G.; Mulpuru, S. The effect of dilution with steam on the burning velocity and structure of premixed hydrogen flames. Symp. Int. Combust. 1988, 21, 1811–1819. [Google Scholar] [CrossRef]
- Babkin, V.; V’yun, A. Effect of water vapor on the normal burning velocity of a methane-air mixture at high pressures. Combust. Explos. Shock Waves 1971, 7, 339–341. [Google Scholar] [CrossRef]
- Park, J.; Kim, S.C.; Keel, S.I.; Noh, D.S.; Oh, C.B.; Chung, D. Effect of steam addition on flame structure and NO formation in H2-O2-N2 diffusion flame. Int. J. Energy Res. 2004, 28, 1075–1088. [Google Scholar] [CrossRef]
- Hwang, D.J.; Choi, J.W.; Park, J.; Keel, S.I.; Ch, C.B.; Noh, D.S. Numerical study on flame structure and NO formation in CH4-O2-N2 counterflow diffusion flame diluted with H2O. Int. J. Energy Res. 2004, 28, 1255–1267. [Google Scholar] [CrossRef]
- Katoh, A.; Shinoda, M.; Kitagawa, K.; Gupta, A.K. Visualization of steam addition effect on OH Distribution in a flame by isotope shift/planar laser-induced fluorescence (IS/PLIF) spectroscopy. J. Eng. Gas Turbines Power. 2006, 128, 8. [Google Scholar] [CrossRef]
- Dryer, F. Water addition to practical combustion systems—Concepts and applications. Symp. Int. Combust. 1977, 16, 279–295. [Google Scholar] [CrossRef]
- Goke, S.; Terhaar, S.; Schimek, S.; Göckeler, K.; Paschereit, C.O. Combustion of Natural Gas, Hydrogen and Bio-Fuels at Ultra-Wet Conditions; American Society of Mechanical Engineers: New York, NY, USA, 2011; pp. 659–670. [Google Scholar]
- Park, J.; Keel, S.I.; Yun, J.H. Addition effects of H2 and H2O on flame structure and pollutant emissions in methane-air diffusion flame. Energy Fuels 2007, 21, 3216–3224. [Google Scholar] [CrossRef]
- Kobayashi, H.; Yata, S.; Ichikawa, Y.; Ogami, Y. Dilution effects of superheated water vapor on turbulent premixed flames at high pressure and high temperature. Proc. Combust. Inst. 2009, 32, 2607–2614. [Google Scholar] [CrossRef]
- Kuhn, P.; Terhaar, S.; Reichel, T.; Paschereit, C.O. Design and Assessment of a Fuel-Flexible Low Emission Combustor for Dry and Steam-Diluted Conditions; American Society of Mechanical Engineers: New York, NY, USA, 2015. [Google Scholar]
- Kee, R.; Rupley, F.; Miller, J. CHEMKIN-PRO 15112; Reaction Design: San Diego, CA, USA, 2011. [Google Scholar]
- Beér, J.M.; Chigier, N.A. Combustion Aerodynamics; Krieger Publishing Company: Malabar, FL, USA, 1972. [Google Scholar]
- Sayad, P.; Schönborn, A.; Clerini, D.; Klingmann, J. Experimental Investigation of Methane Lean Blowout Limit; Effects of Dilution, Mass Flow Rate and Inlet Temperature; American Society of Mechanical Engineers: New York, NY, USA, 2012; pp. 815–826. [Google Scholar]
- Smith, G.P.; Golden, D.M.; Frenklach, M.; Moriarty, N.W.; Eiteneer, B.; Goldenberg, M.; Bowman, C.T.; Hanson, R.K.; Song, S.; Gardiner, W.C.; et al. GRI-Mech 3.0. Available online: http://combustion.berkeley.edu/gri-mech/index.html (accessed on 21 July 2017).
- Weber, R.; Breussin, F. Scaling properties of swirling pulverized coal flames: From 180 kW to 50 MW thermal input. Symp. Int. Combust. 1998, 27, 2957–29564. [Google Scholar] [CrossRef]
- Poinsot, T.; Veynante, D. Theoretical and Numerical Combustion; RT Edwards, Inc.: Philadelphia, PA, USA, 2005. [Google Scholar]
Figure 1.
Combustor and experiment configuration.

Figure 2.
Swirl-stabilized combustor with optical access and swirler cross-section.

Figure 3.
The dependence of LBO equivalence ratio on steam fraction with three different inlet temperatures.
Figure 3.
The dependence of LBO equivalence ratio on steam fraction with three different inlet temperatures.

Figure 4.
The calculated adiabatic flame temperature (a) and laminar flame speed (b) with a wide range of equivalence ratios and the steam fraction from 0% to 23%, at an inlet temperature of 484 K.
Figure 4.
The calculated adiabatic flame temperature (a) and laminar flame speed (b) with a wide range of equivalence ratios and the steam fraction from 0% to 23%, at an inlet temperature of 484 K.

Figure 5.
Comparison of the adiabatic flame temperature on LBO limits for inlet temperatures of (a) 484 K; (b) 434 K; and (c) 384 K; (d) the dependence of LBO adiabatic flame temperature on steam fractions.
Figure 5.
Comparison of the adiabatic flame temperature on LBO limits for inlet temperatures of (a) 484 K; (b) 434 K; and (c) 384 K; (d) the dependence of LBO adiabatic flame temperature on steam fractions.

Figure 6.
A sketch illustration for the flame thicknesses of a premixed flame.

Figure 7.
The Damköhler number and equivalence ratio flammability limits for different quantities of steam addition. Higher LBO equivalence ratios corresponded to the larger steam fraction in each inlet temperature.
Figure 7.
The Damköhler number and equivalence ratio flammability limits for different quantities of steam addition. Higher LBO equivalence ratios corresponded to the larger steam fraction in each inlet temperature.

Figure 8.
The reconstructed CH chemiluminescence which revealed three types of flame structures with an inlet temperature of 484 K. Ω = 0 in (a1), (b1), and (c1); Ω = 4.7% in (a2), (b2), and (c2).
Figure 8.
The reconstructed CH chemiluminescence which revealed three types of flame structures with an inlet temperature of 484 K. Ω = 0 in (a1), (b1), and (c1); Ω = 4.7% in (a2), (b2), and (c2).

Figure 9.
The reconstructed CH which showed the two types of flame structures with the inlet temperature of 484 K and steam fraction of 19% (2 kg/h).
Figure 9.
The reconstructed CH which showed the two types of flame structures with the inlet temperature of 484 K and steam fraction of 19% (2 kg/h).

Figure 10.
Time-averaged CH chemiluminescence (without reconstruction) for the inlet temperature of 434 K and a steam fraction of 19%. Flame fluctuated in the combustor during the whole operation range.
Figure 10.
Time-averaged CH chemiluminescence (without reconstruction) for the inlet temperature of 434 K and a steam fraction of 19%. Flame fluctuated in the combustor during the whole operation range.

Figure 11.
The influence of the steam fraction and the equivalence ratios on the CO emissions. (a) 484 K; (b) 434 K; and (c) 384 K.
Figure 11.
The influence of the steam fraction and the equivalence ratios on the CO emissions. (a) 484 K; (b) 434 K; and (c) 384 K.

Figure 12.
A comparison of the steam fraction and inlet temperature effect on the operation range where CO was below 200 ppm.
Figure 12.
A comparison of the steam fraction and inlet temperature effect on the operation range where CO was below 200 ppm.

Figure 13.
The dependence of CO emission on the adiabatic flame temperatures for three inlet temperatures, (a) 484 K; (b) 434 K; and (c) 384 K.
Figure 13.
The dependence of CO emission on the adiabatic flame temperatures for three inlet temperatures, (a) 484 K; (b) 434 K; and (c) 384 K.


Table 1.
Experimental operating conditions.
| Operation Parameter | Units | Methane/Air/Steam Flame | Uncertainty |
|---|---|---|---|
| Fuel | [-] | CH4 (99.98%) | [-] |
| Fuel flow rate | (g/s) | 0.076–0.175 | ±0.002 |
| Power | (kW) | 3.8–8.6 | ±0.1 |
| Air flow rate | (g/s) | 2.96 | ±0.02 |
| Equivalence ratio | [-] | 1.00–LBO limits | 0.01 |
| Swirl number | [-] | 0.58–0.56 | ±0.01 |
| Preheated temperature | (K) | 384/434/484 | ±2 |
| Steam flow rate | g/s | 0–0.69 | ±0.06 |
| Steam Fraction | [-] | 0–24% | ±0.02 |
© 2017 by the authors. Licensee MDPI, Basel, Switzerland. This article is an open access article distributed under the terms and conditions of the Creative Commons Attribution (CC BY) license (http://creativecommons.org/licenses/by/4.0/).
Share and Cite
MDPI and ACS Style
Li, M.; Tong, Y.; Thern, M.; Klingmann, J. Influence of the Steam Addition on Premixed Methane Air Combustion at Atmospheric Pressure. Energies 2017, 10, 1070. https://doi.org/10.3390/en10071070
AMA Style
Li M, Tong Y, Thern M, Klingmann J. Influence of the Steam Addition on Premixed Methane Air Combustion at Atmospheric Pressure. Energies. 2017; 10(7):1070. https://doi.org/10.3390/en10071070
Chicago/Turabian StyleLi, Mao, Yiheng Tong, Marcus Thern, and Jens Klingmann. 2017. "Influence of the Steam Addition on Premixed Methane Air Combustion at Atmospheric Pressure" Energies 10, no. 7: 1070. https://doi.org/10.3390/en10071070
Note that from the first issue of 2016, this journal uses article numbers instead of page numbers. See further details here.