Article

Effect of Fuel Injection Strategy on the Carbonaceous Structure Formation and Nanoparticle Emission in a DISI Engine Fuelled with Butanol

by
Simona Silvia Merola
*,
Adrian Irimescu
,
Silvana Di Iorio
and
Bianca Maria Vaglieco
Istituto Motori-Consiglio Nazionale delle Ricerche, 80125 Naples, Italy
*
Author to whom correspondence should be addressed.
Energies 2017, 10(7), 832; https://doi.org/10.3390/en10070832
Submission received: 8 May 2017 / Revised: 16 June 2017 / Accepted: 16 June 2017 / Published: 22 June 2017
(This article belongs to the Special Issue Automotive Engines Emissions and Control)

Abstract

:
Within the context of ever wider expansion of direct injection in spark ignition engines, this investigation was aimed at improved understanding of the correlation between fuel injection strategy and emission of nanoparticles. Measurements performed on a wall guided engine allowed identifying the mechanisms involved in the formation of carbonaceous structures during combustion and their evolution in the exhaust line. In-cylinder pressure was recorded in combination with cycle-resolved flame imaging, gaseous emissions and particle size distribution. This complete characterization was performed at three injection phasing settings, with butanol and commercial gasoline. Optical accessibility from below the combustion chamber allowed visualization of diffusive flames induced by fuel deposits; these localized phenomena were correlated to observed changes in engine performance and pollutant species. With gasoline fueling, minor modifications were observed with respect to combustion parameters, when varying the start of injection. The alcohol, on the other hand, featured marked sensitivity to the fuel delivery strategy. Even though the start of injection was varied in a relatively narrow crank angle range during the intake stroke, significant differences were recorded, especially in the values of particle emissions. This was correlated to the fuel jet-wall interactions; the analysis of diffusive flames, their location and size confirmed the importance of liquid film formation in direct injection engines, especially at medium and high load.

1. Introduction

Internal combustion engines are the dominant propulsion method in automotive transportation [1]. Their development is centered around improving fuel conversion efficiency and reducing exhaust gas emissions; the latter is becoming the prevailing aspect and is sometimes decoupled from the first one, with policy playing a significant role [2]. Within this context, spark ignition (SI) engines are migrating towards direct injection (DI), due to its favorable effect on efficiency [3] and reduced propensity towards knock at full load [4].
There are basically two DI systems that are being implemented on a wide scale. The wall guided (WG) solution [5] has the advantage of improved volumetric efficiency compared to port fuel injection (PFI) [6]; good performance is ensured in homogenous charge mode [7], while stratified operation requires special tumble flaps fitted in the intake runners [8]. Basically, the guiding principle is the interaction of injected fuel with the working fluid, thus requiring a compromise between high intake air velocity and increased jet penetration possible only with the piston away from top dead center (TDC). Spray guided (SG) systems operate at higher injection pressure and are more favorable for lean stratified combustion [9,10]. In this configuration, the injector is usually centrally located, close to the spark plug, as opposed to side mounting specific for the wall guided principle. One of the decisive factors for both solutions is the start of injection (SOI) [11,12]. It determines the interaction between incoming air flow and the fuel jets, as well as the actual space available for spray penetration, given by the position of the piston. Even though liquid velocity is high, air motion plays a significant role in this process, which also needs to be considered in view of ever wider application of variable valves actuation [13,14]. This is also important bearing in mind that injection needs to be advanced during boosted operation at high engine speed [15] in order to maintain the aforementioned compromise between intake air velocity and available spray penetration length [11]. The main mechanism is impingement on the piston and liner [16], with significant fuel effects [17]. Wall wetting is directly related to load, meaning that as engine output is increased at fixed rotational speed, larger quantities of fuel need to be injected; several mechanisms during air–fuel mixture formation contribute to complex effects on charge distribution during combustion, that can be identified through combined experimental and numerical investigations [18,19]. Mixture inhomogeneity plays a significant role during the initial stages of flame kernel development [20], but also influences the occurrence of abnormal combustion phenomena due to autoignition [21,22,23].
The use of alternative fuels is another aspect that needs to be considered from a wide perspective [24]. Applications of alcohol fuels generally result in improved combustion phasing [25,26] due to higher laminar flame speed. Moreover, as was observed for diesel engines [27,28], this category of alternative fuels feature lower particle emissions owed to specific differences in molecular structure [29]. Both affirmations have been somewhat extensively investigated at part load [30,31] while at high engine load there is relatively reduced literature available [32,33].
This study was aimed at improved understanding of charge distribution for different settings of injection phasing and its effects on nanoparticle emissions, when fueling a wall guided SI engine with butanol. Compared to a previous investigation [11], the focus is switched on the correlation between the chemical processes during late combustion and characteristics of particles measured in the exhaust line; also, a direct comparison with gasoline was performed in order to emphasize the changes in injection strategies that need to be performed when changing fuel type. In-cylinder pressure and exhaust gas emissions were measured under wide open throttle (WOT) conditions, at the same spark timing setting with gasoline and n-butanol fueling. Particle number distribution was also monitored to provide a more detailed view of the influence each fuel has on this pollutant category. Cycle resolved imaging allowed the assessment of spatial distribution for diffusive flame during late combustion, and its correlation to the changes observed in engine performance and emissions.

2. Experimental Setup and Methods
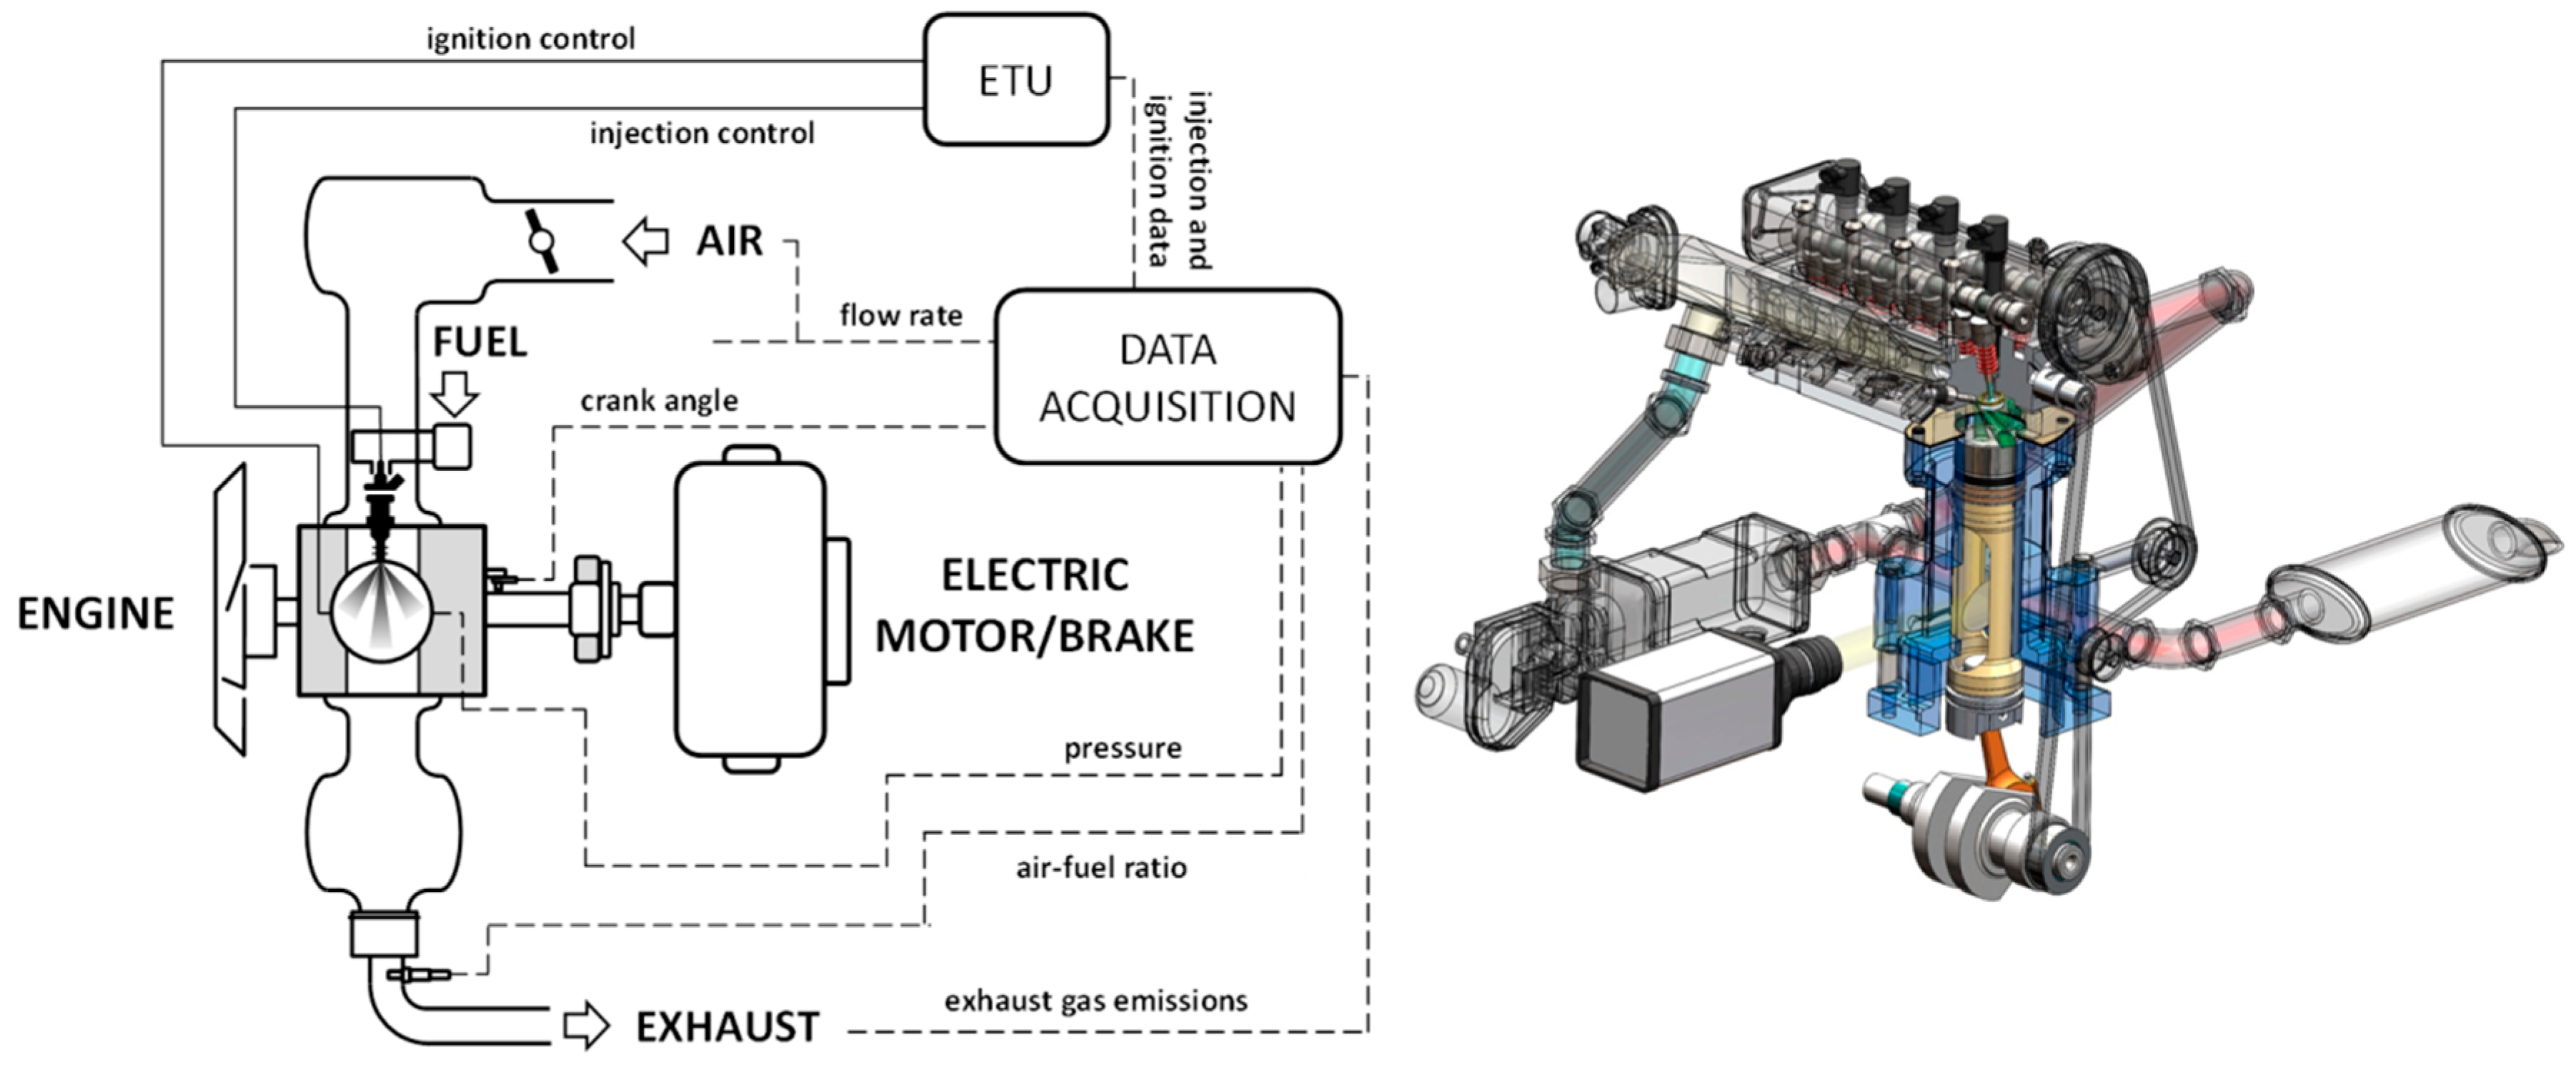
2.1. Engine

All measurements were performed on an optically accessible SI engine, when using RON95 commercial gasoline and n-butanol as fuels. Figure 1 shows the schematic representation of the experimental setup, as well as an illustration of the Bowditch design piston [34] that allowed visualization of the combustion chamber from below. Basic engine characteristics are listed in Table 1; the cylinder head of a commercial automotive power unit was fitted with four valves per cylinder and centrally located spark plug. Fuel delivery was performed using a six hole injector, side mounted on the side of the intake valves; more details on the specifics of the jet–wall interactions and metering valve flow rates, as well as gasoline and butanol properties can be found in [11,35]. In order to compensate for butanol’s lower air–fuel ratio, injection duration was augmented by a factor of 1.21 compared to gasoline fueling. In order to control relative air–fuel ratio around its stoichiometric value, the readings of a wide band exhaust gas oxygen sensor were monitored with an accuracy of ±1%.
Operating conditions of 2000 rev/min and WOT were investigated; the engine speed and load combination can be considered as representative for urban driving conditions. Spark timing was maintained at 15 CAD bTDC for all measurements, given the relatively flat indicated mean effective pressure curve around this ignition point. This choice was also preferred in order to ensure measurements with roughly the same fluid velocity at the time of ignition. Air pressure and temperature were around 1 atm and 300 K, respectively. Coolant temperature was set at 325 K so that longer combustion runs were possible without risking piston thermal expansion close to the tolerance limit; this allowed working in conditions closer to steady-state situations usually found in real-world applications.
Start of injection (SOI) was set at three different values, at 340, 300 and 260 CAD bTDC, chosen based on the findings of a previous study [11]. Even though slight variations were noted for measured relative air–fuel ratio when changing the SOI, the same duration of injection was maintained constant for each fuel. Therefore, overall stoichiometry was ensured in relation to the optimized case of SOI 300 CAD bTDC of both fuel types.
In-cylinder pressure was measured using a flush-installed piezo-electric transducer that provided an accuracy of ±1%; crank angle resolution was 0.2 CAD. Other thermodynamic parameters such as intake pressure, air, coolant and lubricant temperatures were determined with similar accuracy.
Exhaust gas concentrations were determined using a gas analyzer based on the nondispersive infrared (NDIR) measurement principle for carbon monoxide (CO) and unburned hydrocarbons (n-hexane equivalent HC); the electrochemical method was employed for nitrogen oxide (NOx) emissions. Accuracy was within 3%, and the resolution of the readings for the first component was 0.01% and 1 ppm for the other two species. Particle number and size distributions were measured by means of an Engine Exhaust Particle Sizer 3090 (EEPS) through electrical mobility methods. The EEPS measures particle size ranging from 5.6 to 560 nm, with a sizing resolution of 32 channels. Before entering the EEPS, the sample of exhaust gas was passed through a 1.5 m long line heated at 150 °C, and was afterwards diluted by means a single stage dilution, at a ratio of 10:1.

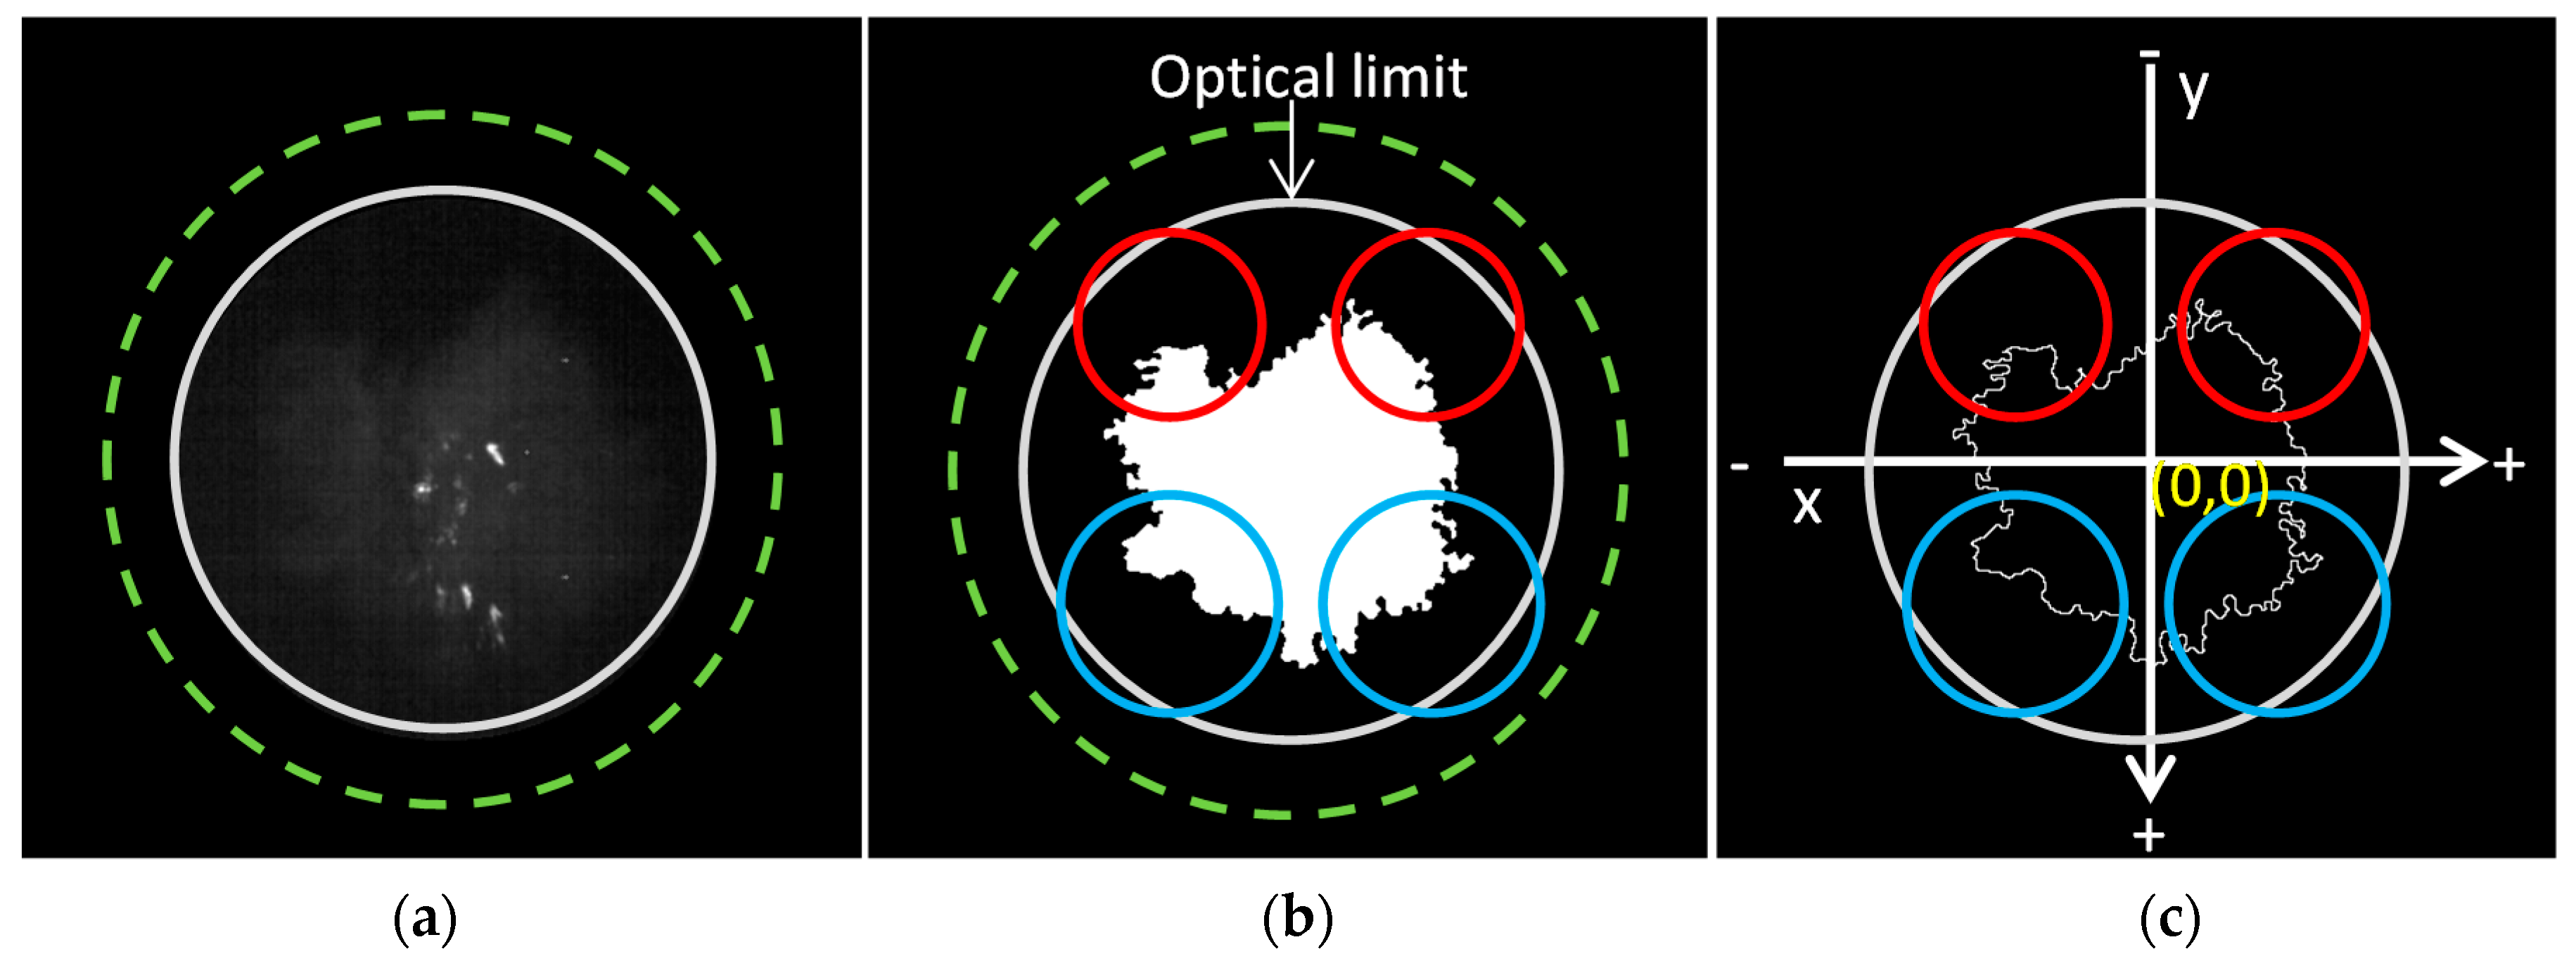
2.2. Optical Measurements

Cycle-resolved digital imaging of the combustion process was performed by an Optronis (Kehl, Germany) CamRecord 5000 high-speed camera coupled with 50-mm focus Nikon lens. The camera worked in full chip configuration (512 × 512 pixel) with a frame rate of 5 kHz, corresponding to 2.4 CAD between frames at 2000 rpm. The set-up gave a resolution of 193 μm per pixel. Synchronization of various control triggers for ignition, injection and cameras was achieved using the optical encoder mounted on the crankshaft as an external clock connected to an AVL Engine Timing Unit. The exposure time of the camera (200 μs) and the f stop of the lens (5.6) permitted obtaining a good signal to noise ratio during the early combustion stages. The episodic saturation of the images during the late combustion induced by fuel deposits burning was overcome through “ad-hoc” image processing. Specifically, macroscopic parameters related to flame morphology as well as the distribution of diffusive flames due to fuel deposits burning were evaluated via two procedures developed by NI Vision Assistant software.
For the analysis of flame front propagation, a circular mask was applied to the 256-grey scale image sequences to cut the spurious light from reflections at the boundaries of the circular window of the piston crown. Then, the brightness and contrast levels were modified by using a lookup table (LUT) function for improving the signal to noise ratio related to flame emission (Figure 2a). Successively, automatic thresholding based on the moments method was applied. The method uses the histogram of each image to determine the related threshold for binarization. More details are reported in [36,37]. Later, frequency filtering was applied to correct the drifts in the binary images. It consisted of three steps: first, it finds the fast Fourier transform (FFT) of the source image; then the function filtered the complex image by 35% attenuation; finally, it computed the inverse FFT (Figure 2b). After this phase the coordinates of the centroid and the number of pixels in the foreground were stored. Flame area was normalized to the piston section. The border of the flame was obtained by applying a thinning function that eliminated the pixels located in a neighborhood matching the 3 × 3 square the structuring element [37]. The flame displacement was estimated considering the average distance of border pixels from the combustion chamber center along the x and y directions, as sketched in Figure 2c.
To evaluate morphological characteristics of the diffusive flames induced by the fuel deposits burning, an additional image processing routine was developed; this allowed a clear distinction between the normally propagating, spark induced flame fronts and those due to the presence of liquid fuel film. In particular, after applying the circular mask to the 256-grey scale images, the LUT was varied by a power function (with constant 3) transformation, which increases brightness and contrast in bright regions; this highlighted the diffusive flames with respect to the luminosity induced by the spark ignited burned gas. Then, the images were binarized fixing the threshold at 24/256. Pixel coordinates for the diffusive flames were stored for 20 consecutive combustion sequences, with each injection strategy, at a fixed crank angle of 100 CAD after start of spark (ASOS).
Then, the most probable spatial distribution of diffusive flames was obtained by interpolating these coordinates by the method of Kriging [38,39]. All interpolation algorithms (inverse distance squared, splines, radial basis functions, triangulation, etc.) estimate the value at a given location as a weighted sum of data values at surrounding locations. Almost all of them assign weights according to functions that give a decreasing weight with increasing separation distance. Kriging assigns these values according to a (moderately) data-driven function, weighted according to spatial covariance values. Moreover, for each injection timing, a probability density function (PDF) was obtained by calculating the cumulative of the areas and the centroid coordinates of all fuel deposits flames produced in the combustion chamber. The area was evaluated as percentage with respect to piston cross-section. The distance along x and y of flame centroids was estimated as well. Figure 3 shows the PDFs calculated for the SOI300 condition of gasoline.

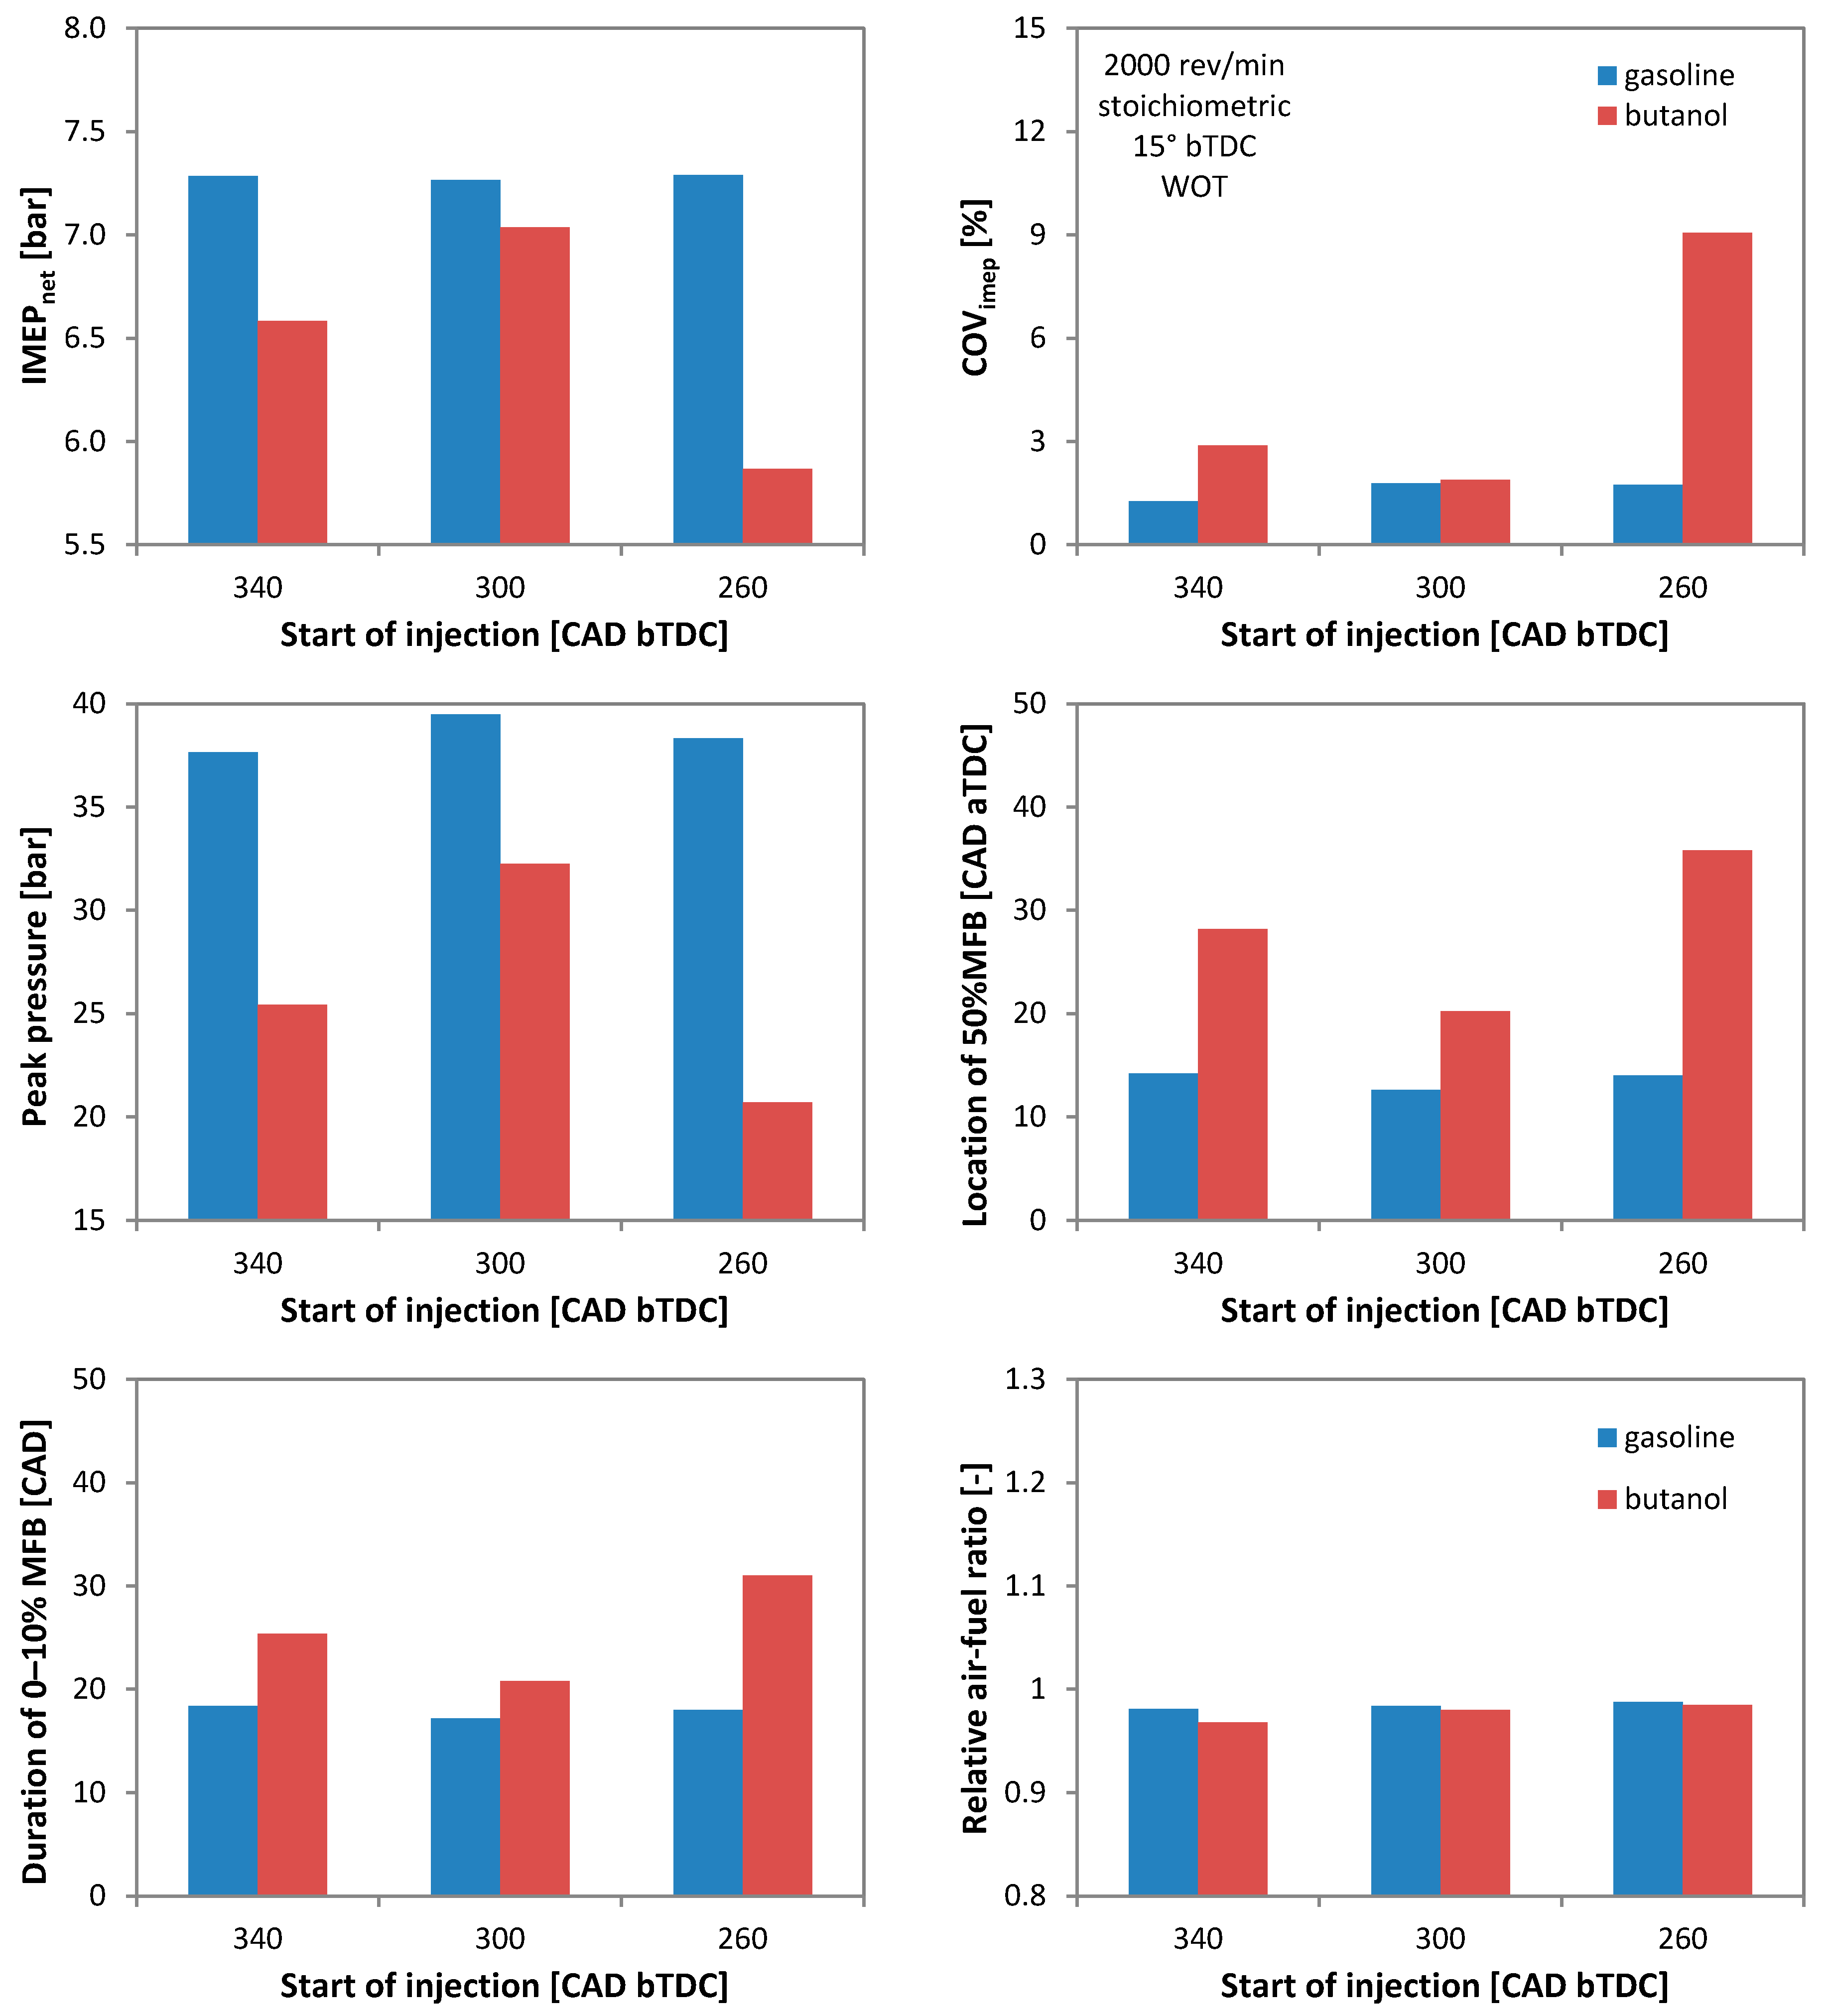
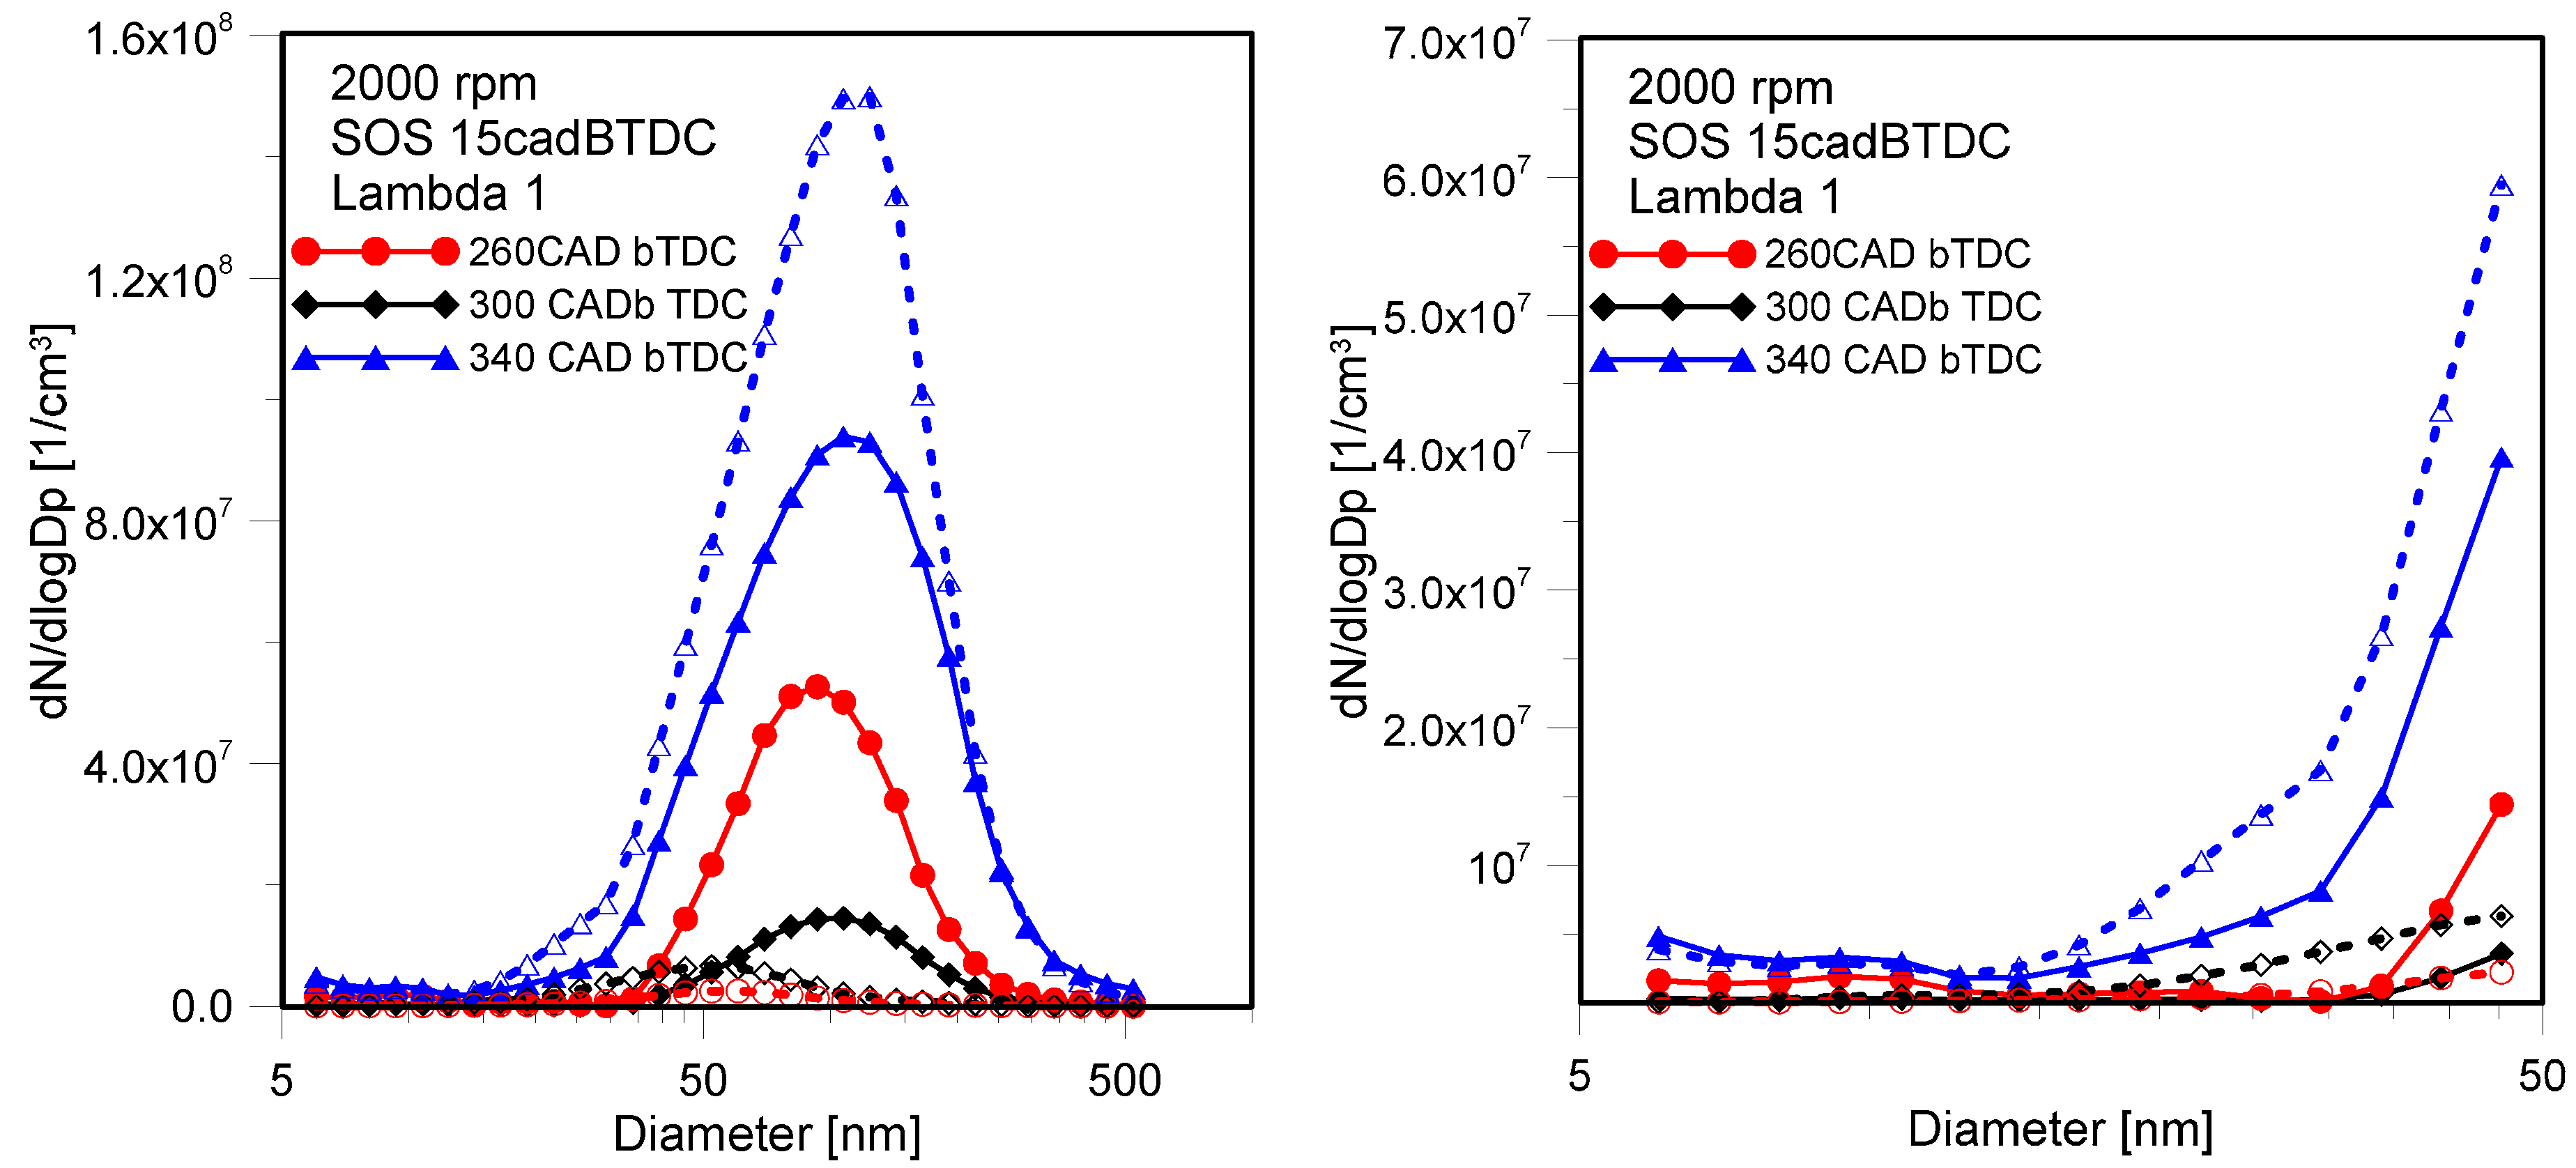
3. Results and Discussion

As anticipated in the previous section, the defining influence on engine performance and emissions was the interaction of fuel jets with the piston crown and cylinder liner, when changing injection phasing. The effect was much more evident for the alcohol compared to gasoline. Figure 4 shows overall thermodynamic and combustion phasing parameters for both fuels. Indicated mean effective pressure (IMEP) was practically the same for gasoline, with differences below 1%. On the other hand, for butanol a significant drop in engine output was recorded when retarding or advancing injection from the point of SOI 300 CAD bTDC; the loss in IMEP was around 5% for case SOI340 and over 15% for SOI260. When comparing the two fuels for the optimized SOI of 300 CAD bTDC, the alcohol featured slightly lower output, around 3% less than gasoline.
The same effect was noted when the influence of load was investigated on this engine [40]. Even though overall this result does not constitute a reason for changing injection strategy, when looking at the other combustion parameters, it becomes evident that flame propagation was “slower” for the alcohol. The initial difference recorded in the 0–10% mass fraction burned (MFB) duration was augmented further as combustion progressed; this was indicated by the location of the 50% MFB point and lower peak pressure recorded for butanol. These differences were much more evident for the SOI340 and SOI260 cases. Both conditions featured retarded combustion and lower peak pressure compared to SOI300. An interesting result is the recorded coefficient of variation (COV) when retarding butanol injection to 260 CAD bTDC; high values for this parameter are specific for lean fueling that for this engine were recorded at an equivalence ratio of 0.7 when using the SOI300 setting at the same engine speed and WOT [41]. The most likely explanation is that as injection was advanced, fuel impinged mainly on the piston. Consequently, for SOI340, an initial combustion phase with lean air–fuel mixture was followed by entrainment of the liquid fuel film on the piston within the enflamed region and subsequent overall stoichiometric oxidation reaction.
When looking at the in-cylinder pressure traces and associated rates of heat release shown in Figure 5, the effects observed for butanol are further emphasized. An interesting observation is that, for gasoline, the SOI340 setting seems to worsen combustion more than the retarded SOI260, contrary to the behavior observed for the alcohol.
With retarded fuel delivery, more liquid film was formed on the cylinder liner and therefore its entrainment by the flame was delayed to the final stages of combustion, resulting in a long period of lean “operation” during flame propagation and early expansion. This explains the observed trends of 10% and 50% MFB points, as well as that of peak pressure. Apart from the increased COV for SOI260, the overall mechanism and fuel film distribution seems to be confirmed by the changes observed in relative air–fuel ratio. With more significant impingement on the piston crown for SOI340, richer mixture was present in the central region of the combustion chamber; therefore, blow-by losses consisted of leaner charge, thus resulting in an overall equivalence ratio higher than unity. The same effect was noted for extremely advanced ignition settings, which resulted in more significant variations [42]. No definite conclusion can be formulated in this respect, given that recorded variations were close to the accuracy level, but the data do seem to confirm the impingement mechanism and its effects on mixture formation and combustion.
When analyzing only the SOI300 case, the basic properties of each fuel need to be considered as a reason for the observed drop in engine output; e.g., when using gaseous fuels, volumetric efficiency decreases for stoichiometric fueling compared to gasoline [43]. For the specific case of this study, assuming complete fuel evaporation during the intake stroke, with the same temperature at IVC and neglecting the effect of residual gas, heating value delivered to the engine would be expected to be roughly the same for both fuels [44]. In addition, butanol’s higher latent heat of vaporization should result in improved volumetric efficiency and therefore slightly higher relative air–fuel ratio, given that injection duration was compensated for ensuring stoichiometry. Nonetheless, the main conclusion is that the observed effects are due to incomplete fuel evaporation that resulted in different combustion evolution, even for the optimum injection phasing.
Hypothesizing on the mechanisms behind the observed changes, the reason most likely for this result is that the benefit of longer available penetration for the six jets with SOI260 exceeded the downside of performing injection in conditions with lower intake air velocity; with advanced fuel delivery, impingement on the piston crown played the major role, thus resulting in leaner mixture at the time of ignition, and lower rates of heat release during the first stages of combustion. The fact that gasoline is a multi-component fuel also needs to be considered; in this sense, the “heavier” components were the ones not fully evaporated. However, with retarded injection the liquid fuel film was distributed on a more widespread area, thus increasing the heat flux available for evaporation. These observations need to be evaluated with care, given the relatively reduced differences recorded for gasoline, but further emphasize the specific fuel effects and how they affect combustion development.
Analyzing the traces for butanol, it becomes evident that only the optimized case of SOI300 ensured the mixture homogeneity and distribution level that resulted in high enough rates of heat release to determine engine output comparable to that of gasoline fueling. Both SOI340 and SOI260 settings suggest “lean operation” for extensive periods after ignition, more so for retarded injection. One possible mitigation of the effects of butanol in the SOI260 case was identified in the form of split injection [45]. This further underlines the effect of jet penetration and the interaction with bulk fluid motion. Such phenomena become increasingly important as load and injected fuel quantity are increased. Therefore, optimized injection strategies developed based on the evaluation of impingement effects should ensure multi-fuel operation with high efficiency and reduced emissions.
Regarding the formation of pollutant emissions, when looking at measured CO, HC and NOx values shown in Figure 6, it becomes evident that differences recorded in combustion evolution had a significant impact on chemistry as well. As expected, carbon monoxide concentrations were within a relatively narrow range in all conditions. A slight descending trend can be identified as injection was retarded, but with no significant variations. Unburned hydrocarbon emissions followed roughly the same line, suggesting overall stoichiometric combustion; these results also seem to be confirmed by the measured air–fuel ratio. Interestingly enough, HC concentrations for butanol were at their lowest level for SOI260. At first, this seems to be counterintuitive, given that, for this setting, more liquid fuel is expected to be found in the top-land region. One important aspect is the long combustion period during expansion; this most likely contributed to more complete evaporation of the liquid, even if the contribution of heat flux transferred from the walls to the fuel film should be relatively reduced compared to that from the bulk gas [11]. This, combined with large periods available for fuel evaporation, promoted complete oxidation, despite more fuel impingement on the cylinder liner. The values recorded for NOx concentrations seem to suggest that even for gasoline a minimum stratification was present; if the thermal effect explains the slight increase when comparing SOI260 to SOI340, the lower value for SOI300 could be the result of favorable mixture stratification. Nonetheless, variations can be considered as reduced when compared to those recorded for the alcohol. In this sense, the thermal effect was the main mechanism behind the observed variations.
In order to more thoroughly evaluate the effect of injection phasing on the engine’s environmental impact, measurements of particle numbers were analyzed. Figure 7 shows the size distribution overall, within 5.6–560 nm, as well as in the range 5.6–50 nm.
The distributions show a strong accumulation mode for all the conditions that were tested. The presence of particles smaller than 23 nm was also observed, even if they are more evident at 340 CAD bTDC for both fuels. Gasoline showed lowest particle number for SOI 300 CAD bTDC; instead, for butanol this parameter increased with the advancement of injection timing. A common trend noted for both gasoline and butanol, is a shift of the distribution curve towards larger diameters as injection timing was advanced. These results can be ascribed to the different spray evolution and combustion process. Stronger impingement of the alcohol on the liner occurring at 260 CAD bTDC, typical of the delayed injection, enhanced the formation of soot; anyway, the longer and delayed combustion (Figure 5) improved soot oxidation resulting in lower particle emissions. For gasoline fueling, combustion evolution was quite similar when varying the SOI, but the in-cylinder conditions were different. With advanced fuel delivery, unfavorable jet penetration worsened fuel evaporation and charge stratification, leading to larger particle emissions. For the delayed injection timing of SOI 260 CAD bTDC, the piston was further away from the injector, therefore providing more “space” available for fuel evaporation with respect the previous case; this mostly counteracted the lower fluid velocity specific for the late intake stroke in the case of gasoline. The SOI 300 CAD bTDC setting ensured good mixture formation and evaporation, thus resulting in a good compromise between jet penetration and air motion, along with relatively low particle emissions.
Cycle-resolved flame imaging data (Figure 8) for the sequence corresponding to the cycle closest to the average pressure trace were found to be well correlated to VFB lines (Figure 5). Indeed, flame propagation was found to feature minimum variations when changing SOI with gasoline. With butanol, the optimized condition of SOI300 was the “fastest” and the most retarded injection setting was the “slowest”. These results are in line with the previous study [11] aimed at butanol fueling. A more interesting finding is the confirmation of flame displacement for both fuels in the same direction when switching from one injection strategy to another. The images shown in Figure 9 suggest that the same mechanism determined the observed changes for gasoline as well as butanol. Given that the effect was much more prominent for the alcohol, mixture distribution seems to be the reason most likely to explain this behavior.
Figure 10 shows results that were averaged over 20 consecutive cycles. At the fixed crank angle of 5 CAD aTDC (20 CAD aSOS), flame front propagation was generally “faster” for gasoline, in line with the observed combustion phasing parameters. An interesting result is that the flame area COV correlated relatively well with that of the IMEP; reduced variation of this parameter was confirmed for gasoline, and for butanol fueling, the “worse” case was SOI260, as was the case of overall measured cyclic variability. This further emphasizes the role of flame front propagation on the repeatability of combustion, as well as the indirect effects of fuel evaporation. Flame displacement during its propagation is the result of fluid motion, local gas temperature and air–fuel ratio. The two fuels showed quite different displacement, but also common trends. For correct interpretation of these results in correlation to the images shown in Figure 9, positive translation along the y-axis means displacement “downwards” towards the intake valves, and, on the contrary, negative y values mean “upwards” towards the exhaust valves.
As previously stated, when considering the effect of fuel evaporation, it would seem that mixture stratification played the major role. This is due to butanol’s higher latent heat of vaporization, but also its low saturation pressure that impaired homogenous charge distribution; therefore the effect was much more prominent for the alcohol. However, air–fuel mixture formation needs to b treated from multiple perspectives. In this sense, charge motion would be expected to displace the flame towards the exhaust valves given the tumble-inducing cylinder head architecture that features four valves (two for intake and two for exhaust).
This is confirmed by the relatively reduced translation along the x-axis; a minimum presence of swirl is to be expected, given that the “final” port out of the four featured by the cylinder head was used when coupling it to the engine block; the throttle valve was fitted at the other end of the intake manifold, thus resulting in a 90° bend in the intake air flow prior to the runner (please note that only one of the four was illustrated in Figure 1). In other words, slightly higher velocity is expected over the intake valve positioned on the right hand side of the images shown in Figure 9. When analyzing the displacement along the y-axis, high sensitivity of butanol is quite evident. An interesting result is that for SOI300 and 260, the alcohol featured a significant displacement opposite to the direction that would be expected due to tumble. Gasoline featured the same trend, more evident only for late injection. This can be explained through two different mechanisms. One is that the organized fluid motion is quickly converted into turbulence around TDC [46]; the other is that the interaction with the six fuel jets can induce other velocity components that can even partially cancel out tumble [47,48]. Nonetheless, the net difference recorded between the two fuels suggests that mixture stratification plays the most significant role.
After establishing the correlation between air–fuel mixture formation at different injection settings, and preferred directions of flame front propagation, diffusive flames induced by liquid fuel film were investigated as well. Figure 11 shows images that are representative for the late combustion stage.
What is immediately evident is that there is a significant difference between the two fuels: a common trend is that the SOI340 setting featured more intense and extended areas of such diffusive flames, while late fuel delivery resulted in reduced luminosity; the optimized case was in-between the two.
Given that the image processing technique allowed the identification of diffusive flames with respect to normally propagating ones, distribution maps were built at 100 CAD after ignition initiation, by using optical data averaged over 20 consecutive cycles. Both fuels featured a shift from the side of the exhaust valves to the intake when changing the SOI from 340 to 260 CAD bTDC. This correlates well with the impact of the six fuel jets on the combustion chamber walls. For early injection, most of the fuel impinged on the piston crown, while for late fuel delivery, liquid film was formed on the cylinder liner. This is more evident for butanol, further emphasizing low evaporation rates that allowed the presence of rich zones throughout combustion. At first glance, in the case of SOI260 the mixture seems more homogenous. Only one such zone (albeit reduced in size) was observed towards the intake side, in line with the jet that featured quasi-vertically penetration; therefore, the other jets most likely interacted with the liner. This explains why combustion was “slower” for the alcohol, given that stratification was unfavorable for the initial stages of flame front propagation. For SOI340, as the piston was closer to the injector, practically all six jets impinged on the piston. The slight asymmetry is due to the combined effects of turbulence and swirl; backflow into the combustion chamber during the expansion stroke also needs to be considered. All these considerations were far less evident for gasoline, in line with the thermodynamic analysis that suggested reduced effect of injection settings. Nonetheless, the results underline the importance of fuel jets interaction with the combustion chamber walls and incoming air flow, especially when using fuels that feature low saturation pressure, such as butanol. For both fuels, the SOI300 case provided an optimized solution, confirmed by the distribution of diffusive flames during late combustion shown in Figure 12.
An interesting result is the analysis of diffusive flames displacement, as shown in Figure 13. The common trend for both fuels, with comparable absolute values, is related to the fact that the location of impingements sites was the same for both fuels; being the result of a much more repeatable process (i.e., fuel injection), the influence of turbulence is dramatically reduced compared to the displacement of spark ignited flames. As expected, minimum displacement was observed along the x-axis.
As the findings of a previous study suggested [11], a good correlation was established between diffusive flames luminosity (intended as integrated over the entire field of view) and smoke opacity measured at the exhaust. A similar trend was recorded for the area of diffusive flames shown in Figure 14.
More detailed information can be obtained through PN analysis, which also circumvents issues associated with the equivalence between particle mass and smoke opacity [49]. Figure 15 shows the comparison of ultrafine (<50 nm diameter) and total particulate mass and number measured at the exhaust. Already as an overview, there is a clear correlation between the in-cylinder processes and measurements in the exhaust line. The prevalence of locally rich areas due to impingement on the piston crown for SOI340, were associated with high overall particulate mass and number. The effect can be also associated to the strong increase in the mean value and median of normal distributions evaluated for the diffusive flame areas, as it shows in Figure 14. These datasets suggest that advanced fuel delivery is not beneficial for lowering particulate emissions; this is, most importantly, especially as when increasing load (and therefore high fuel flow is present), injection needs to be advanced so that high intake air velocity is exploited. To put things into perspective, injection duration was around 40 CAD (lower for gasoline, higher for the alcohol); when considering that the investigated load level is WOT, for boosted conditions fuel flow can range from 1.5 to 2.5 times, depending on the level of downsizing [50]. Therefore, changes in injection phasing required by high load conditions can have significant effects, even for modifications such as the relatively narrow 40 CAD shift that was considered for this study. When looking at the relative trend for each energy source, it is evident that the alcohol featured a much more prominent sensitivity to changes in injection strategy. As previously observed (Figure 7) the mean diameter of the particle size distributions measured for butanol increased by around 40% (from ≈60 nm to ≈100 nm) when switching the injection from SOI260 to SOI340. On the other hand, the mean diameter for gasoline was marginally influenced by the injection strategy and the increase in size resulted around 10% (from ≈100 nm to ≈110 nm). Thus, fuel impingement on the piston surface observed at SOI340 for butanol determined the formation of aggregate carbonaceous structures similar to the soot observed for GDI engines [51]. In another study, changing the fuel injection timing when using alcohol fuel, the formation of small particles (nanoparticles) was induced; this was in agreement with TEM morphology investigations [52] that demonstrated how the exhaust particles from DISI engines fueled with gasoline exhibited graphitic structures, regardless of fuel injection timing. In the case of alcohol fueling, higher number of smaller nanoparticles was observed and their structure changed to amorphous as a consequence of the variation in injection timing. Surface Enhanced Raman Spectroscopy (SERS) showed that the DISI engine nanoparticles have a solid core with a size of 1–5 nm featured by disordered amorphous carbon structure, similar to those measured for flame-generated nanoparticles [53]. The evolution of carbonaceous structures induced by the fuel injection strategy for butanol, also determined a change in the aggregation tendency. This justified the strong difference in the mean size of particle distribution. It should be noted that the evolution in the chemical nature of the carbonaceous particles also influenced the tendency towards sticking with other solid compounds (such as metals) and the adsorption properties [54].
An interesting observation is that the SOI300 and SOI260 cases featured extremely low overall particle number and mass concentrations when using the alcohol. This seems to conflict with the optical data (i.e., in-cylinder soot formation); however, when looking at the small particles, a good correlation is observed between the two categories of data.
Therefore, the differences in fuel properties resulted in dissimilar evolution of the particles and their distribution with respect to size, during combustion and up to the point that they were sampled in the exhaust line. Another interesting result is the increase in PN and mass concentration for gasoline, when switching from SOI300 to late fuel delivery. This is related to the phenomenon of fuel impingement on the cylinder liner; even though longer fuel penetration was available for SOI260, reduced air velocity resulted in poorer air–fuel mixing with respect to the optimized SOI300 case. The multi-component nature of gasoline also played a role. As previously stated, longer time available for fuel evaporation before flame arrival compared to SOI340, and high wall temperature, were most likely not enough to completely eliminate liquid films of “heavier” components (that feature reduced saturation pressure, lower than that of butanol). Another aspect that needs to be considered is that the optical accessibility does not allow the secondary flames near the cylinder wall to be visualized. Nonetheless, the effect was nowhere near as important as for the advanced injection setting.
The combined evaluation of in-cylinder pressure, exhaust emissions and flame imaging show significant effects of butanol when performing even relatively small changes in the injection phasing during the intake stroke. As previously mentioned, this effect would be more prominent during boosted operation and should therefore require adaptation of engine control settings; one possible solution is splitting the injection. Dividing fuel delivery in two equal parts was found to ensure comparable performance for both fuels and reduction of particle emissions for the alcohol [55]. The dwell time between the first and second injection was optimized based on numerical simulations for gasoline fueling and was found to be suitable for butanol as well. This suggests that indeed jet–wall interactions and liquid film formation are the driving mechanisms, regardless of the fuel, and obtaining the best compromise between jet penetration and bulk fluid flow is a good strategy for developing control algorithms. Most likely, there is room for optimizing the first–second injection quantity ratio, but the core concept is to avoid extensive wall wetting through split fuel delivery. Even the “worst case scenario” for butanol (i.e., case SOI260) featured practically the same performance levels as with gasoline fueling, as well as ensuring overall reductions of exhaust gas emissions [45].

4. Conclusions

A detailed scrutiny of combustion and exhaust emissions was performed on an optically accessible spark ignition engine. The effect of injection phasing was investigated for a wall guided system, when fueling the engine with butanol and gasoline.
Cycle-resolved flame imaging was correlated to the combustion parameters obtained via in-cylinder pressure analysis and particulate number measurements at the exhaust. Thermodynamic data showed that three start of injection settings during the intake stroke resulted in quite different engine output characteristics for the alcohol; on the other hand, with gasoline, minor modifications were recorded. Exhaust gas emissions featured relatively close CO and HC concentrations, with only NOx species featuring significant changes to injection phasing for butanol. Particle number measurements also suggested increased sensitivity for the alcohol. Combustion evolution and exhaust emissions were correlated to flame imaging, which confirmed significantly different flame front evolution for the two fuels. Flame displacement showed an important role of charge stratification; in this sense, the preferred direction of propagation was opposite for the SOI340 and SOI260 cases, as well as common for both gasoline and butanol. The location of secondary or diffusive flames confirmed the mechanism of fuel impingement on the piston crown and cylinder liner as the reason for observed changes in engine performance and pollutant species evolution. The trend of decreasing diffusive flame areas when retarding fuel delivery was common for both fuels and correlated well with measured particle number and mass, especially for the alcohol. On the other hand, the setting with minimum particulate emissions featured low indicated mean effective pressure and high instability; the best compromise was found to be starting the injection so that acceptable jet penetration and high intake air velocity was exploited. The optimized case of SOI300 was found to ensure high engine output and satisfactory concentrations of pollutant emissions in the exhaust line.
As a general conclusion, the study emphasizes the need to adjust engine control strategies when substituting gasoline with butanol. One positive aspect is that the optimized setting for high engine output also ensured low particle emissions. Nonetheless, as the effect is directly related to the actual injected fuel quantity, correct implementation of alternative fuels such as alcohols is paramount in medium and high load conditions.

Acknowledgments

The authors are grateful to Mr. Carlo Rossi for his support in the experimental activities.

Author Contributions

All four authors contributed to conceiving and designing the experiments, Silvana Di Iorio and Adrian Irimescu performed the measurements, Silvana Di Iorio, Adrian Irimescu and Simona Silvia Merola analyzed the data and wrote the paper, Bianca Maria Vaglieco coordinated the activities.

Conflicts of Interest

The authors declare no conflict of interest

References

  1. Kalghatgi, G.T. Developments in internal combustion engines and implications for combustion science and future transport fuels. Proc. Comb. Inst. 2017, 35, 101–115. [Google Scholar] [CrossRef]
  2. Berggren, C.; Magnusson, T. Reducing automotive emissions—The potentials of combustion engine technologies and the power of policy. Energy Policy 2012, 41, 636–643. [Google Scholar] [CrossRef]
  3. Alagumalai, A. Internal combustion engines: Progress and prospects. Renew. Sustain. Energy Rev. 2014, 31, 561–571. [Google Scholar] [CrossRef]
  4. Linse, D.; Kleemann, A.; Hasse, C. Probability density function approach coupled with detailed chemical kinetics for the prediction of knock in turbocharged direct injection spark ignition engines. Combust. Flame 2014, 161, 997–1014. [Google Scholar] [CrossRef]
  5. Karavalakis, G.; Short, D.; Vu, D.; Russell, R.L.; Asa-Awuku, A.; Jung, H.; Johnson, K.C.; Durbin, T.D. The impact of ethanol and iso-butanol blends on gaseous and particulate emissions from two passenger cars equipped with spray-guided and wall-guided direct injection SI (spark ignition) engines. Energy 2015, 82, 168–179. [Google Scholar] [CrossRef]
  6. Wyszynski, L.; Stone, C.; Kalghatgi, G. The Volumetric Efficiency of Direct and Port Injection Gasoline Engines with Different Fuels. SAE Tech. Pap. 2002. [Google Scholar] [CrossRef]
  7. Sementa, P.; Vaglieco, B.M.; Catapano, F. Thermodynamic and optical characterizations of a high performance GDI engine operating in homogeneous and stratified charge mixture conditions fueled with gasoline and bio-ethanol. Fuel 2012, 96, 204–219. [Google Scholar] [CrossRef]
  8. Fischer, J.; Velji, A.; Spicher, U. Investigation of Cycle-to-Cycle Variations of In-Cylinder Processes in Gasoline Direct Injection Engines Operating With Variable Tumble Systems. SAE Tech. Pap. 2004. [Google Scholar] [CrossRef]
  9. Price, P.; Twiney, B.; Stone, R.; Kar, K.; Walmsley, H. Particulate and Hydrocarbon Emissions from a Spray Guided Direct Injection Spark Ignition Engine with Oxygenate Fuel Blends. SAE Tech. Pap. 2007. [Google Scholar] [CrossRef]
  10. Schmidt, L.; Seabrook, J.; Stokes, J.; Ahmad Zuhdi, M.; Begg, S.; Heikal, M.; King, J. Multiple Injection Strategies for Improved Combustion Stability under Stratified Part Load Conditions in a Spray Guided Gasoline Direct Injection (SGDI) Engine. SAE Tech. Pap. 2011. [Google Scholar] [CrossRef]
  11. Merola, S.S.; Irimescu, A.; Marchitto, L.; Tornatore, C.; Valentino, G. Effect of injection timing on combustion and soot formation in a direct injection spark ignition engine fueled with butanol. Int. J. Engine Res. 2016. [Google Scholar] [CrossRef]
  12. Bertsch, M.; Koch, T.; Velji, A.; Kubach, H. Thermodynamic and Optical Investigations on Particle Emissions in a DISI Engine at Boosted Operation. SAE Int. J. Engines 2016, 9, 154–170. [Google Scholar] [CrossRef]
  13. Clenci, A.; Bîzîiac, A.; Podevin, P.; Descombes, G.; Deligant, M.; Niculescu, R. Idle Operation with Low Intake Valve Lift in a Port Fuel Injected Engine. Energies 2013, 6, 2874–2891. [Google Scholar] [CrossRef]
  14. Wang, T.; Liu, D.; Wang, G.; Tan, B.; Peng, Z. Effects of Variable Valve Lift on In-Cylinder Air Motion. Energies 2015, 8, 13778–13795. [Google Scholar] [CrossRef]
  15. Li, T.; Yin, T.; Wang, B. Anatomy of the cooled EGR effects on soot emission reduction in boosted spark-ignited direct-injection engines. Appl. Energy 2017, 190, 43–56. [Google Scholar] [CrossRef]
  16. Alger, T.; Huang, Y.; Hall, M.; Matthews, R. Liquid Film Evaporation Off the Piston of a Direct Injection Gasoline Engine. SAE Tech. Pap. 2001. [Google Scholar] [CrossRef]
  17. Yu, H.; Liang, X.; Shu, G.; Wang, X.; Wang, Y.; Hongsheng Zhang, H. Experimental Investigation on Wall Film Distribution of Dimethyl Ether/Diesel Blended Fuels Formed during Spray Wall Impingement. Energies 2016, 9, 949. [Google Scholar] [CrossRef]
  18. Lucchini, T.; D’Errico, G.; Onorati, A.; Bonandrini, G.; Venturoli, L.; Di Gioia, R. Development of a CFD Approach to Model Fuel-Air Mixing in Gasoline Direct-Injection Engines. SAE Tech. Pap. 2012. [Google Scholar] [CrossRef]
  19. Sphicas, P.; Pickett, L.; Skeen, S.; Frank, J.; Lucchini, T.; Sinoir, D.; D’Errico, G.; Saha, K.; Som, S. A Comparison of Experimental and Modeled Velocity in Gasoline Direct-Injection Sprays with Plume Interaction and Collapse. SAE Int. J. Fuels Lubr. 2017, 10, 184–201. [Google Scholar] [CrossRef]
  20. Breda, S.; D’Adamo, A.; Fontanesi, S.; D’Orrico, F.; Irimescu, A.; Merola, S.S.; Giovannoni, N. Numerical Simulation of Gasoline and n-Butanol Combustion in an Optically Accessible Research Engine. SAE Int. J. Fuels Lubr. 2017, 10, 32–55. [Google Scholar] [CrossRef]
  21. Kalghatgi, G.T.; Bradley, D. Pre-ignition and “super-knock” in turbo-charged spark-ignition engines. Int. J. Engine Res. 2012, 13, 399–414. [Google Scholar] [CrossRef]
  22. Fontanesi, S.; d’Adamo, A.; Rutland, C.J. Large-Eddy simulation analysis of spark configuration effect on cycle-to-cycle variability of combustion and knock. Int. J. Engine Res. 2015, 16, 403–418. [Google Scholar] [CrossRef]
  23. D’Adamo, A.; Breda, S.; Fontanesi, S.; Irimescu, A.; Merola, S.S.; Tornatore, C. A RANS knock model to predict the statistical occurrence of engine knock. Appl. Energy 2017, 191, 251–263. [Google Scholar] [CrossRef]
  24. Di Iorio, S.; Mancaruso, E.; Sementa, P.; Vaglieco, B.M. A comprehensive analysis of the impact of biofuels on the performance and emissions from compression and spark-ignition engines. Int. J. Engine Res. 2015, 16, 680–690. [Google Scholar] [CrossRef]
  25. Szwaja, S.; Naber, J.D. Combustion of n-butanol in a spark-ignition IC engine. Fuel 2010, 89, 1573–1582. [Google Scholar] [CrossRef]
  26. Aleiferis, P.G.; Serras-Pereira, J.; Richardson, D. Characterisation of flame development with ethanol, butanol, iso-octane, gasoline and methane in a direct-injection spark-ignition engine. Fuel 2013, 109, 256–278. [Google Scholar] [CrossRef]
  27. Rakopoulos, D.C.; Rakopoulos, C.D.; Giakoumis, E.G.; Papagiannakis, R.G.; Kyritsis, D.C. Influence of properties of various common bio-fuels on the combustion and emission characteristics of high-speed DI (direct injection) diesel engine: Vegetable oil, bio-diesel, ethanol, n-butanol, diethyl ether. Energy 2014, 73, 354–366. [Google Scholar] [CrossRef]
  28. Rakopoulos, D.C.; Rakopoulos, C.D.; Giakoumis, E.G. Impact of properties of vegetable oil, biodiesel, ethanol and n-butanol on the combustion and emissions of an HDDI diesel engine operating under steady-state and transient conditions. Fuel 2015, 156, 1–19. [Google Scholar] [CrossRef]
  29. Gu, X.; Huang, Z.; Cai, J.; Gong, J.; Wu, X.; Lee, C. Emission characteristics of a spark-ignition engine fuelled with gasoline-n-butanol blends in combination with EGR. Fuel 2012, 93, 611–617. [Google Scholar] [CrossRef]
  30. He, B.Q.; Chen, X.; Lin, C.L.; Zhao, H. Combustion characteristics of a gasoline engine with independent intake port injection and direct injection systems for n-butanol and gasoline. Energy Convers. Manag. 2016, 124, 556–565. [Google Scholar] [CrossRef]
  31. Irimescu, A.; Marchitto, L.; Merola, S.S.; Tornatore, C.; Valentino, G. Combustion process investigations in an optically accessible DISI engine fuelled with n-butanol during part load operation. Renew. Energy 2015, 77, 363–376. [Google Scholar] [CrossRef]
  32. Chen, Z.; Yang, F.; Xue, S.; Wu, Z.; Liu, J. Impact of higher n-butanol addition on combustion and performance of GDI engine in stoichiometric combustion. Energy Convers. Manag. 2015, 106, 385–392. [Google Scholar] [CrossRef]
  33. Wei, H.; Feng, D.; Pan, M.; Pan, J.Y.; Rao, X.K.; Gao, D. Experimental investigation on the knocking combustion characteristics of n-butanol gasoline blends in a DISI engine. Appl. Energy 2016, 175, 346–355. [Google Scholar] [CrossRef]
  34. Bowditch, F. A new tool for combustion research a quartz piston engine. SAE Tech. Pap. 1961. [Google Scholar] [CrossRef]
  35. Irimescu, A.; Merola, S.S.; Valentino, G. Application of an entrainment turbulent combustion model with validation based on the distribution of chemical species in an optical. Appl. Energy 2016, 162, 908–923. [Google Scholar] [CrossRef]
  36. Tsai, W. Moment-preserving thresholding: A new approach. Comput. Vis. Graph. Image Process. 1985, 29, 377–393. [Google Scholar] [CrossRef]
  37. Klinger, T. Image processing with LabVIEW and IMAQ Vision; Prentice Hall Professional: Upper Saddle River, NJ, USA, 2003. [Google Scholar]
  38. Yilmaz, H.M. The effect of interpolation methods in surface definition: An experimental study. Earth Surf. Processes Landf. 2007, 32, 1346–1361. [Google Scholar] [CrossRef]
  39. Yang, C.S.; Kao, S.P.; Lee, F.B.; Hung, P.S. Twelve different interpolation methods: A case study of Surfer 8.0. In Proceedings of the XXth ISPRS Congress, Istanbul, Turkey, 12–23 July 2004; Volume 35, pp. 778–785. [Google Scholar]
  40. Irimescu, A.; Tornatore, C.; Merola, S.S.; Valentino, G. Integrated Diagnostics for Combustion Investigation in a DISI Engine Fueled with Butanol and Gasoline at Different Load Settings. In Proceedings of the Colloquium Fuels—Conventional and Future Energy for Automobiles, Stuttgart/Ostfildern, Germany, 20–22 January 2015; pp. 117–128. [Google Scholar]
  41. Irimescu, A.; Merola, S.; Tornatore, C.; Valentino, G.; Grimaldi, A.; Carugati, E.; Silva, S. Plasma Assisted Ignition Effects on a DISI Engine Fueled with Gasoline and Butanol under Lean Conditions and with EGR. SAE Tech. Pap. 2016. [Google Scholar] [CrossRef]
  42. Irimescu, A.; Tornatore, C.; Marchitto, L.; Merola, S.S. Compression ratio and blow-by rates estimation based on motored pressure trace analysis for an optical spark ignition engine. Appl. Therm. Eng. 2013, 61, 101–109. [Google Scholar] [CrossRef]
  43. Sevik, J.; Pamminger, M.; Wallner, T.; Scarcelli, R.; Reese, R.; Iqbal, A.; Boyer, B.; Wooldridge, S.; Hall, C.; Miers, S. Performance, Efficiency and Emissions Assessment of Natural Gas Direct Injection compared to Gasoline and Natural Gas Port-Fuel Injection in an Automotive Engine. SAE Int. J. Engines 2016, 9, 1130–1142. [Google Scholar] [CrossRef]
  44. Irimescu, A. Air-fuel h–x diagram for gasoline-isobutanol blends. Proc. Rom. Acad. Ser. A 2010, 11, 322–329. [Google Scholar]
  45. Merola, S.S.; Irimescu, A.; Tornatore, C.; Valentino, G. Effect of the Fuel-Injection Strategy on Flame-Front Evolution in an Optical Wall-Guided DISI Engine with Gasoline and Butanol Fueling. J. Energy Eng. 2016, 142, E4015004. [Google Scholar] [CrossRef]
  46. Kang, K.Y.; Baek, J.H. Turbulence characteristics of tumble flow in a four-valve engine. Exp. Therm. Fluid Sci. 1998, 18, 231–243. [Google Scholar] [CrossRef]
  47. Kim, T.; Song, J.; Park, S. Effects of turbulence enhancement on combustion process using a double injection strategy in direct-injection spark-ignition (DISI) gasoline engines. Int. J. Heat Fluid Flow 2015, 56, 124–136. [Google Scholar] [CrossRef]
  48. Zeng, W.; Sjöberg, M. Utilizing boost and double injections for enhanced stratified-charge direct-injection spark-ignition engine operation with gasoline and E30 fuels. Int. J. Engine Res. 2017, 18, 131–142. [Google Scholar] [CrossRef]
  49. Giechaskiel, B.; Maricq, M.; Ntziachristos, L.; Dardiotis, C.; Wang, X.; Axmann, H.; Bergmann, A.; Schindler, W. Review of motor vehicle particulate emissions sampling and measurement: From smoke and filter mass to particle number. J. Aerosol Sci. 2014, 67, 48–86. [Google Scholar] [CrossRef]
  50. Turner, J.; Popplewell, A.; Patel, R.; Johnson, T.; Darnton, N.J.; Richardson, S.; Bredda, S.W.; Tudor, R.J.; Bithell, C.I.; Jackson, R.; et al. Ultra Boost for Economy: Extending the Limits of Extreme Engine Downsizing. SAE Int. J. Engines 2014, 7, 387–417. [Google Scholar] [CrossRef]
  51. Lee, C.B.; Oh, K.C.; Seong, H.; Choi, S. Morphology and Structure of Engine-like Soot Particles formed by a Soot/SOF Generator. In Proceedings of the 19th ETH Conference on Combustion Generated Nanoparticles, Zurich, Switzerland, 28–29 June 2015. [Google Scholar]
  52. Lee, K.; Seong, H.; Sakai, S.; Hageman, M.; Rothamer, D. Detailed Morphological Properties of Nanoparticles from Gasoline Direct Injection Engine Combustion of Ethanol Blends. SAE Tech. Pap. 2013. [Google Scholar] [CrossRef]
  53. Sgro, L.A.; Sementa, P.; Vaglieco, B.M.; Rusciano, G.; D’Anna, A.; Minutolo, P. Investigating the origin of nuclei particles in GDI engine exhausts. Combust. Flame 2012, 159, 1687–1692. [Google Scholar] [CrossRef]
  54. Fuller, K.A.; Malm, W.C.; Kreidenweis, S.M. Effects of mixing on extinction by carbonaceous particles. J. Geophys. Res. 1999, 104, 15941–15954. [Google Scholar] [CrossRef]
  55. Merola, S.; Irimescu, A.; Tornatore, C.; Marchitto, L.; Valentino, G. Split Injection in a DISI Engine Fuelled with Butanol and Gasoline Analyzed through Integrated Methodologies. SAE Int. J. Engines 2015, 8, 474–494. [Google Scholar] [CrossRef]
Figure 1. Experimental setup and detail of the optical path for digital imaging.
Energies 10 00832 g001
Figure 2. Sketch of the image processing steps for the analysis of the spark ignited flame morphology: (a) lookup table (LUT) function application; (b) thresholding and FFT filtering; and (c) flame contour extraction.
Energies 10 00832 g002
Figure 3. PDF of the area and x-y displacement of the centroid calculated for SOI300 with gasoline fueling.
Energies 10 00832 g003
Figure 4. Overall thermodynamic and combustion phasing parameters for the two fuels.
Energies 10 00832 g004
Figure 5. In-cylinder pressure and rate of heat release for: gasoline (left); and butanol (right). The volume fraction burned is also illustrated.
Energies 10 00832 g005
Figure 6. Exhaust gas emissions for the two fuels.
Energies 10 00832 g006
Figure 7. Particle size distribution measured at the exhaust at different SOI for gasoline (solid line) and butanol (dotted line).
Energies 10 00832 g007
Figure 8. Evolution of the flame front area for the two fuels.
Energies 10 00832 g008
Figure 9. Flame images and related contours at roughly the same flame area (i.e., around 10% MFB).
Energies 10 00832 g009
Figure 10. Flame area, variability and displacement averaged over 20 consecutive cycles.
Energies 10 00832 g010
Figure 11. Images recorded at different instances during the intake stroke, representative for the size and location of the diffusive flames.
Energies 10 00832 g011
Figure 12. Distribution maps of diffusive flames at 100 CAD after spark timing, built on data recorded over 20 consecutive cycles.
Energies 10 00832 g012
Figure 13. Diffusive flames displacement.
Energies 10 00832 g013
Figure 14. Diffusive flame area integrated over the working cycle.
Energies 10 00832 g014
Figure 15. Comparison of ultra-fine (<50 nm diameter) and total particulate mass/number emissions measured in the exhaust line.
Energies 10 00832 g015
Table 1. Engine specifications.
Bore × Stroke79 × 81.3 mm
Connecting rod length143 mm
Cylinder1
Compression ratio10
IVO3 CAD bTDC
IVC36 CAD aBDC
EVO27 CAD bBDC
EVC0 CAD aTDC
Fuel systemdirect injection 100 bar

