1. Introduction
During the past half-century, the widespread use of electronic devices has brought numerous benefits to scientific and intellectual advancement. At the same time, these essential technologies are prone to unpredictable degradation over time, which can result in catastrophic failures in mission-critical applications. Rechargeable lithium batteries (LiBs) are an example of these advances, and the highest energy densities available on the market and recent advancements in materials have also made them the most reliable.
Li-ion batteries have become the most important energy-storage device for many applications such as cellular phones, mobile computers, and medical, aerospace, and military devices, and are the leading contender to power all electric cars. Batteries are also the primary energy source for aircraft power and operation where monitoring energy storage, usage, and potential failures is critical to all operations of the aircraft including direct energy weapons (DEWs) [
1]. To support consumer needs, many of these electronic applications require rechargeable or secondary batteries that can offer long cycle life, high volumetric and gravimetric energy densities, and high power capabilities [
1,
2].
Aircraft systems require larger and higher-performance LiBs than those in portable electronics uses, as safety issues are very important. Aircraft batteries undergo different operational modes than those in portable electronics. For instance, because the aircraft is used in the open air, the batteries are subjected to damage from alternating temperature, not only during cell operation but also during storage. Moreover, non-operating time is generally much longer than the driving time, which causes capacity loss of the battery by self-discharging even under the full charge conditions. Therefore, the first and utmost challenge in designing a LiB system is to ensure its inherent safety under both normal and abusive operating conditions. Knowledge of the internal cell behavior is therefore critical [
3,
4,
5]. The main underlying concern is related to the significant temperature variation under high charge/discharge rates [
6].
For many applications, failure is considered to occur when the capacity of the battery is reduced to below 80% of its rated value. At this point, the battery is considered as an unreliable power source and should be replaced, because it tends to exhibit an exponential decay of capacity after it passes this point [
7]. Battery failure can lead to loss of operation, reduced capability, downtime, and catastrophic failure. For example, in April 2000, a plane crashed during landing when a battery failure led to an electrical malfunction that disabled the normal landing gear extension capability. Another battery failure caused the loss of a Mars global surveyor in November 2006. When the surveyor’s batteries were exposed to sunlight, the high temperature resulted in the premature depletion of the batteries. A recent survey conducted by Emerson Network Power showed that 65% of data center downtime is caused by uninterruptible power supply (UPS) battery failures. For data centers, even one hour of downtime can incur losses of tens of thousands of dollars. Another recent example of battery failure is the Boeing 787 Dreamliner. In 2013, an abnormal increase in temperature and pressure (also known as “thermal runway”) in one of the battery cells led to heavy smoke and flames while the aircraft was stationed at a terminal.
The National Transportation Safety Board issued a recommendation letter stating that such conditions can develop and propagate within the cell over time, leading to thermal runaway and battery system failure, and might not be detected by the battery management system (BMS) in time to prevent catastrophic failures [
8]. Therefore, the need to predict and understand a battery’s state of charge and state of health (SOH) at the cell level is significant. The few BMSs currently available on the market do not provide adequate information in real time to mitigate all failures because they do not report all parameters at the cell level [
9,
10,
11].
Aircraft battery packs are composed of several hundred cells and having the ability to monitor battery health at the cell level is crucial to ensure operational safety and efficiency. Typically, battery monitoring is performed by sampling external temperature and electrical properties such as current and voltage over the battery terminals, with one measurement made per group of 10 or more cells. Existing BMSs lack of reporting parameters at the individual cell level which is crucial for good cell performance and long life cycle of the battery pack.
Recent literature reports summarize studies of fiber Bragg grating (FBG) sensors integrated into Li-ion batteries under specific operating conditions and different scenarios. The sensors can show a clear difference between internal and external battery cell temperature [
12,
13,
14,
15]. The reports contend that FBG sensors are good candidates for integration inside battery cells due to their inert nature, small size, light structure, and extreme accuracy. However, the literature does not provide a detailed overview of sensor integration in various battery geometries and how these geometries affect electrode stability. Further, because a battery performs differently under various operating conditions, performance data should be reported over a longer time span instead of just short cycle rates so that continued and fundamental understanding can be obtained for improving of battery safety.
This paper reports on FBG sensor integration inside Li-ion battery coin cells. Strain, internal, and external temperatures are recorded using the FBG sensors and evaluated for the battery cell at a cycling C/20 rate. Scanning electron microscope (SEM) images of electrode degradation upon sensor integration are presented as well as recommendations for eliminating degradation in electrodes upon sensor integration and during cell charge/discharge cycles. Results show stable strain behavior within the cell and about 10 °C difference in temperature between the inside of the coin cell and the ambient environment over time during charging/discharging cycles. This study is intended to contribute to the safe integration of FBG sensors inside hermetically sealed batteries and to detection of real-time temperature and strain gradient inside a cell.
2. Methods and Materials
Why select FBG sensors? To date, thermal monitoring of batteries is typically performed on their surface through the use of thermocouples or electro-mechanical sensors [
16,
17]. Internal monitoring, however, is challenging due to the chemically aggressive and electrically noisy environment, and thus requires sensors with low invasiveness, mechanical robustness, immunity to electromagnetic radiation, and resistance to corrosion. Sensors based on fiber Bragg gratings are an effective method to perform both static and dynamic measurements of temperature, pressure, strain, and bending [
18]. FBG sensors are characterized by their high sensitivity to forces and pressure and their extremely small size (
d ≤ 200 µm). They are made from pure silica, which makes them inert to chemically reactive environments; they use a shift in light wavelength instead of electrical power to produce a signal; they are not distance-dependent; and a multiple array of sensors can be loaded on a single fiber. The main parameters measured with FBG sensors in this study are temperature and strain. Both of these parameters are significant because this study assumes that cell degradation should result in internal resistance as a result of temperature increase during cycling, while cell expansion or swelling prior to failure (i.e., strain) would be the result from off-gassing. FBG sensors have two additional advantages over other fiber optical sensing schemes. First, they have an inherent self-referencing capability—the grating encodes an absolute wavelength to be reflected to the light detector without dependence on total light levels, losses in the connecting fibers, and couplers or source power. Second, they have a distributed sensing capability—each FBG sensor is assigned a different slice of the available source spectrum to conduct wavelength division multiplexing in an optical fiber sensing network [
15]. The FBG sensor signals were captured with a Micron Optics Interrogator unit. The signals were translated into strain and temperature values using ENLIGHT software (version 10.2, Micron Optics, Atlanta, GA, USA).
Battery cell characteristics: All cells tested in this study are coin cells, and the basic chemistry along with the operating conditions are summarized in
Table 1.
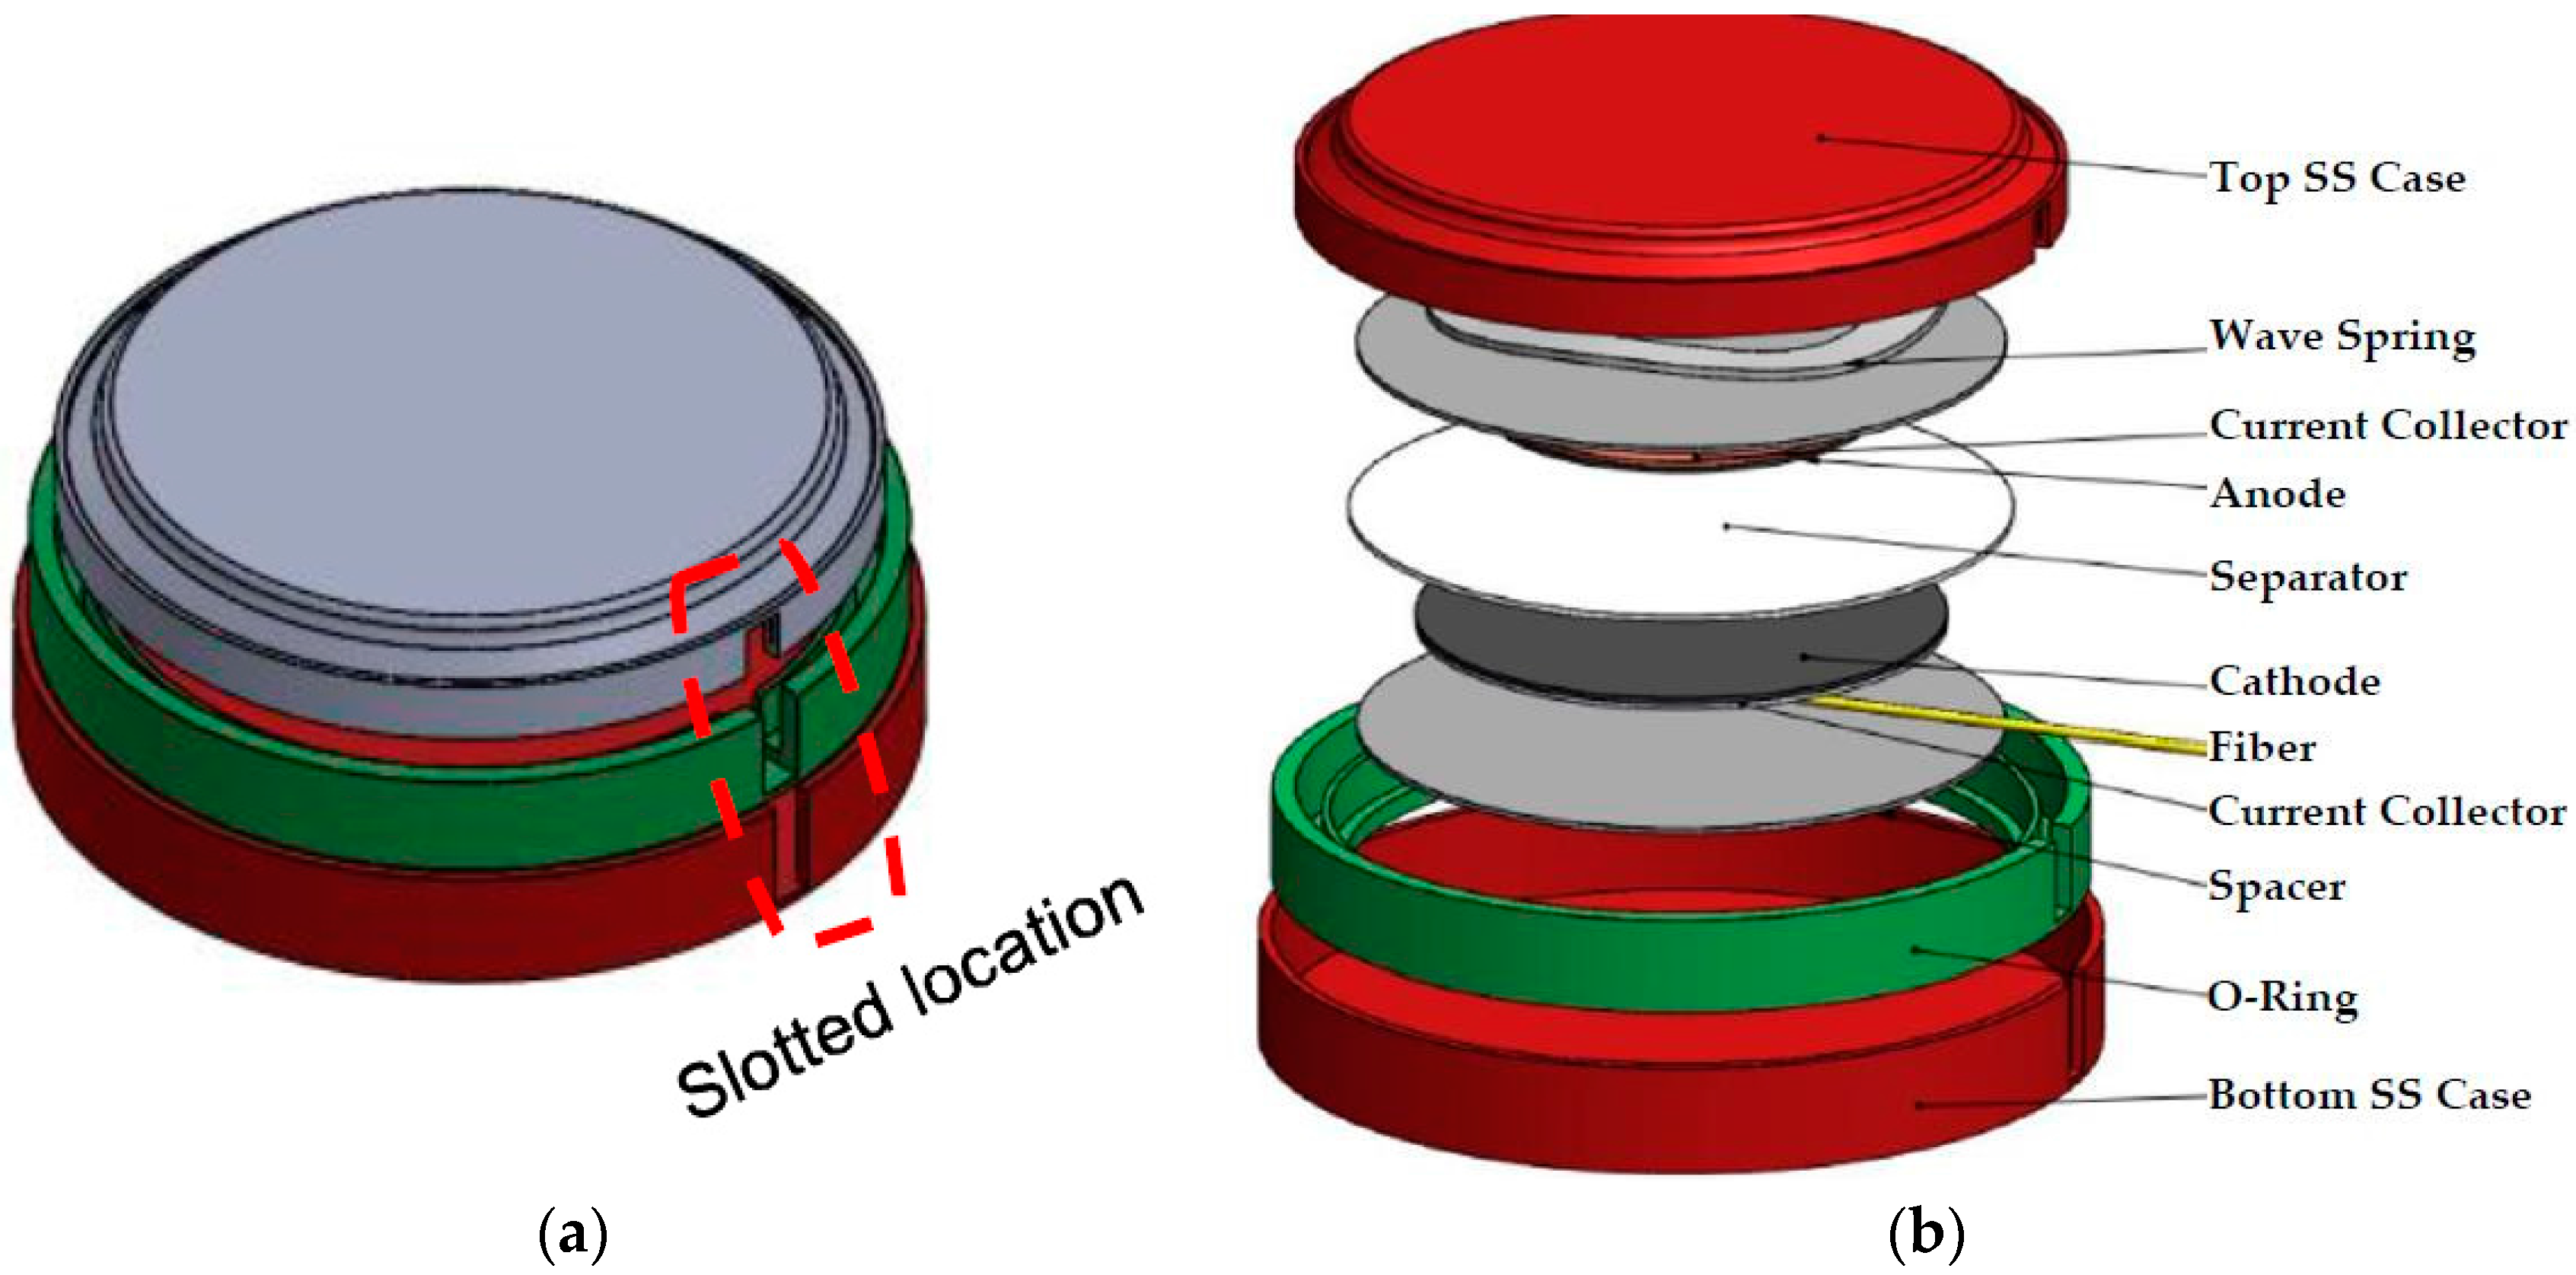
The metal casing of the coin cell was machined in order to integrate the sensor safely, the sensor was added, and the casing was sealed as shown in the schematic of
Figure 1.
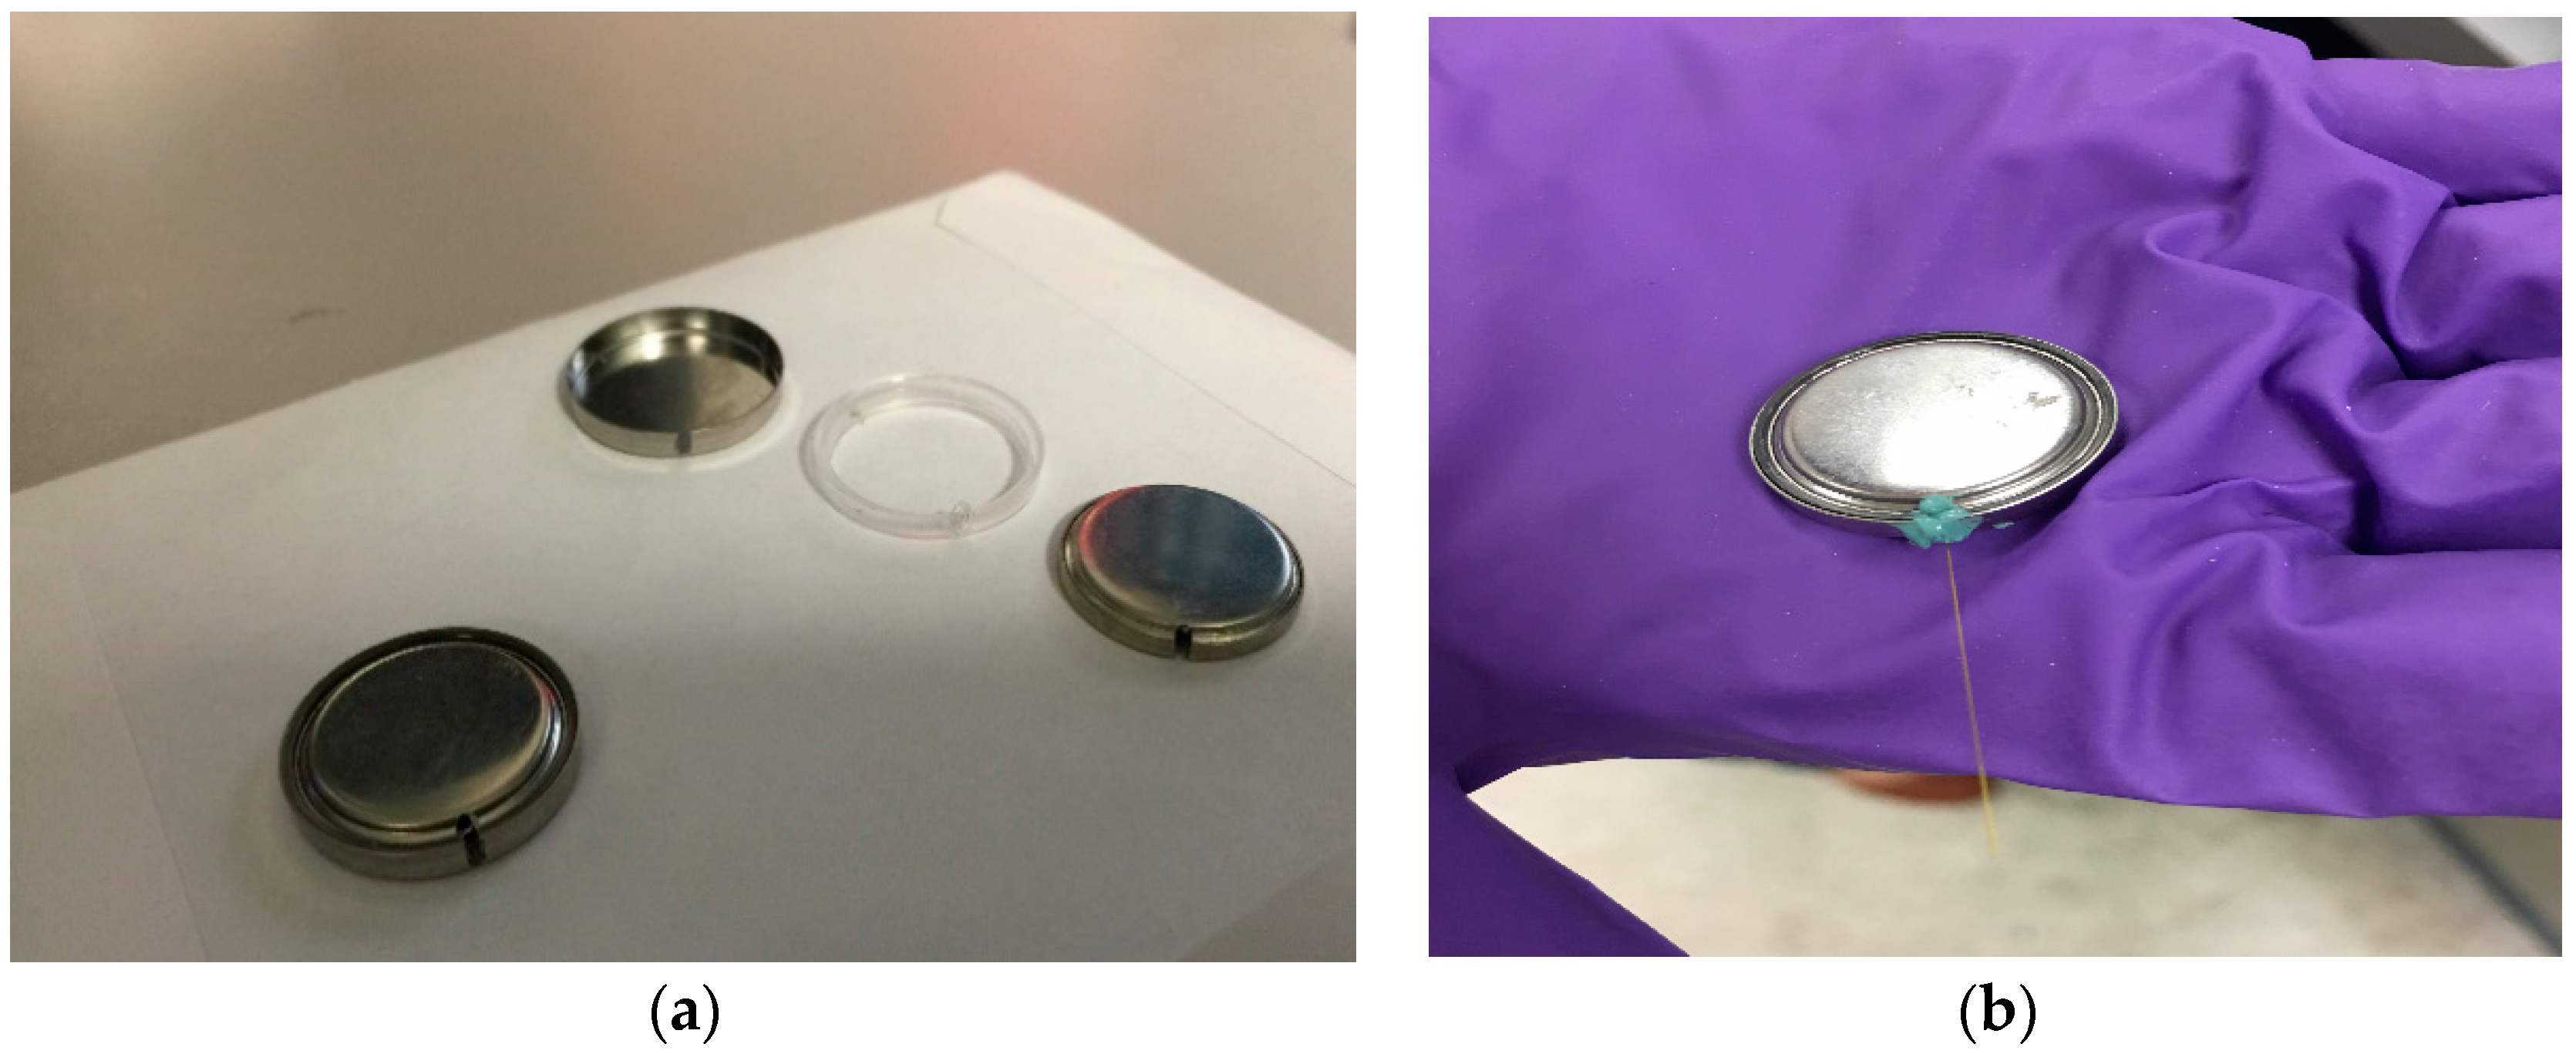
Figure 2a shows the actual slotted coin cell, and
Figure 2b shows the fully assembled coin cell with the FBG sensor integrated.
Initially, the anode side was selected to position the sensors because it is considered the less dynamic region during charge/discharge cycling of the battery. Once cell stability was ensured, the sensor was integrated on the cathode side as shown in
Figure 1b. Next, the appropriate sealant to close the slotted location was determined. Because this sealant ensures proper battery cycling over time, the following challenges should be considered when integrating it: (1) batteries are hermetically sealed, which makes sensor integration challenging; (2) the cell performance could be affected when a foreign object and foreign chemistry from the sealant are introduced; and (3) last protection of the sensor damage must be ensured so that accurate stain and temperature data can be collected. To determine how each step affects battery performance and several battery scenarios were tested. The various batteries’ scenarios are presented in
Table 2, and the results for each cell case are presented in
Section 3.
Table 2 summarizes six different battery cell case scenarios. Three equal battery cells were tested for each scenario, and only one example of average test data is presented in this paper. Scenario #1 consisted of a basic battery cell without a sensor tested for simple comparison against batteries with sensors. Two different types of sealants were tested: non-conductive polymer-based STOPAQ [
19] and optical-based Norland 65 (NOA 65) [
20]. NOA 65 proved better adhesion with the metal casing, and blue ultraviolet (UV) light was used to ensure good curing. Cycling tests were also performed to ensure that no sealant can be mixed with the cell electrolyte. Further results will be discussed in
Section 3, including the choice for integration of four layers of separator material.
3. Results and Discussion
Six different battery cell scenarios were tested for the effect of FBG sensor integration on battery performance.
Table 1 and
Table 2 provide the chemistry and details for each scenario.
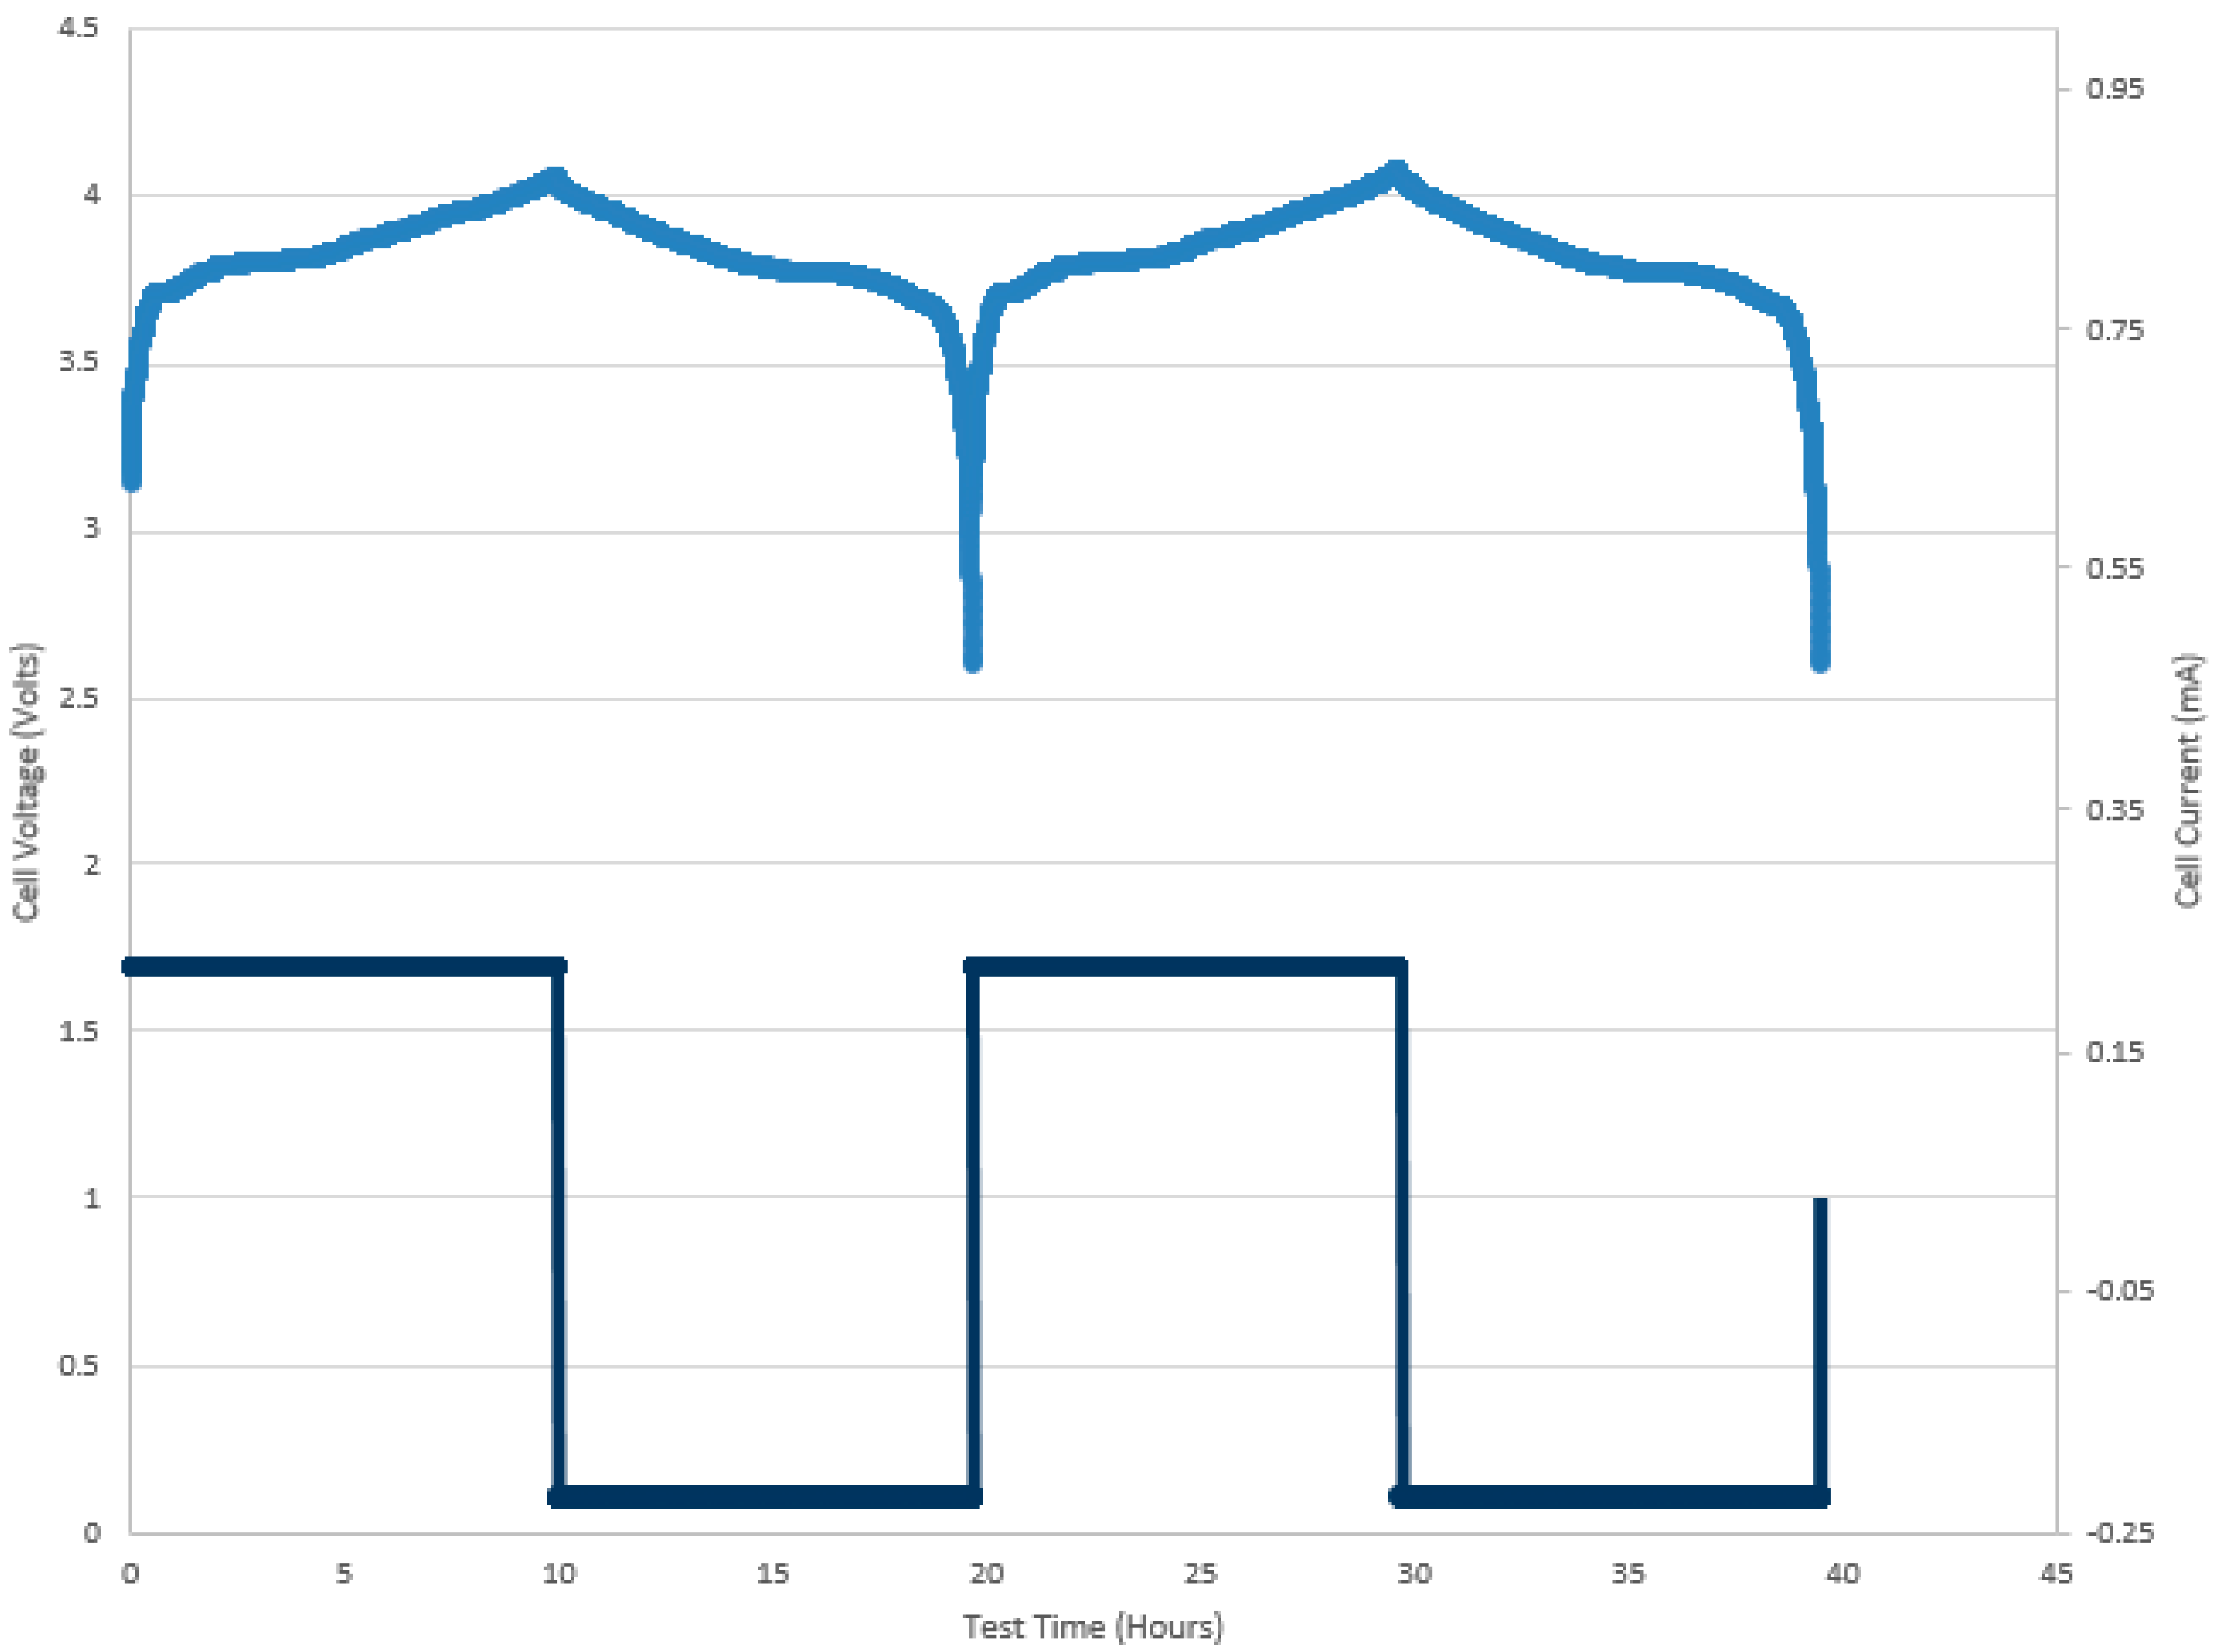
Scenario #1: Coin cell battery without sensor integration.
Figure 3 shows typical, healthy charge/discharge cycles of the LiCoO
2 based battery. This scenario was presented just for comparison with the rest of the cells in this study and is used as a benchmark against other charge/discharge curves.
Scenarios #2 and #3: The coin cells in these scenarios have the slotted locations as shown in
Figure 1a, but the FBG sensor is not present. These cells were only tested to check which sealant is more efficient in keeping the cell closed during cycling and to ensure electrolyte starvation does not occur.
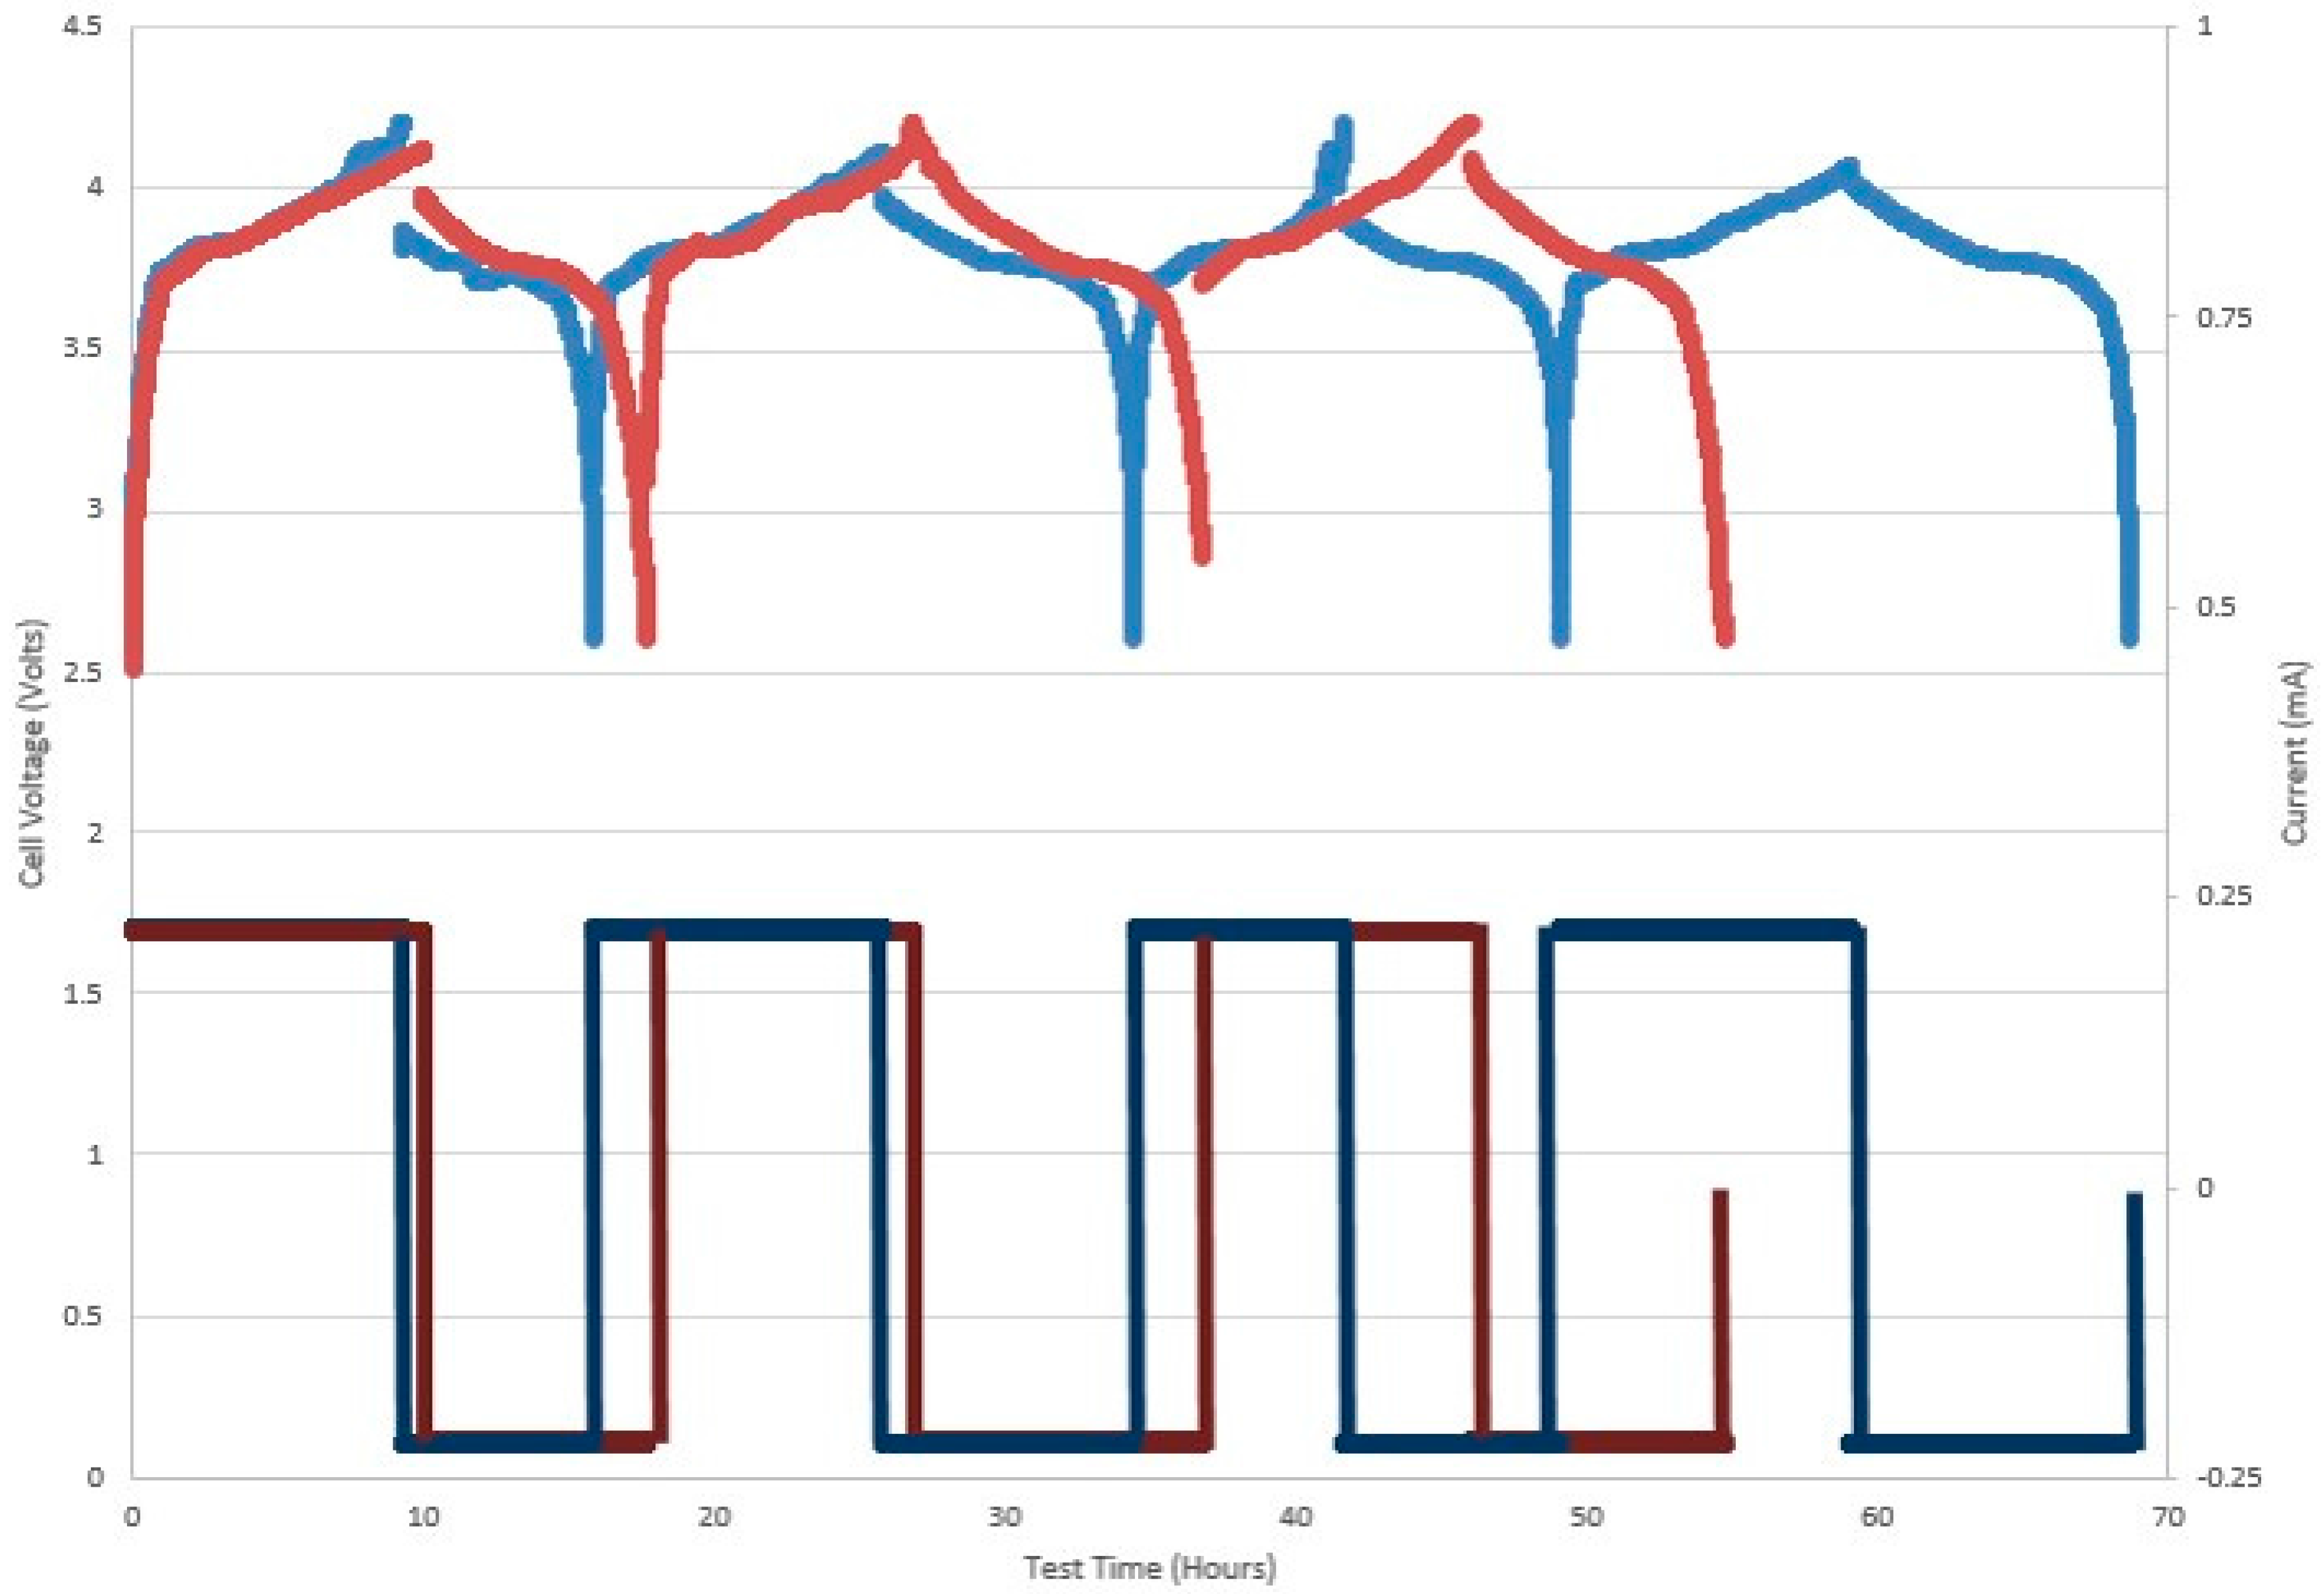
Figure 4 shows charge/discharge cycles of two LiCoO
2-based battery cells. The blue curve represents cells sealed with polymer-based STOPAQ sealant, and the red curve represents cells sealed with NOA 65 optical based sealant.
Figure 4 shows that cells sealed with NOA 65 experience a longer life cycle during charging/discharging compared to those cells sealed with STOPAQ. Electrolyte starvation was observed over time in the cells sealed with STOPAQ and was possibly the reason for the shorter cycles shown in
Figure 4. NOA 65 clearly proved to be a more durable and effective sealant for the purpose of this study.
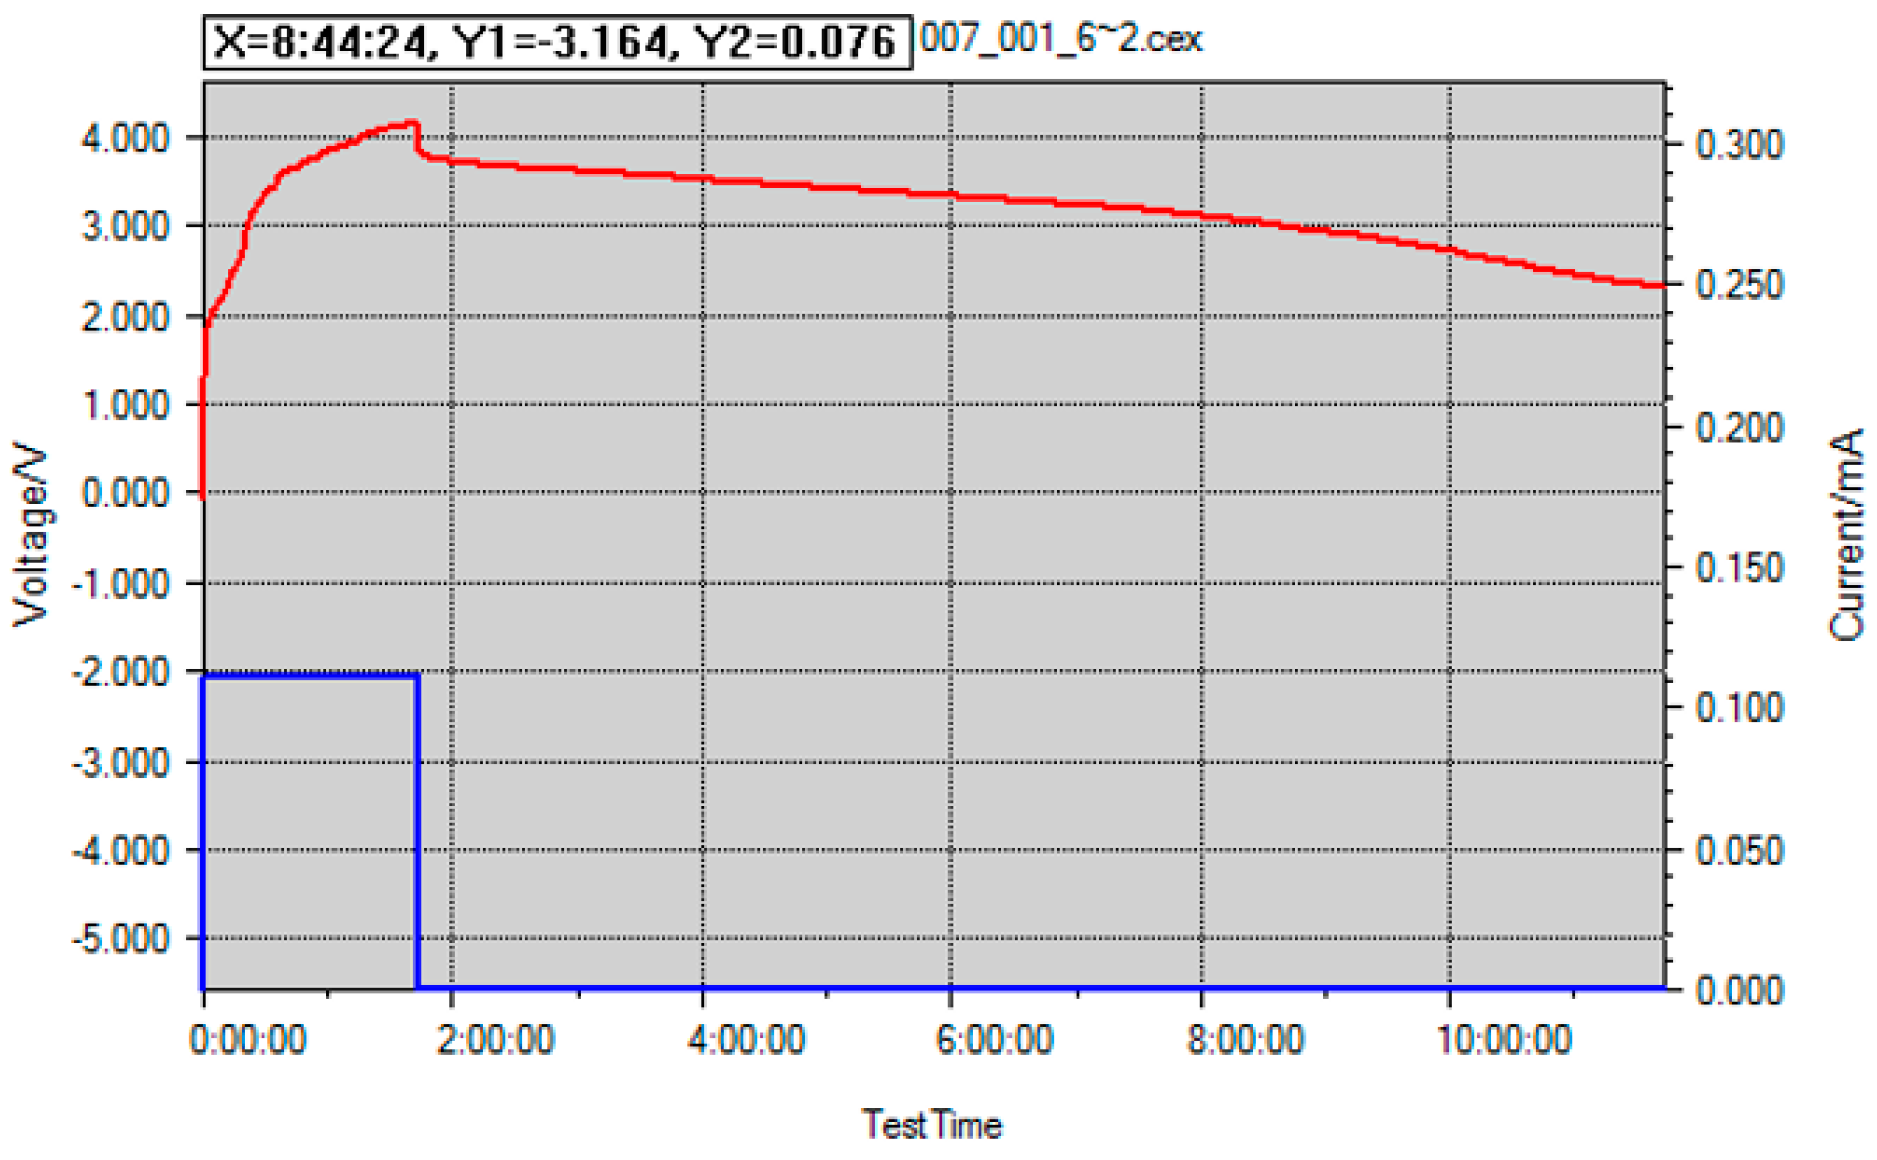
Scenario #4: This scenario further confirmed whether the sealant NOA 65 is effective and completely cured prior to cell cycling. As a result, one drop of NOA 65 was mixed with the cell ECDMC electrolyte to simulate cell behavior in the event that the NOA 65 sealant is not completely cured when cell cycling occurred.
Figure 5 shows the cycling curve for this scenario, where it can be observed that even one drop of NOA 65 into the electrolyte can cause complete malfunction of the battery cell where the cell dies before it reaches 2 h of charging time. Therefore, complete curing must take place before the cell is set on cycling.
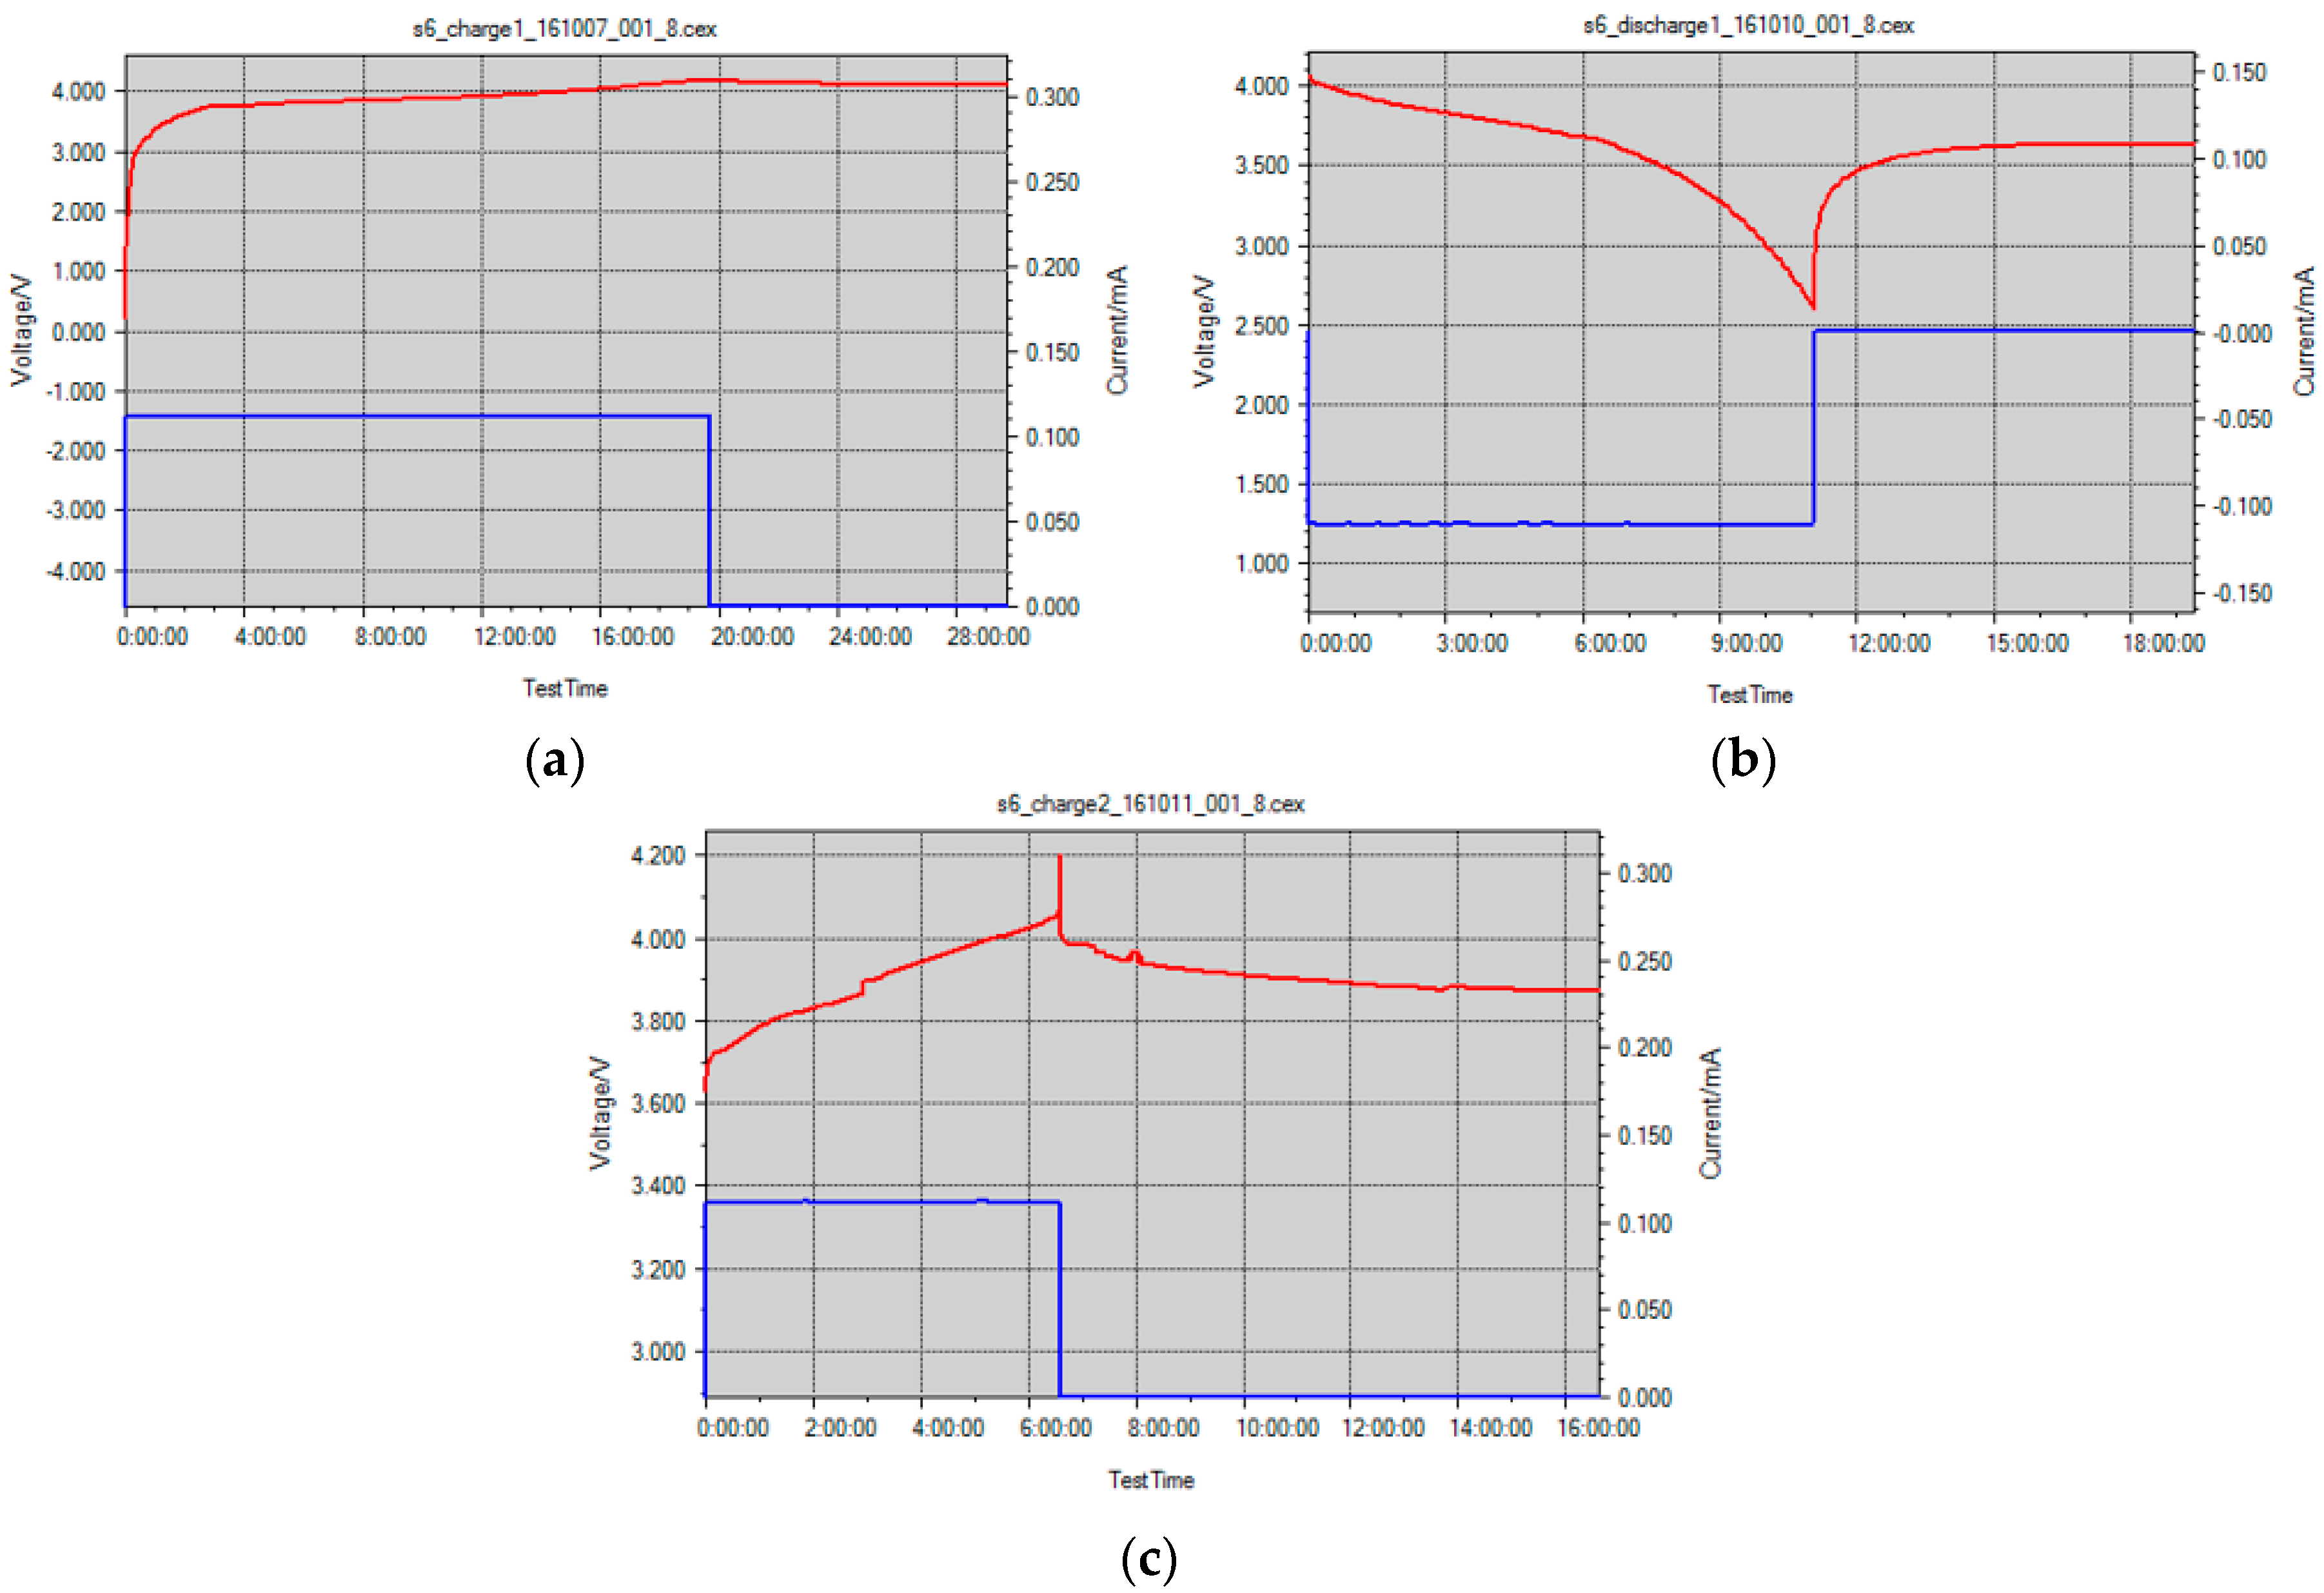
Scenario #5: Upon successful selection of the appropriate sealant and optimizing curing parameters, the next step was to integrate the FBG sensor inside the cell between the cathode and separator layers and seal the slotted coin cell location with NOA 65. As observed during the first cycle in
Figure 6a (charging) and
Figure 6b (discharging), everything seems to work well within the cell. However, on cycle 2, the cell dies completely during the first few hours of charging (
Figure 6c).
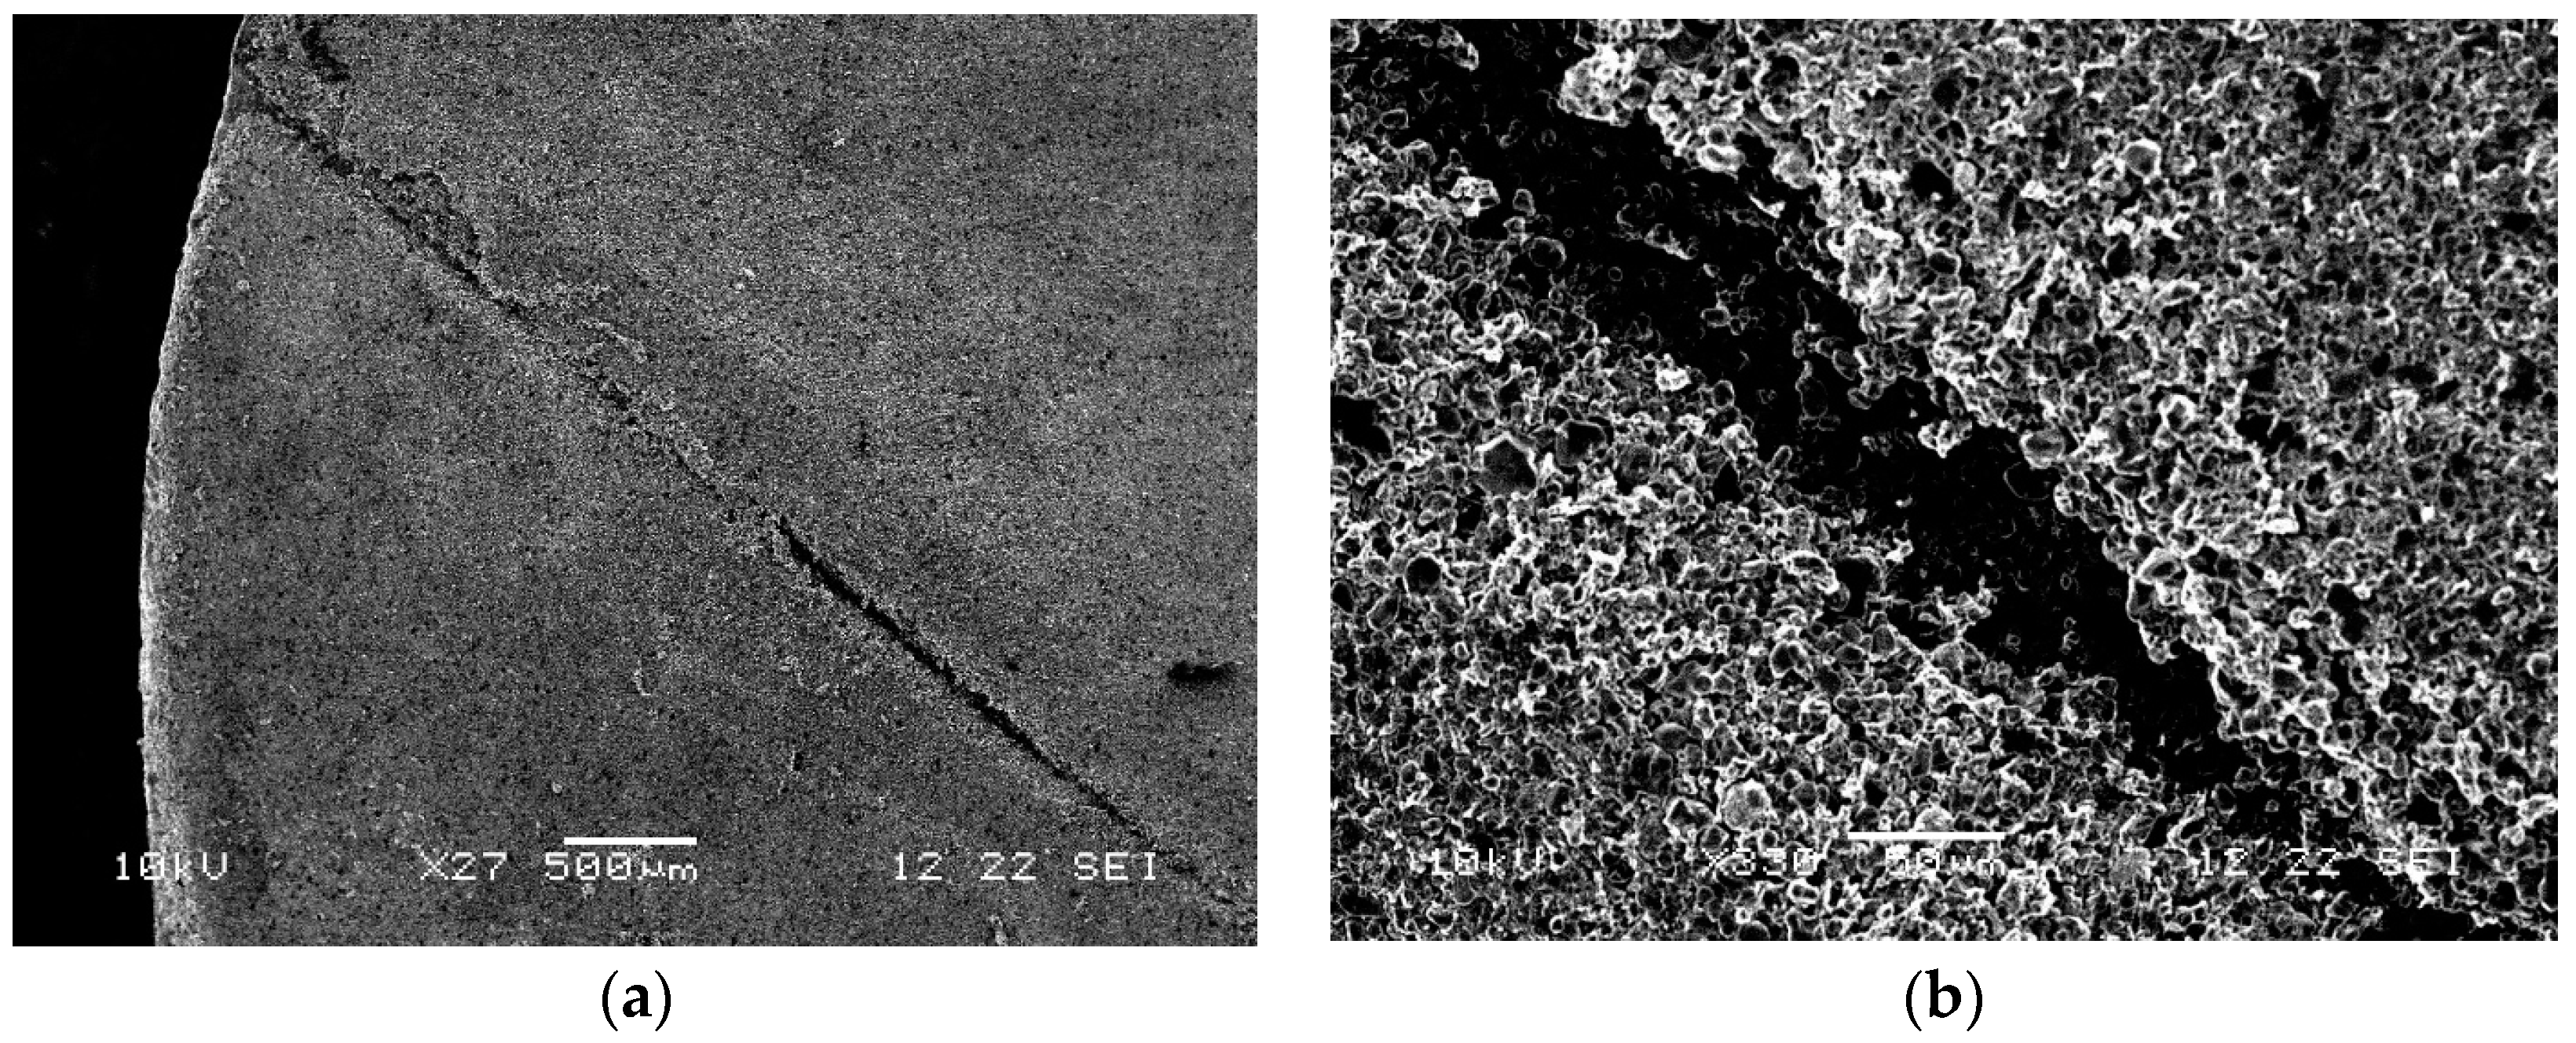
Electrolyte starvation was not observed, therefore, the coin cell was safely disassembled in a glove box and the electrodes were observed under SEM. The FBG sensor was found to be too harsh for the thin electrodes, and its optical nature was cutting right through the cathode layer and the separator layer. The damage shown on the cathode surface in
Figure 7a,b under different magnifications caused the cell to die over time as shown in
Figure 6c during charging.
Scenario #6: The damaged cathode in scenario #5 lead to scenario #6 where the means of isolating the FBG sensor inside the battery cell needed to be invented for improved cycling. A literature study on separator modifications and usage of multiple layers of separator for improved battery functionality [
21] guided our work to implement several layers of separator and wrap the sensor in between the stack of separator layers. This approach prevented the sensor from damaging any of the functional layers in the coin cell under test. After several trial-and-error experiments, four layers of separator were selected as the optimal amount (the sensor was integrated between two internal layers and an additional two external layers of separator) for extra protection. Finally, the cells with excellent, healthy charge/discharge profiles were noted upon FBG integration.
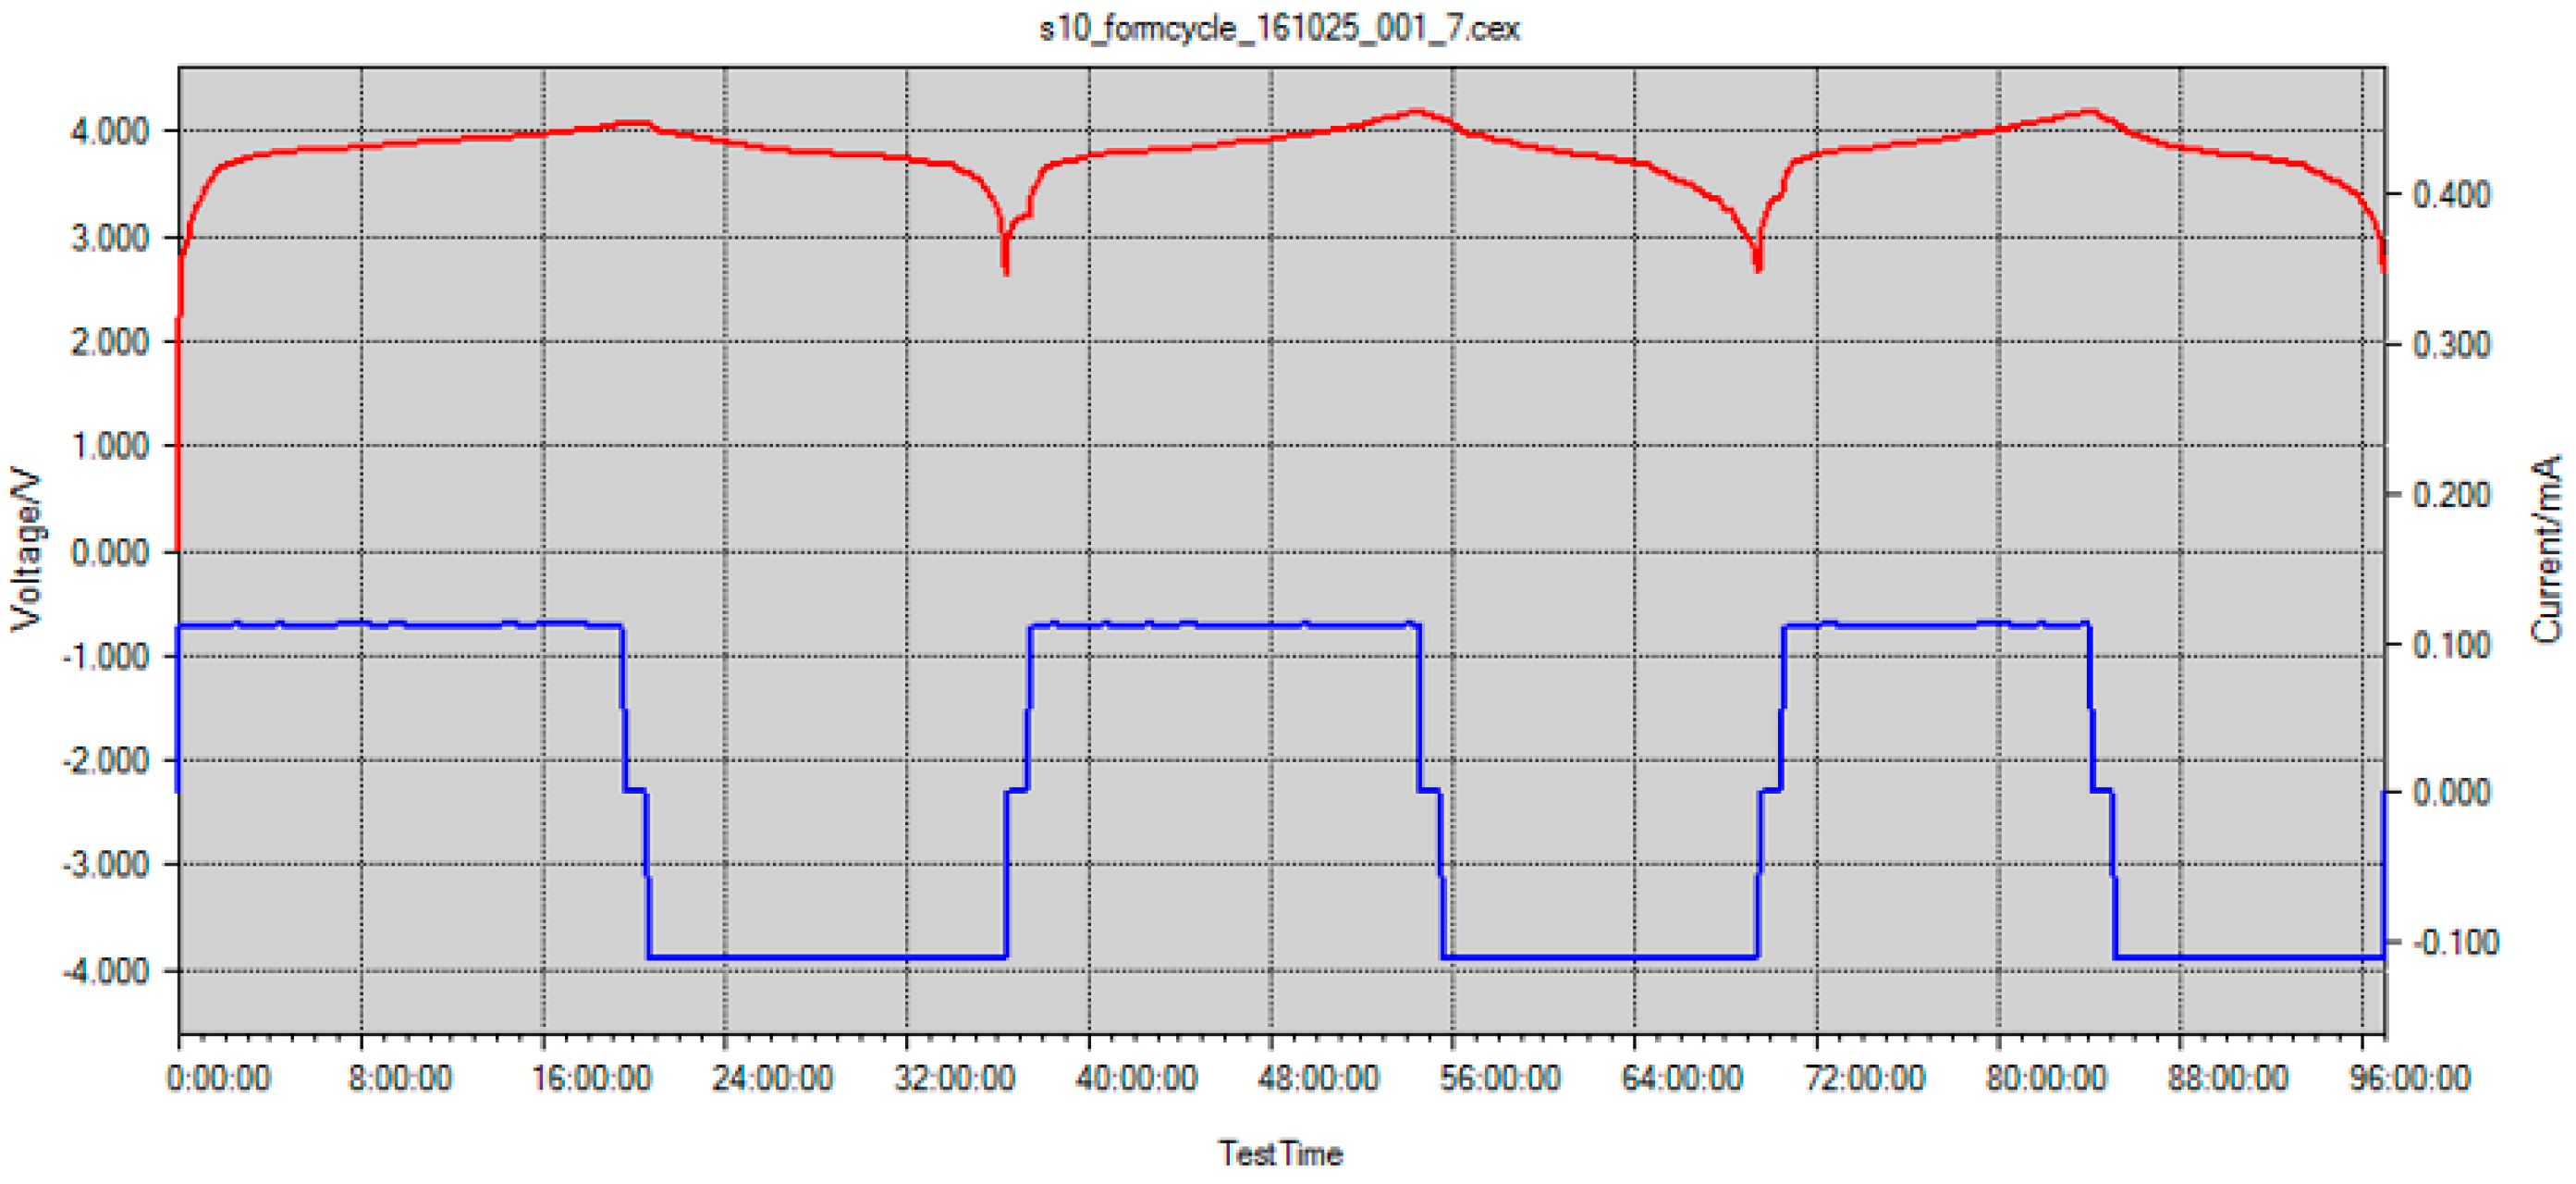
Figure 8 shows three complete charging/discharging cycles for this scenario at a rate of C/20, which totals over 90 h of cell cycling time with the FBG sensor internally integrated. For this scenario, cells cycled for at least 20+ cycles, however, due to large amount of data, only the first 90 h of cycling are presented.
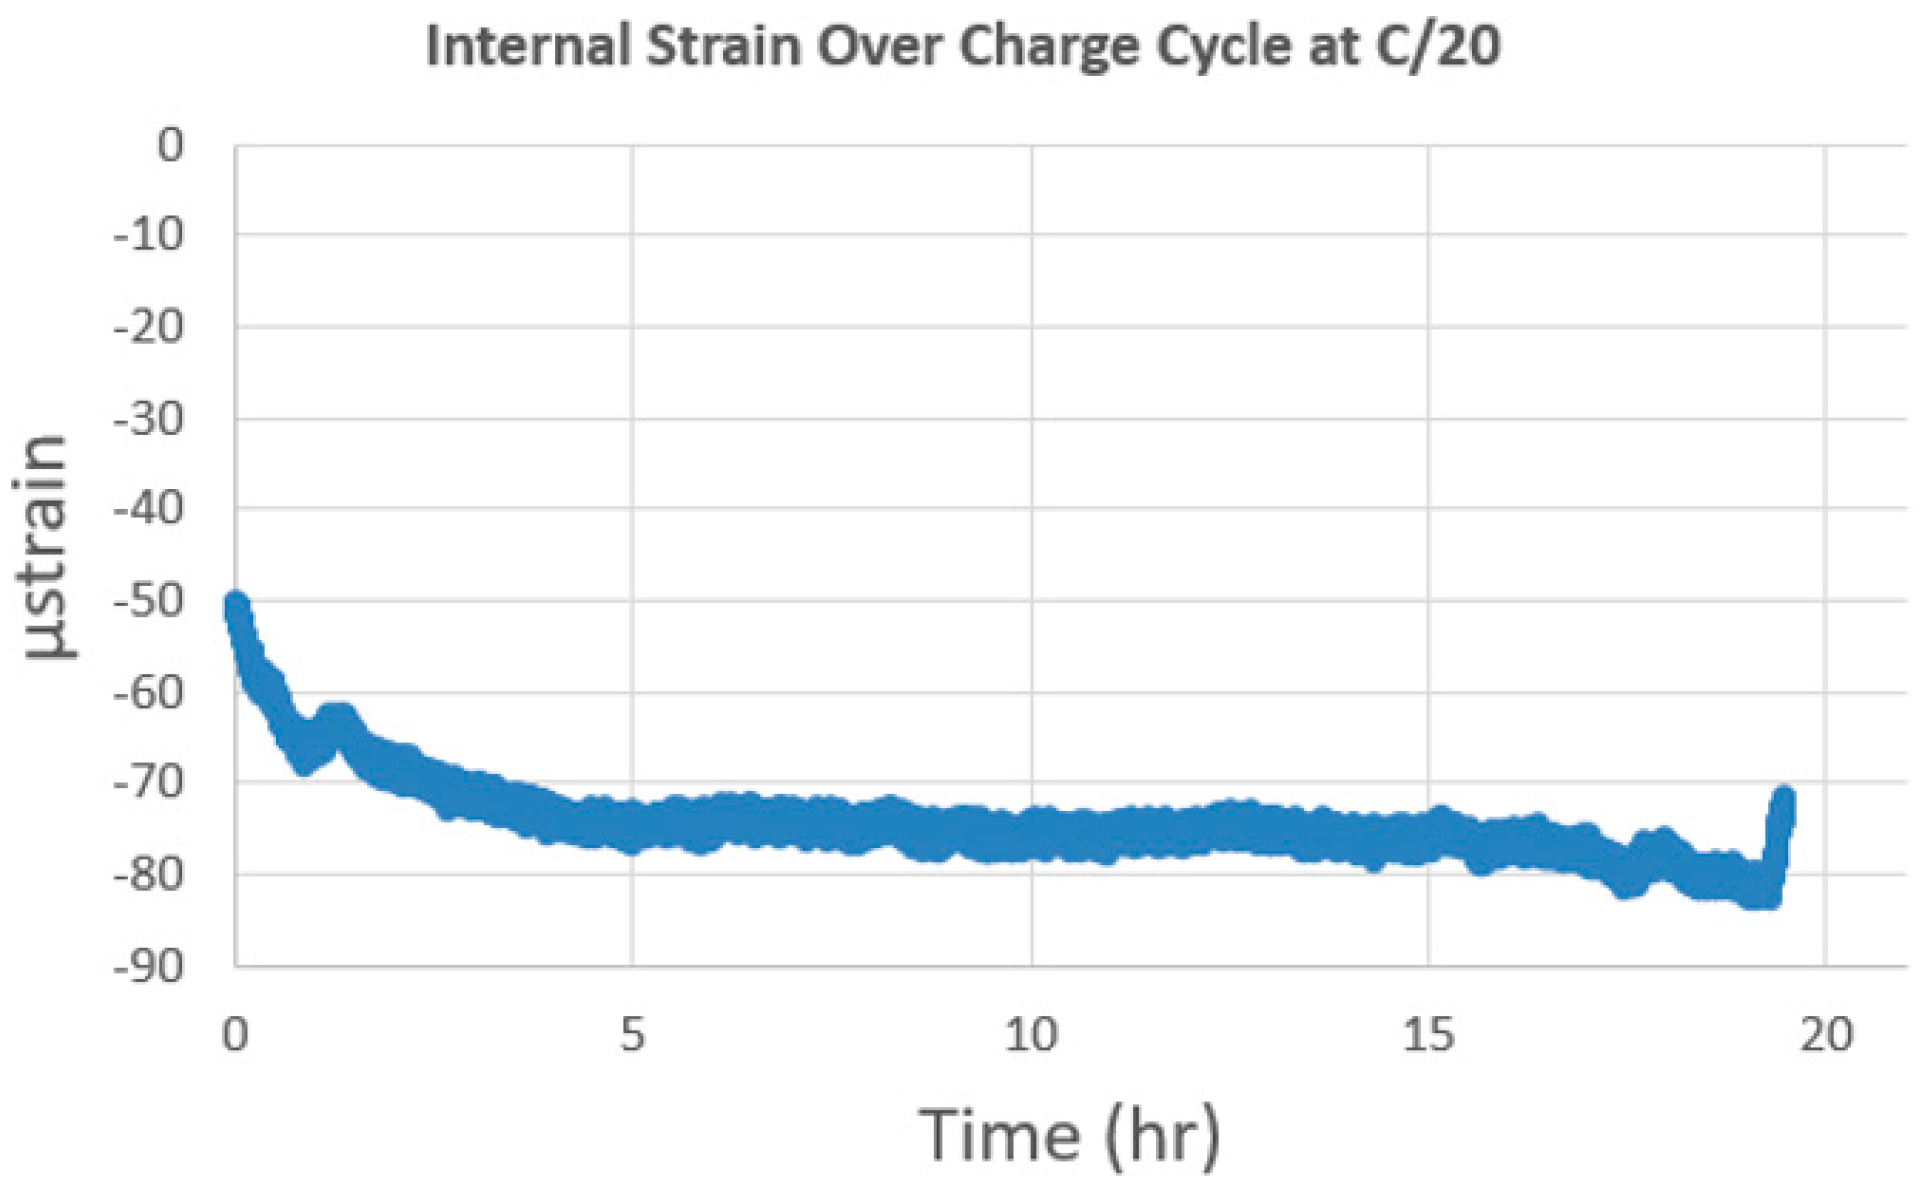
In scenario #6, due to successful sensor integration and battery cell stability, the strain and temperature data was collected with FBG sensors. The battery coin cell area is relatively small, so a large strain gradient was not expected.
Figure 9 shows the strain stability over the charging cycle at C/20 with the strain recorded approximately −79 µstrain. During charging, Li-ions leave the cathode and the electrode is expected to shrink and produce negative strain. The initial difference of about -30 µstrain is most likely caused by initial stabilization during the formation cycle. Strain tends to increase or decrease and fluctuate during charge/discharge cycles but long-term is expected to increase. Although large strain gradients were not observed because of the small surface area in the coin cell, they will be investigated in future studies.
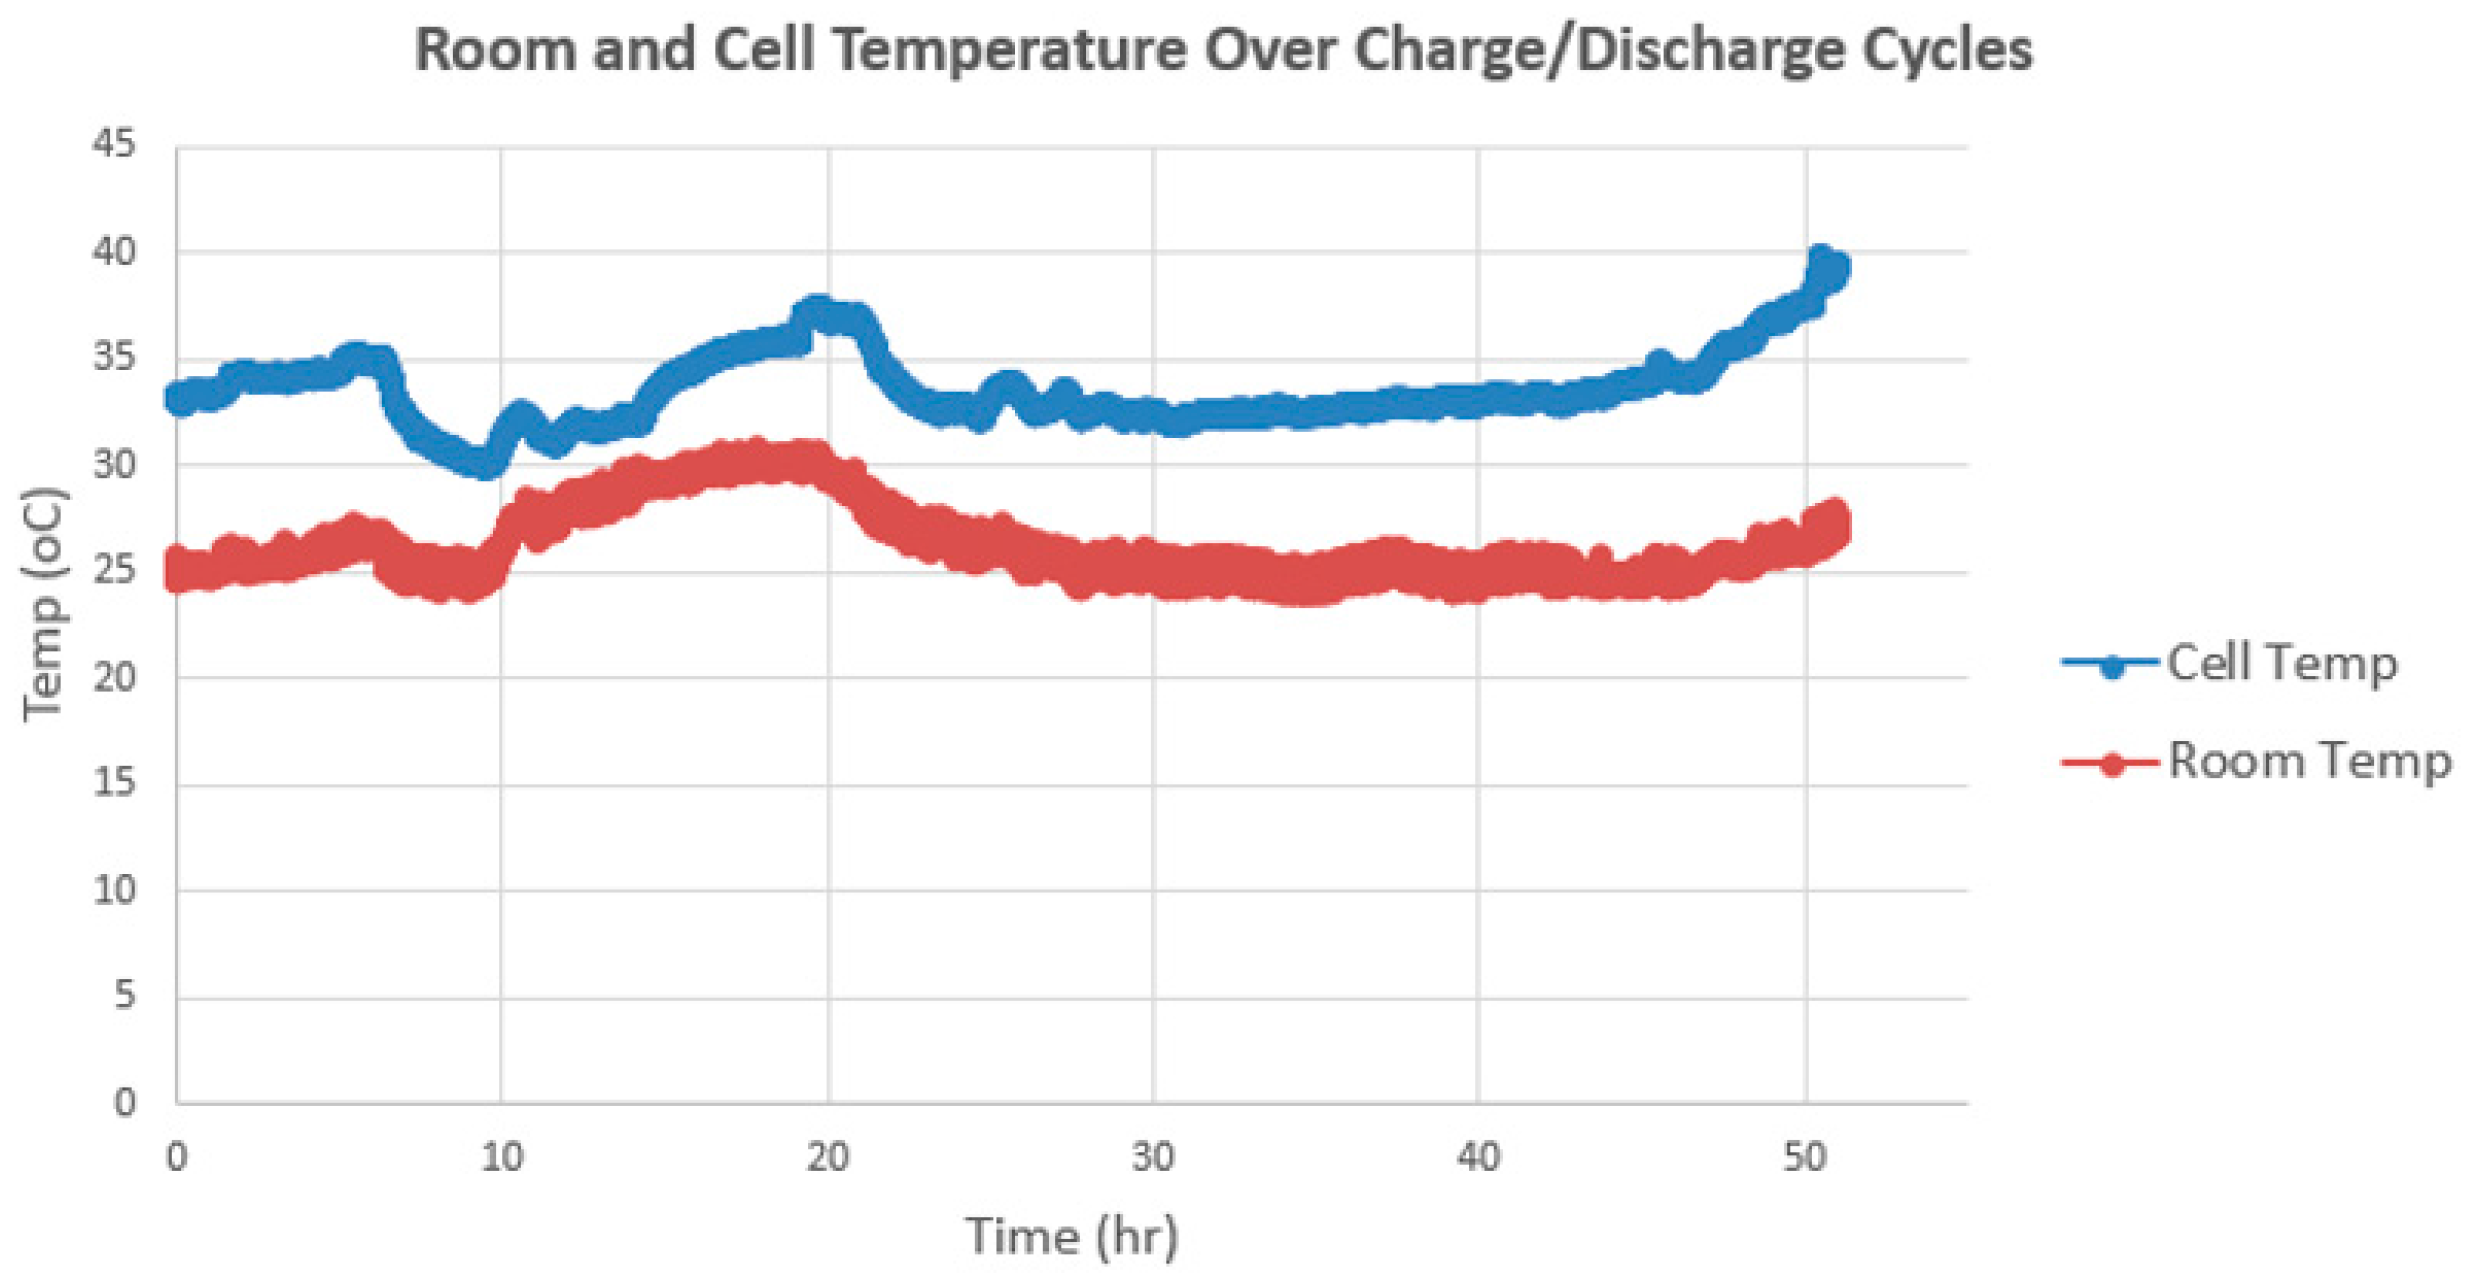
Figure 10 shows changes in temperature data over charge/discharge cycles, with the cell temperature spiking up as the cycling approaches 50 h duration. A striking 10 °C temperature gradient is noted between the ambient temperature and the internal cell temperature over cycling time as shown in
Figure 10. A situation like this can lead to thermal runaway over time, and this data shows the importance of monitoring cell temperature in real time at the cell level. Unfortunately, current BMS systems are not equipped to monitor parameters for each individual cell and thermal runaway takes place.
4. Conclusions
As an electrochemical product, a battery acts differently under different operational and environmental conditions. The uncertainty of a battery’s performance poses a challenge to the implementation of specific functions. Monitoring temperature at the cell level is essential to prevent overheating of a battery pack; SOH is supposed to show the battery’s current health status and its remaining performance, which should ensure operational safety and scheduled maintenance for battery replacement; and data logging traces the cycling pattern of the battery, which can assist in monitoring SOH in real time. To meet the future challenges of energy storage, a new generation of Li-ion batteries with excellent performance, long cycle life, safety, and reliability are needed specifically for next-generation aircraft and automotive vehicles.
The purpose of this study is to show preliminary data on sensor integration inside battery cells along with the challenges and obstacles encountered and resolved during the process. The further intent of this study is to show the differences in the internal parameters of battery cells, which are not monitored by the current BMS systems. The benefits of this study are the demonstration of cell performance scenarios over long cycling periods and description of the sensor integration process, which is not available in the literature. Future studies can investigate safe sensor integration into pouch cells and the possibility of inventing an improved and manufacturing-friendly process for sensor isolation without damaging electrode layers. Other parameters can be involved, such as capacity, pressure, various C-rates, and voltage, to build the relationship between SOH and cell degradation. Moreover, successful sensor integration in commercial battery cells along with big data computing will lead to next-generation improved BMS that will be effective for a number of energy storage applications.


