Influence of High Pressure and Temperature on the Mechanical Behavior and Permeability of a Fractured Coal


Department of Civil and Environmental Engineering, University of Alberta, 9211-116 Street NW, Edmonton, AB T6G 1H9, Canada
*
Author to whom correspondence should be addressed.
Energies 2017, 10(7), 854; https://doi.org/10.3390/en10070854
Submission received: 2 June 2017
/
Revised: 19 June 2017
/
Accepted: 24 June 2017
/
Published: 27 June 2017
(This article belongs to the Section L: Energy Sources)
Abstract
:Understanding mechanical behavior and permeability of coal at ambient and high temperature is key in optimizing high-temperature in-situ processes such as underground coal gasification. The main objectives of this study were to characterize thermal deformation, stress-strain behavior, and gas permeability of coal samples acquired from the Genesee coal mine in Central Alberta, Canada under various temperatures and confining stresses. These measurements were conducted in a high-pressure high-temperature triaxial apparatus. Initial thermal expansion of the coal was followed by contraction in both axial and lateral directions at about 140 °C. This temperature corresponds to occurrence of pyrolysis in the coal. All specimens showed brittle behavior during shear while forming complex shear planes. The specimens exhibited compressional volumetric strain responses at all temperatures. Deformation localization initiated at various stage during shearing. Specimens sheared at 200 °C showed higher peak stresses and larger axial strains compared to those tested at room temperature (24 °C). Fluctuations of permeability were observed with confining stress and temperature. Permeability dropped at 80 °C due to thermal expansion of coal and closure of initial fractures; however, it increased at 140 and 200 °C due to a combined response of thermal expansion and pyrolysis. Small axial strain during shear was observed to reduce permeability.
1. Introduction
Coal is an organic sedimentary rock which is of economic interest. Coal contains varying amounts of carbon, hydrogen, nitrogen, oxygen, and sulfur as well as small amounts of other elements, including mineral matter [1]. The organic nature of this rock along with natural fracture networks makes its behavior distinctive from other rocks.
Understanding coal behavior is crucial in successful operation of in-situ thermal processes such as Underground Coal Gasification (UCG). In UCG, after building a system of injector and producer wells, coal is ignited. Thereafter, the gasification process is maintained by providing an oxygen-based mixture. Gasification can generate temperatures in excess of 1000 °C. After some coal has been burned away, a cavity is formed and beyond the boundaries of the cavity, temperature will decay to initial formation temperatures. Within this zone, complex coupled thermal-hydro-chemical-mechanical processes occur: devolatilization, change in water phase, thermal stress and strain, changes in porosity and permeability, and stiffness degradation [2]. Understanding the behavior of the coal seam in this zone helps optimize the UCG process and mitigate syn- and post-gasification risks.
Extensive experimental studies were carried out to understand coal mechanical behavior under ambient temperature [3,4,5]. Permeability of coal to water, air, and gas at room temperature was previously studied [6,7,8,9]. Several researchers studied influence of effective stress on flow behavior of different gases in coal (e.g., methane [9,10], carbon dioxide [11,12,13,14], and helium [14]. Change in permeability of coal during progressive shearing was also investigated [15]. The challenging part of coal research is conducting experiments under high temperature. Akbarzadeh and Chalaturnyk [16] reviewed structural changes in coal during heating including, but not limited to; micro crack generation, thermal deformation, porosity and permeability, and strength and stiffness. Experimental studies conducted in 1970s, utilized preheated specimens [17,18,19,20]. Coal samples were preheated (carbonized) in a furnace and moved to a geomechanical apparatus (direct shear, simple shear, uniaxial, triaxial) for measuring their strength and stiffness. Similar approach was followed for permeability measurements. Recent studies used High-Pressure High-Temperature (HPHT) triaxial apparatus to measure permeability at various temperatures up to some 600 °C [21,22,23,24,25]. Feng et al. [21] measured thermal deformation using a raster sensor; however, other researchers did not specify how they measured thermal deformation and which cross section area (original or instantaneous) they used for permeability and stress calculations.
Since coal undergoes a significant thermal deformation, using initial cross section area, especially in the case of very high temperatures, would not be accurate. In high temperature triaxial experiments on rocks, unlike traditional soil mechanics testing, cell liquid volume change is not accurate and cannot be utilized to estimate the specimen volume change. Cell liquid expands remarkably due to heating. Instead, internal linear variable displacement transducers (LVDTs) facilitate measuring deformation during heating and shearing. To date, no high-temperature study on Alberta coal has been reported. The objectives of this study were to investigate thermal deformation, stress-strain characteristics as well as gas permeability of some Alberta coal samples both at room temperature and high temperature. It was intended to perform all these measurements in a single apparatus, namely an HPHT triaxial machine (Structural Behavior Engineering Laboratories Inc. (SBEL), Phoenix, AZ, USA).
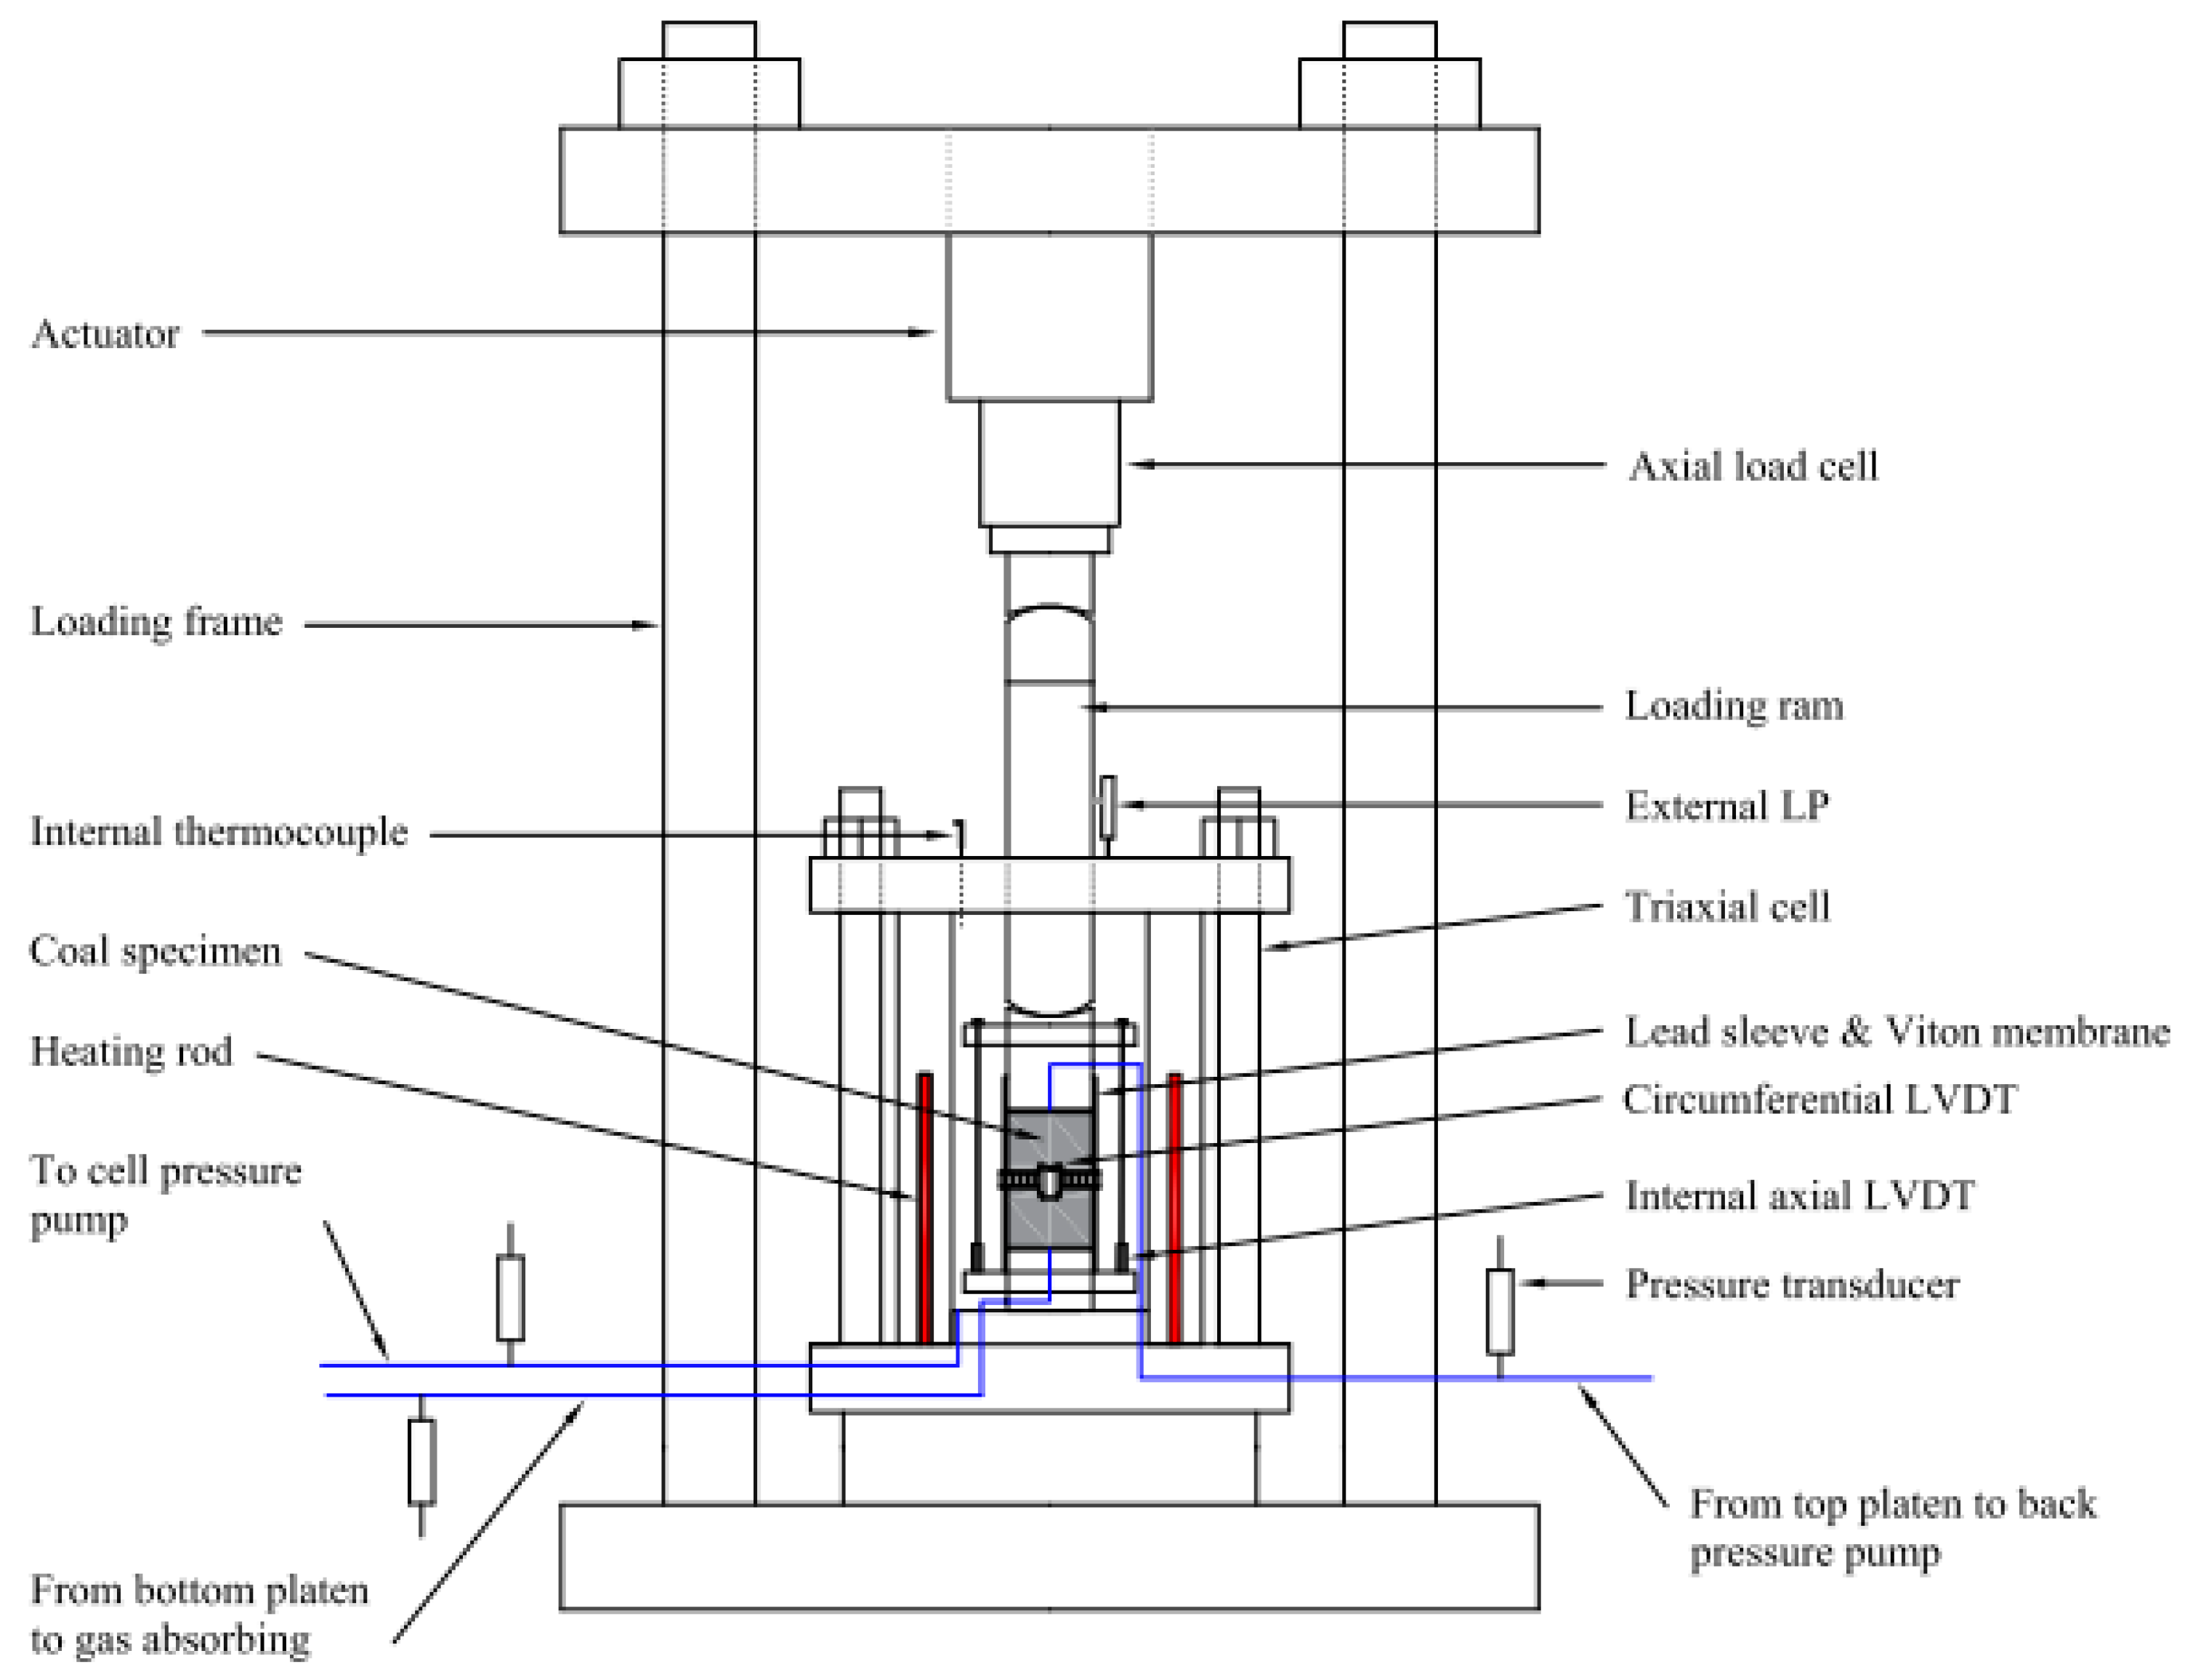
2. Experimental Apparatus
The HPHT triaxial system (Figure 1) included a high-capacity triaxial cell that was accompanied with multiple ISCO pumps, thermocouples, pore pressure transducers, and external and internal displacement measuring devices. The apparatus was equipped with nitrogen cylinders to facilitate gas-permeability measurements. Working temperature for this apparatus is 200 °C which is bounded by temperature rating of fittings, sealing, membrane, confining fluid, and internal LVDTs.
A 260D syringe pump (Teledyne ISCO, Lincoln, NE, USA) was utilized as the cell pressure pump to apply an isotropic confining stress on the specimen. White Oil 200 with flash point above 210 °C was used as the confining fluid. A FPG pressure transducer (Honeywell, Columbus, OH, USA) was installed adjacent to the cell to monitor the confining stress. Heating of the specimen was accomplished by using 240 V/1000 W cartridge heaters embedded in the wall of the triaxial cell which were connected to an Omega temperature controller panel. Heat generated by the rods was transmitted from the cell to the confining fluid and eventually to the specimen. A thermocouple was placed inside the confining fluid to help control and maintain constant temperature throughout the experiment.
A Teledyne ISCO 260D syringe pump was used as the back pump. It received nitrogen gas from nitrogen cylinders and was used for permeability tests. A PLE-3000-G11-111 (Psi-Tronix, Tulare, CA, USA) and Honeywell FPG pressure transducers were mounted on the pore lines, adjacent to the cell, to record pore pressure in the upstream and downstream, respectively. The ram pump was a Teledyne ISCO 500D syringe pump which pushed a hydraulic ram to provide axial force required for shearing the specimen in a conventional triaxial compression test following a displacement-controlled mode. The contact between loading ram and top platen was a point contact; therefore, it did not disturb the isotopic stress being applied by the confining oil on the specimen. Axial deviator load values were recorded using a 50,000 lbf (222 KN) external load cell and corrected for friction between the ram and sealing.
A Novotechnik (Ostfildern, Germany) external linear potentiometer (LP) measured axial deformation of the specimen. Two MHR 250 type internal linear variable displacement transducers (LVDT, Measurement Specialties, Hampton, VA, USA) were mounted alongside specimen to record its axial deformation. An MHR 100 LVDT was placed in a circumferential chain to measure circumferential deformation of the specimen. The LVDTs were rated for 200 °C by manufacture. The axial LVDTs were used as a complimentary measure of axial deformation during shear. All axial strain calculations during shear presented in the stress-strain curves was done based on the external LP readings. The internal LVDTs were used to measure deformation during heating.
The specimen was jacketed with an in-house built lead sleeve and then enclosed with a Viton membrane. The lead sleeve was utilized to prevent gas diffusion through the Viton membrane at elevated temperatures. Calibration was done to exclude thermal expansion of lead and Viton membrane in deformation measurements recorded by the circumferential LVDT. The far end of the downstream pore line was submerged in water to allow nitrogen and pyrolysis gas (if any) absorbed into water. Any remaining gas was directed to a fume hood. The entire ISCO pump controllers and electronics were connected to data logging systems which utilized two PCs.
3. Sample Preparation
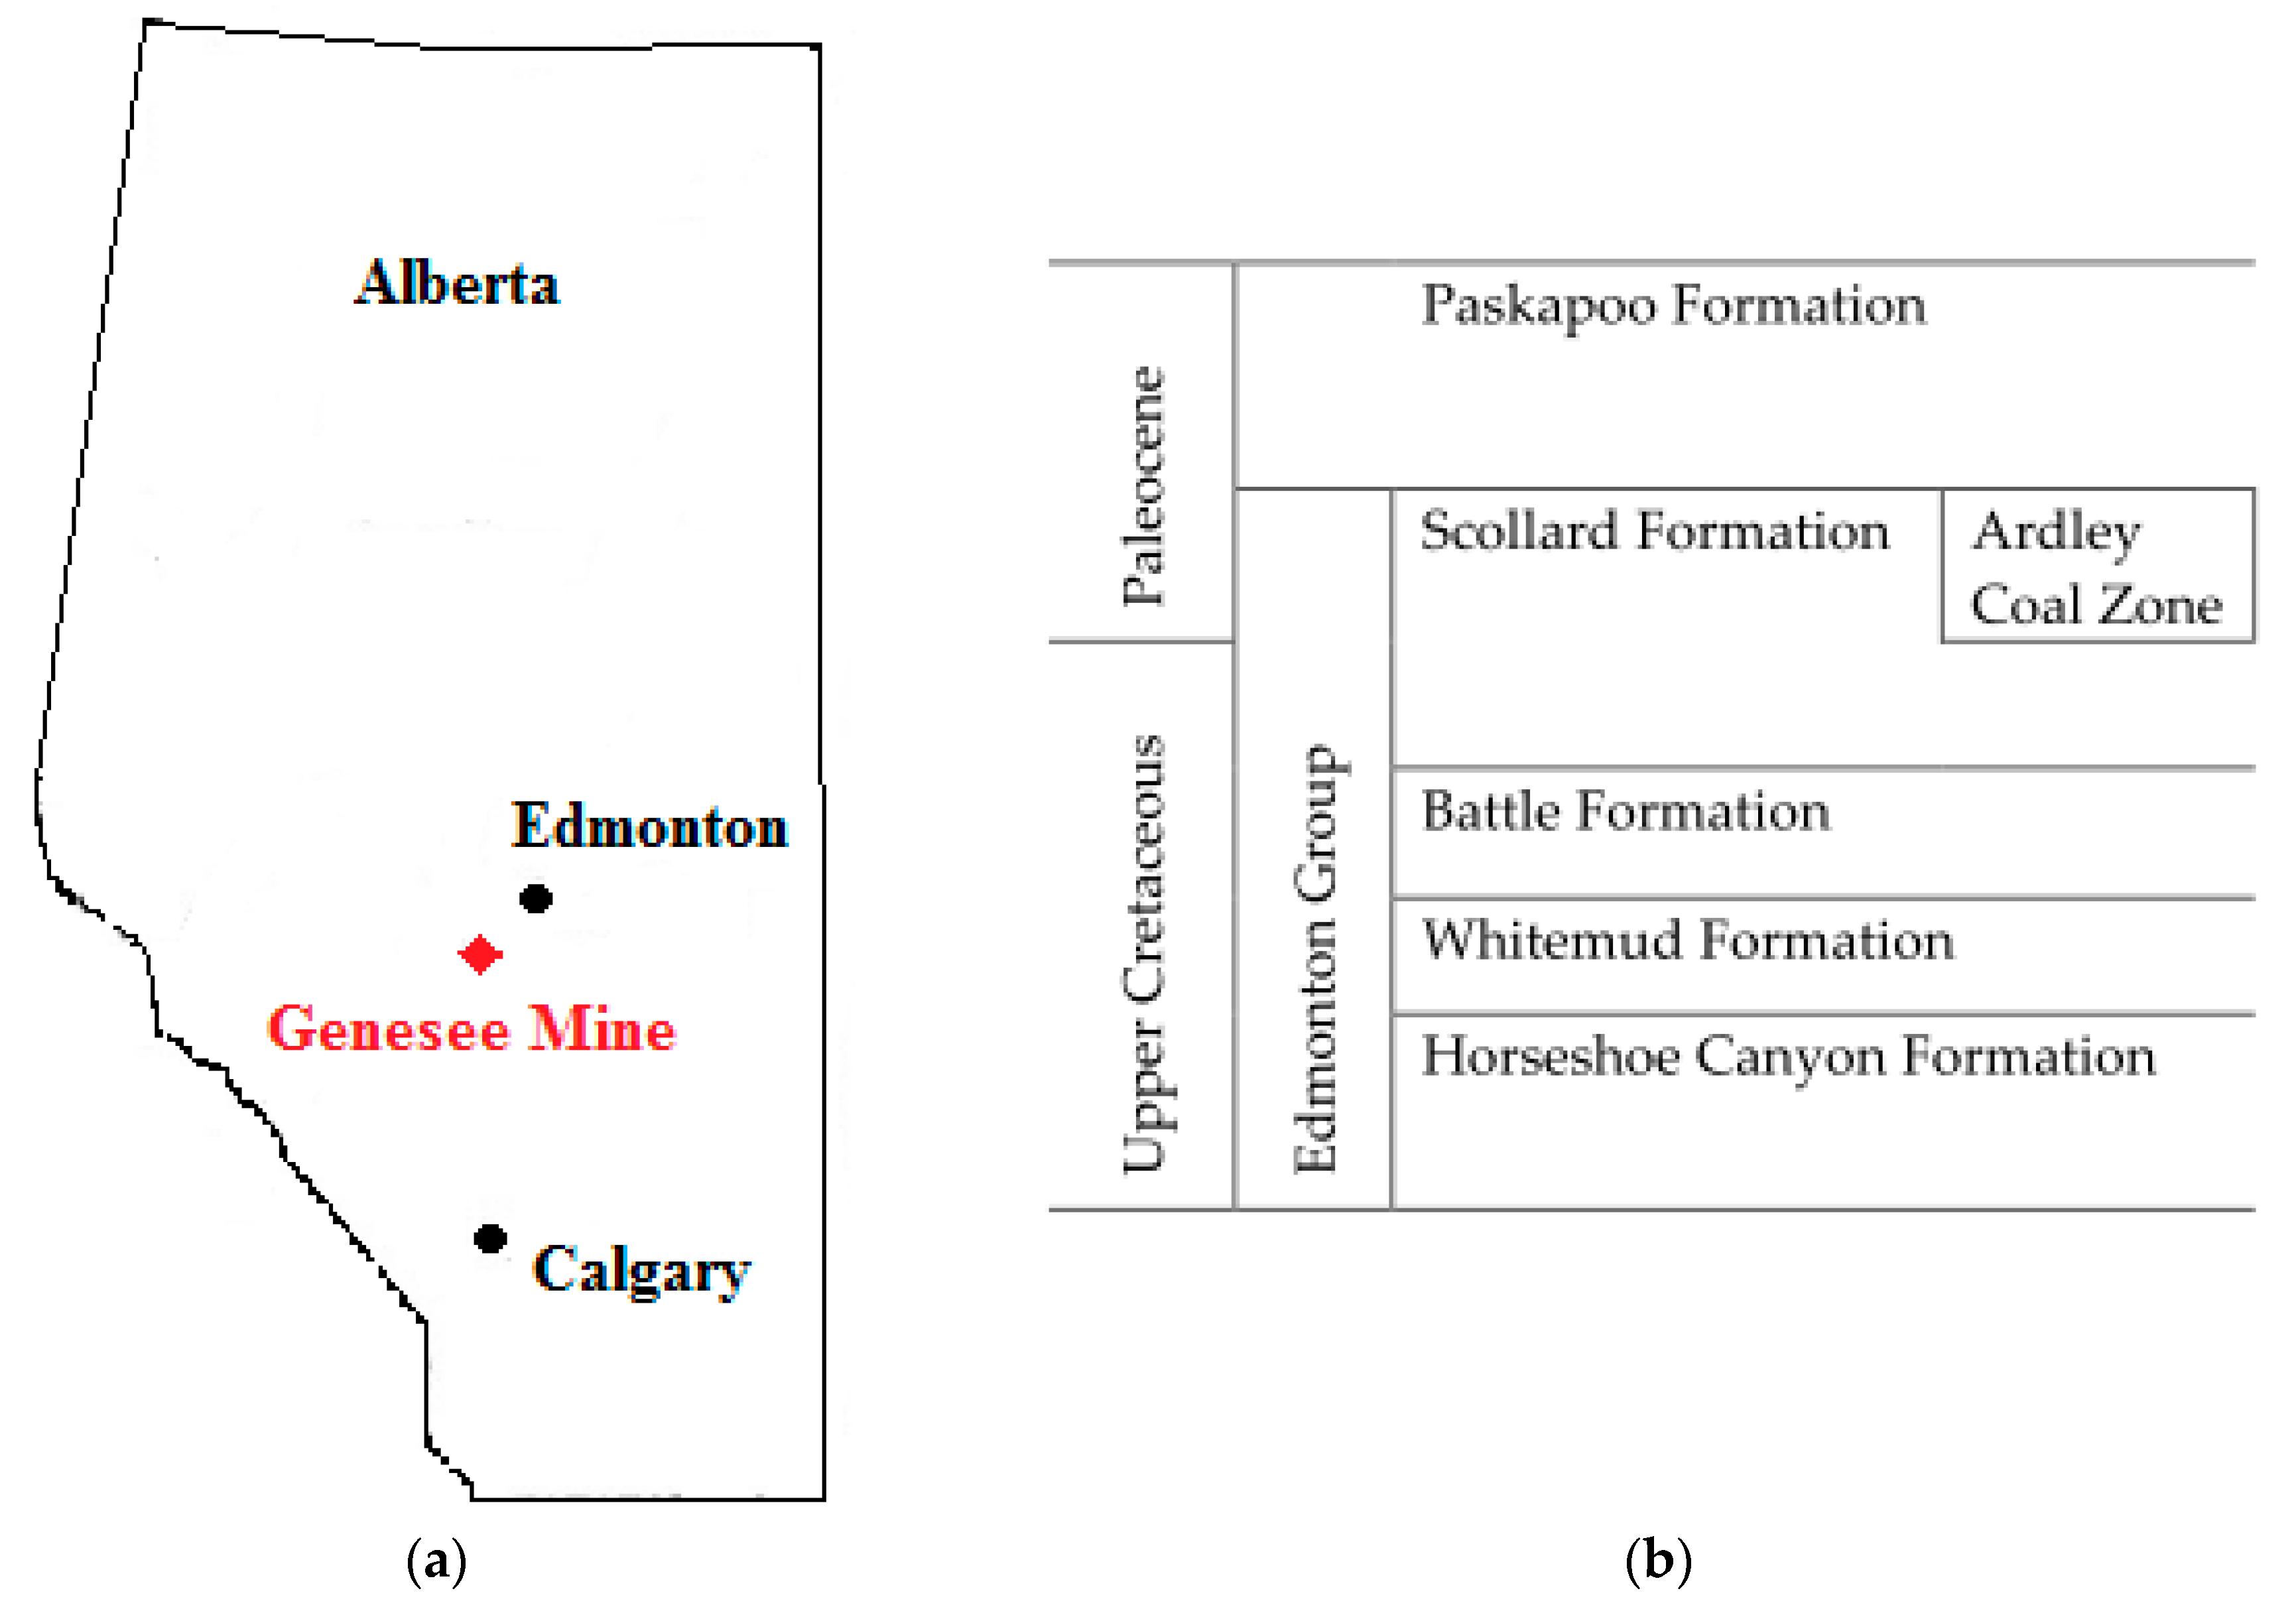
Several coal blocks were acquired from the Genesee coal mine, located approximately 70 km west of Edmonton, AB, Canada (Figure 2a). They were part of the Ardley coal zone of the Scollard Formation (Figure 2b). The coal is subbituminous in rank. No proximate and/or mineralogy analysis was conducted herein; however, it is interpreted that our samples had similar composition to the upper seams (No. 2 seam, cycle II) analyzed by Pollock et al. [26], as listed in Table 1 and Table 2, respectively.
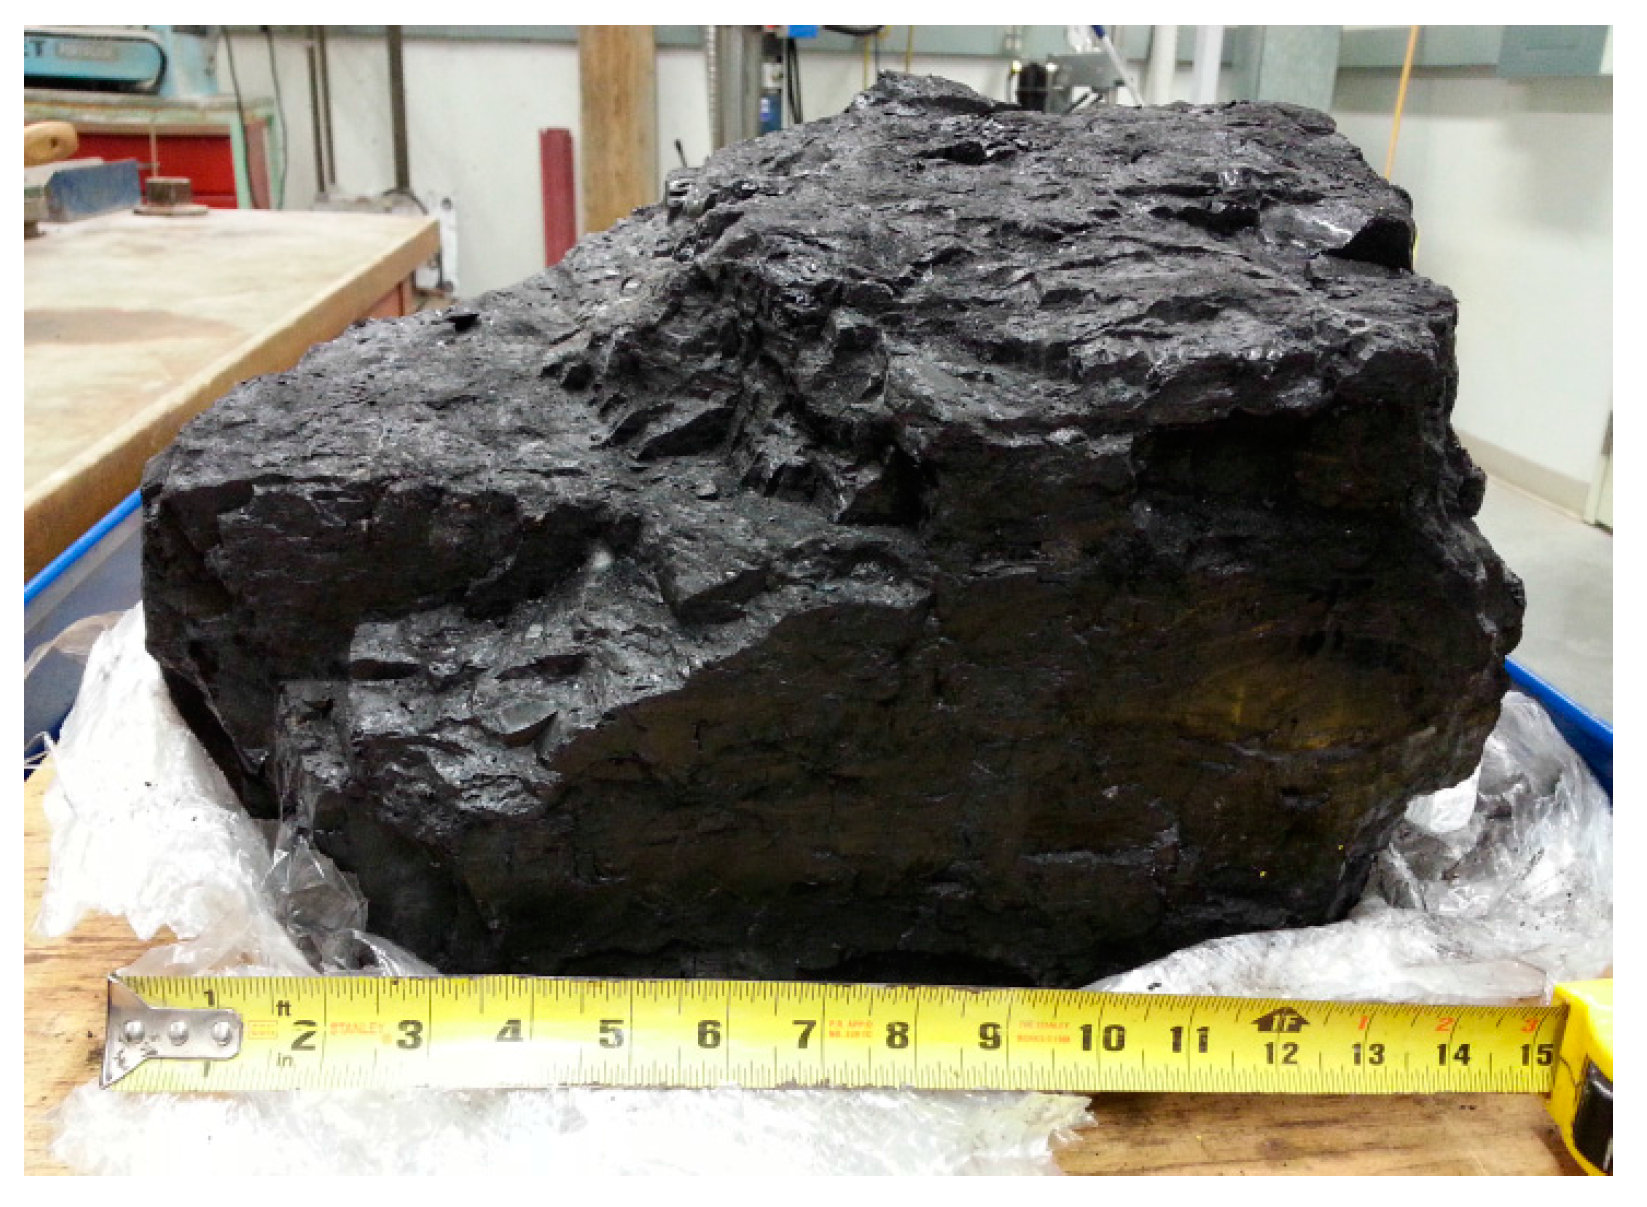
Cylindrical coal specimens with diameter of about 6.1 cm (2.5 inches) were cored from the coal blocks. One of the coal blocks is shown in Figure 3. The blocks had visually detectable face and butt cleats as well as bedding plane discontinuities. The face cleats’ spacing varied from about 0.6 to 3.8 cm (0.25 to 1.5 inches); however, the butt cleats were not as consistent as the face cleats. The specimens were drilled perpendicular to bedding plane. The bedding plane discontinuities made it very challenging for coring. Wet drilling with water was not successful. Therefore, drilling of other blocks was done dry while isolating the drill bit area in order to capture dust generated during drilling.
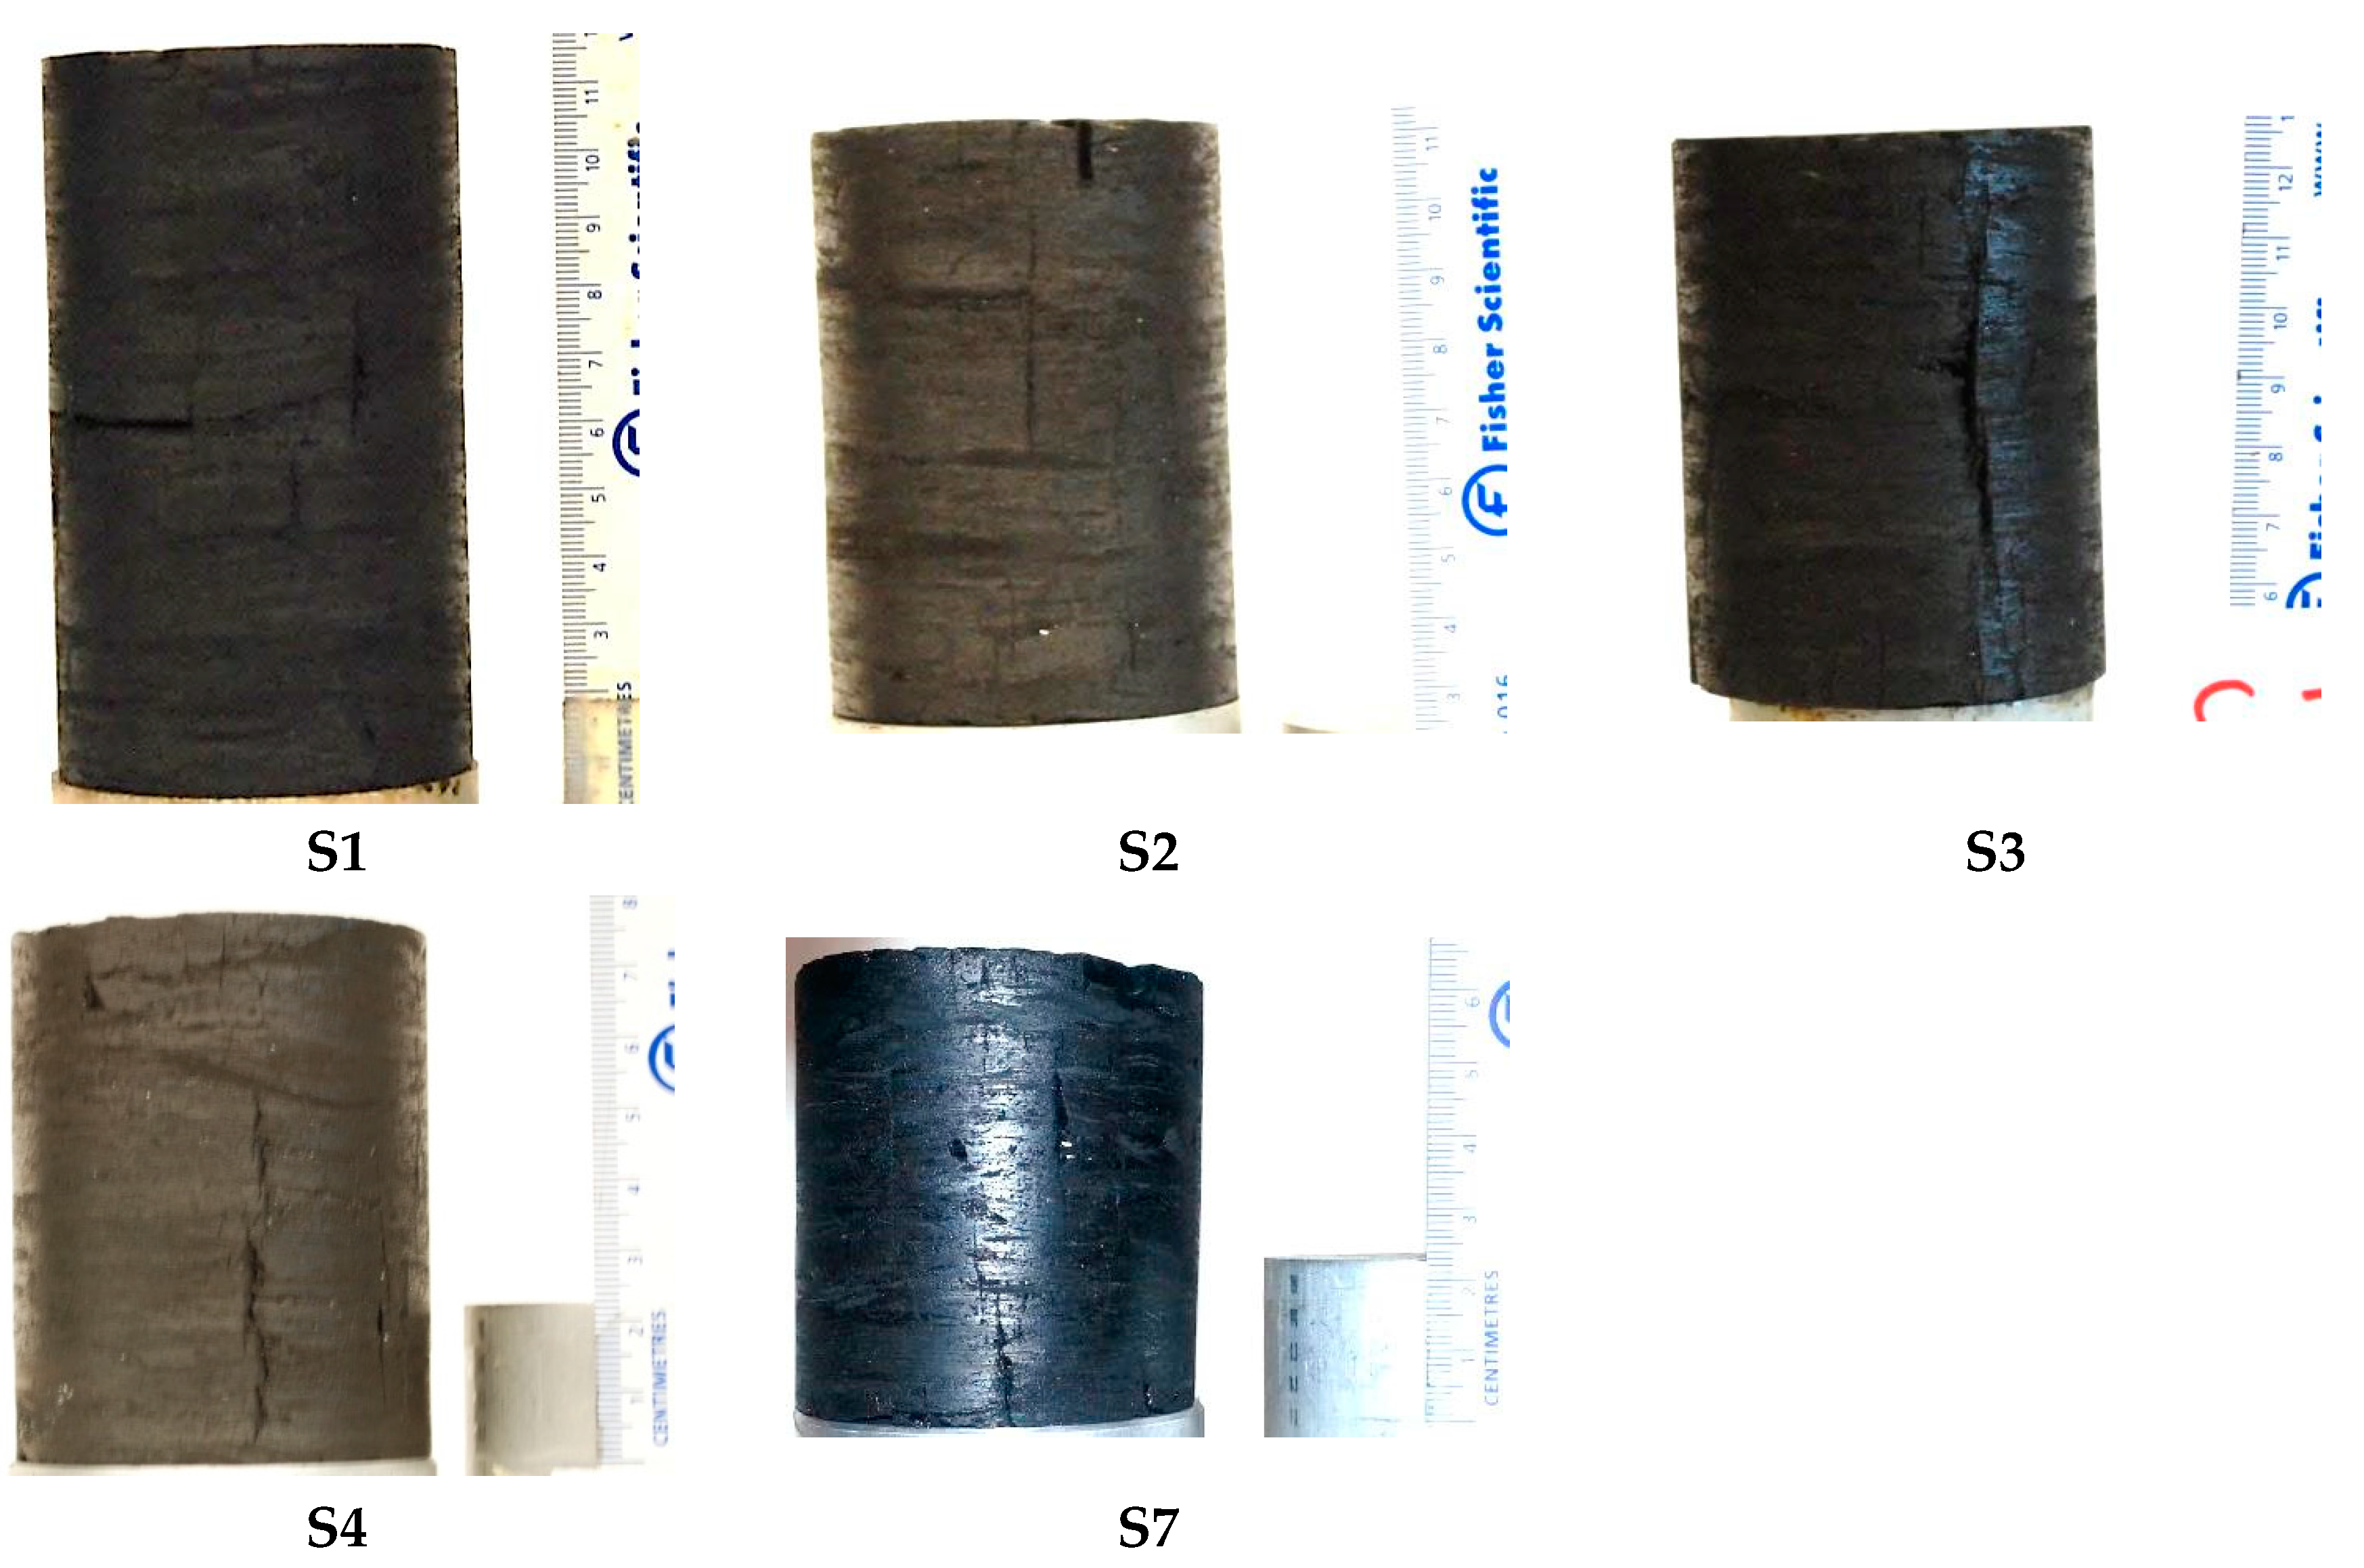
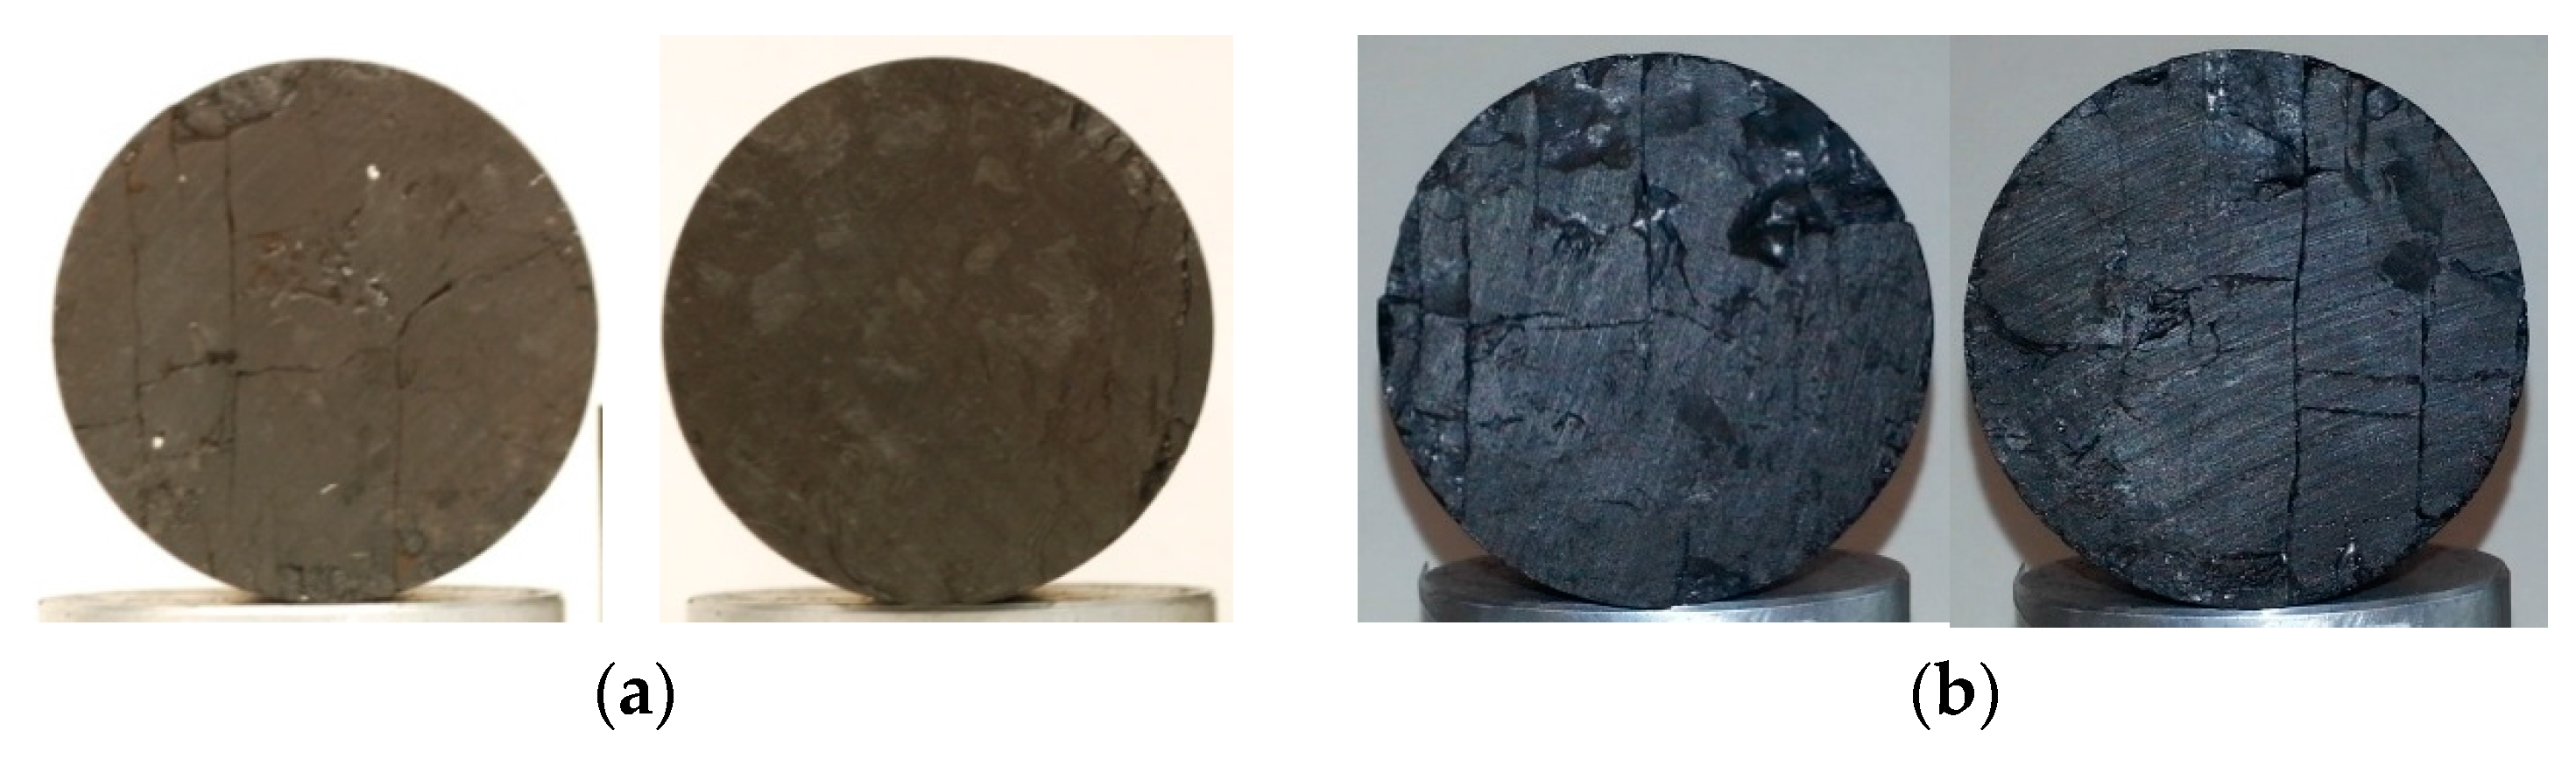
Most of the cores broke along bedding plane discontinuities; hence, none of the specimens were twice as long as their diameters as recommended by ASTM D7012-13 [28]. A diamond drill bit with 2–1/2 inches nominal outer diameter was utilized which resulted in cores with dimeters of 6.1 cm. No additional work was done to adjust dimeter of the cores; however, they were end-trimmed using a lathe machine and specimens with fairly flat end surfaces were produced. No specific measurements were conducted regarding initial moisture content as well as any potential moisture loss and/or gas desorption during the coring process. Ten specimens were obtained with lengths between 5.6 and 10.6 cm; however, five of them were successfully tested in this study. Figure 4 shows pictures of those specimens prior to testing. Vertical fractures (face and butt cleats) and bedding plane fissures were observed in all samples. The specimens even possessed dissimilar natural fracture networks in two end surfaces. The heterogeneous cleat networks in two end faces of S4 and S7, as an example, is shown in Figure 5. Dimensions of the tested specimens are summarized in Table 3.
4. Testing Program
The testing plan is provided in Table 4. Two specimens (S1 and S7) were selected for testing at room temperature. Specimen S1 was tested at room temperature (~24 °C) under a confining stress () equal to 12 MPa. Nitrogen permeability of S1 was measured prior and during shearing. Specimen S7 was also tested at room temperature but under . Specimens S2, S3, and S4 were chosen for higher temperature tests. Initially, the corresponding confining stress was applied to each specimen, which was 6.5, 9.0 and 4.0 MPa, respectively. Then, they were heated at a rate of approximately 10 °C/h. This heating rate was selected much lower than the maximum heating rate of 120 °C/h suggested by ASTM D7012-13 [28]. Once internal LVDTs outputs were stable for about 30 min (3 min for room temperature tests), the test specimen was considered to have reached temperature and pressure equilibrium, compliant to ASTM D7012-13 [28].
Permeability was measured at room temperature, and then at each target temperature (i.e., 80 °C, 140 °C and 200 °C). Each target temperature was maintained over one night (at least 12 h). Two or three permeability measurements were performed at each temperature but under various differential pressures. Finally, Specimens S2, S3 and S4 were sheared at 200 °C.
The intention of this testing program was to capture constitutive behavior of coal beyond the boundaries of a deep UCG cavity where milder temperatures exist than the gasification zone. The focus was to understand the Alberta deep UCG project response which was discussed elsewhere [29]. In that site, the coal seam is located at a depth of ~1400 m. Mean in-situ effective stress was estimated ~14 MPa. Despite the fact that the coal blocks were acquired from an open coal mine in a different location in the province, they were tested under the stress conditions reported in Table 4; which were meant to be close to the deep UCG site condition. Higher temperatures were desirable but the maximum temperature of 200 °C was dictated by maximum operating temperature of the equipment.
It should be noted that no thermo-gravimetric analysis was available for this study. Effective stress definition in this work followed Terzaghi’s formulation; that is, total stress minus average pore gas pressure. Investigation of compressibility effects and; therefore, validity of Terzaghi’s formulation for effective stress definition in this class of material requires further experiments which were beyond the scope of this work.
4.1. Volume Change during Heating and Final Shearing
Equation (1) was used for determination of volumetric strain of a specimen during heating or shearing. Thermal volumetric strain was calculated as a ratio of the thermal volume change at any temperature divided by the initial volume of the specimen at room temperature (~24 °C). Volumetric strain during shear was determined as a ratio of the volume change divided by the specimen volume prior to shear at the test temperature. Contraction was assumed positive in Equation (1):
where:
- (1)
- : volumetric strain (%),
- (2)
- : initial volume of specimen, m3,
- (3)
- : volume of specimen after thermal or shear deformation, m3,
- (4)
- : initial radius of specimen, m,
- (5)
- : change in radius of specimen, m,
- (6)
- : initial height of specimen, m, and
- (7)
- : change in height of specimen, m.
4.2. Permeability to Gas
Interpretation of gas permeability measurements was based on Equation (2), which is applicable to the (laminar/viscous) low flow rate regimes where Darcy’s equation is valid [30]. To date, there is no ASTM standard for gas permeability tests of rocks in a triaxial apparatus to specify a laminar flow in terms of flow rate. ASTM D4525-08 [31], which standardizes permeability of rocks by flowing air in a specimen holder, states that a flow rate less than 2 cm3/s per one cm2 of the specimen end face area is found to be below a turbulent flow threshold. Consequently, all flow rates did not exceed this value:
where:
- (1)
- : coefficient of apparent permeability, m2,
- (2)
- : flow rate of nitrogen at downstream of specimen, m3/s,
- (3)
- : absolute pressure of nitrogen at downstream of specimen, Pa,
- (4)
- : absolute pressure of nitrogen at upstream of specimen, Pa,
- (5)
- : viscosity of nitrogen at specimen temperature and average absolute pressure (, Pa.s,
- (6)
- : length of specimen, m, and
- (7)
- : cross section area of specimen, m2.
Top end of the sample was exposed to nitrogen gas pressure while bottom end was open to the atmosphere. Several other researchers also conducted permeability test with one end open to the atmosphere e.g., [15,23]. The majority of permeability measurements were conducted in a constant pressure mode, where a constant differential pressure was maintained between top and bottom of the specimen. After an equilibrium gas flow rate was attained, the flow rate was measured and permeability was calculated. Flow rate stabilization took from one hour to more than one day, depending on intensity of fractures in specimen. A few constant flow mode tests were also performed in which nitrogen gas with a constant rate was flowed through the specimen, and equilibrium upstream pressure was measured. For each specimen and under each temperature, multiple permeability measurements under various differential pressures or flow rates were done. Pressure transducers continuously recorded upstream and downstream pressures. Flow rate was calculated from ISCO pump volume change. Rewriting Equation (2) to accommodate the aforementioned testing procedure, Equation (3) is used for computing specimen permeability:
where:
- (1)
- : temperature of specimen, K,
- (2)
- : temperature of nitrogen at ISCO pump, K,
- (3)
- : flow rate of nitrogen at ISCO pump, m3/s, and
- (4)
- : absolute pressure of nitrogen at ISCO pump, Pa.
Permeability data herein represents overall response of the coal mass (cleat and matrix). It is worth noting that cleats under effect of confining stress of 4~12 MPa might be different (having much smaller aperture) from the condition in the original coal block in the lab.
5. Results and Discussion
5.1. Thermal Deformation under Isotropic Confining Stress
Utilizing internal LVDTs is one way to measure deformation of a rock specimen in a drained triaxial test or a triaxial test with gas as the pore fluid. In the latter case, pore pressure pump volume change cannot be used as a measure of specimen volume change due to gas compressibility. Using oil as a cell fluid under high temperature also poses a real challenge to utilize strain gauges in a triaxial cell. In these experiments, high-temperature internal LVDTs were used which facilitated capturing thermal deformation behavior of S4, S2 and S3.
Figure 6 presents axial, lateral, and volumetric strains in these specimens during heating from room temperature to about 200 °C under isotropic confining stresses. Neither deformation during permeability tests nor during shearing was included in this figure.
Specimen S2 did not show a significant deformation in axial and lateral directions up to a temperature of about 100 °C. Further heating resulted in decrease in height. At 100 °C, contraction in axial direction was accelerated. At 140 °C, the specimen collapsed in the axial direction and exhibited more than 4% axial contraction. By further heating from 140 to 200 °C, the specimen exhibited contraction in axial direction such that axial compressional strain was more than 5% at 200 °C (Figure 6a).The circumferential LVDT started to detect contraction at about 140 °C, but it moved outside of its limit.
Height of specimen S3 increased by more than 1% as temperature increased from room temperature to approximately 30 °C. Further heating caused a slight reduction in height. At 140 °C, axial strain dropped to nearly 1.9% (contraction) which further gradually dropped to about 2.6% compressional strain at 200 °C. Heating caused gradual lateral contraction. Lateral strain was about 0.5% contraction at 140 °C which was followed by a collapse to about 2.6% contraction at 140 °C. Increasing temperature gradually escalated radial contraction to more than 3.0% at 200 °C (Figure 6b). The volumetric strain curve had a similar trend to those of the axial and lateral strains. Maximum volumetric expansion was about 1.1%; however, at 140 °C, it dropped to about 6.8% contraction. Thereafter, volumetric contraction gradually increased to more than 9% at 200 °C.
Starting heating up from room temperature, specimen S4 exhibited slight expansion both in axial and radial directions. As temperature approached 80 °C, the axial LVDT recorded compressional deformation began to accelerate at 135 °C and followed by a collapse in the axial direction to more than 3% contraction at 145 °C. The circumferential LVDT also started to record a decrease in the circumference (contraction) at 135 °C; however, it moved outside of its limit. From 140 to 200 °C, not a significant change in height was observed (Figure 6c).
Based on Figure 6, it can be concluded that the temperature of about 140 °C seems to be a characteristic temperature where thermal deformation undergoes a transition from expansion to contraction. It is hypothesized that this point corresponds to the temperature where pyrolysis within the coal specimens was initiated. Pyrolysis is defined as thermo-chemical decomposition of coal due to heating in the absence of oxygen. It produces gases (volatile matter), tar, and char. As stated by Arenillas et al. [32], below 150 °C, desorption of water and adsorbed gases occur. Further heating from 150 to 500 °C, degrades the coal matrix generating CO2, pyrolysis water, and aliphatic compounds. The main products of heating between 500 and 800 °C include CO, H2 and CH4. Feng et al. [21] studied gas coal specimens from the Xing-Long-Zhuang coal mine in Shandong, China up to 600 °C in an HPHT triaxial apparatus. They measured pyrolysis gas production along with deformation measurements. In their experiments, major compressional deformation was induced by a sharp increase of pyrolysis gas production at about 250 °C. They reported volumetric expansion of 0.65% at 200 °C which rapidly dropped to 7% contraction at 280 °C. Glass [17] reported that specimens of the Hanna Basin coal initially expanded due to heating (less than 1% expansion). Axial contraction started at about 150 °C and reached to about 10% at about 500 °C. By comparing our observations on the Alberta coal with those from Feng et al. [21] and Glass [17], it was concluded that the temperature of 140 °C signals the initiation of pyrolysis within the specimens.
Increasing confining stress from 4 to 9 MPa for the three specimens did not seem to influence this characteristic temperature; however, further experiments under a wider range of confining stresses may provide a better insight in this regard. The magnitudes of thermal deformation for the specimens shown in Figure 6 were not identical. This is likely due to material variability, dissimilarity in fracture networks in the specimens, and different confining stresses. It is worth noting that the results in Figure 6 may also include creep effects at any target temperature, where permeability tests were done over time periods longer than the heating times. The creep effects were not excluded from the data in Figure 6. A non-stop heating test, from room temperature to 200 °C, on other specimen(s) could prevent the creep effect. Such a test was not conducted in this work.
Unlike inorganic rocks which continuously expand with temperature [33,34,35,36], coal exhibits initial expansion followed by contraction after the characteristic temperature. This distinctive thermal deformation behavior of coal is because of its heterogeneous structure. Coal contains organic and inorganic solids, moisture and volatile matter, and cleat (fracture) network. According to Akbarzadeh and Chalaturnyk [16], thermal deformation of coal is a resultant response of multiple constituents of the coal to heating.
5.2. Stress-Strain and Deformation Characteristics during Shear at Room Temperature
The stress-strain curves of S1 and S7 were determined using different values for their cross section area: (1) a constant area equal to original cross section area; (2) instantaneous cross section area calculated based on circumferential LVDT recordings and (3) instantaneous cross section area based on cell fluid displacement and height change recorded by the external LP. Cell pump volume change (at room temperature) is a simple way of measuring volume change of specimen; which, unlike internal LVDTs and strain gauges, does not require special preparations. The intention here was to quantify differences between the various methods to compute the stress-strain curves. It would provide some insights on the importance of measuring deformation during a HT test on coal which were not quantified by some other researchers [22,23,24,25].
Specimen S1 exhibited a fairly linear behavior in the beginning of shear, which was followed by a curvilinear section prior to peak stress, and a softening behavior post-peak (Figure 7). Maximum strength was observed at an axial strain of 4.38%. Data logging was done at an interval of one minute during the entire shear. The three deviator stress-axial strain curves of specimen S1 are presented in Figure 7. It was observed that there was not a significant difference between the three curves, particularly in the pre-peak region. Compressive strength from circumferential LVDT readings was 53.0 MPa; however, from cell pump/LP and original are were 53.2 MPa and 54.1 MPa, respectively. The latter would result in 0.40% and 1.97% error, respectively, in estimating the compressive strength compared to using the circumferential LVDT. Figure 7 also shows lateral strain plots for S1 using the circumferential LVDT as well as the cell pump/LP. Lateral strain at peak was extensional which were determined equal to 0.98% and 0.78% from the circumferential LVDT and the cell pump/LP, respectively.
Axial and lateral strain curves were used for deducing values of Young’s modulus, E, and Poisson’s ratio, ν, compliant to the methods explained by ASTM D7012-13 [26]. E was measured as an average modulus of the linear portion of the axial stress-strain curve using a linear regression curve-fitting. It was 1467 MPa using the stress-strain curve acquired from the circumferential LVDT; however, based on the cell pump readings, E was determined equal to 1473 MPa. Slope of the lateral curve was determined in the same manner as for the axial curve. Poisson’s ratio is equal to the negative of the ratio between slope of the axial and lateral strain curves in Figure 7. The circumferential LVDT and cell pump/LP resulted in ν of 0.24 and 0.22, respectively.
Volumetric strain of S1 was calculated using the cell pump as well as the circumferential LVDT/external LP readings. In using the cell pump volume change, calibration was done for the volume of the loading ram entering cell fluid area and expelling cell fluid back to the pump. Equation (1) was used in the calculation of from the circumferential LVDT/external LP. Contraction was taken as positive. curves of S1 from the two methods mentioned above are presented in Figure 7. S1 exhibited contraction even after peak stress. Reversal points were observed in the post-peak region from either method. The maximum was determined to be 3.24% and 2.98% from the circumferential LVDT/external LP and the cell pump, respectively.
Specimen S7 was tested under . There was no circumferential LVDT available for this sample; however, lateral and volumetric strains were calculated from the cell pump volume change and an external LP (Figure 8). Similar to S1, using original cross section area and the deformed area (concluded from the cell pump and LP) did not result in a significant deviation in the stress-strain curves in the pre-peak region. The peak deviator stresses using the original and deformed area were equal to 36.33 and 36.10 MPa, respectively. The corresponding peak axial strain was 3.51%. Figure 8 also shows lateral strain curve of S7. Lateral strain initially was compressional which later changed to extensional. Although the initial portion of the lateral strain curve seems uncertain, it is used here. One possible reason for this uncertain region could be fluctuations of room temperature; therefore, cell pump compliance. Lateral strain at peak was determined equal to 0.32% (extension).
If one utilizes the deformation calculation of this specimen, following the same approach as for S1, Young’s modulus and Poisson’s ratio would be equal to 1253 MPa and 0.25 MPa, respectively. Volumetric strain of S7 was analyzed in a similar manner to S1 and the corresponding curves are presented in Figure 8.
5.3. Stress-Strain and Deformation Characteristics during Shear at 200 °C
Specimen S3 was sheared at about 200 °C (the actual average temperature during shearing was 199.3 °C) and under . It should be noted that, due to thermal expansion of the cell fluid, using cell pump volume change for deformation calculation is irrational. Based on the thermal deformation response reported in Figure 6c, diameter and height of the specimen at 199.3 °C and prior to the final shearing were calculated and used as initial dimensions for the shearing stage.
Lateral deformation of S3 during shear was recorded using the circumferential LVDT. As depicted in Figure 9, using original cross section area resulted in a noticeable deviation of the stress-strain curve from the curve concluded by the lateral strain measurements. The peak deviator stress in case of using the original area was 72.1 MPa (compared to 76.7 MPa from the circumferential LVDT) which was 6.0% smaller than using the lateral strain results. The specimen underwent 7.37% axial strain at peak which was larger than the specimens tested at room temperature; S1 and S7.
The circumferential LVDT did not capture a notable deformation until it reached the peak stress where there was a sudden change in the lateral deformation readings. This could be related to forming a failure plane in the specimen. E and ν of S3 were determined as 1817 and 0.04 MPa, respectively. Despite the curvilinear stress-strain plot, slope of the straight-line portion of the curve was calculated as E. Since this is the only HT measurement of ν for this coal, it is not possible to make any statement in regards to its accuracy. Several researchers reported wide ranges for ν at room and elevated temperatures. By testing cylindrical coal specimens with diameters between 61 and 300 mm from the BHP Coal’s Moura Mine in Queensland, Australia at room temperature and under between 0.2 MPa to 10.0 MPa, Medhurst and Brown [5] measured ν between 0.17 and 0.43. Gentzis et al. [4] tested several 37.5 mm-diameter coal specimens from the Foothills and Mountain regions of western Canada at room temperature and under ranging from 0.21 MPa and 14.0 MPa which resulted in ν between 0.26 and 0.48. Fluctuation of ν with temperature was reported by Glass [17], where ν value as small as 0.11 was measured at 250 °C. In that work, ν varied from 0.11 to 0.43 for temperatures between 25 and 250 °C.
For the other two specimens tested at about 200 °C, i.e., S2 and S4, the circumferential LVDT was out of its limit during final shear. Consequently, for those specimens, initial cross section areas were used in the analyses. Their results are presented in the following sections. Number of specimens available for this study was not sufficient to conclude any trend for E versus temperature. Variations of E with temperature for other coals were reported elsewhere [18,19,24].
5.4. Volume Change Responses at Room Temperature and 200 °C
While studying carbonate rocks, Palchik [37] realized that, in general, two classes of curves may be exhibited by rocks. In type 1, the curve has a reversal point, the location where the maximum occurred. This point represents the onset of unstable crack growth in the specimen. This notion was first suggested by Martin and Chandler [38] while performing uniaxial/triaxial compression tests on the Lac du Bonnet granite. Martin and Chandler [38] called the corresponding axial stress for this point as crack damage stress which, for the Lac du Bonnet granite tested in a triaxial compression test, it occurred between 70% and 85% of the peak stress. Another characteristic feature of type 1 is that, at maximum axial/deviator stress, switches from contraction to dilatation. According to Palchik [37], type 2 curve does not have a reversal point in the volumetric strain in the pre-peak region. For type 2, he concluded that crack damage stress is equal to the peak stress and at peak is still compressional; however, he did not mention about occurrence of a reversal point in the post-peak region. The coal specimens tested by Medhurst and Brown [5] manifested initial contraction in the beginning of shear which followed by a dilatant behavior as deviator load increased (type 1). In our experiments, there were no reversal points prior to peak stress for S1, S7 and S3, as depicted in Figure 7, Figure 8 and Figure 9, respectively. The latter was an indication of type 2 volumetric strain responses for these specimens as per Palchik [35]’s classification. In the case of S1, a reversal point in the curve was seen in the post-peak region (Figure 7).
5.5. Comparison between Shear Strength at Room Temperature and 200 °C
Figure 10a,b shows stress-strain curves of room temperature and 200 °C tests, respectively. For room temperature, increasing from 4 MPa (S7) to 12 MPa (S1) resulted in an increase in peak deviator stress from 36.1 MPa (S7) to 53.0 MPa (S1). Moreover, peak axial strain increased from 3.51% (S7) to 4.38% (S1). Similar trends were observed for 200 °C tests. Peak stress as well as peak axial strain became greater as increased. Maximum deviator stresses in the cases of of 4 MPa (S4), 6.5 MPa (S2), and 9 MPa (S3) were 38.0 MPa, 64.3 MPa, and 76.7 MPa, respectively. The corresponding values for peak axial strains were, 4.38%, 6.20% and 7.37%, respectively. Generally, specimens showed greater peak stresses and axial strains at 200 °C compared to room temperature.
It is worth mentioning that the curves presented in Figure 10 embrace two potential sources that might have caused variabilities in the results; shear rate and L/D effects. The data in this figure were not corrected for these effects. Specimen S7 was sheared at a slower rate () compared to the other specimens ().
None of the tested specimens satisfied the length-to-diameter ratio requirement by ASTM D7012-13 [28]. According to ASTM D7012-13 [28], L/D needs to be between 2.0:1 and 2.5:1 and specimens with L/D less than 2.0:1 are unacceptable. According to other researchers [39,40], specimens with L/D less than 2.0:1 exhibit larger strength compared to specimens with L/D equal to 2.0:1. Despite the small L/D of the specimens, they were utilized since longer specimens could not be obtained. ASTM D7012-13 [28] does not suggest any correction factor for the L/D effect; hence, no correction was done in this regard. Principal stress ratio () for all tests are plotted against axial strain in Figure 10c. From both room temperature and 200 °C tests, it was concluded that increasing generally resulted in smaller .
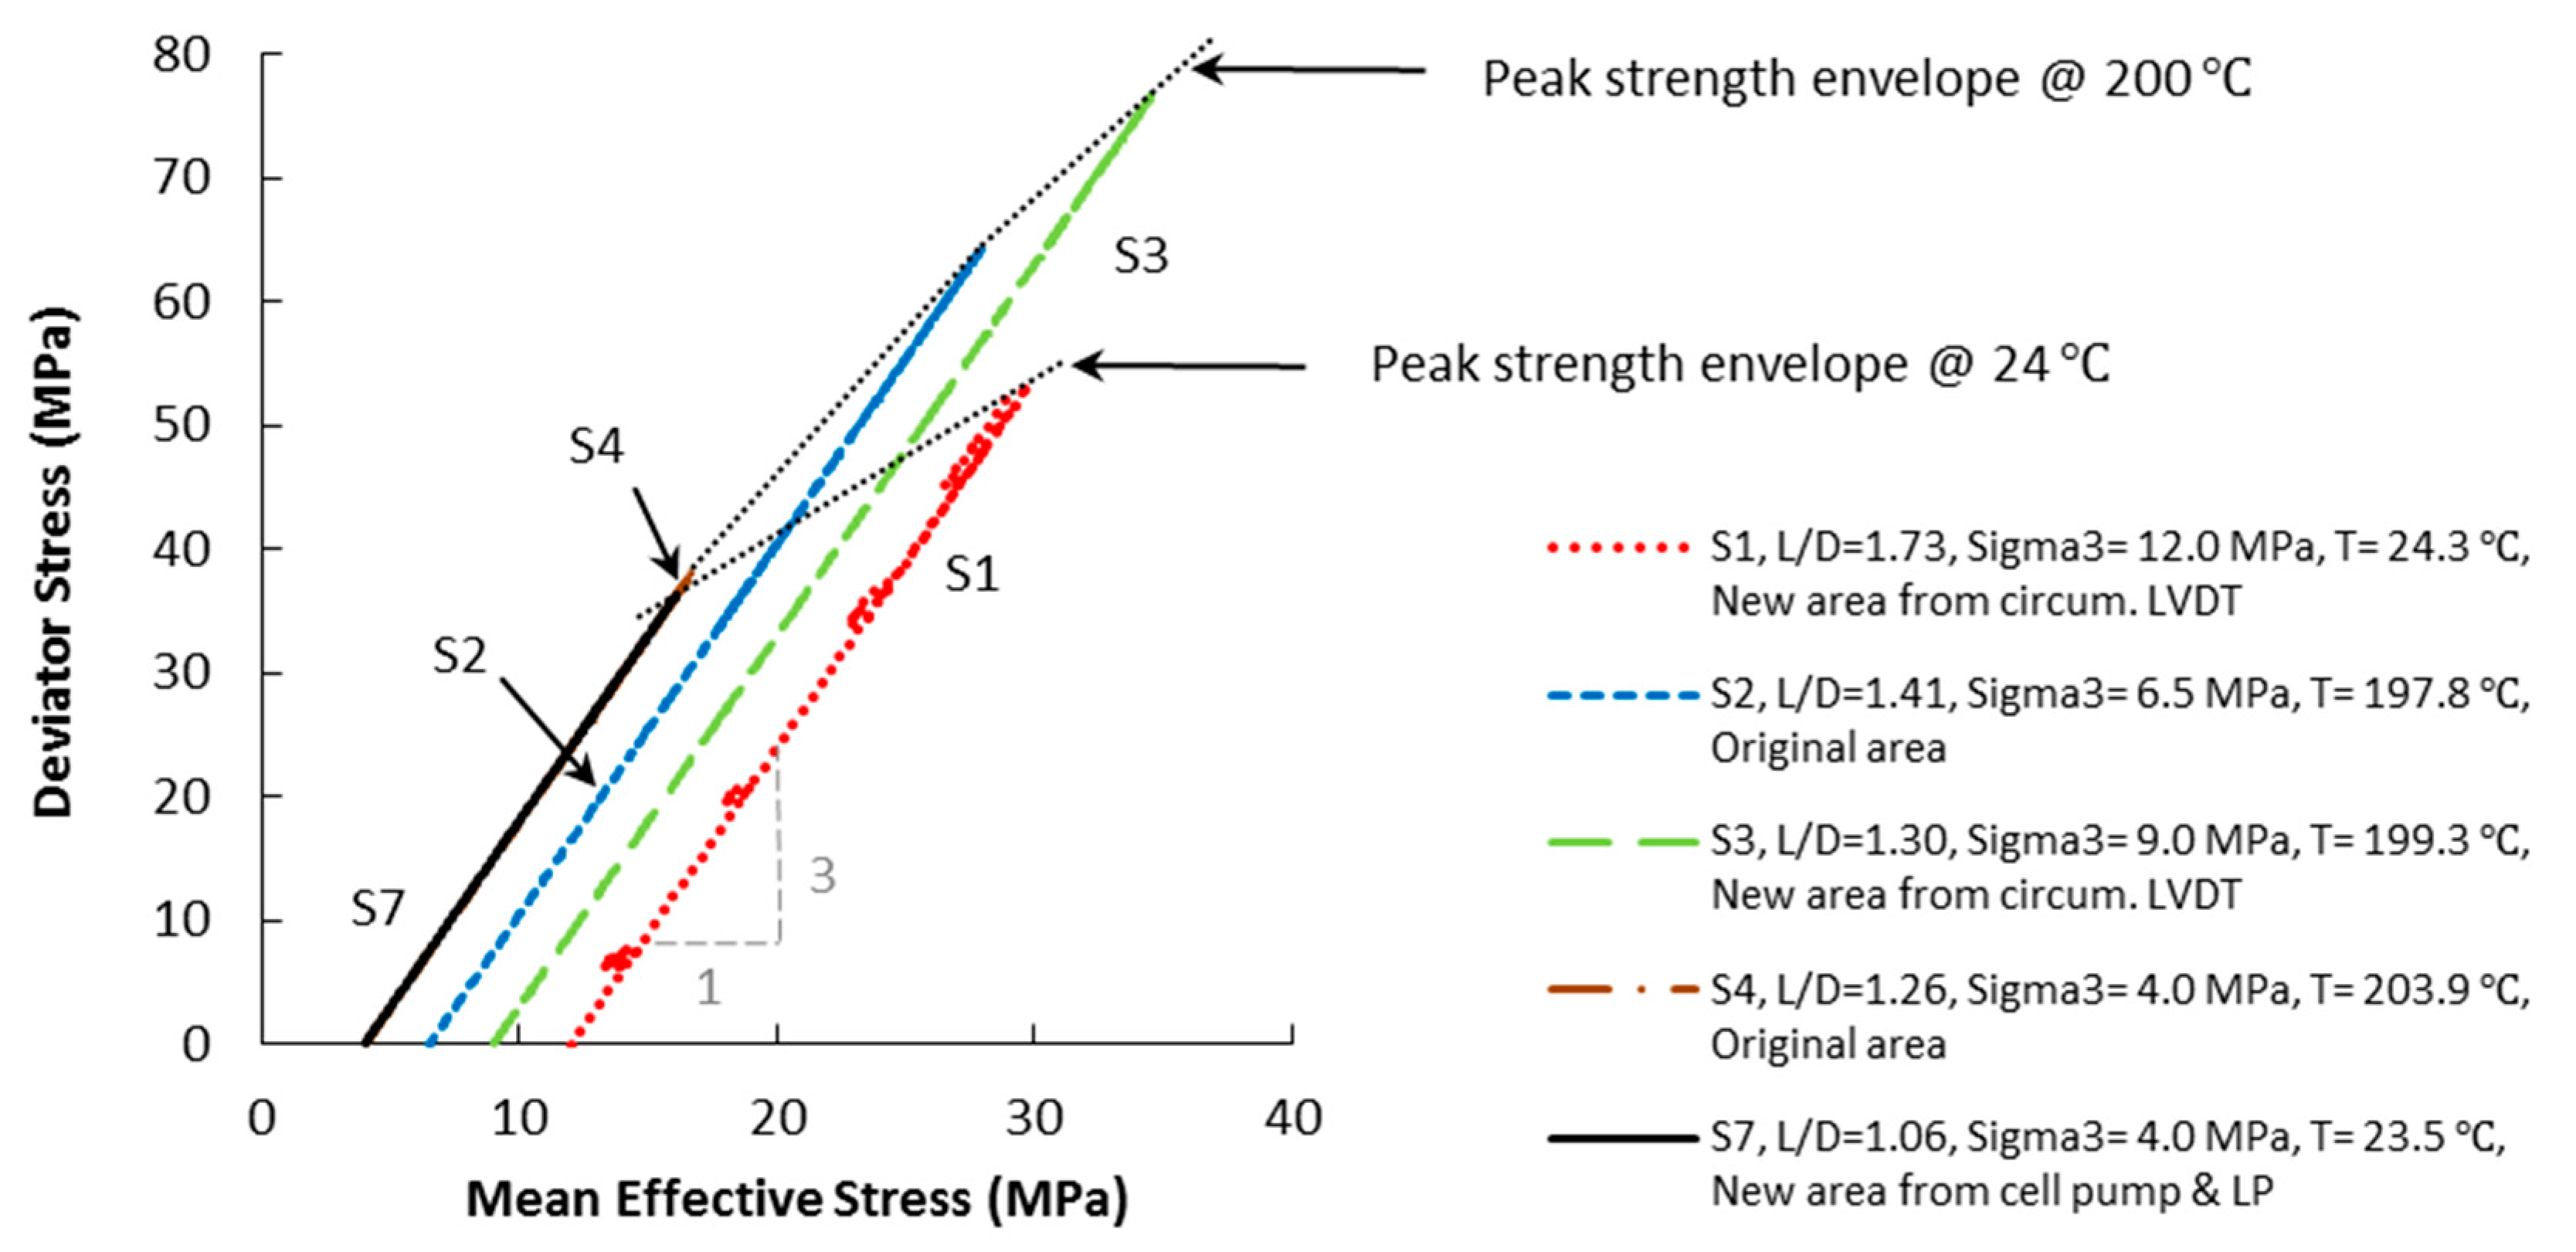
5.6. Stress Paths and Failure Envelopes at Room Temperature and 200 °C
Stress paths all tests are plotted in Figure 11. As mentioned in Section 4, all triaxial tests were performed in drained axial compression mode under constant which resulted in linear stress paths with slope of 3:1 in the deviator-mean effective stress plane. It should be noted that mean effective stress herein was determined as . Inferred peak strength envelopes for room temperature (~24 °C) and ~200 °C are also included in Figure 11. The 200 °C envelope is located above the room temperature envelope which indicates that the coal exhibited higher strength at 200 °C than room temperature. A possible interpretation could be volume contraction due to thermo-chemical response beyond the characteristic temperature (refer to Figure 6). In addition, coal material at 200 °C could be different for the initial coal at room temperature. Further experiments are required to expand these envelops for various mean effectives stress values as well as investigate the envelopes for different temperatures. Implementation of a constitutive model for the coal under study required more experiments which were beyond the scope of this research.
5.7. Internal Measurements and Deformation Localization
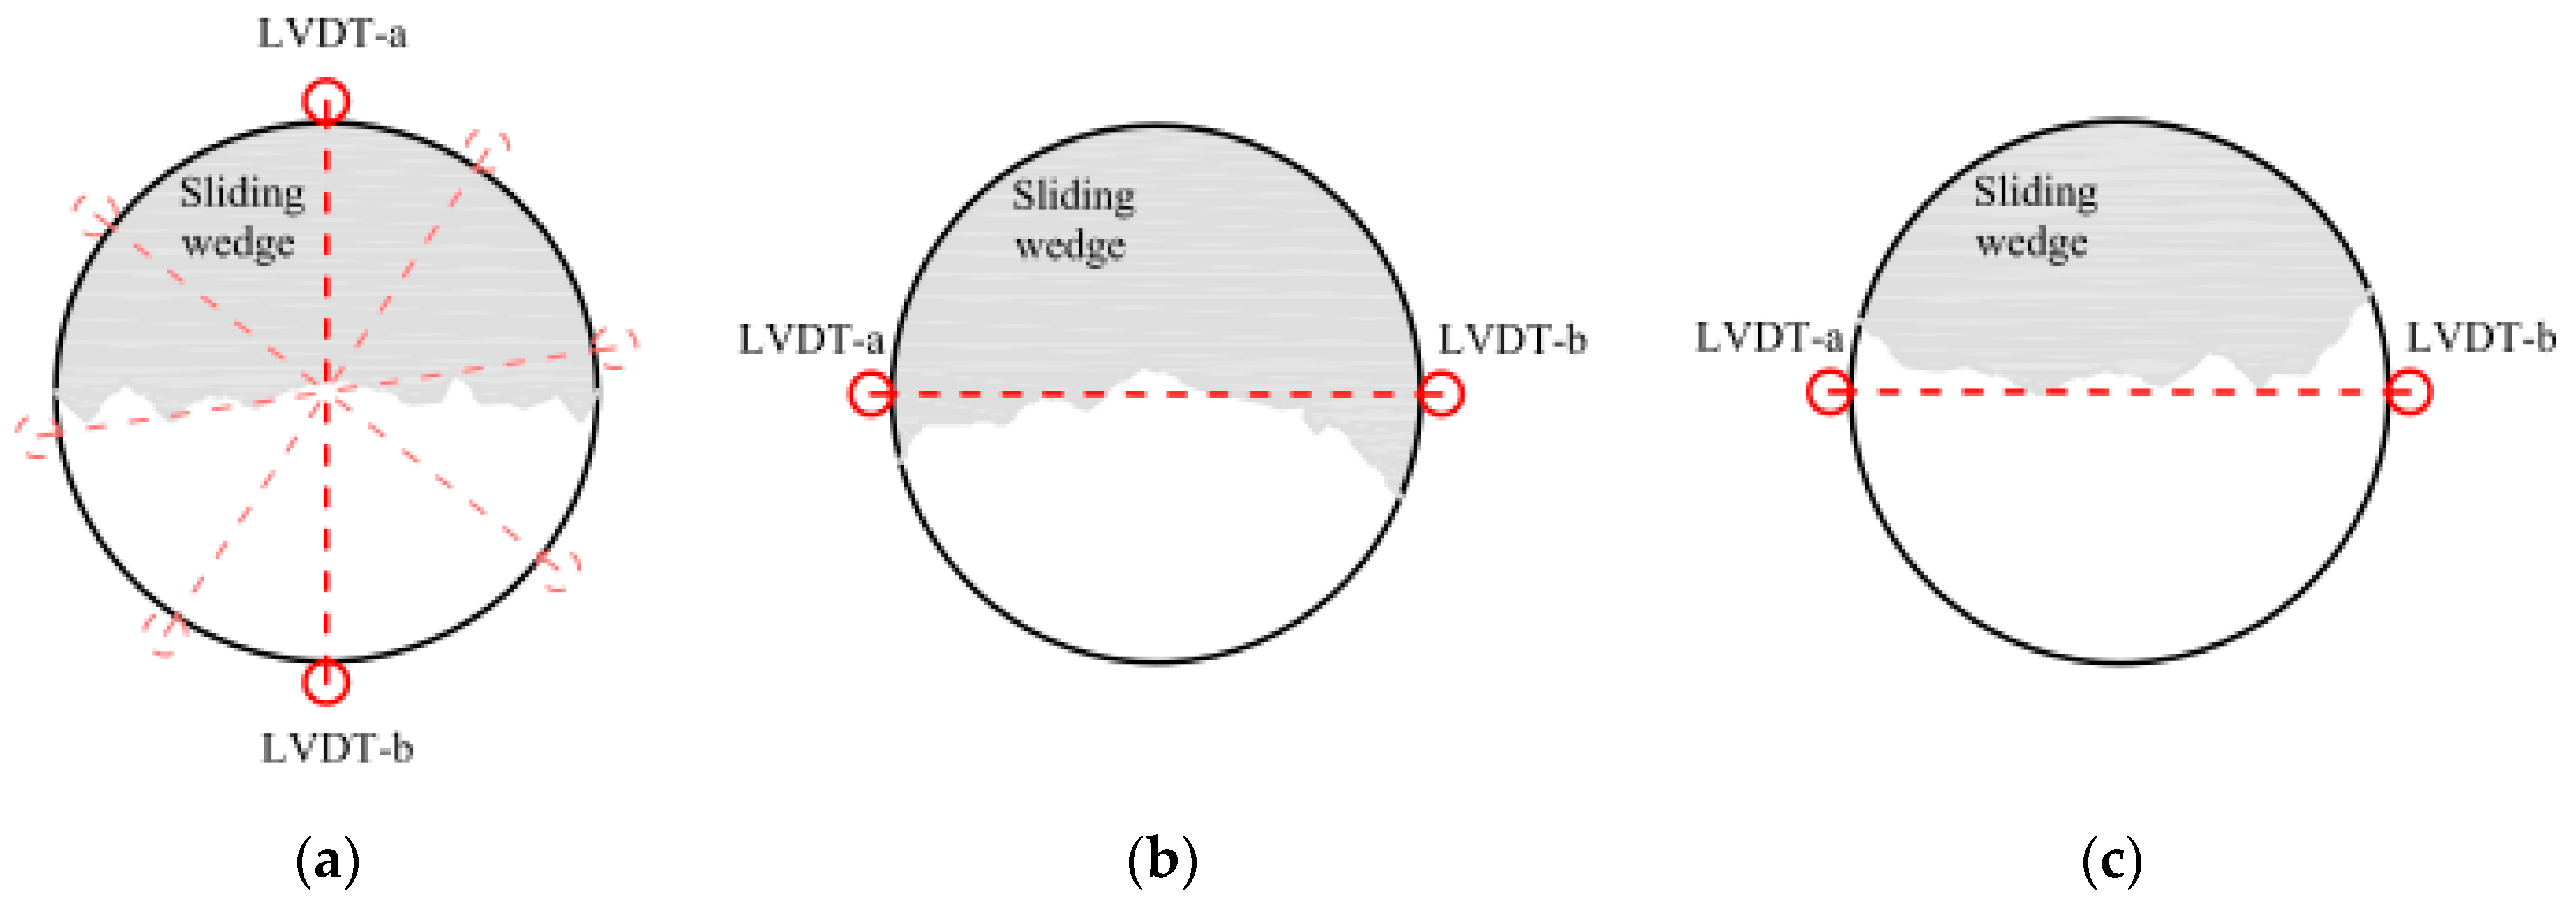
It is very common and convenient to use two axial LVDTs (in diametrically opposite positions) along with one circumferential LVDT in triaxial testing of rocks; however, extra caution must be exercised in using axial LVDTs recordings in testing a fractured coal. An external LP provides average height change during axial compression of a fractured rock sample. Internal axial LVDTs, depending on their positions and proximity to pre-existing weak fractures or any developing shear plane, might be very closely following the external LP or may record smaller or larger axial deformation. Since location of the shear plane is not pre-determined, proximity of the axial LVDTs to the shear plane is unknown until the test is finished and the specimen is disassembled. Nonetheless, axial LVDTs may signal onset of deformation localization in the specimen, as discussed below.
For the purpose of simplicity, let us ignore effect of propagation of any fractures to bedding plane discontinuities on deformation captured by the axial LVDTs. In general, three realizations are possible for positioning axial LVDTs with respect to a sliding wedge during shearing of a specimen, particularly a fractured coal, (Figure 12). Suppose that the axial LVDT-a is placed on the same side as the sliding wedge in Figure 12a and the axial LVDT-b is located on the opposite side. LVDT-a is expected to record more axial deformation than LVDT-b. Average of the two LVDTs might be close to the values recorded by the external LP. If both LVDTs are mounted on the same side of the sliding wedge (Figure 12b) they are supposed to observe somewhat similar displacements but more than the external LP. If both LVDTs are located on the opposite side of the sliding wedge (Figure 12c) they may record similar displacements but less than the external LP. In the latter case, the LVDTs will go a long each other until heterogeneous deformation field initiated. At this point, one LVDT may deviate from another. This can be regarded as onset of deformation localization. Any complex fracture pattern may affect the above interpretations. It should be noted that comprehensive study of strain localization requires utilizing visualization techniques [41,42] which were beyond the scope of current research.
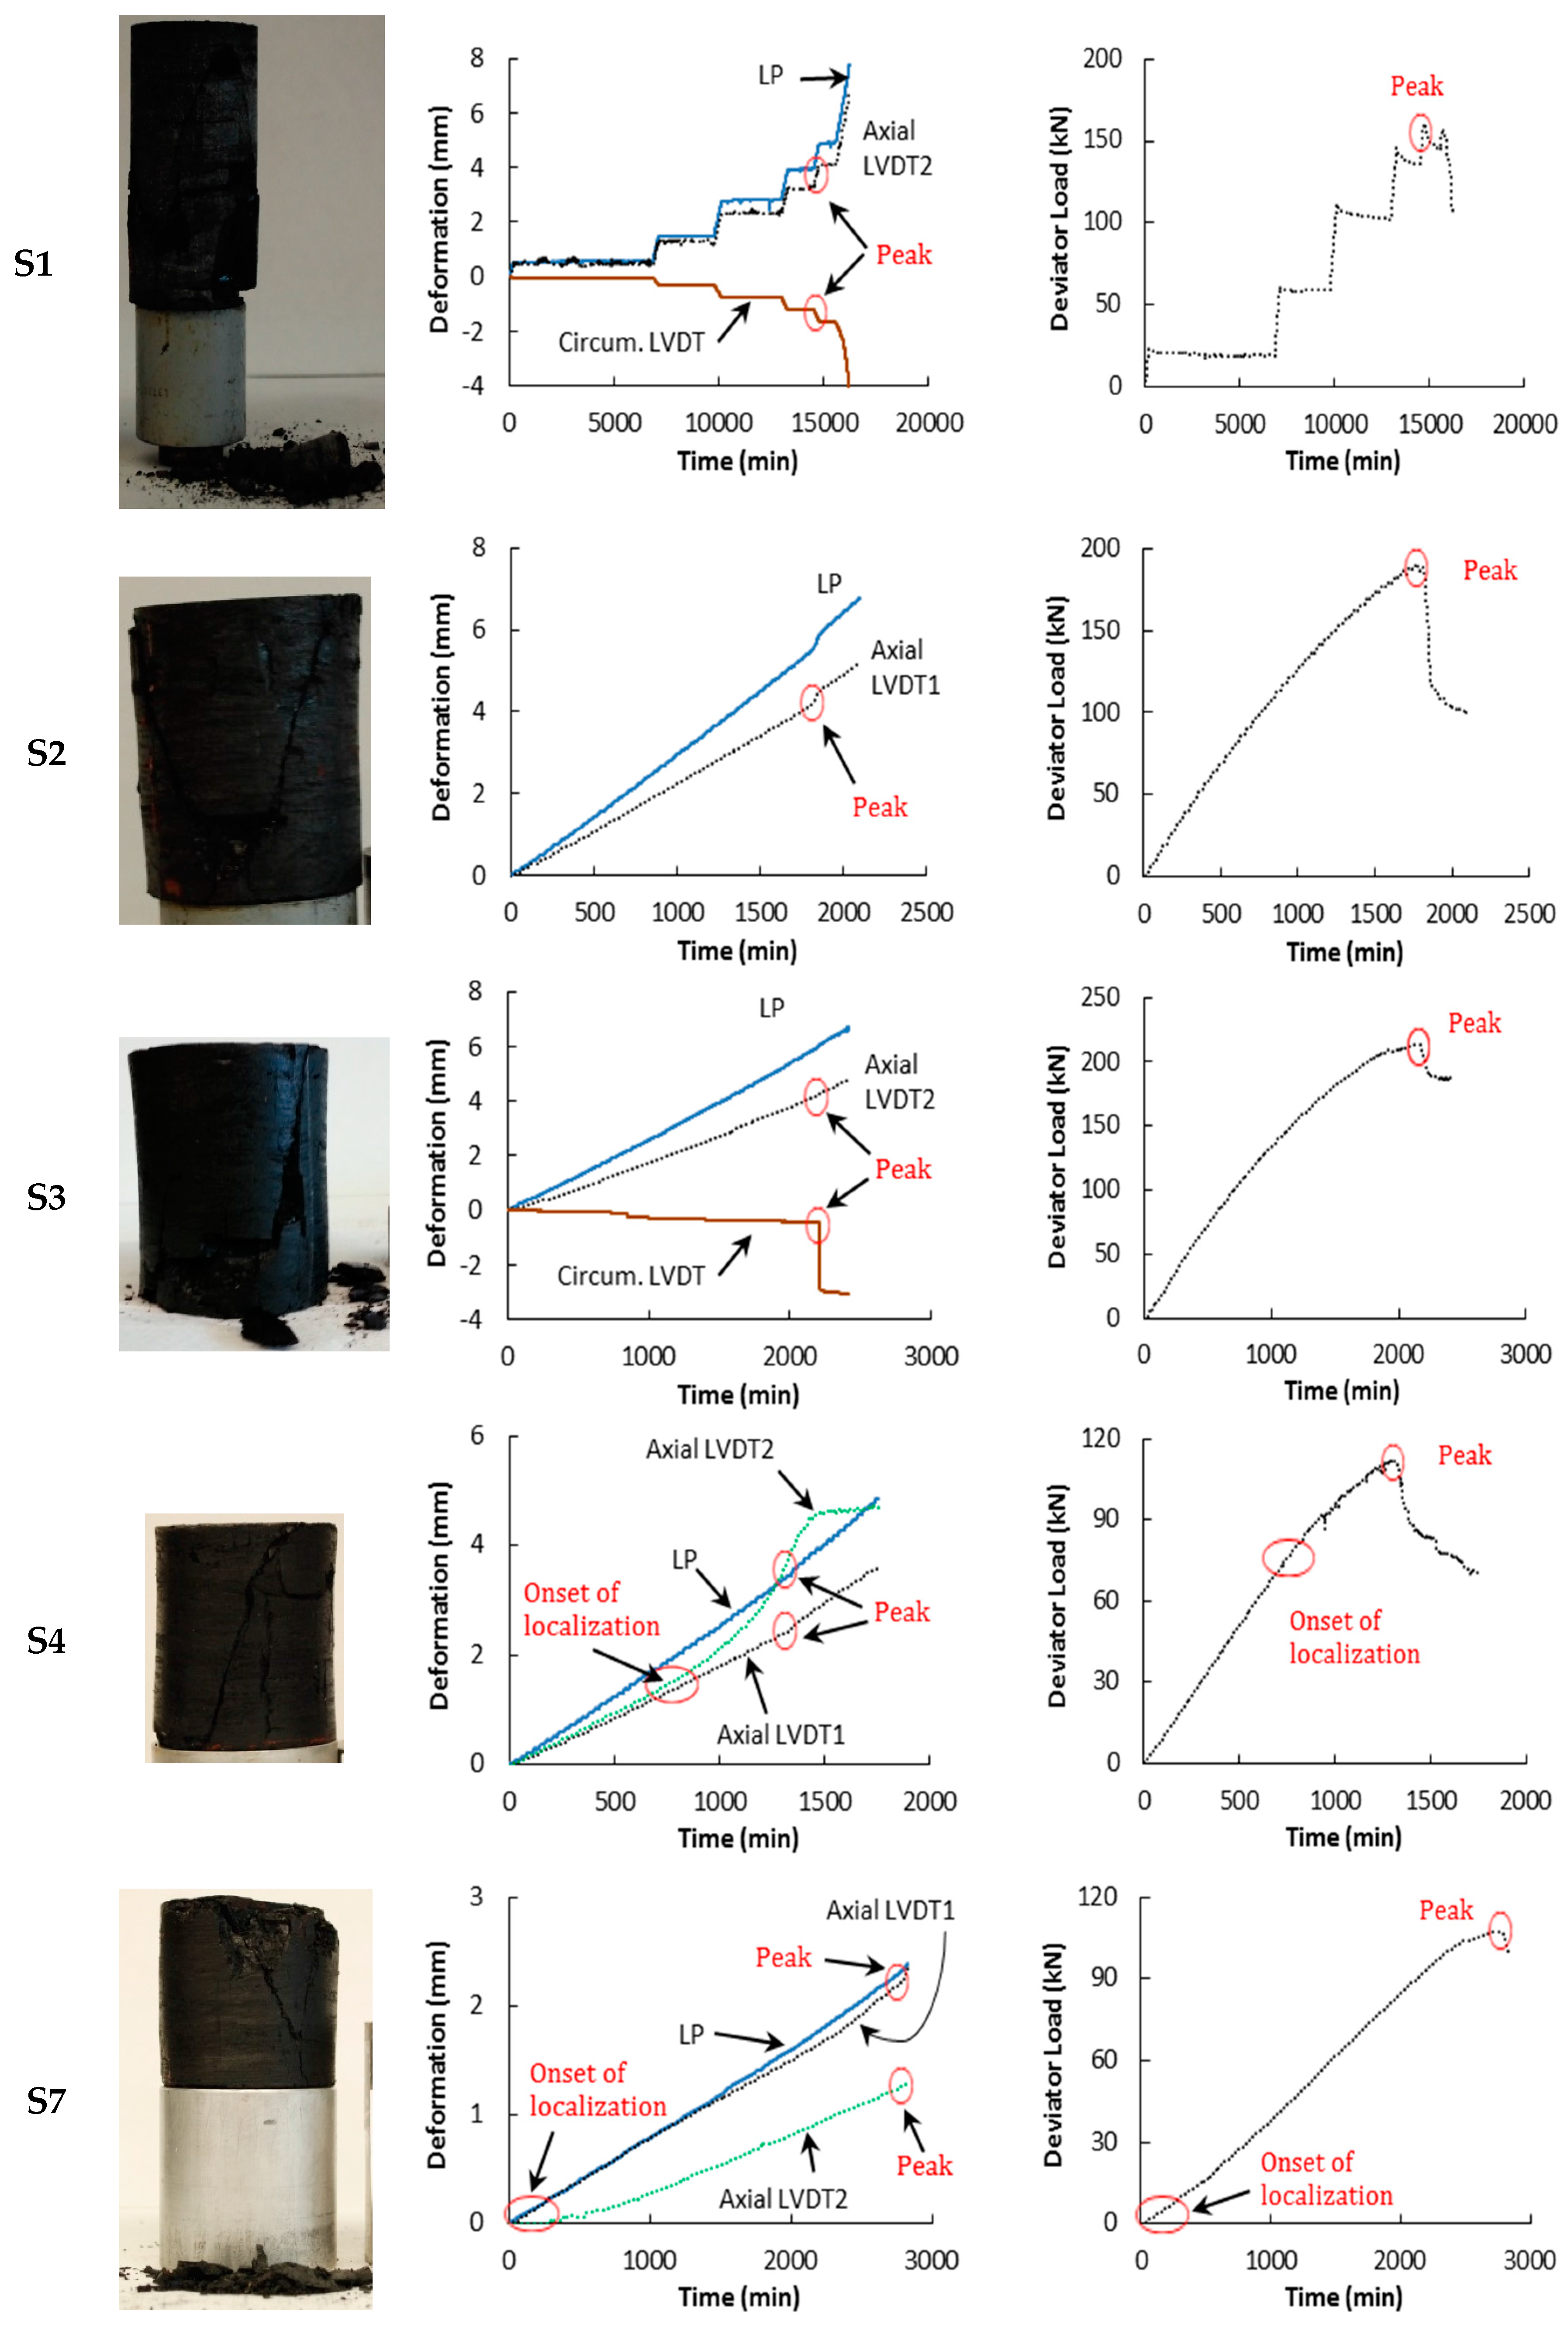
All experiments, room or high temperature, exhibited brittle behavior while forming through-going failure planes along with multiple other fractures. Some fractures extended to bedding plane discontinuities. Post-failure images of the specimen are presented in Figure 13. Since the specimens were shorter than the L/D of 2:1, their failure mechanisms were combination of shearing and axial splitting as discussed by Medhurst and Brown [5]. This is clearly seen in Figure 13 for S4. Besides localization phenomenon, axial and circumferential LVDTs may signal peak stress by rapid change in slopes of axial and circumferential deformation profiles (Figure 13).
In the case of S1, the axial LVDT2 captured almost similar deformation to the external LP. Location of the axial LVDT was not recorded after disassembling the specimen S1. Peak stress was detected by remarkable increase in slope of both axial and circumferential measurement curves.
After dismantling S2, it was observed that the axial LVDT1 was located on the opposite side of the area which was later on severely damaged during shearing. That was the reason that LVDT1 detected less axial compression than the external LP. A vivid increase in slope of the axial compression curve was recorded in the peak stress region.
For specimen S3, LVDT2 captured smaller axial deformation than the external LP. Location of LVDT2 was not recorded after this test. The peak stress was clearly identified by dramatic increase in slope of the circumferential LVDT.
The post-test observation for S4 was that both LVDT1 and LVDT2 were mounted outside of the area which was severely damaged during shearing; hence, they moved downward less than the LP. This observation was similar to the case shown in Figure 12c. At the time 725 min, LVDT2 started to deviate from LVDT1 which can be an indication of major shear plane development (onset of localization). This time corresponded to a deviator load and stress of 73 kN and 25 MPa, respectively. This deviator stress corresponded to 65% of the peak stress. Significant increase in slope of the axial LVDTs curves were noted at the peak stress.
In the case of S7, locations of the axial LVDTs were not noted after the test. LVDT1 readings closely followed the LP; however, LVDT2 detected much smaller deformation. Our interpretation is that LVDT2 was positioned far from the zone that was crushed during shearing. The deviation between LVDT1 and LVDT2 started right after the axial load was applied. This could be due to existence of intense fracture network in both top and bottom end faces of S7 as depicted in Figure 5b. The intense fracture network along with being a short specimen resulted in a localized damage zone in the top end of S7; hence, larger displacement, as possibly detected by LVDT1 and LP (Figure 13). The peak stress was captured by change in slope of the deformation curve of LVDT1.
5.8. Permeability Evolution with Temperature and Effective Stress
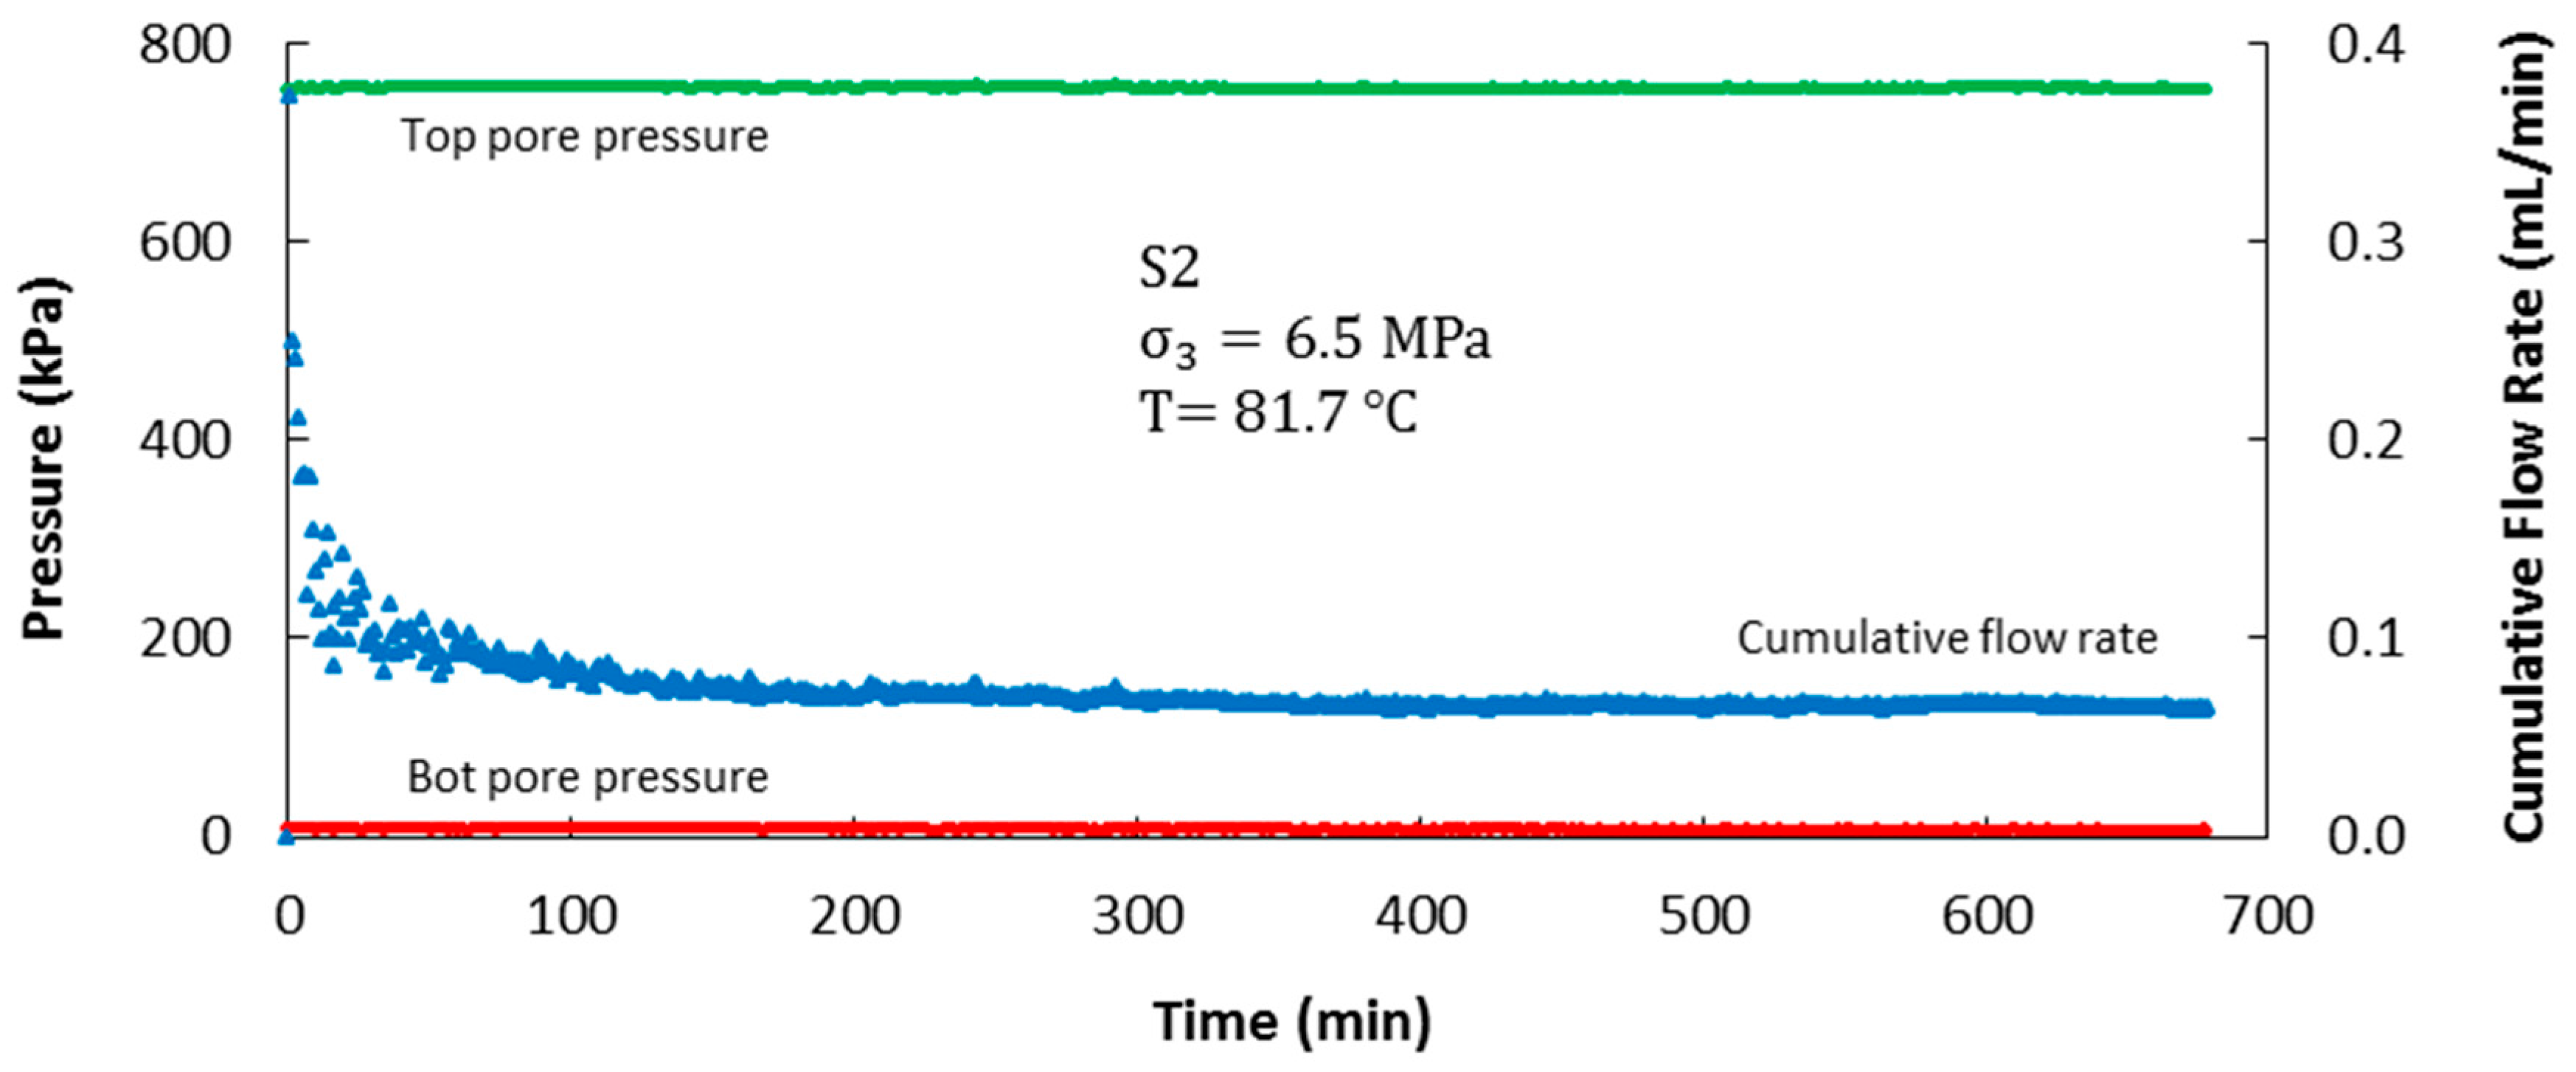
Figure 14, as an example, presents upstream/downstream pressure as well as cumulative flow rate curves for permeability measurement on S2 at 81.7 °C. After about 420 min, equilibrium flow rate at the ISCO pump was attained. Similar curves were generated for each specimen, at any temperatures and differential pore pressures. Nitrogen viscosity as a function of temperature and average pressure in specimen was taken from NIST [43]. Experimental measurements along with the corresponding viscosity were input into Equation (3) to determine permeability. All reported permeability values are apparent permeability since effect of any existing water in the matrix on the testing results was not separated. Table 5 summarizes information regarding permeability tests for each specimen.
Permeability of S2, S3 and S4 are plotted in Figure 15. As depicted in Figure 15a,c,e tests at 80 °C, despite applying higher differential pressures (that is, lower effective confining stresses), usually resulted in smaller permeability values. These phenomena could be due to thermal expansion of the matrix; hence, closure of natural fractures. Further heating of the specimens caused increase in permeability at 140 °C and 200 °C. This increase in permeability is related to the thermo-chemical process of pyrolysis as discussed earlier. Variations of permeability with effective confining stress ( where is mean gas pressure) for these specimens are presented in Figure 15b,d,f. Generally, increasing led to reduction of permeability of the specimens.
Figure 16a summarizes all permeability results versus temperature. Initial permeability at room temperature varied between 5.9 × 10⁻¹⁸ m2 and 3.9 × 10⁻¹⁶ m2. The results show fluctuations. All samples belonged to one coal seam; however, they had different cleat networks. Moreover, they were tested under various differential pressures, effective stresses, and temperatures.
Variations of permeability with for these specimens are plotted in Figure 16b. In this figure, each family of data points at each belongs to a specific specimen but under different temperature. Based on this figure, permeability generally decreased as increased.
5.9. A Conceptual Model for Permeability Evolution Versus Thermal Deformation
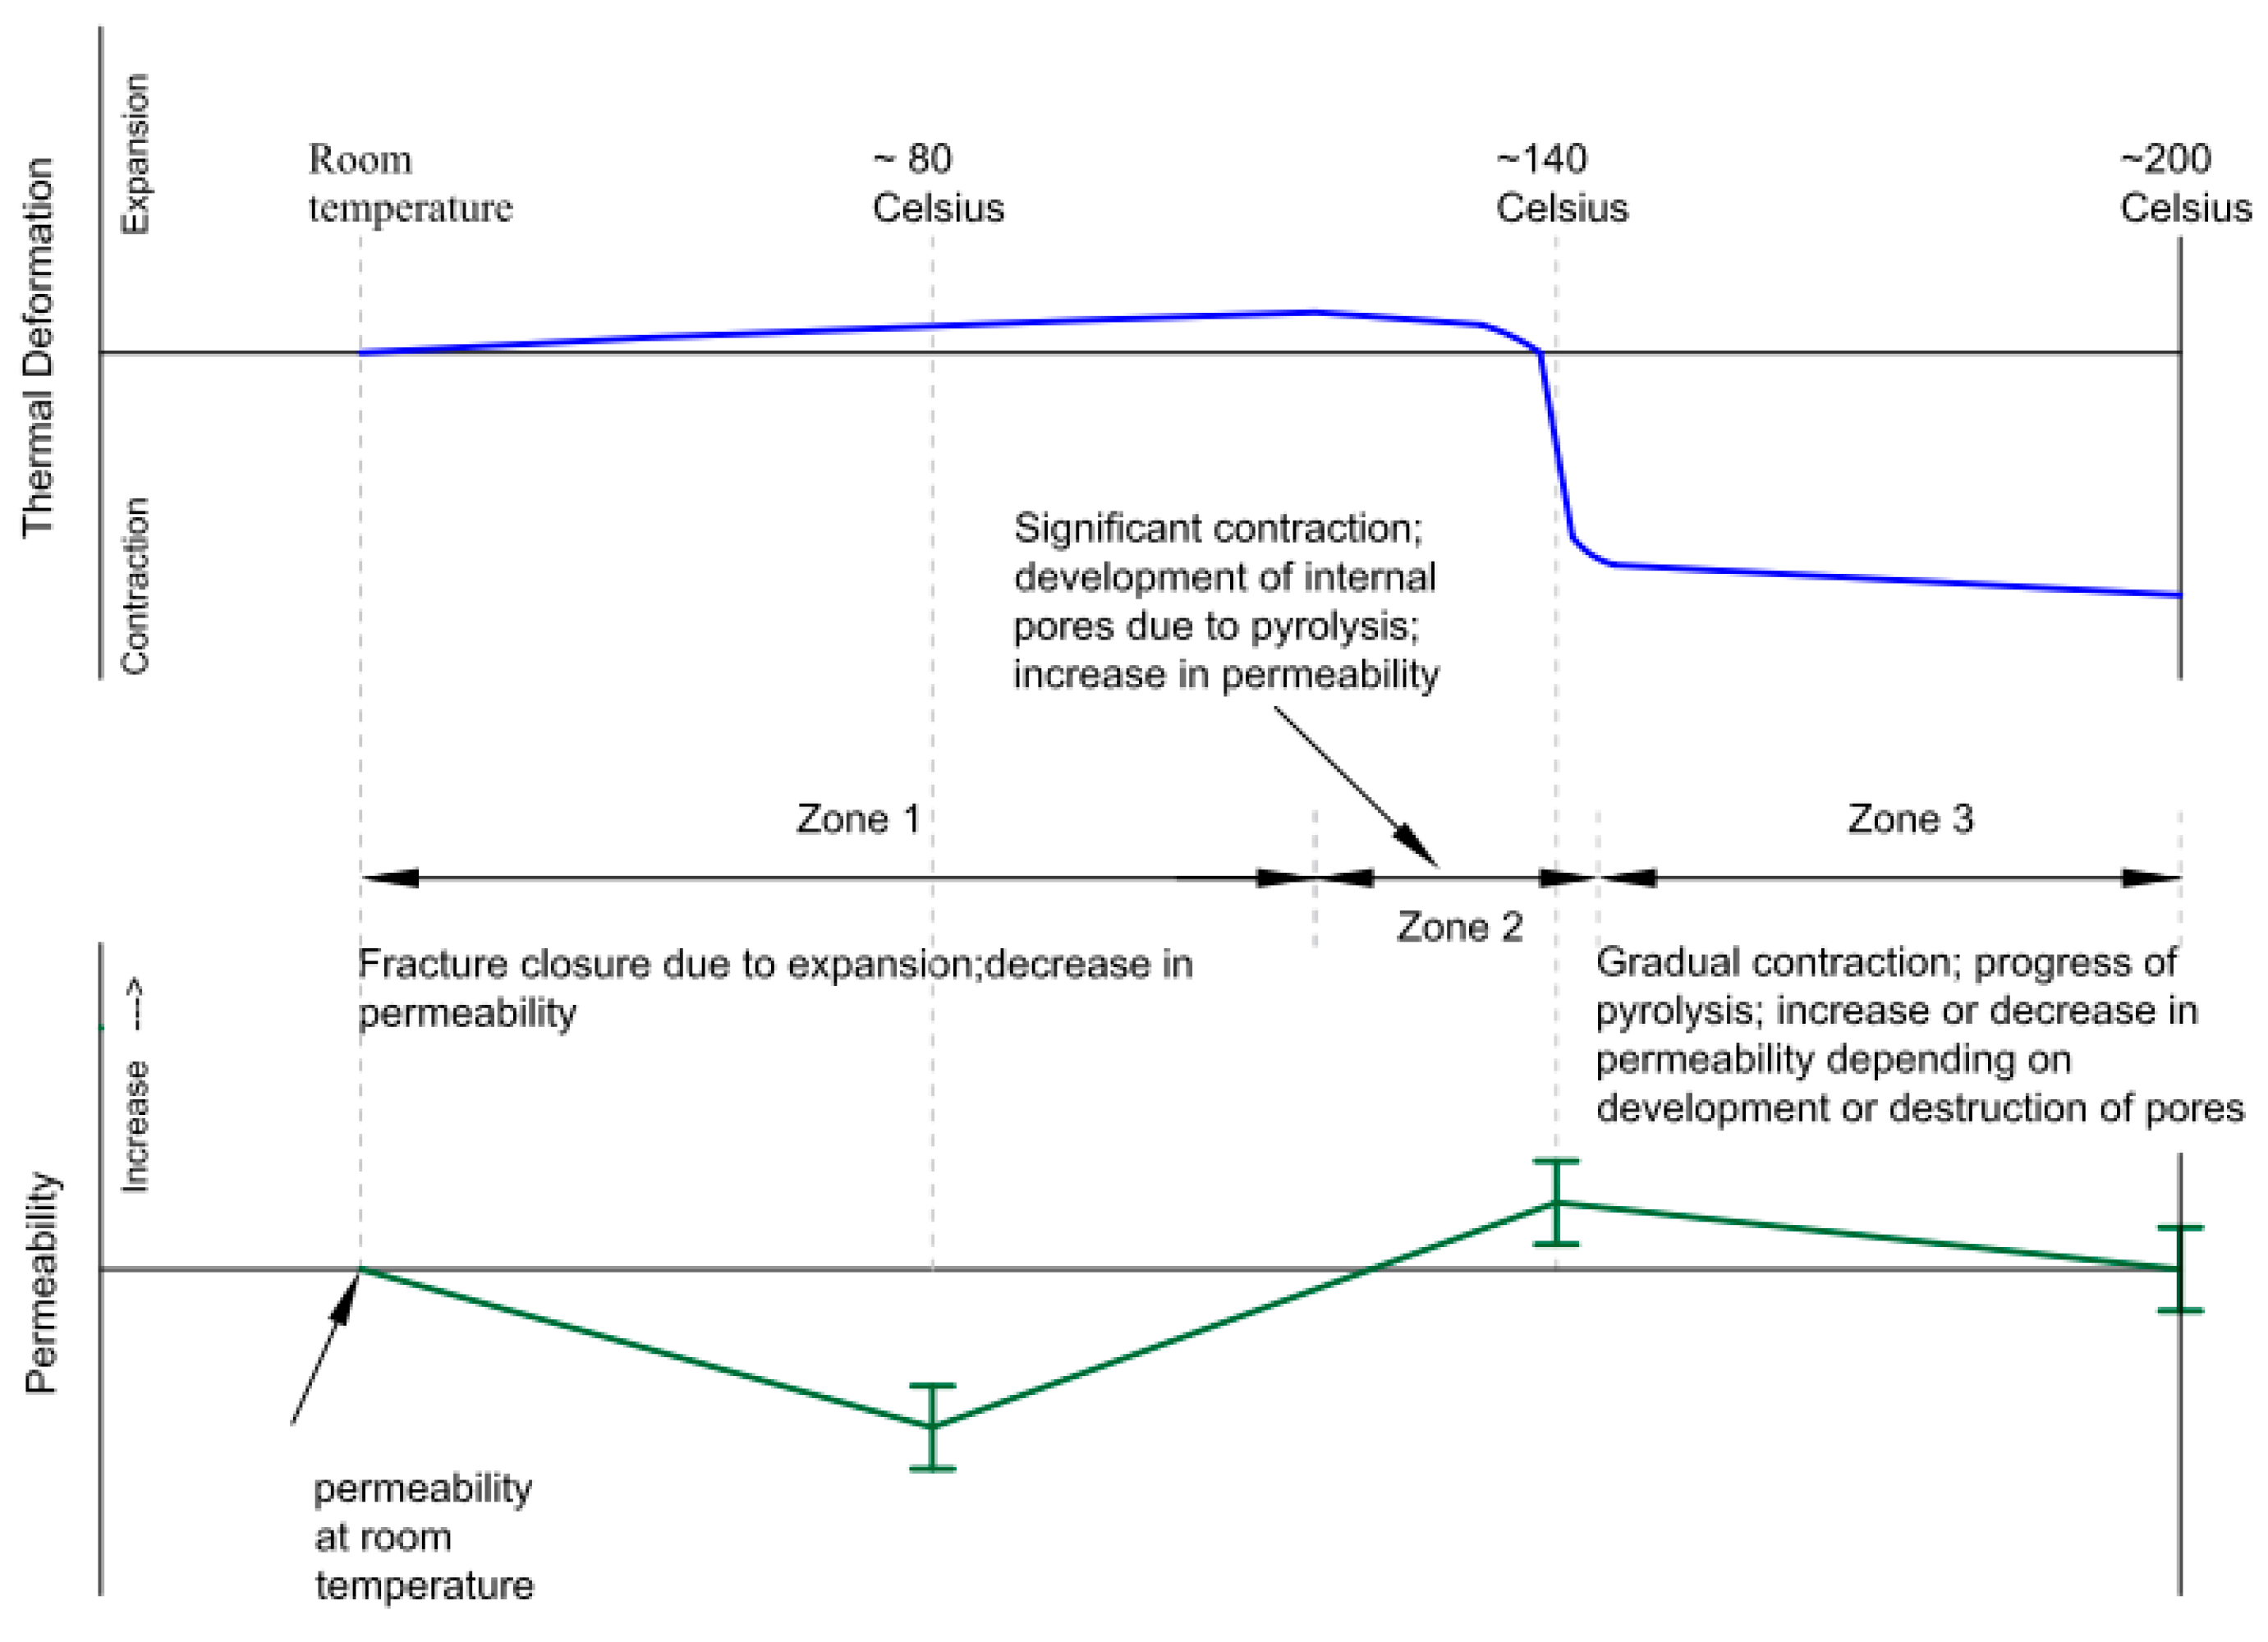
Fluctuations of coal permeability with temperature and were reported by other researchers [19,20,22,23,25]. The general trend of permeability with temperature was ascending in those works. Especially at ultra-high temperatures such as 500 °C or 600 °C, significant increase in permeability was observed. Nonetheless, at lower temperatures such as 100 °C or 200 °C, fluctuations in permeability were noted [23,25]. Based on our experimental results, a conceptual model was inferred for N2-permeability versus thermal deformation of the Alberta coal, which is depicted in Figure 17. Three zones could be interpreted from Figure 17 with different mechanisms of permeability evolution. The first zone existed from room temperature (about 24 °C) to a temperature between 80 and 140 °C. In this zone, the governing mechanism is gradual thermal expansion of the matrix which closed initial fractures; hence, reduced permeability. The second zone existed thereafter to a temperature just after 140 °C. The characteristic feature of the second zone was significant contraction of the specimen and simultaneous development of internal pores due to pyrolysis initiation; hence, increase in permeability. Beyond the second zone, there was a region with gradual contraction up to 200 °C (Zone 3). In this zone permeability may drop or increase, depending on development of new pores as a result of pyrolysis or structural collapse of some of the existing pores. One could justify this conceptual model by measuring porosity under temperatures and average effective confining stresses similar to permeability tests. Such porosity measurements need to be done utilizing gas within the same triaxial apparatus, perhaps based upon the Boyle-Mariotte law.
5.10. Permeability Evolution during Progressive Shearing
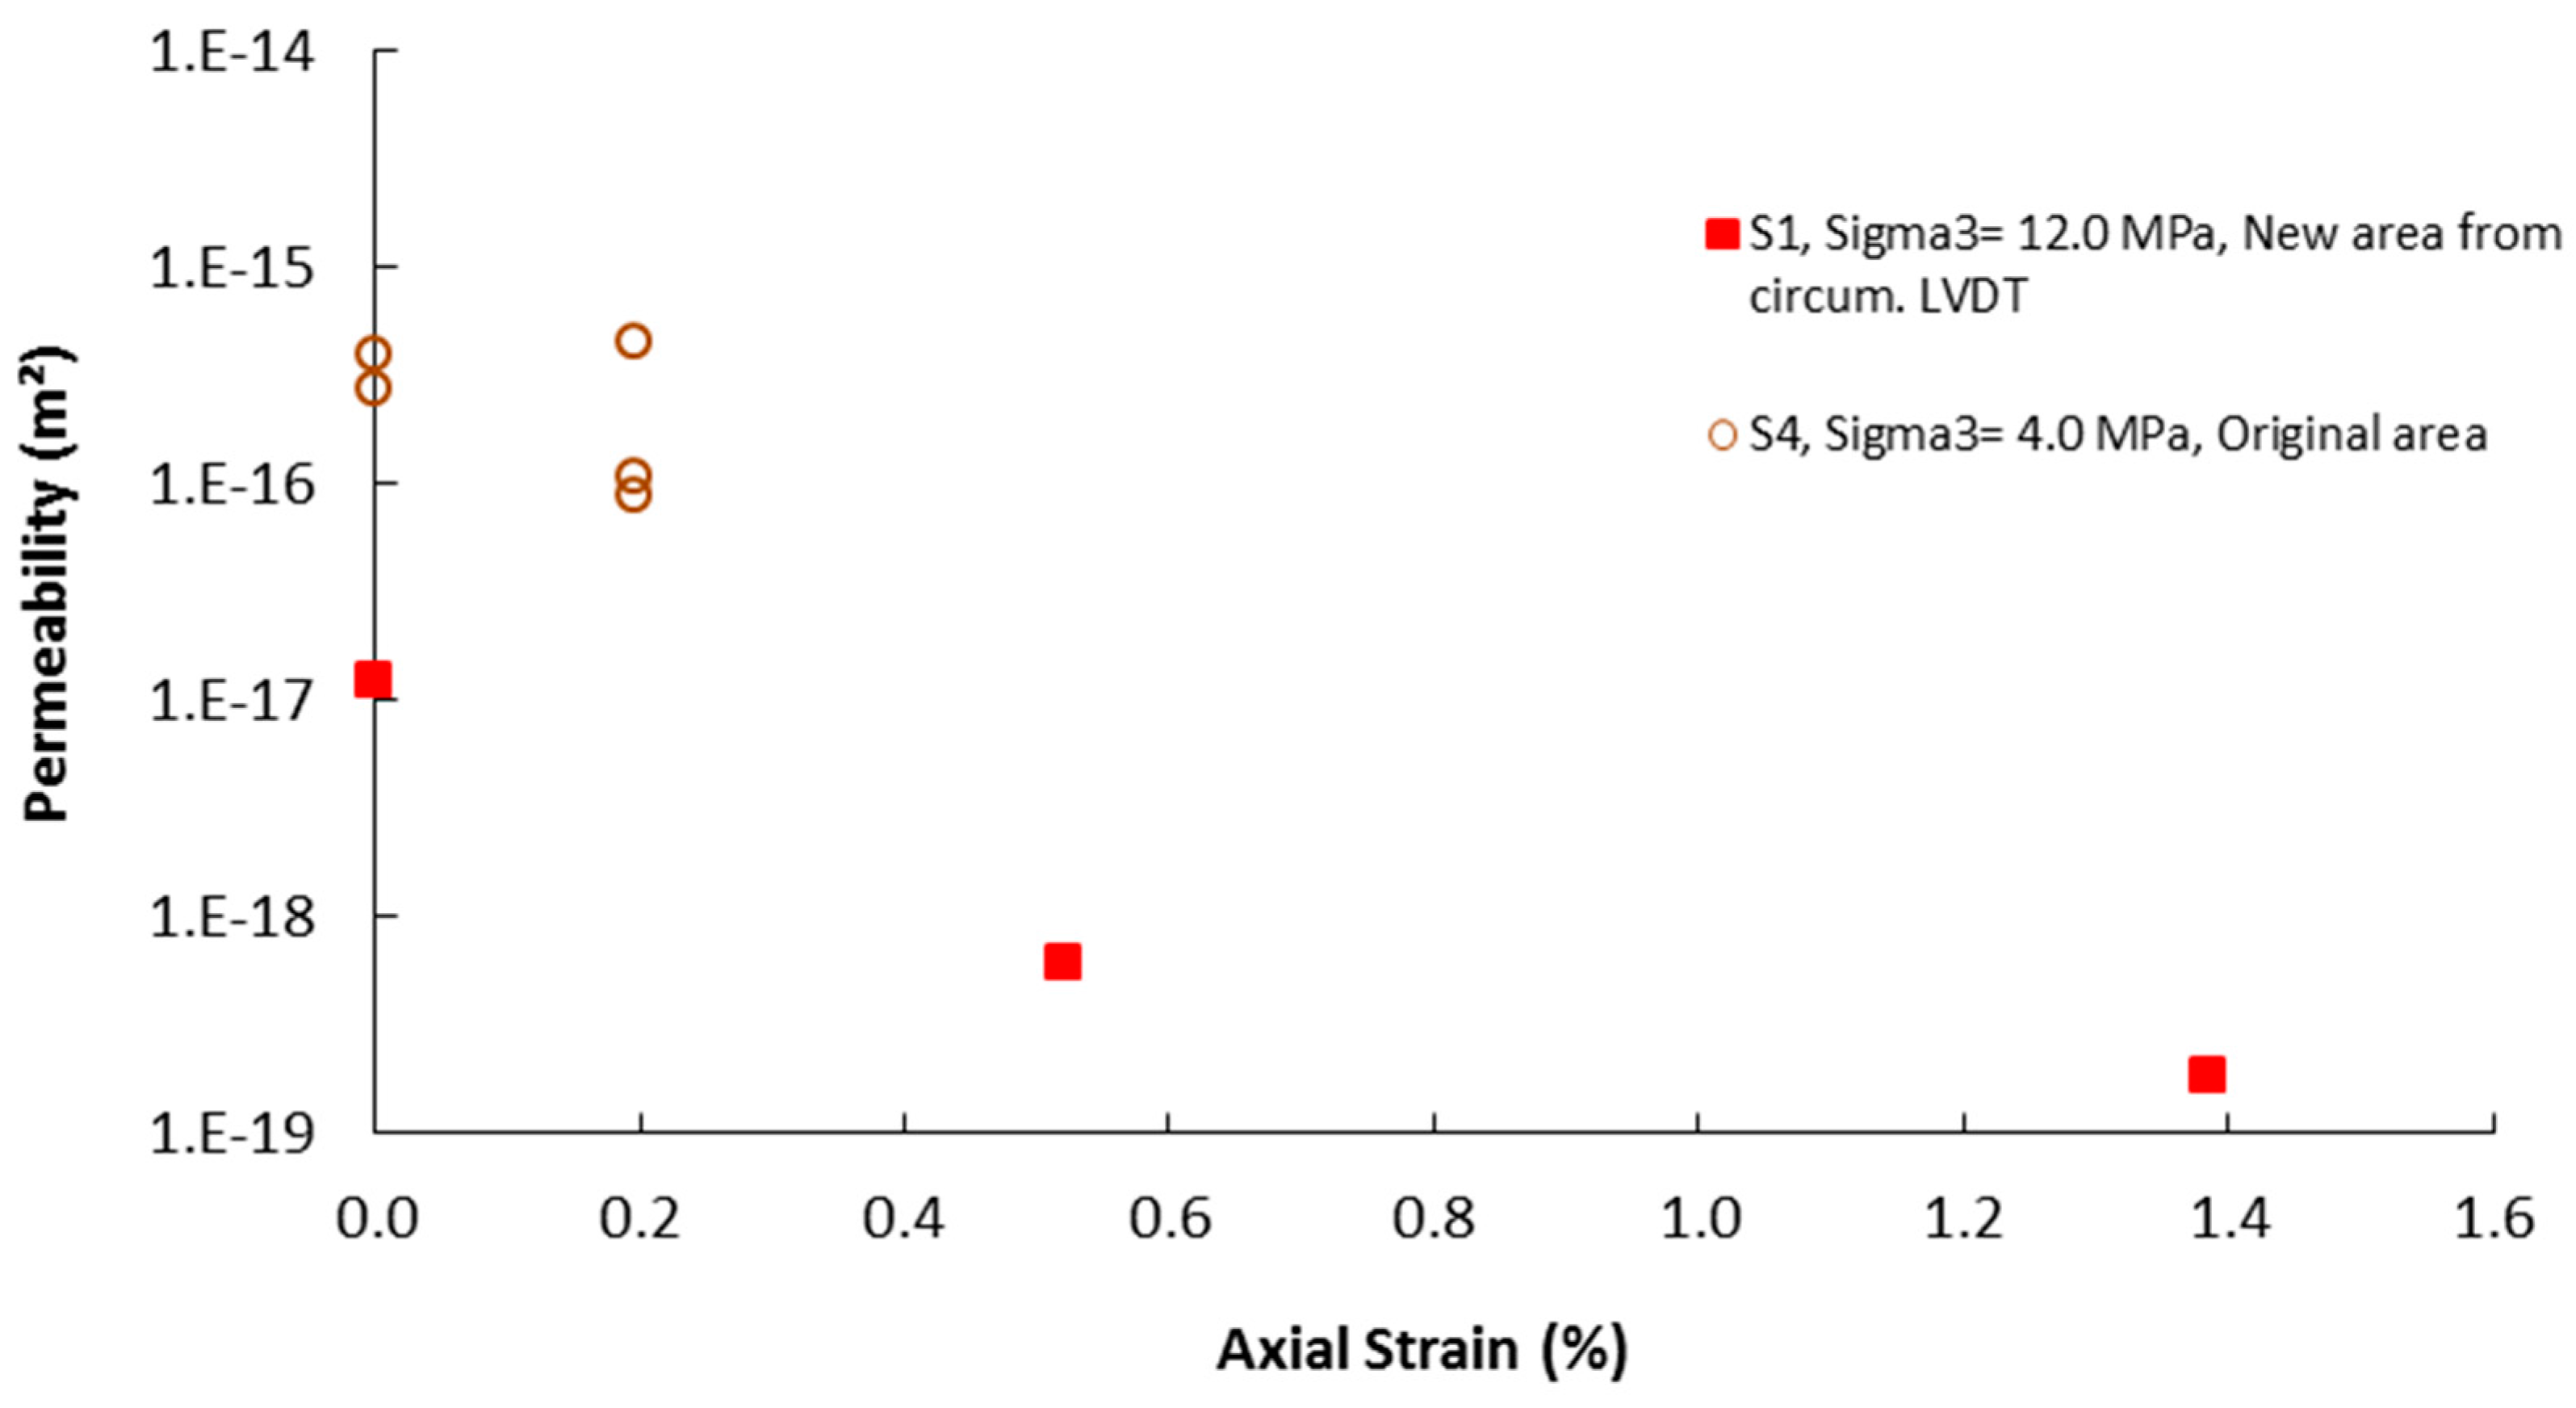
Permeability of S1 and S4 was measured during shearing. Table 5 provides details of each experiment. Permeability of S1 was measured at room temperature prior to shearing and during shearing (at axial strains of 0.52% and 1.39%). The shearing was done in a displacement-control mode. At any target shear strain, the ram pump was stopped without depressurizing it. After permeability test, pore pressure was released; shearing was resumed, and continued to the next target axial strain. As shearing proceeded (axial strain increased), permeability of S1 dramatically decreased (Figure 17). This could be interpreted as the effect of closure of initial fractures of the coal due to shearing. One would expect further shear, especially close to peak stress as well as in post-peak region, to increase permeability. In the case of S1, this phenomenon did not happen. As it is seen from the jumps in Figure 7, it was planned to measure permeability at other axial strains during shearing (i.e., 2.58%, 3.68%, 4.57%) and after shearing; however, it was not possible to do so. Several differential pressures up to 1.04 MPa during shearing and 1.5 MPa after shearing were even tried, for which no significant flow occurred over a period of more than one day for each differential pressure. After disassembling the test, it was observed that failure mechanism was a combination of forming a wedge, and several inclined and horizontal cracks (along bedding plane). None of the mentioned cracks had crossed the top end surface of S1. Shear deformation closed the initial cracks; hence, the progressive shear did not seem to increase permeability. Gas permeation through the matrix and micro-cracks of the top end region probably needed much higher differential pressures. These pressures were not supplied to the specimen. Permeability of S4 prior to shearing and after 2 MPa shear at room temperature (corresponding axial strain was 0.20%) were tested under various gas pressures (Figure 18). Permeability of S4 decreased after axial strain of 0.20%.
According to Figure 18, general trend of permeability with axial strain for the studied range was descending. Similar response was reported by other researchers. For example, Wang et al. [15] tested water and CO2 permeability of the Utah bituminous coal during progressive shearing and under between 0.75 and 3 MPa. They also observed initial reduction of permeability; however, progressive shearing increased permeability by a few orders of magnitude near peak stress and in post-peak region.
5.11. Implications for UCG and Future Experiments
Beyond the boundaries of an underground gasification zone, coal mass is exposed to various temperature and effective stress. As shown in current work and supported by several previous studies e.g., [9,10,11,12,13,14,15,23], gas flow behavior in coal is governed by both temperature and effective stress. Consequently, permeability field beyond the gasification zone would be anisotropic. The same concern exists regarding strength and stiffness of coal which was shown to be dependent on temperature and effective stress.
Further experimental activities at higher temperatures (and up to prevailing gasification temperatures) are required provided that deformation of coal is accurately captured during heating and shearing. Using initial cross section area in permeability and stress-strain calculations would mislead the understanding of coal response. This is of particular significance for the case of an organic rock such as coal as recorded by using internal LVDTs.
6. Conclusions
By testing fractured coal specimens from Alberta in an HPHT triaxial apparatus, following observations can be concluded:
- Thermal deformation was initially observed as expansion that followed by contraction in both axial and lateral directions at about 140 °C. This temperature corresponded to occurrence of thermo-chemical process of pyrolysis in which some gases were released from the coal matrix; hence, resulted in contraction of the coal rock.
- All specimens showed brittle behavior while forming through-going shear planes combined with multiple other fractures, some extended to bedding plane discontinuities. A detailed analysis of internal LVDTs responses during deformation was provided to highlight their applicability to detect deformation localization and peak stress in a fractured coal. Specimens at 200 °C showed higher peak stresses and strains compared to those tested at 24 °C. Volumetric strain response of this coal, both at room and high temperature revealed that crack damage stress was equal to peak stress; that is, no reversal point in the volumetric strain plots were observed in pre-peak region.
- Permeability of this coal fluctuated with temperature and confining stress. Reduction in permeability was notable at 80 °C, which was due to thermal expansion of the matrix and closure of initial fractures. Permeability evolution at higher temperature, especially around 140 °C and above was a combined response of thermal expansion and pyrolysis. A conceptual model was inferred for N2-permeability versus thermal deformation of the coal under study. Progressive shearing was observed to decrease permeability in early stage of shear.
Acknowledgments
The authors would like to thank the Canadian Centre for Clean Coal/Carbon and Mineral Processing Technologies (C5MPT) for providing financial support to this research program. Collaboration by the Sherritt Coal in supplying the coal blocks is also acknowledged.
Author Contributions
Hossein Akbarzadeh Kasani and Richard J. Chalaturnyk conceived and designed the experiments; Richard J. Chalaturnyk supplied required equipment and materials; Hossein Akbarzadeh Kasani carried out the experiments, analyzed the results, and wrote the paper; Richard J. Chalaturnyk supervised the work and edited the paper.
Conflicts of Interest
The authors declare no conflict of interest.
References
- Speight, J.G. Handbook of Coal Analysis; John Wiley & Sons, Inc.: Hoboken, NJ, USA, 2005; Volume 166. [Google Scholar]
- Akbarzadeh Kasani, H. Reservoir-Geomechanics of Underground Coal Gasification (UCG). Ph.D. Thesis, University of Alberta, Edmonton, AB, Canada, September 2016. [Google Scholar]
- Buzzi, O.; Sieffert, Y.; Mendes, J.; Liu, X.; Giacomini, A.; Seedsman, R. Strength of an Australian coal under low confinement. Rock Mech. Rock Eng. 2014, 47, 2265–2270. [Google Scholar] [CrossRef]
- Gentzis, T.; Deisman, N.; Chalaturnyk, R.J. Geomechanical properties and permeability of coals from the Foothills and Mountain regions of western Canada. Int. J. Coal Geol. 2007, 69, 153–164. [Google Scholar] [CrossRef]
- Medhurst, T.P.; Brown, E.T. A study of the mechanical behaviour of coal for pillar design. Int. J. Rock Mech. Min. Sci. 1998, 35, 1087–1105. [Google Scholar] [CrossRef]
- Dabbous, M.K.; Reznik, A.A.; Taber, J.J.; Fulton, P.F. The permeability of coal to gas and water. Soc. Petrol. Eng. J. 1974, 14, 563–572. [Google Scholar] [CrossRef]
- Gensterblum, Y.; Ghanizadeh, A.; Krooss, B.M. Gas permeability measurements on Australian subbituminous coals: Fluid dynamic and poroelastic aspects. J. Nat. Gas Sci. Eng. 2014, 19, 202–214. [Google Scholar] [CrossRef]
- Li, Y.; Tang, D.; Xu, H.; Meng, Y.; Li, J. Experimental research on coal permeability: The roles of effective stress and gas slippage. J. Nat. Gas Sci. Eng. 2014, 21, 481–488. [Google Scholar] [CrossRef]
- Somerton, W.H.; Soylemezoglu, I.M.; Dudley, R.C. Effect of stress on permeability of coal. Intl. J. Rock Mech. Min. Sci. 1975, 12, 129–145. [Google Scholar] [CrossRef]
- Mitra, A.; Harpalani, S.; Liu, S. Laboratory measurement and modeling of coal permeability with continued methane production: Part 1—Laboratory results. Fuel 2012, 94, 110–116. [Google Scholar] [CrossRef]
- Perera, M.S.A.; Ranjith, P.G.; Choi, S.K.; Bouazza, A.; Kodikara, J.; Airey, D. A review of coal properties pertinent to carbon dioxide sequestration in coal seams: With special reference to Victorian brown coals. Environ. Earth Sci. 2011, 64, 223–235. [Google Scholar] [CrossRef]
- Jasinge, D.; Ranjith, P.G.; Choi, S.K. Effects of effective stress changes on permeability of latrobe valley brown coal. Fuel 2011, 90, 1292–1300. [Google Scholar] [CrossRef]
- Ranathunga, A.S.; Perera, M.S.A.; Ranjith, P.G.; De Silva, G.P.D. A macro-scale view of the influence of effective stress on carbon dioxide flow behaviour in coal: An experimental study. Geomech. Geophys. Geo-Energ. Geo-Resour. 2017, 3, 13–28. [Google Scholar] [CrossRef]
- Wang, Y.; Liu, S.; Elsworth, D. Laboratory investigations of gas flow behaviors in tight anthracite and evaluation of different pulse-decay methods on permeability estimation. Int. J. Coal Geol. 2015, 149, 118–128. [Google Scholar] [CrossRef]
- Wang, S.; Elsworth, D.; Liu, J. Permeability evolution during progressive deformation of intact coal and implications for instability in underground coal seams. Int. J. Rock Mech. Min. Sci. 2013, 58, 34–45. [Google Scholar] [CrossRef]
- Akbarzadeh, H.; Chalaturnyk, R.J. Structural changes in coal at elevated temperature pertinent to underground coal gasification: A review. Int. J. Coal Geol. 2014, 131, 126–146. [Google Scholar] [CrossRef]
- Glass, R.E. The thermal and structural properties of a Hanna basin coal. J. Energy Resour. Technol. 1984, 106, 266–271. [Google Scholar] [CrossRef]
- Shoemaker, H.D. Mechanical Properties of the Pittsburgh Coal at Elevated Temperatures. Ph.D. Thesis, West Virginia University, Morgantown, WV, USA, 1976. [Google Scholar]
- Singer, J.M.; Tye, R.P. Thermal, Mechanical, and Physical Properties of Selected Bituminous Coals and Cokes; Bureau of Mines Report: Washington, DC, USA, 1979. [Google Scholar]
- Thorsness, C.B.; Grens, E.A.; Sherwood, A. A One-Dimensional Model for In Situ Coal Gasification; UCRL-52523, National Laboratory (LLNL) Report; Lawrence Livermore: Berkeley, CA, USA, 1978.
- Feng, Z.J.; Zhao, Y.S.; Wan, Z.J. Experiment study of the thermal deformation of in-situ gas coal. In Rock Mechanics: Achievements and Ambitions-Proceedings of the 2nd ISRM International Young Scholars’ Symposium on Rock Mechanics; Cai, M., Ed.; Taylor & Francis Group: London, UK, 2012; pp. 103–108. [Google Scholar]
- Liu, S.; Zhang, S.; Chen, F.; Wang, C.; Liu, M. Variation of coal permeability under dehydrating and heating: A case study of Ulanqab lignite for underground coal gasification. Energy Fuels 2014, 28, 6869–6876. [Google Scholar] [CrossRef]
- Niu, S.; Zhao, Y.; Hu, Y. Experimental investigation of the temperature and pore pressure effect on permeability of lignite under the in situ condition. Transp. Porous Med. 2014, 101, 137–148. [Google Scholar] [CrossRef]
- Wan, Z.; Feng, Z.; Zhao, Y.; Zhang, Y.; Li, G.; Zhou, C. Elastic modulus’s evolution law of coal under high temperature and triaxial stress. J. China Coal Soc. 2011, 36, 1736–1740. [Google Scholar]
- Zhao, Y.; Qu, F.; Wan, Z.; Zhang, Y.; Liang, W.; Meng, Q. Experimental investigation on correlation between permeability variation and pore structure during coal pyrolysis. Transp. Porous Med. 2010, 82, 401–412. [Google Scholar]
- Pollock, S.M.; Goodarzi, F.; Riediger, C.L. Mineralogical and elemental variation of coal from Alberta, Canada: An example from the No. 2 seam, Genesee Mine. Int. J. Coal Geol. 2000, 43, 259–286. [Google Scholar] [CrossRef]
- Gibson, D.W. Upper Cretaceous and Tertiary Coal-Bearing Strata in the Drumheller–Ardley Region, Red Deer River Valley, Alberta; Geological Survey of Canada; Energy, Mines and Resources Canada: Ottawa, Canada, 1977. [Google Scholar]
- American Society for Testing and Materials (ASTM). ASTM D7012-13 Standard Test Methods for Compressive Strength and Elastic Moduli of Intact Rock Core Specimens under Varying States of Stress and Temperatures; American Society for Testing and Materials: West Conshohochen, PA, USA, 2013. [Google Scholar]
- Akbarzadeh Kasani, H.; Chalaturnyk, R.J. Coupled reservoir and geomechanical simulation for a deep underground coal gasification project. J. Nat. Gas Sci. Eng. 2017, 37, 487–501. [Google Scholar] [CrossRef]
- Ahmed, T. Reservoir Engineering Handbook, 2nd ed.; Gulf Professional Publishing: Huston, TX, USA, 2001. [Google Scholar]
- American Society for Testing and Materials (ASTM). ASTM D4525-08 Standard Test Methods for Permeability of Rocks by Flowing Air; American Society for Testing and Materials: West Conshohoken, PA, USA, 2008. [Google Scholar]
- Arenillas, A.; Rubiera, F.; Pis, J.J.; Cuesta, M.J.; Iglesias, M.J.; Jimenez, A.; Suarez-Ruiz, I. Thermal behaviour during the pyrolysis of low rank perhydrous coals. J. Anal. Appl. Pyrol. 2003, 68, 371–385. [Google Scholar] [CrossRef]
- Elliott, G.M.; Brown, E.T. Laboratory measurement of the thermo-hydro-mechanical properties of rock. Quart. J. Eng. Geol. Hydrogeol. 1988, 21, 299–314. [Google Scholar] [CrossRef]
- Heuze, F.E. High-temperature mechanical, physical and thermal properties of granitic rocks—A review. Int. J. Rock Mech. Min. Sci. 1983, 20, 3–10. [Google Scholar] [CrossRef]
- Luo, J.A.; Wang, L. High-temperature mechanical properties of mudstone in the process of underground coal gasification. Rock Mech. Rock Eng. 2011, 44, 749–754. [Google Scholar] [CrossRef]
- Richter, D.; Simmons, G. Thermal expansion behavior of igneous rocks. Int. J. Rock Mech. Min. Sci. 1974, 11, 403–411. [Google Scholar] [CrossRef]
- Palchik, V. Is there link between the type of the volumetric strain curve and elastic constants, porosity, stress and strain characteristics? Rock Mech. Rock Eng. 2013, 46, 315–326. [Google Scholar] [CrossRef]
- Martin, C.D.; Chandler, N.A. The progressive fracture of Lac du Bonnet granite. Int. J. Rock Mech. Min. Sci. 1994, 31, 643–659. [Google Scholar] [CrossRef]
- Thuro, K.; Plinninger, R.J.; Zah, S.; Schutz, S. Scale effects in rock strength properties. Part 1: Unconfined compressive test and Brazilian test. In EUROCK 2001: Rock Mechanics—A Challenge for Society; Eloranta, P., Sarkka, P., Eds.; Finnish National Group of International Society for Rock Mechanics (ISRM): Espoo, Finland, 2001; pp. 169–174. [Google Scholar]
- Tuncay, E.; Hasancebi, N. The effect of length to diameter ratio of test specimens on the uniaxial compressive strength of rock. Bull. Eng. Geol. Environ. 2009, 68, 491–497. [Google Scholar] [CrossRef]
- Mao, L.; Chiang, F.P. 3D strain mapping in rocks using digital volumetric speckle photography technique. Acta Mech. 2015, 227, 3069–3085. [Google Scholar] [CrossRef]
- Zhang, H.; Huang, G.; Song, H.; Kang, Y. Experimental characterization of strain localization in rock. Geophys. J. Int. 2013, 194, 1554–1558. [Google Scholar] [CrossRef]
- National Institute of Standards and Technology (NIST). NIST Chemistry WebBook. Available online: http://webbook.nist.gov/chemistry/ (accessed on 31 May 2017).
Figure 1.
Schematic of the HPHT triaxial apparatus and instrumented coal specimen.

Figure 2.
(a) Location of the Genesee coal mine (modified from [26]); (b) geology of the coal seam [27].

Figure 3.
A coal block from the Genesee coal mine in Central Alberta, Canada. (Note: The measuring tape’s divisions are in inches).
Figure 3.
A coal block from the Genesee coal mine in Central Alberta, Canada. (Note: The measuring tape’s divisions are in inches).

Figure 4.
Photographs of all specimens prior to testing. (Note: The measuring tape’s divisions are in centimeters. Contrasts in the specimens’ colors were due to using different cameras and/or taking photos at different conditions. All coal blocks were from the same mine and had similar colors).
Figure 4.
Photographs of all specimens prior to testing. (Note: The measuring tape’s divisions are in centimeters. Contrasts in the specimens’ colors were due to using different cameras and/or taking photos at different conditions. All coal blocks were from the same mine and had similar colors).

Figure 5.
Heterogeneous initial fracture networks of two end surfaces: (a) S4; and (b) S7, which contained intense cleat networks. (Note: Contrasts in the specimens’ colors was due to using different cameras and/or taking photos at different conditions. All coal blocks were from the same mine and had similar colors).

Figure 6.
Thermal strains recorded by internal axial and circumferential LVDTs during heating from room temperature to about 200 °C for: (a) S2; (b) S3; and (c) S4.
Figure 6.
Thermal strains recorded by internal axial and circumferential LVDTs during heating from room temperature to about 200 °C for: (a) S2; (b) S3; and (c) S4.
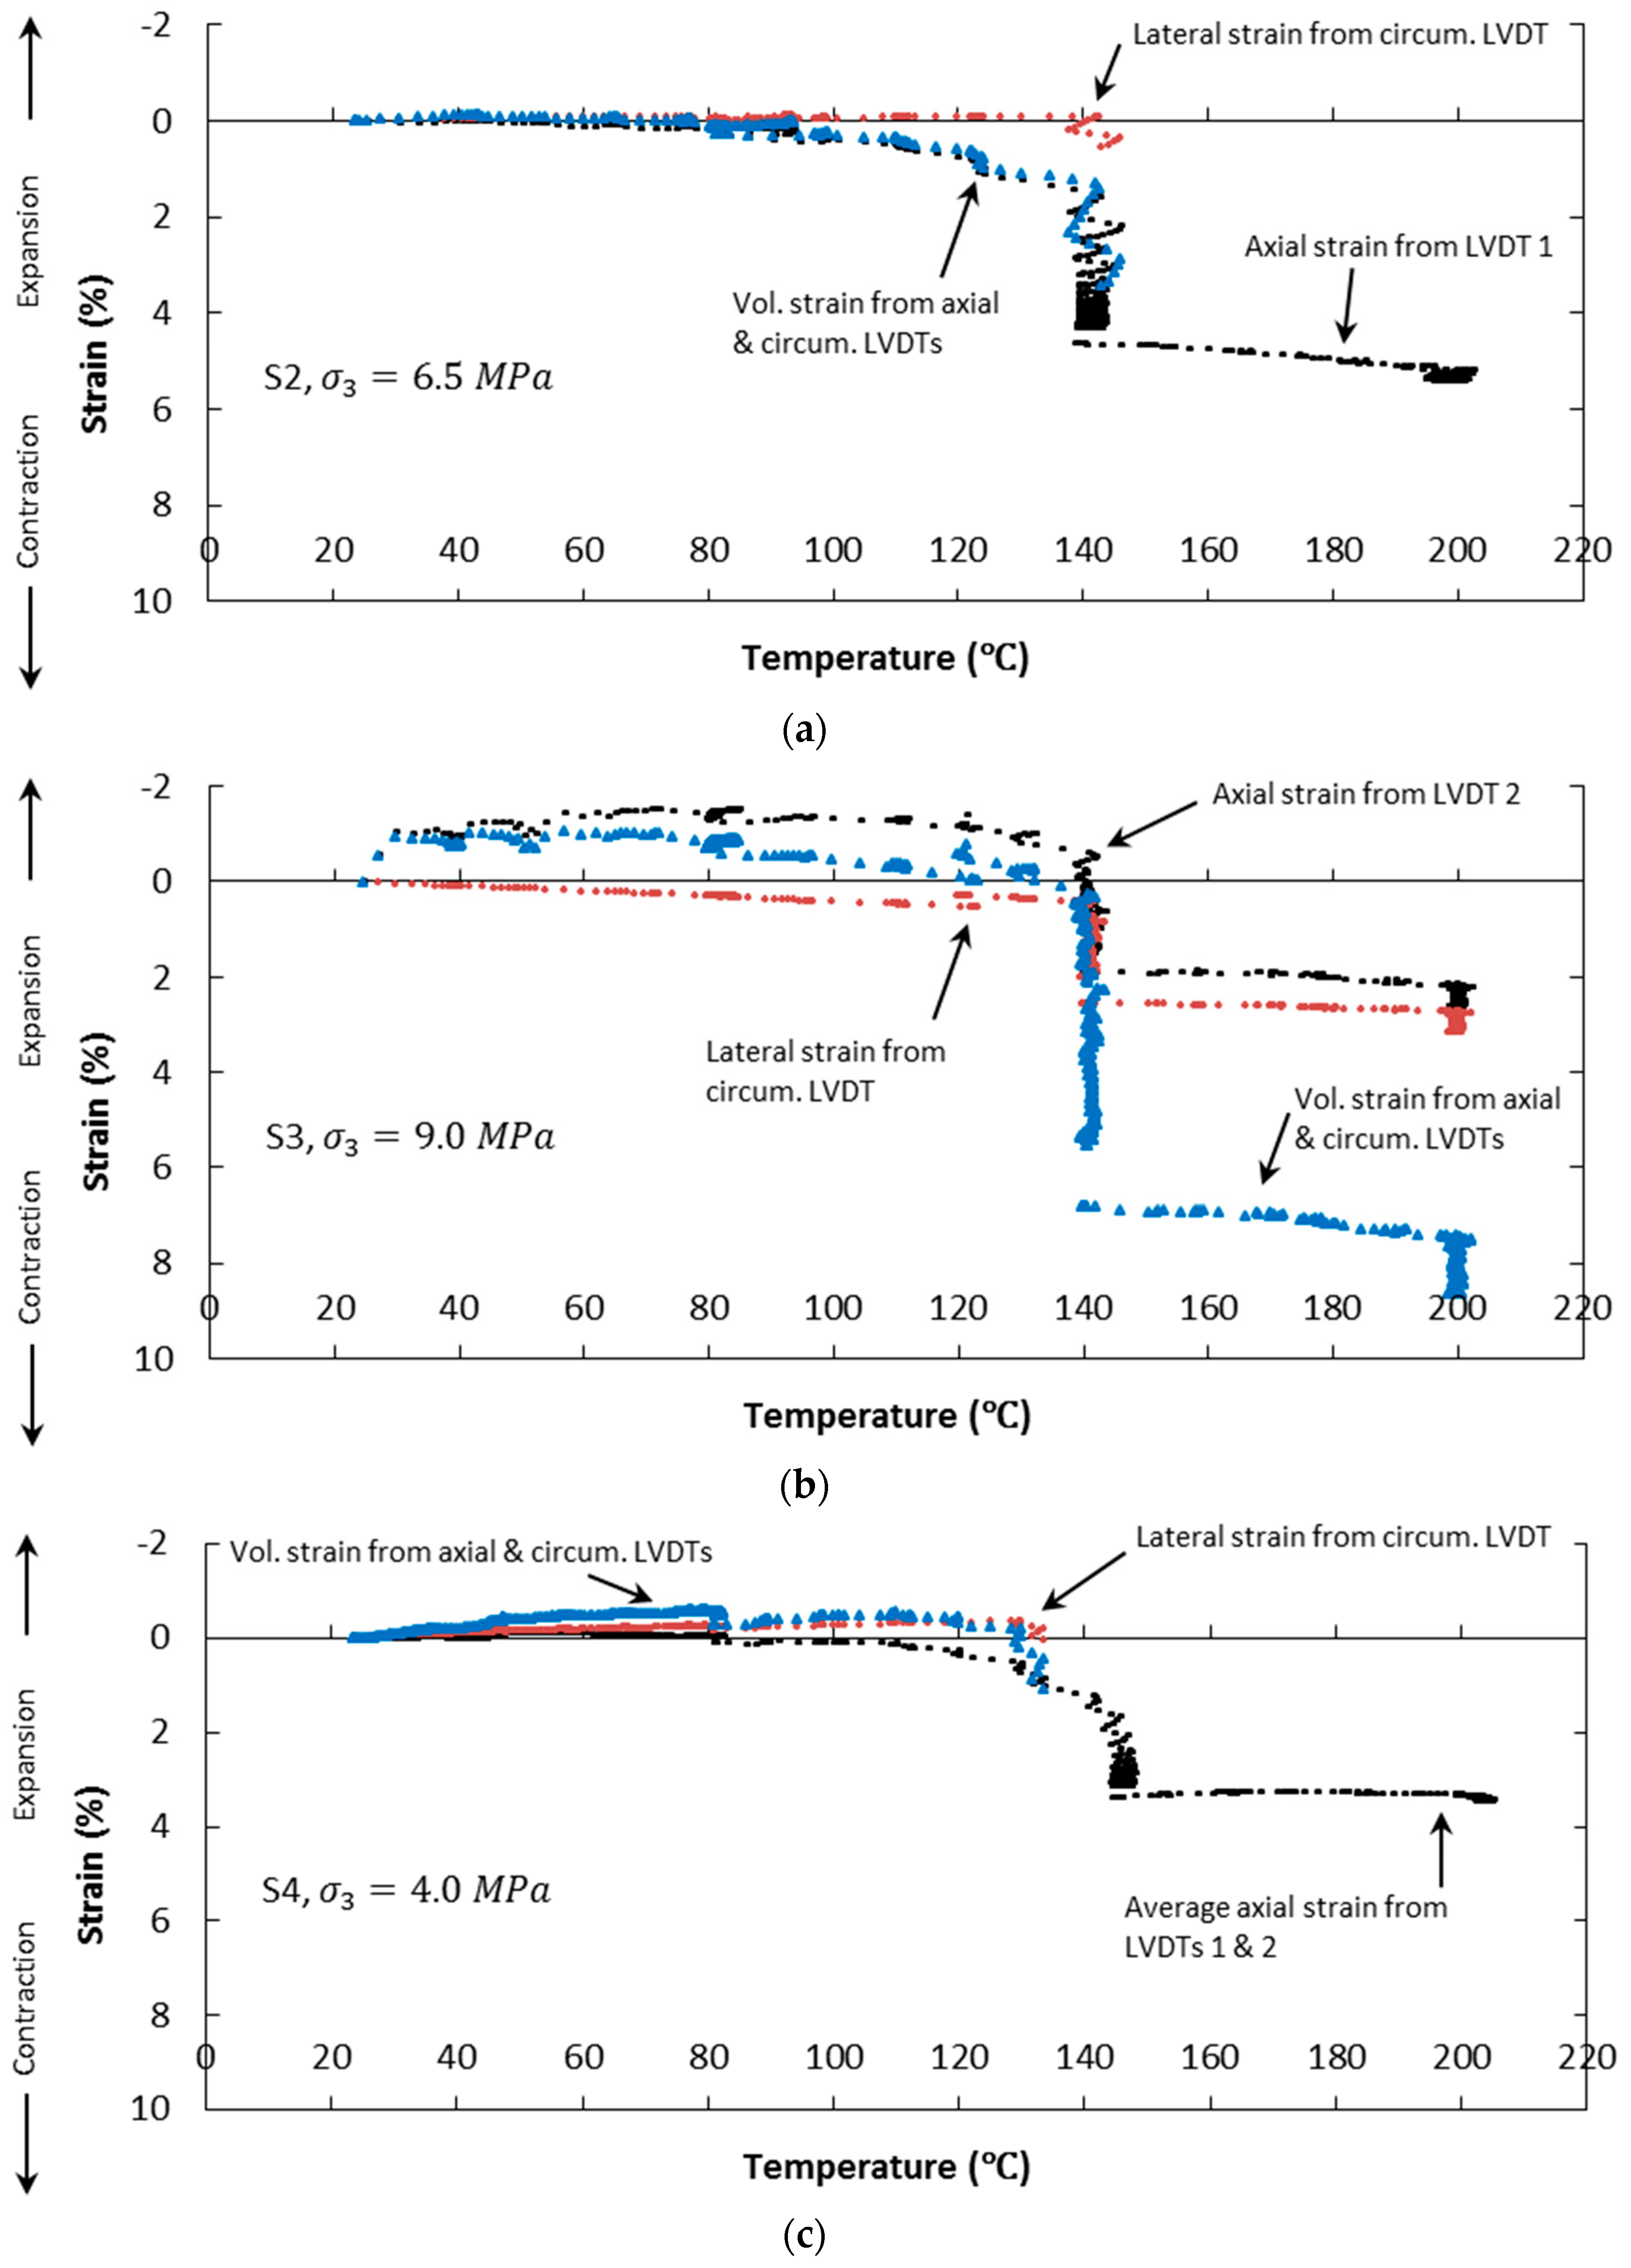
Figure 7.
Stress-strain curves of specimen S1 at room temperature from different methods. (Note: The jumps in the curves correspond to trials for permeability measurements during shear).
Figure 7.
Stress-strain curves of specimen S1 at room temperature from different methods. (Note: The jumps in the curves correspond to trials for permeability measurements during shear).
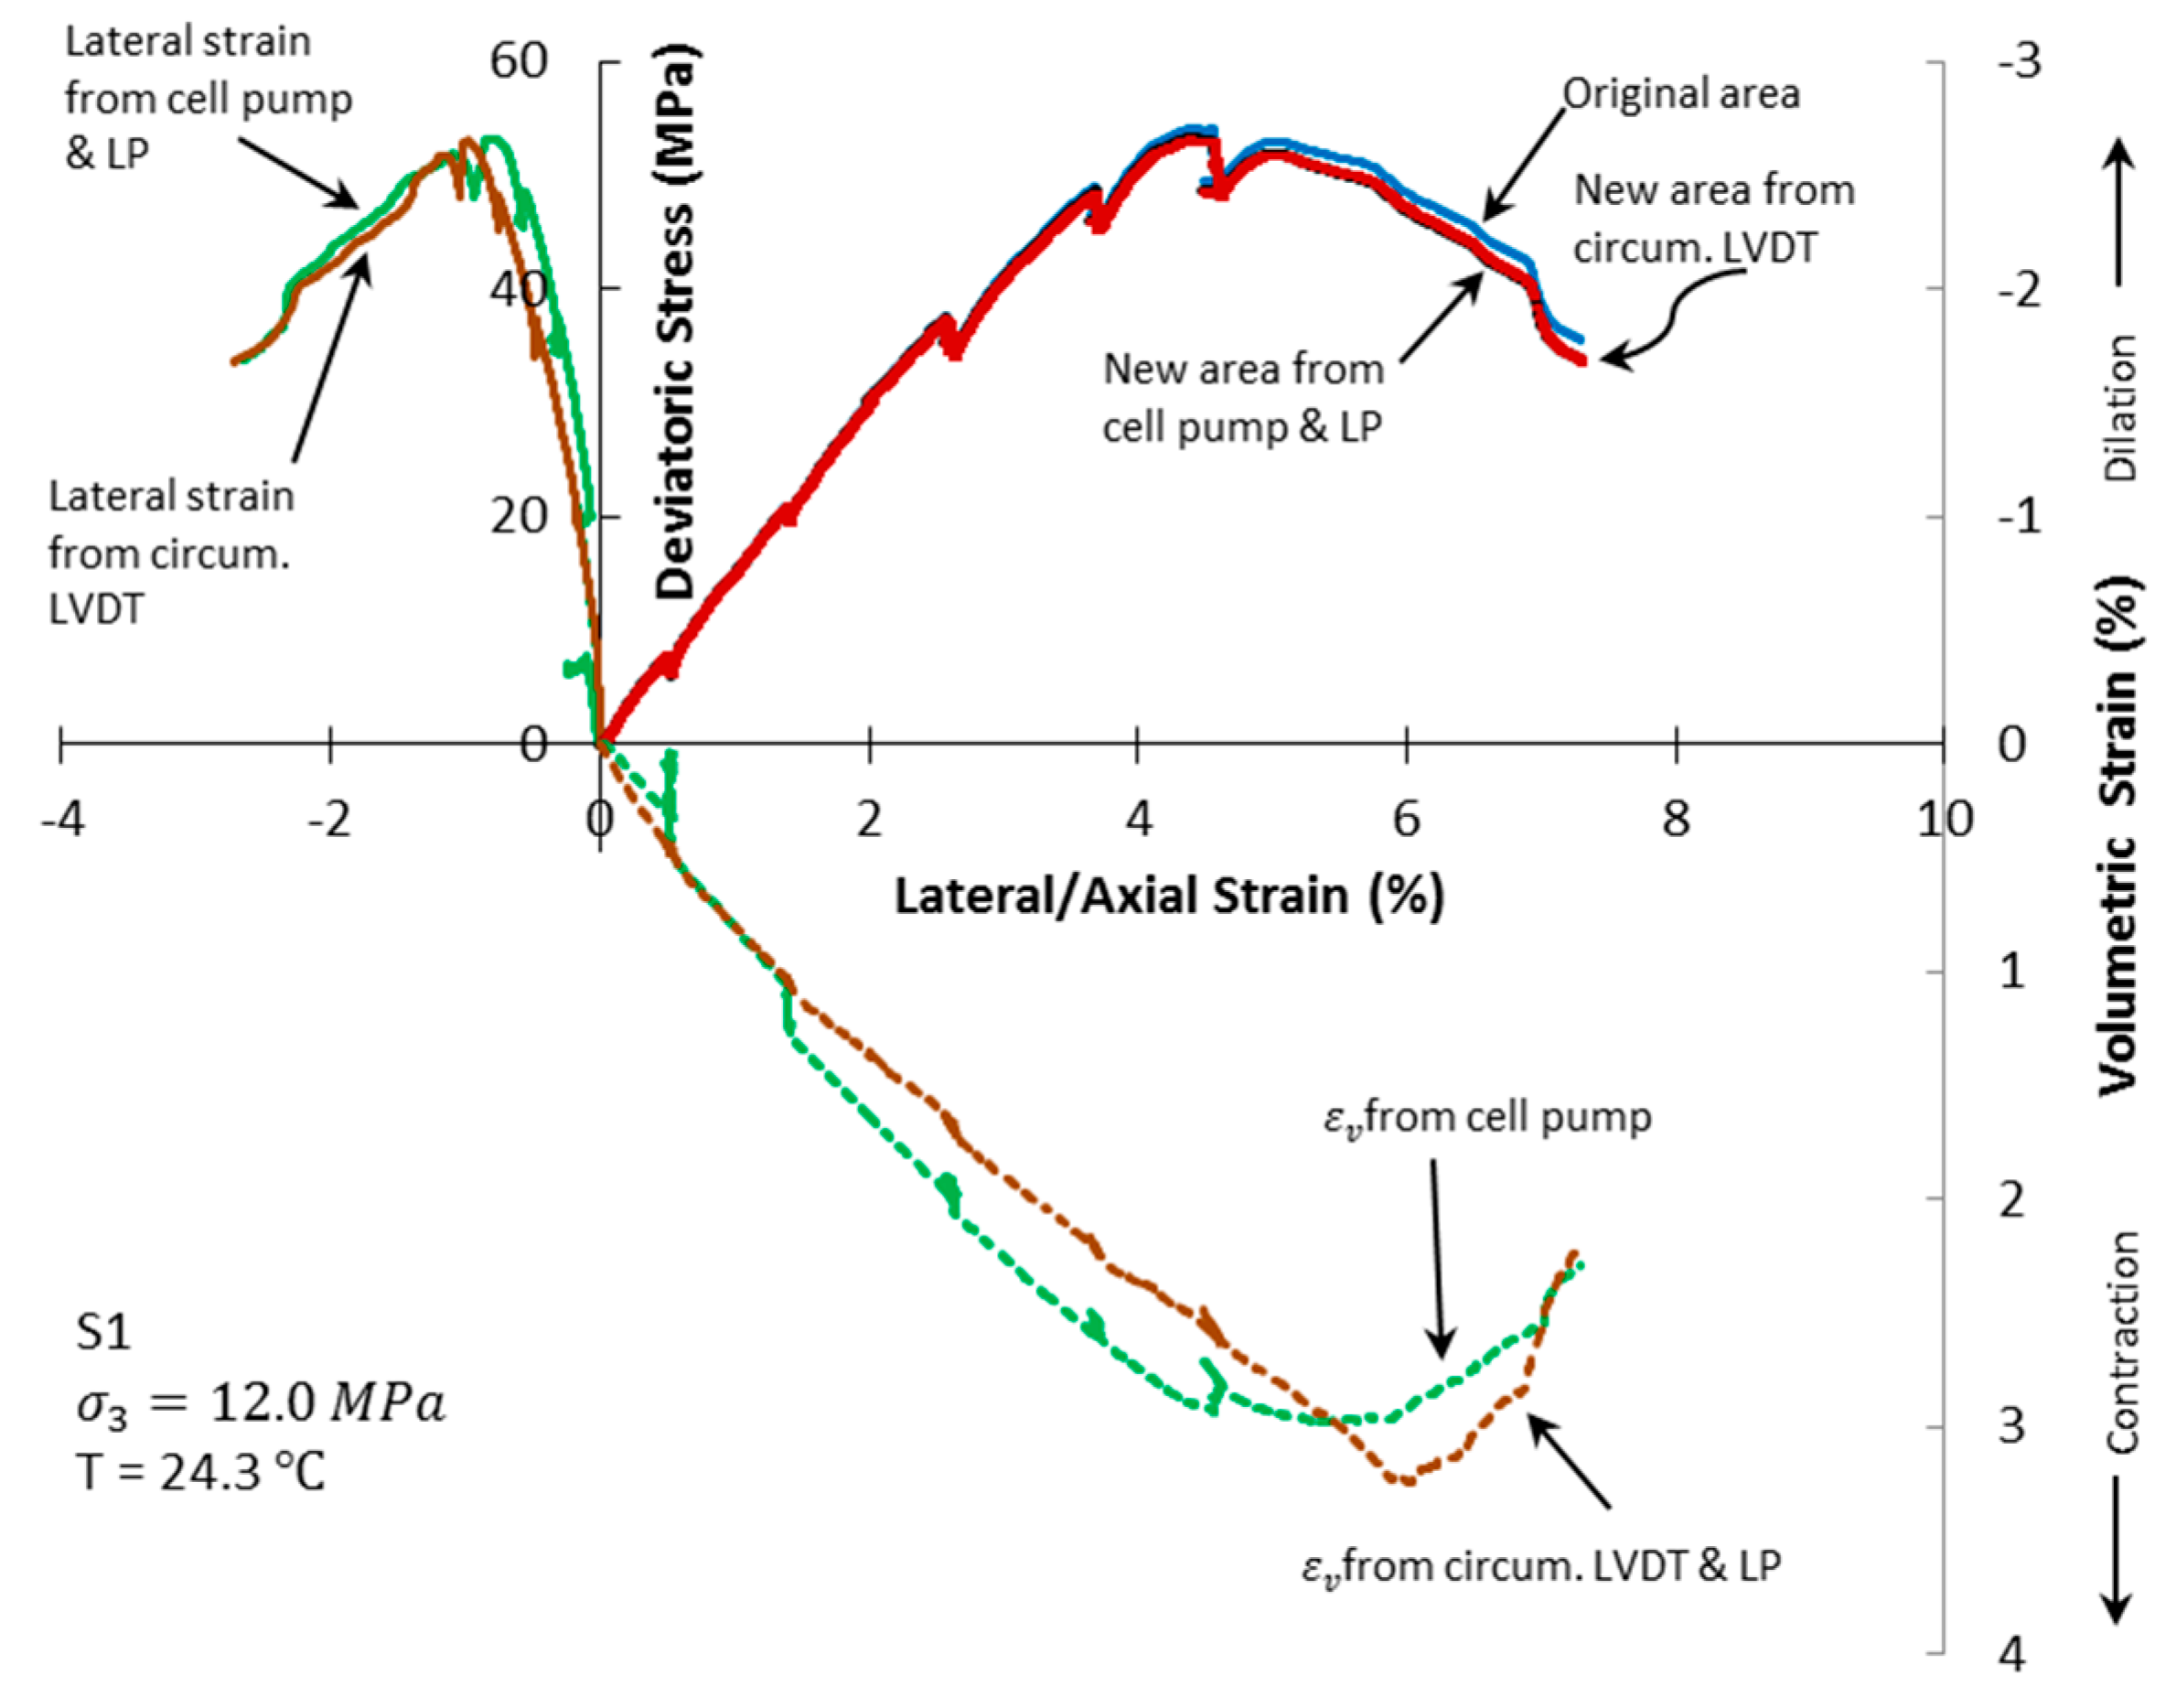
Figure 8.
Stress-strain curves of specimen S7 at room temperature from different methods.
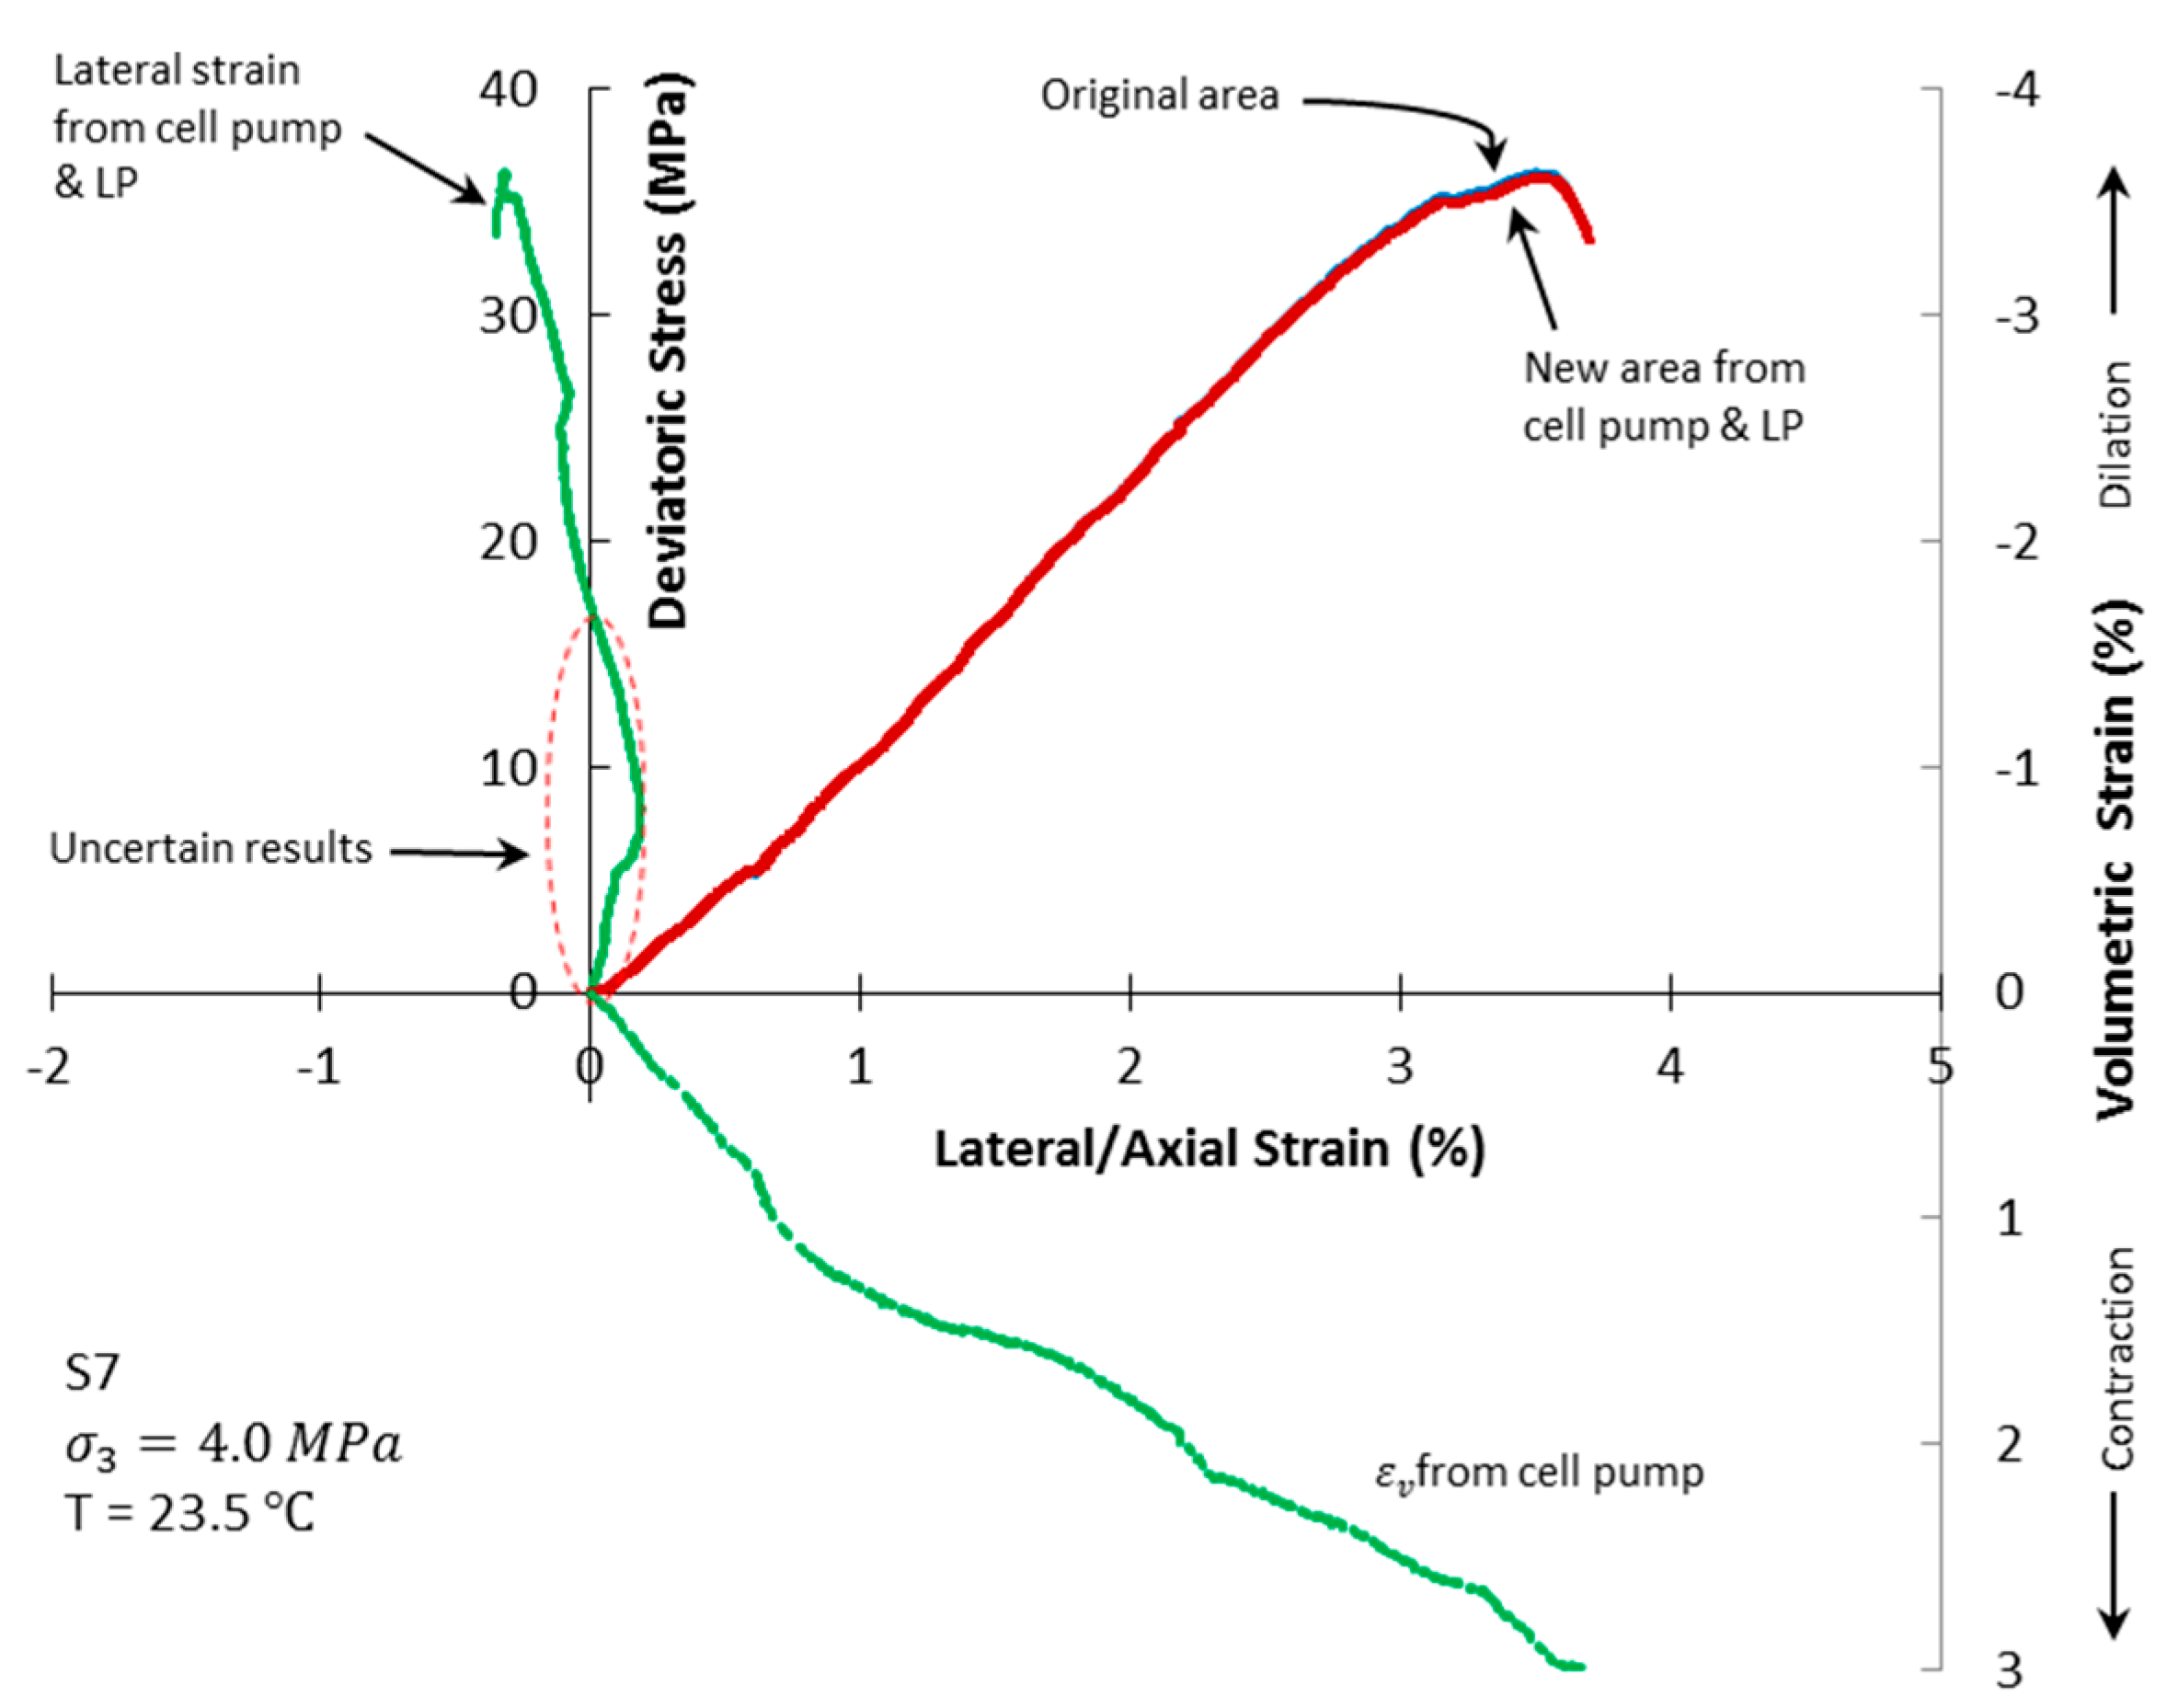
Figure 9.
Stress-strain curves of specimen S3 at 199.3 °C from different methods.
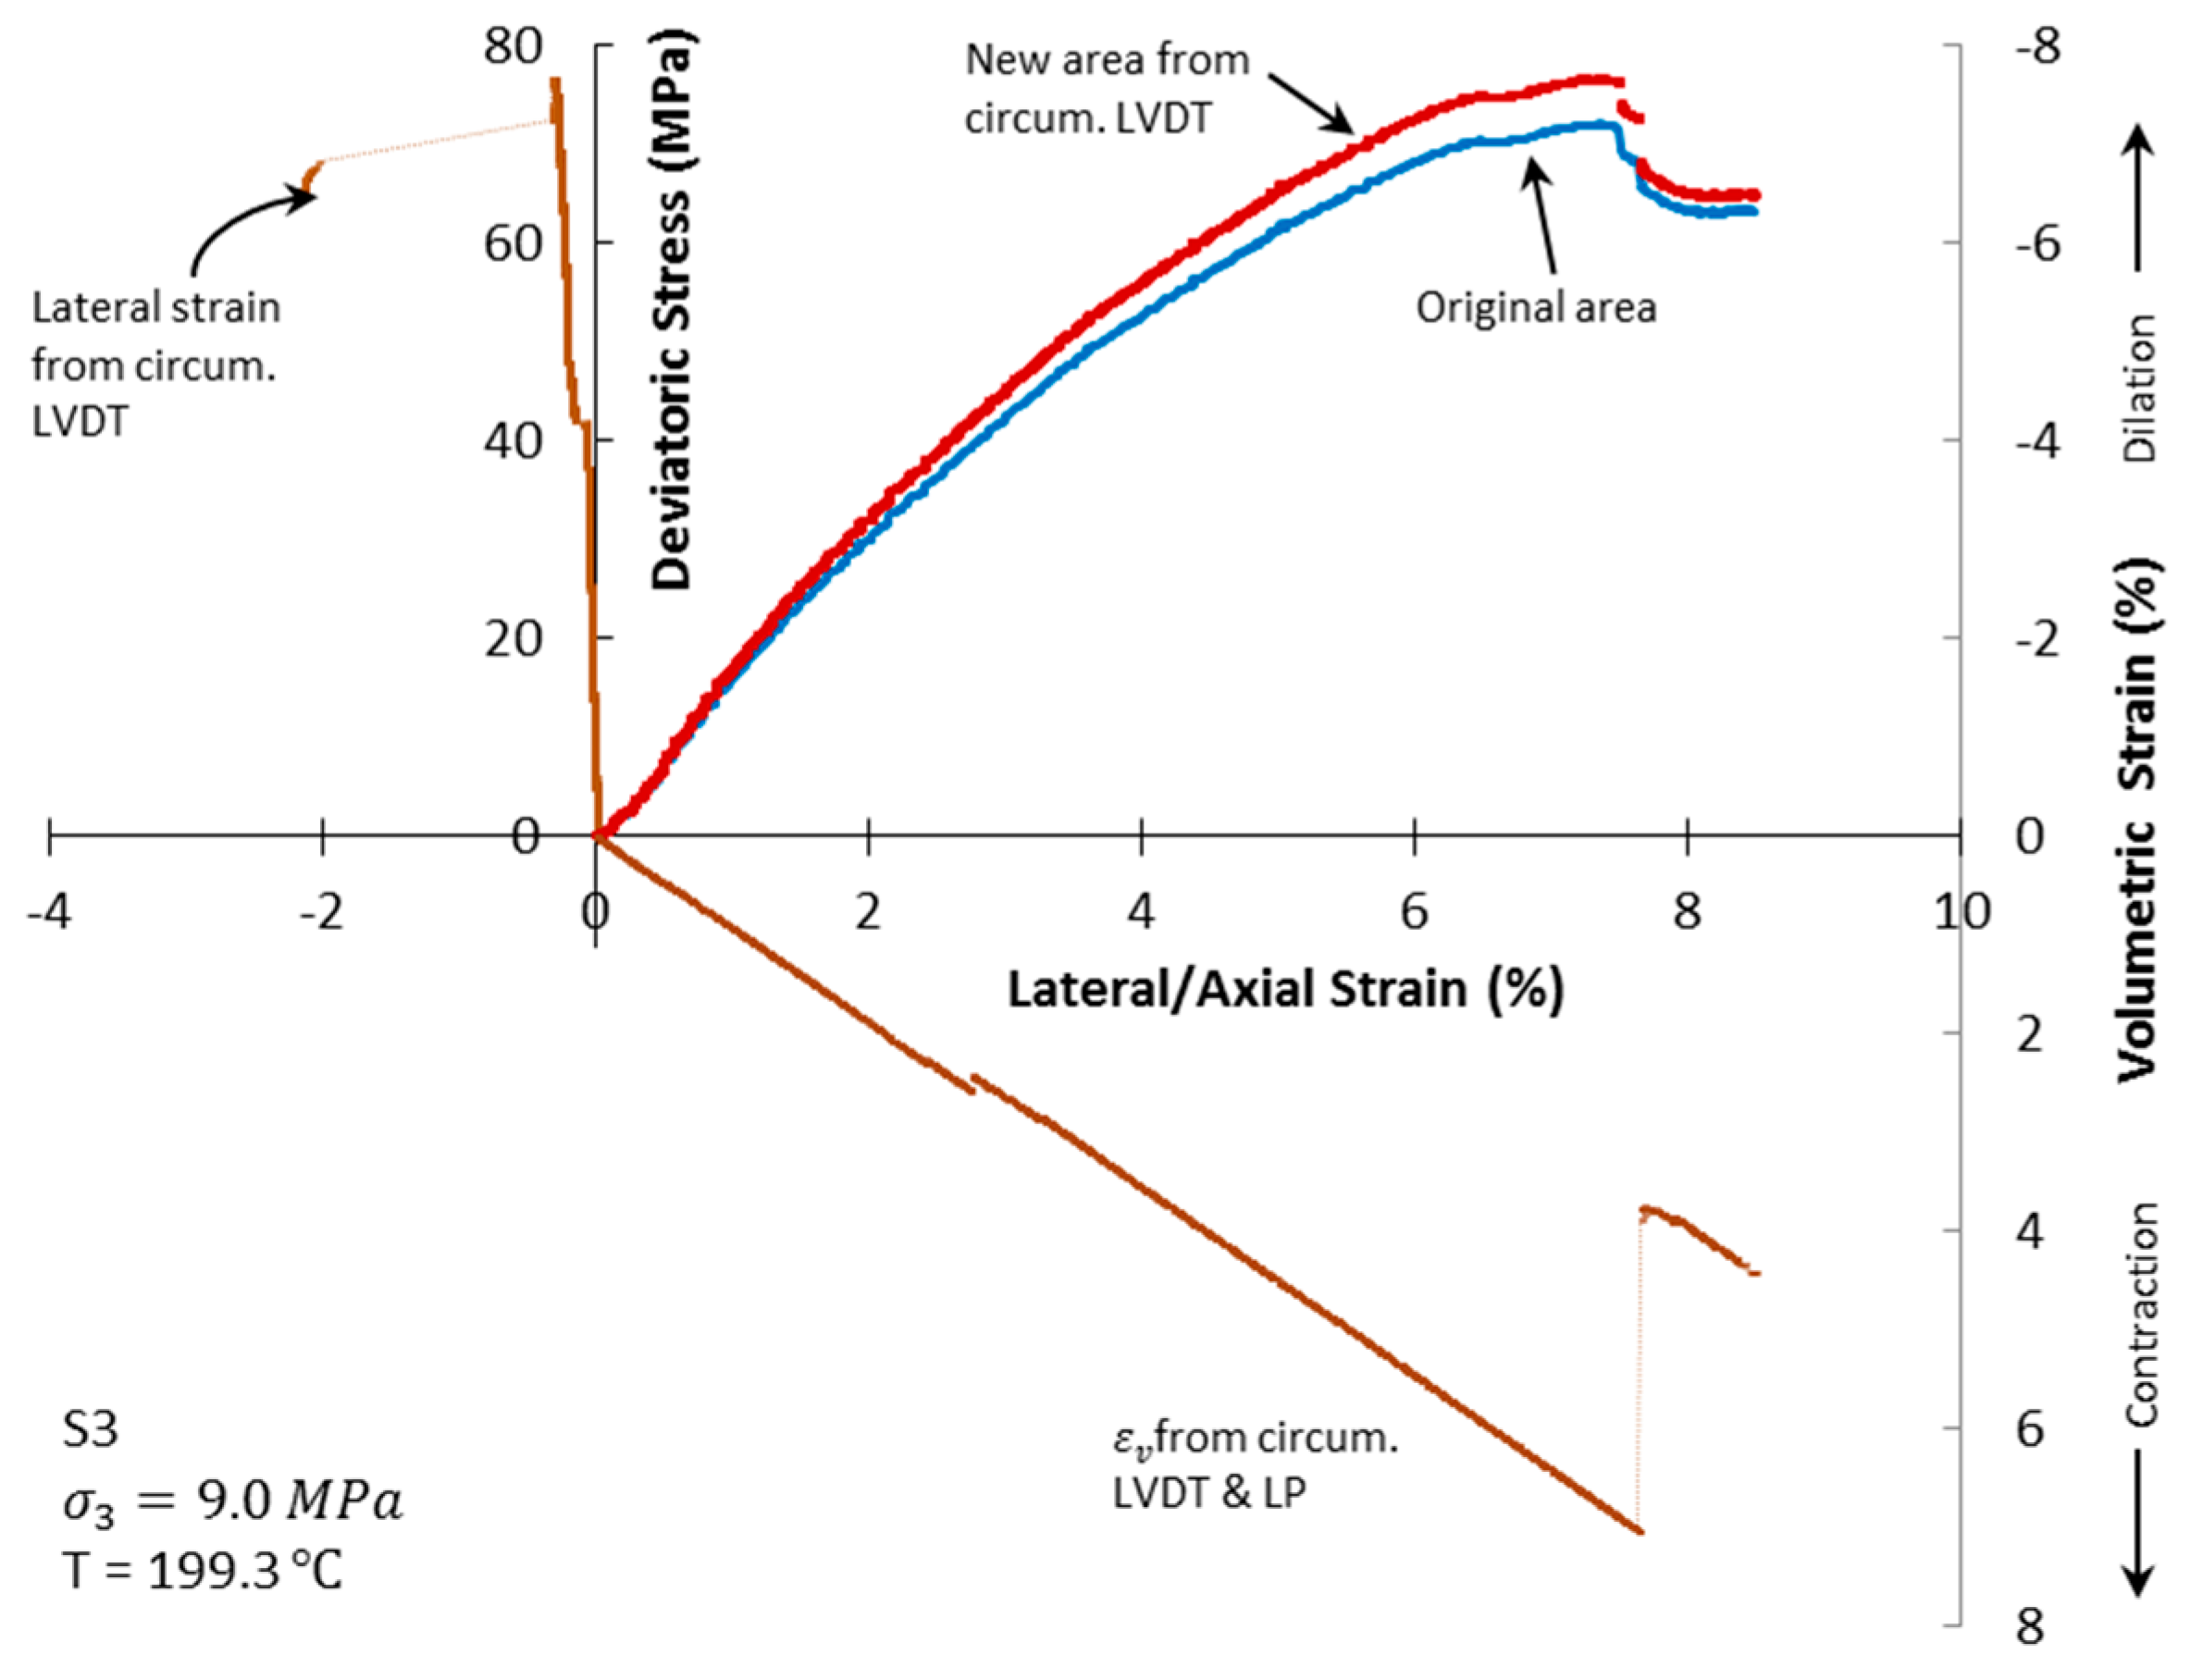
Figure 10.
Stress-strain curves of all specimens: (a) room temperature; (b) 200 °C; and (c) principal stress ratio vs. axial strain for all tests.
Figure 10.
Stress-strain curves of all specimens: (a) room temperature; (b) 200 °C; and (c) principal stress ratio vs. axial strain for all tests.
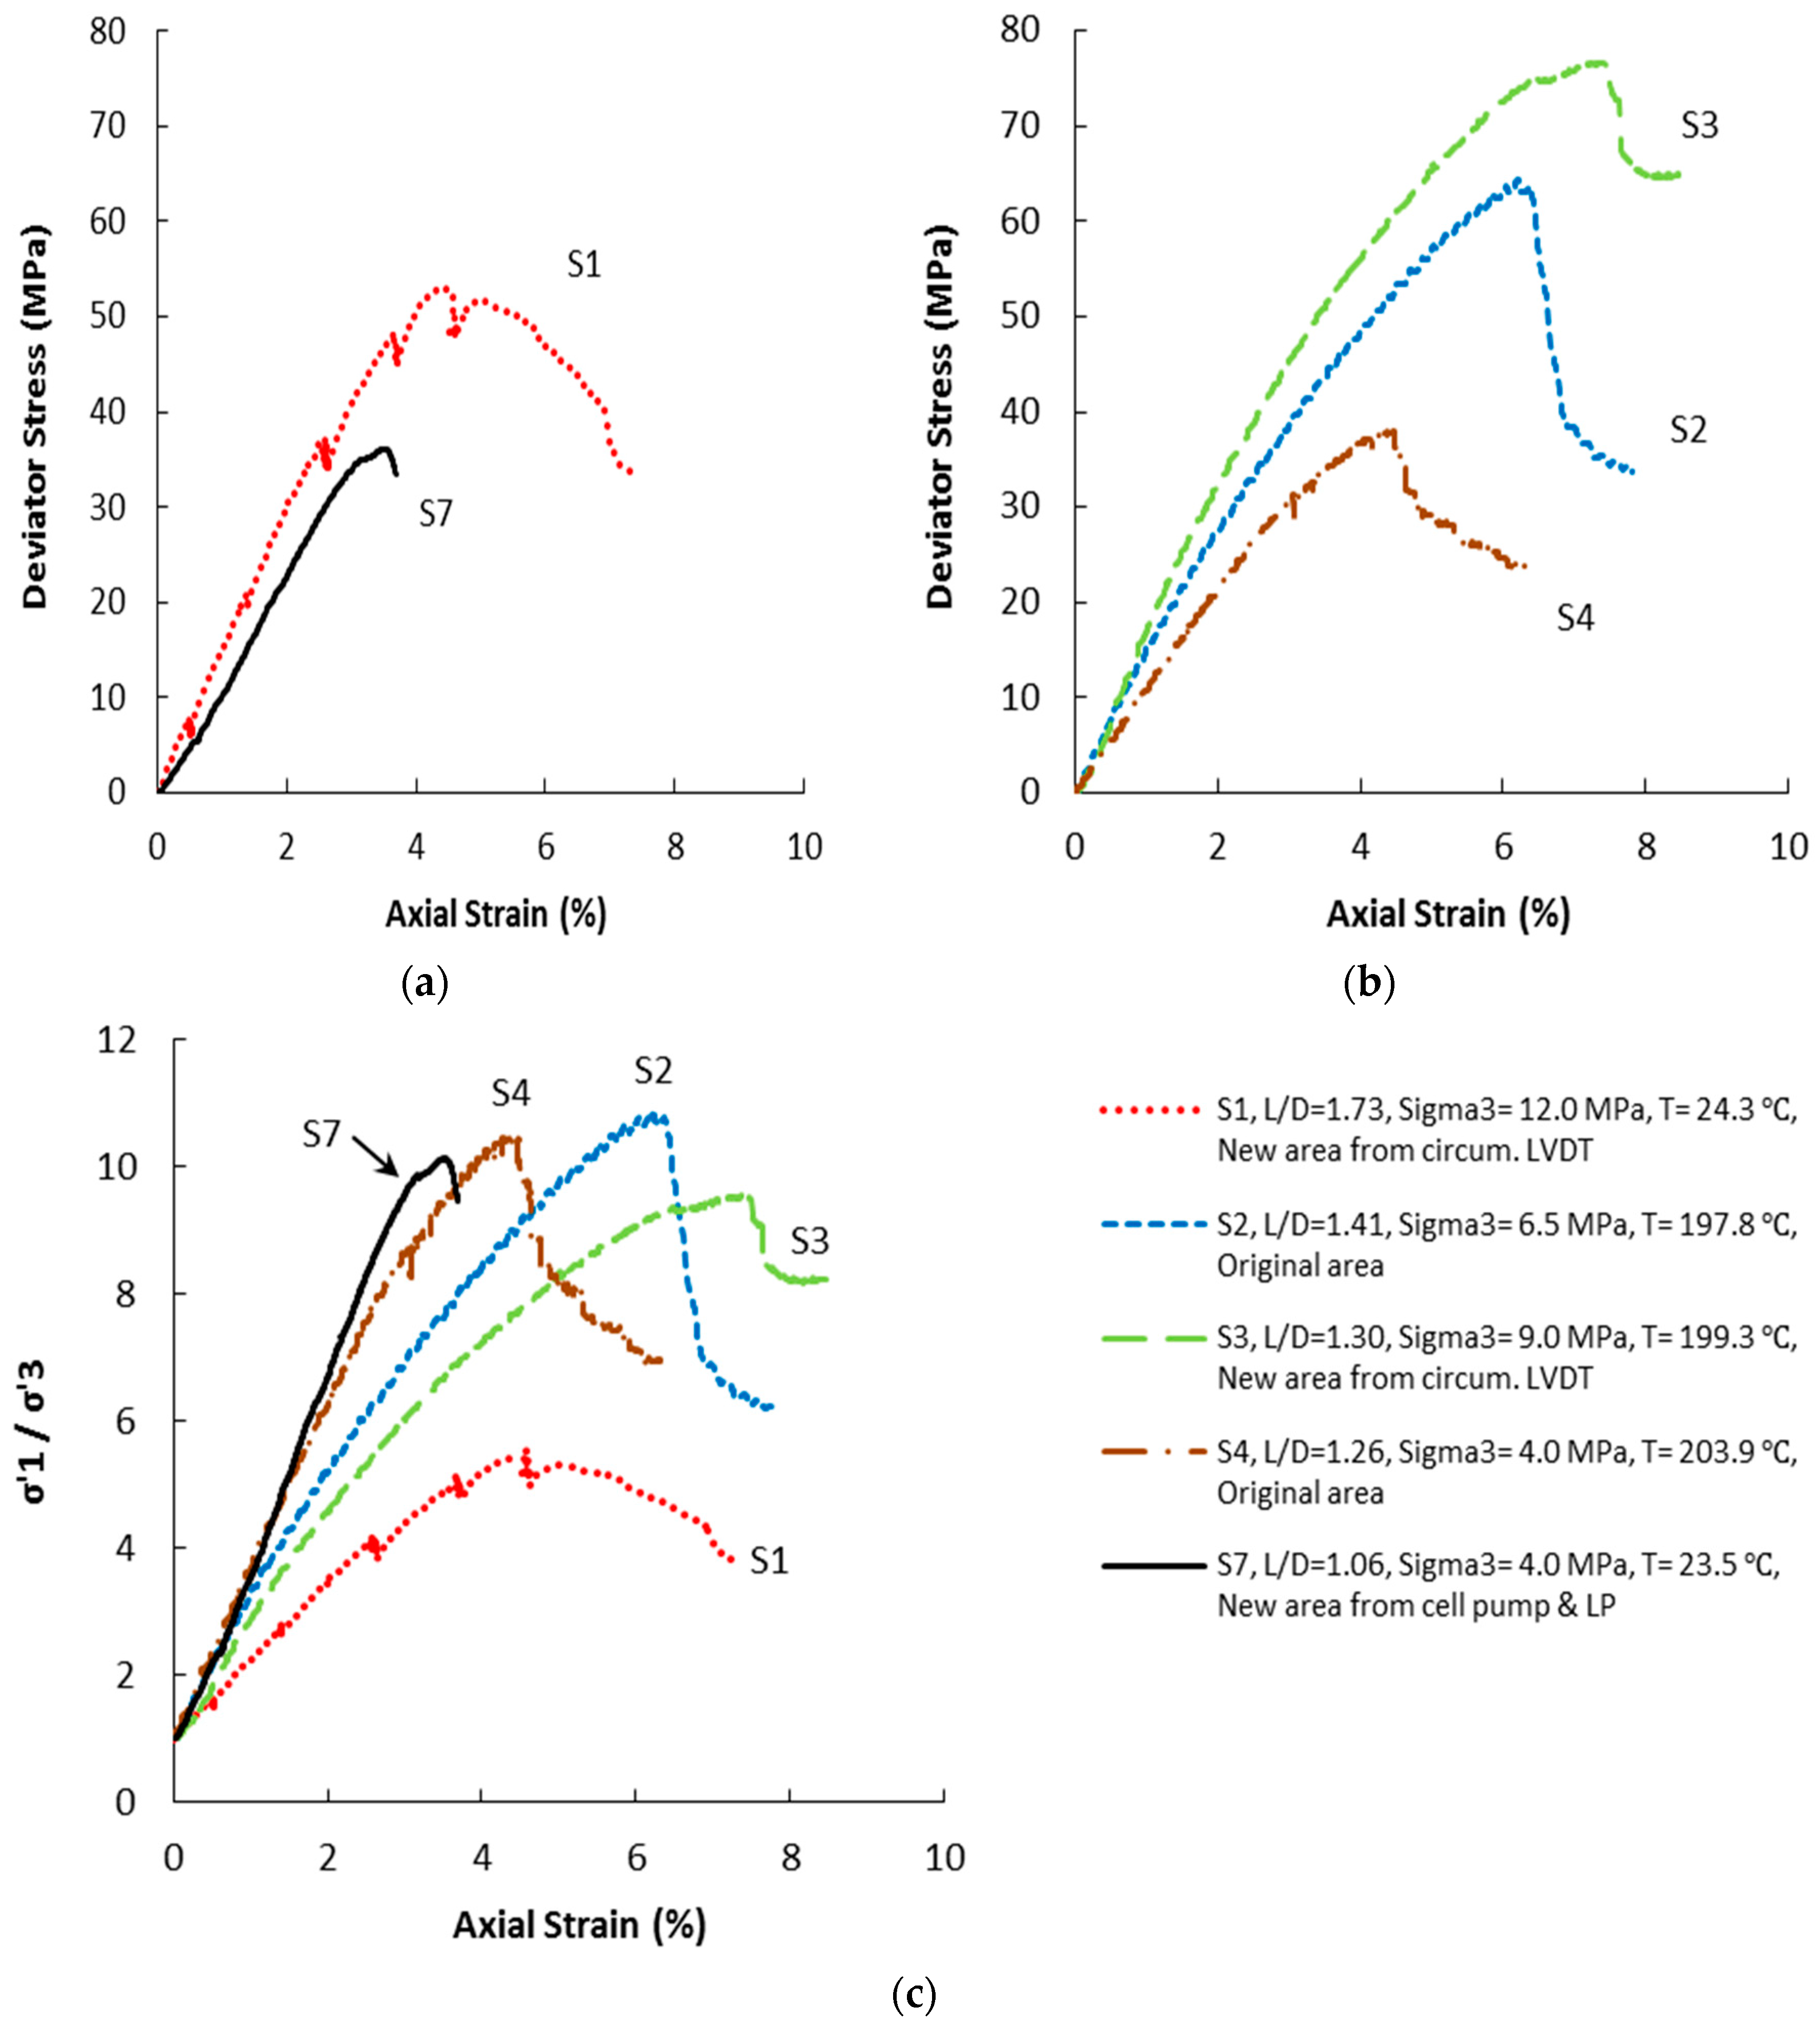
Figure 11.
Stress paths and inferred peak strength envelopes for room temperature and 200 °C.

Figure 12.
Different realizations for positioning of internal axial LVDTs in cross-section of a specimen with respect to a slidig wedge which may form at a later time during deformation: (a) LVDTs on opposite sides; (b) both LVDTs adjacent to the sliding wedge; and (c) both LVDTs outside of the sliding wedge.

Figure 13.
Post-failure images, onset of localization, and peak stress detected by the LVDTs.

Figure 14.
Laboratory results of a constant-pressure mode N2 permeability test of S2 at 81.7 °C.

Figure 15.
(a) Permeability of S2 versus temperature; (b) permeability of S2 versus effective stress; (c) permeability of S3 versus temperature; (d) permeability of S3 versus effective stress; (e) permeability of S4 versus temperature; and (f) permeability of S4 versus effective stress.
Figure 15.
(a) Permeability of S2 versus temperature; (b) permeability of S2 versus effective stress; (c) permeability of S3 versus temperature; (d) permeability of S3 versus effective stress; (e) permeability of S4 versus temperature; and (f) permeability of S4 versus effective stress.
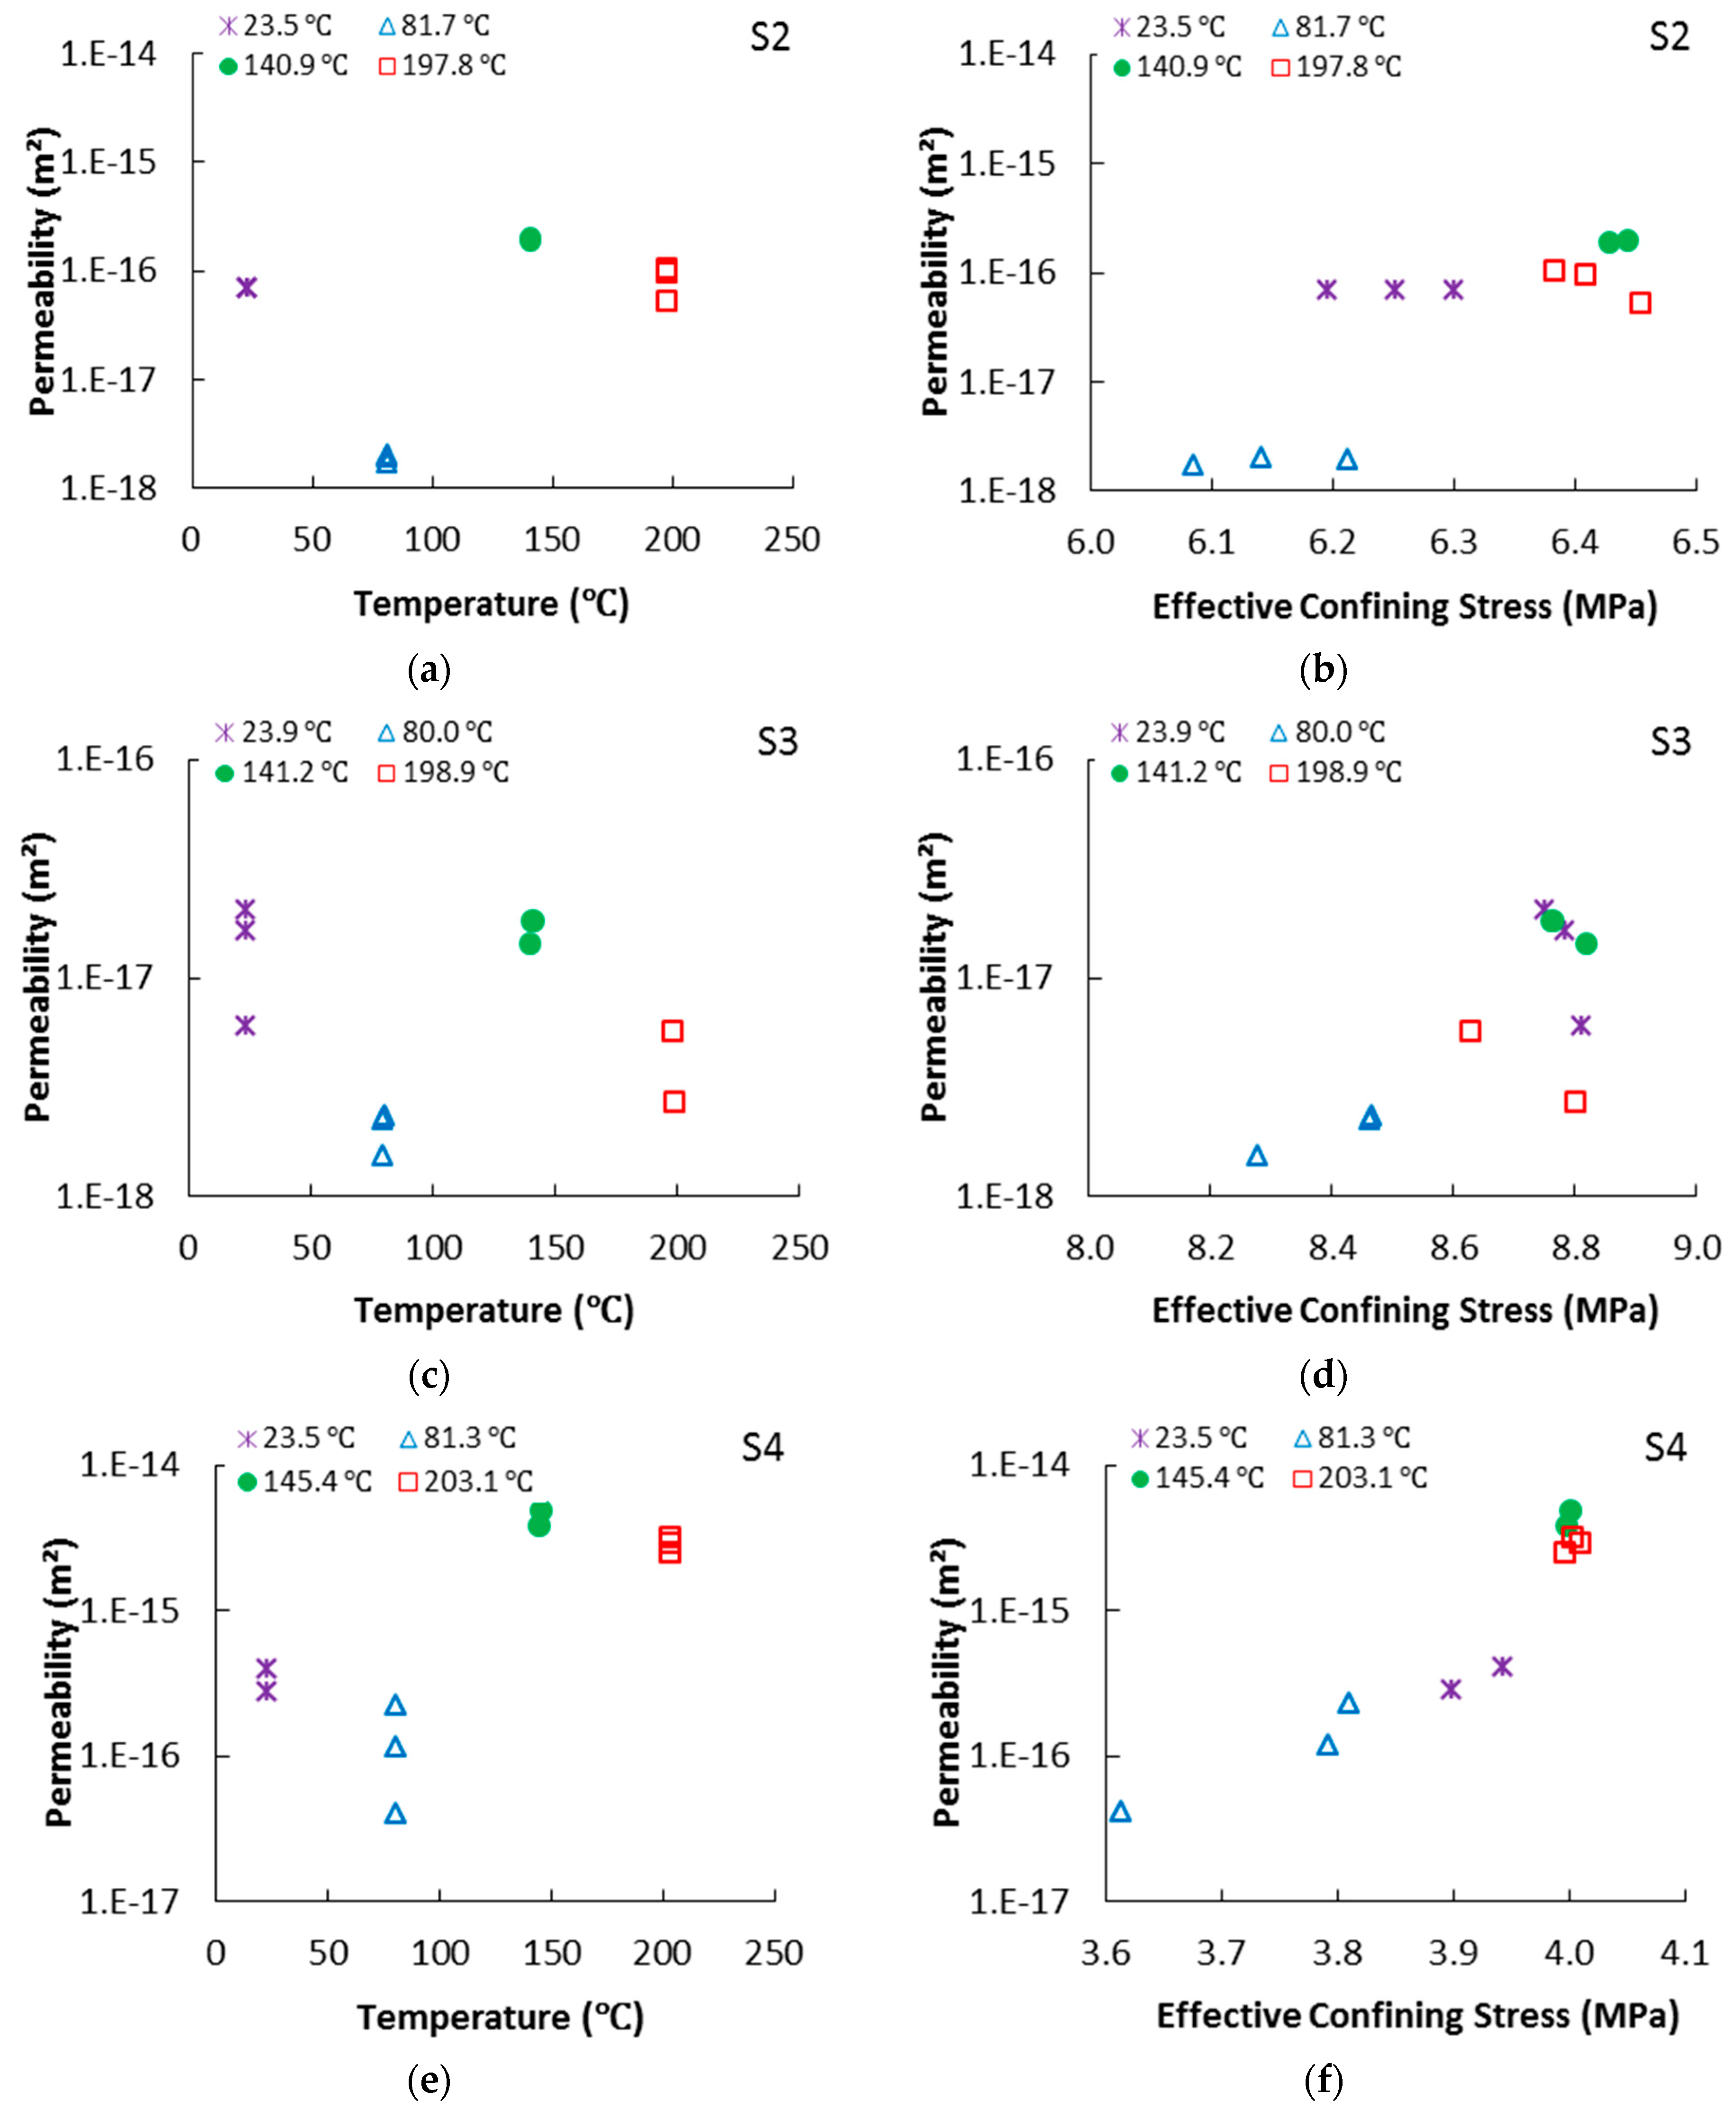
Figure 16.
Variation of permeability of all specimens with: (a) temperature; and (b) effective stress.
Figure 16.
Variation of permeability of all specimens with: (a) temperature; and (b) effective stress.
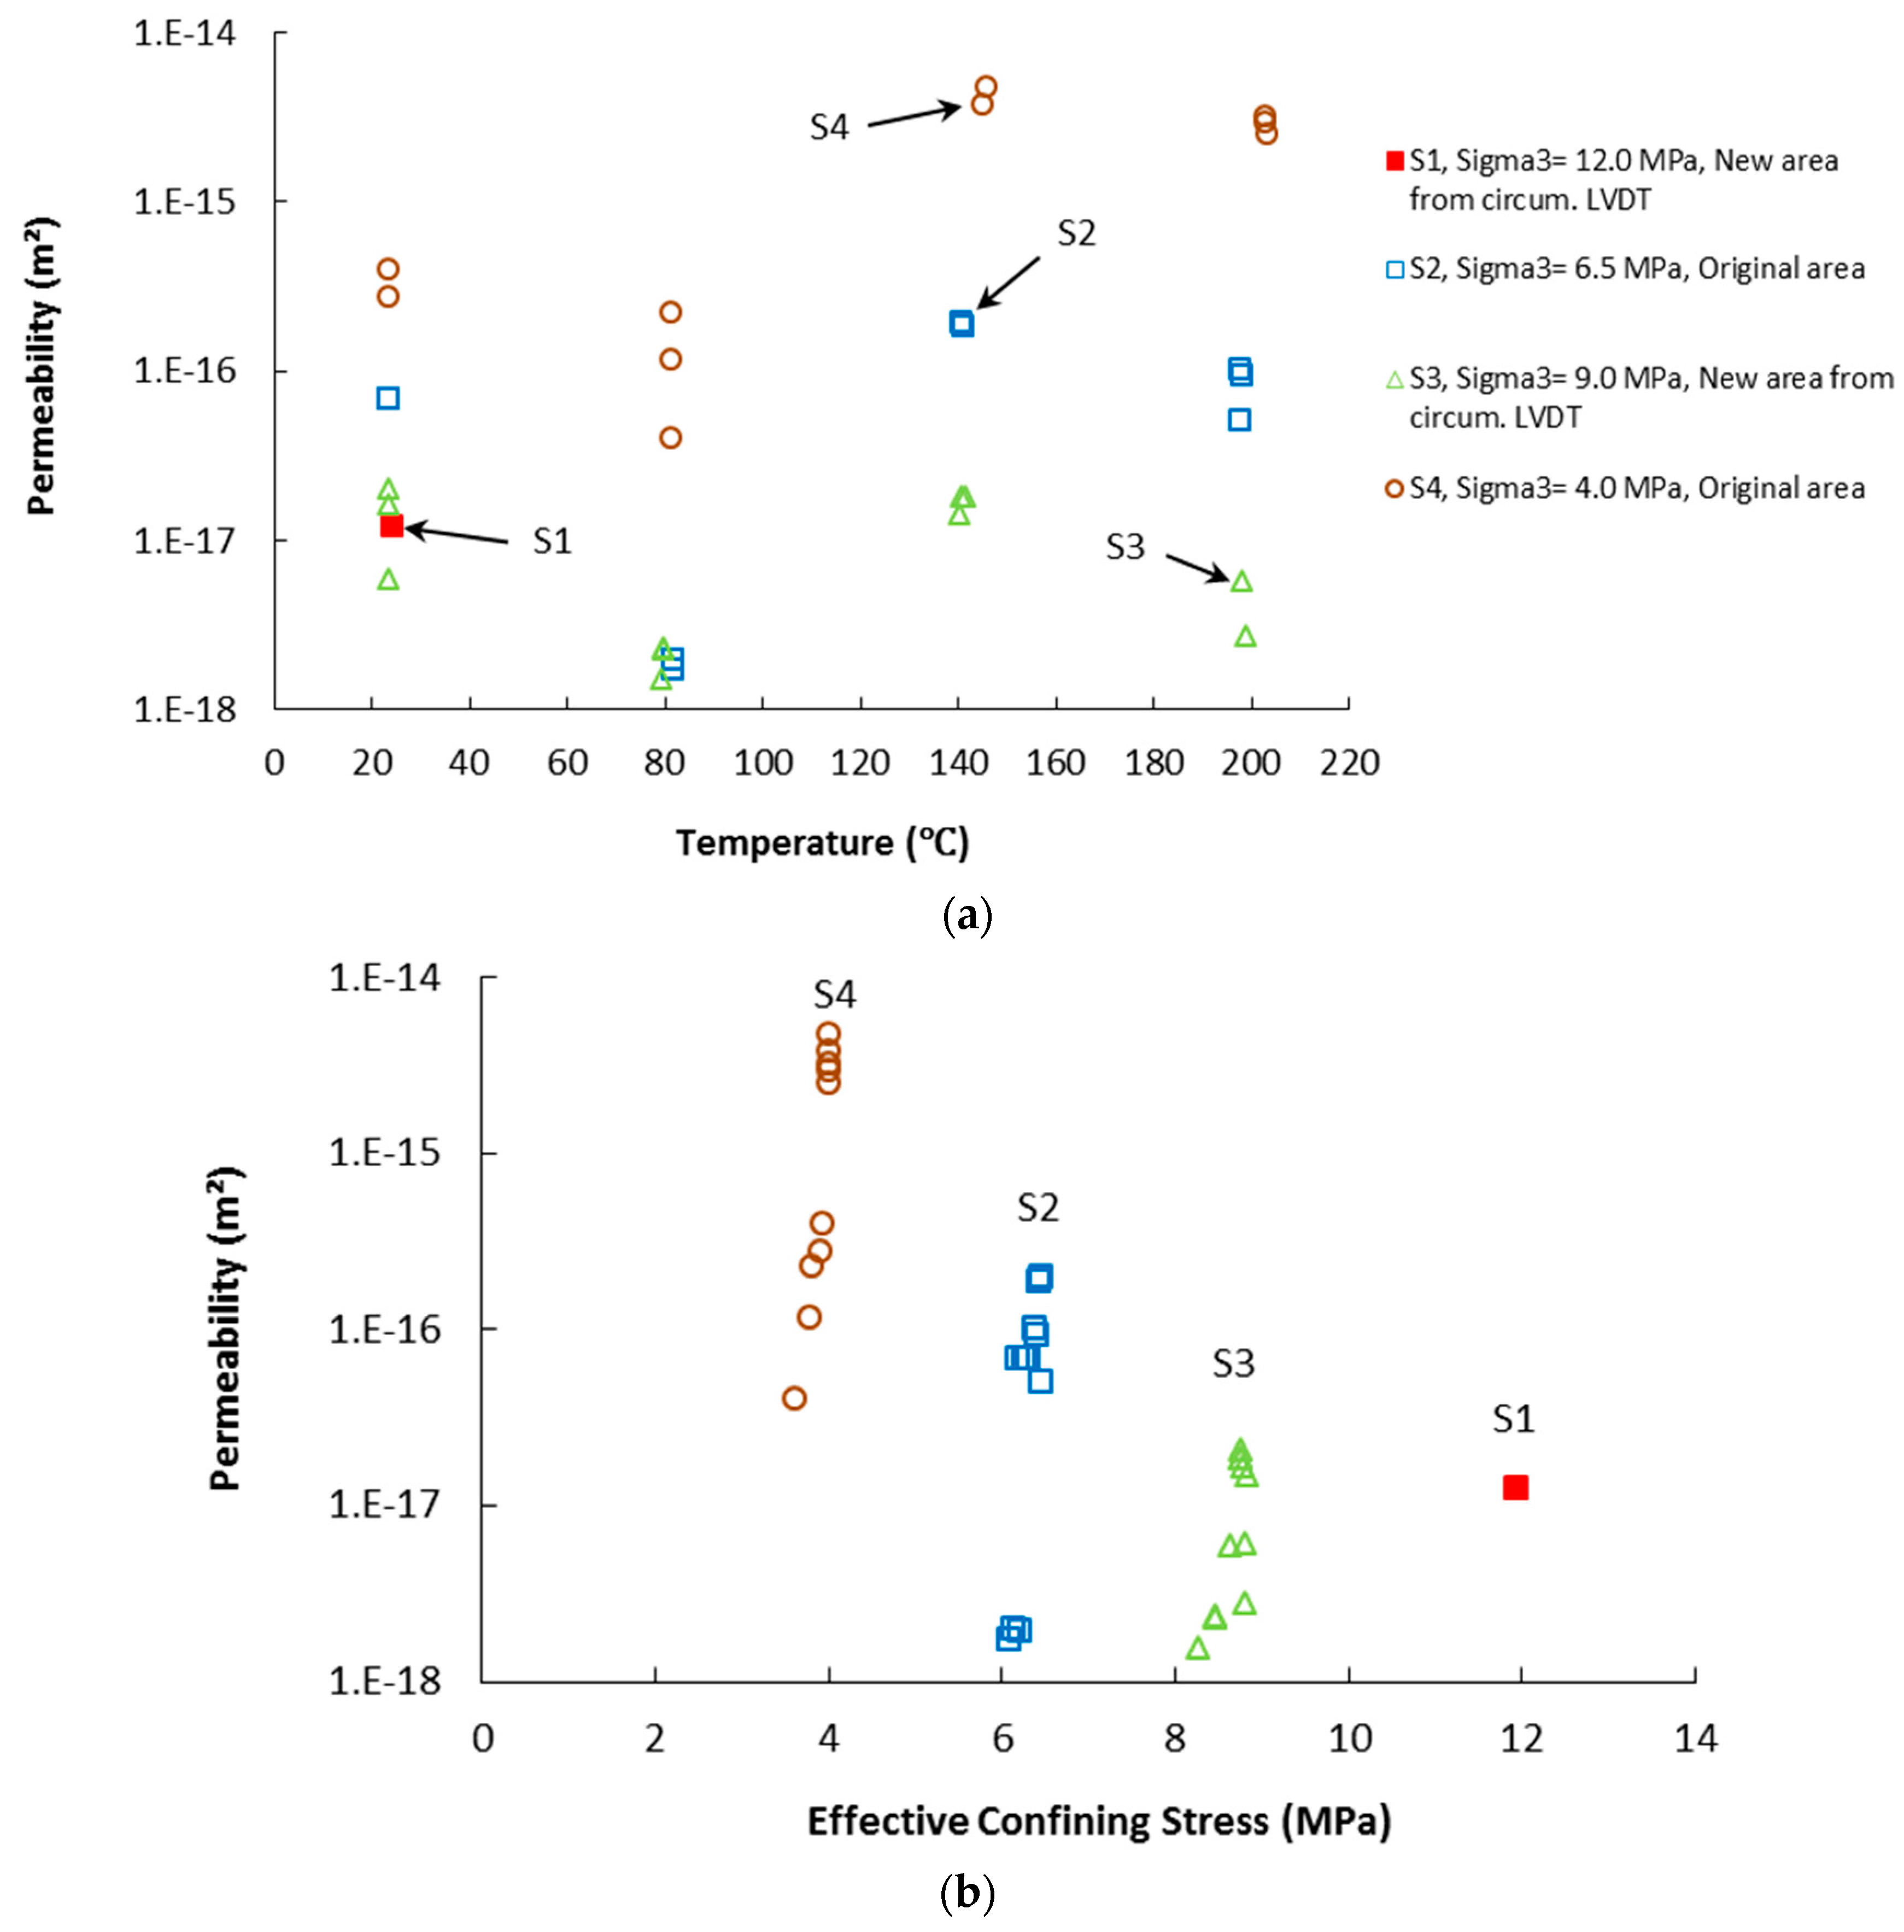
Figure 17.
A qualitative representation of gas-permeability versus thermal deformation of coal inferred from these experiments.
Figure 17.
A qualitative representation of gas-permeability versus thermal deformation of coal inferred from these experiments.

Figure 18.
Permeability of S1 and S4 versus axial strain during shearing at room temperature.


Table 1.
Proximate analysis (wt %, as received) of the Genesee mine coal (No. 2 seam, cycle II) [26].
Table 1.
Proximate analysis (wt %, as received) of the Genesee mine coal (No. 2 seam, cycle II) [26].
| Moisture | Ash | Volatile Matter | Fixed Carbon |
|---|---|---|---|
| 7.7–8.8 | 12.9–28.5 | 25.6–33.1 | 35.9–45.2 |
Table 2.
Minerology (wt %) of the Genesee mine coal (No. 2 seam, cycle II) [26].
Table 2.
Minerology (wt %) of the Genesee mine coal (No. 2 seam, cycle II) [26].
| Quartz | Feldspar | Illite | Kaolinite | Mixed Layer Clays | Gypsum | Calcium Aluminum Sulfate Hydrate | Clinoptilolite | Calcite |
|---|---|---|---|---|---|---|---|---|
| 32–42 | trace | <3 | 7–16 | 18–47 | <3 | 7–8 | 8 | 12 |
Table 3.
Specimens’ dimensions and density.
| Specimen ID | Diameter (cm) | Length (cm) | Length to Diameter Ratio (L/D) | Density (g/cm3) |
|---|---|---|---|---|
| S1 | 6.1 | 10.6 | 1.7 | 1.3 |
| S2 | 6.1 | 8.7 | 1.4 | 1.3 |
| S3 | 6.1 | 8.0 | 1.3 | 1.3 |
| S4 | 6.1 | 7.7 | 1.3 | 1.3 |
| S7 | 6.1 | 6.5 | 1.1 | 1.3 |
Table 4.
Testing program for each specimen.
| Specimen ID | Maximum Temperature (°C ) | Confining Stress (MPa) | Experimental Steps 1 |
|---|---|---|---|
| S7 | Room | 4 | Perform shear at 24 °C and at a rate of 2% axial strain/day () |
| S1 | Room | 12 | Measure N2 permeability at 24 °C and under various differential pressures, Perform shear at 24 °C and at a rate of 5% axial strain/day (), Pause shearing at various times and measure N2 permeability |
| S2 2 | 200 | 6.5 | Measure N2 permeability at 24 °C and under various differential pressures, Apply about 2 MPa deviator stress at a rate of , measure permeability, remove the 2 MPa deviator stress (only S4), Heat up specimen to about 80 °C and at a rate of 10 °C /h, Maintain 80 °C overnight (at least 12 h), Measure N2 permeability at 80 °C and under various differential pressures, Heat up specimen to about 140 °C and at a rate of 10 °C /h, Maintain 140 °C overnight (at least 12 h), Measure N2 permeability at 140 °C and under various differential pressures, Heat up specimen to about 200 °C and at a rate of 10 °C /h, Maintain 200 °C overnight (at least 12 h), Measure N2 permeability at 200 °C and under various differential pressures, Perform final shear at 200 °C and at a rate of |
| S3 2 | 200 | 9 | |
| S4 2 | 200 | 4 |
1 All final shear tests were performed in drained axial compression mode under constant confining stress. 2 Thermal deformation was measured using internal LVDTs.
Table 5.
Summary of N2 gas permeability test results.
| Specimen ID | Confining Stress (MPa) | Temperature (°C) | Upstream Pore Pressure Range (MPa) |
|---|---|---|---|
| S1 | 12.0 | 24.3 | 0.172 |
| 24.3 (during shear) | 0.973–0.994 | ||
| S2 | 6.5 | 23.5 | 0.240–0.462 |
| 81.7 | 0.597–0.849 | ||
| 140.9 | 0.128–0.155 | ||
| 197.8 | 0.150–0.295 | ||
| S3 | 9.0 | 23.9 | 0.290–0.414 |
| 80.0 | 1.002–1.382 | ||
| 141.2 | 0.318–0.419 | ||
| 198.9 | 0.436–0.783 | ||
| S4 | 4.0 | 23.5 | 0.121–0.204 |
| 23.5 (after 2 MPa shear) | 0.113–0.305 | ||
| 81.3 | 0.387–0.786 | ||
| 145.4 | 0.013–0.019 | ||
| 203.1 | 0.016–0.028 |
© 2017 by the authors. Licensee MDPI, Basel, Switzerland. This article is an open access article distributed under the terms and conditions of the Creative Commons Attribution (CC BY) license (http://creativecommons.org/licenses/by/4.0/).
Share and Cite
MDPI and ACS Style
Akbarzadeh Kasani, H.; Chalaturnyk, R.J. Influence of High Pressure and Temperature on the Mechanical Behavior and Permeability of a Fractured Coal. Energies 2017, 10, 854. https://doi.org/10.3390/en10070854
AMA Style
Akbarzadeh Kasani H, Chalaturnyk RJ. Influence of High Pressure and Temperature on the Mechanical Behavior and Permeability of a Fractured Coal. Energies. 2017; 10(7):854. https://doi.org/10.3390/en10070854
Chicago/Turabian StyleAkbarzadeh Kasani, Hossein, and Richard J. Chalaturnyk. 2017. "Influence of High Pressure and Temperature on the Mechanical Behavior and Permeability of a Fractured Coal" Energies 10, no. 7: 854. https://doi.org/10.3390/en10070854
Note that from the first issue of 2016, this journal uses article numbers instead of page numbers. See further details here.