
Loss Characteristics of 6.5 kV RC-IGBT Applied to a Traction Converter


School of Electrical Engineering, Beijing Jiaotong University, No. 3 Shangyuancun, Beijing 100044, China
*
Author to whom correspondence should be addressed.
Energies 2017, 10(7), 891; https://doi.org/10.3390/en10070891
Submission received: 15 May 2017
/
Revised: 2 June 2017
/
Accepted: 21 June 2017
/
Published: 1 July 2017
(This article belongs to the Special Issue Emerging Power Electronics Technologies for Power Systems and Machine Drives)
Abstract
:6.5 kV level IGBT (Insulated Gate Bipolar Transistor) modules are widely applied in megawatt locomotive (MCUs) traction converters, to achieve an upper 3.5 kV DC link, which is beneficial for decreasing power losses and increasing the power density. Reverse Conducting IGBT (RC-IGBT) constructs the conventional IGBT function and freewheel diode function in a single chip, which has a greater flow ability in the same package volume. In the same cooling conditions, RC-IGBT allows for a higher operating temperature. In this paper, a mathematic model is developed, referring to the datasheets and measurement data, to study the 6.5 kV/1000 A RC-IGBT switching features. The relationship among the gate desaturated pulse, conducting losses, and recovery losses is discussed. Simulations and tests were carried out to consider the influence of total losses on the different amplitudes and durations of the desaturated pulse. The RC-IGBT traction converter system with gate pulse desaturated control is built, and the simulation and measurements show that the total losses of RC-IGBT with desaturated control decreased comparing to the RC-IGBT without desaturated control or conventional IGBT. Finally, a proportional small power platform is developed, and the test results prove the correction of the theory analysis.
1. Introduction
The traction converter system of a modern electric locomotive and high speed train (EMU) is a voltage type traction converter composed of a four-quadrant converter and PWM inverters. It is used to facilitate the maintenance of the production and operation of the rectifiers and inverters of the same traction converter, by using the same devices to realize modular and standardized assembly. The DC voltage determines the voltage level of the main equipment, such as the traction transformers, converters, and traction motors [1,2,3]. The input and output currents of the traction drive system are related to the DC voltage under a certain traction power. The current capacity directly affects the equipment loss and heat dissipation, and determines the size and weight of the equipment.
In the design of the next generation of electric locomotives and standard EMUs in China, there is currently a trend of choosing a higher intermediate DC voltage. A 3600 V intermediate voltage can be obtained according to the circuit topology and the characteristics of the devices. In the three-level converter circuit, a 3600 V intermediate DC voltage can be achieved by using 3300 V or 4500 V IGBTs [4,5]. Due to the fact that this scheme has low requirements for the capacity of devices, we can easily choose a suitable device. Three-level control can reduce the harmonic and filter parameters, but its disadvantages are that the control is complex and many devices are required. We can only use 6500 V IGBTs to achieve a 3600 V intermediate DC voltage in the two-level converter circuit, and thus the selection of devices is narrow [6,7,8,9]. At present, the current tolerance of 6500 V IGBTs is generally 300–750 A, and the current capacity is low. Therefore, a parallel connection of IGBTs is needed. This scheme is easy to control and design, but a large number of devices are required.
The technology of RC-IGBT is very effective in terms of improving the current capacity of high voltage devices [10,11,12]. At present, the major manufacturers are actively engaged in the research and promotion of RC-IGBT. By the end of 2016, Infineon had launched products involving 6500 V/1000 A RC-IGBTs [13,14,15]. ABB developed the products of 6500 V/900 A BiGT on the basis of the further integration of the technology of RC-IGBTs [16]. CRRC Zhuzhou Times is also developing RC-IGBT, and is expected to release the first batch of samples in 2019. Due to the lack of ability of the power semiconductor industry, there are few Chinese companies carrying out research on the characteristics of high voltage and high power RC-IGBT applications [17,18,19]. Such research is mainly conducted by foreign companies and research institutions. Some characteristics of low power RC-IGBTs have been covered in Chinese studies, which have concentrated on the optimization of semiconductor mathematical modeling and snapback phenomenon (voltage retrace) [20,21]. Reference [22] compares the charge dynamic characteristics of RC-IGBTs with BiGT* (IGBT + RC-IGBT), and proposes the effect of the ratio of the P region and N region on the snapback phenomenon. Reference [23] shows a 6.5 kV RC-IGBT being applied to the method of the pulse control and the loss analysis of traction converters. It does not study the optimization of the desaturation pulse time, but instead selects a compromise time according to the manufacturer or its system. Reference [9] describes a double pulse test performed for various 6.5 kV RC-IGBT desaturation schemes, and compares the loss characteristics, but the study lacks quantitative analysis and optimization. Reference [24] presents an analysis of the overall driving strategy of RC-IGBTs, along with an empirical desaturation control scheme, which is adjusted according to the test system. However, the study does not specify the quantitative conditions.
In the present paper, the relationship between the RC-IGBT loss characteristics and desaturation control is studied, and the influences of the amplitude of the voltage and duration of the gate desaturation pulse on the loss of the integrated diode are analyzed. The paper presents a predictive control scheme based on a two-level desaturation pulse, which is used to control the 6.5 kV RC-IGBT traction converter. The operating conditions are simulated in a Simulink environment. The operating characteristics and loss characteristics of the RC-IGBT converter under the control of the common PWM and desaturation pulse are analyzed and compared. Finally, a specific application of the environmental parameters of the experimental analysis and loss calculation is performed to verify the effectiveness of the strategy of RC-IGBT desaturation control to reduce the loss.
2. RC-IGBT Structure and Switching Principal
2.1. Structure of RC-IGBT
Figure 1 shows the internal structure of the RC-IGBT. The most significant feature is that the collector area is not all p+ area, but is inserted in part of the n+ area. The red region is a P-i-N diode consisting of the p+ base region, the n-epitaxial region, and the n+ short-circuit region [25].
Under the conventional PWM signal gate driver, the switching state of RC-IGBT is similar to that of conventional IGBT, and thus it is correct to drive RC-IGBT by the conventional PWM signal. However, the loss characteristic of RC-IGBT is different from that of the conventional IGBT. Due to its internal P-i-N diode, the forward and reverse recovery characteristics of the internal diode will change when a voltage pulse is applied to the RC-IGBT gate during the diode mode (current direction is reverse). However, the characteristic of conventional IGBT and its anti-parallel diode only depend on the working conditions, including the voltage and current. In addition, the total loss of RC-IGBT consisting of the on-state loss and switching loss, is the same as that of the conventional IGBT module, but its value can be optimized by the gate control strategy.
2.2. Switching Loss Characteristics of RC-IGBT
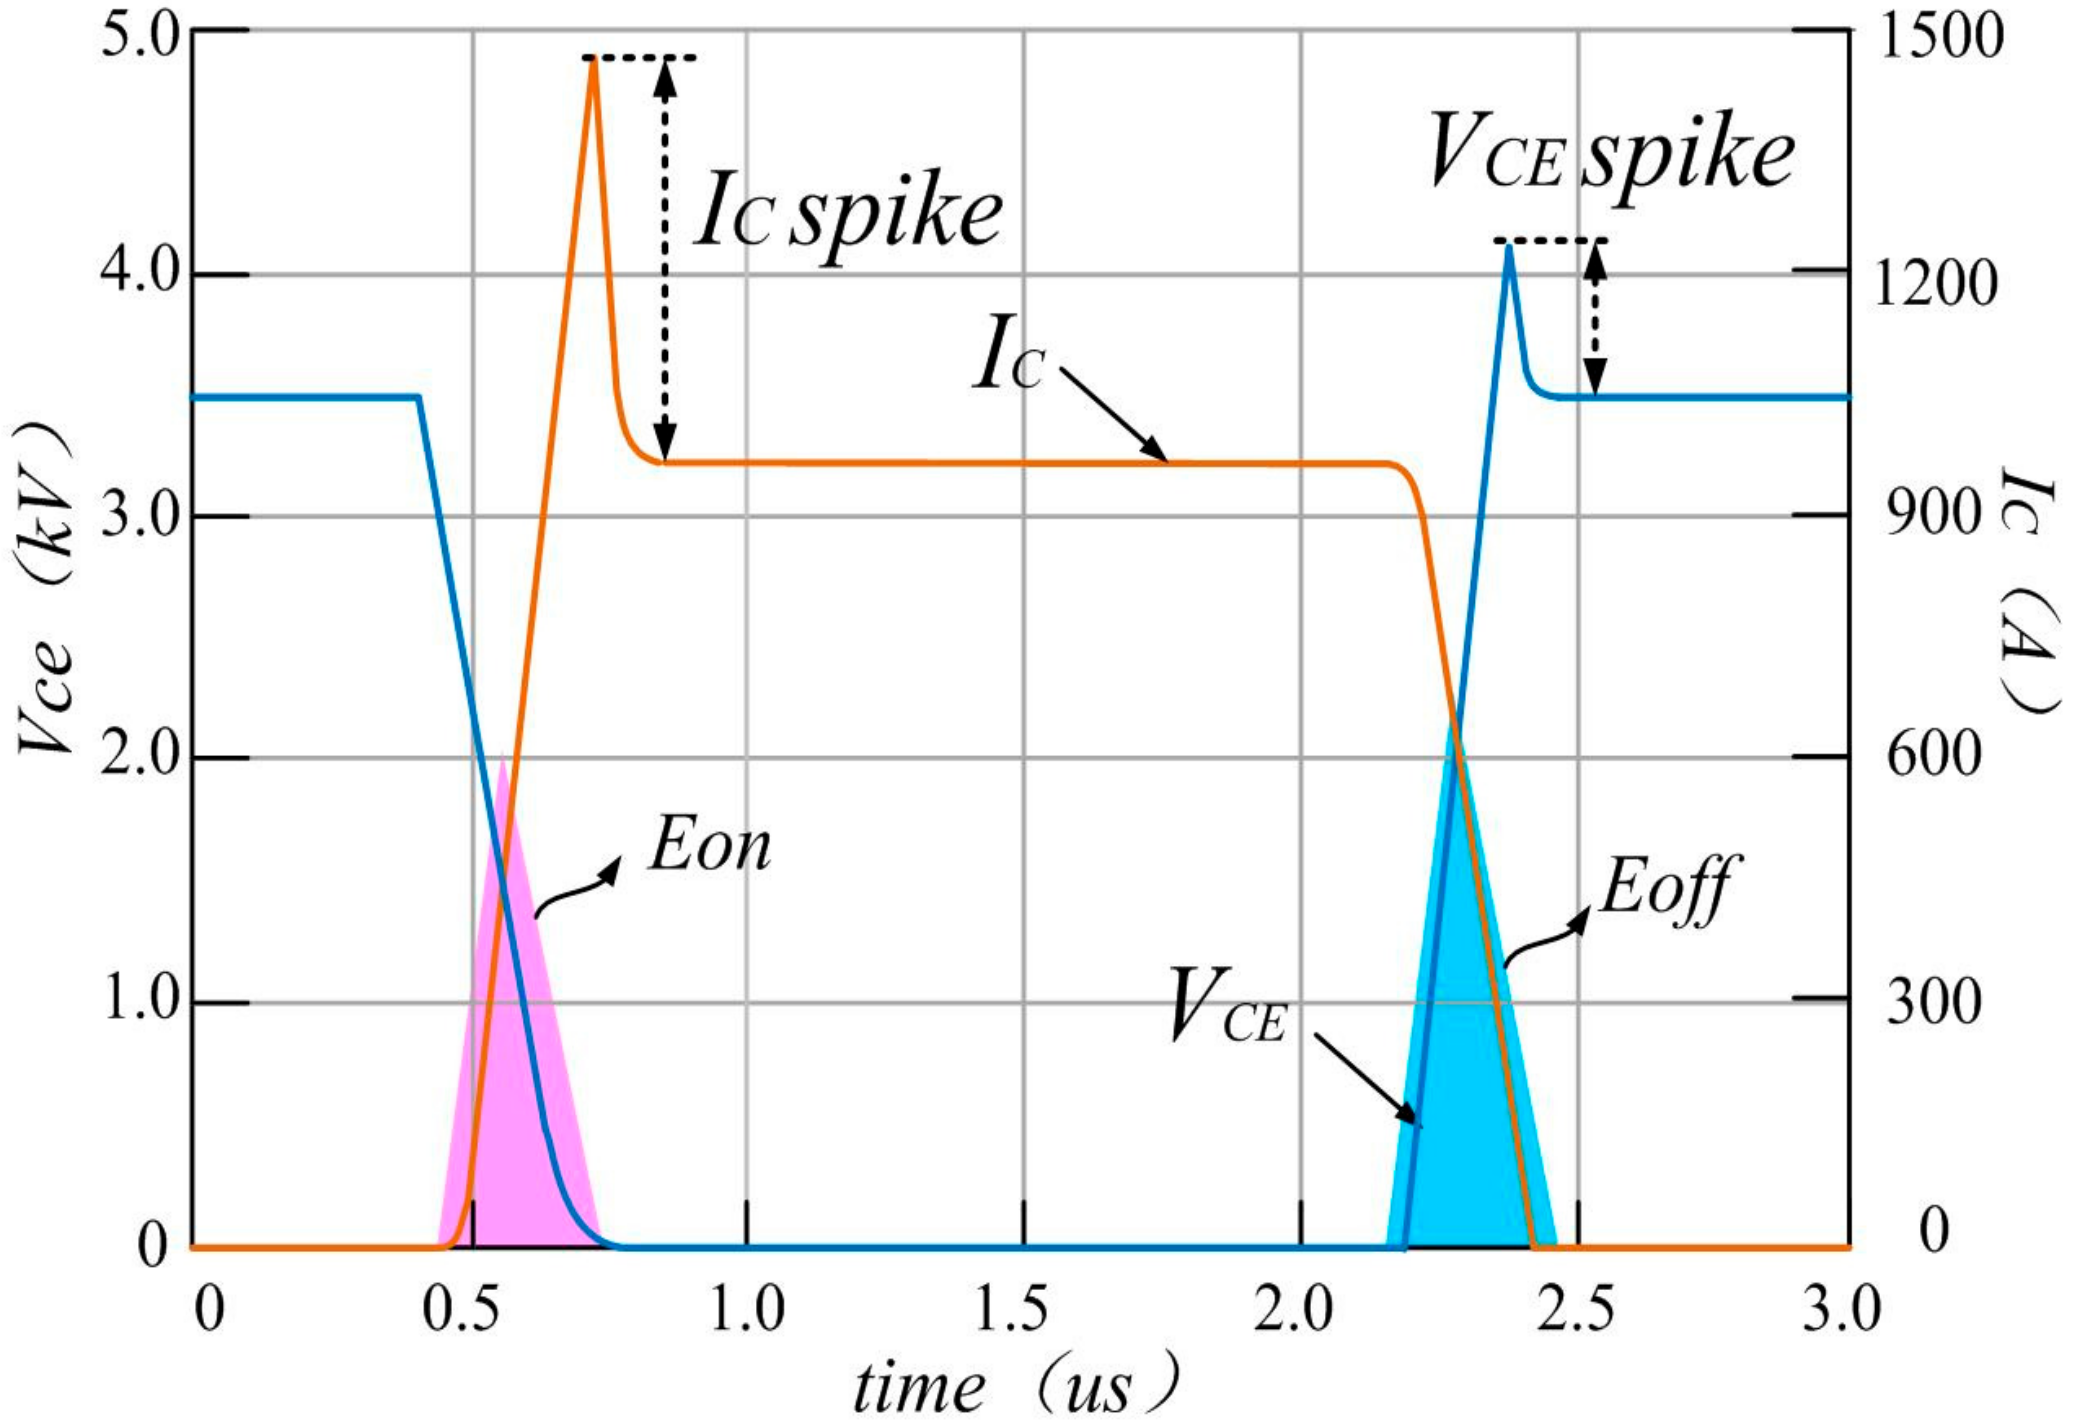
Figure 2 shows the whole waveform of the turn-on and turn-off of IGBT. When the IGBT turns off, the current IC drops. Under the effect of the parasitic inductance on the line, the waveform of Vce will exhibit a voltage peak, which will greatly increase the turn-off loss Eoff. When the IGBT turns on, the reverse recovery current will be superimposed on the collector current of the IGBT, a current peak will occur, and the turn-on loss of the IGBT will greatly increase [26,27].
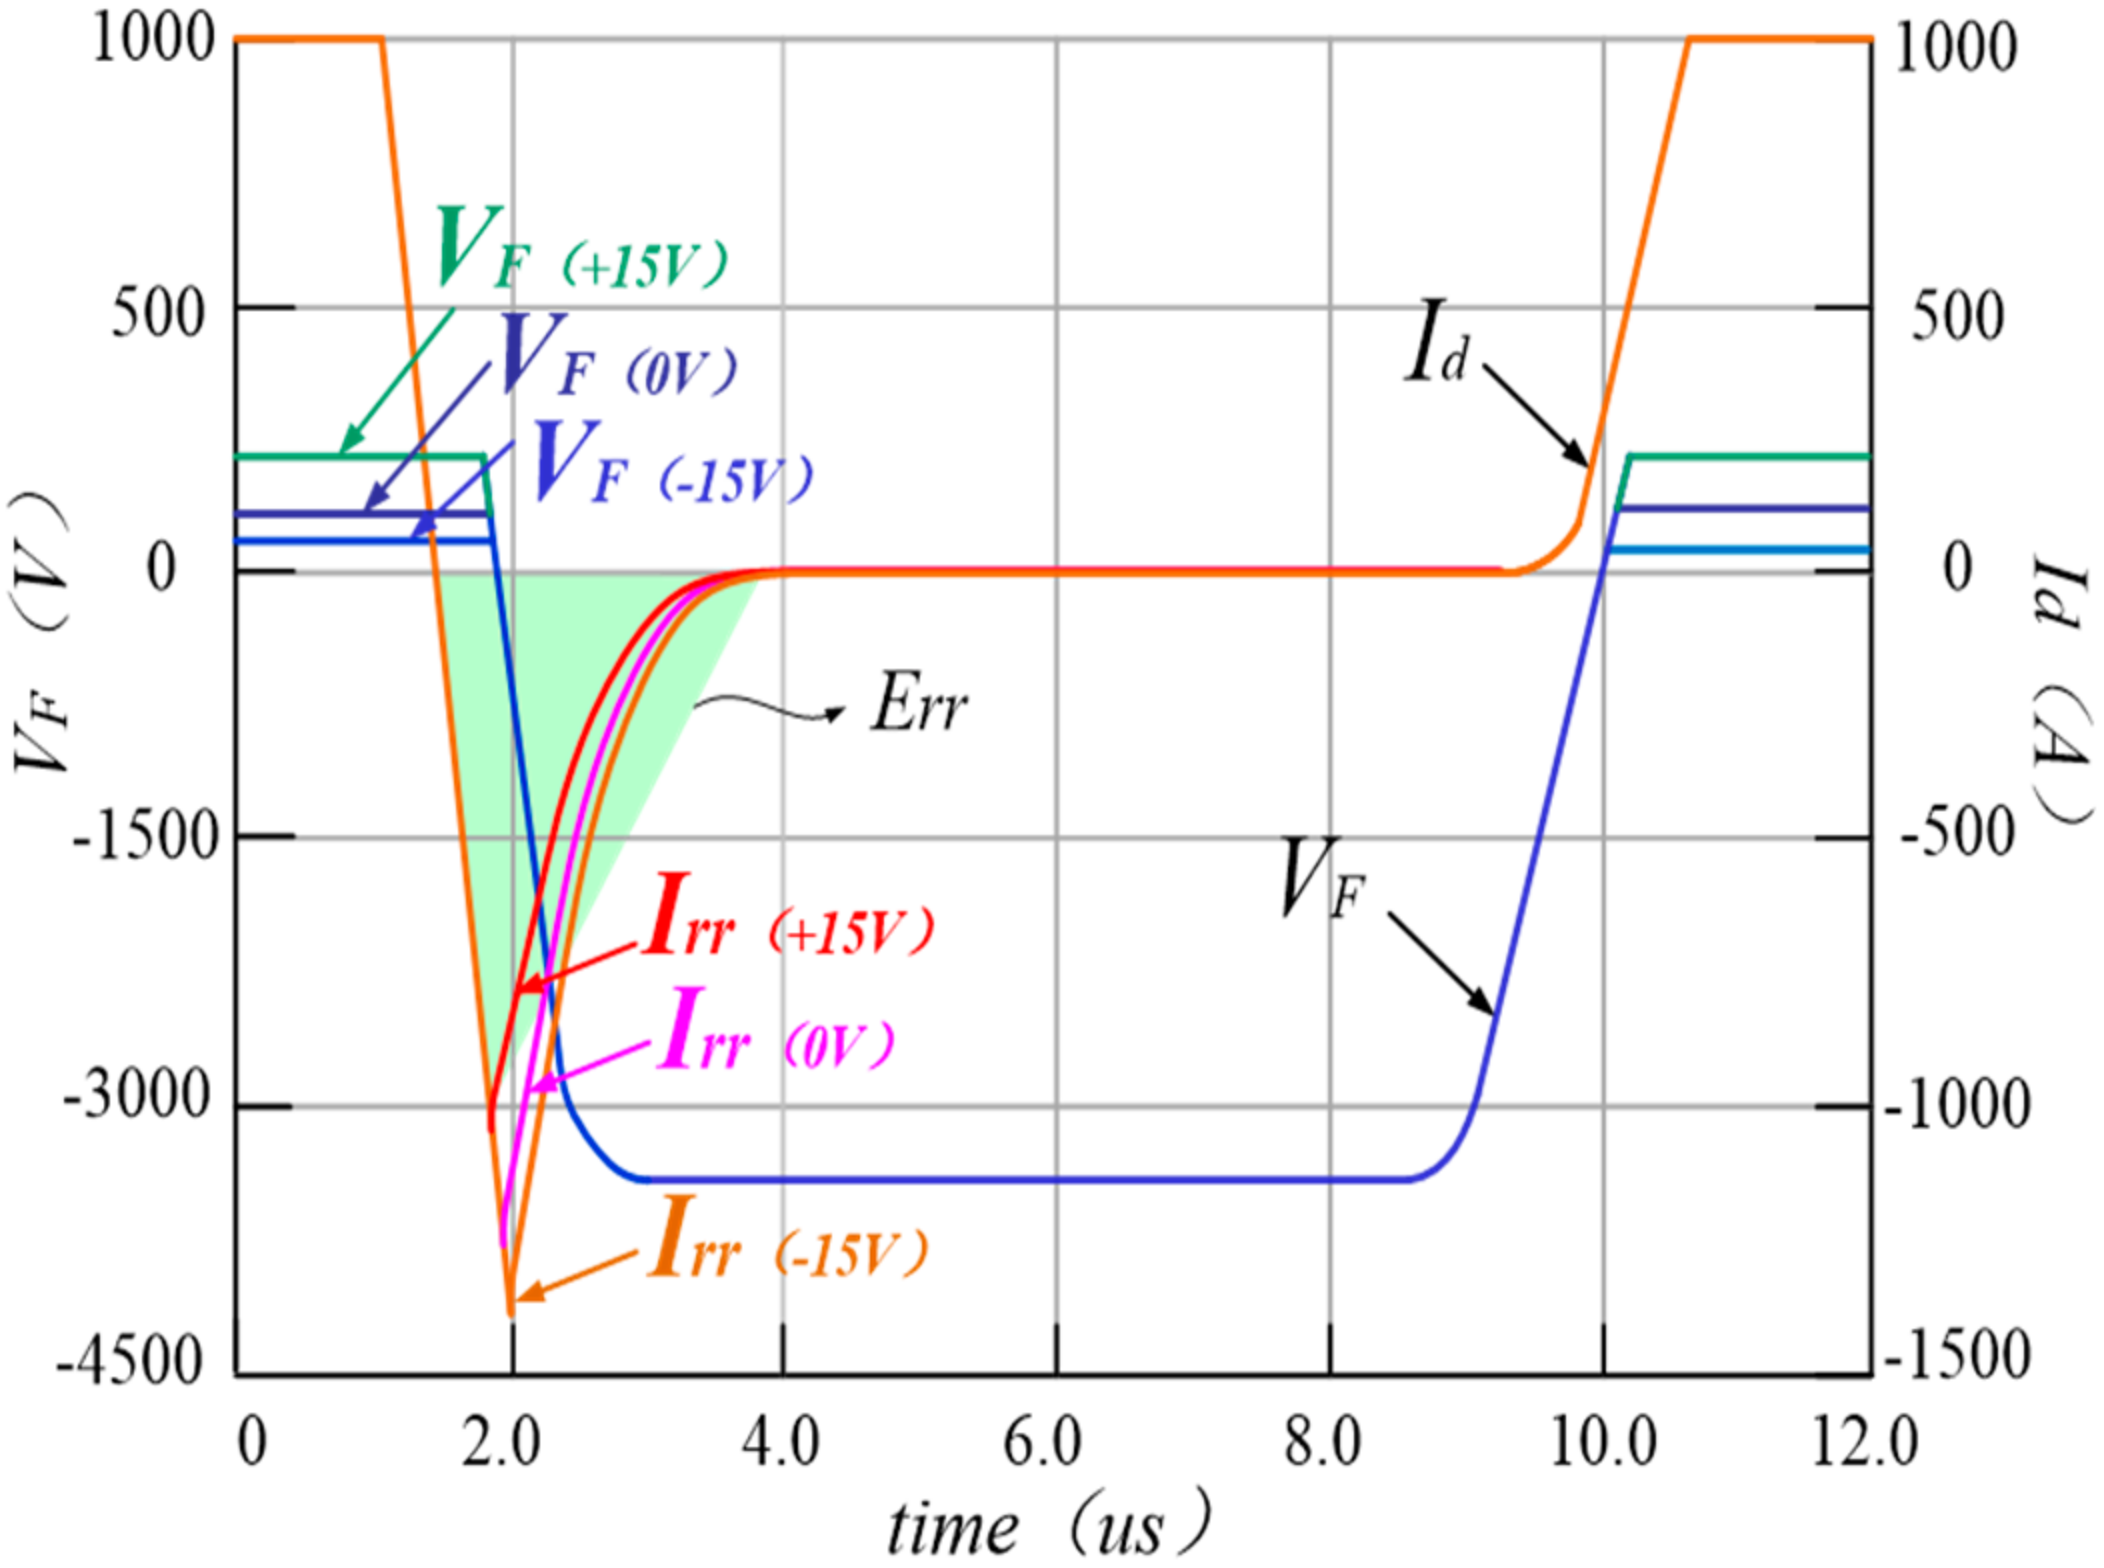
Figure 3 shows the whole waveforms of RC-IGBT internal diode switching simulation. The diode reverse recovery loss occurs after the diode is turned off. The diode reverse recovery peak current and the forward voltage drop under the different gate voltages are given.
3. RC-IGBT Diode Desaturation Control
The switching characteristics of the internal diode of the RC-IGBT are closely related to its operating state. The amplitude and duration of the voltage pulses applied on the gate may also significantly affect the conduction and reverse recovery characteristics of the diode.
3.1. Operation Principle of Internal Diode
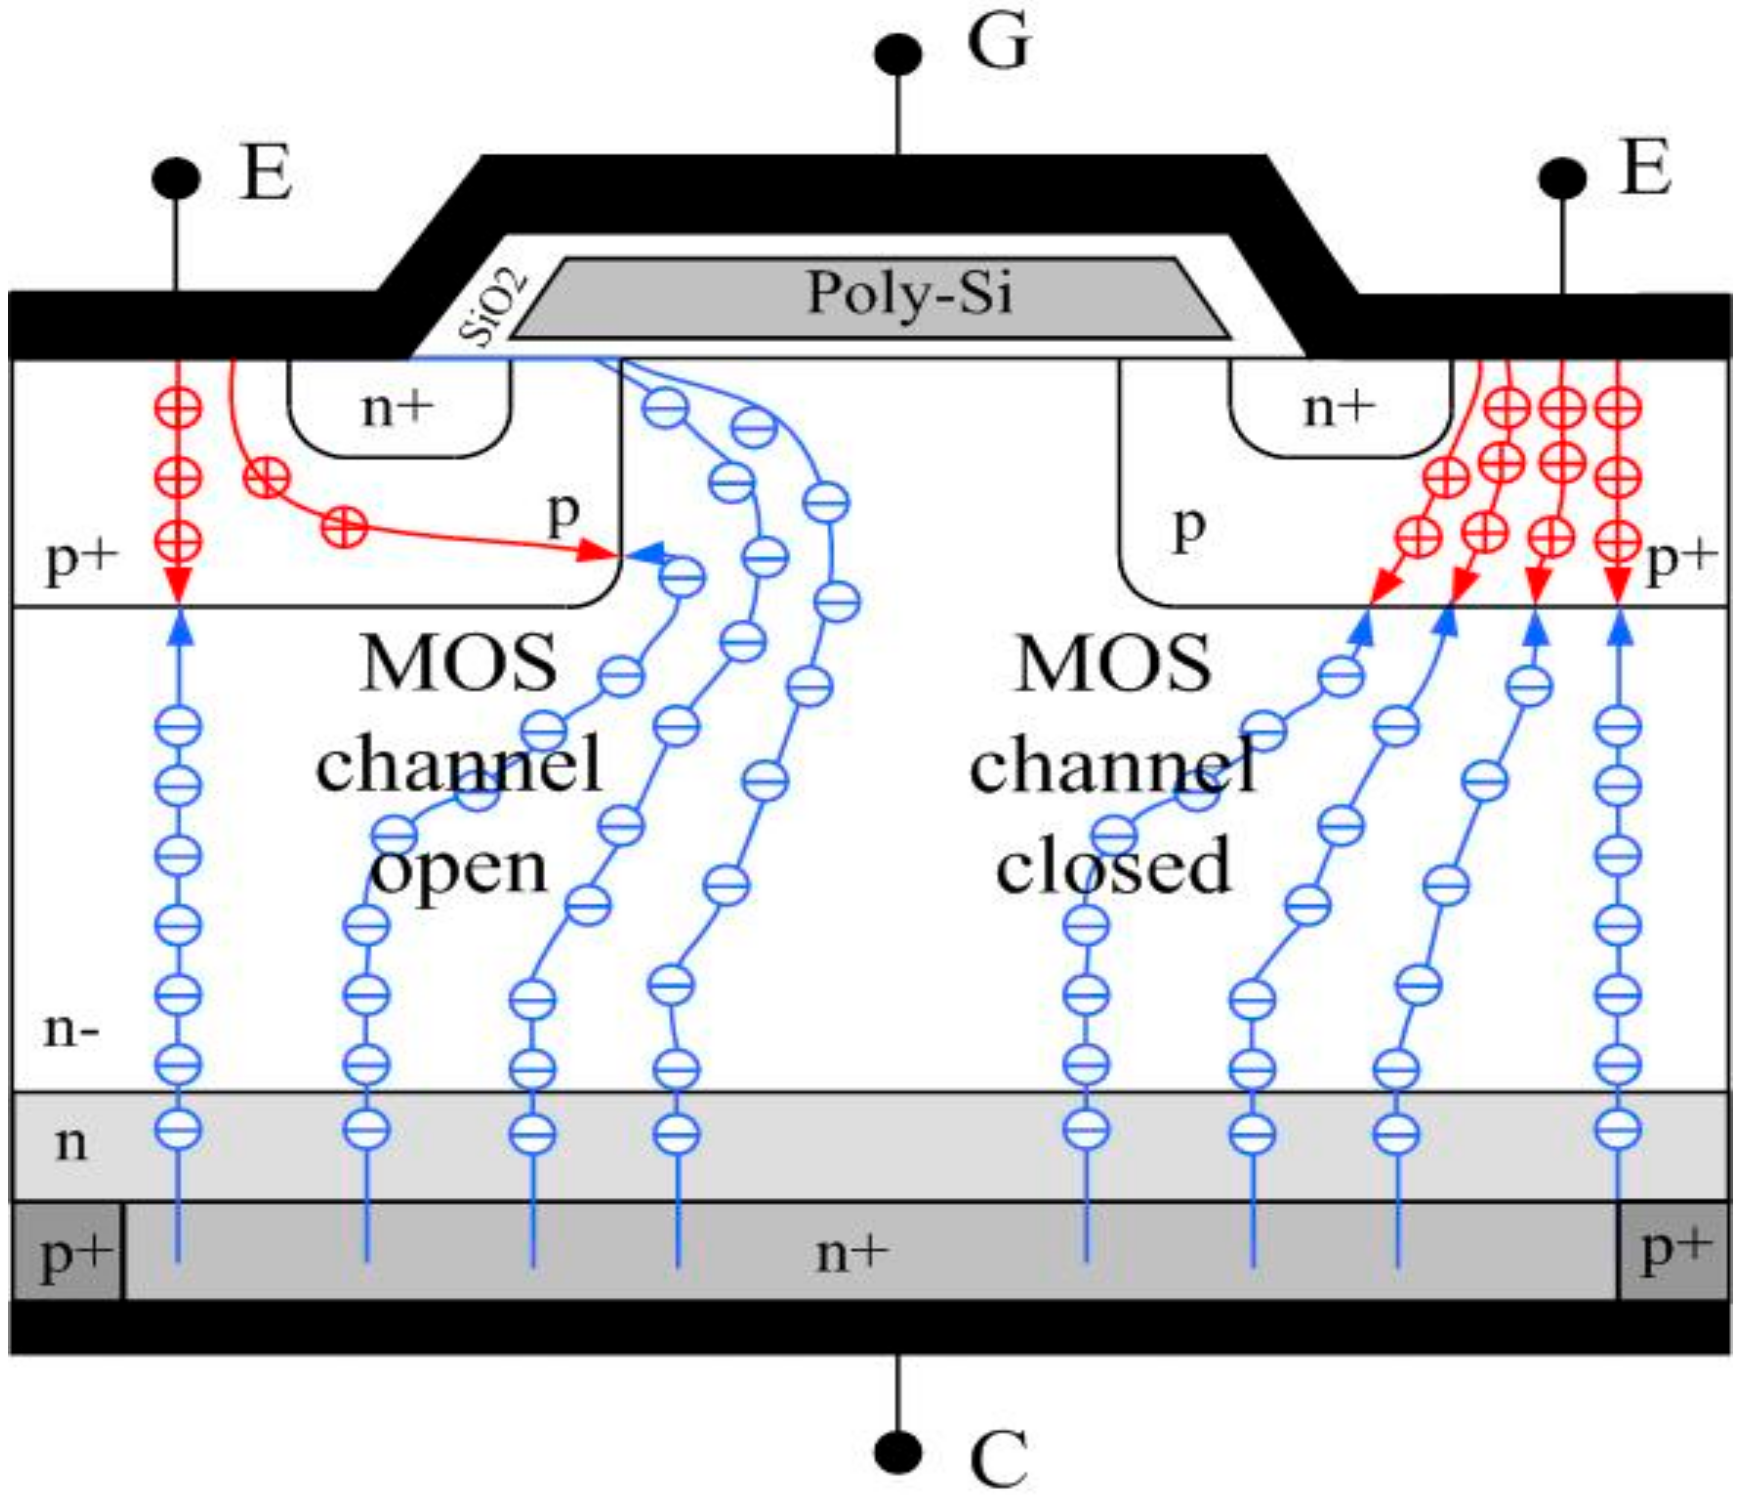
When the RC-IGBT internal diode is conducting, due to the fact that its P-i-N area exists in the N- drift area of the RC-IGBT, the electrical characteristics of the diode are controlled by the gate voltage. Figure 4 shows the internal charge dynamic of the RC-IGBT, whether the gate voltage is applied or not. When the gate voltage is applied, the MOSFET channel opens. The channel current promotes the charge shift in the diode region and extracts the stored charge (reverse recovery charge) accumulated in the space charge region when the diode is conducting, to optimize the diode reverse recovery characteristics. The disadvantages are that the diode forward voltage drop and a part of its conduction loss will be increased. When gate voltage is not applied, the internal diode of the RC-IGBT is the same as the conventional diode [28].
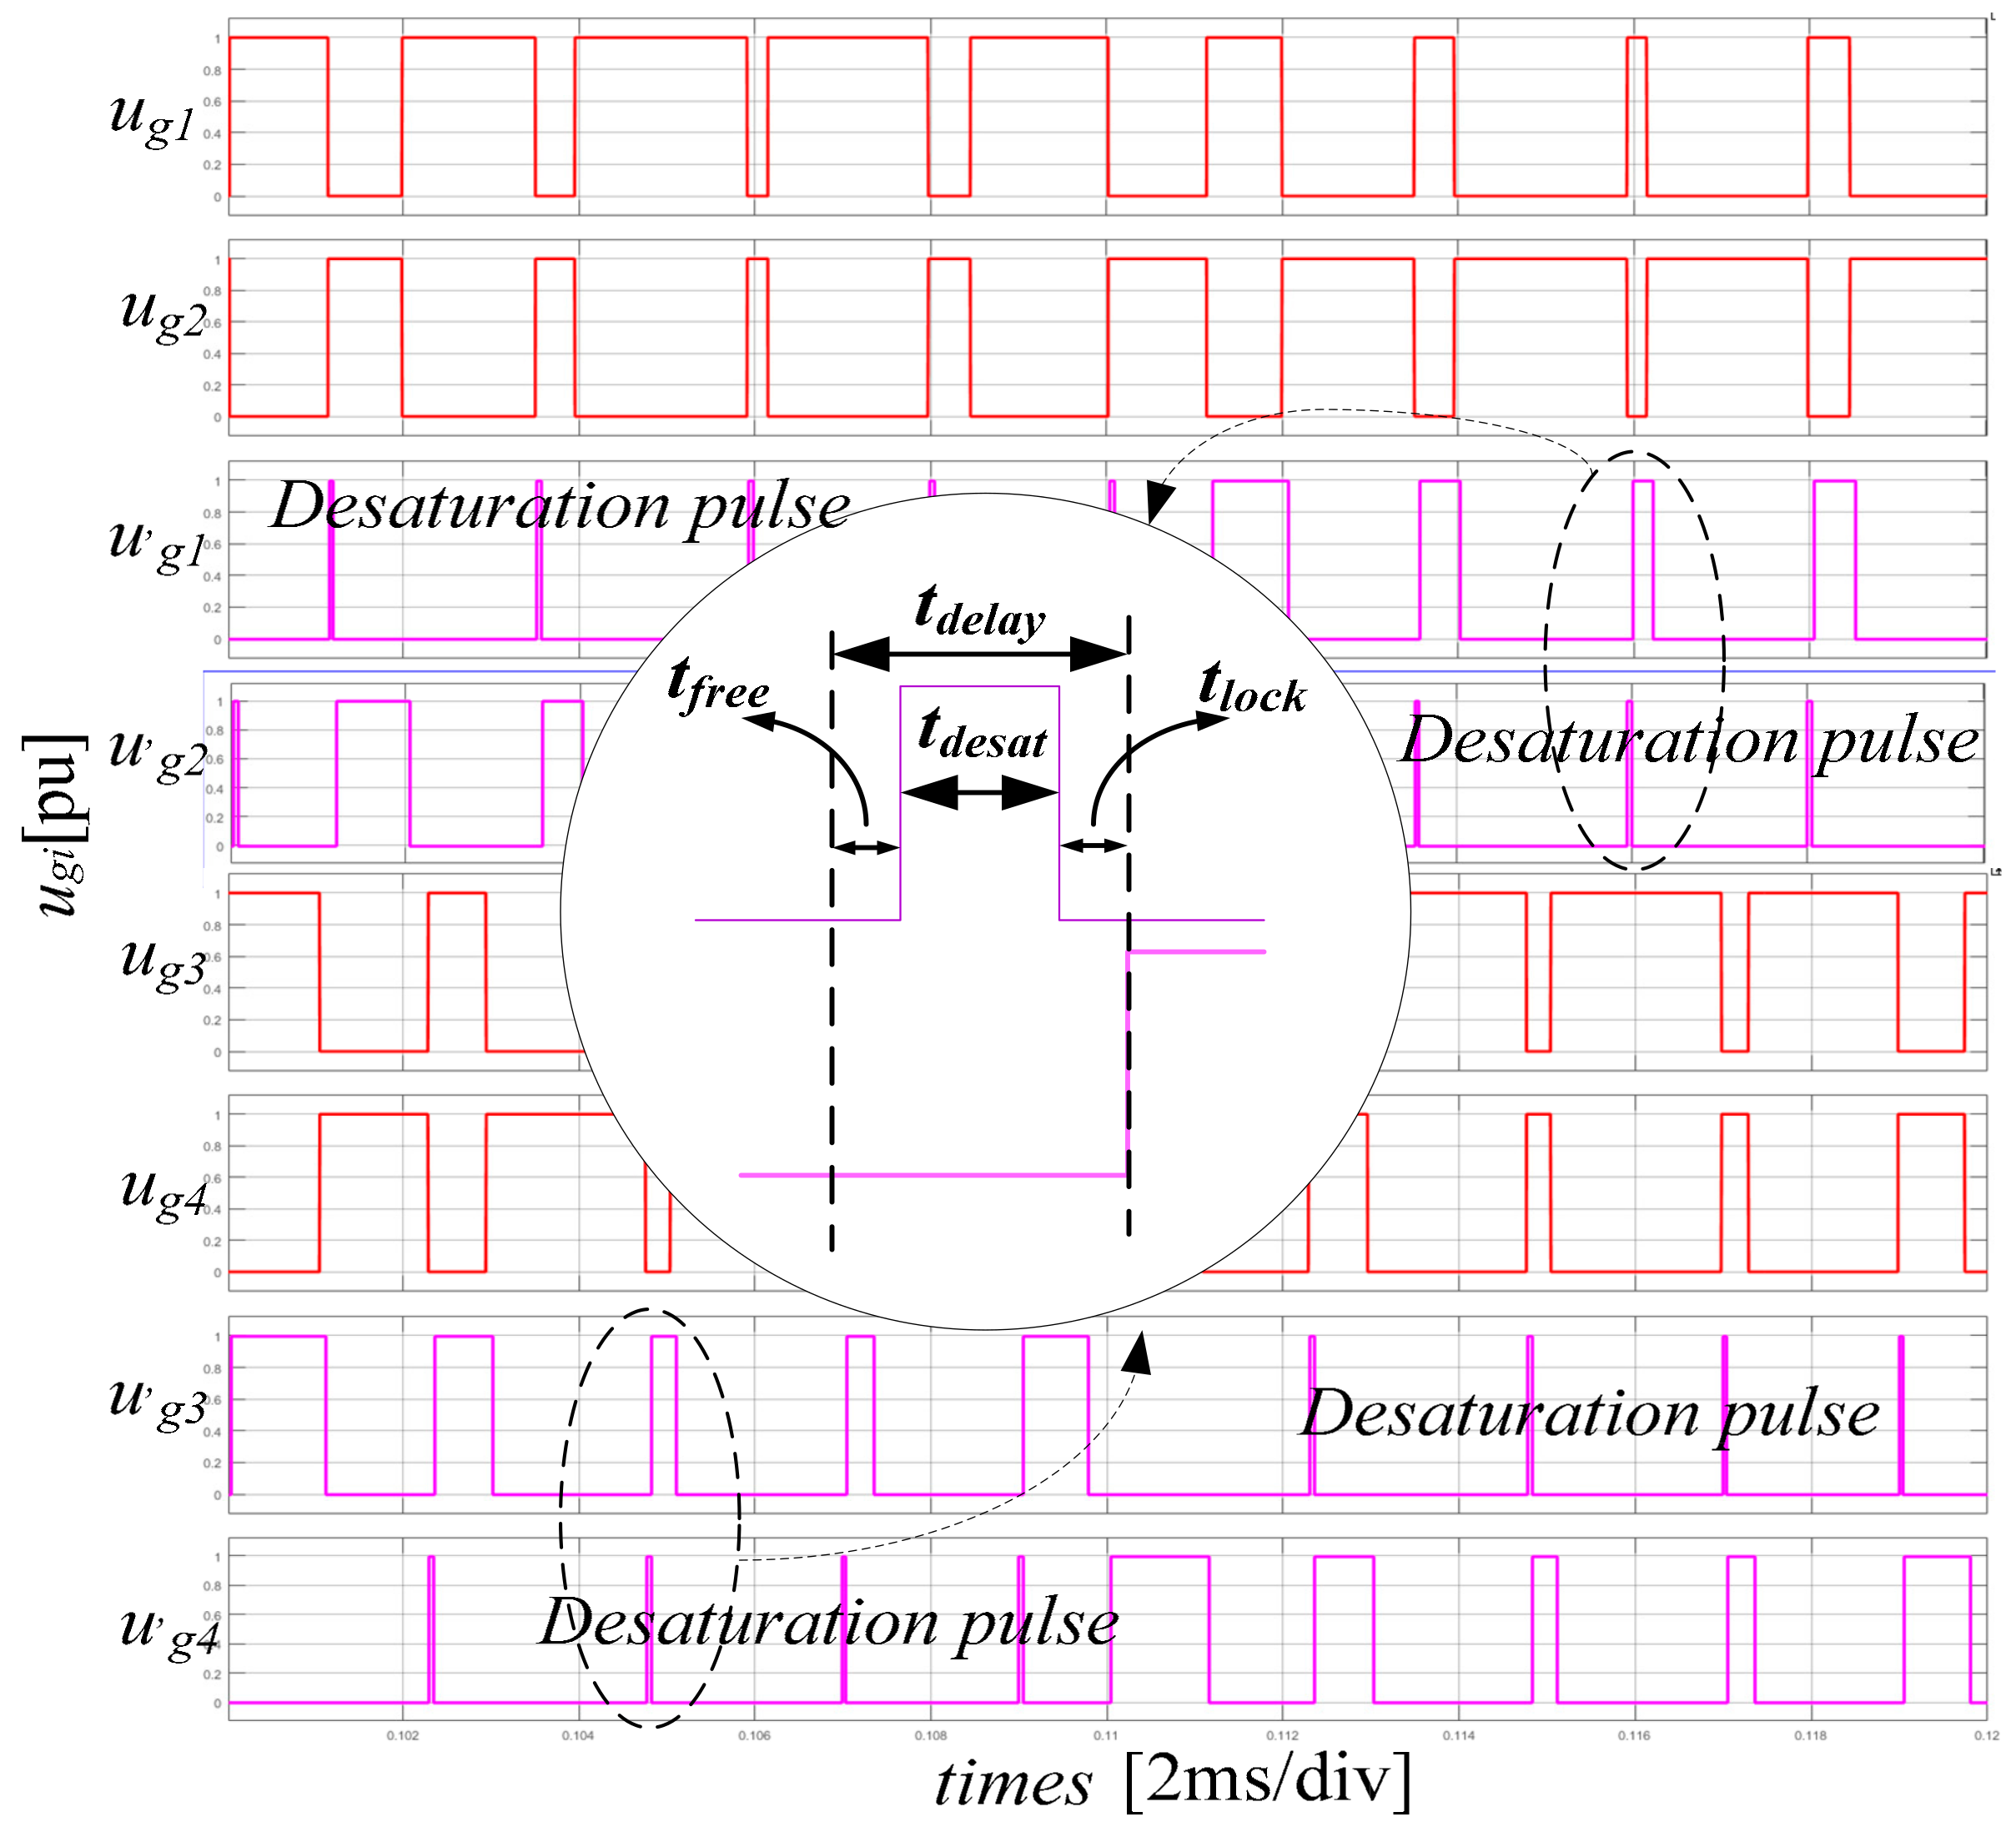
The applied gate voltage is known as the desaturation pulse, and is usually applied before the diode is turned off (before the reverse recovery), as the amount of stored charge in the diode can be greatly suppressed at this time. If the desaturation pulse is applied at the initial stage of diode conduction, then the stored charge in the space charge region is restored, and the effect is not significant when the diode is going to turn off [29].
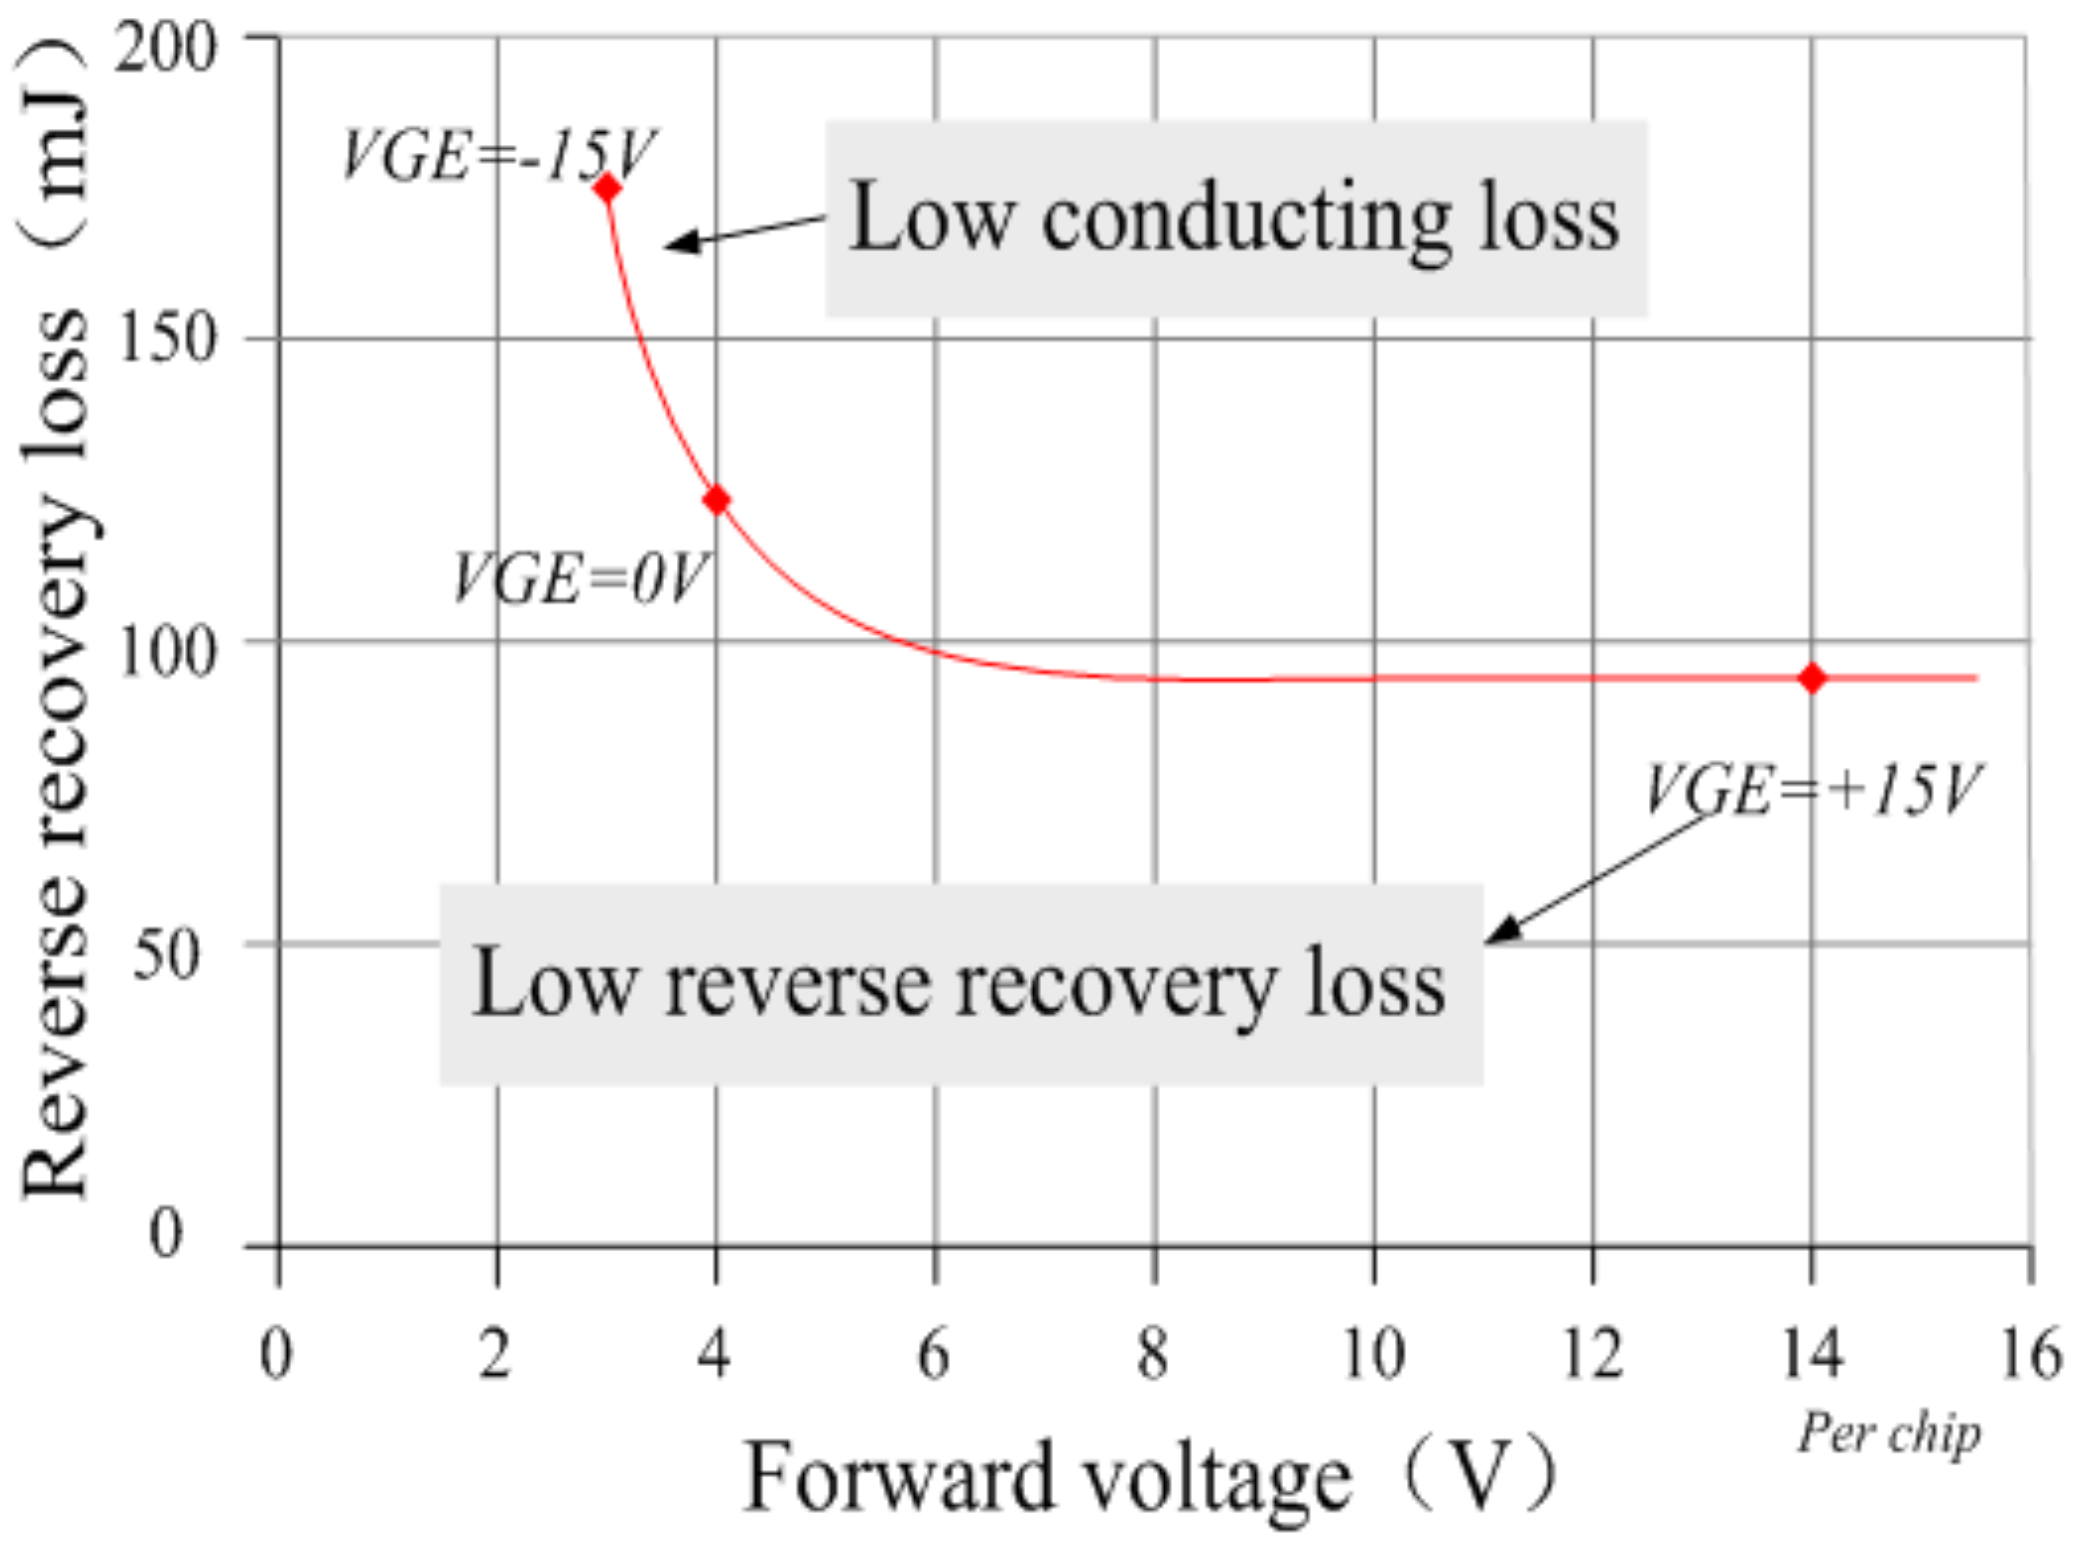
As mentioned above, there are two sides to the effects of the desaturation pulse on the diode characteristics. As the static loss of the diode increases, the dynamic loss of the diode can be optimized. Figure 5 shows the reverse recovery loss and forward voltage drop of the RC-IGBT internal diode under the different gate voltages. It can be seen that, if the PWM modulation and IGBT complementary control method (−15 V) are used in the diode conduction, then the dynamic characteristics of the diode are very poor, while the static characteristics are excellent. The dynamic characteristic is optimized with a gate voltage of 0 V, but the static characteristic is slightly poorer. When the gate voltage is +15 V, the dynamic characteristic is greatly optimized, while the static characteristic is very poor.
Considering the mutual constraints between the dynamic and static characteristics under this gate control strategy and the simplicity of the driver design, as the signal 0 V is an unconventional level and thus difficult to achieve, the drive must be greatly changed. The realization of two-level control (+15 V and −10 V) is relatively simple and quick at the laboratory stage. After the voltage value of the desaturation pulse has been determined, the duration of the desaturation pulse must also be determined, which is an important factor that strongly affects the dynamic static characteristics of the diode. It is necessary to choose the duration of the desaturation time to optimize the loss reduction, by combining the specific operating conditions.
3.2. Diode Losses under RC-IGBT Desaturation Control
The RC-IGBT desaturation pulse contains the voltage value Vdesat and the duration time tdesat. Under two-level control, by keeping Vdesat unchanged and changing the duration time tdesat, its impact on the reverse recovery at different desaturation times may be observed. Figure 6 shows the reverse recovery characteristics at desaturation durations of 20 μs, 50 μs, and 70 μs.
It can be seen from Figure 6 that the reverse recovery current reaches 1410 A without a desaturation pulse, and the peak of the reverse recovery current corresponds to 1180 A, 920 A, and 880 A after applying desaturation pulse durations of 20 μs, 50 μs, and 70 μs, respectively. The reverse current peak reduction is positively correlated with the pulse duration. The reverse desaturation positive voltage will reduce the reverse recovery current peak, yet increase the forward voltage drop during this time when the desaturation pulse (+15 V) is applied, and increase the conduction loss. Therefore, this paper must consider choosing a suitable desaturation duration, so that the reduction of the total loss achieves the optimal value.
In a switching cycle (the diode turn-on time is set to half of a switching period), the RC-IGBT switching loss variation is defined as δEsw, and the turn-off loss is almost unchanged. Diode reverse recovery loss variation is defined as δErr, the conduction loss variation is defined as δEon (diode), and the diode switching loss can be ignored. The resulting loss of RC-IGBT under desaturation pulse control is as follows:
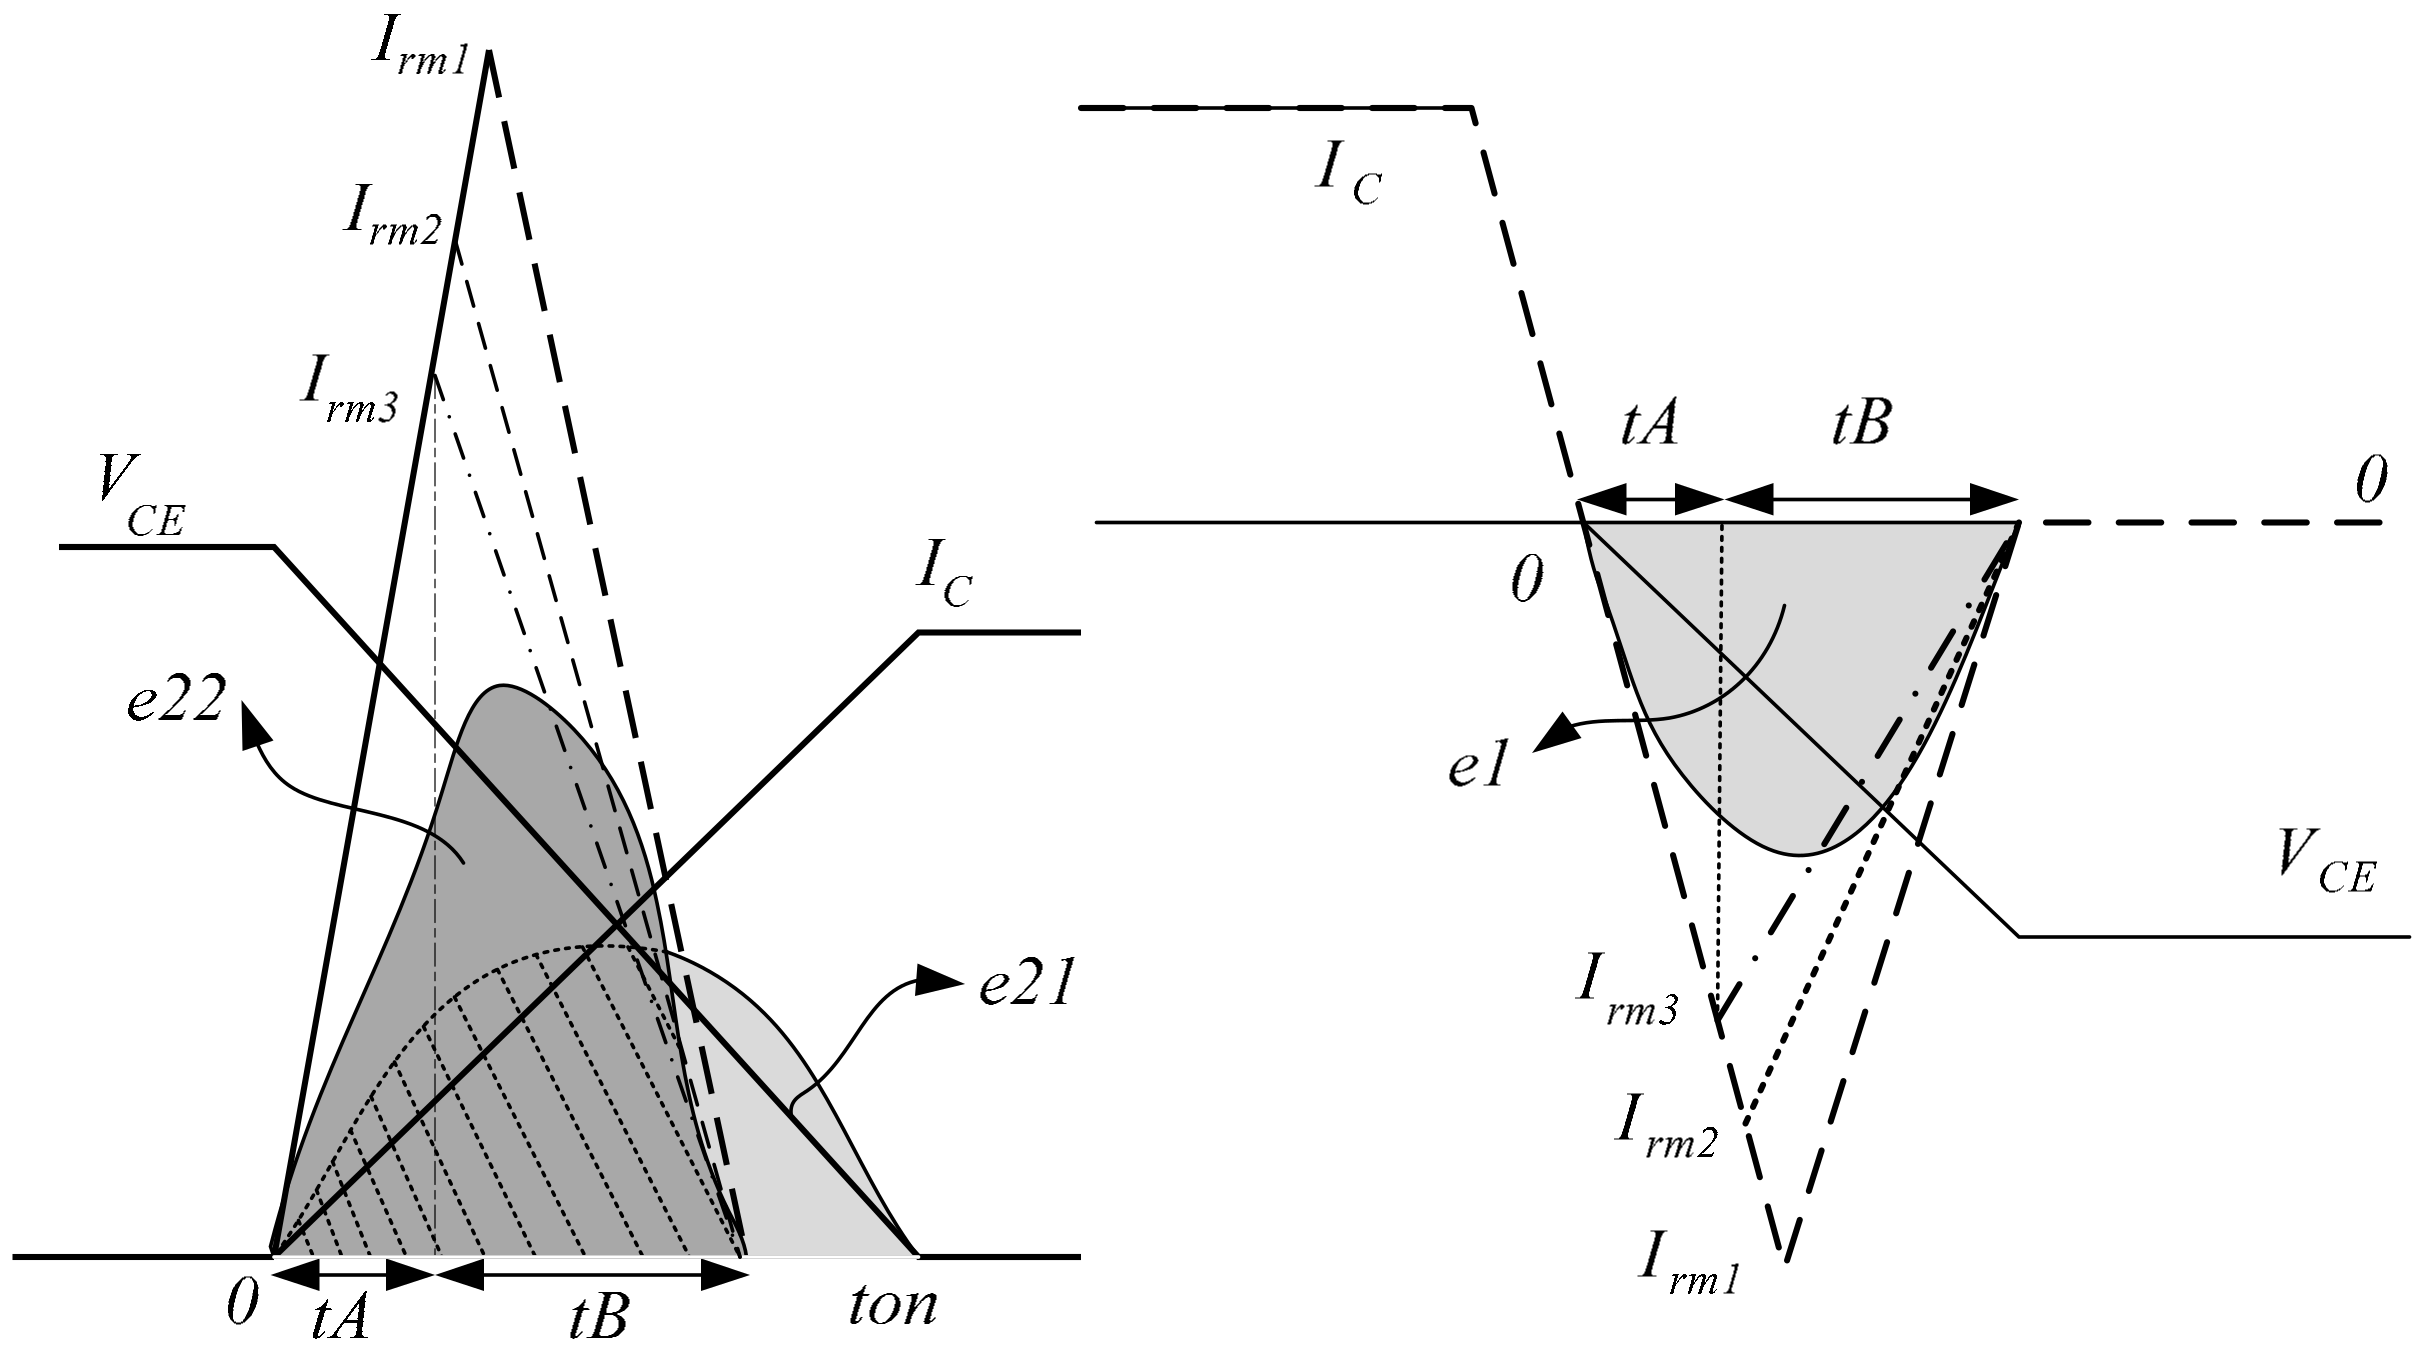
The turn-on current is decomposed into the superposition of the diode reverse recovery current Irr and the original collector current IC* to study the effects of the desaturation pulse on the turn-on loss of the RC-IGBT. According to two independent current components (2) and (3), two groups of losses, e21 and e22, are calculated, and the waveform is simplified to the linear function to quickly calculate the reverse recovery loss.
In Figure 7, the voltage function Vce (t), the current function Ic (t), and the two stages of the reverse recovery current function of IrrA (t) and IrrB (t) are as follows:
In the Formulas, ton: RC-IGBT switching time, trr = tA + tB: reverse recovery current time (in two stages), IRM: reverse recovery current peak value, IC: collector current, and VCE: DC voltage.
In 0 to ton time, each component is integrated, and the expression of the RC-IGBT turn-on loss is obtained as follows:
It can be seen from the above equation that the application of the desaturation pulse will result in a decrease in the reverse recovery current peak value and the recovery time tA, thereby achieving a corresponding reduction in the RC-IGBT turn-on loss. Assuming that the peak current IRM and the recovery time tA, tB are (The β is the negative coefficient), the following is true:
When substituting Equation (9) into Equation (8) to obtain the RC-IGBT turn-on loss under the function of desaturation, the approximate variation of the opening loss can be obtained as follows:
Similarly, the variation of reverse recovery loss is calculated as follows:
When the RC-IGBT module operates under the conditions of 3600 V and 1000 A, the reverse recovery current peak is 2850 A, the turn-on time ton is 3 μs, the reverse recovery time trr is 2 μs, and tA is 0.6 μs. These data are taken as the initial values and substitute Equation (12) to obtain the RC-IGBT turn-on loss and the reverse recovery loss expression as a function of β:
At the same time, the desaturation pulse increases the diode conduction loss. Under the above conditions, the diode forward voltage drop at the +15 V gate voltage is increased by 11.5 V compared to the −10 V gate voltage, and thus the diode conducting loss during the desaturation time can be expressed as follows:
In summary, the RC-IGBT total loss variation after desaturation gate control under the 3500 V/1000 A operating conditions can be expressed as follows:
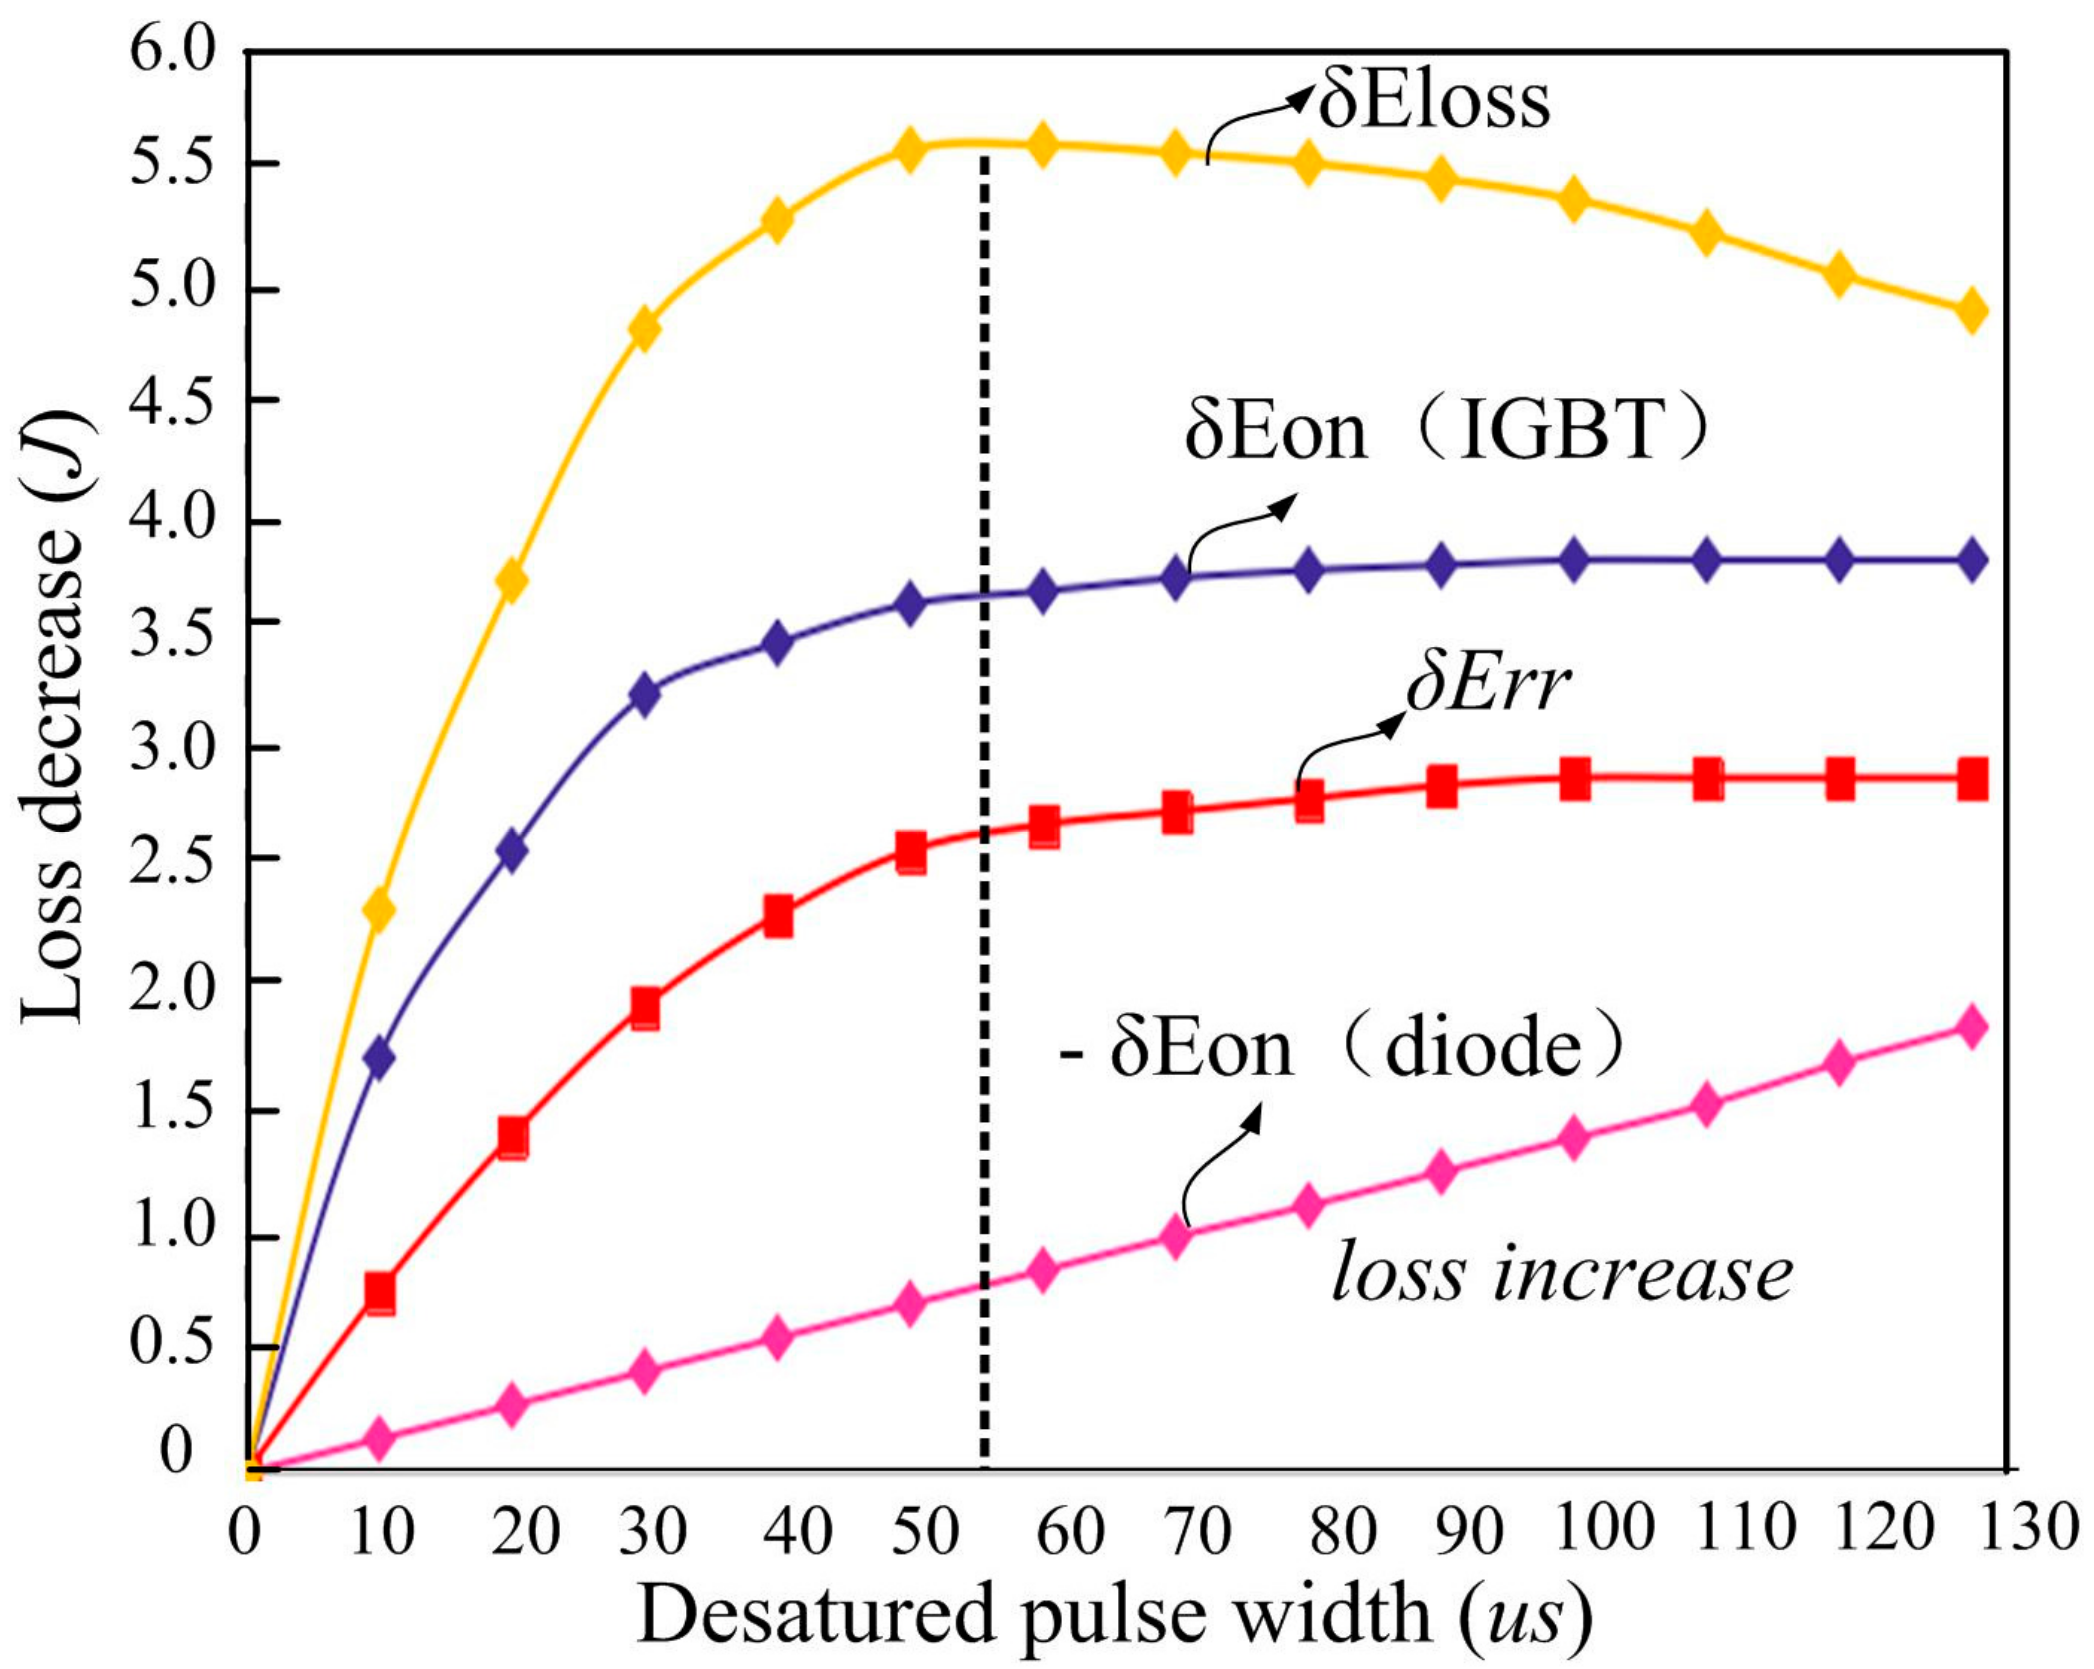
According to the RC-IGBT data sheet, the curve fitting of the above calculation can be obtained. Figure 8 shows the relationship between the variation of the loss and the desaturation time under the 3500 V/1000 A conditions of the RC-IGBT.
It can be seen from Figure 8 that the loss decreases with desaturation control under the conditions of 3500 V/1000 A, and the decrease in the variation of turn-on loss and reverse recovery loss will be saturated with the continuous increasing of the desaturation pulse duration, while the diode conduction loss always continues to increase. When the desaturation time tdesat is 50–70 μs, the total loss reduction reaches its maximum, and the effect of the desaturation control on the loss is best.
In this paper, by further optimizing the established loss model, and under the conditions of rated 3500 V/1000 A, the mathematical equations of the optimization process are as follows:
When the RC-IGBT operating condition changes, the optimal desaturation pulse time tdesat will change with the power level. Throughout the desaturation process, the diode conduction loss is only related to the current at that time, and when the system power level gradually decreases, the optimized IGBT turn-on loss and diode reverse recovery loss decrease more rapidly, while the conduction loss increases more slowly. When assuming the following approximation: the voltage and current, respectively, become 1/α and 1/γ of the initial values, the loss mathematical expression is as follows:
When the system power level drops, the summary of the turn-on loss and reverse recovery loss decreases by a large proportion, yet the increment of the diode conducting loss is smaller, so that the optimal point will shift to the left side of the rated condition optimization point. Figure 9 shows the results of desaturation control at operating conditions of 3300 V/750 A, 3300 V/750 A, 2500 V/700 A, and 1700 V/600 A. When the system power level is reduced, an appropriate reduction in the desaturation pulse duration is advantageous for maintaining the total loss at a low level.
4. Losses Analysis and Operation Test for RC-IGBT Converter
The test of the actual losses of the RC-IGBT module under rated operating conditions is carried out. Based on the simulation parameters of the desaturation pulse control of a single-phase PWM rectifier, the system losses under rated operating conditions are calculated. Finally, the experimental platform of the RC-IGBT single-phase PWM rectifier is built and tested under the condition of equal power reduction.
4.1. Losses Analysis and Test for RC-IGBT under Desaturation Control
The test of the improved dual-pulse is carried out. On the basis of the common dual-pulse Vge2, the saturation pulse Vge1 is applied to the upper switch according to the turn-off time of the diode of the upper switch, and the turn-on time of the IGBT of the lower switch. The RC-IGBT module is Infineon FZ1000R65KR3, and the general IGBT module is Infineon FZ750R65KE3.
Figure 10 shows the waveforms of a dual-pulse test. The bus voltage is 3500 V and the rated current is 600 A. The width of the saturation pulse is 50 μs and the self-locking time is 3 μs.
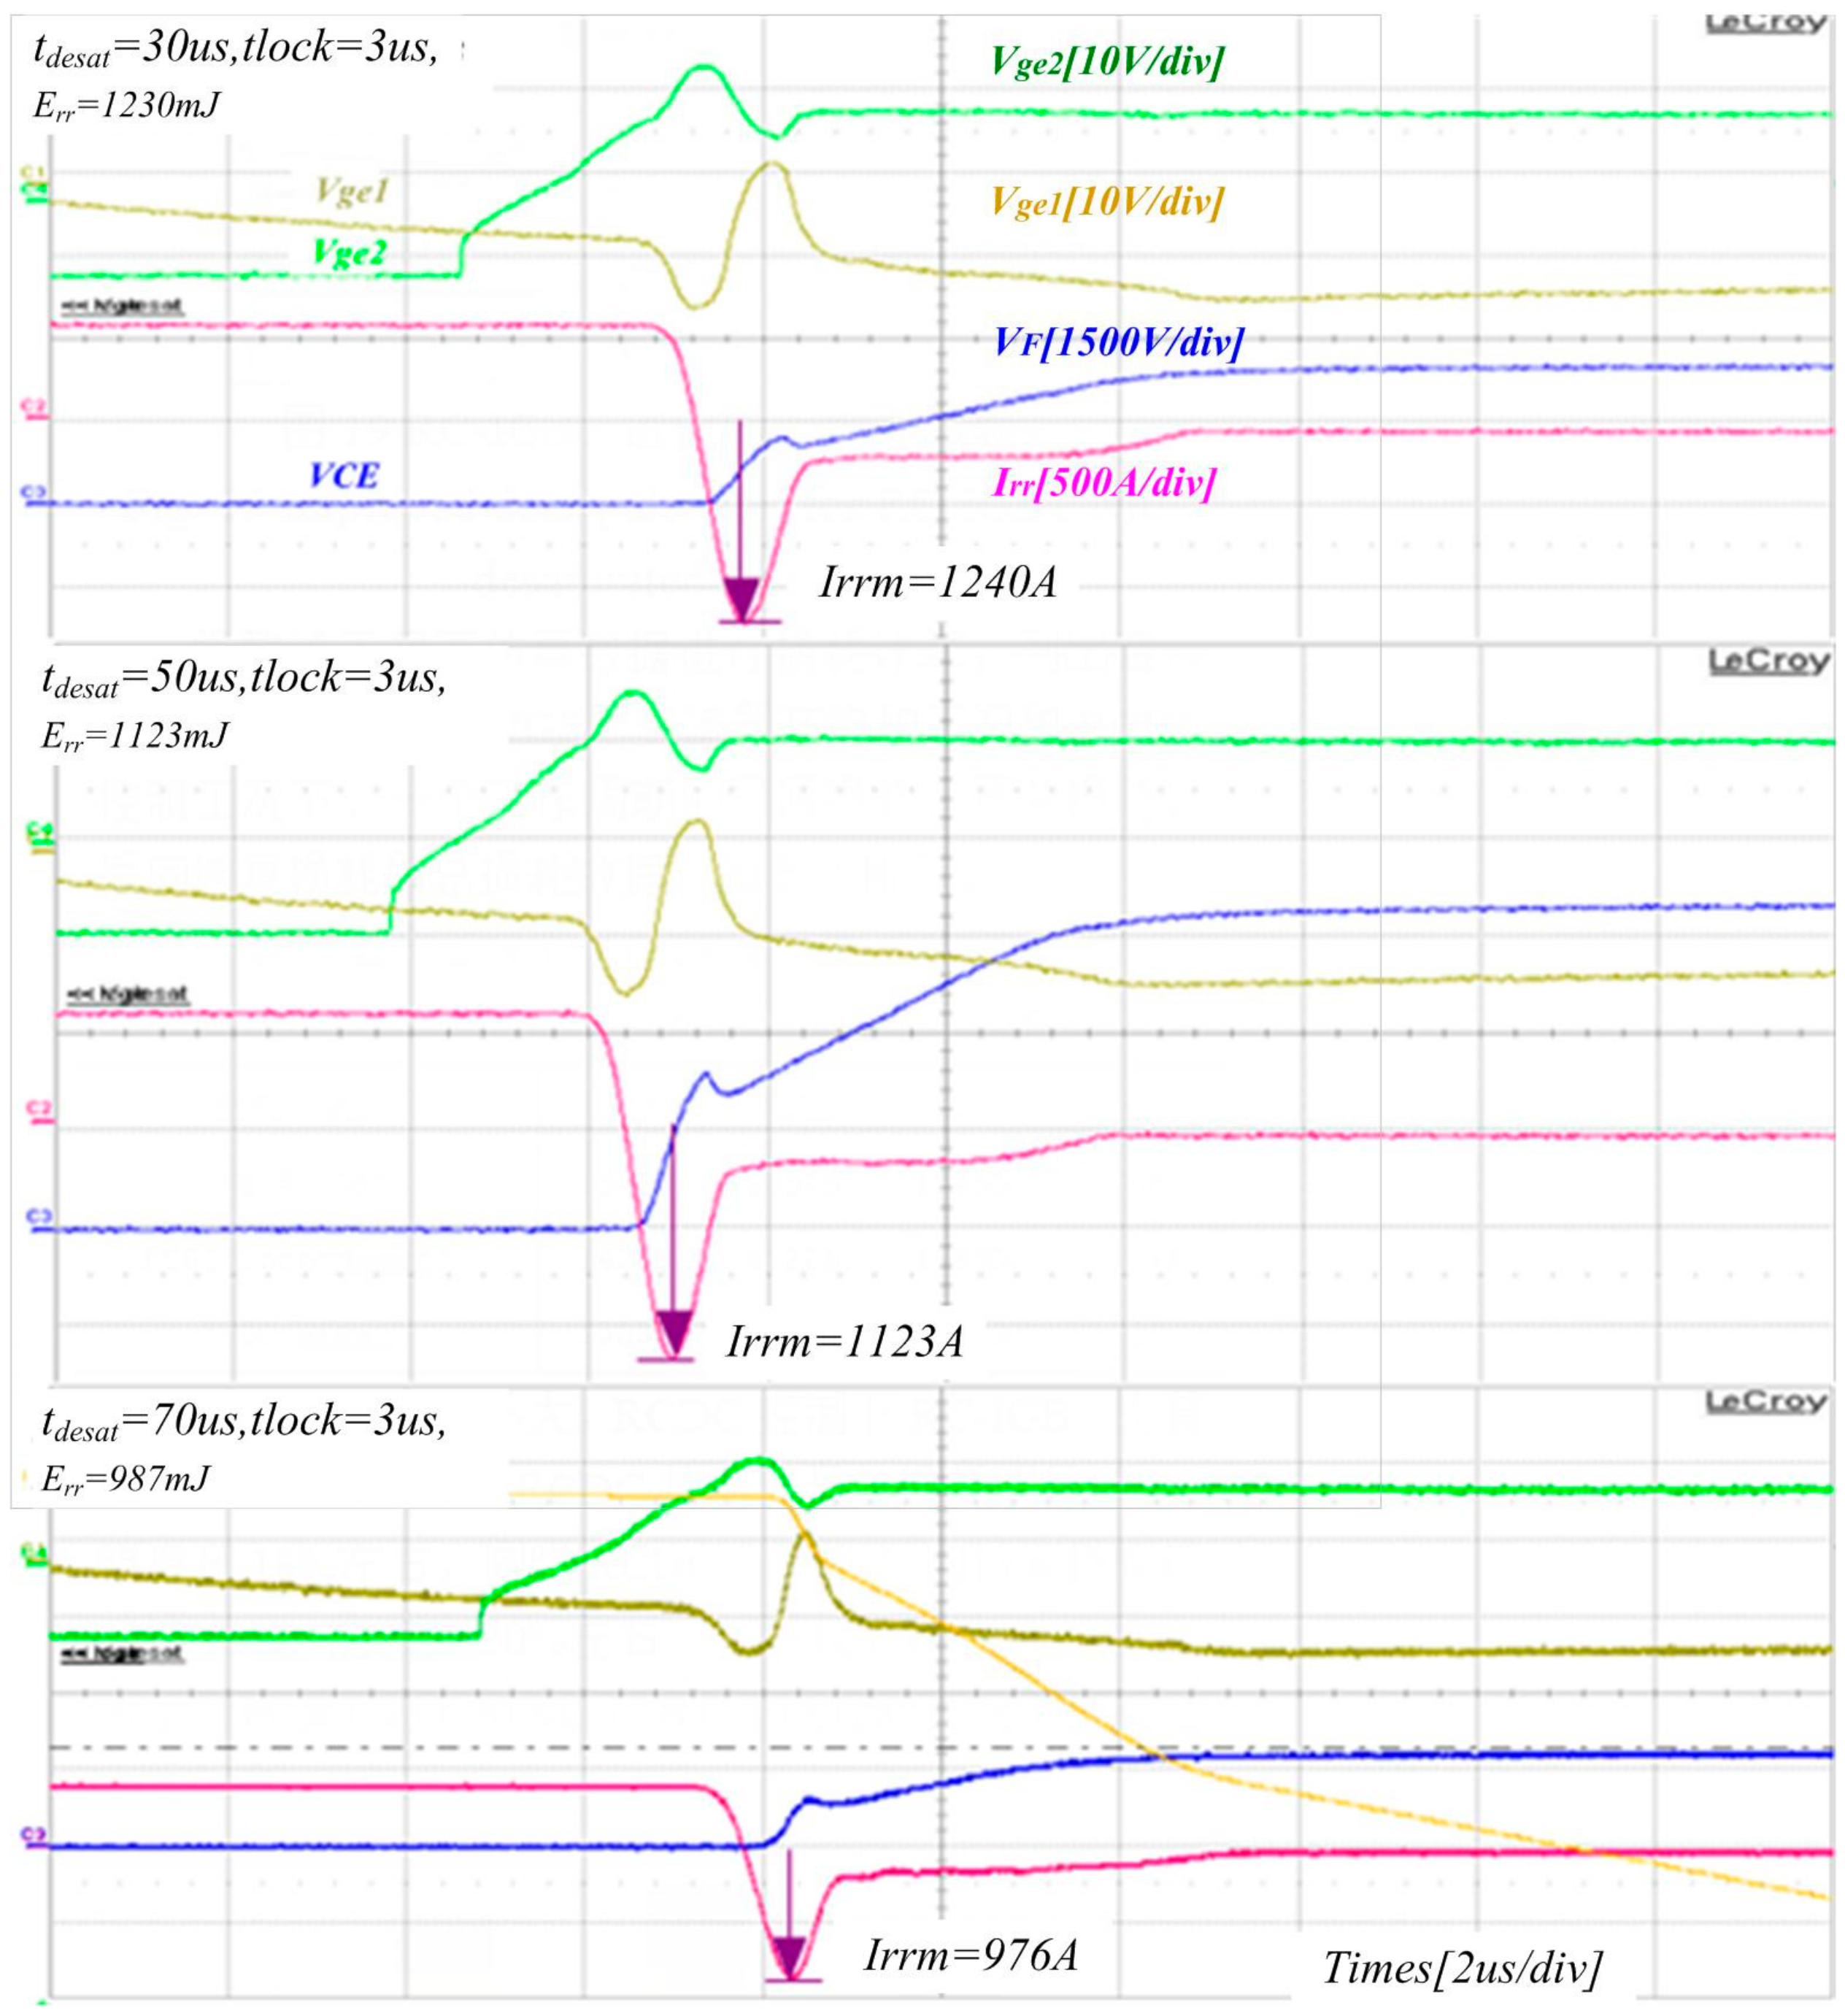
Figure 11 shows the diode reverse recovery waveforms corresponding to 30 μs, 50 μs, and 70 μs of the desaturation pulse time under the conditions of 3500 V/1000 A, and records the reverse recovery loss data. It can be seen that as the desaturation pulse time increases, the peak value of the reverse recovery current and the loss both decrease.
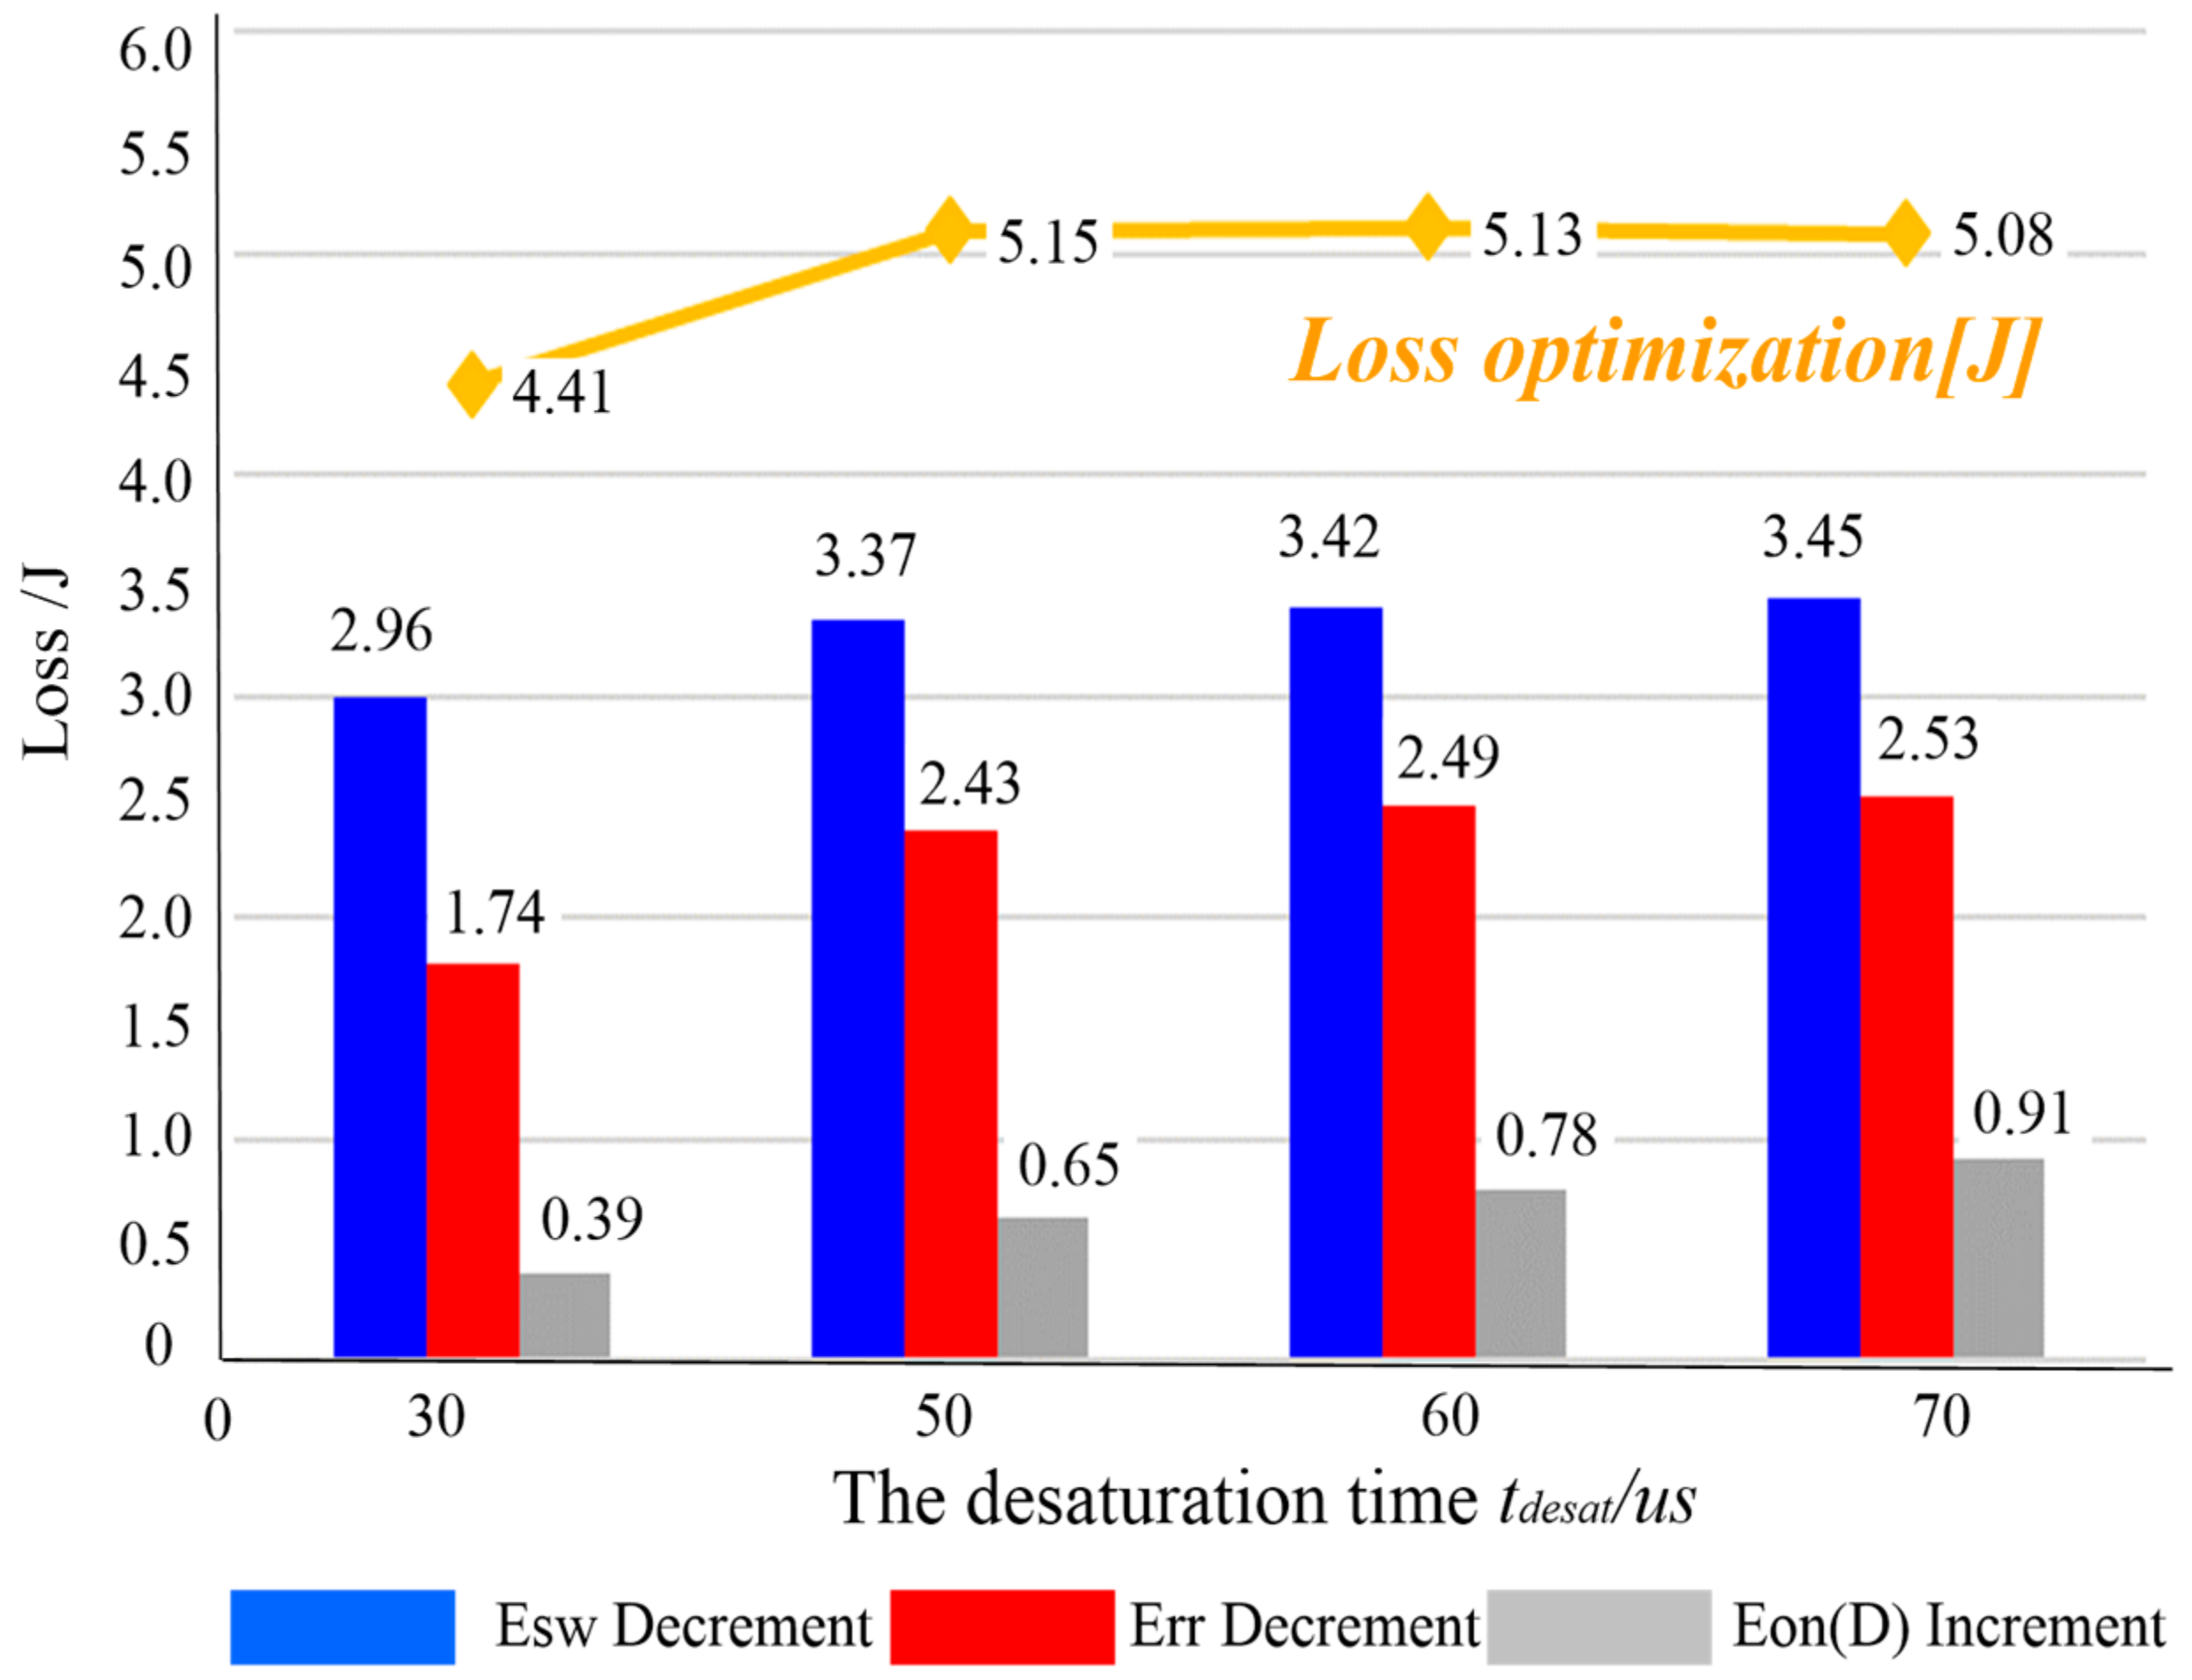
Figure 12 shows the variation of the switching loss Esw, the reverse recovery loss Err, and the diode conduction loss Eon(D) under 30 μs, 50 μs, and 70 μs of the desaturation pulse time with desaturation control compared to saturation control under the conditions of 3500 V/1000 A. It can be seen from the figure that, with the increase of the saturation time, the change of the RC-IGBT turn-on loss and the diode reverse recovery loss rise continuously. However, in the range of 60 μs–70 μs, the rising speed is slower, and the stable value is about 3.5 J. At the same time, the diode conduction loss continues to increase. Therefore, the optimal effect of net loss is about 50 μs according to the yellow line shown in the chart.
4.2. Operation Simulation and Losses Calculation of Single Phase PWM Rectifier with RC-IGBT
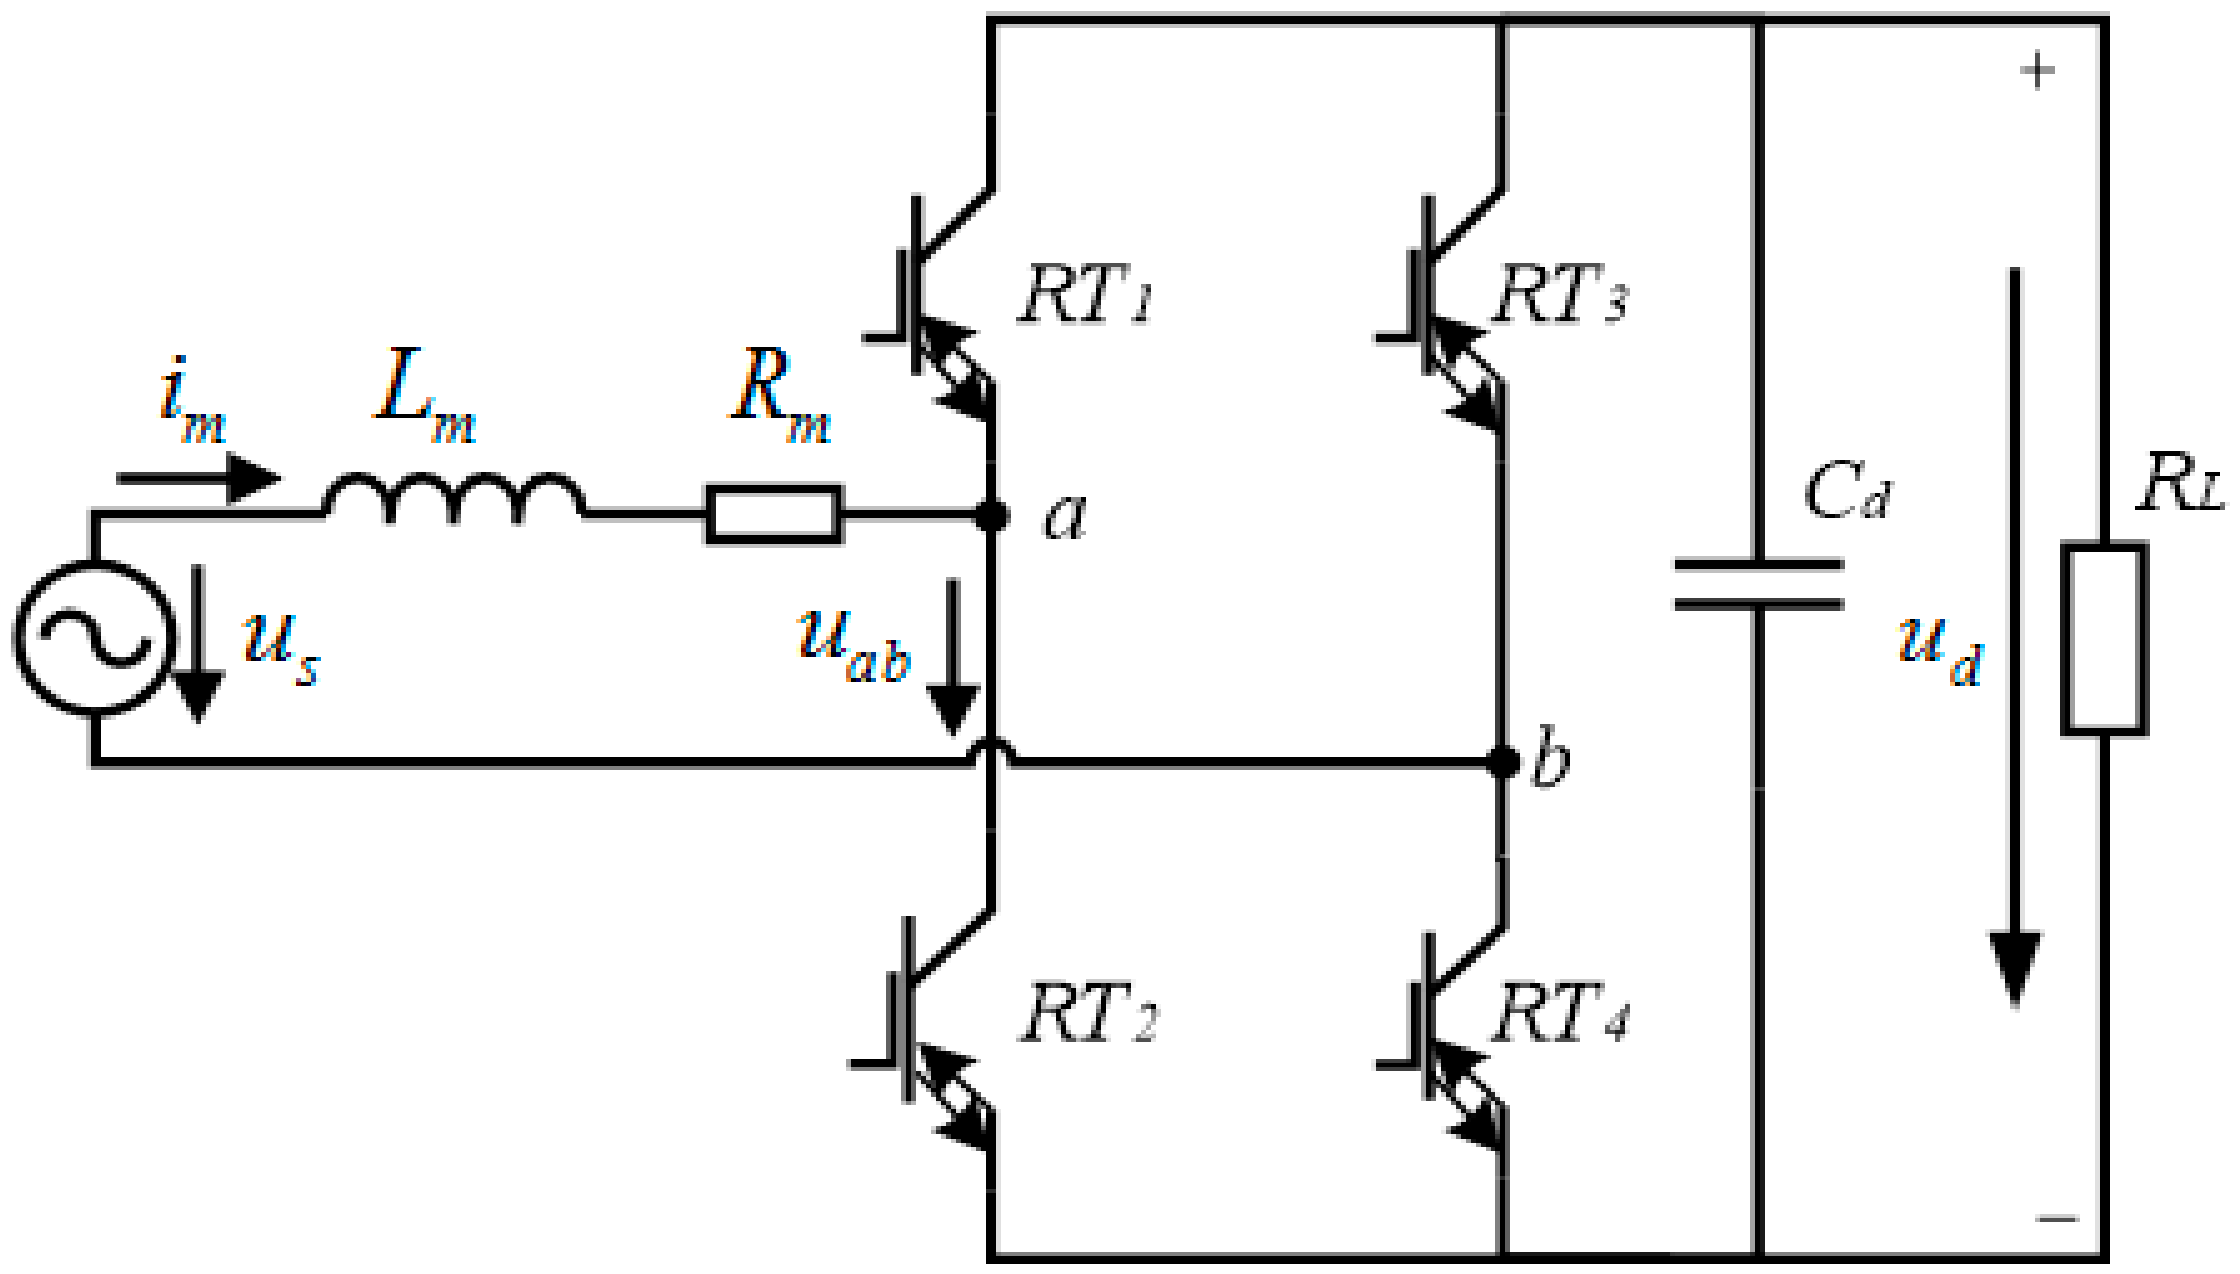
Based on the equivalent circuit model of the RC-IGBT, a single phase PWM rectifier model is built in Matlab/Simulink, as shown in Figure 13. The predictive current control with the desaturation pulse control of the gate is adopted to realize the rated operating conditions of the RC-IGBT PWM rectifier. The rated parameters for a single phase PWM rectifier are shown in Table 1.
Figure 14 shows the different driving pulses of single phase PWM rectifiers with an RC-IGBT and conventional IGBT. The pulses of ugx are PWM signals for the conventional IGBTs, and u’gx represents desaturated PWM pulses for the RC-IGBTs.
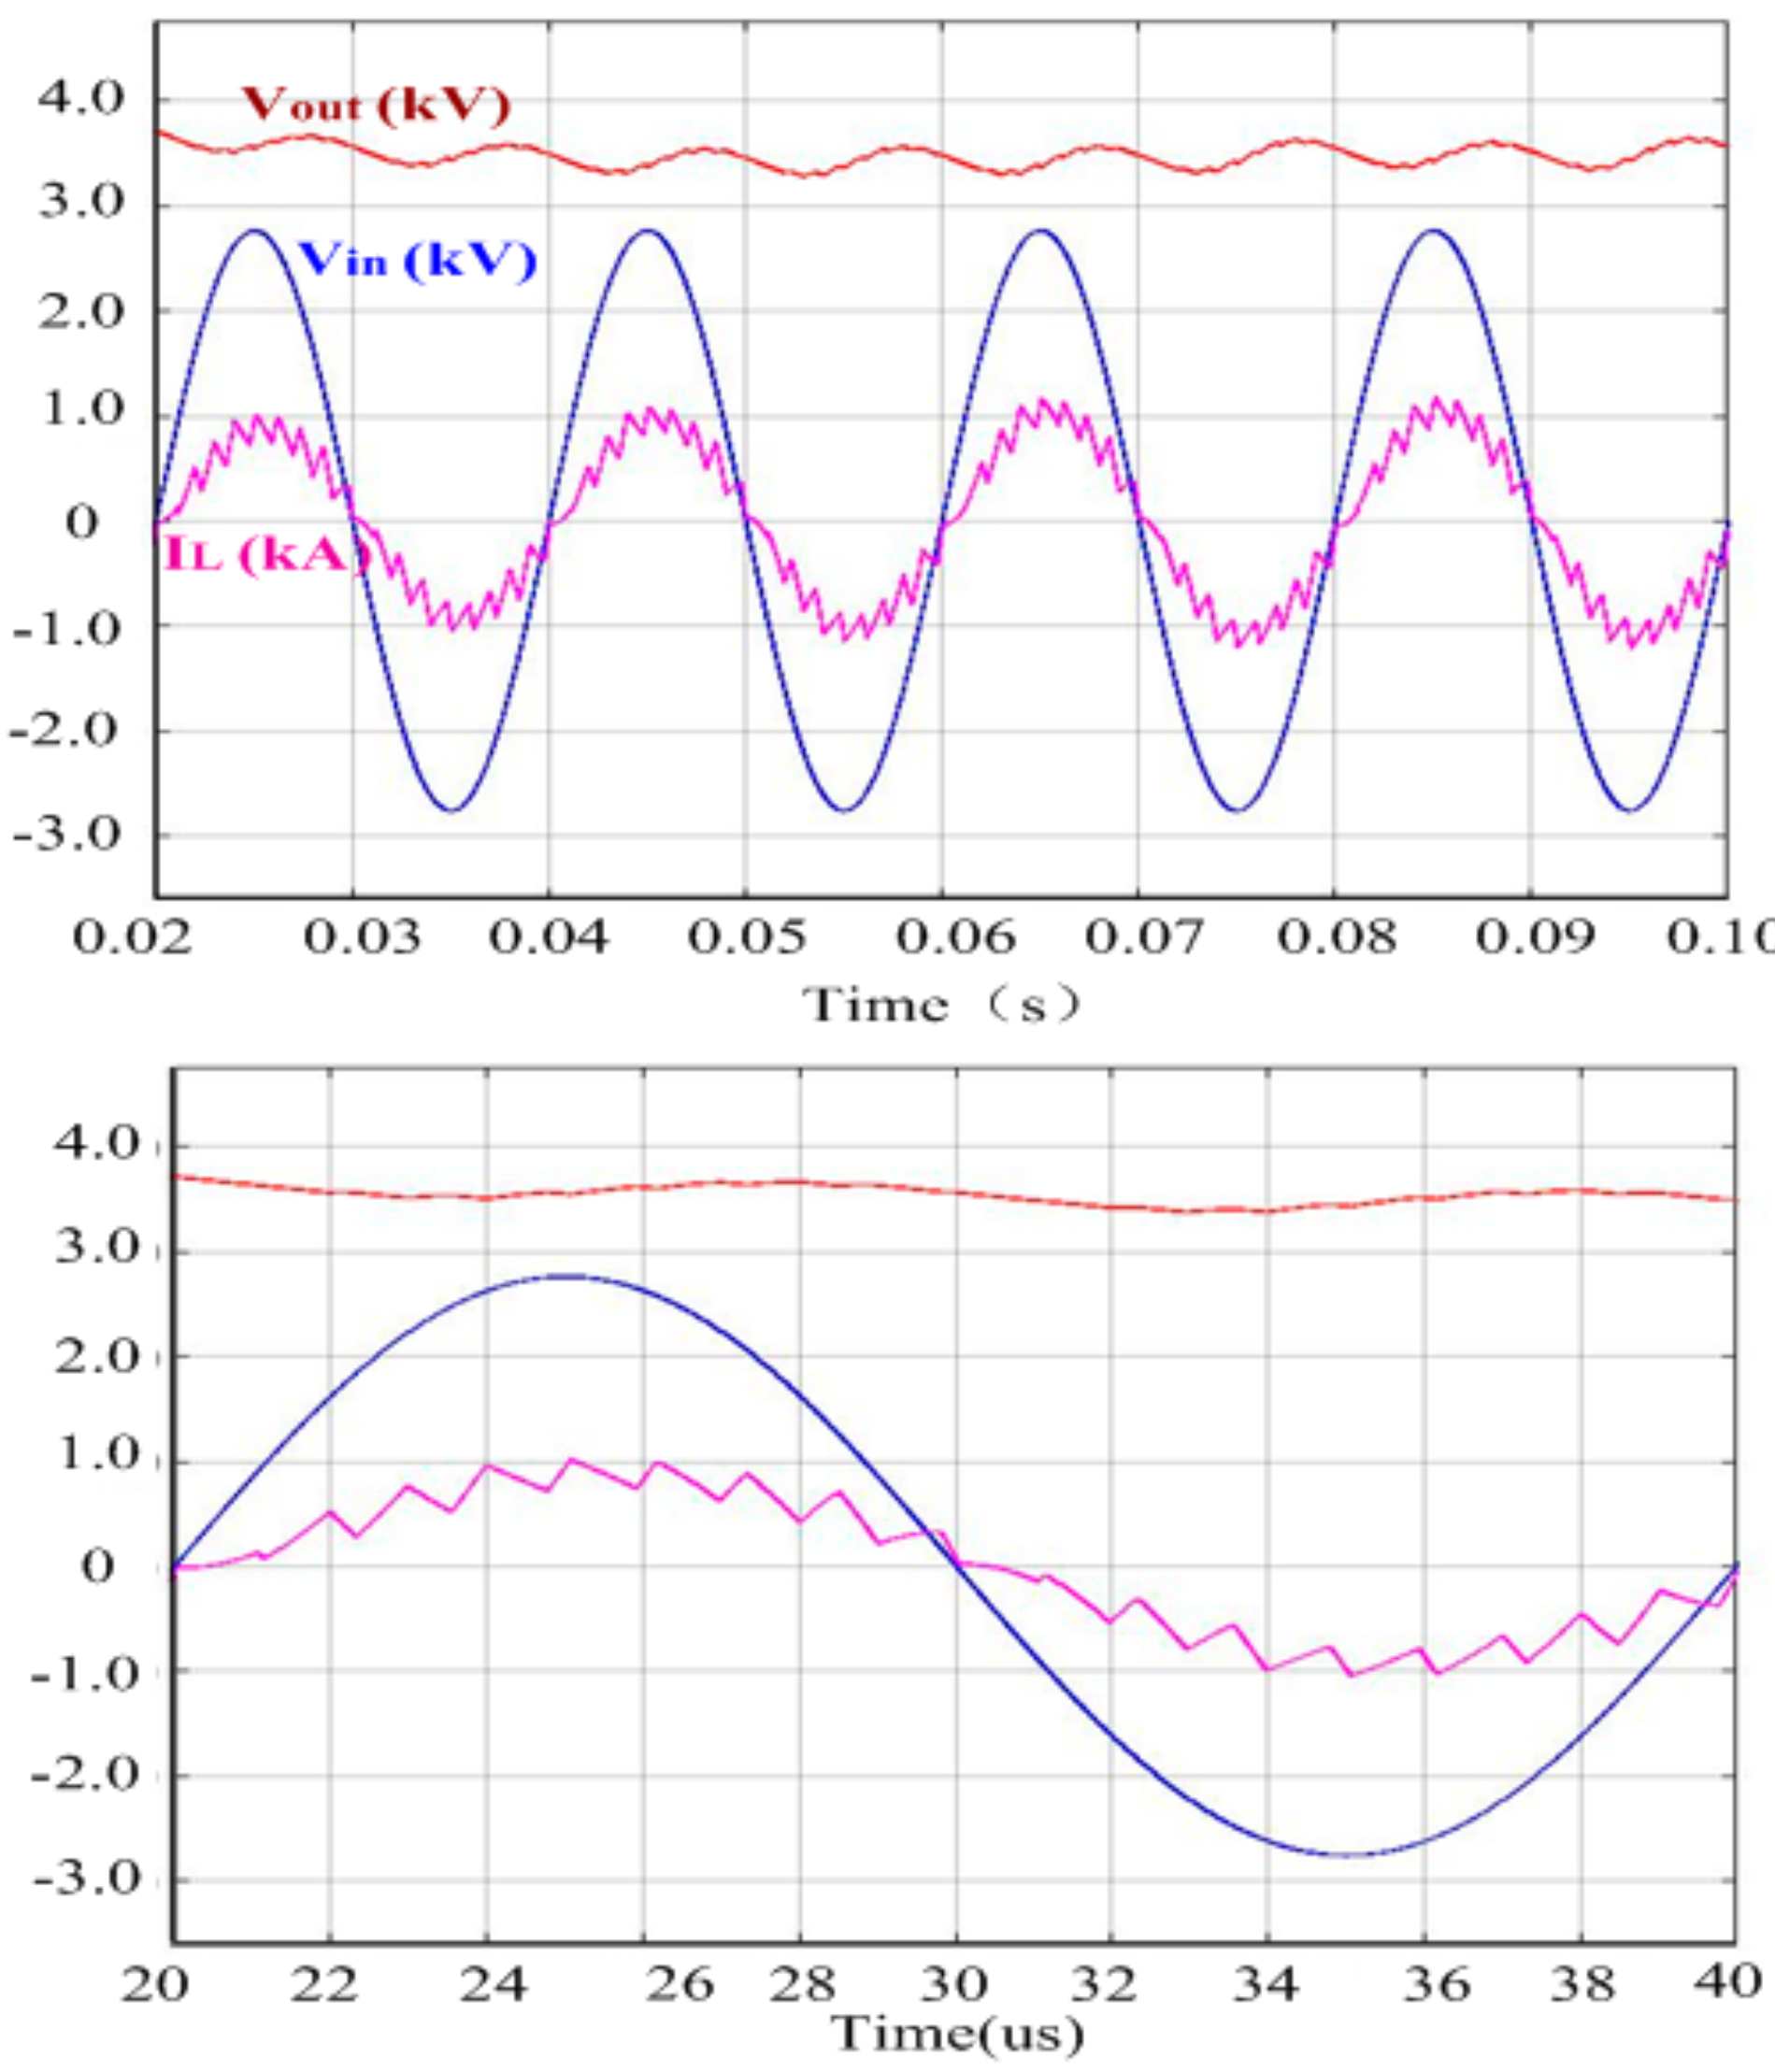
The waveforms of the input voltage Vin, output voltage Vout, and the inductor current IL are shown in Figure 15. Under rectifier working, the sinusoidal input current is good. The input voltage and current have nearly same phase, and the ripple of the output voltage is less than 4%.
According to the simulation data of the rectifier working status, the average value of the current in a switching period is calculated, and the losses of the switches are tested under the different average values of the current in the rated condition. Due to the same effect of switching devices, the loss of a PWM rectifier with a modulated wave period is also the total of the average loss of four switches [30]. Table 2 lists the conduction loss, switching loss, and total loss of the conventional IGBT converter and RC-IGBT converter under saturation control and RCDC control in one working cycle. We then drew a histogram based on Table 2, which is shown in Figure 16.
It can be seen that the conduction loss Econd of the devices exhibits little difference. Specifically, the conduction loss of the RC-IGBT in different operating conditions is lower than the conventional IGBT. The conduction loss of the RC-IGBT in RCDC control is higher than that in saturation control. The switching losses of the devices are quite different. The switching loss of the RC-IGBT in saturation control is larger than that of the conventional IGBT. Under the control of RCDC, the switching loss of the RC-IGBT is significantly reduced, by more than 13% compared with that in saturation control, and by 5% compared with that of the conventional IGBT. The total loss of the RC-IGBT in saturation control increased by 3% compared to that of the conventional IGBT. The total loss of the RC-IGBT in RCDC control is reduced by 5% compared to that of the conventional IGBT.
4.3. Operation Test of RC-IGBT Converter under RCDC Control
The experiment is based on the power scaling down platform, as shown in Figure 17. Two types of working condition of the RC-IGBT PWM rectifier in common control and desaturation pulse control are compared, and it is verified that the current predictive control strategy with the desaturation pulse can effectively realize control of the PWM rectifier with RC-IGBTs.
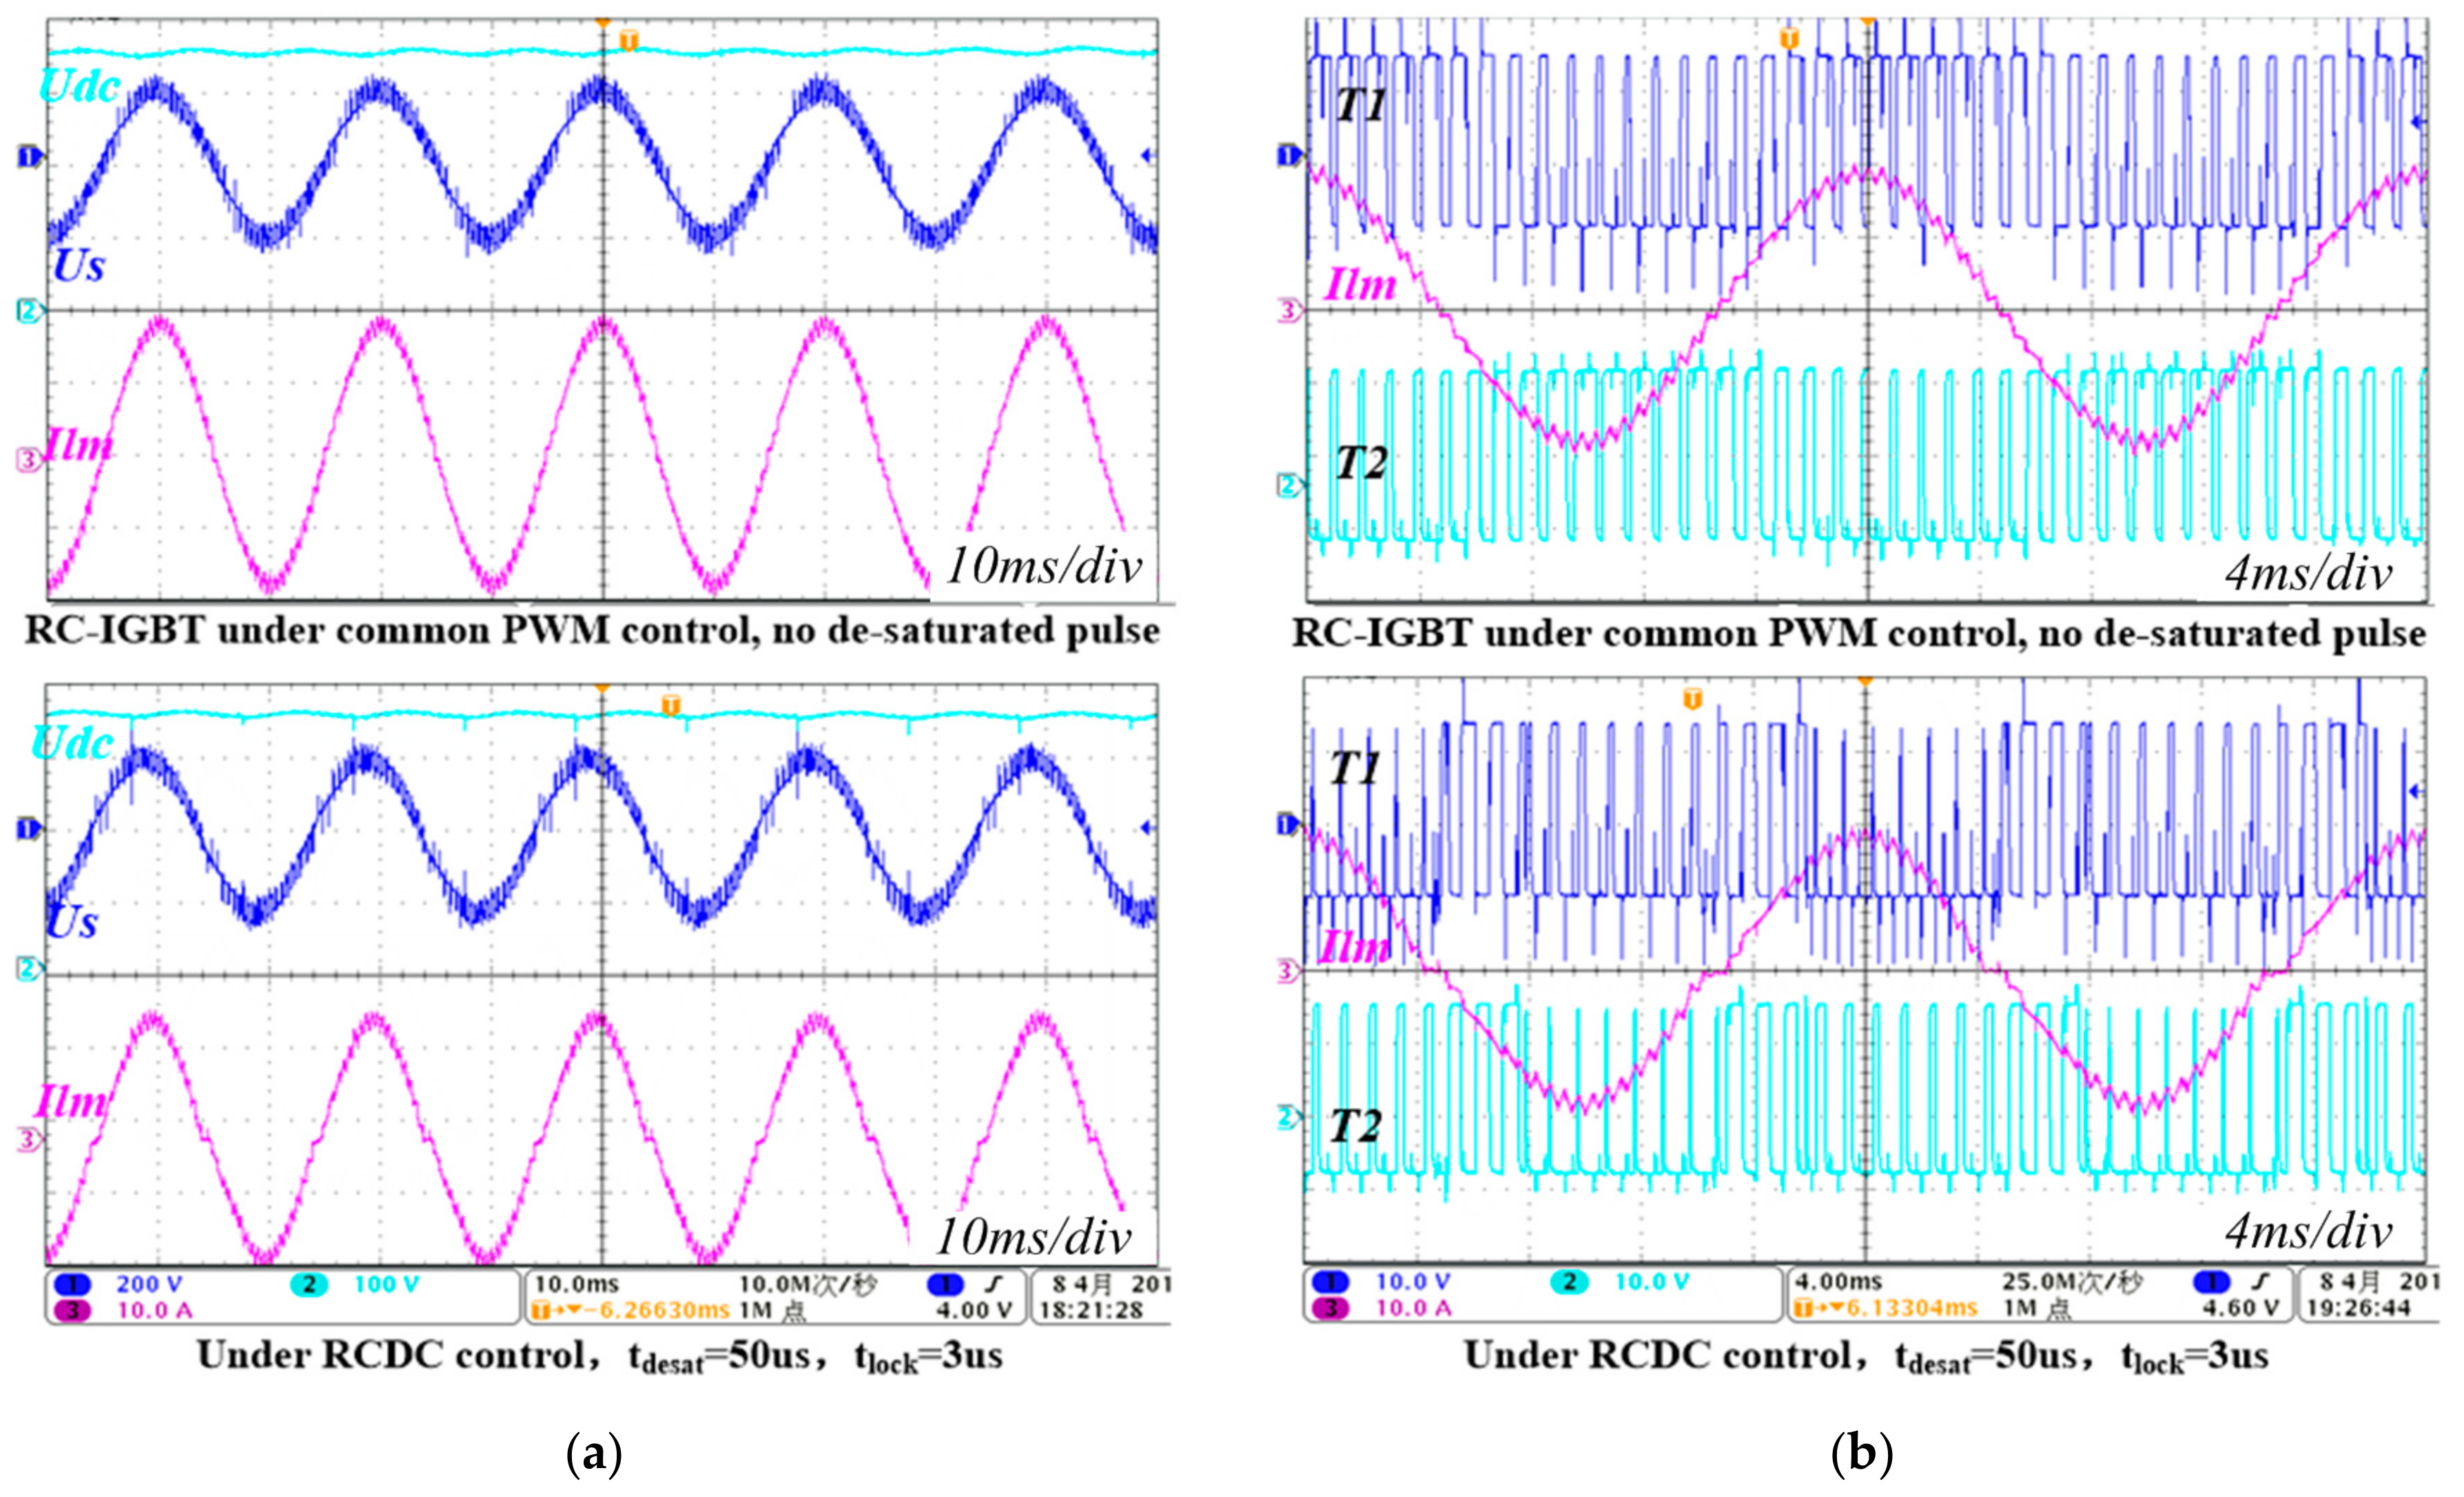
Figure 18 shows the waveforms of the input voltage, current, and gate pulse of the RC-IGBT rectifier under two types of control strategies. In Figure 18a, the input voltage is 195 V, the line frequency is 50 Hz, the switching frequency is 1000 Hz, and the output DC voltage is 350 V.
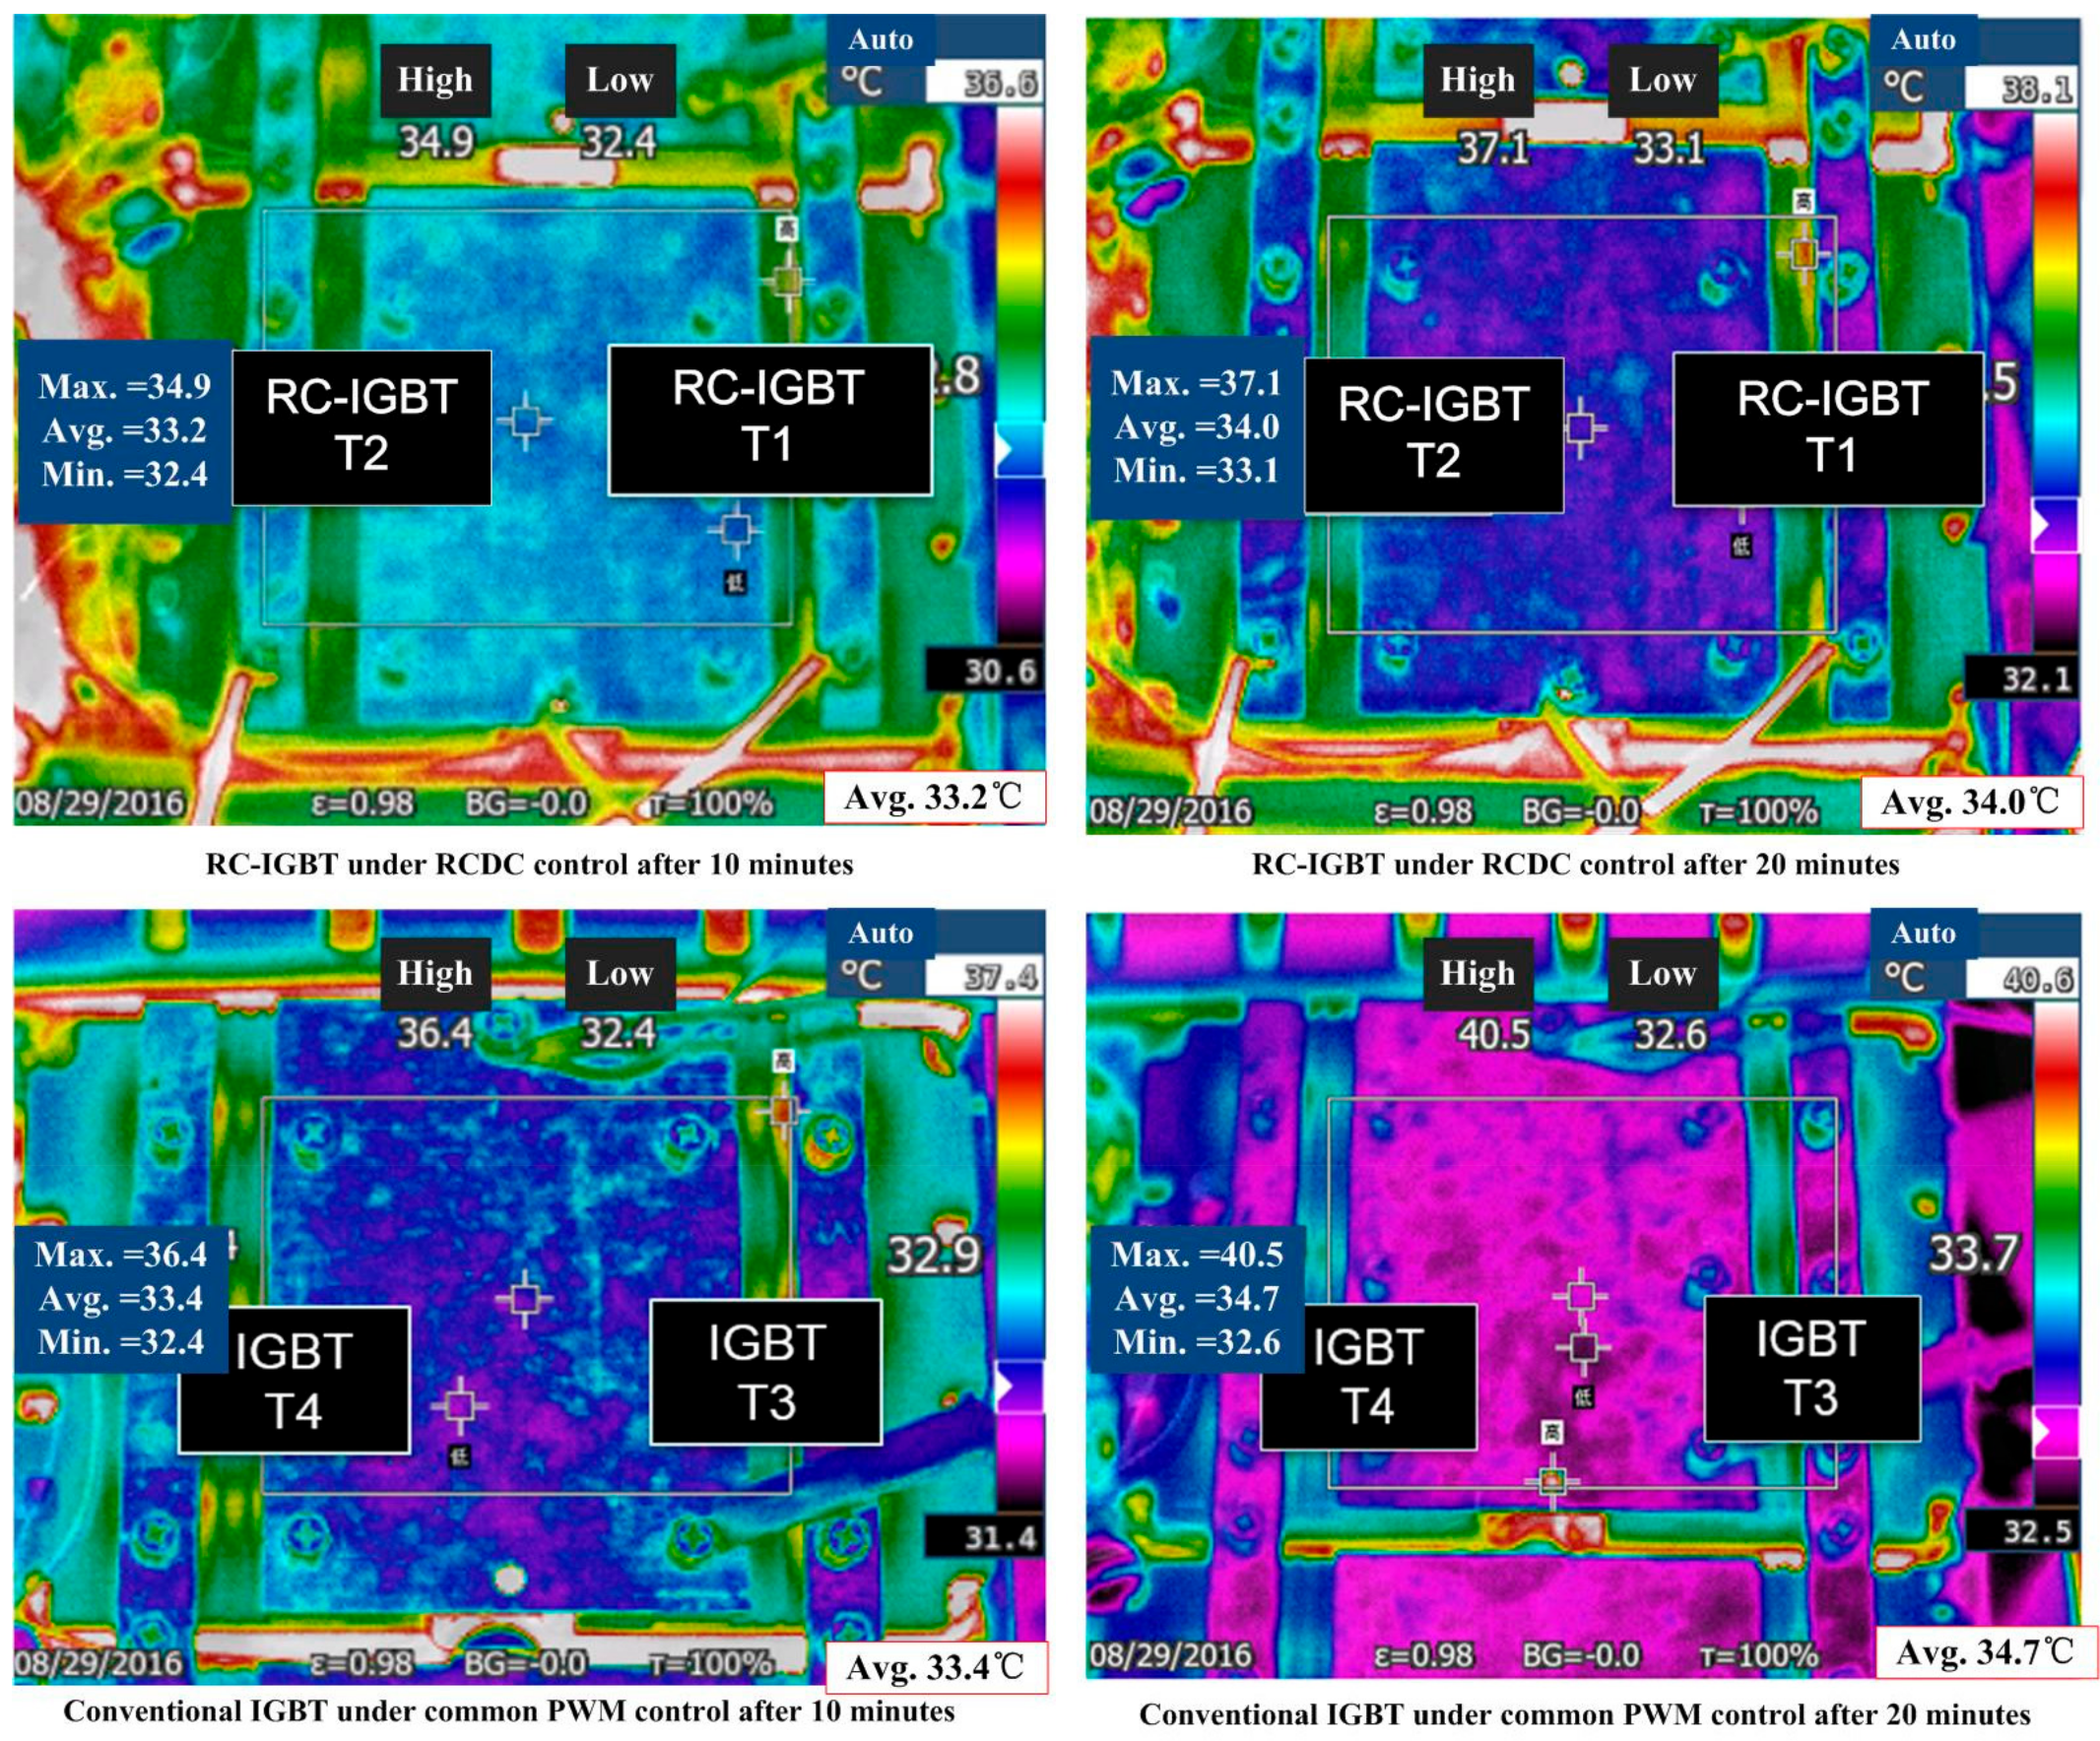
The temperature rise test is carried out on the scaled down power platform, as shown in Figure 19. The two upper thermal images correspond to the RC-IGBT desaturation control for the working conditions of 10 min and 20 min. The module reference temperature for 10 min is 33.2 °C and that of 20 min is 34 °C. The two lower thermal images correspond to the conventional IGBT with PWM control for the working conditions of 10 min and 20 min. The module reference temperature for 10 min is 33.4 °C and that of 20 min is 34.7 °C. It can be found that, in the same time, the temperature of RC-IGBT is lower than that of the conventional IGBT. After 10 min, the reference temperature of the RC-IGBT module rises by 0.8 °C, and that of the conventional IGBT rises by 1.3 °C.
5. Conclusions
In this paper, the loss characteristics of a 6.5 kV RC-IGBT are studied; the loss variation and operating characteristics of the RC-IGBT are compared and analyzed. The following conclusions are obtained:
- (1)
- The desaturation gate pulse control for the RC-IGBT can alter the proportion of diode reverse recovery loss and conduction loss. The total loss of the RC-IGBT is affected by the pulse amplitude, pulse duration, and pulse level mode of the gate desaturation pulse. In the practical application of +15 V, −10 V two level driving mode, the width of the desaturation pulse is set to 50 μs, which is helpful to reduce the total loss.
- (2)
- The predictive current control strategy with the desaturation gate pulse control method may be adopted to achieve the rated operating conditions of the single phase PWM rectifier with RC-IGBTs. The scheme is able to ensure the stable operation of the converter under the condition of reducing the total loss.
- (3)
- The dual-pulse test with the desaturation pulse control is carried out, and the different current conditions of switching loss and reverse recovery loss are tested. Accordingly, the loss of the average loss of one cycle is 3% lower than that of the conventional IGBT, and 8% lower than that of the RC-IGBT without desaturation pulse control (in common saturation pulse control).
- (4)
- The contrast experiment is carried out on the scaled down power platform. The PWM control with a desaturation gate pulse for the RC-IGBT is proven to be beneficial to reduce the loss, through a comparison of the temperature rise.
Acknowledgments
The research is supported by “the Fundamental Research Funds for the Central Universities (2017JBM061)” In this paper, the samples and test data were recorded with the strong support of Toshiba Japan and Infineon Beijing Company. We wish to express our heartfelt thanks to them.
Author Contributions
X.H. and T.Q.Z. conceived and designed the experiments; C.L. and D.C. performed the experiments; X.H. and X.Y. analyzed the data; T.Q.Z. and X.Y. contributed materials and analysis tools; X.H. wrote the paper.
Conflicts of Interest
The authors declare no conflict of interest.
References
- Fan, S.F.; Xiong, J.; Zhang, K.; He, L.Q.; Zhao, W.C. A decoupling control scheme of high power four-quadrant converters for traction. Proc. CSEE 2012, 32, 63–70. [Google Scholar]
- Chen, Z.; Wang, Z.H.; Chen, M. Shunt active power filter based on new four-quadrant switch cell. Trans. China Electrotech. Soc. 2015, 30, 147–154. [Google Scholar]
- Hao, Q.; Ge, X.L.; Song, W.S.; Feng, X.Y. Microsecond hardware-in-the-loop real-time simulation of electrical traction drive system. Trans. China Electrotech. Soc. 2016, 31, 189–198. [Google Scholar]
- Zhu, Q.Y.; Wang, J.Z.; Liu, A.L. Research on performance comparison and optimization of traction converter for CRH1 and CRH2 EMU. Comput. Eng. Appl. 2013, 49, 255–261. [Google Scholar]
- Qin, F.F.; Li, H.; Li, P. Converter power circuit comparison of HXD locomotives. Electr. Drive Locomot. 2012, 5, 43–46. [Google Scholar]
- Fujii, T.; Yoshikawa, K.; Koga, T. 4.5 kV-2000 A power pack IGBT (ultra-high power flat-packaged PT type RC-IGBT). In Proceedings of the 12th International Symposium on Power Semiconductor Devices & IC’s (ISPSD 2000), Toulouse, France, 22–25 May 2000; pp. 33–36. [Google Scholar]
- Werber, D.; Gutt, T.; Komarnitskyy, V.; Hunger, T.; Domes, D. 6.5 kV RCDC for increased power density in IGBT modules. In Proceedings of the 26th International Symposium on Power Semiconductor Devices & IC’s (ISPSD), Waikoloa, HI, USA, 15–19 June 2014; pp. 35–38. [Google Scholar]
- ABB Datasheet: 2000A, 3300V Hipak2 BiGT Module; ABB Switzerland Ltd. Semiconductors: Lenzburg, Switzerland, 2015.
- Werber, D.; Hunger, T.; Wissen, M.; Stemmer, B. A 1000 A 6.5 kV power module enable by reverse-conducting trench-IGBT-technology. In Proceedings of the PCIM Asia 2016, Shanghai, China, 28–30 June 2016; pp. 269–276. [Google Scholar]
- Won, J.; Koo, J.G.; Rhee, T.; Oh, H.S.; Lee, J.H. Reverse Conducting IGBT using MEMS technology on the wafer back side. ETRI J. 2013, 4, 603–609. [Google Scholar] [CrossRef]
- Wang, Y.Z.; Shibata, S. New transfer mold type SLIMDIP with RC-IGBT and high precision short circuit protection function. In Proceedings of the PCIM Asia 2016, Shanghai, China, 28–30 June 2016; pp. 285–291. [Google Scholar]
- Yoshida, T.; Takahashi, T.; Suzuki, K.; Tarutani, M. The second-generation 600 V RC-IGBT with optimized FWD. In Proceedings of the 2016 28th ISPSD, Prague, Czech Republic, 12–16 June 2016; pp. 159–162. [Google Scholar]
- Infineon Datasheet: Reverse Conducting Series IKW50N65WR5; Infineon Technologies AG: Munchen, Germany, 2015.
- Infineon Datasheet: FZ750R65KE3 Technical Information; Infineon Technologies K.K: Tokyo, Japan, 2015.
- Infineon Datasheet: FZ1000R65KR3 Technical Information; Infineon Technologies: Munich, Germany, 2014.
- Storasta, L.; Kopta, A.; Rahimo, M.; Papadopoulos, C.; Geissmann, S. The next generation 6500 V BiGT HiPak modules. In Proceedings of the PCIM Europe 2013, Nuremberg, Germany, 14–16 May 2013; pp. 1–8. [Google Scholar]
- Li, X.P.; Liu, J.; Zhao, G. Development and application of reverse conducting IGBT in smart grid. Smart Grid 2017, 5, 1–8. [Google Scholar]
- Chen, W.Z. Theoretical Model and Novel Structures for RC-IGBT. Ph.D. Thesis, University of Electronic Science and Technology of China, Chengdu, China, 2014. [Google Scholar]
- Huang, X.J.; You, X.J.; Zheng, Q.L. Traction converter with desaturated diode control for reverse conducting IGBT. Trans. China Electrotech. Soc. 2016, 31, 58–66. [Google Scholar]
- Zhang, W.L.; Zhu, Y.J.; Lu, S.J.; Tian, X.L. The negative differential resistance characteristics of an RC-IGBT and its equivalent circuit model. J. Semicond. 2014, 35, 1–5. [Google Scholar] [CrossRef]
- Li, X.P.; Zhao, G.; Liu, J.; Gao, M.C.; Wang, Y.H.; Jin, R. Simulation of 3300 V reverse conducting IGBT. Res. Prog. SSE 2016, 36, 406–410. [Google Scholar]
- Storasta, L.; Kopta, A.; Rahimo, M. A comparison of charge dynamics in the Reverse-Conducting RC IGBT and Bi-mode Insulated Gate Transistor BiGT. In Proceedings of the 22nd ISPSD, Hiroshima, Japan, 6–10 June 2010; pp. 391–394. [Google Scholar]
- Hermann, R.; Krafft, E.; Marz, A. Reverse Conducting IGBTs A new IGBT technology setting new benchmarks in traction converters. In Proceedings of the European Conference on Power Electronics and Applications (EPE), Lille, France, 2–9 September 2013; pp. 1–8. [Google Scholar]
- Domes, D. Control Method for a Reverse Conducting IGBT. In Proceedings of the PCIM Europe 2015, Nuremberg, Germany, 19–20 May 2015; pp. 147–154. [Google Scholar]
- Riccio, M.; Tedesco, M.; Mirone, P.; De Falco, G.; Maresca, L. An electro-thermal SPICE model for RC-IGBT: Simulation and experimental validation. In Proceedings of the 2016 28th ISPSD, Prague, Czech Republic, 12–16 June 2016; pp. 343–346. [Google Scholar]
- International Rectifier Products Notes: IGBT Reverse Conduction Characteristics Hard-Switching and Soft-Switching; International Rectifier Energy Saving Products BU: El Segundo, CA, USA, 2013.
- Jahdi, S.; Olayiwola, A.; Mawby, P. Modeling of turn-off transient energy in IGBT controlled silicon Pin diodes. In Proceedings of the EPE 2014- ECCE Europe, Lappeenranta, Finland, 26–28 August 2014; pp. 1–9. [Google Scholar]
- Infineon Application Note: Reverse Conducting IGBT for Drives RC-Drives Cost-Optimized IGBT for Consumer Drive Application; Infineon Technologies AG: Munich, Germany, 2010.
- Wiencke, H.; Lexow, D.; Tran, T. Plasma dynamic of RC-IGBT during desaturation pulses. In Proceedings of the 18th European Conference on Power Electronics and Applications (EPE 2016), Karlsruhe, Germany, 5–9 September 2016; pp. 1–8. [Google Scholar]
- Meng, Z.; Wang, Y.F.; Yang, L.; Li, W. Analysis of power loss and improved simulation method of a high frequency dual-buck full-bridge inverter. Energies 2017, 10, 311. [Google Scholar] [CrossRef]
Figure 1.
RC-IGBT: (a) The internal structure; (b) RC-IGBT in kind and its equivalent circuit.
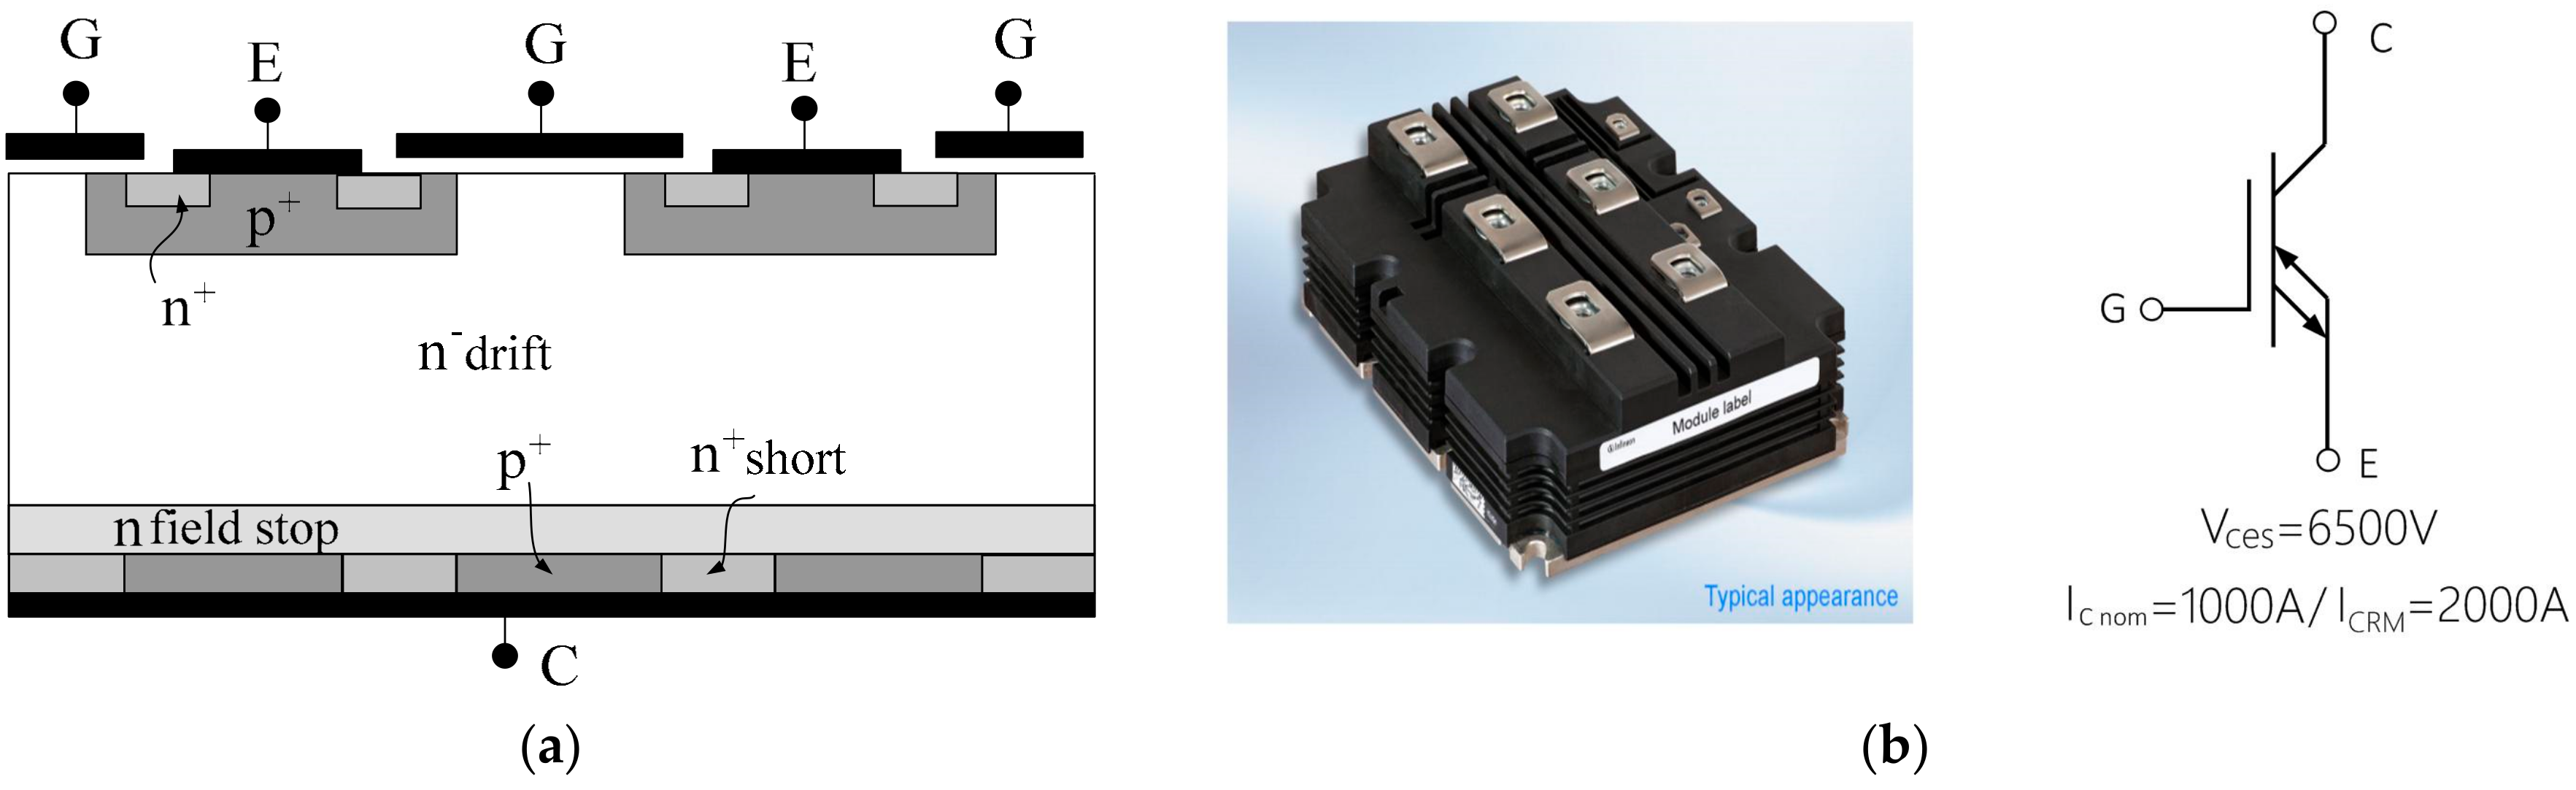
Figure 2.
Waveforms of the IGBT switching simulation.

Figure 3.
Waveforms of the RC-IGBT internal diode switching simulation.

Figure 4.
The internal charge dynamics of the RC-IGBT internal diode, whether the gate voltage is on or not.
Figure 4.
The internal charge dynamics of the RC-IGBT internal diode, whether the gate voltage is on or not.

Figure 5.
The influence of VGE on the conduction and reverse recovery of the body-diode [9].
Figure 5.
The influence of VGE on the conduction and reverse recovery of the body-diode [9].

Figure 6.
The influence of gate desaturation control on the reverse recovery current of the RC-IGBT body-diode.
Figure 6.
The influence of gate desaturation control on the reverse recovery current of the RC-IGBT body-diode.
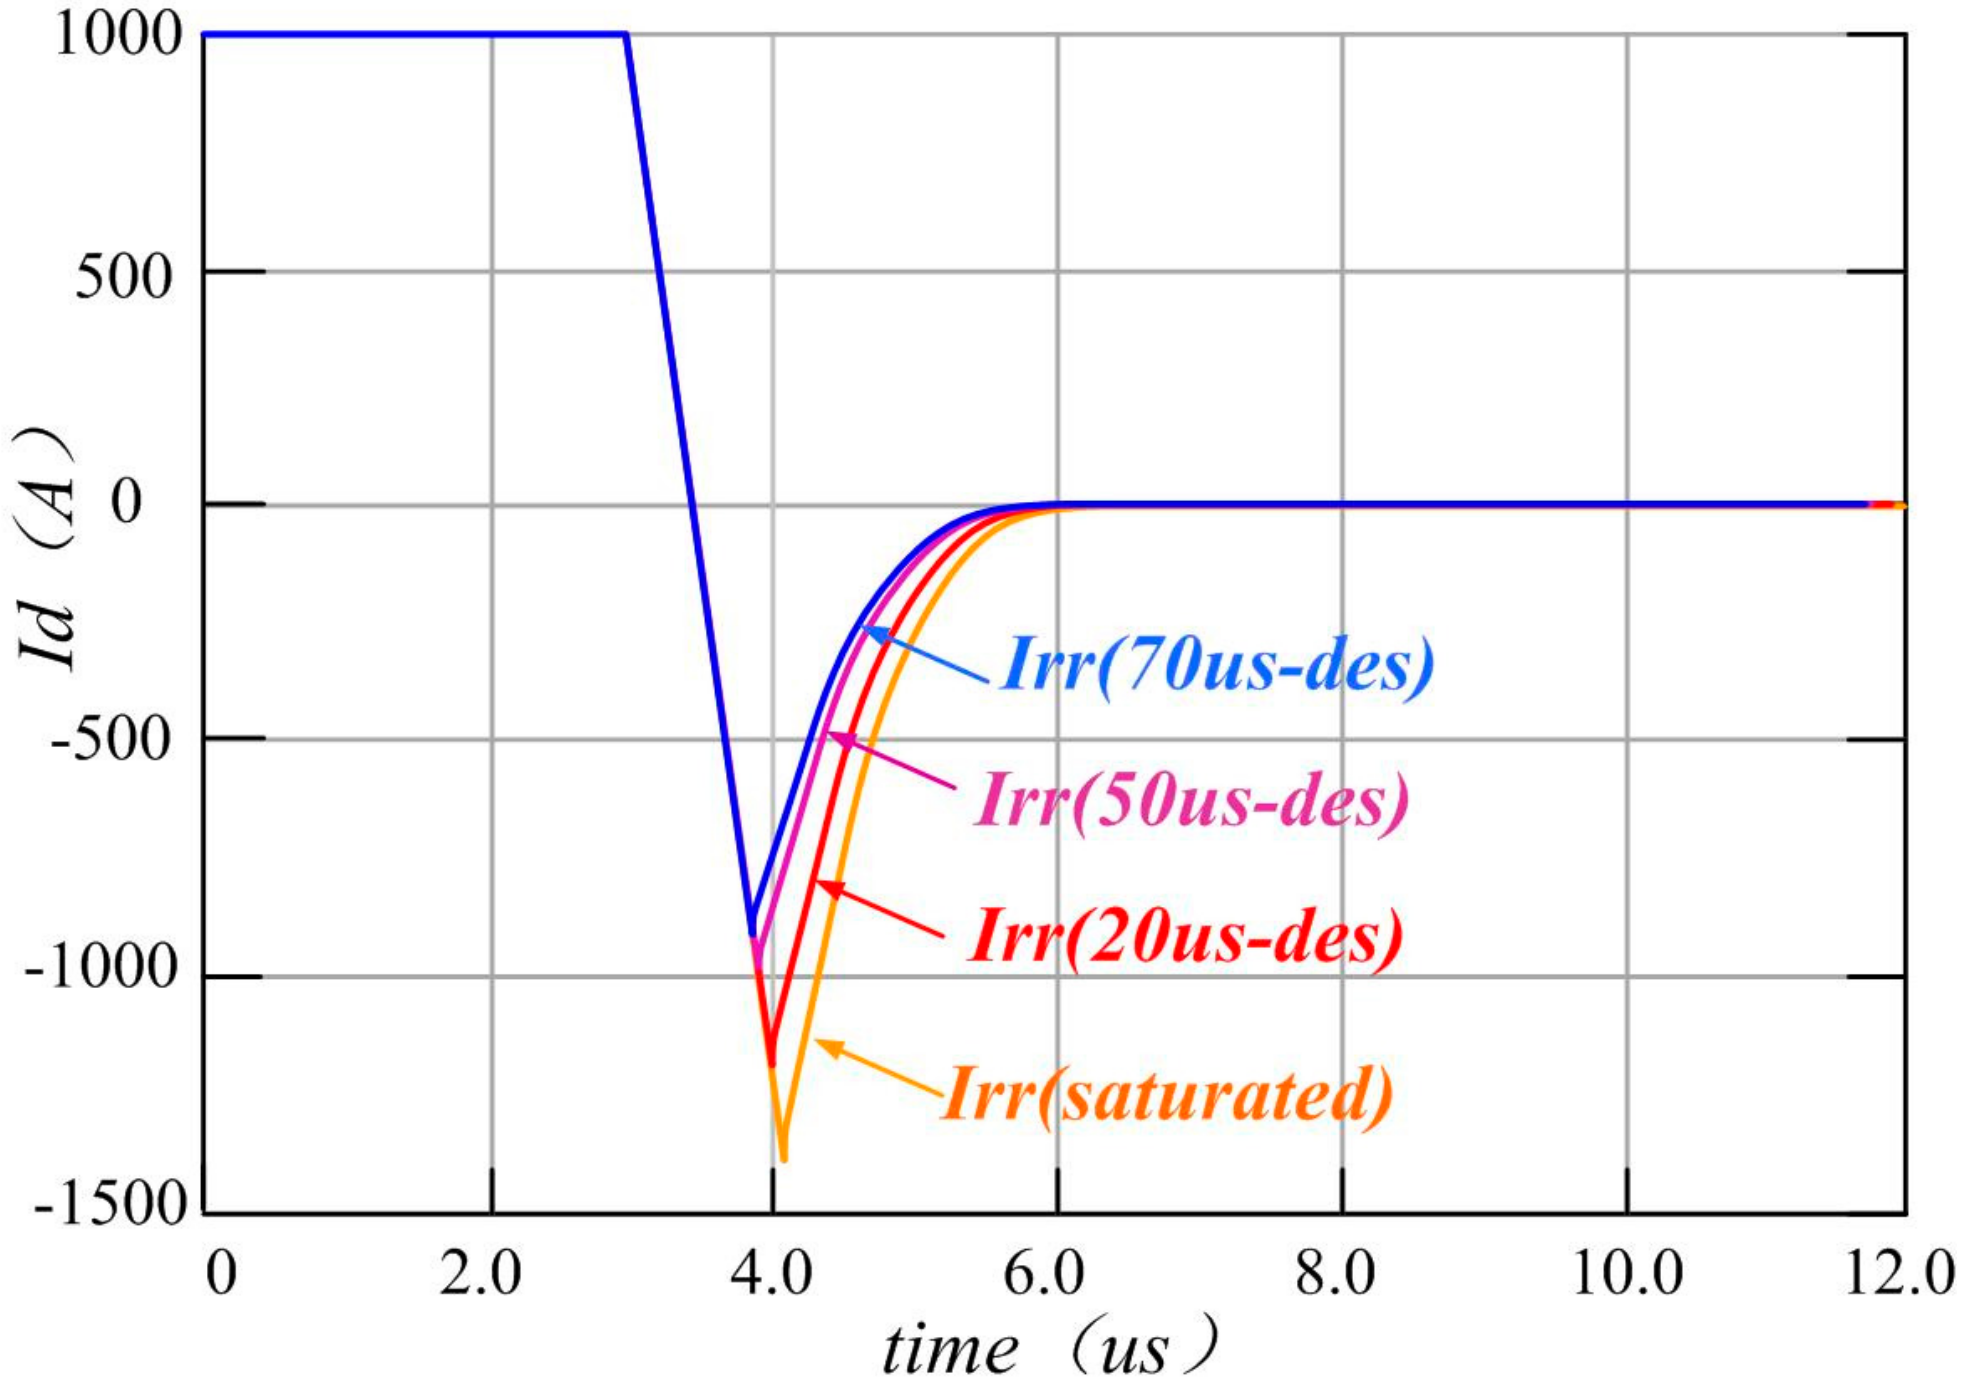
Figure 7.
The diagram of the turn-on and reverse recovery loss calculation of the RC-IGBT.

Figure 8.
Diagram of the relation between optimal loss and the desaturation time at 3500 V/1000 A.

Figure 9.
Diagram of the relation between optimal loss and the desaturation pulse time at different situations.
Figure 9.
Diagram of the relation between optimal loss and the desaturation pulse time at different situations.
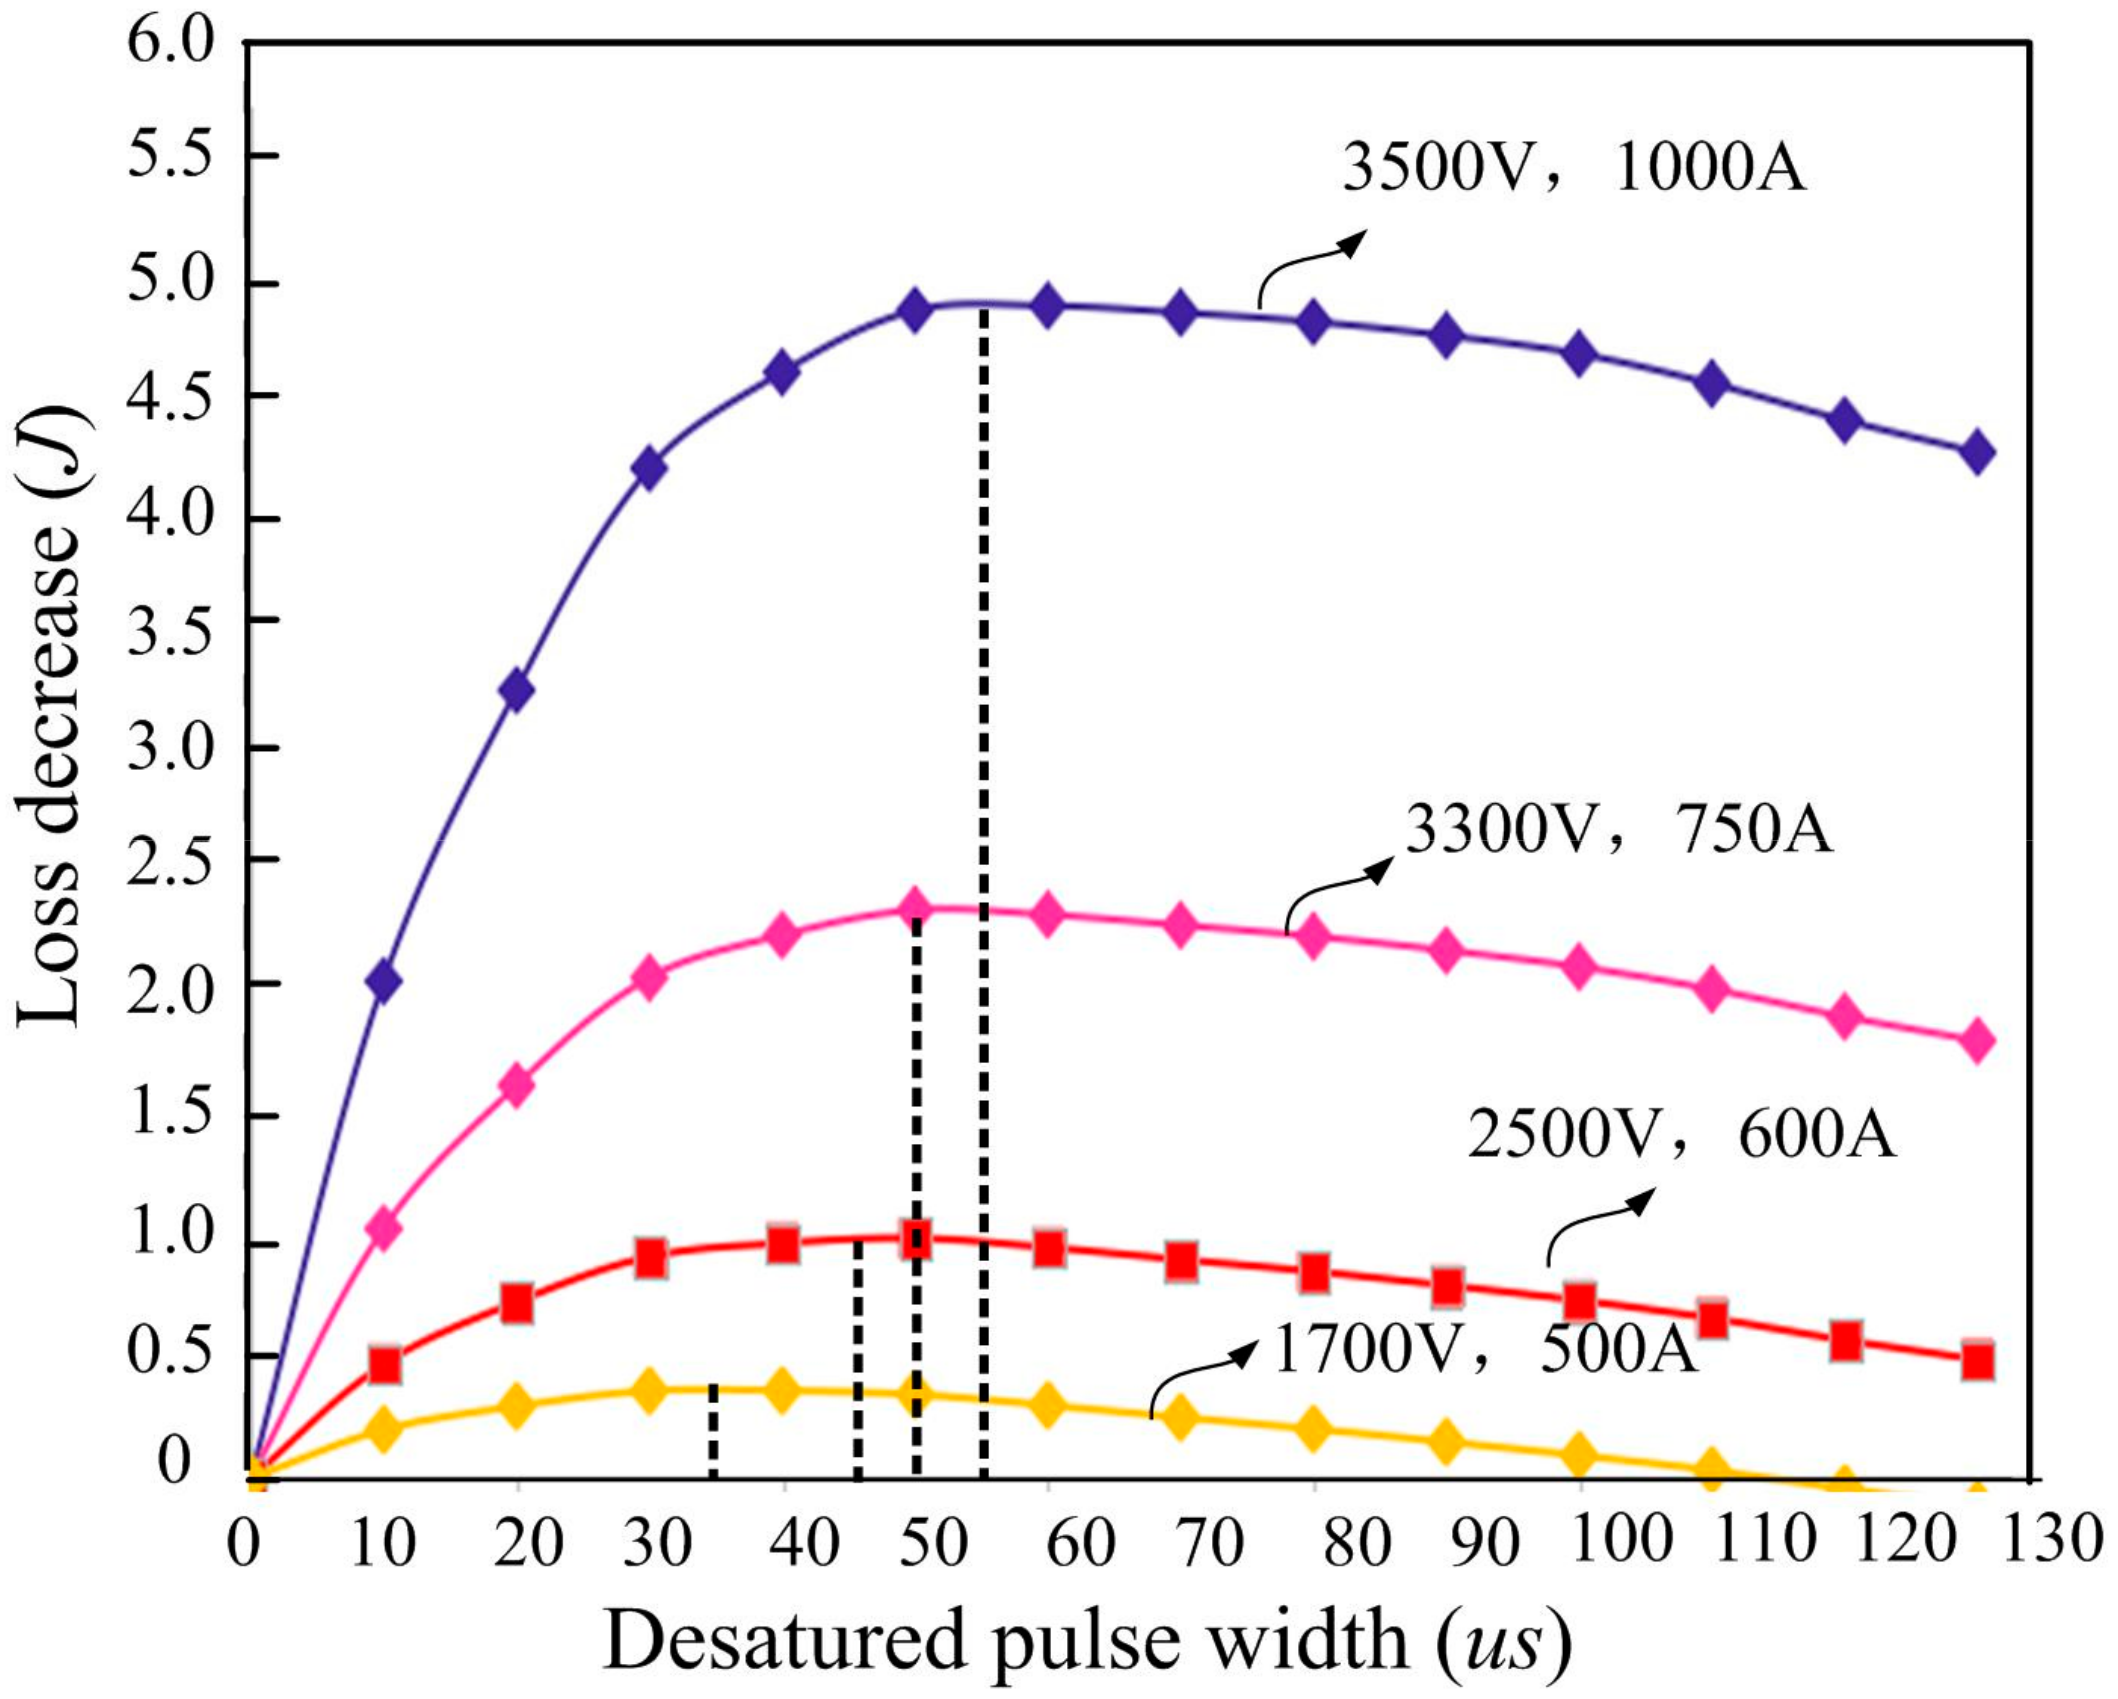
Figure 10.
Waveforms of the improved dual-pulse test for the RC-IGBT with a desaturation pulse.
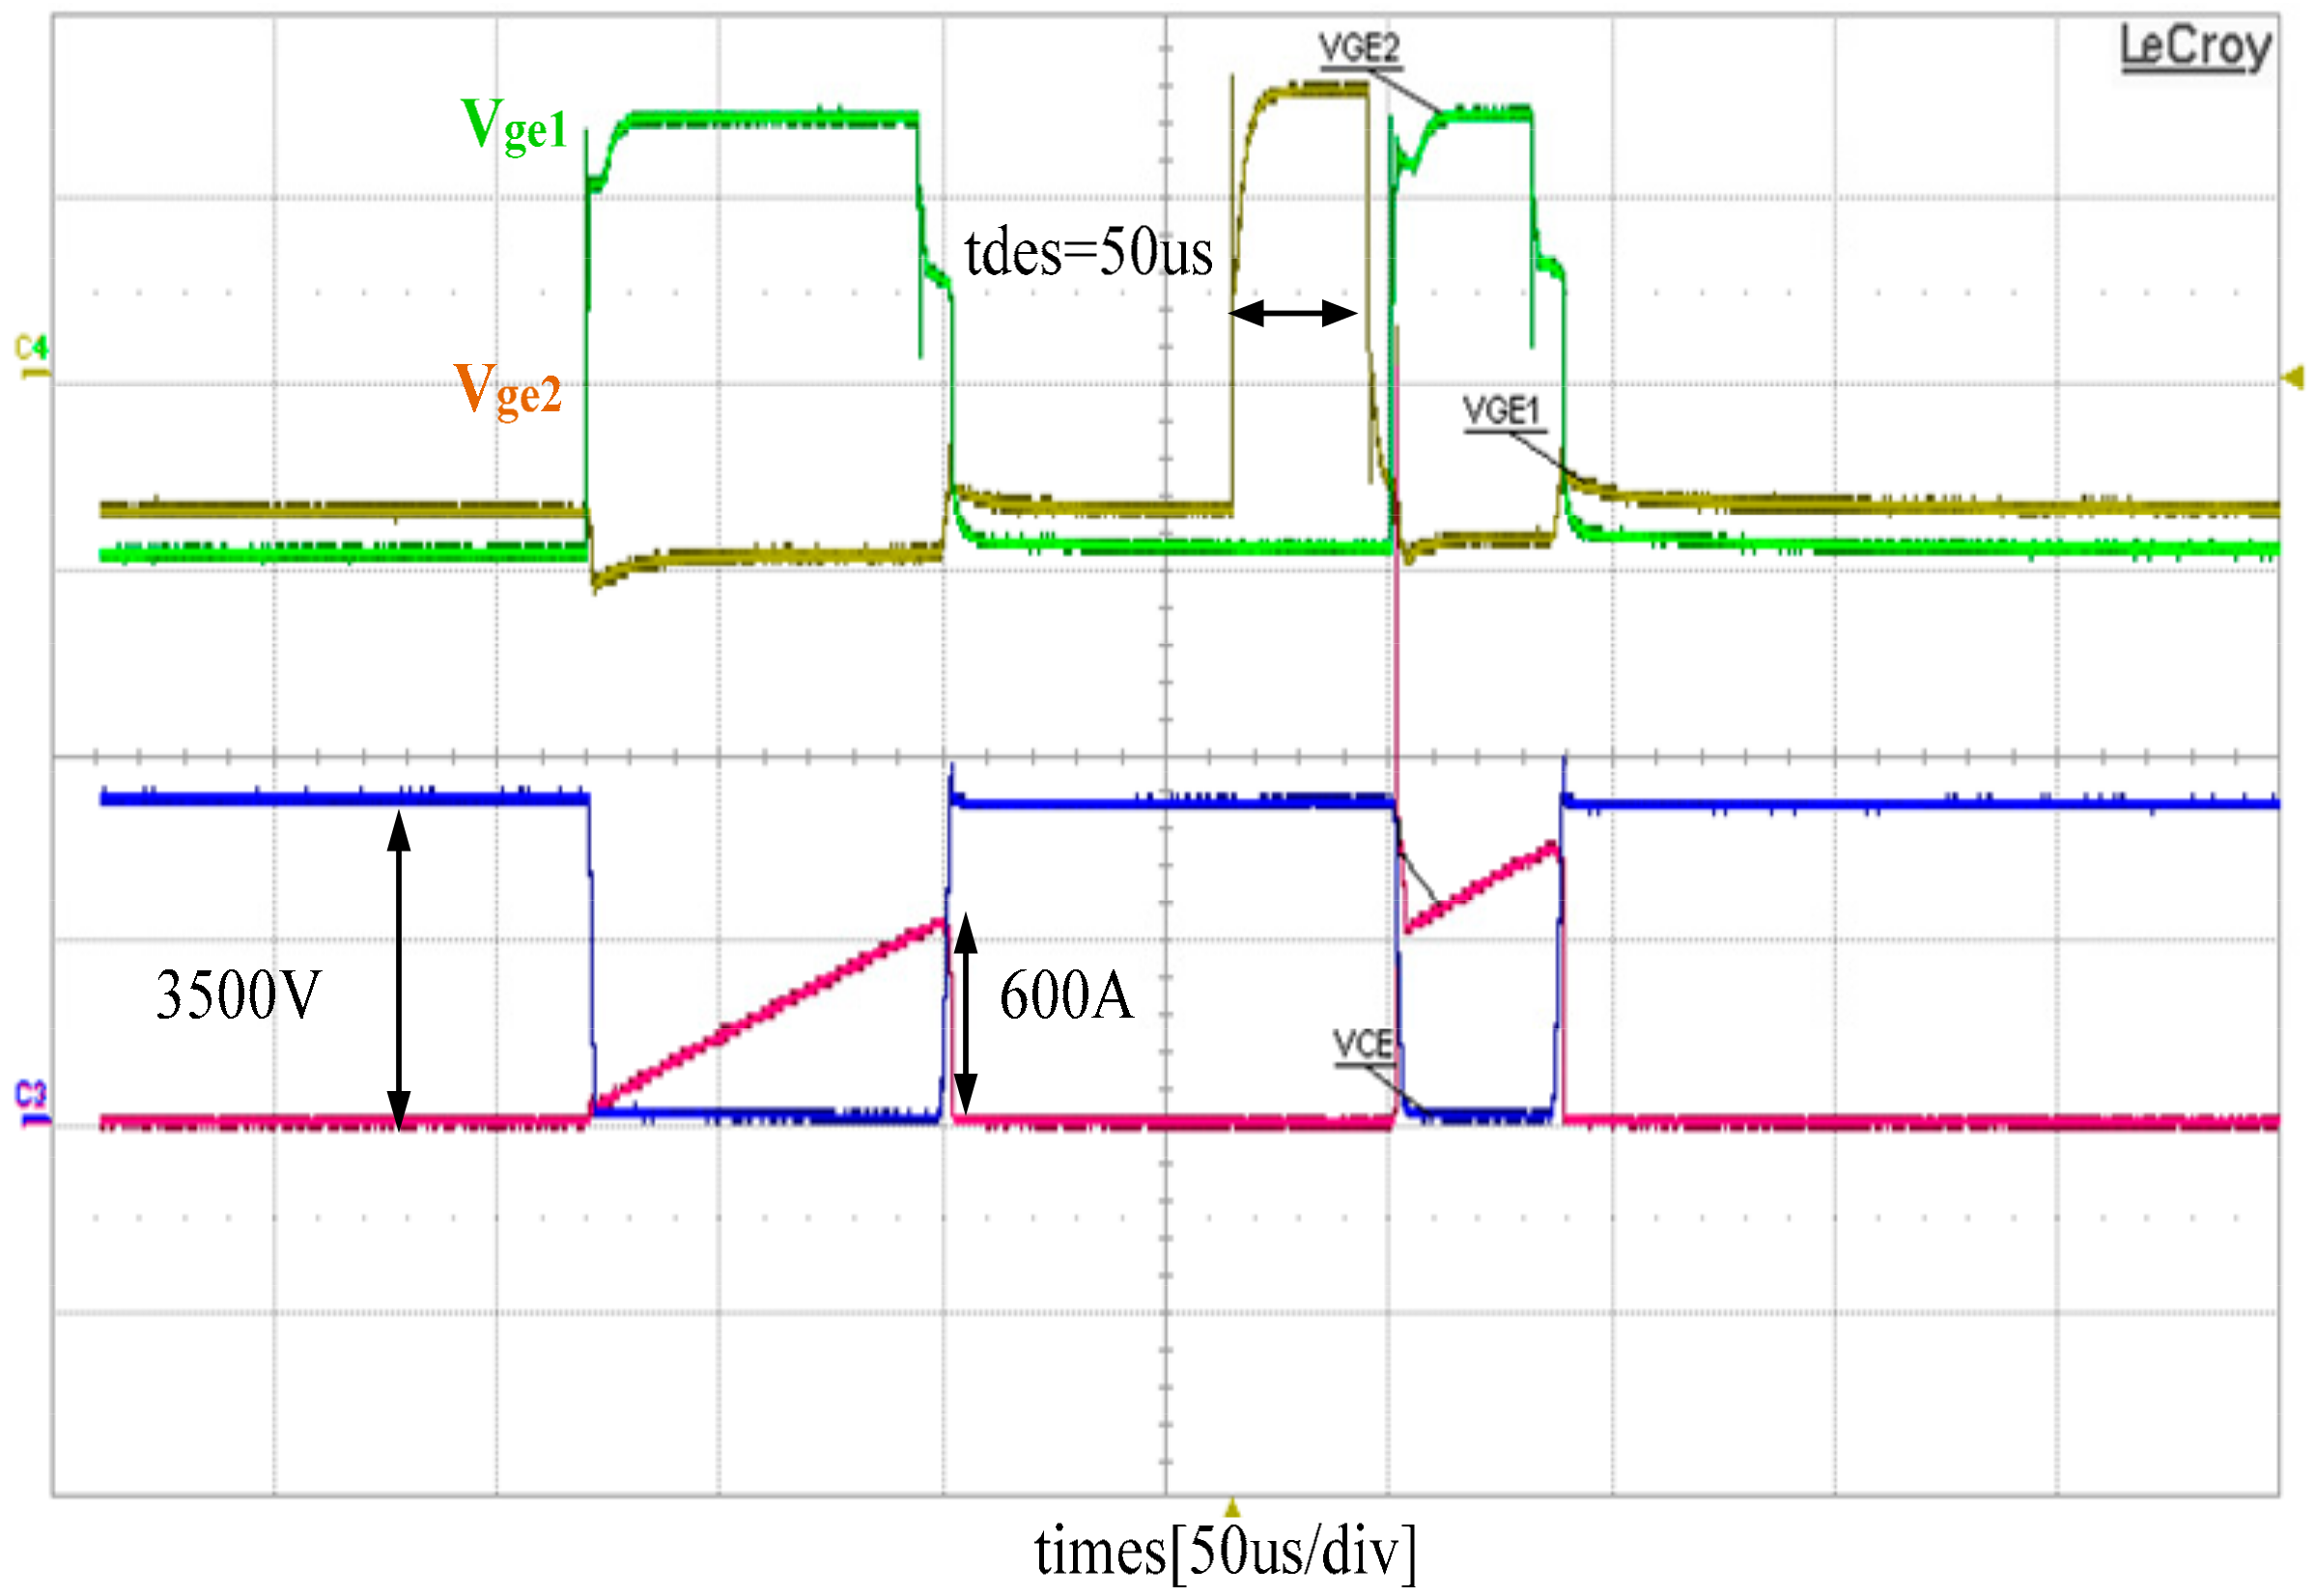
Figure 11.
Waveforms of diode reverse recovery under different desaturation pulse control.

Figure 12.
Loss comparison between RC-IGBT and conventional IGBT under 3500 V/1000 A.

Figure 13.
Diagram of the RC-IGBT single phase Voltage-source.

Figure 14.
Simulation of the rectify operation for the PWM rectifier with an RC-IGBT.

Figure 15.
Simulation of the single PWM rectifier with an RC-IGBT.

Figure 16.
Loss comparison between Conv-IGBT and RC-IGBT applied to a 1.4 MW PWM converter.
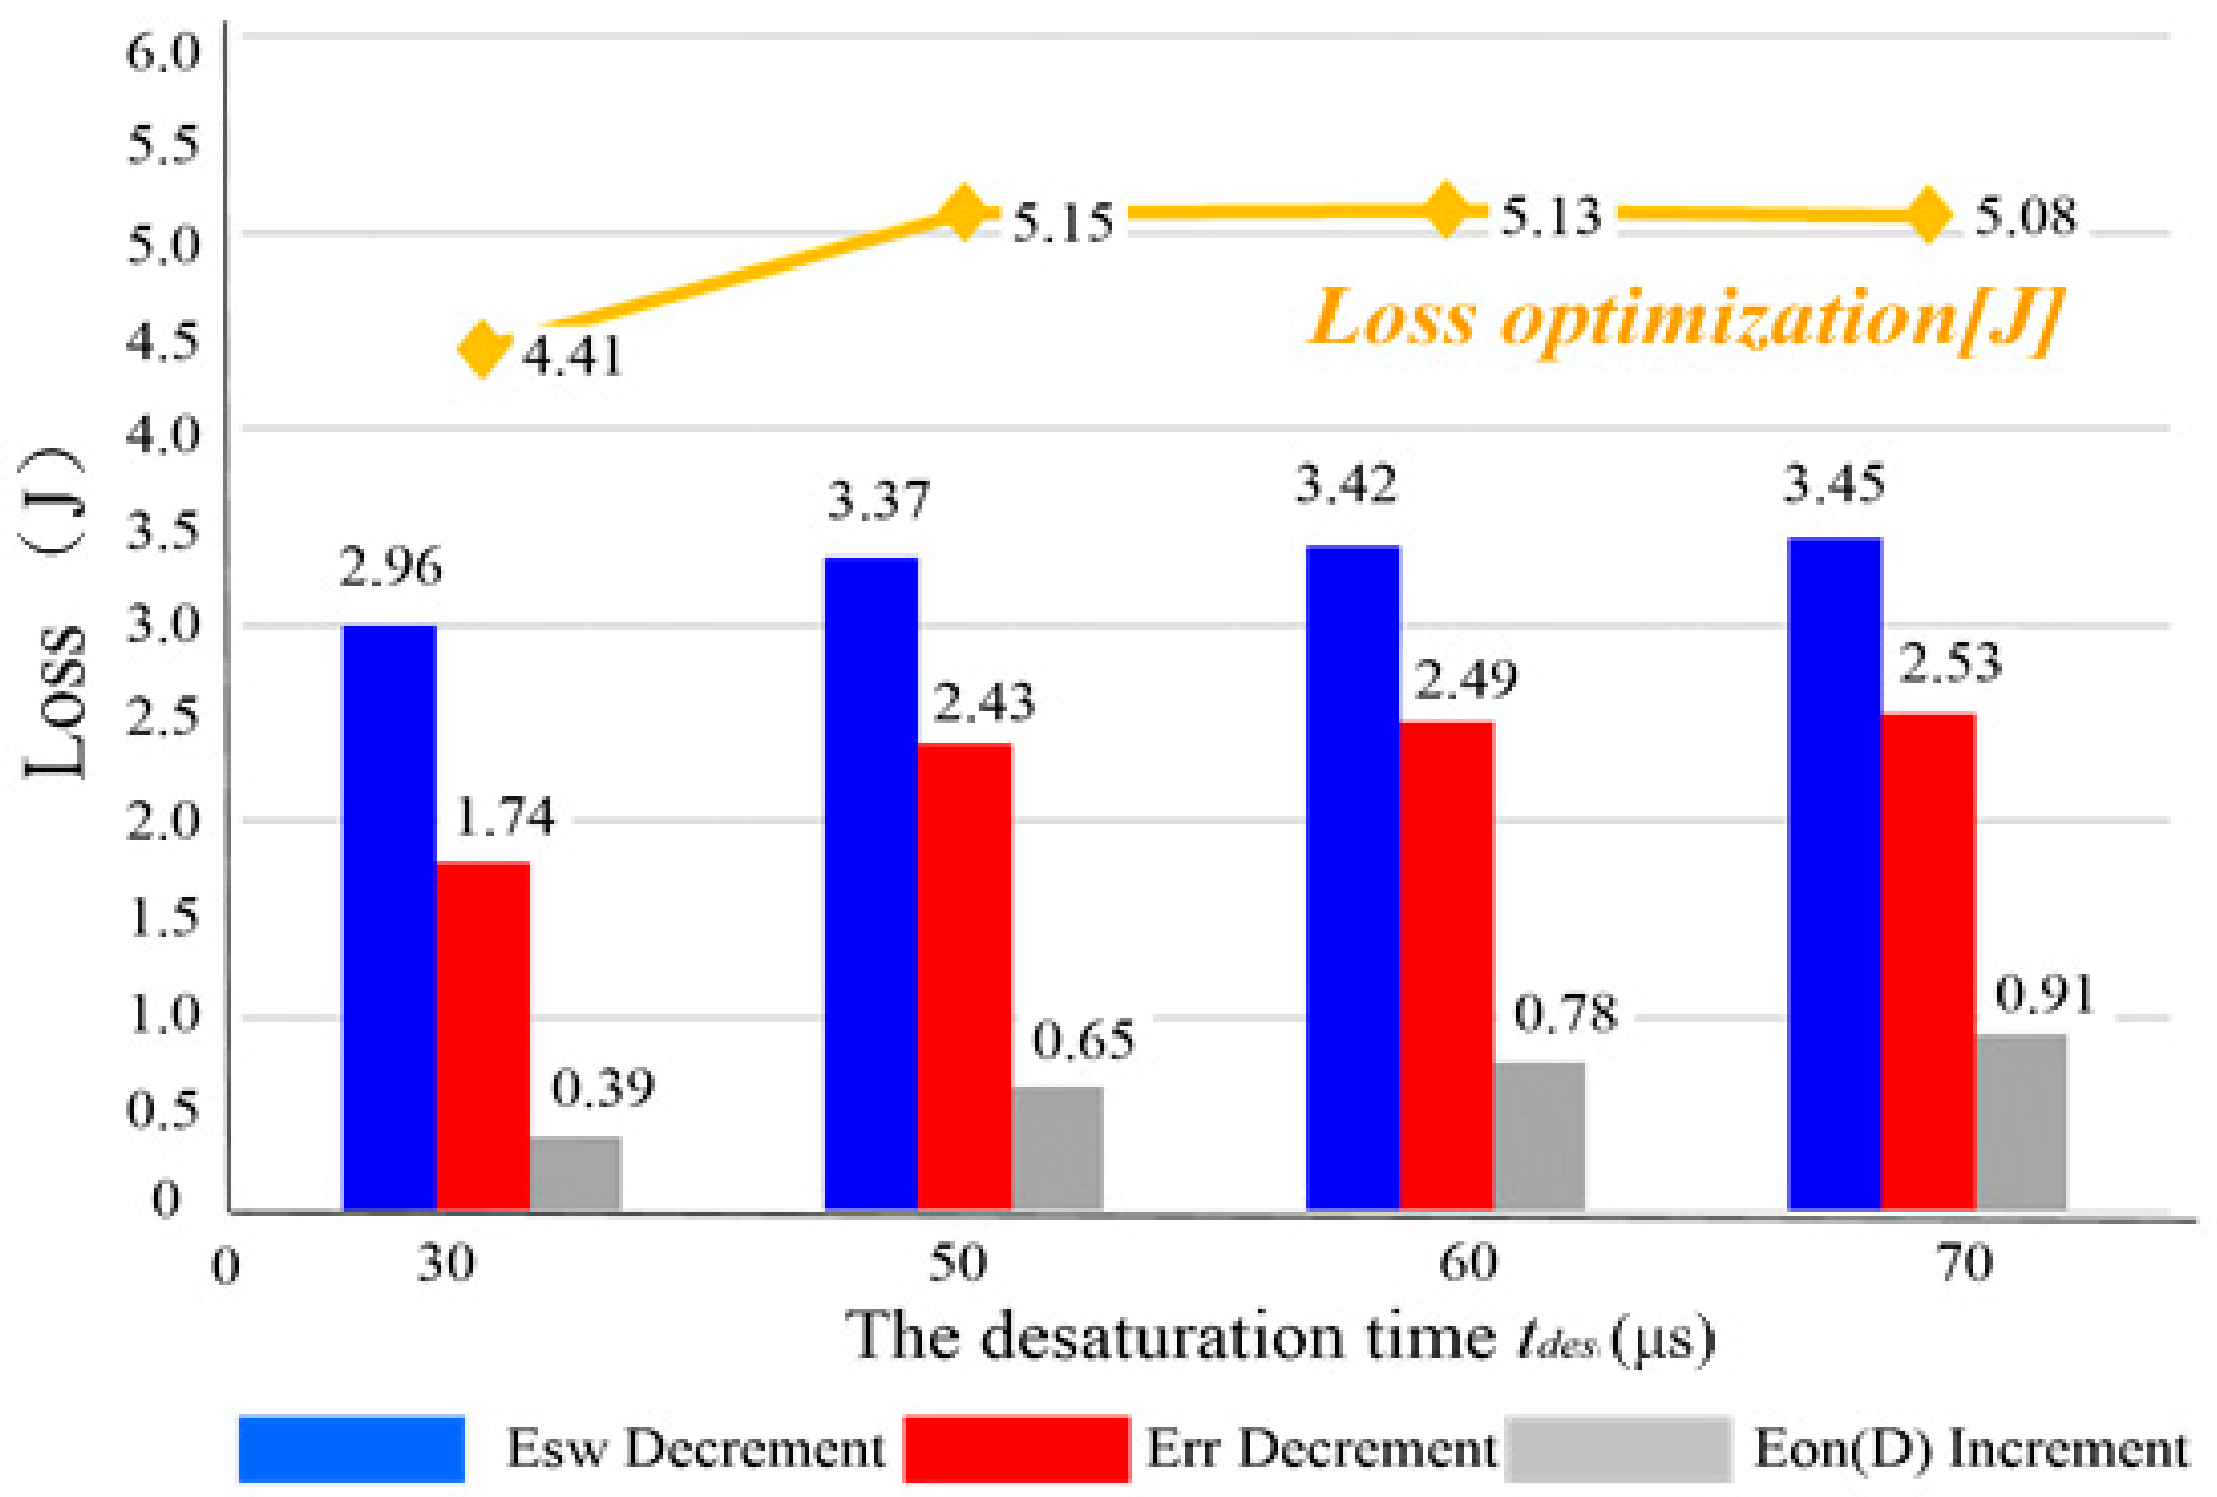
Figure 17.
Experimental Bench.
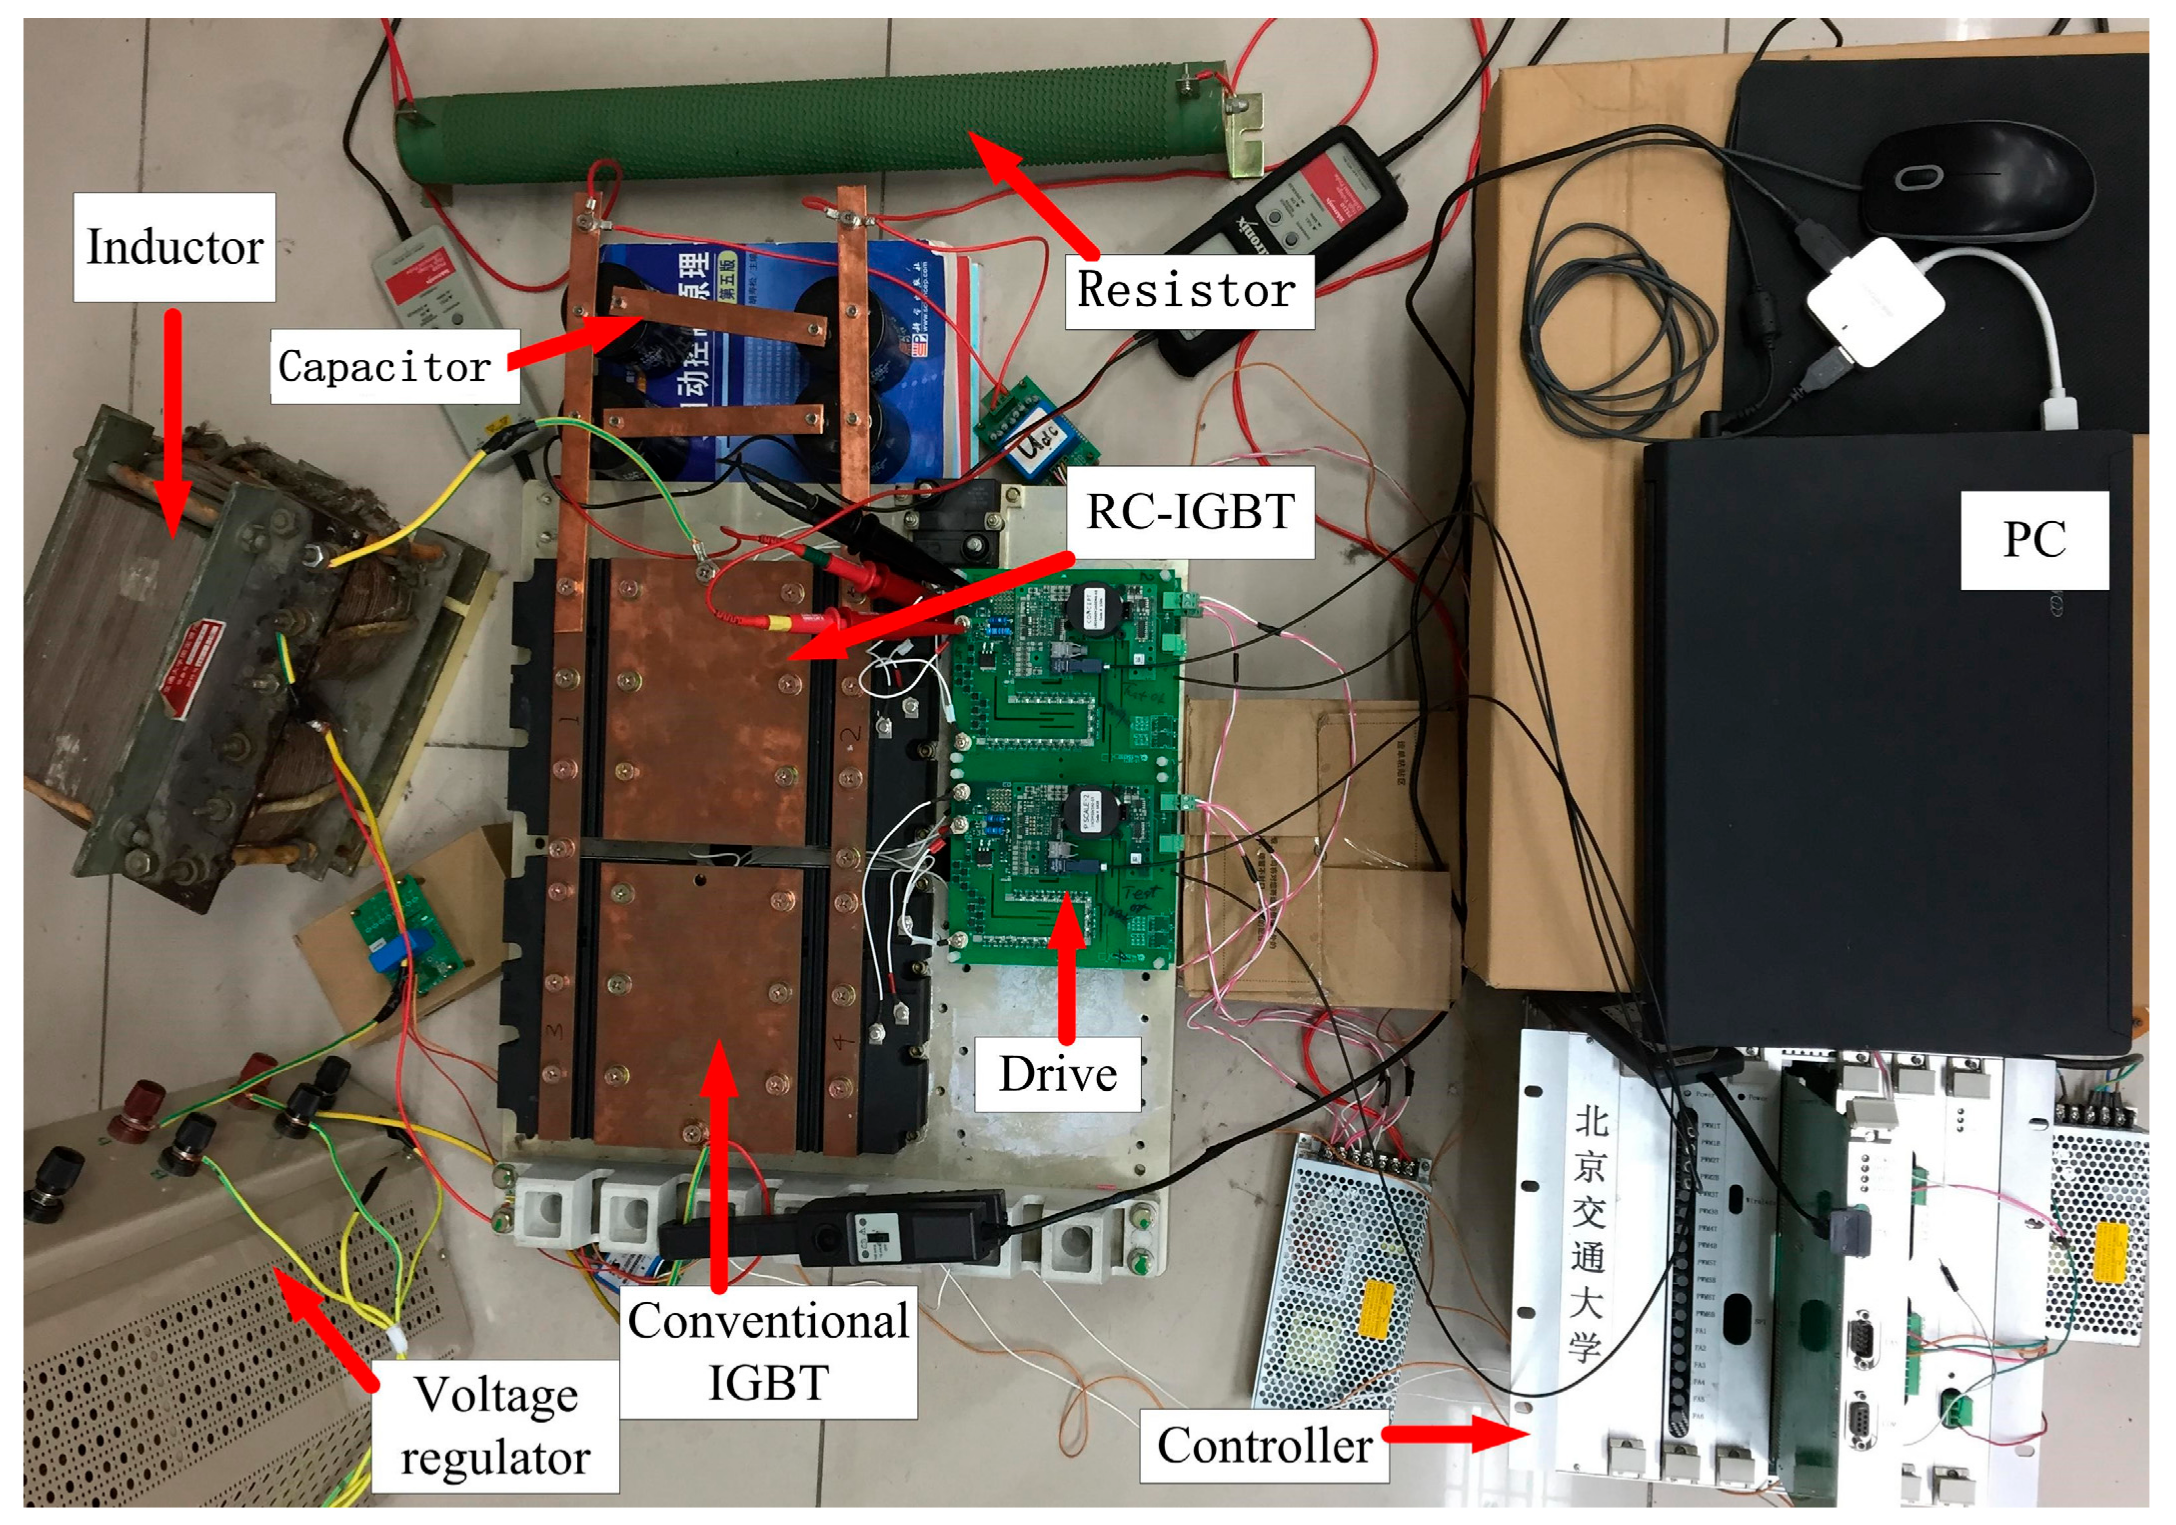
Figure 18.
Waveforms of the input & output voltage and current under desaturation control, as well as saturated work, for RC-IGBT: (a) Waveforms of the input and output voltage, as well as the inductance current; (b) Waveforms of the current and T1/T2 gate pulses.
Figure 18.
Waveforms of the input & output voltage and current under desaturation control, as well as saturated work, for RC-IGBT: (a) Waveforms of the input and output voltage, as well as the inductance current; (b) Waveforms of the current and T1/T2 gate pulses.

Figure 19.
Images of the temperature rise of the RC-IGBT and conventional IGBT.

Table 1.
Work conditions of the PWM Rectifier in Simulink.
| Symbol | Meaning | Value |
|---|---|---|
| Voltage source RMS | Us | 1950 V |
| DC-link voltage | Ud* | 3500 V |
| AC side inductance | Lm | 2.6 mH |
| DC-link capacitance | Cd | 5.4 mF |
| Switching frequency | fs | 450 Hz |
| Rated power | PN | 1.4 MW |
Table 2.
Losses Distribution of the PWM Rectifier.
| Loss (mJ) | Econd | Esw | Etot |
|---|---|---|---|
| Conventional IGBT | 16,668.4 | 32,956.2 | 49,624.6 |
| RC-IGBT (non-desat) | 14,464.3 | 36,654.6 | 51,118.9 |
| RCDC (tdes = 50 μs) | 15,294.7 | 31,415.6 | 46,710.3 |
| RCDC (tdes = 30 μs) | 14,962.5 | 31,791.1 | 46,753.6 |
© 2017 by the authors. Licensee MDPI, Basel, Switzerland. This article is an open access article distributed under the terms and conditions of the Creative Commons Attribution (CC BY) license (http://creativecommons.org/licenses/by/4.0/).
Share and Cite
MDPI and ACS Style
Huang, X.; Ling, C.; Chang, D.; You, X.; Zheng, T.Q. Loss Characteristics of 6.5 kV RC-IGBT Applied to a Traction Converter. Energies 2017, 10, 891. https://doi.org/10.3390/en10070891
AMA Style
Huang X, Ling C, Chang D, You X, Zheng TQ. Loss Characteristics of 6.5 kV RC-IGBT Applied to a Traction Converter. Energies. 2017; 10(7):891. https://doi.org/10.3390/en10070891
Chicago/Turabian StyleHuang, Xianjin, Chao Ling, Dengwei Chang, Xiaojie You, and Trillion Q. Zheng. 2017. "Loss Characteristics of 6.5 kV RC-IGBT Applied to a Traction Converter" Energies 10, no. 7: 891. https://doi.org/10.3390/en10070891
Note that from the first issue of 2016, this journal uses article numbers instead of page numbers. See further details here.