
A Hybrid Reliability Evaluation Method for Meshed VSC-HVDC Grids

1
The State Key Laboratory of Electrical Insulation and Power Equipment, Xi’an Jiaotong University, Xi’an 710049, China
2
The Department of Research and Application of New Technology, China Electric Power Research Institution, Beijing 100192, China
*
Author to whom correspondence should be addressed.
Energies 2017, 10(7), 895; https://doi.org/10.3390/en10070895
Submission received: 28 February 2017
/
Revised: 7 June 2017
/
Accepted: 28 June 2017
/
Published: 1 July 2017
(This article belongs to the Special Issue Electric Power Systems Research 2017)
Abstract
:High-voltage direct current (HVDC) grids are emerging, and their reliability has been an increasing concern for the utilities. HVDC grids are different from typical two-terminal HVDC transmission systems due to the loops in their topology, which makes it difficult to evaluate the reliability by conventional analytical methods. This paper proposes an innovative hybrid method to evaluate the reliability of meshed HVDC grids. First, steady-state models and reliability models are established for the components in HVDC grids, especially for converters and power flow controllers. In the models, virtual buses are introduced to represent the external AC connections to the HVDC grid. Then a hybrid reliability evaluation method is proposed based on an analytical approach and Monte Carlo simulation. One innovation of the paper is the application of an analytical analysis method to accelerate state evaluation in Monte Carlo simulation by skipping unnecessary optimization. The proposed models and methods are verified on two HVDC grids. Test results show that HVDC grids under most failure states (approximately 70%) tend to shed no load except on buses connected to faulted converters, and the application of the analytical method could promote evaluation efficiency significantly.
1. Introduction
Renewable energy is playing an ever-increasing role in the power systems all over the world. However, the development of large-scale renewable energy is hindered to a certain extent by the shortage of transmission capacity. Thanks to the latest power electronics technology, high-voltage direct current (HVDC) grids show great potential for wide-scale application in the future high-voltage transmission systems [1,2,3]. Apart from economic considerations, plentiful technical benefits promise the competitiveness of HVDC grids to transmit large-scale renewable generation to load centers. First, DC cable is almost the exclusive solution to transmit electrical power across a strait or integrate offshore wind power. Also, an HVDC grid does not have security and stability problems arising from synchronous interconnections. In addition, an HVDC grid can reduce cascading outages of wind farms.
The concept of HVDC grids has drawn attention from academic organizations and research community. The Council on Large Electric Systems (CIGRE) led a thorough investigation on HVDC grids and proved their feasibility [4]. The feasibility was also verified in the laboratory [5]. Furthermore, the European HVDC Study Group investigated basic principles to design and operate HVDC grid systems [6]. Inspired by these studies, a wide range of research has been conducted on HVDC grids, such as control [7,8,9,10,11,12], protection [13,14,15,16], and security [17].
The first commercial HVDC grid in the world is set to emerge in China. A meshed HVDC grid named Zhang-Bei has been designed by the State Grid to secure power supply to Beijing from a variety of clean sources. By the end of 2018, four converter stations will be built, including three sending terminals (1500 MW/±500 kV each) and one receiving terminal (3000 MW/±500 kV). Another two terminals have also been planned and are expected to be in operation by 2021.
The meshed HVDC grid is an emerging technology, and its reliability is a serious concern. The reliability of a device or a system is defined as the probability it will perform its intended functions adequately while in operation [18]. A high priority should be given to the reliability of power systems because blackouts or even local power interruptions can impact industrial manufacture, business activities, and public order. Thereby, the evaluation of reliability plays an important role in power system planning and operation. Despite some existing studies on the reliability of multi-terminal HVDC systems (e.g., [19,20,21]), these methods are not applicable to meshed HVDC grids (especially densely meshed grids [22]) because of the loops in the topology. Therefore, a quantitative reliability evaluation method for meshed HVDC grids is necessary and urgent. Furthermore, the reliability evaluation for complex power systems is generally computationally-intensive and time-consuming, and meshed HVDC grids are no exception. Reliability evaluation may be embedded into planning, reconfiguration, and scheduling of power systems. In these cases, reliability evaluation is executed repeatedly, especially when these problems are solved with heuristic algorithms. Therefore, the efficiency of a reliability evaluation method is critical to its application. A plain reliability evaluation method may even have difficulty in convergence within acceptable time. In order to address this problem, a hybrid evaluation method is proposed, in which an analytical algorithm is combined with Monte Carlo simulation to boost the efficiency.
The contents of the paper are organized as follows: Section 2 models the components in HVDC grids in terms of steady state and reliability. In Section 3, a contingency analysis method including preliminary analysis and optimal load shedding algorithm is presented. Section 4 illustrates the procedure of the proposed reliability evaluation method based on Monte Carlo simulation. Section 5 verifies the proposed models and methods via case studies on two test systems. In final, conclusions of the paper are summarized in Section 6.
2. HVDC Grid Model
Since no HVDC grids are in service yet anywhere in the world, a detailed model of the meshed HVDC grids is unavailable. However, existing studies, such as references [4,6], offer a useful outline of underlying HVDC grids. In accordance with most studies, it is assumed that converters in the paper are all voltage source converters (VSCs) including modular multilevel converters (MMCs). A notational topology of an HVDC grid is shown in Figure 1.
Based on existing studies, three reasonable and common assumptions are further adopted to simplify the HVDC grids:
- (1)
- AC systems connected to different DC buses are separate from each other.
- (2)
- HVDC grids are bipolar and operate symmetrically.
- (3)
- Reactive power is sufficient in AC systems.
Assumption 1 guarantees that all AC buses only can be energized by converters rather than other AC buses. However, if there exist a couple of simple AC connections, they can be removed by adding constraints, which will be presented in Section 2.2. If AC connections are complex and the failures of these connections are supposed to take into account, the reliability should be evaluated with techniques for hybrid AC/DC system rather than these for DC grids, and it is beyond the scope of this paper. On Assumption 2, all analysis can be conducted only on one pole, providing a wide range of simplicity and convenience. Assumption 3 excludes discussions on reactive power in AC systems.
An HVDC grid is represented by a tuple (, , , ), where denotes the set of DC buses, denotes the set of DC transmission lines, denotes the set of DC/DC converters and denotes the set of AC/DC converters. AC⊆ and DC⊆ denotes the set of AC buses and DC buses respectively.
2.1. Aggregation of AC Buses
An AC system integrated into an HVDC grid may contain both power demand and sources, so an appropriate model for the AC system is essential to evaluate the reliability of the HVDC grid in a concise way. In this paper, all load nodes and generators are aggregated into an equivalent load node and an equivalent generator respectively. In the aggregation, no power loss is taken into account. Thus, the power injected into AC bus i is:
where Pig and Pid denote the equivalent demand of all load nodes and equivalent capacity of all generators connected to AC bus i via AC access respectively.
2.2. Converter Stations
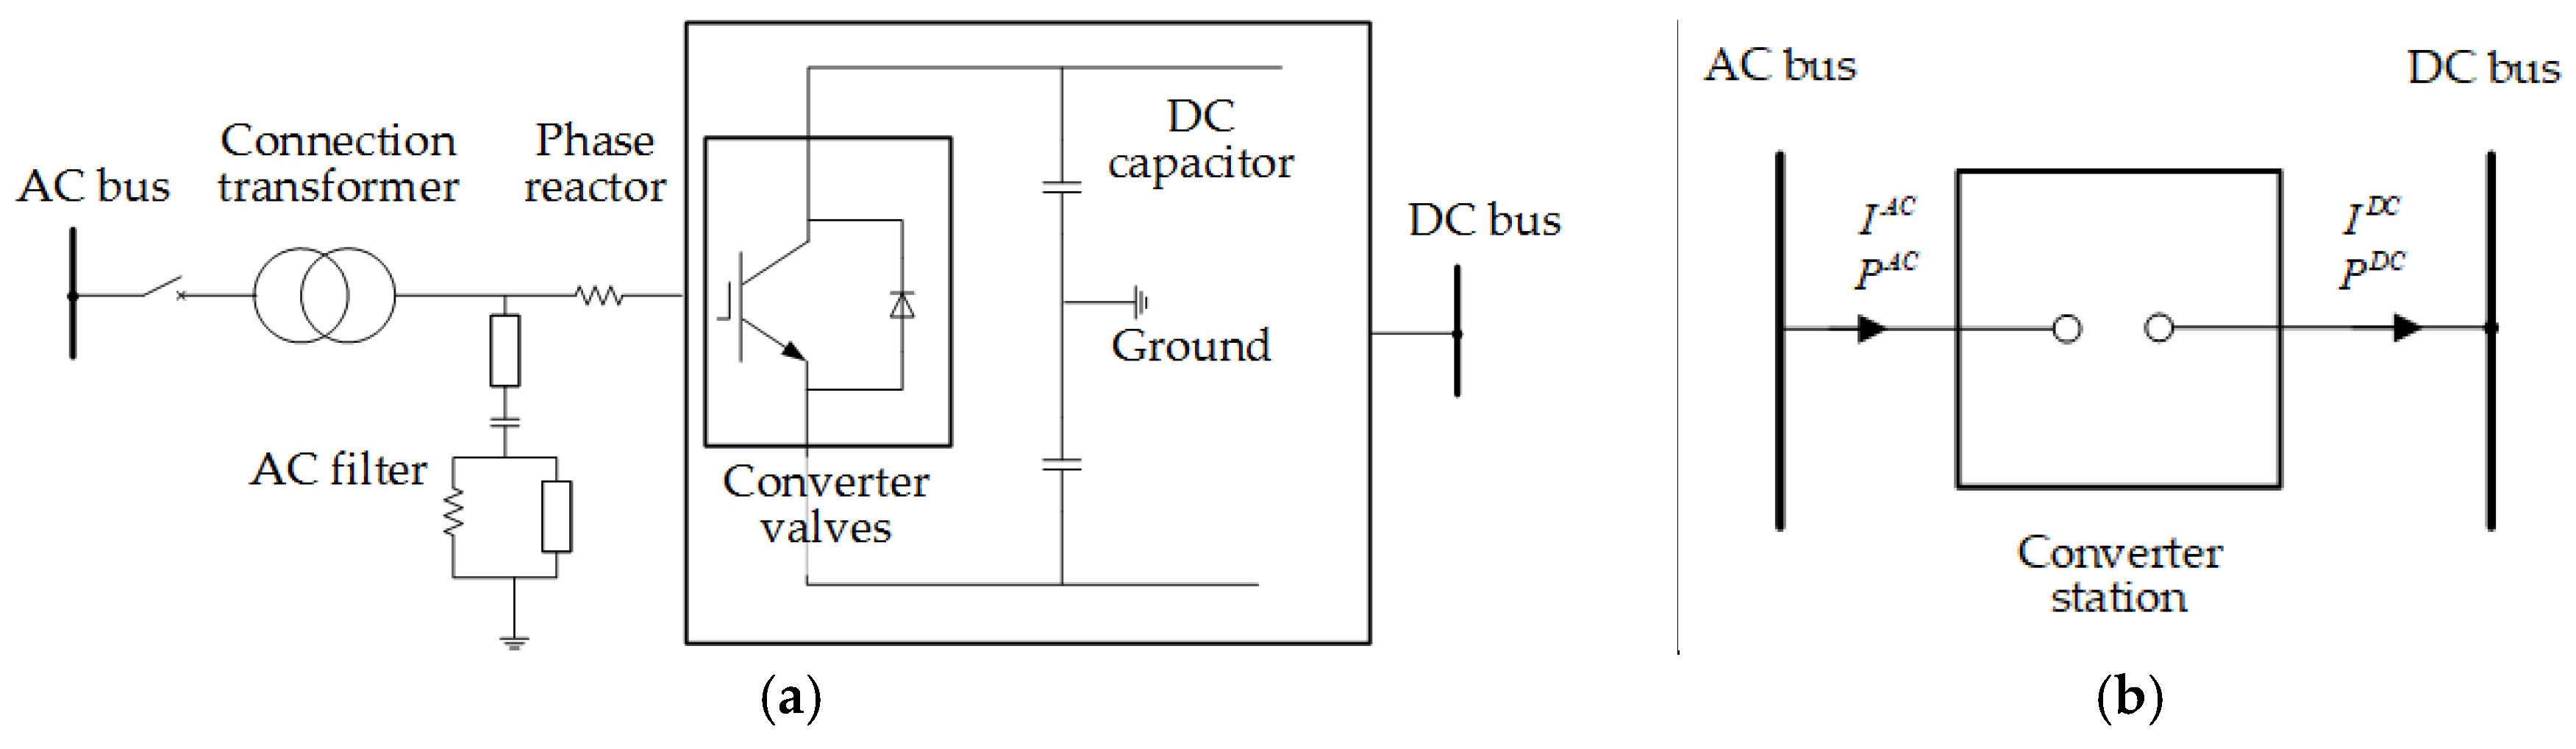
Converter stations are the bridges between AC buses and DC buses. As shown in Figure 2a, a converter contains connection transformer, phase reactor, converter valves and capacitors between the AC bus and the DC bus. In reliability evaluation, one of the consideration is the power loss in these components. An equivalence is adopted in the paper in Figure 2b.
The active power loss of the connection can be approximated by a quadratic function of the AC current magnitude i.e.:
where IiAC denotes the current injected into AC bus from the AC system; a, b and c are constant factors.
The AC voltage is not the main concern in this paper, so IiAC is estimated with the corresponding DC one, i.e.:
where Ii denotes the current injected into DC bus i from the DC grid.
In this equivalent model, the power balance can be formulated as:
where PiDC denotes the power injected into DC bus i from the converter station; PiAC denotes the active power injected into DC bus i from the AC system.
The voltage and injected power of DC buses are intimately related to the control modes of converters. Active power and reactive power of converters based on VSC can be controlled independently, and only the former contributes to the power flow in HVDC grids directly, so only active power control is taken into consideration in the paper. Constant voltage control, constant power control, and droop control are three popular control strategies to implement active power control. These control strategies are modeled as follows.
The DC voltage of the converter under voltage control serves as the reference voltage of an HVDC grid, and the corresponding DC bus is a slack bus. The voltage of the slack bus is:
where Ui and Ui0 denote the real and preset voltage of DC bus i.
In the other two strategies, the voltage is adjustable, and the injected power is dependent. The power injected into the DC bus from the converter under constant power control and droop control can be formulated as Equations (6) and (7) respectively:
where PiDC,0 denotes the preset power injected into DC bus i from its connected converter, and ki denotes the droop factor.
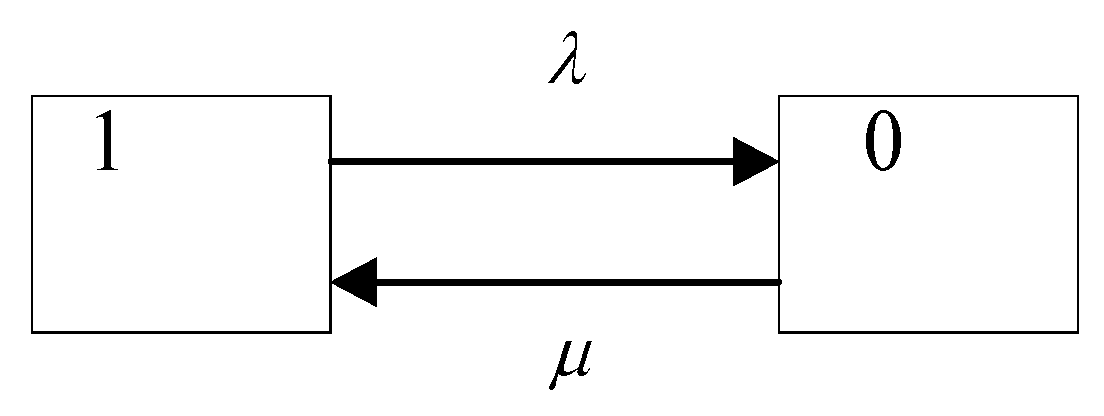
The two-state model is utilized for the outage model of converter stations. As shown in Figure 3, the two states in the model are the available state (denoted by 1) and the unavailable state (denoted by 0). λ and μ are the equivalent failure rate and the equivalent repair rate respectively, assessed with the methods proposed in [23,24] or estimated directly from historical statistics.
The failure probability is utilized to depict the reliability of converter stations. It can be calculated from λ and μ as Equation (8):
If there are more than one converter in a converter station and these converters are connected to different DC buses, the above models are still effective, with virtual AC buses introduced. Provided that there are m DC buses connected to the same converter station, m virtual AC buses are requisite to be introduced to replace the original AC bus. The power at these virtual AC buses is constrained by Equations (9)–(10):
where P is the output of generators at the kth virtual AC bus; P is power demand at the kth virtual AC bus.
If there are connections between AC buses, then these AC buses can be treated as virtual AC buses and thus the violation of Assumption 1 is eliminated.
2.3. Transmission Lines
Transmission lines include overhead lines and cables. They are both modeled as a resistor with a constant conductance in proportion to their length. Then conductance of all transmission lines of an HVDC grid can be expressed by a matrix Gl defined as:
where gij is the conductance of transmission line ij∈.
Transmission lines share the same reliability model with converters, but the failure probability is calculated in another way as shown in Equation (12):
where l denotes the length of the transmission line (km), f denotes the failure frequency (occ./yr/100 km); tr denotes the average repair time (h/occ.).
2.4. Power Flow Controllers
For meshed HVDC grids, the current in branches cannot be fully controlled if the number of branches minus the number of buses exceeds one [4]. Therefore, power flow controllers are introduced to enhance the control of power flow in HVDC grids. Although a wide diversity of techniques are proposed to realize the control, including variable resistors, DC/DC converters, and auxiliary power supplies, only DC/DC converters have the expected performance. Thus DC/DC converters are regarded as power flow controllers in the paper. The same reliability model of converter stations is used to model DC/DC converters, and the following paragraphs focus on the steady model.
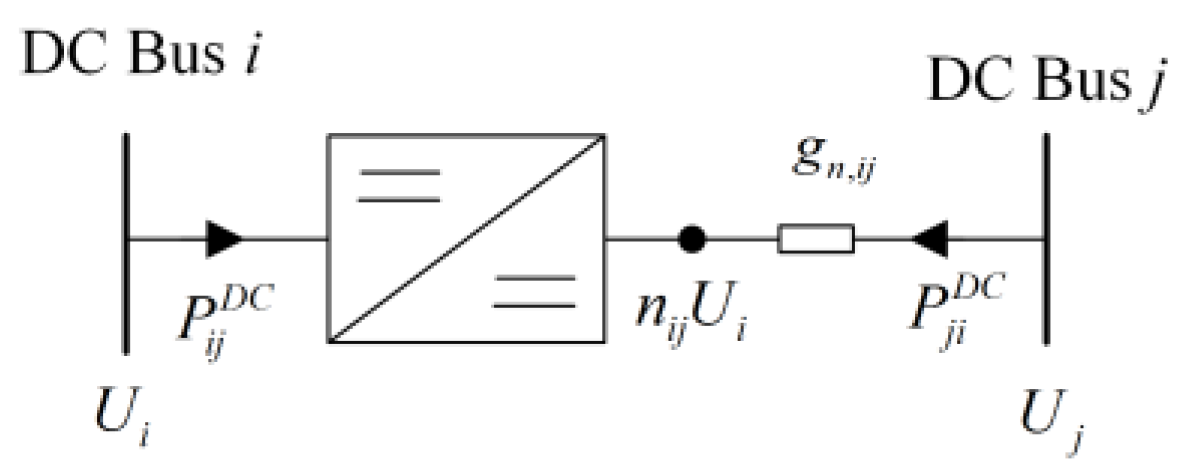
Assuming i < j, the DC/DC converter connecting DC bus i and DC bus j is equivalent to an ideal DC/DC converter and a cascaded resistor as shown in Figure 4. For the convenience, the equivalent resistor is chosen on the side of the DC bus with a larger index (i.e., bus j in Figure 4). The branch power flow can be formulated as:
where nij denotes the voltage ratio of the ideal DC/DC converter and gn,ij denotes the conductance of the equivalent resistor.
Similar to transmission lines, a matrix Gd is defined as:
3. Contingency Analysis
There are three steps in reliability evaluation with Monte Carlo method, i.e., state generation, state evaluation, and indices aggregation. Among these steps, state evaluation is the vital and most complicated one for complex power systems. This section is to address the core problem in state evaluation via contingency analysis. The contingency analysis is utilized to analyze the consequence after component(s) failing. More specifically, the process determines whether the load is to be shed, where and how much demand is to be shed if shedding occurs.
In conventional Monte Carlo simulations, all failure states are evaluated with optimal load shedding (OLS, a type of load curtailment models) to determine the consequence. Usually OLS is an optimization problem and time-consuming. As Figure 5 shows, the HVDC grid, however, tends to shed no load in a portion of failure states because all loads can recover after network reconfiguration in these cases. In the paper, an analytical process named preliminary analysis is proposed to accelerate contingency analysis, aiming to reduce the number of executions of OLS by narrowing the set of failure states as shown in Figure 5. Thus the contingency analysis consists of two parts, preliminary analysis and OLS.
3.1. Preliminary Analysis
The first step of the preliminary analysis is to examine the consequence of converter failures. Power from or into AC buses may be blocked when the connected converters are in outage states. Assumed that converter (i,j) ∈ fails, the following steps are carried out:
- (1)
- Remove converter (i,j) ∈ and AC bus i ∈ AC from HVDC grid ;
- (2)
- Determine the status of AC bus i, i.e., load would be shed with Equation (16) if Pig < Pid;
- (3)
- Directly enter OLS module if total demand of reachable load nodes overtakes the total capacity of available generators, otherwise continue the analysis;
- (4)
- Reallocate the output of available generators as Equation (17):where Pkd,0 and Pkg,0 are the initial equivalent demand and equivalent output of AC bus k.
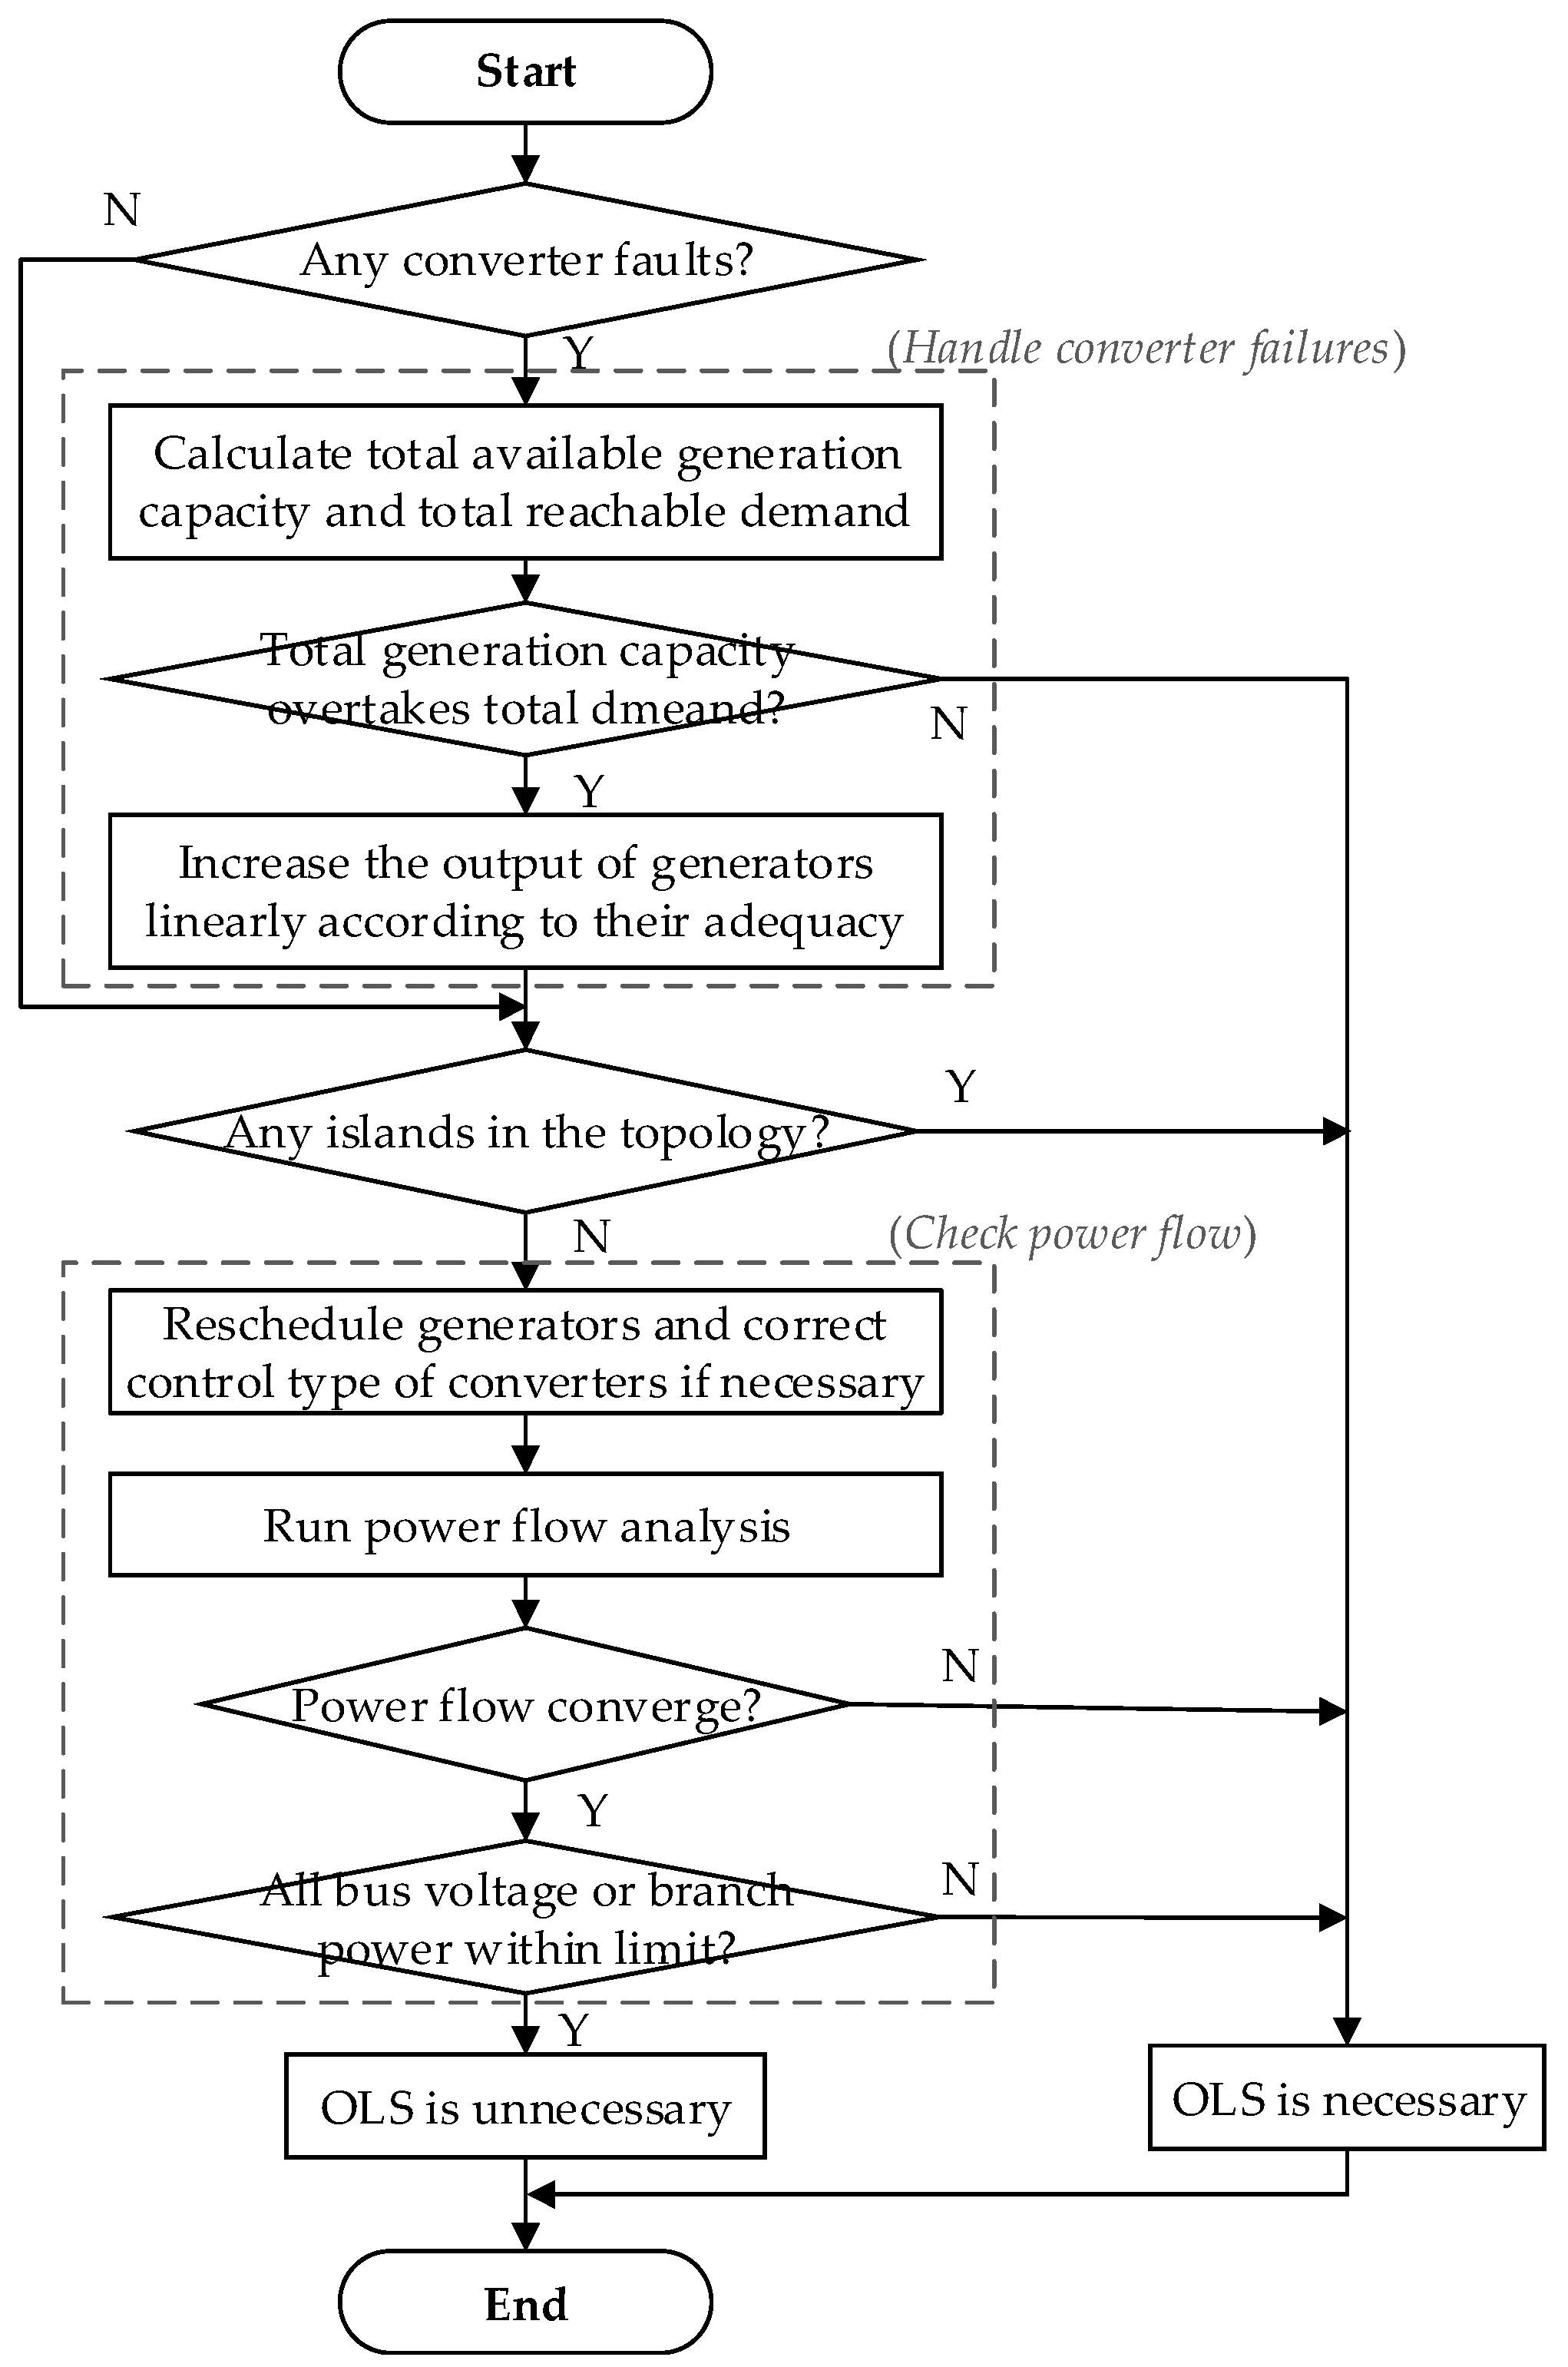
After the analysis of converters faults, power flow analysis is conducted to determine the necessity of OLS. If the analysis of power flow succeeds and operation variables in results violate no operational limit, OLS is unnecessary in this fault case. Otherwise, OLS is necessary to determine the status of HVDC grids. In this analysis, violations of limits include disaggregation of HVDC grids, over-voltage of buses, over-power of transmission lines and converters. The preliminary analysis procedure described above is shown in Figure 6.
3.2. Optimal Load Shedding
In radial networks, the load can only be energized by one source. If the load cannot reach the source, it has to be shed. Thereby load shedding can be determined by the topological connectivity. However, due to loops existing in the topology, the load can be supplied by more than one source in an HVDC grid, so the demand may still be met once more than one sources are still reachable after failures. In order to solve the problem, an optimization model (namely OLS) is proposed to determine the consequence of failures in HVDC grids. The objective of OLS is to minimize the economic loss of shedding, formulated as:
where x denotes the vector of optimization variable [U Pg Ps n], i.e., the voltage of DC buses, the output of generators, the shed power, and the voltage ratios of power flow controllers; ηi denotes the economic loss factor of AC buses i, meaning the economic loss per unit of power.
The power flow constraints in the form of bus injection are:
where G is the conductance matrix, and G = Gl + Gd.
The constraints of voltage ratios are:
The constraints of bus voltage are:
The constraints of branch capacity are:
The constraints of converter capacity are:
where Pic,max is the capacity of AC/DC converter connected to AC bus i.
The constraints of generator capacity are:
The constraints of load shedding are:
Equation (18) is the objective function and Equations (2)–(7), Equations (9)–(10), and Equations (19) and (25) constitute the constraints of OLS. OLS is a non-linear optimization, particularly a quadratic constrained problem if there exists no power controller. It can be solved using the interior point method.
4. Reliability Evaluation Procedure
On the basis of Monte Carlo simulation and the analytical method presented in Section 3, a reliability evaluation procedure is proposed as shown in Figure 7. After contingency analysis method is built, generating probability space and obtaining reliability indices are the major problems to address.
All states of HVDC grids can be described by a probability space (Ω, , P) where Ω is the sample space, is the σ-field, P(∙) is the probability measure function. Let F(∙) denote the reliability index function, the expectation of its value is:
Unfortunately, it is impossible to list all states in Ω in most instances. For example, in an HVDC grid containing 80 components there are more than 1.2 × 1024 states. Thereby, the Monte Carlo method is applied to construct a new probability space (Ωm, m, Pm) to estimate the reliability index. In reliability evaluation, diversified sample methods are used to generate the probability space, such as importance sampling [25,26]. For the sake of simplicity, plain sampling is adopted to introduce the step of sampling in this paper, which can be easily substituted with other efficient sampling methods.
A state S of an HVDC grid can be defined as a vector of states of components, i.e., S: = (S1, S2, …, Sm) where m is the number of components in the grid. Si can be obtained from a random variate γi distributed uniformly between [0, 1] as:
where pif is the failure probability of component i.
All sampled states constitute the sample space and sampling frequency serves as the probability, so the estimation of the reliability index is:
where N is the number of samples and n(S) is the number of occurrences of state S.
N should be large enough to obtain appropriate accuracy. The accuracy is usually estimated by the coefficient of variation that can be formulated as:
where V(·) is the variance function. As Q cannot be estimated before simulation, an appropriate N cannot be assigned in advance. In the paper, the coefficient of variation is calculated during the simulation and the terminal condition of the simulation is:
where β0 is the given coefficient of variation, which can be 0.05 in most instances.
In this paper, three reliability indices are calculated based on load shedding value in simulation as listed in Table 1.
5. Numerical Tests
The proposed model and reliability evaluation method are applied on two meshed HVDC grids, CIGRE B4 DC grid test system and Continental Overlay HVDC Grid (40 buses) to verify their feasibility and efficiency. The former is primarily used to explore the shedding features of HVDC grids while the latter focuses more on the efficiency of the proposed reliability evaluation method.
5.1. CIGRE B4 DC Grid Test System
CIGRE B4 DC grid test system was proposed by the B4-58 work group and the B4-57 work group of CIGRE. There are 15 DC buses, 11 AC/DC converters, two DC/DC converters, nine DC cables, six DC overhead lines in this system. The total power demand of the system is 7500 MW. The voltage limit of DC system is 0.95–1.05 p.u. The topology of CIGRE B4 DC grid test system is shown in Figure 8, and more detailed data and information can be found in [27].
The grid in [27] was design for power flow analysis and operational simulation, so the reliability parameters are unobtainable. In this paper, reliability parameters used in the analysis are listed in Table 2. Also, the generation adequacy of the grid is set to 1.33, and adequate generation capacity is distributed on generators evenly according to their original capacity. In addition, AC lines between Ba-B0, Ba-B1, Ba-B2 and Ba-B3 are removed, which are shown in light grey in Figure 8.
With the proposed evaluation method, results were obtained from 10,000 samples as shown in Table 3. The reliability level of the test system is much higher than that of the two-terminal VSC-HVDC transmission system in [24] where EA is 95.40%, which reveals one of the advantages of HVDC grids, i.e., high reliability.
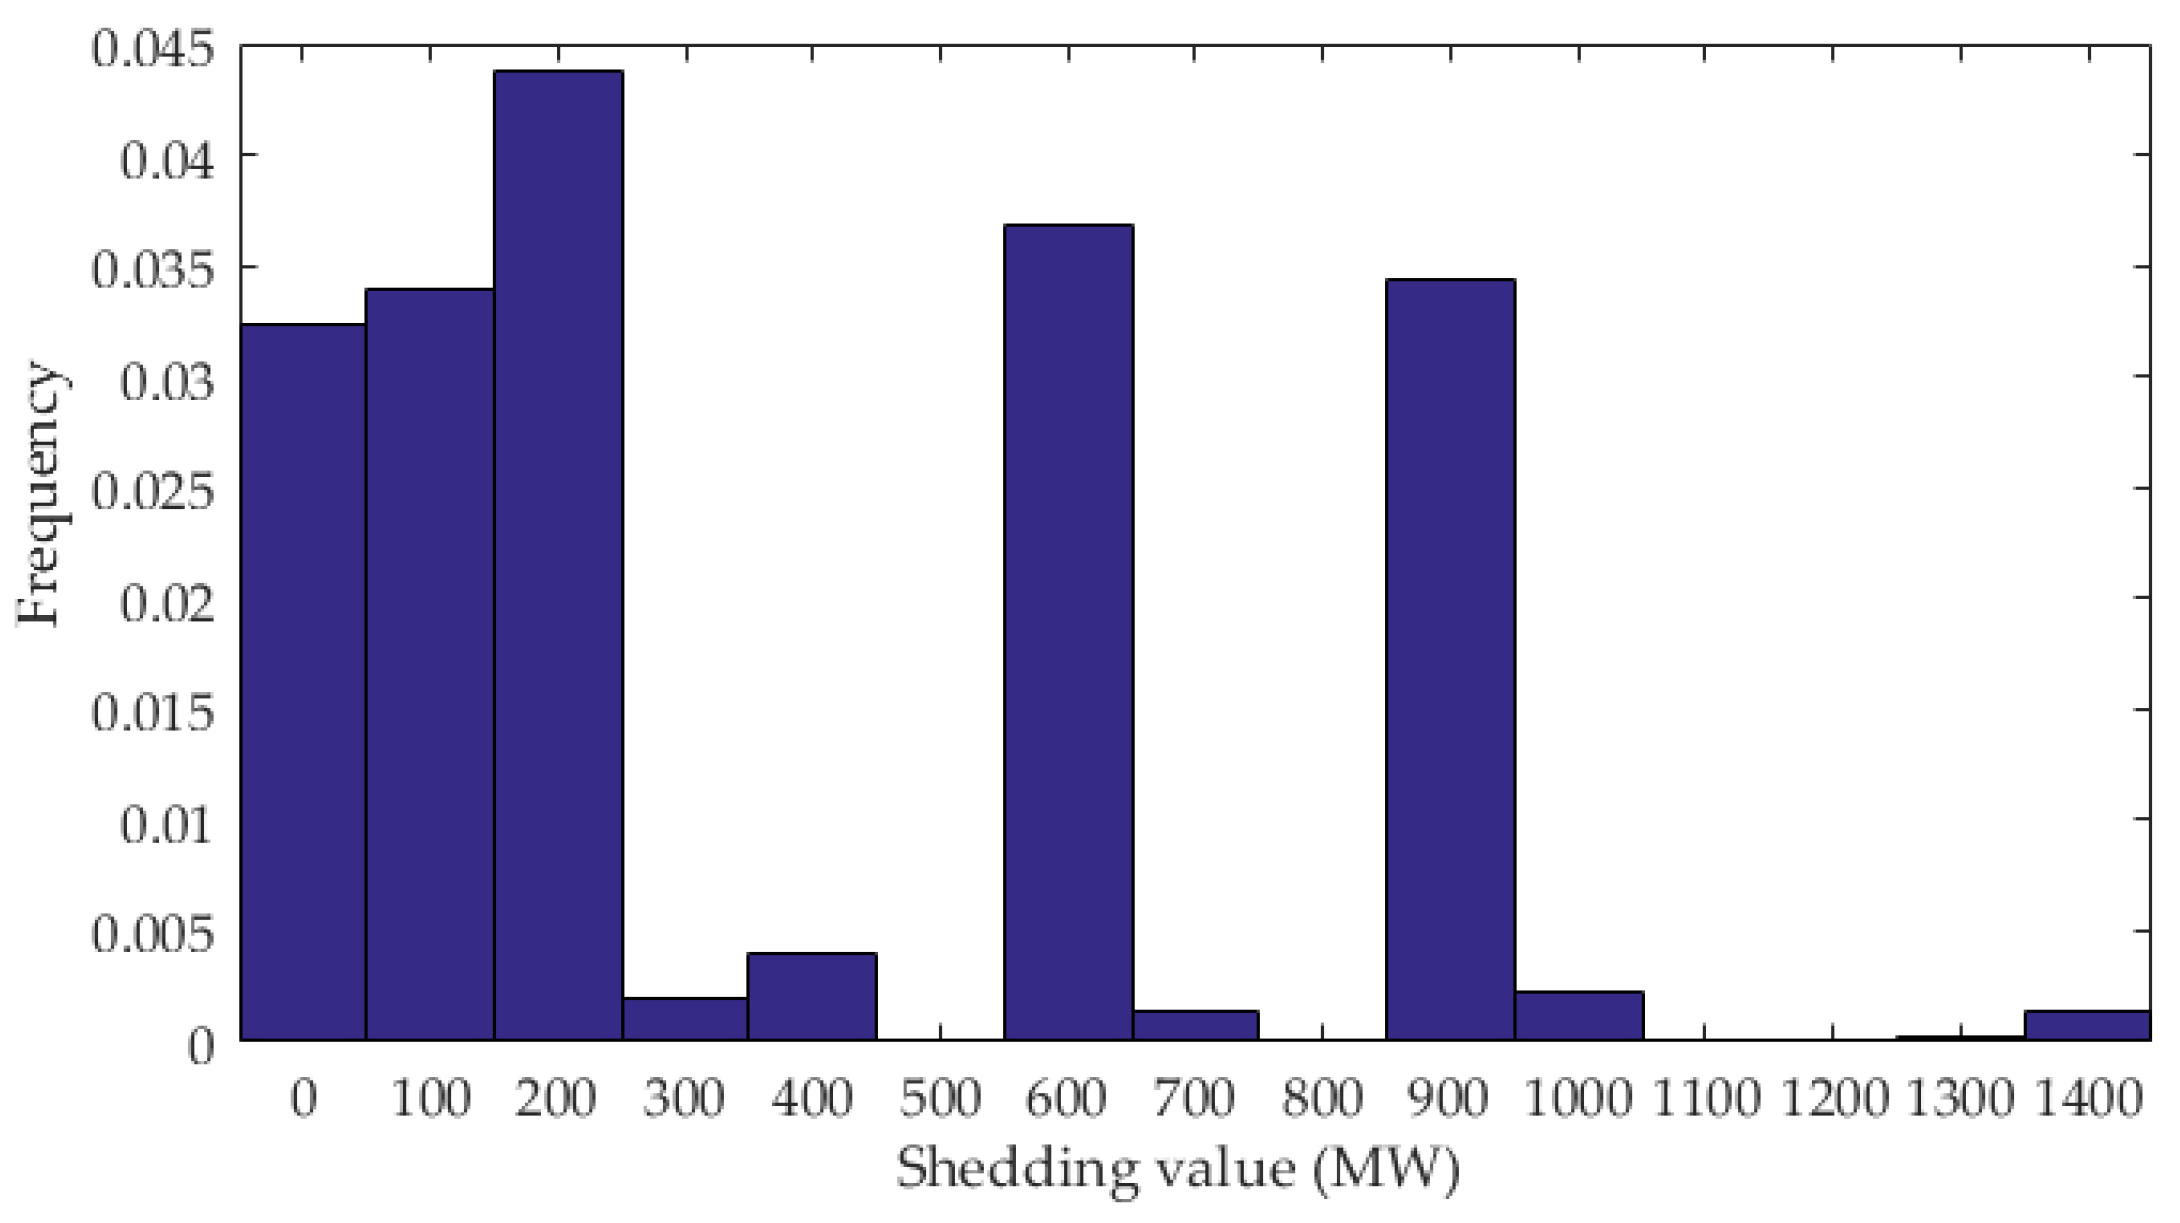
To investigate the shedding features, the shedding value is analyzed. As Figure 9 shows, the shedding value varies from 0 to 1450 MW. Most shedding values are between 0–250 MW, 550–650 MW, and 850–950 MW, and the distribution of shedding values are far from flat.
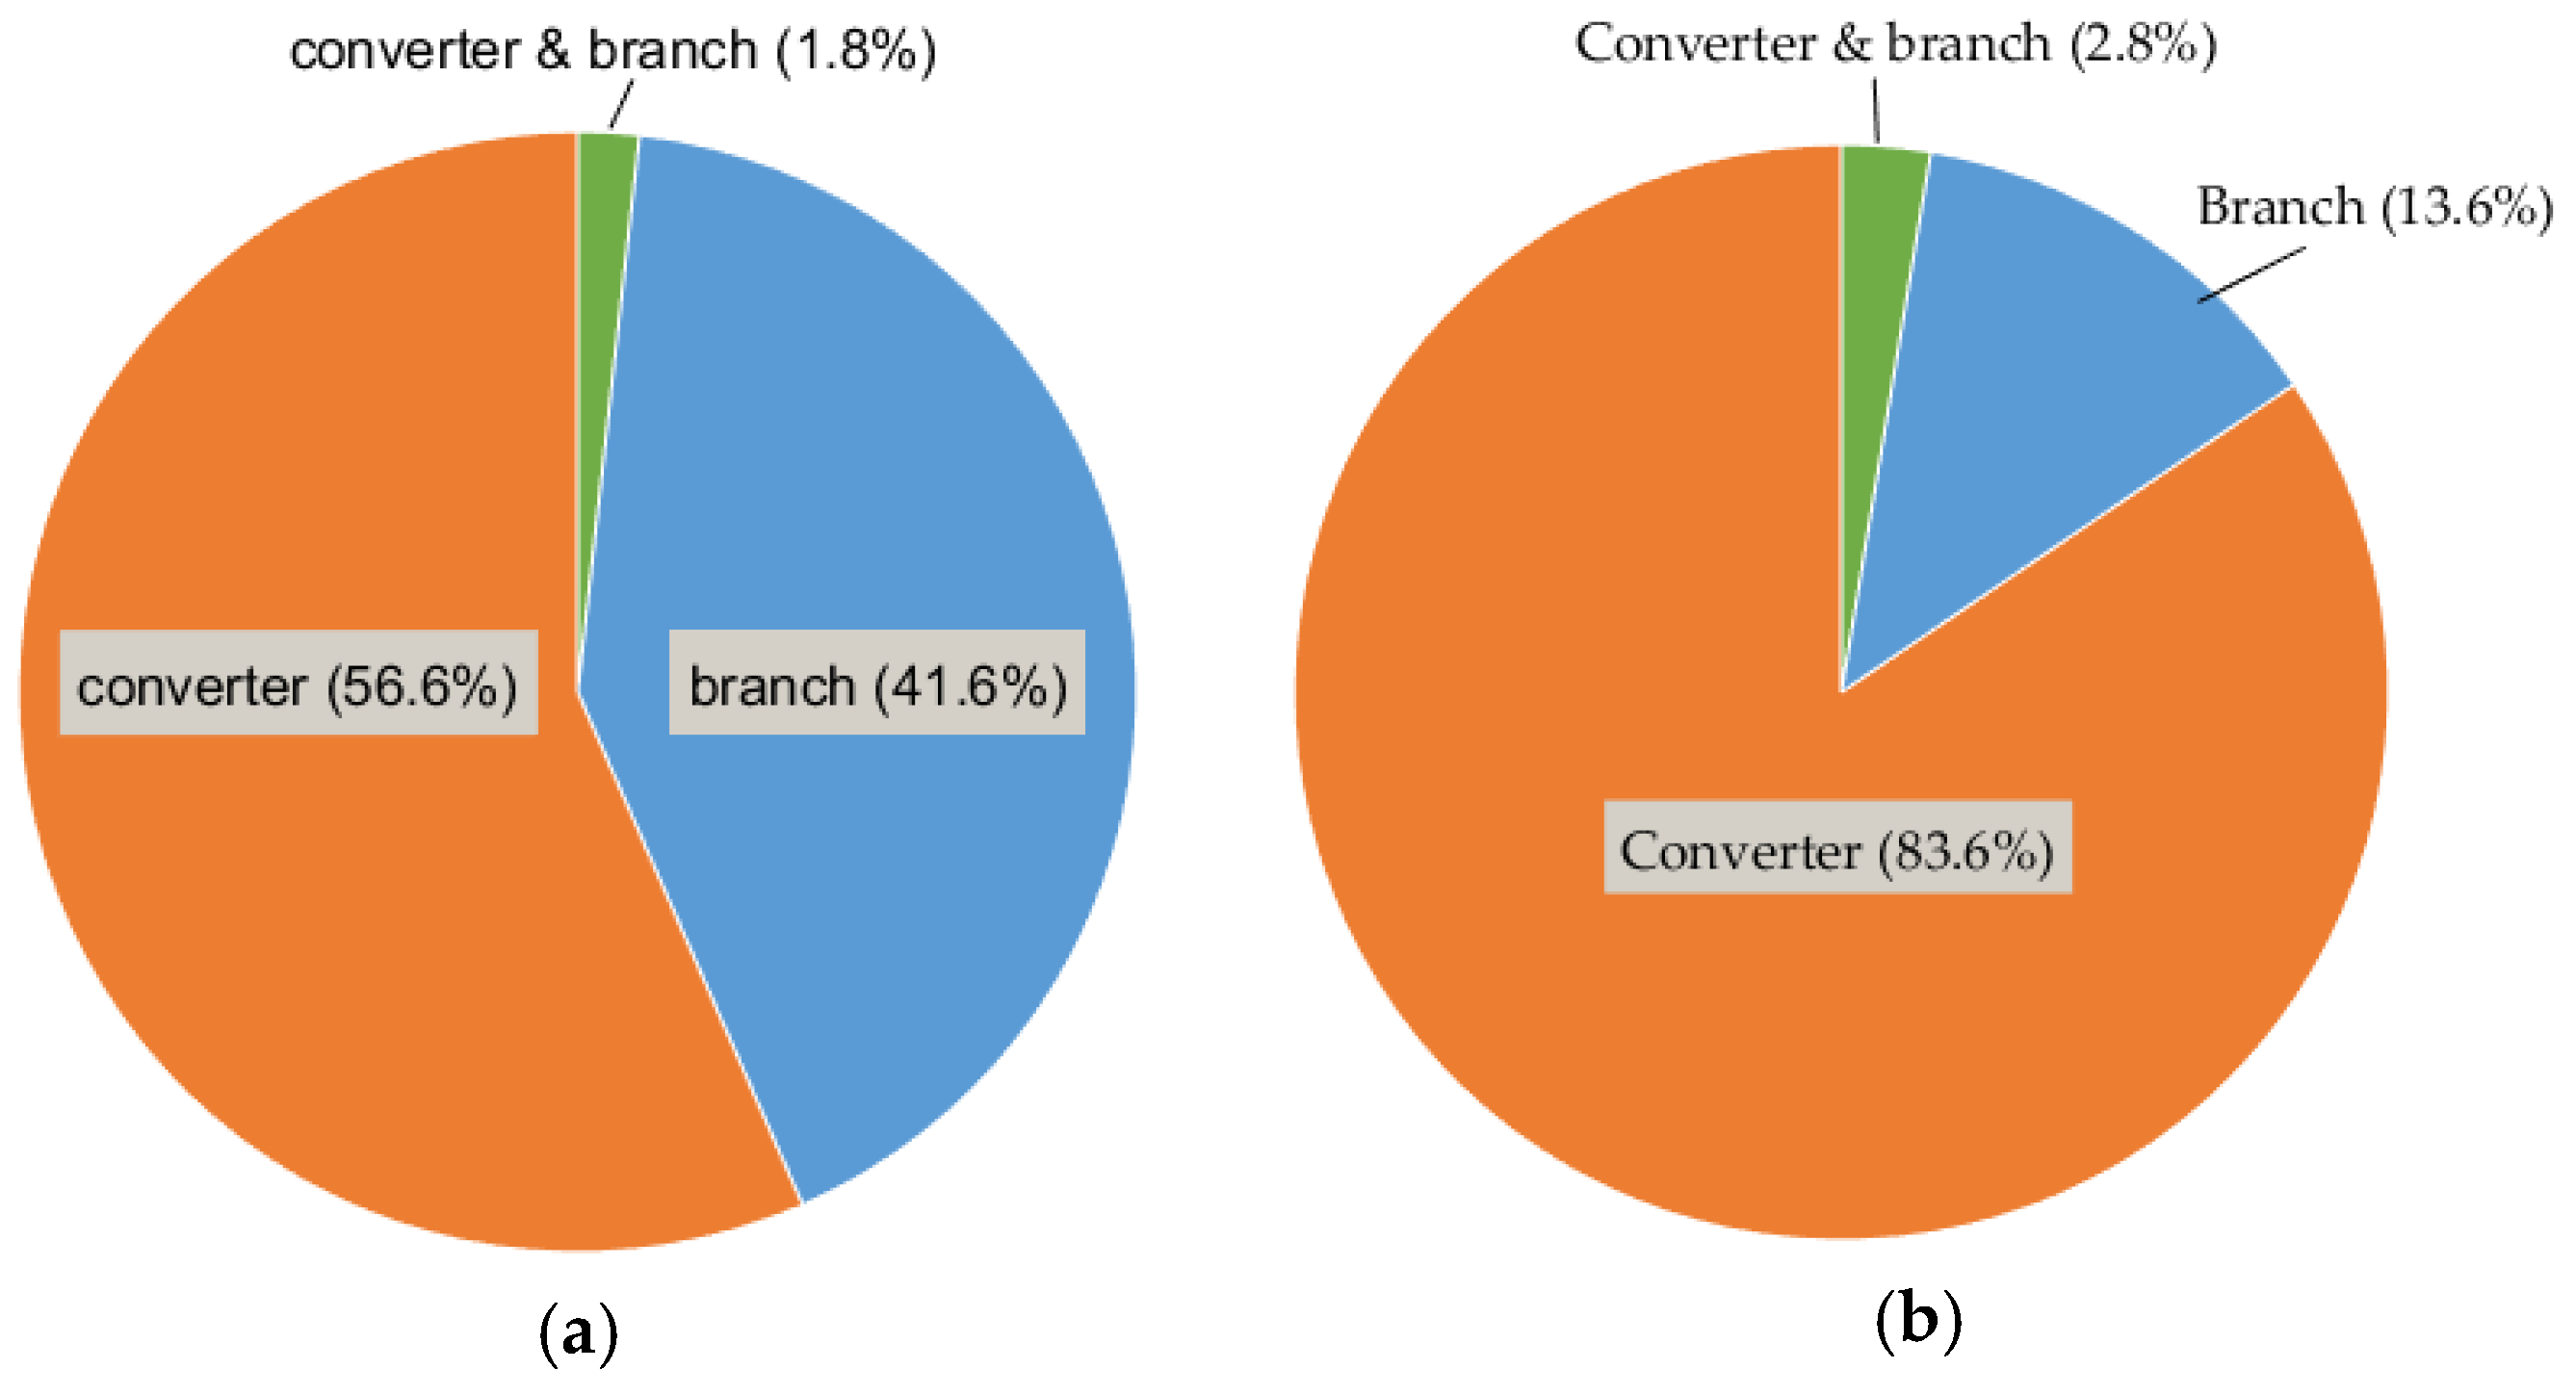
From the view of buses, as Figure 10 shows, most of the shedding load is located at bus 3, bus 7 and bus 14 where no AC connection between these buses to others. A small quantity of load is also shed at bus 5 and bus 6. At these buses, AC load can still be energized if only one of the converters fails. At bus 1 and bus 2, no parent shedding can be seen because AC generators can meet the power need at these buses regardless of the state of converters. Figure 11 also shows that converter failures lead to most shed load. Furthermore, most shed load due to branch failures are located at bus 7.
Further investigation is conducted on sources of shedding as Figure 11 shows. More than half of shedding states are due to converter failures, but these states account for the most of the shed load (approximately 84.5%). Therefore, converter failures are the main sources of shedding, which means reducing the failure rate and repair time of converter stations will be one of the effective means to promote the reliability of HVDC grids.
5.2. Continental Overlay HVDC Grid (40 buses)
The continental overlay HVDC grid is an imaginary HVDC grid laying on the current European (AC) grid. The grid is bipolar and the voltage rating is ±640 kV. In the grid, there are 40 DC buses and 52 transmission lines, and the total load is 26,700 MW. All integrated power sources are clean power, including 19,200 MW solar power from north of the Sahara, 2200 MW hydropower from Northern Europe and 7800 MW offshore wind power from Western Europe. The topology is shown in Figure 12. More details about the system can be found in [4].
The same reliability parameters of lines and converters are utilized in this grid as the data in CIGRE B4 DC grid test system, i.e., the data in Table 2. Each DC bus connects a converter station with a capacity of 2500 MW, in which there are two same converters.
The grid was evaluated with the proposed evaluation method via 10,000 samples, and the reliability indices are listed in Table 4. This grid is more reliable than CIGRE B4 DC grid test system as it has a lower LOLP and a higher EA.
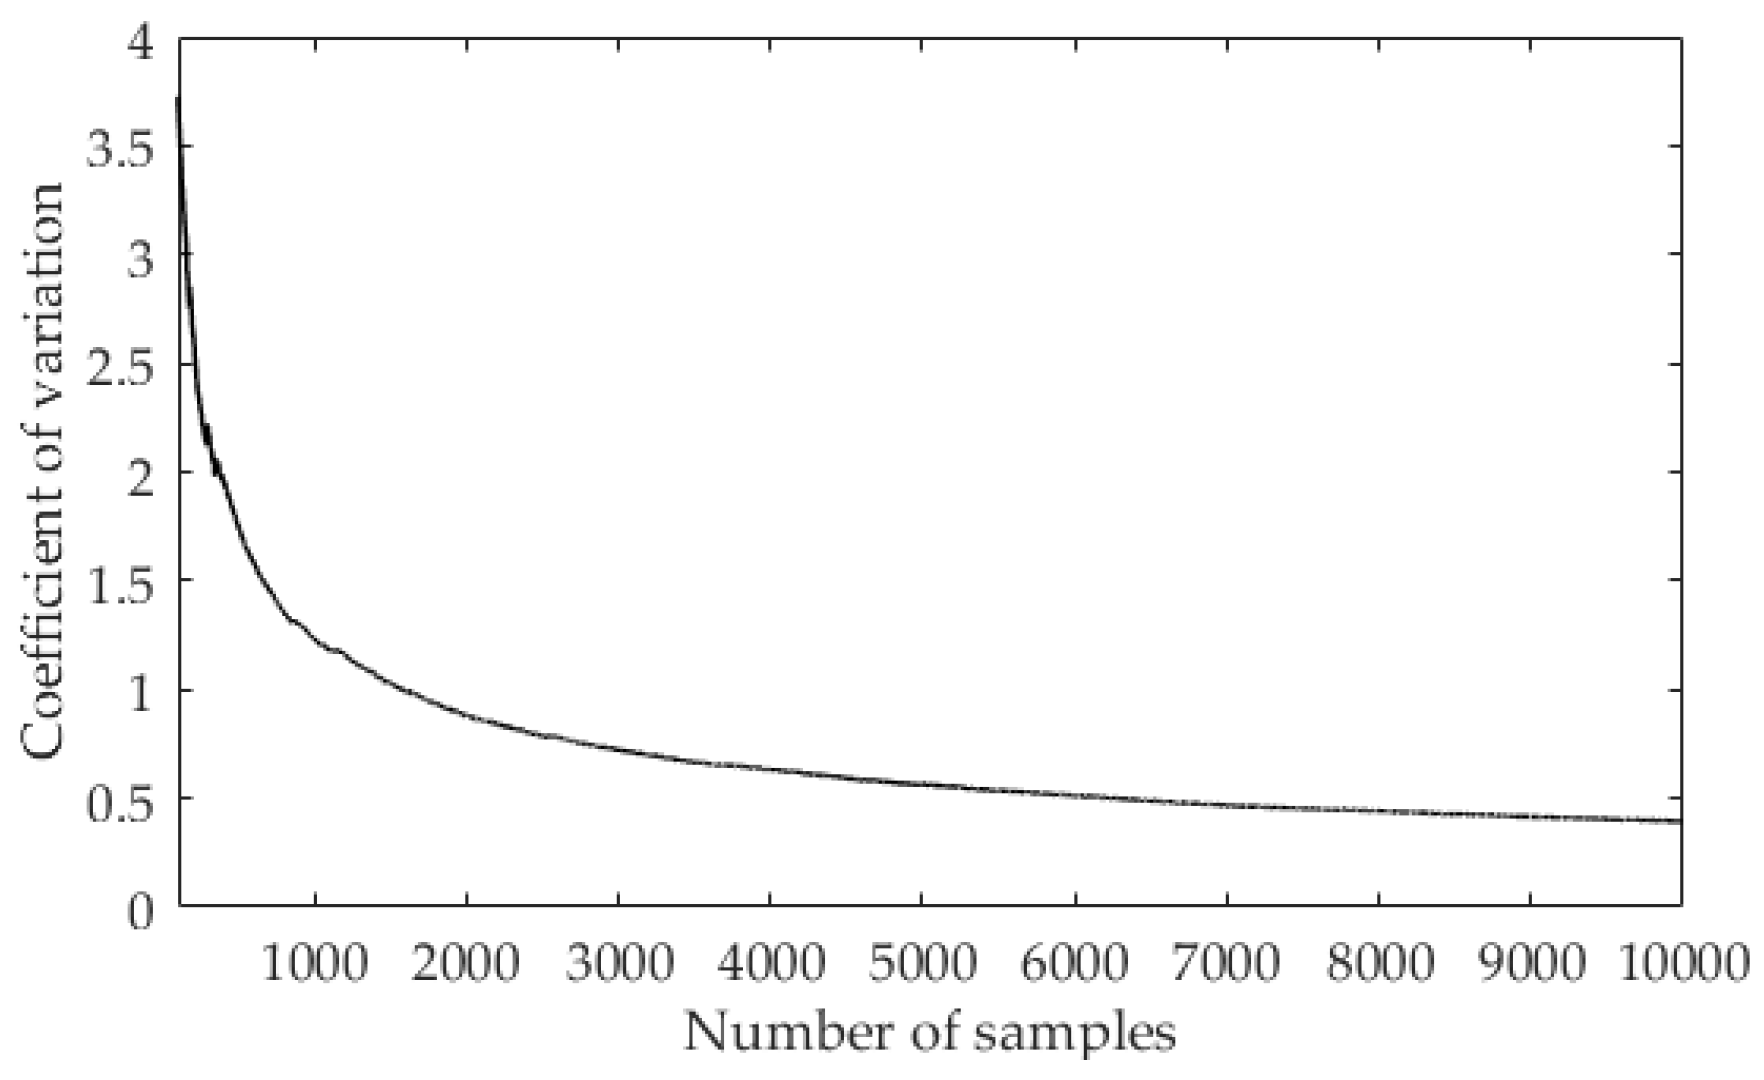
As Figure 13 shows, the coefficient of variation declines as the number of samples increases, but the falling speed becomes small gradually. Especially, when the number of samples overtakes 5000, the coefficient of variation decrease rather fairly slightly. It indicates that it is hard to improve the accuracy of evaluation results merely by increasing the number of samples.
To investigate the benefit of preliminary analysis, the reliability was re-evaluated with a method without preliminary analysis. The comparison of these two methods is shown in Table 5. As data in Table 5 show, more than 70% of the failure states are demonstrated as ‘no shedding’ states and these states are not evaluated with OLS. The efficiency of the proposed method is so remarkable that nearly 70% simulation time is saved with the preliminary analysis.
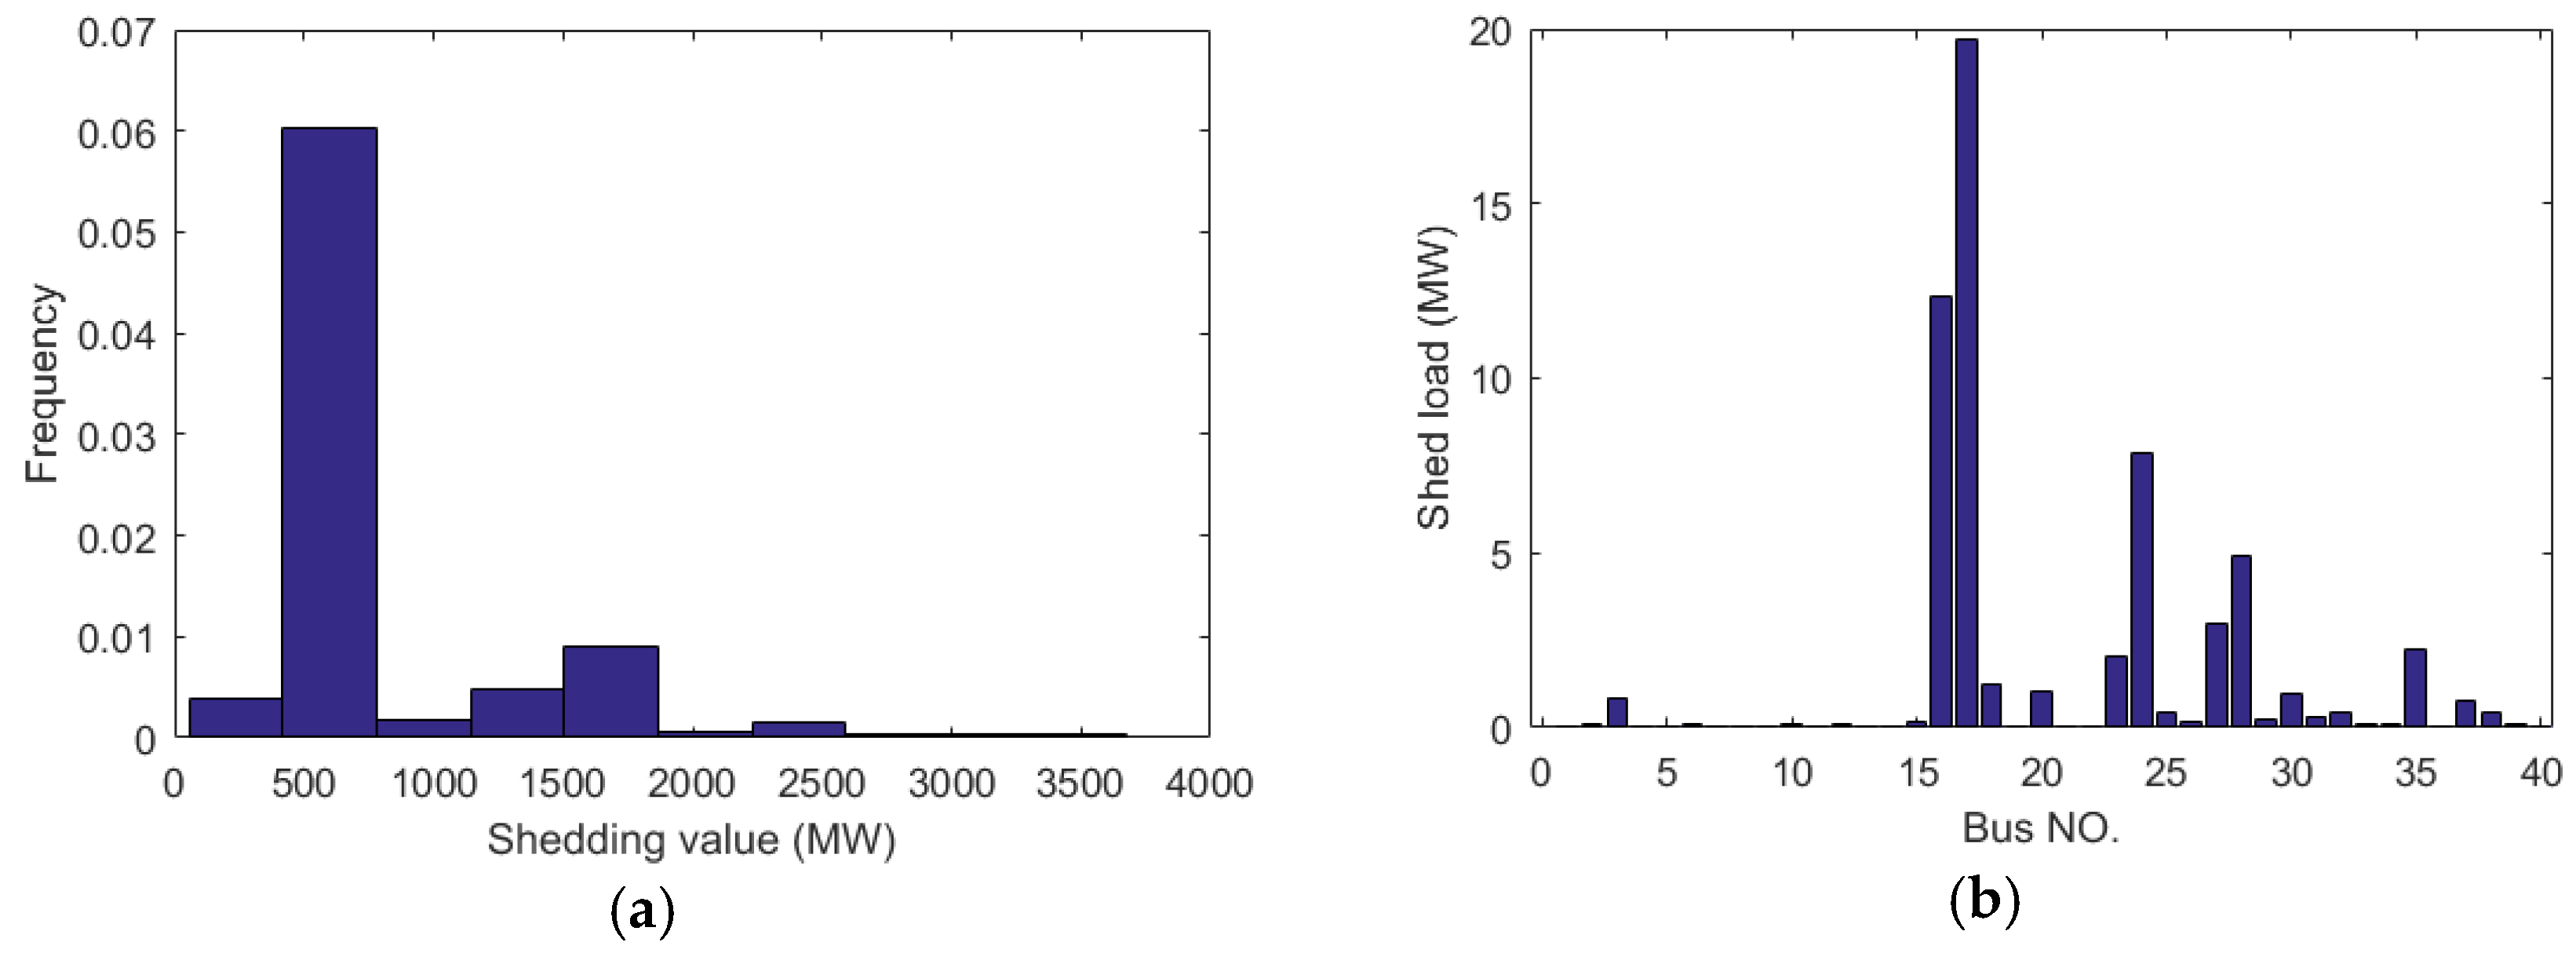
Similar to the data in Figure 9 and Figure 10, the shed load in Figure 14 are also distributed unevenly. In most shedding instances, shedding value located between 400–800 MW. For the view of buses, most shed load located at bus 16, bus 17, bus 24 and bus 28.
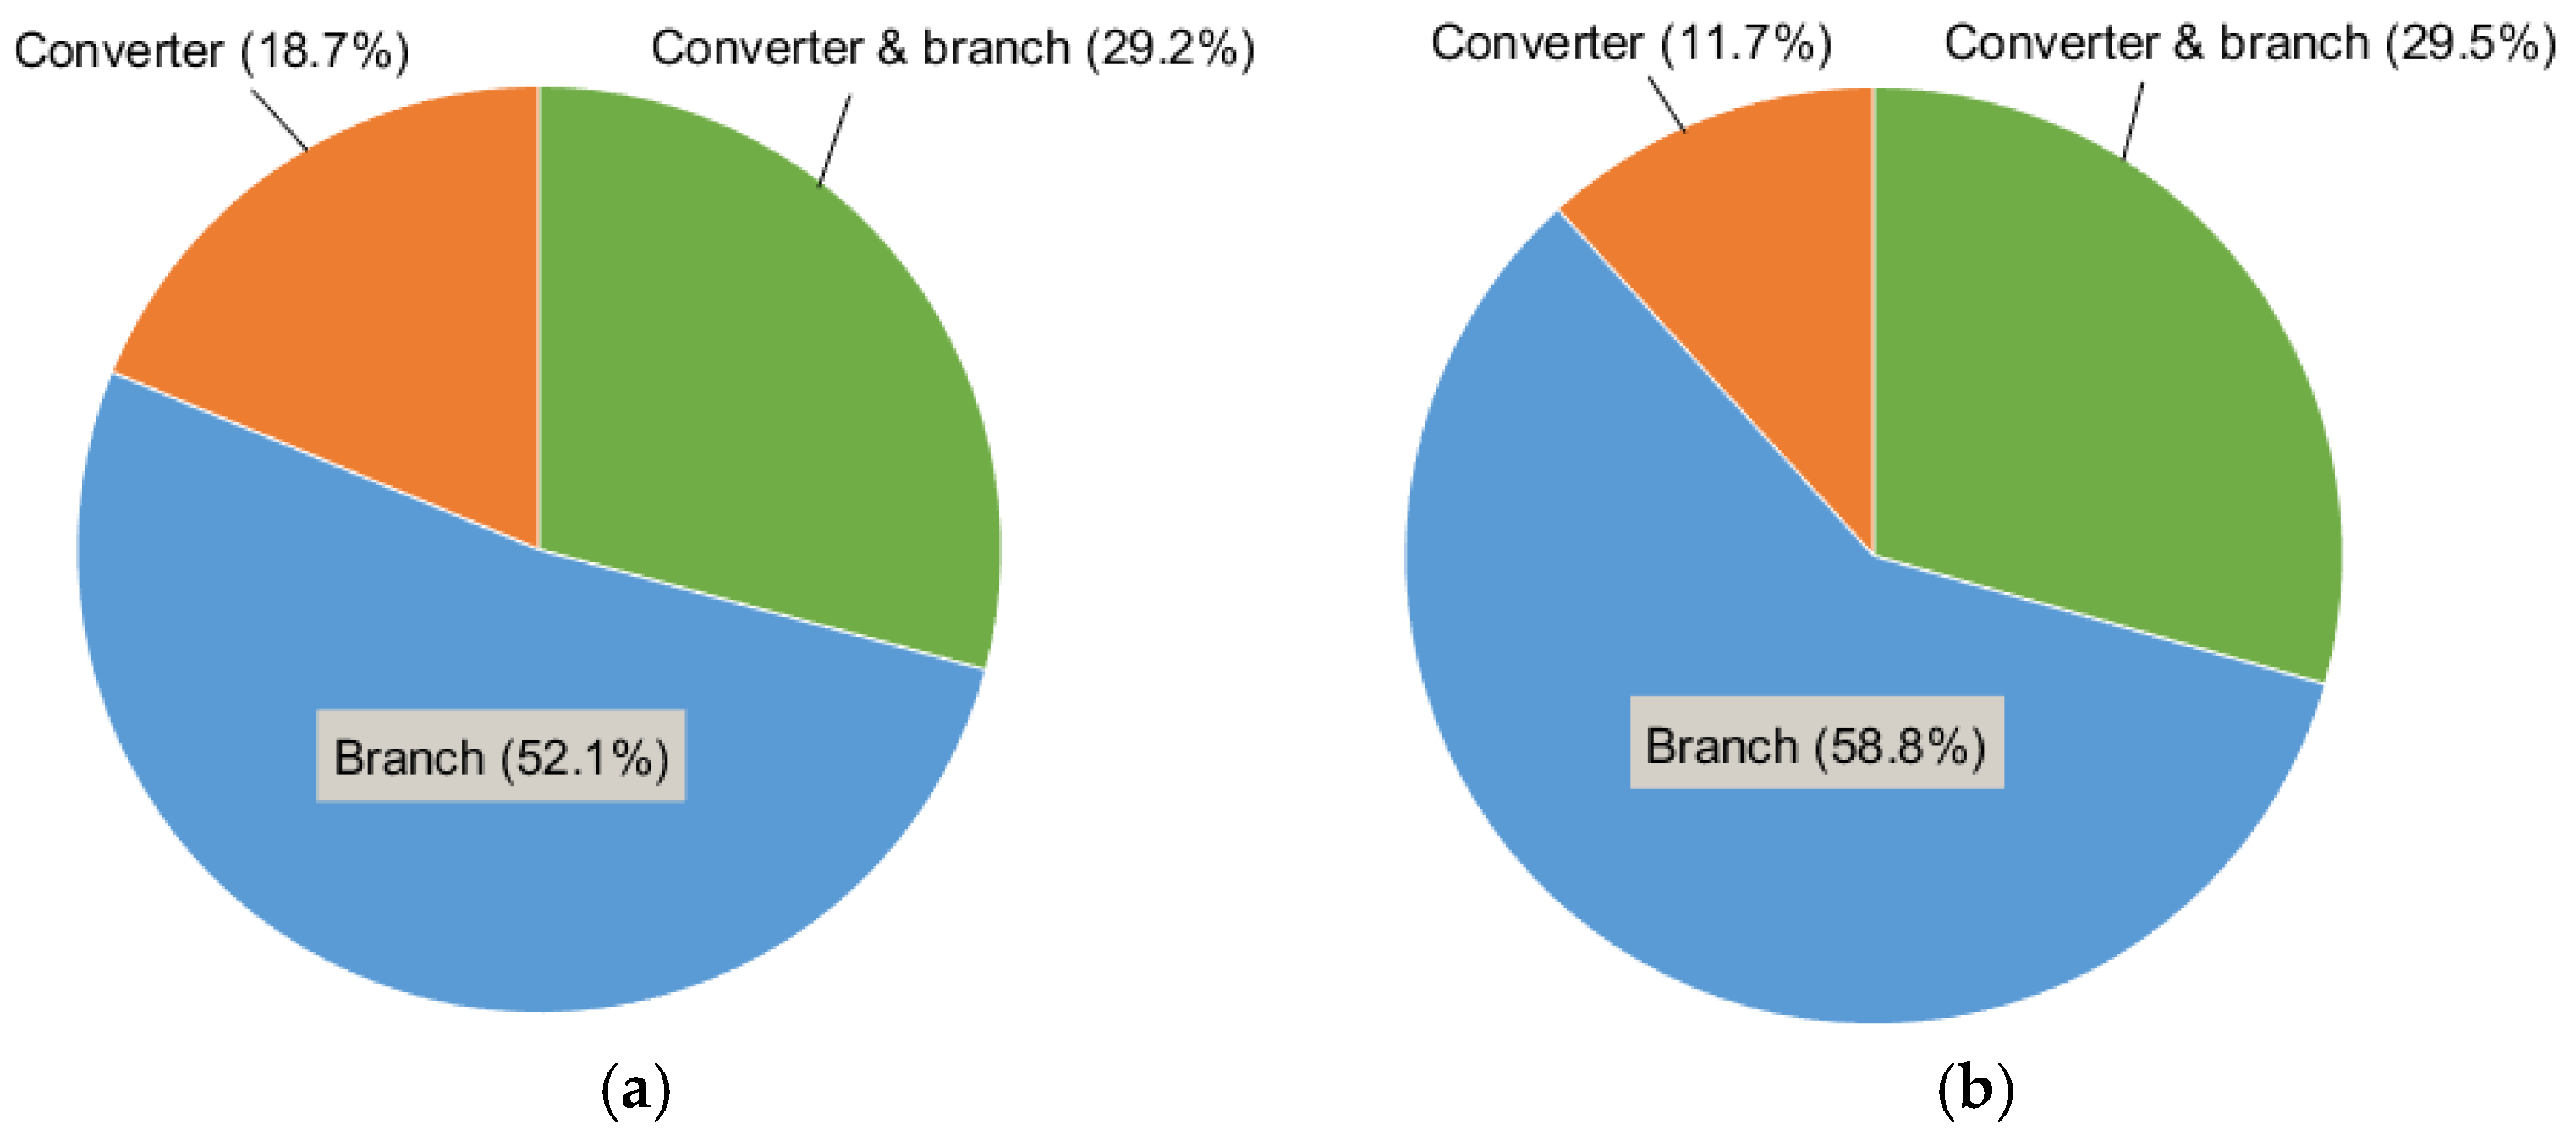
The sources of shedding are shown in Figure 15. Compared with the proportions in Figure 10, transmission line failures contribute more in the Continental Overlay HVDC Grid, which leads to more than half of shedding in terms of shedding times and shed power.
The solar power in the north of the Sahara accounts for 64% of the total installed generation capacity, and it is far from the load center. The power delivered via four separated power transmission corridors. Any branch failure in these corridors will lead to a loss of 4800 MW generation power. To solve this problem, this grid should be replanned or extended to a more reliable topology, for example, by adding connections between source buses in the north of the Sahara and enhancing the capacity of corridors. Therefore, it is reasonable that lines play a more important role in the reliability in this grid because of its unreliable topology. In this test grid, all converter stations are supposed to have two paralleled converters. This case is denoted as Case I. A case where each converter station contains only one converter with a capacity of 5000 MW is used here to investigate the impacts of the number of converters on the reliability and is called Case II. It is notable that the capacity of each station is the same in the two cases. The reliability of the grid in Case II is evaluated, and the obtained indices are listed in Table 6. The reliability of test system in Case II are much worse than that in Case I, because two converters per station can share the risk of failures and the capacity of one converter is enough for most fault states in Case I. This comparison also indicates that the reliability of converter (stations) are critical to the reliability of HVDC grids.
6. Conclusions
This paper has proposed for the first time a reliability evaluation method for densely meshed HVDC grids. Steady-state and reliability models were built first, where virtual AC buses were introduced to reduce the complexity. Then a hybrid reliability evaluation method combining analytical approach and Monte Carlo method was proposed, where analytical analysis was applied to accelerate the state evaluation. With proposed models and methods, the reliability of two HVDC grids, namely CIGRE B4 DC grid test system and Continental Overlay HVDC grid, was analyzed. From the reliability evaluation and analysis, the following conclusions can be drawn:
- (1)
- HVDC grids tend to be more reliable than two-terminal VSC-HVDC transmission systems. In an HVDC grid, power demand can be met by multiple sources, so the absence of a few sources does not certainly induce load shedding. From the view of reliability, an HVDC grid is preferable to multiple two-terminal VSC-HVDC transmission systems.
- (2)
- In reliability evaluation, HVDC grids under most failure states (70% for the test grid) tend to shed no load except on buses connected directly to fault converters. Consequently, the introduction of the analytical analysis can reduce simulation time sharply after it eliminates unnecessary executions of optimal load shedding.
- (3)
- The reliability of HVDC grids is determined by the grids’ topology and the availability of converters and transmission lines. Case studies show the reliability of converters plays a dominating role. Provided the total capacity of the converter station is given, more converters with smaller capacity in a converter station are helpful to promote the reliability. The reliability and capacity of lines also plays an important role, especially in an HVDC grid with a vulnerable topology.
- (4)
- The Continental Overlay HVDC grid topology is unreliable. Solar power, main power sources of the grid, are delivered to the remote load center separately by four corridors. Any failure in these corridors can lead to transmission congestion and induce a further power supply shortage.
The hybrid reliability evaluation method proves efficient, resulting from the introduction of the analytical algorithm. The proposed method is probabilistic in the paper while deterministic evaluation methods are also widely used, such as N-1 contingency analysis. The proposed analytical algorithm also effects for deterministic methods. Most deterministic evaluation methods for meshed grids only take lower-order failure states into account and these failure states are more likely not to shed, so the benefits of the analytical algorithm can even perform better. Also, the analytic algorithm is advantageous to handle N-1 security constraints in planning and scheduling of HVDC grids.
Acknowledgments
This work was partially supported by the National Key Research and Development Program of China (2016YFB0901900).
Author Contributions
Haipeng Xie conceived and performed the research; Haipeng Xie and Yanling Lin wrote the paper; Chao Zheng processed the data; Zhaohong Bie revised the manuscript. All of the authors were involved in preparing this manuscript.
Conflicts of Interest
The authors declare no conflict of interest.
References
- Liu, Z. Ultra-High Voltage AC/DC Grids, 1st ed.; Academic Press: Waltham, MA, USA, 2015. [Google Scholar]
- Shao, S.J.; Agelidis, V.G. Review of DC system technologies for large scale integration of wind energy systems with electricity grids. Energies 2010, 3, 1303–1319. [Google Scholar] [CrossRef]
- Van Hertem, D.; Ghandhari, M. Multi-terminal VSC HVDC for the European supergrid: Obstacles. Renew. Sustain. Energy Rev. 2010, 14, 3156–3163. [Google Scholar] [CrossRef]
- Asplund, G.; Lindén, K.; Barker, C.; Marzin, A.; Baur, U.; Pahalawaththa, N.; Beerten, J.; Rashwan, M.; Christensen, P.; Rittiger, J.; et al. HVDC grid feasibility study. Electra 2013, 50–59. [Google Scholar]
- Amamra, S.A.; Colas, F.; Guillaud, X.; Rault, P.; Nguefeu, S. Laboratory Demonstration of a Multi-Terminal VSC-HVDC Power Grid. IEEE Trans. Power Deliv. 2016, PP. [Google Scholar] [CrossRef]
- Akhmatov, V.; Callavik, M.; Franck, C.M.; Rye, S.E.; Ahndorf, T.; Bucher, M.K.; Müller, H.; Schettler, F.; Wiget, R. Technical Guidelines and Prestandardization Work for First HVDC Grids. IEEE Trans. Power Deliv. 2014, 29, 327–335. [Google Scholar] [CrossRef]
- Pinto, R.T.; Rodrigues, S.F.; Wiggelinkhuizen, E.; Scherrer, R.; Bauer, P.; Pierik, J. Operation and power flow control of multi-terminal DC networks for grid integration of offshore wind farms using genetic algorithms. Energies 2012, 6, 1–26. [Google Scholar] [CrossRef]
- Zhang, X.; Wu, Z.; Hu, M.; Li, X.; Lv, G. Coordinated Control Strategies of VSC-HVDC-Based Wind Power Systems for Low Voltage Ride Through. Energies 2015, 8, 7224–7242. [Google Scholar] [CrossRef]
- Li, H.; Liu, C.; Li, G.; Iravani, R. An Enhanced DC Voltage Droop-Control for the VSC-HVDC Grid. IEEE Trans. Power Syst. 2016, 32, 1520–1527. [Google Scholar] [CrossRef]
- Sau-Bassols, J.; Prieto-Araujo, E.; Gomis-Bellmunt, O. Modelling and control of an interline Current Flow Controller for meshed HVDC grids. IEEE Trans. Power Deliv. 2016, 32, 11–22. [Google Scholar] [CrossRef]
- Chen, W.; Zhu, X.; Yao, L.; Ning, G.; Li, Y.; Wang, Z.; Gu, W.; Qu, X. A Novel Interline DC Power-Flow Controller (IDCPFC) for Meshed HVDC Grids. IEEE Trans. Power Deliv. 2016, 31, 1719–1727. [Google Scholar] [CrossRef]
- Preece, R.; Milanović, J.V. Tuning of a Damping Controller for Multiterminal VSC-HVDC Grids Using the Probabilistic Collocation Method. IEEE Trans. Power Deliv. 2014, 29, 318–326. [Google Scholar] [CrossRef]
- Liu, G.; Xu, F.; Xu, Z.; Zhang, Z.; Tang, G. Assembly HVDC Breaker for HVDC Grids With Modular Multilevel Converters. IEEE Trans. Power Electron. 2017, 32, 931–941. [Google Scholar] [CrossRef]
- Sneath, J.; Rajapakse, A.D. Fault Detection and Interruption in an Earthed HVDC Grid Using ROCOV and Hybrid DC Breakers. IEEE Trans. Power Deliv. 2016, 31, 973–981. [Google Scholar] [CrossRef]
- Leterme, W.; Azad, S.P.; Hertem, D.V. A Local Backup Protection Algorithm for HVDC Grids. IEEE Trans. Power Deliv. 2016, 31, 1767–1775. [Google Scholar] [CrossRef]
- Leterme, W.; Beerten, J.; Hertem, D.V. Nonunit Protection of HVDC Grids With Inductive DC Cable Termination. IEEE Trans. Power Deliv. 2016, 31, 820–828. [Google Scholar] [CrossRef]
- Haileselassie, T.M.; Uhlen, K. Power System Security in a Meshed North Sea HVDC Grid. Proc. IEEE 2013, 101, 978–990. [Google Scholar] [CrossRef]
- Billiton, R.; Allan, R. Reliability Evaluation of Engineering Systems: Concepts and Techniques, 2nd ed.; Plenum Press: New York, NY, USA, 1992. [Google Scholar]
- MacIver, C.; Bell, K.R.W.; Nedić, D.P. A Reliability Evaluation of Offshore HVDC Grid Configuration Options. IEEE Trans. Power Deliv. 2016, 31, 810–819. [Google Scholar] [CrossRef]
- Li, C.; Hu, X.; Guo, J.; Liang, J. The DC Grid Reliability and Cost Evaluation with Zhoushan Five-Terminal HVDC Case Study. In Proceedings of the 2015 50th International Universities Power Engineering Conference (UPEC), Staffordshire, UK, 1–4 September 2015; pp. 1–6. [Google Scholar]
- Hasan, K.N.; Saha, T.K. Reliability and Economic Study of Multi-Terminal HVDC with LCC & VSC Converter for Connecting Remote Renewable Generators to the Grid. In Proceedings of the 2013 IEEE PES General Meeting, Vancouver, BC, Canada, 21–25 July 2013; pp. 1–5. [Google Scholar]
- Bucher, M.K.; Wiget, R.; Andersson, G.; Franck, C.M. Multiterminal HVDC networks—What is the preferred topology? IEEE Trans. Power Deliv. 2014, 29, 406–413. [Google Scholar] [CrossRef]
- Li, W. Elements of Risk Evaluation Methods. In Risk Assessment Of Power Systems: Models, Methods, and Applications; Wiley-IEEE Press: Hoboken, NJ, USA, 2005; pp. 69–87. [Google Scholar]
- Guo, J.; Wang, X.; Bie, Z.; Hou, Y. Reliability Modeling and Evaluation of VSC-HVDC Transmission Systems. In Proceedings of the 2014 IEEE PES General Meeting, Washington, DC, USA, 27–31 July 2014; pp. 1–5. [Google Scholar]
- Yan, C.; Ding, T.; Bie, Z.; Wang, X. A Geometric Programming to Importance Sampling for Power System Reliability Evaluation. IEEE Trans. Power Syst. 2017, 32, 1568–1569. [Google Scholar]
- Tomasson, E.; Soder, L. Improved Importance Sampling for Reliability Evaluation of Composite Power Systems. IEEE Trans. Power Syst. 2016, 32, 2426–2434. [Google Scholar] [CrossRef]
- Vrana, T.K.; Yang, Y.; Jovcic, D.; Dennetière, S.; Jardini, J.; Saad, H. The CIGRE B4 DC grid test system. Electra 2013, 270, 10–19. [Google Scholar]
- Subcommittee, P.M. IEEE Reliability Test System. IEEE Trans. Power Appar. Syst. 1979, PAS-98, 2047–2054. [Google Scholar] [CrossRef]
Figure 1.
Schematic diagram of an HVDC grid.
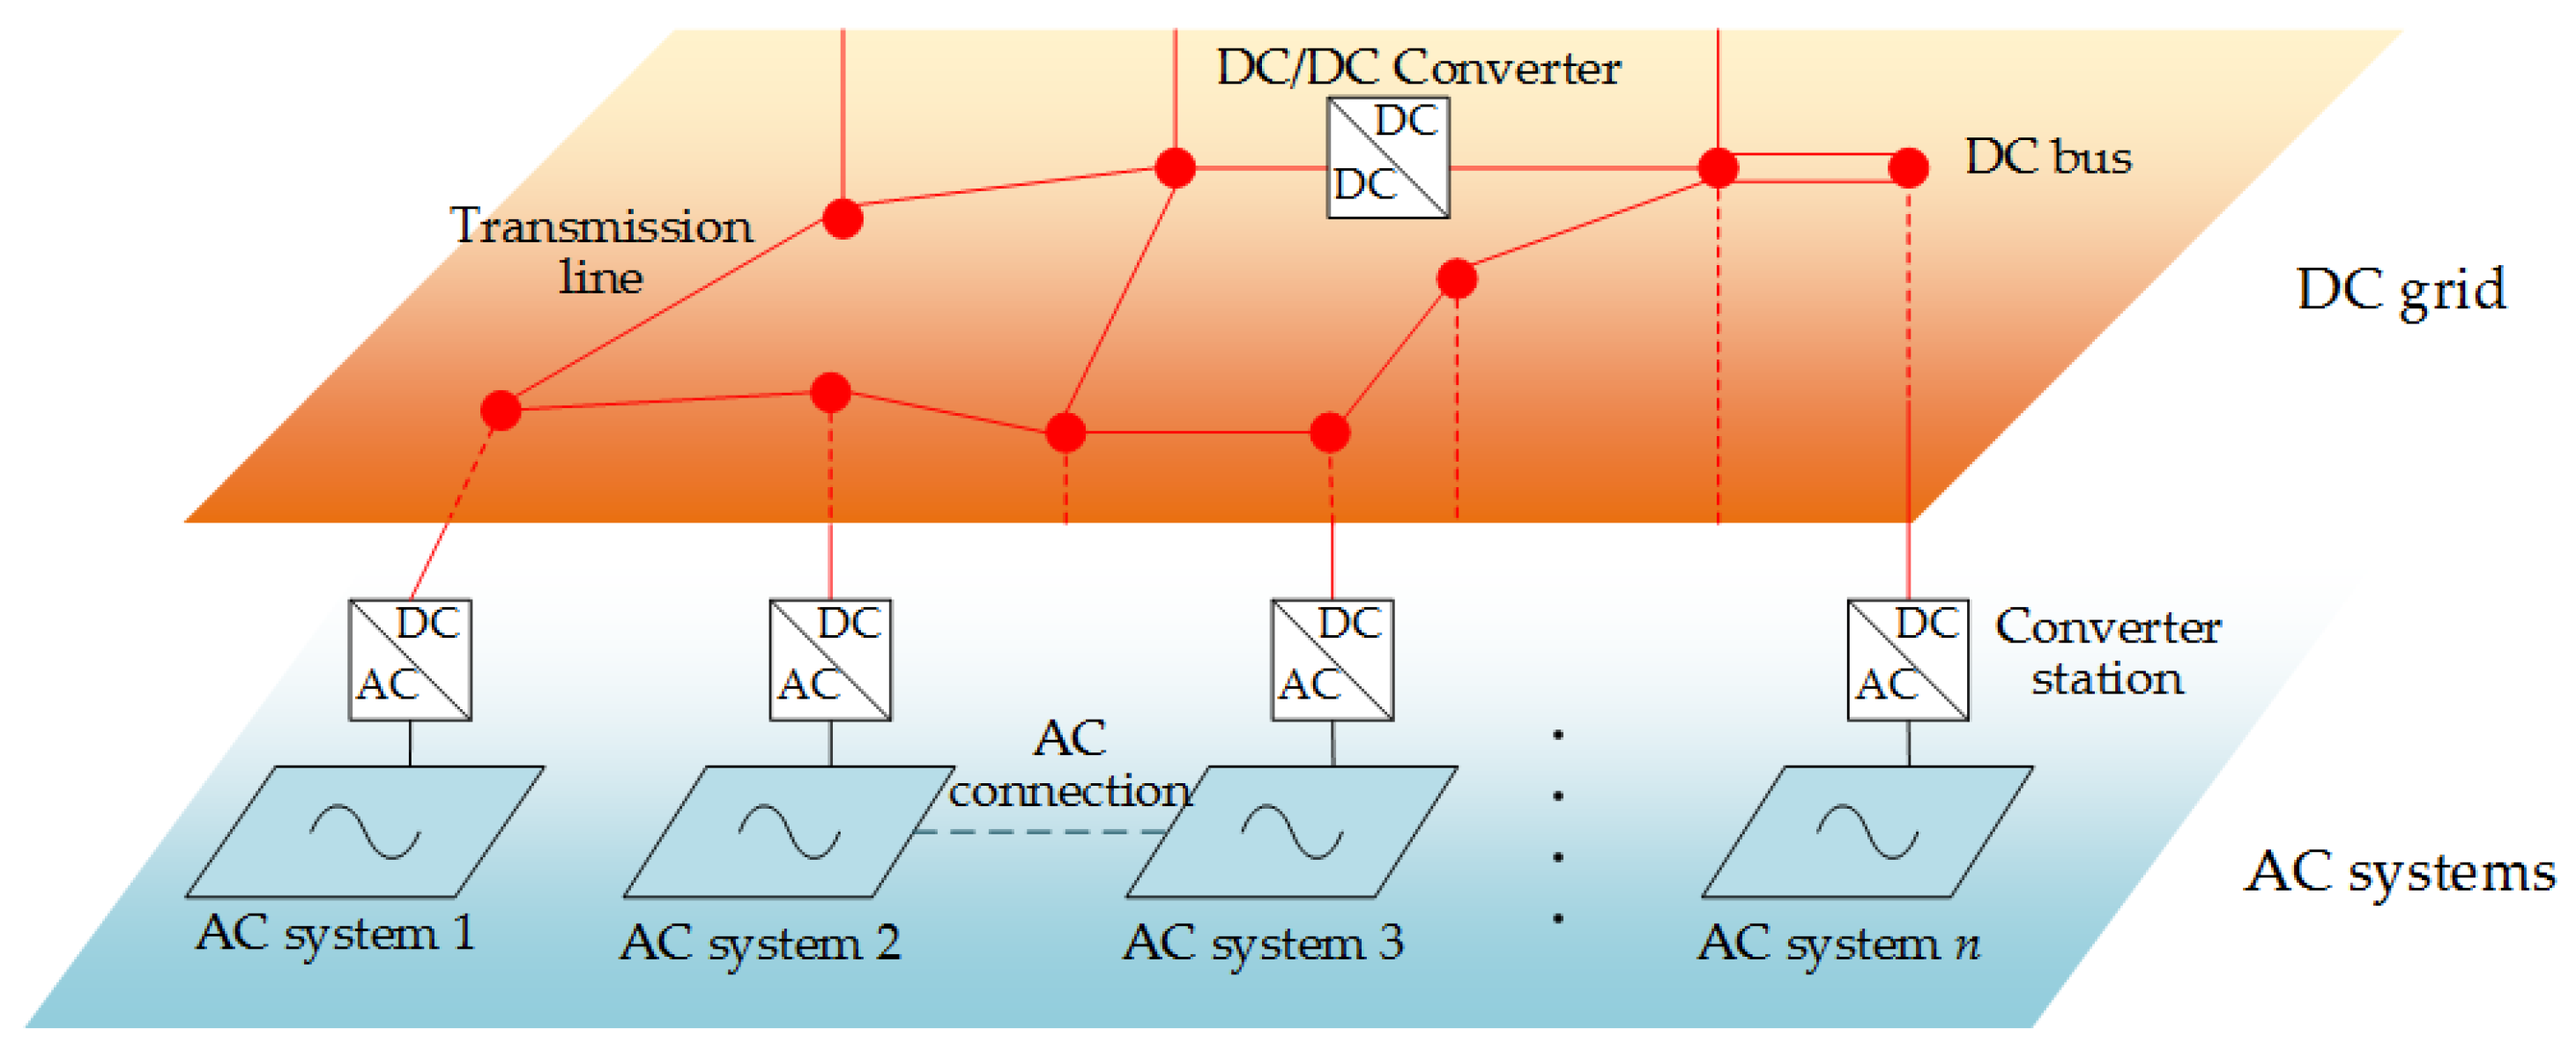
Figure 2.
Schematic diagram of a converter station based on VSC. (a) Original schematic diagram; and (b) equivalent schematic diagram.
Figure 2.
Schematic diagram of a converter station based on VSC. (a) Original schematic diagram; and (b) equivalent schematic diagram.

Figure 3.
Two-state model for a converter station.

Figure 4.
Transmission branch containing a DC/DC converter.

Figure 5.
Venn diagram of grid states.
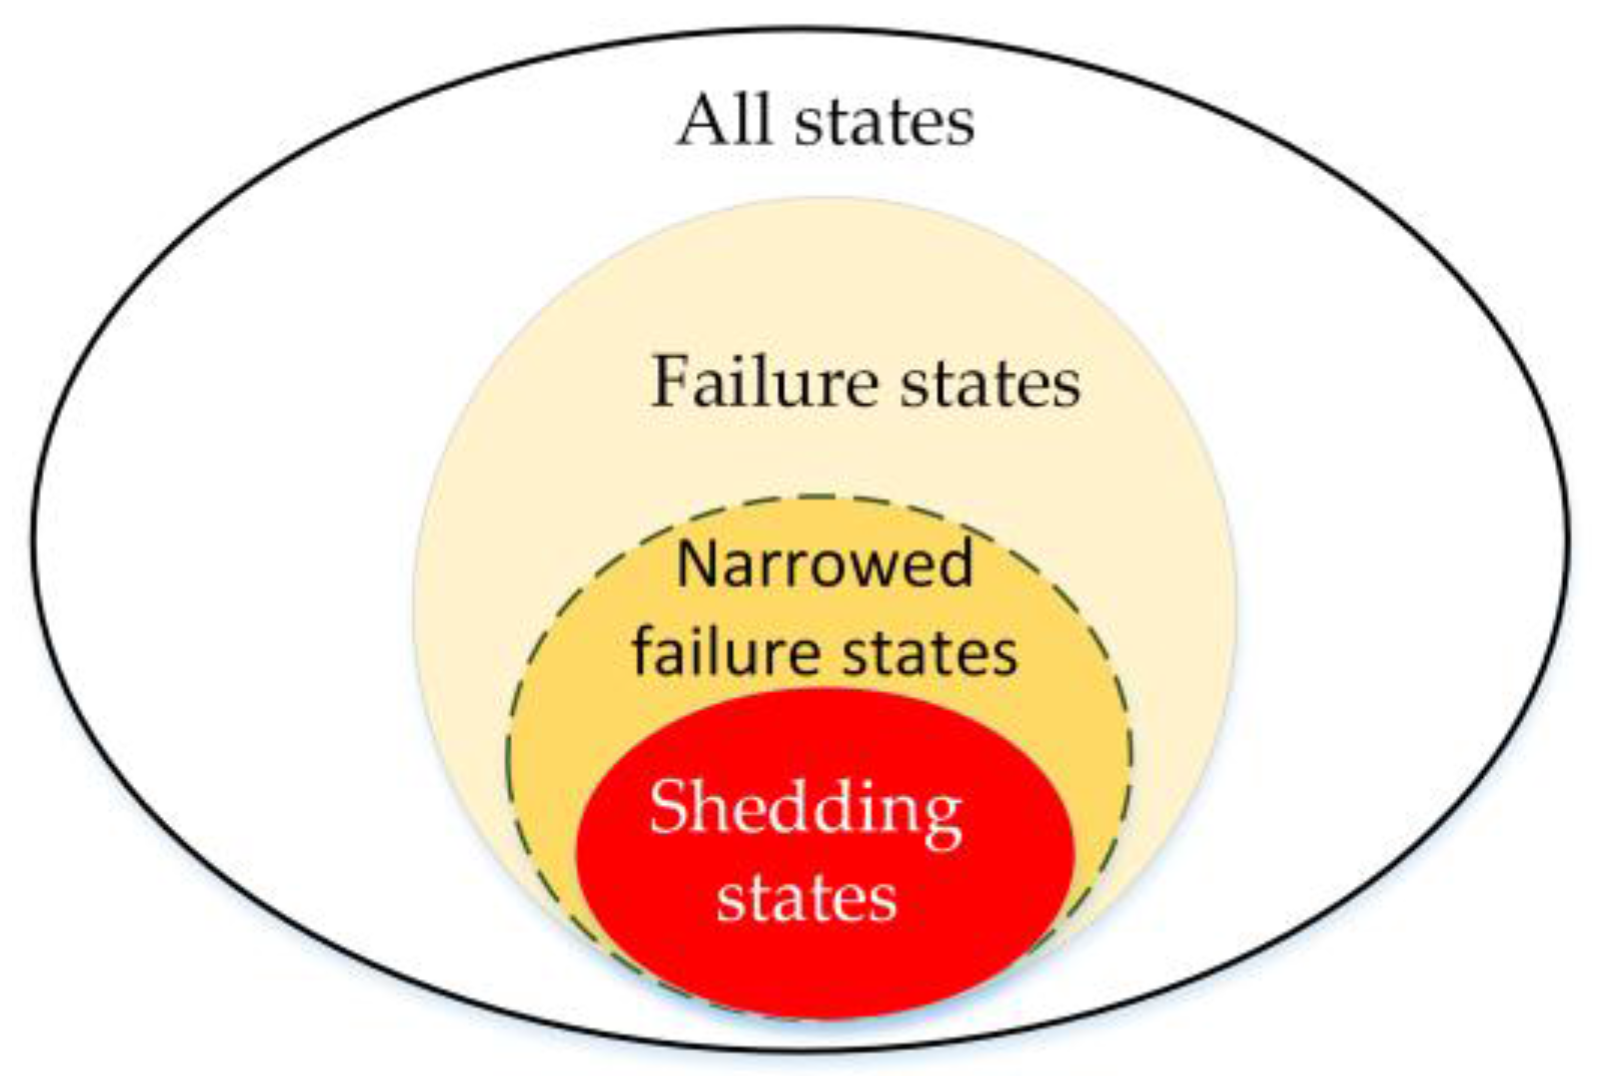
Figure 6.
Flowchart of the preliminary analysis.

Figure 7.
Reliability evaluation procedure of HVDC grids
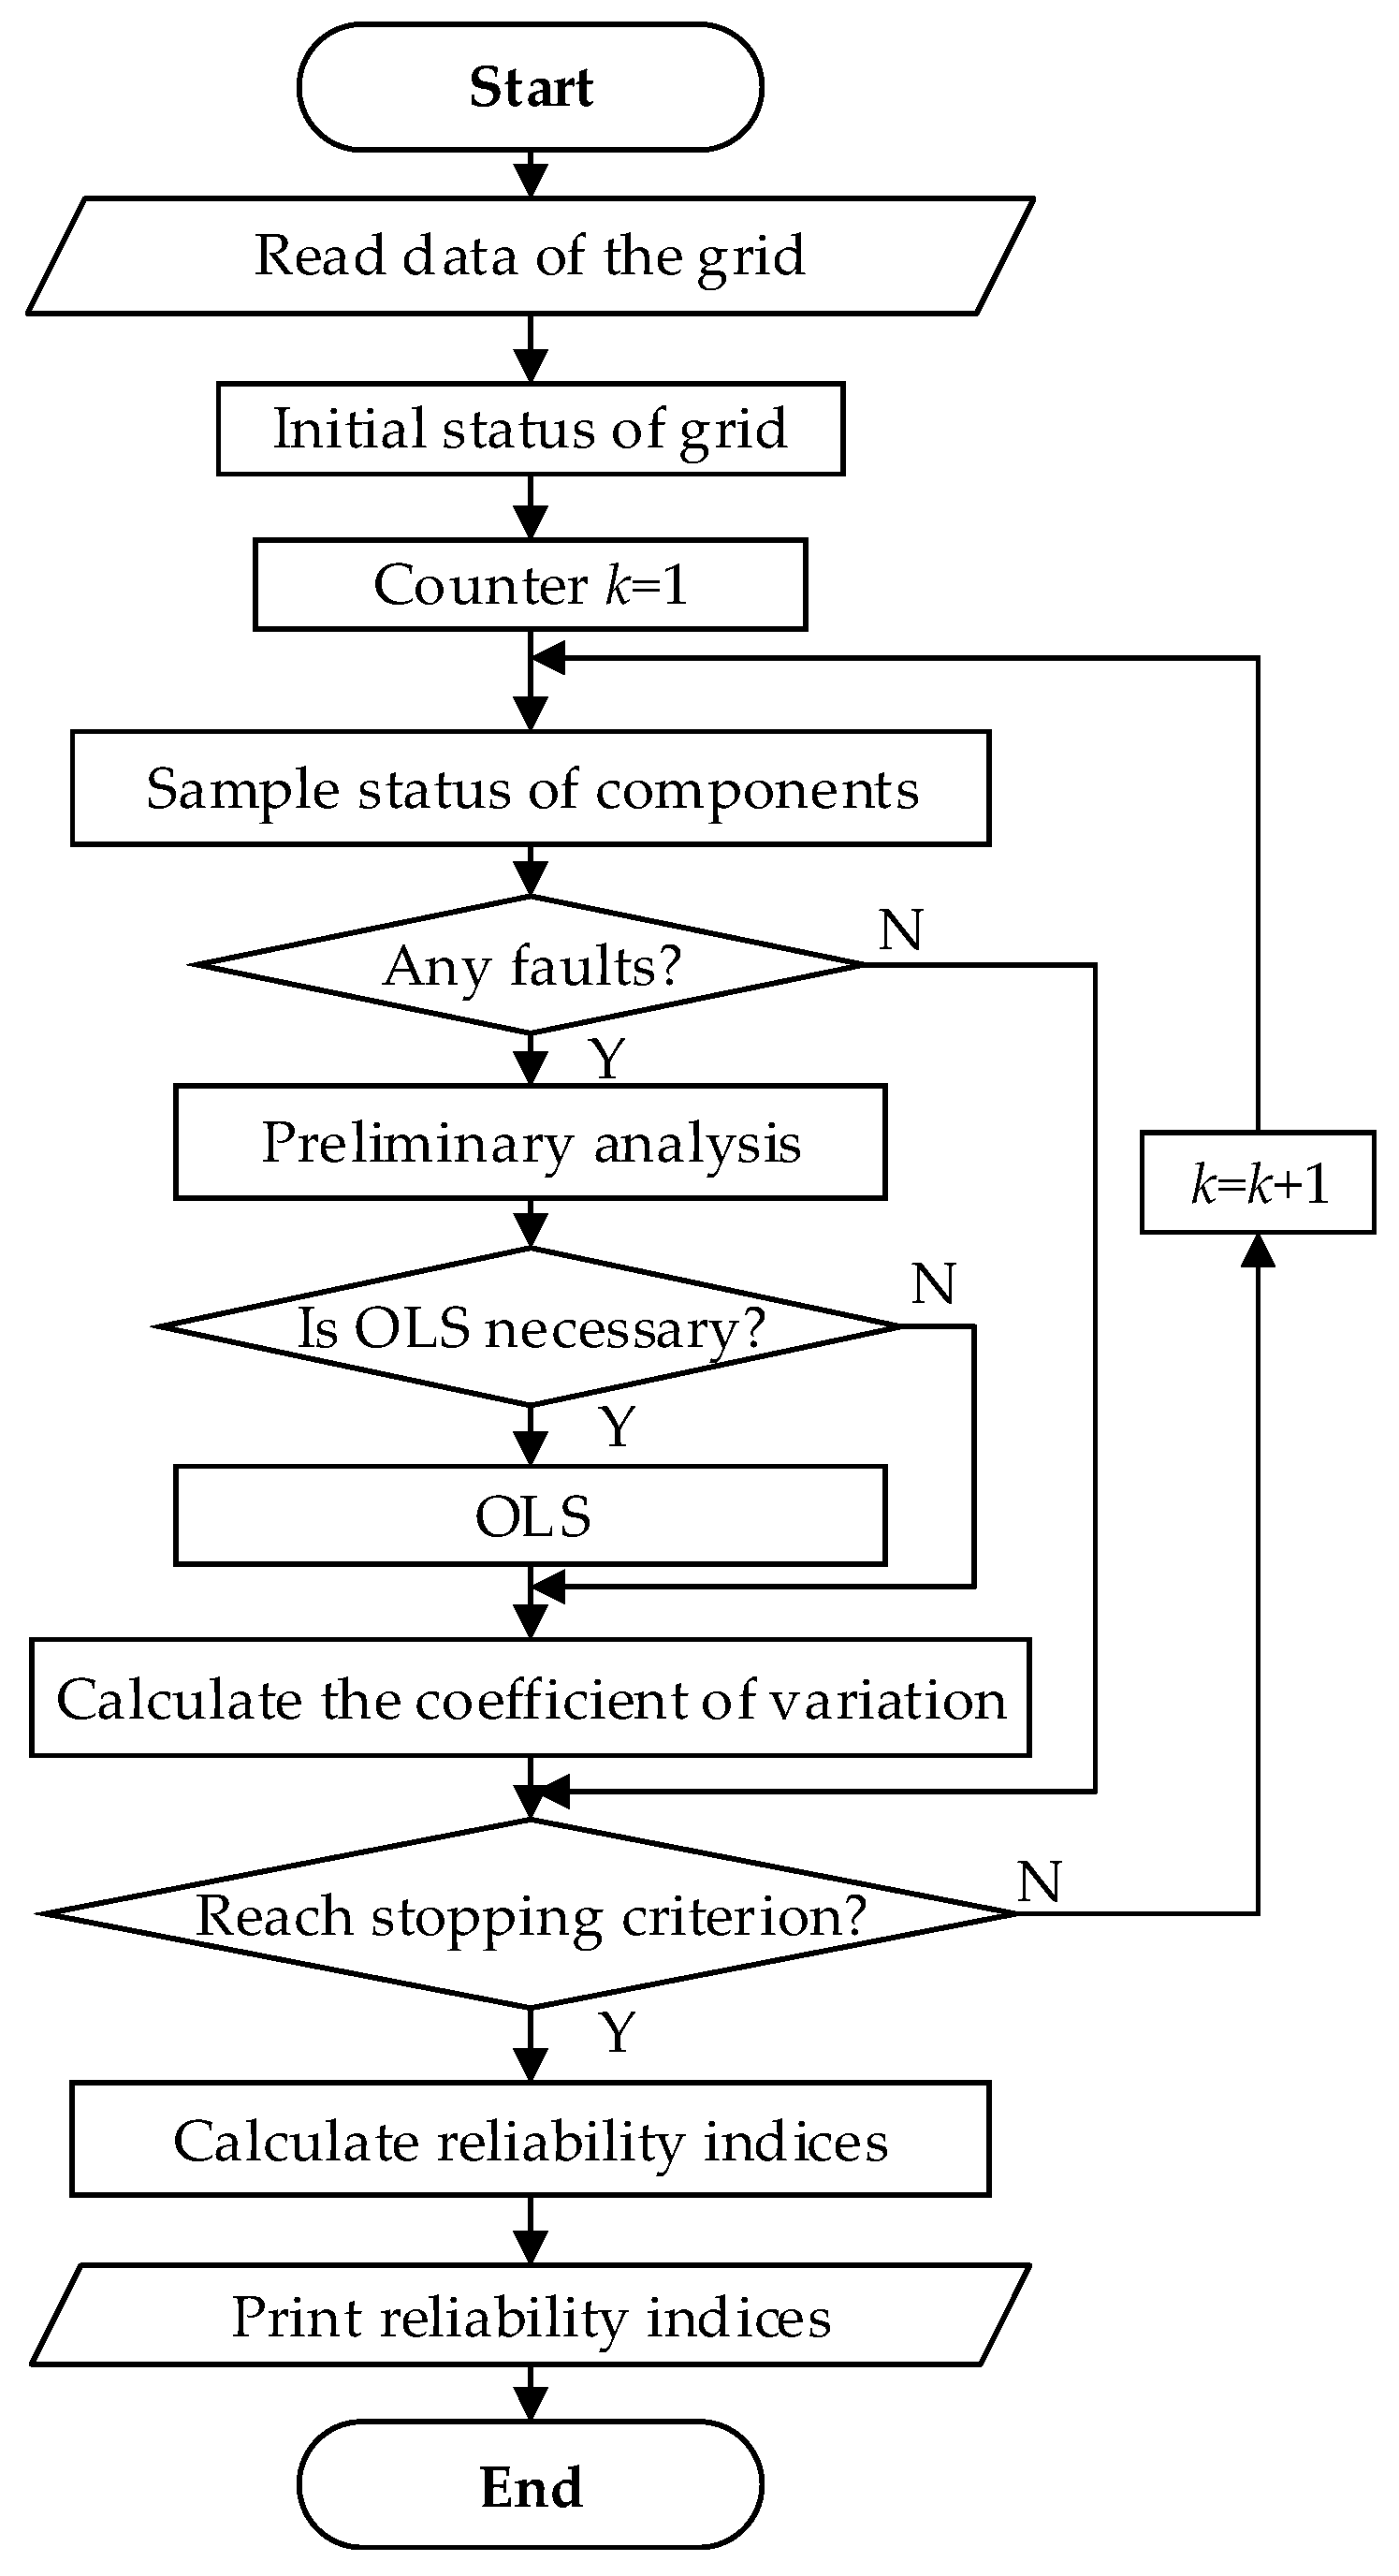
Figure 8.
Single-line diagram of CIGRE B4 DC grid test system.
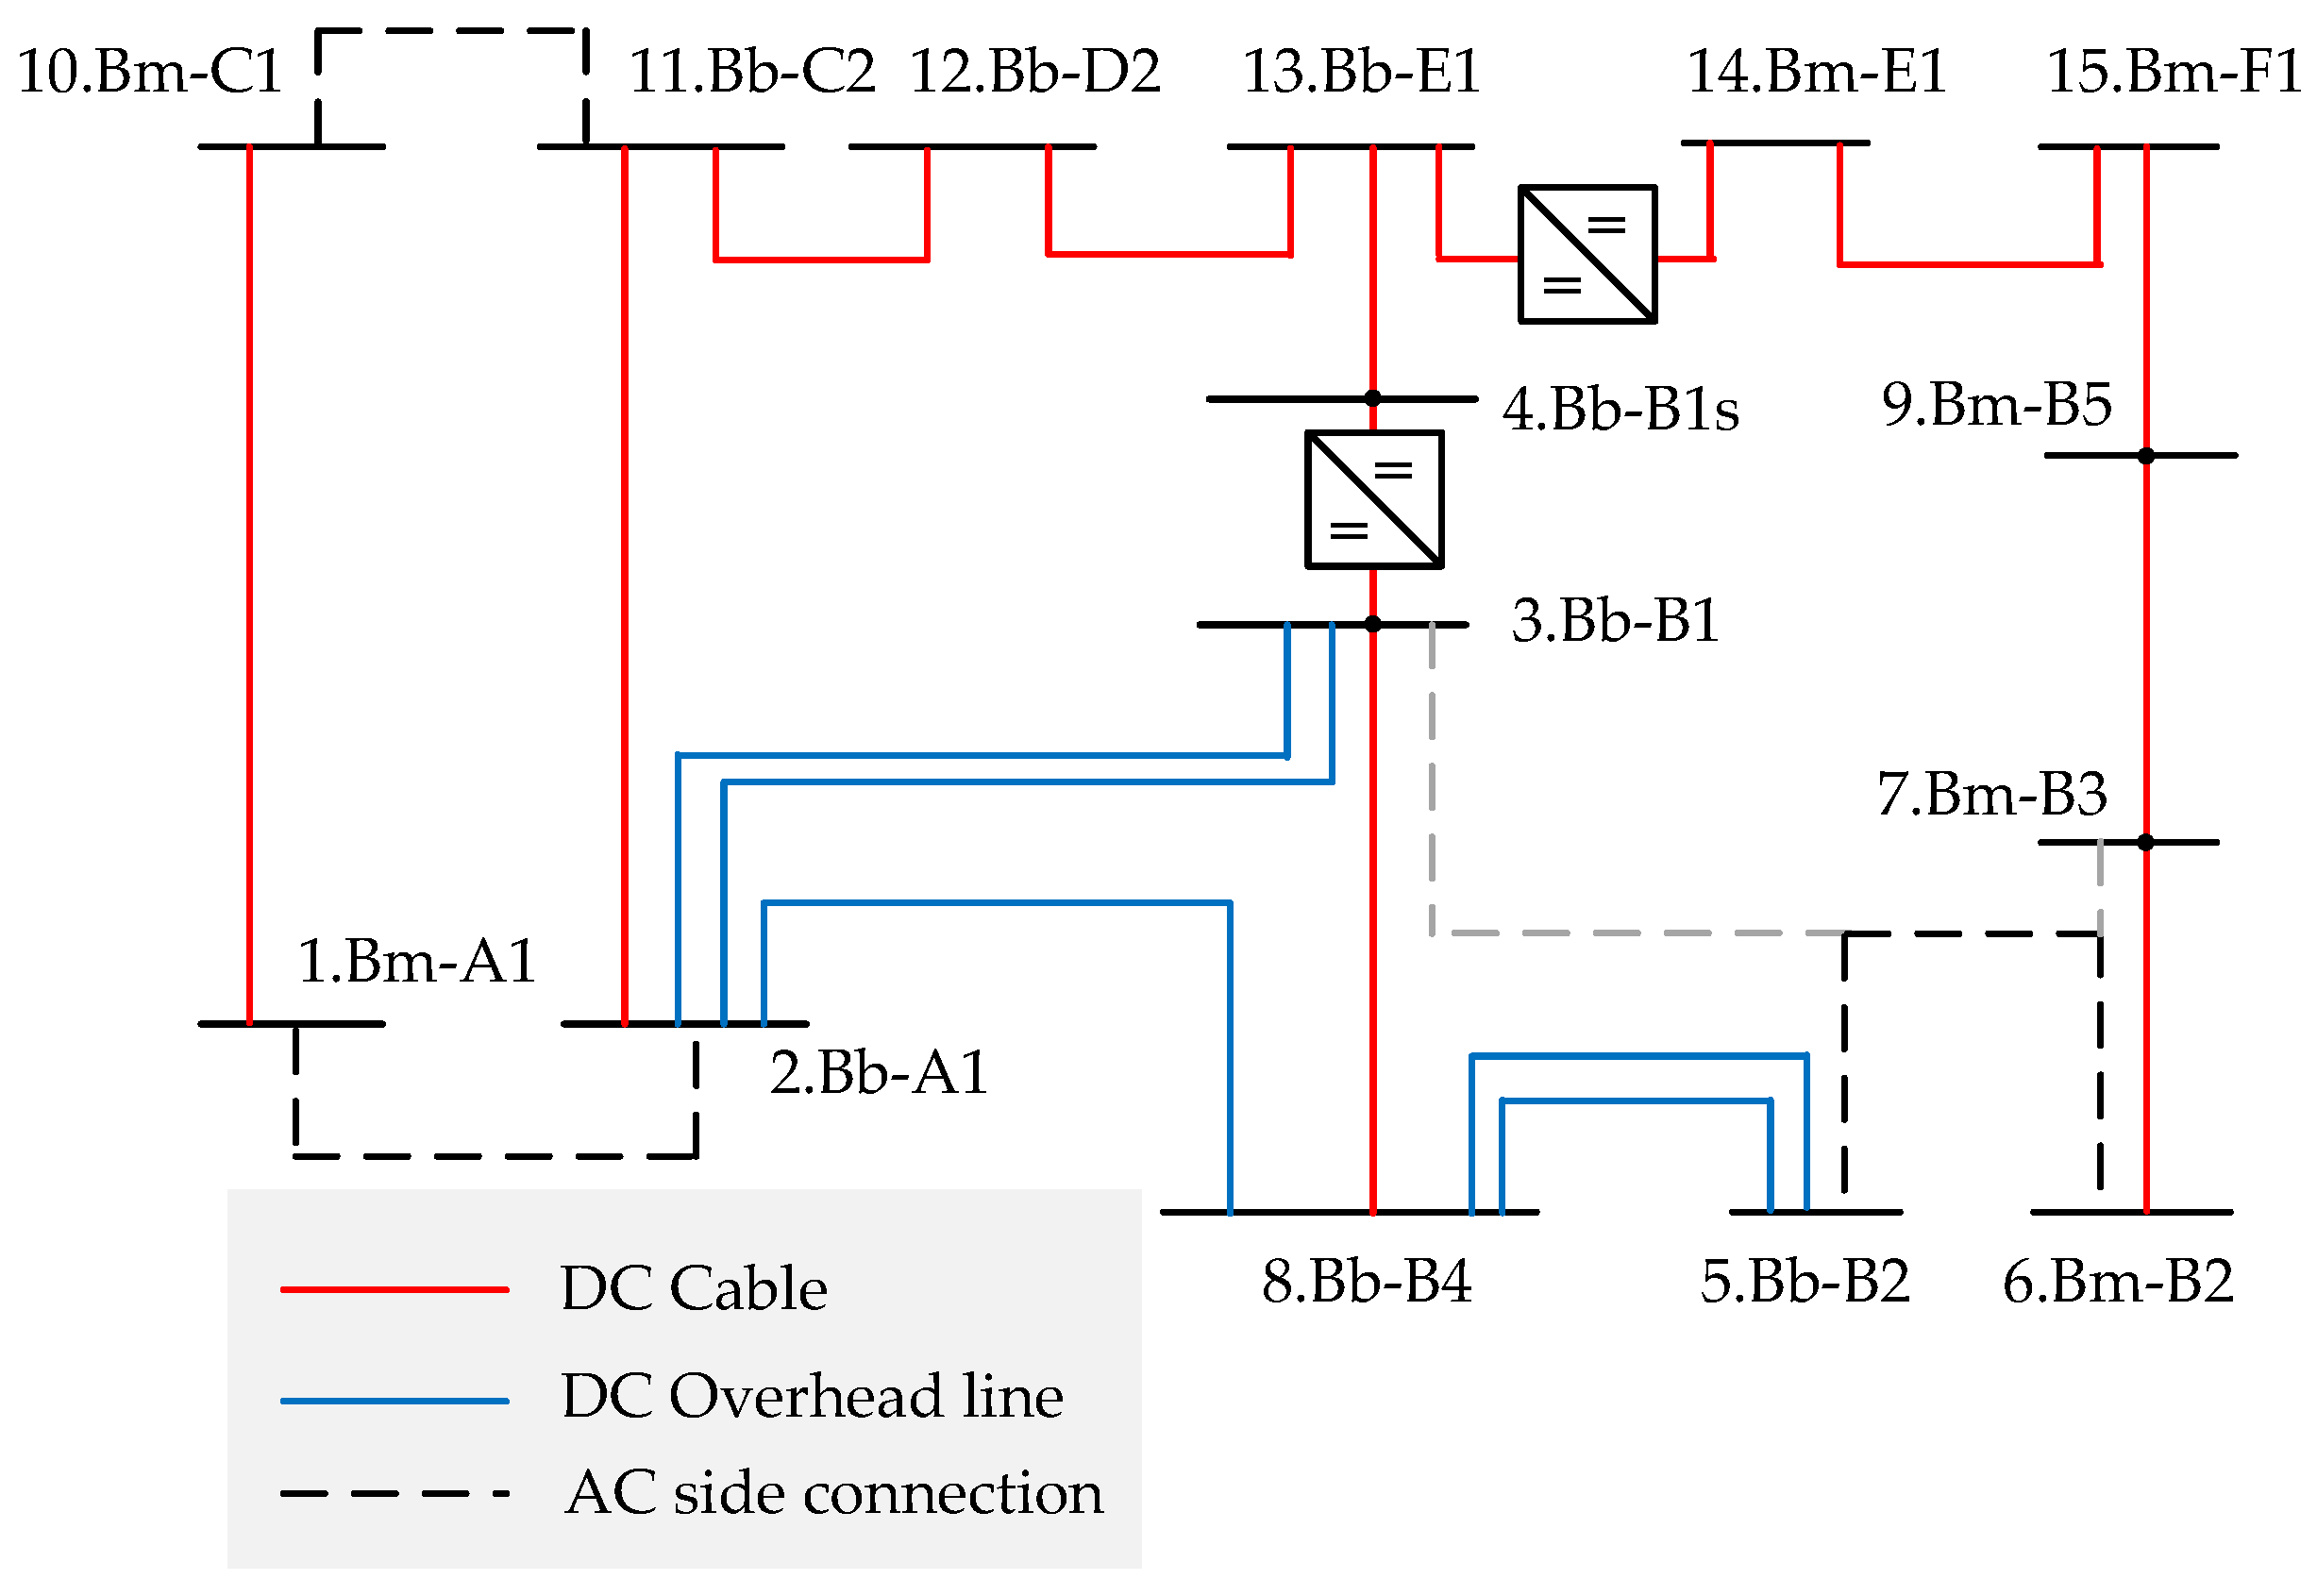
Figure 9.
Histogram of shedding value.

Figure 10.
Shedding value per state on each DC bus.
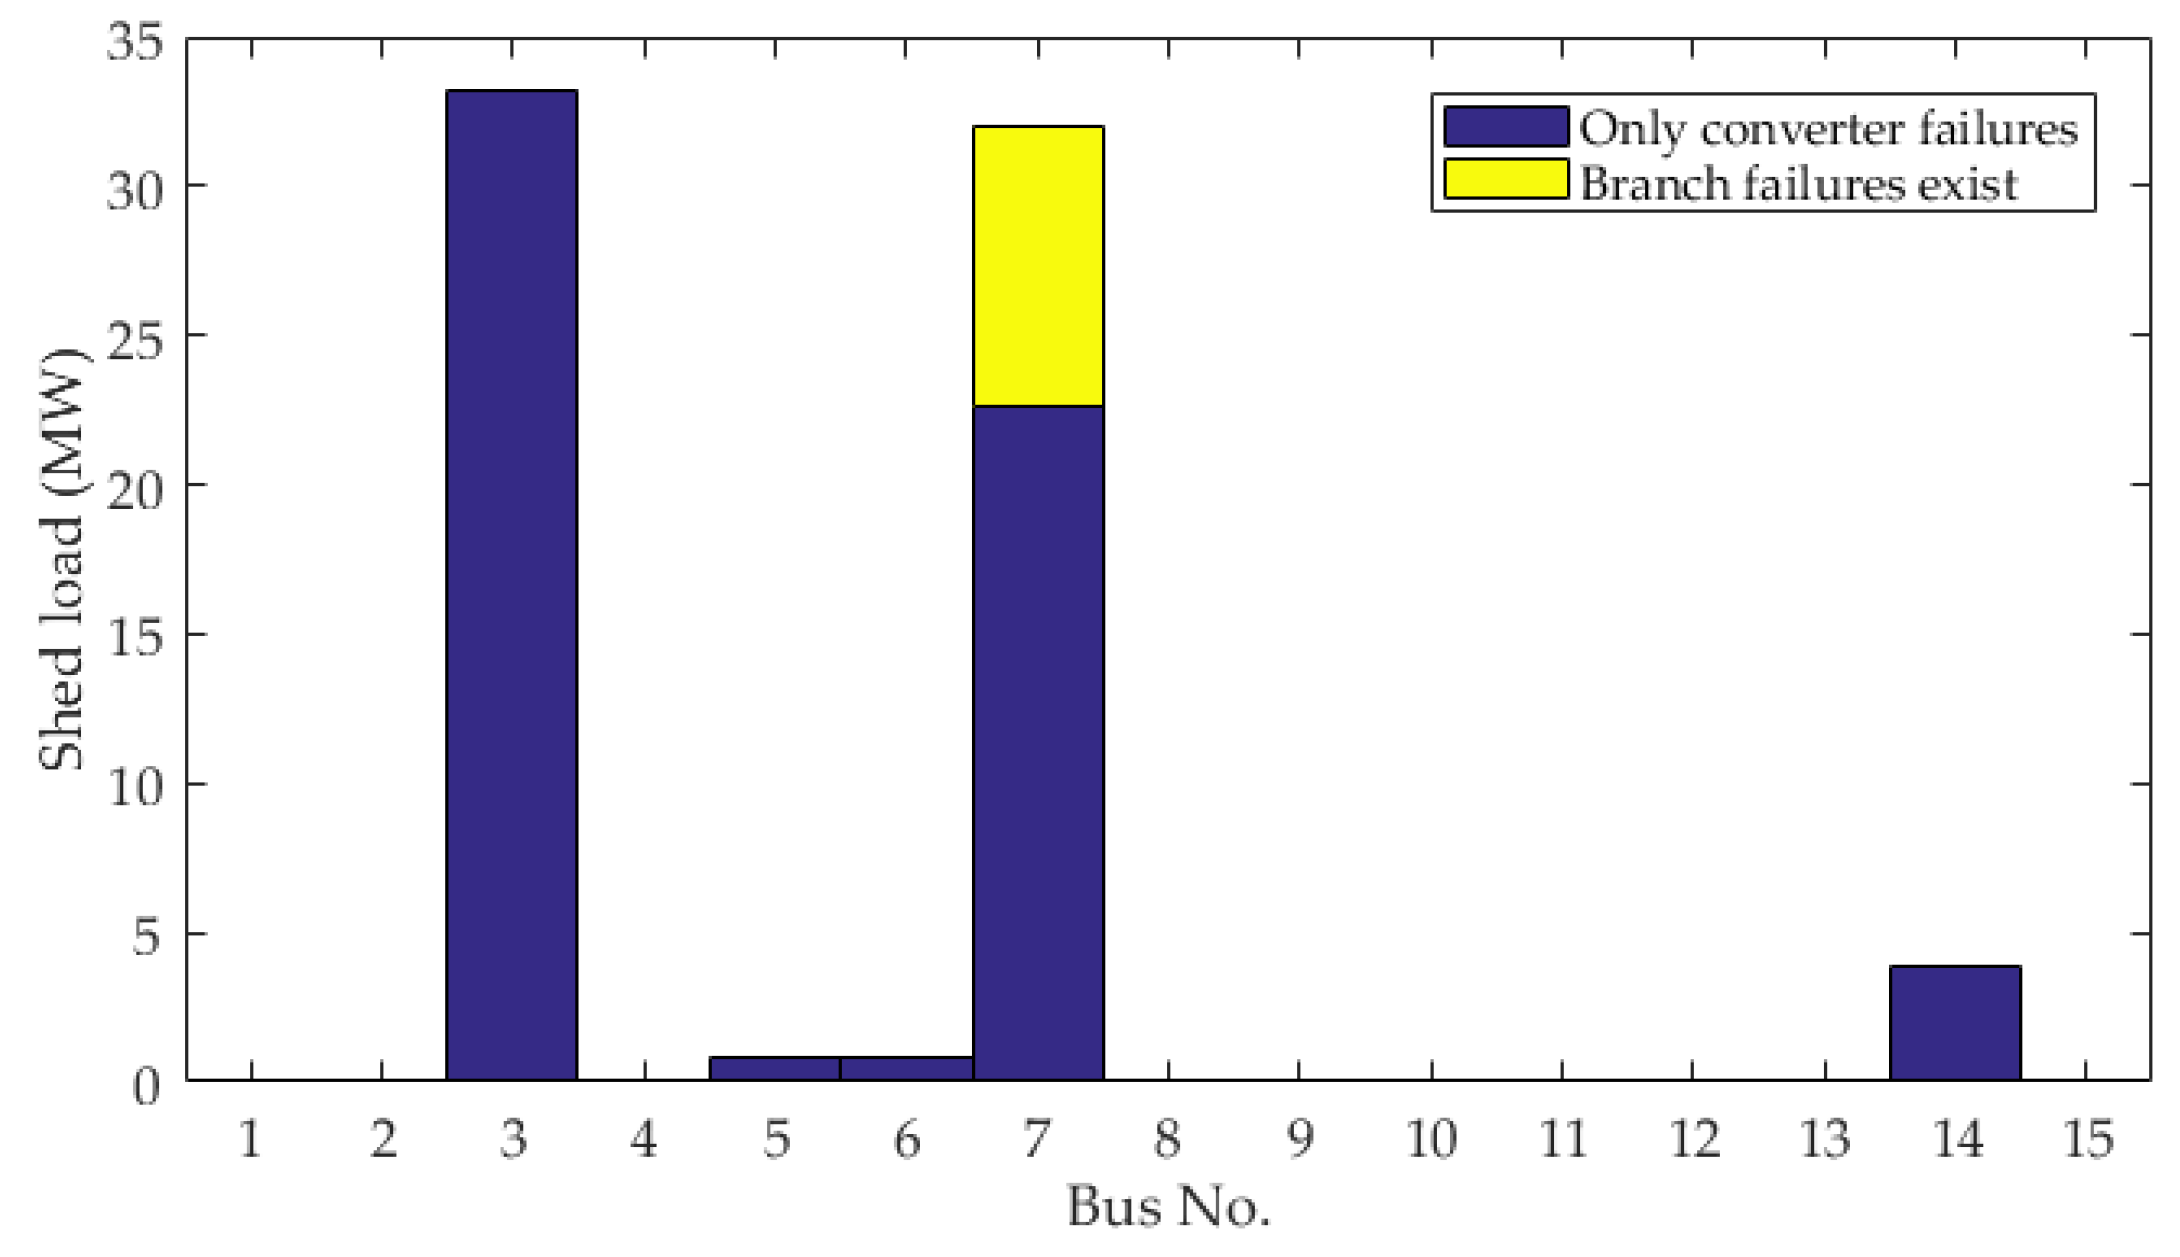
Figure 11.
Proportions of shedding sources (CIGRE B4 DC grid). (a) Number of shedding occurrences; and (b) shed power.
Figure 11.
Proportions of shedding sources (CIGRE B4 DC grid). (a) Number of shedding occurrences; and (b) shed power.

Figure 12.
Single-line diagram of Continental Overlay HVDC Grid (40 buses).
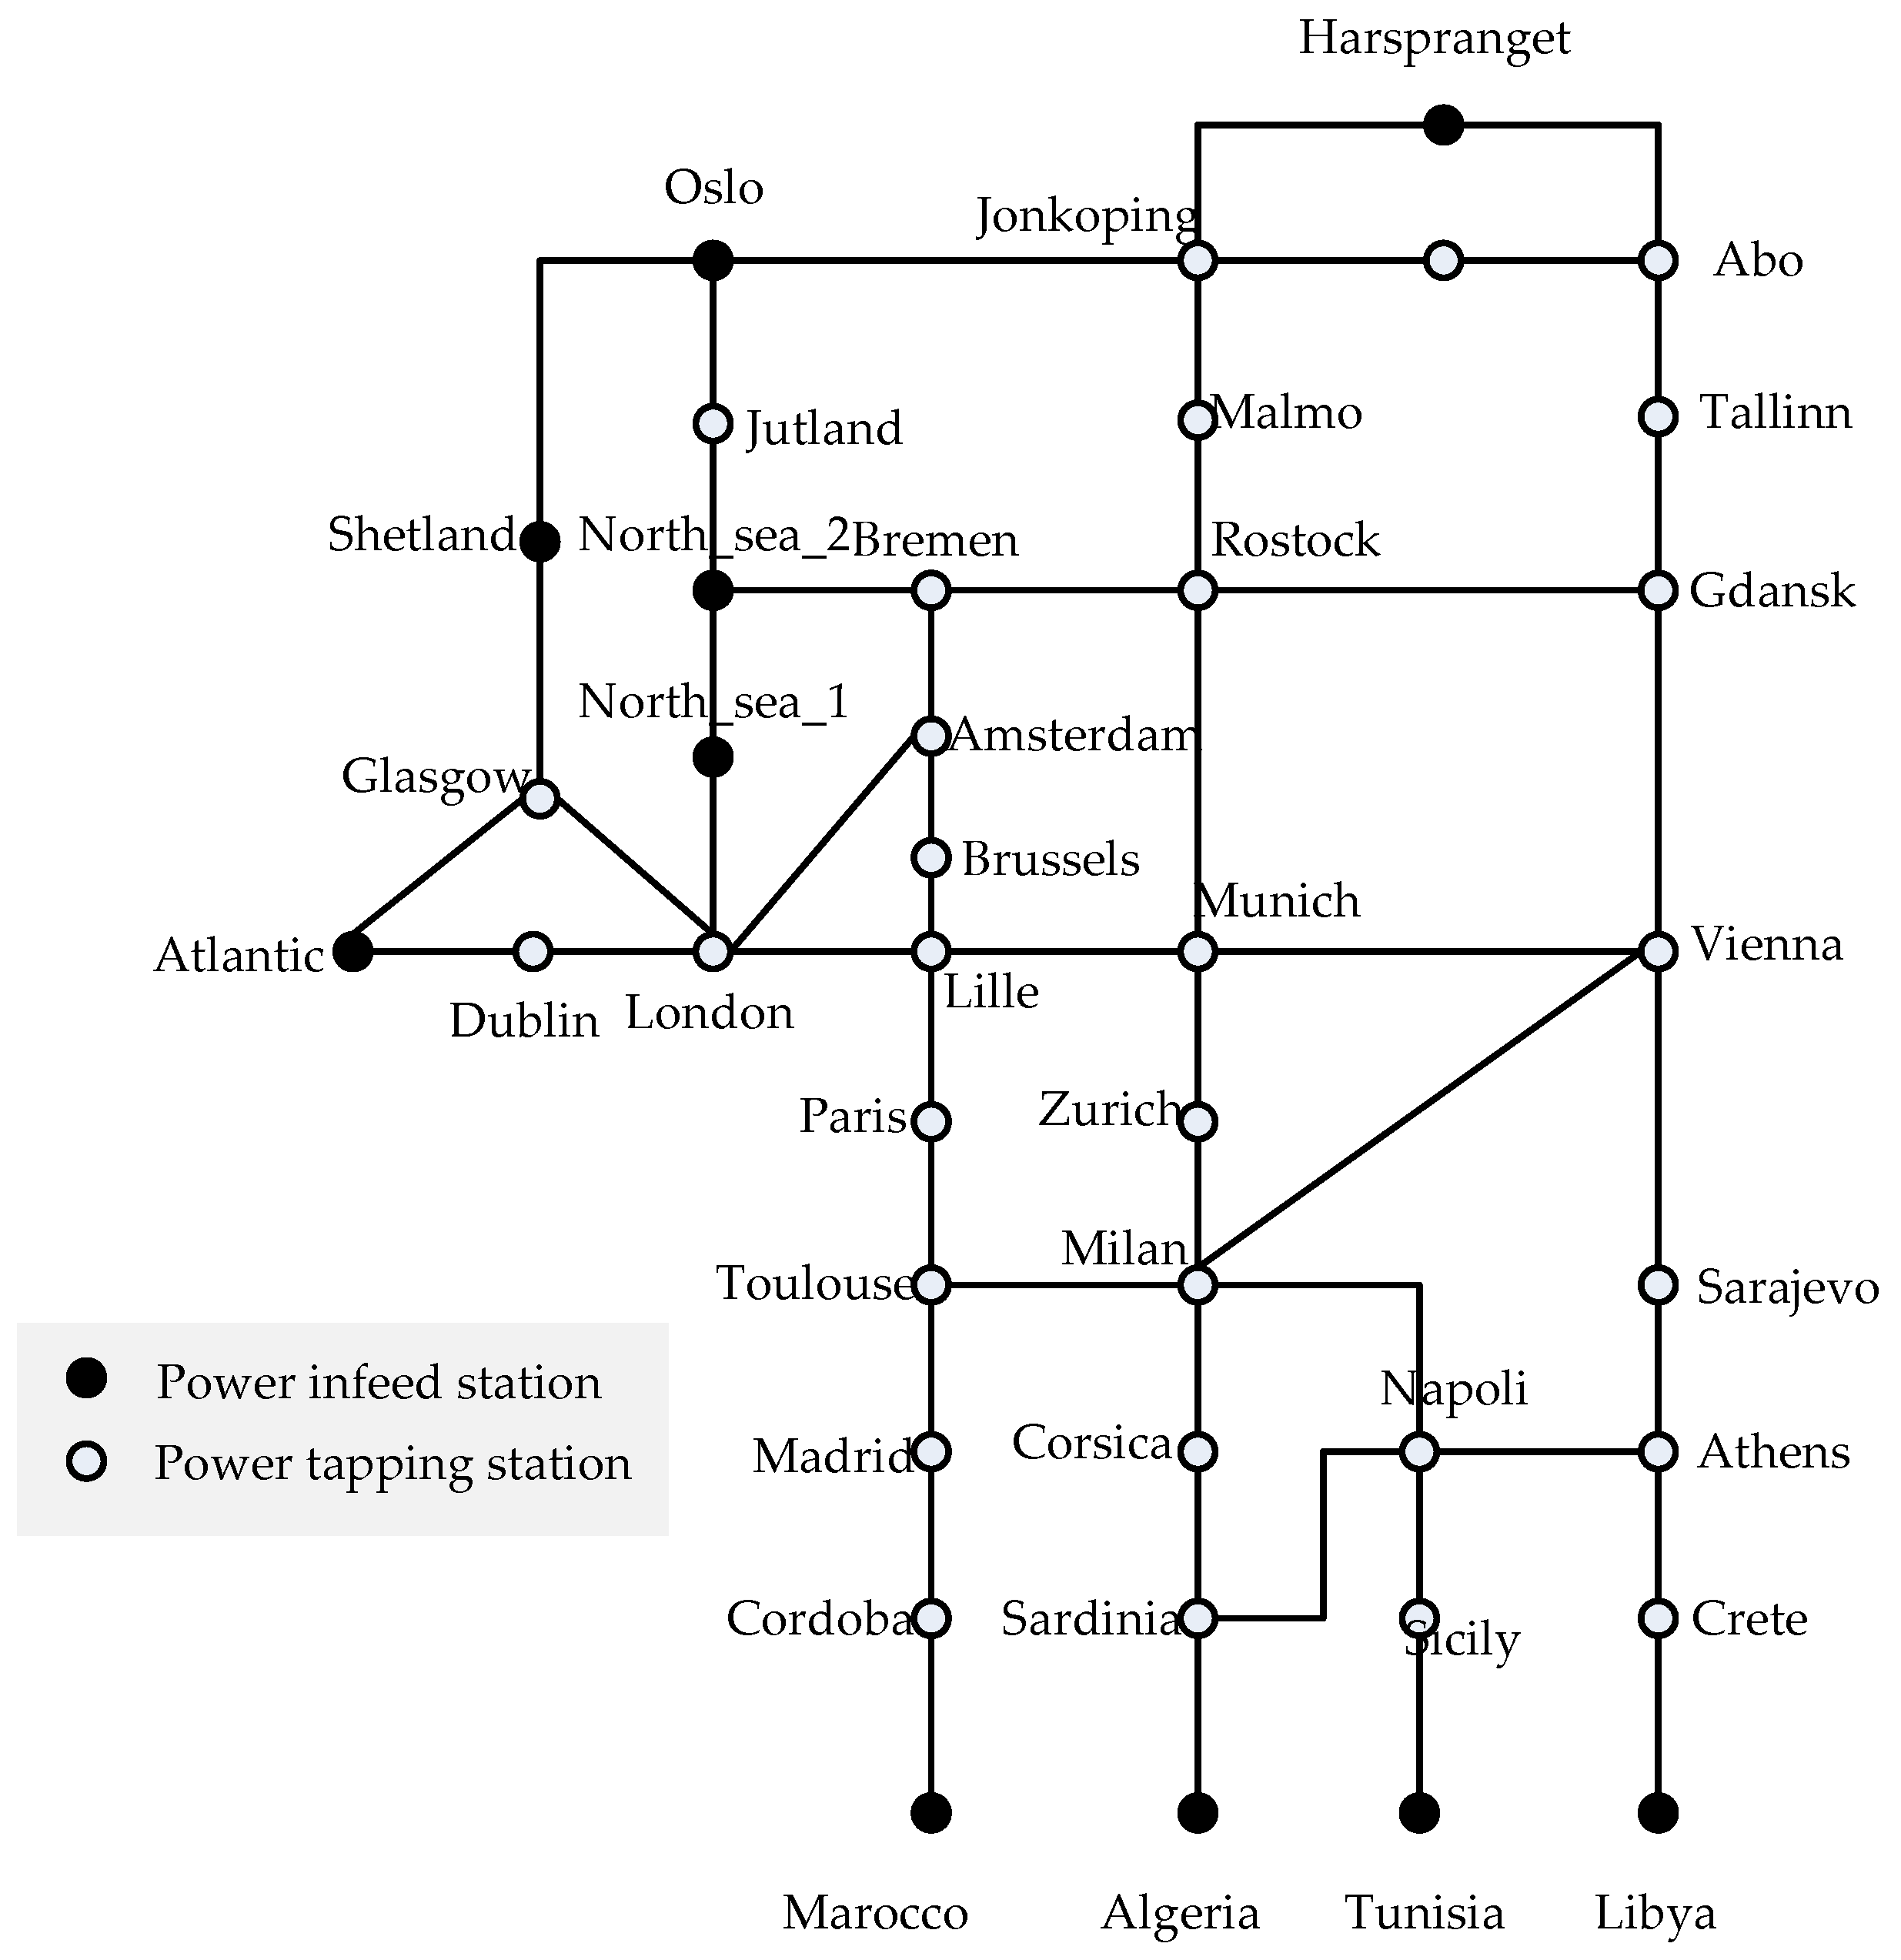
Figure 13.
The coefficient of variation.

Figure 14.
The feature of shedding. (a) Histogram of shedding values; and (b) shedding value per state on each DC bus.
Figure 14.
The feature of shedding. (a) Histogram of shedding values; and (b) shedding value per state on each DC bus.

Figure 15.
Proportions of shedding sources (Continental Overlay HVDC Grid). (a) Number of shedding occurrences; and (b) shed power.
Figure 15.
Proportions of shedding sources (Continental Overlay HVDC Grid). (a) Number of shedding occurrences; and (b) shed power.


Table 1.
Reliability indices of HVDC grids.
| Name | Abbreviation | Reliability Index Function |
|---|---|---|
| Loss of load probability | LOLP | 1 |
| Energy not supplied(MWh/yr) | EENS | 2 |
| System index(min/yr) | SI | 3 |
| Energy Availability | EA |
1 nshed is the number of shedding occurrences; 2 Piss is the shedding value of the grid; 3 Psd is the power demand of the grid.
Table 2.
Reliability parameters.
| Component | Failure Rate(occ./yr/100 km) | Repair Time (h) | Failure Probability |
|---|---|---|---|
| Overhead Line [28] | 0.52 | 10 | / |
| Cable [28] | 0.62 | 50 | / |
| Converter(station) [24] | / | / | 0.046 |
Table 3.
Reliability indices of CIGRE B4 DC grid test system.
| Indices | Value |
|---|---|
| LOLP | 0.192 |
| EENS (MWh/yr) | 605,686 |
| SI (min/yr) | 4845.5 |
| EA | 99.08% |
Table 4.
Reliability indices of the Continental Overlay HVDC Grid (40 buses).
| Indices | Value |
|---|---|
| LOLP | 0.0779 |
| EENS (MWh/yr) | 1,522,022 |
| SI (min/yr) | 3420 |
| EA | 99.35% |
Table 5.
The efficiency of the preliminary analysis.
| Items | Proposed Method | Enter OLS Directly |
|---|---|---|
| Elapse time (s) | 761.3 | 2,507.90 |
| Number of samples | 10,000 | 10,000 |
| Number of failure states | 9687 | 9672 |
| Executions of OLS | 2546 | 9672 |
| Number of shedding states | 782 | 779 |
Table 6.
Reliability indices of test grid with a different number of converters.
| Indices | Case I | Case II |
|---|---|---|
| LOLP | 0.0779 | 0.5291 |
| EENS (MWh/yr) | 761,011 | 2,102,347 |
| SI (min/yr) | 3420 | 9449 |
| EA | 99.35% | 98.20% |
© 2017 by the authors. Licensee MDPI, Basel, Switzerland. This article is an open access article distributed under the terms and conditions of the Creative Commons Attribution (CC BY) license (http://creativecommons.org/licenses/by/4.0/).
Share and Cite
MDPI and ACS Style
Xie, H.; Bie, Z.; Lin, Y.; Zheng, C. A Hybrid Reliability Evaluation Method for Meshed VSC-HVDC Grids. Energies 2017, 10, 895. https://doi.org/10.3390/en10070895
AMA Style
Xie H, Bie Z, Lin Y, Zheng C. A Hybrid Reliability Evaluation Method for Meshed VSC-HVDC Grids. Energies. 2017; 10(7):895. https://doi.org/10.3390/en10070895
Chicago/Turabian StyleXie, Haipeng, Zhaohong Bie, Yanling Lin, and Chao Zheng. 2017. "A Hybrid Reliability Evaluation Method for Meshed VSC-HVDC Grids" Energies 10, no. 7: 895. https://doi.org/10.3390/en10070895
Note that from the first issue of 2016, this journal uses article numbers instead of page numbers. See further details here.