
Big-Data-Based Thermal Runaway Prognosis of Battery Systems for Electric Vehicles

1
National Engineering Laboratory for Electric Vehicles, Beijing Institute of Technology, Beijing 100081, China
2
Beijing Co-Innovation Center for Electric Vehicles Lecturer, Beijing 100081, China
*
Authors to whom correspondence should be addressed.
Energies 2017, 10(7), 919; https://doi.org/10.3390/en10070919
Submission received: 15 May 2017
/
Revised: 25 June 2017
/
Accepted: 26 June 2017
/
Published: 4 July 2017
(This article belongs to the Special Issue Advanced Energy Storage Technologies and Their Applications (AESA))
Abstract
:A thermal runaway prognosis scheme for battery systems in electric vehicles is proposed based on the big data platform and entropy method. It realizes the diagnosis and prognosis of thermal runaway simultaneously, which is caused by the temperature fault through monitoring battery temperature during vehicular operations. A vast quantity of real-time voltage monitoring data is derived from the National Service and Management Center for Electric Vehicles (NSMC-EV) in Beijing. Furthermore, a thermal security management strategy for thermal runaway is presented under the Z-score approach. The abnormity coefficient is introduced to present real-time precautions of temperature abnormity. The results illustrated that the proposed method can accurately forecast both the time and location of the temperature fault within battery packs. The presented method is flexible in all disorder systems and possesses widespread application potential in not only electric vehicles, but also other areas with complex abnormal fluctuating environments.
1. Introduction
Battery systems are critical components that strongly influence the driving performance and cost-effectiveness of electric vehicles (EVs). The travel distance, acceleration performance, and security requirements of EVs cannot be satisfied by the energy density and power density of the single-cell. Therefore, the cells need to be assembled into a small battery module according to certain forms, and battery systems can be composed of a number of battery modules in series or parallel to satisfy the driving requirement of EVs [1]. Thermal runaway may occur with extreme phenomena, such as battery leakage, smoking, or gas venting in the event the heating rate exceeds the dissipation rate. In recent years, a spectrum of fatal fire accidents has shown the great threat to system safety and durability. Generally, thermal runaway occurs when an exothermic reaction gets out of control, which is interpreted as the reaction rate increasing due to the temperature increasing, and causes a further increase in temperature and, hence, a further increase in the reaction rate. In some serious cases, thermal runaway possibly results in an explosion [2]. Battery degradation and failure are strongly dependent on the abnormality in cell temperature. Furthermore, to maintain the healthy state of the battery, thermal management strategies are employed in electric vehicles [3].
A preeminent battery thermal management system (BTMS) is necessary and essential because extreme temperatures affect the driving performance and safety of EVs. In some extreme cases, thermal runaway might trigger fires and explosions if the battery temperature gets out of the safety scope. The effectiveness of a BTMS depends on the design of the battery system and the operating conditions. Daowd et al. [4] proposed an intelligent battery management system (BMS), including a battery pack charging and discharging control, with a battery pack thermal management system. Finally, an experimental setup was implemented for the validation of the proposed balancing system. Panchal et al. [5,6] presented in situ measurements of the heat generation rate for a prismatic lithium-ion battery and a lithium-ion pouch cell (20 Ah capacity) at 1C, 2C, 3C, and 4C discharge rates and 5 °C, 15 °C, 25 °C, and 35 °C boundary conditions (BCs). The results show that the highest rate of heat generation was found to be 91 W for the 4C discharge rate and 5 °C BC, while the minimum value was 13 W measured at a 1C discharge rate and 35 °C BC. This illustrated that the increase in the discharge rate and the discharge current caused a consistent increase in the heat generation rate for an equal depth of discharge points. A model was developed using the neural network approach and the predicted heat generation rate demonstrates an identical behavior with experimental results from this model. Lan et al. [7] developed a novel design of BTMS based on aluminum mini-channel tubes and applied it to a single prismatic lithium-ion cell under different discharge rates. To investigate the thermal performance of a lithium-ion battery pack, Qian et al. [8] established a three-dimensional numerical model using a type of liquid cooling method based on mini-channels and cold-plates. Though simplified approaches, Mastali et al. [9] developed the simplified electrochemical multi-particle model and homogenous pseudo-two-dimensional model to decrease the computational time; the speed and simplicity of three-dimensional electrochemical-thermal models are still of concern. The second type of model is the equivalent circuit model (ECM), where the battery is regarded as a mass point [10,11]. Therefore, they are suitable to be implanted in the battery management system (BMS) for the state of charge (SOC) or the state of health (SOH) estimation [12,13,14,15]. Lin et al. [16] and Forgez et al. [17] added lumped-parameter thermal models to the ECM to predict the thermal characteristics of the cell, which made the model more comprehensive. The results showed this method could effectively control the battery temperature at a 5 °C discharge and the temperature uniformity was obviously improved. Through the studies mentioned in the literature, apart from a few studies monitoring temperature changes through the temperature sensor, no effective and systematic theory or method concerns the accurate and timely temperature fault detection and early detection and warning of thermal runaway during real operation.
Meanwhile, in order to maintain higher energy density, the size and complexity of the battery cell is growing, which leads to a potential temperature imbalance and a risk of various battery faults. So many fault diagnosis methodologies have been presented to reveal the thermal runaway of battery systems. For external short-circuit detection, Xiong et al. [18] extracted the OCV-SOC relationship from any existing current-voltage measurements by using an H infinity filter within several seconds. The results show that the estimated OCV can result in accurate SoC estimation with a maximum error of 1%. Seo et al. [19] proposed a high accuracy model-based switching model method (SMM) to detect the internal short circuit (ISCr) in the lithium-ion battery, which helps the battery management system to fulfill early detection of the ISCr. Zhang et al. [20] proposed a novel method to perform online and real-time capacity fault diagnosis for a parallel-connected battery group (PCBG) and the fault simulation and validation results demonstrate that the proposed methods have good accuracy and reliability. Due to the inconsistent and varied characteristics of lithium-ion battery cells, Chen et al. [21] and Liu et al. [22] proposed the multi-scale dual H infinity filters and model-based sensor fault diagnosis method, which can significantly reduce the computation work and retains good model accuracy. Bai et al. [23] applied a combined power generation system (CPGS) to achieve a reliable evaluation of a distribution network with micro-grids combined with fault duration. In addition, many model-based diagnostic algorithms, such as extended Kalman, were presented to diagnose thermal faults in lithium-ion batteries [24,25,26,27], and the simulation and experimental studies were demonstrated to illustrate the effectiveness of the proposed schemes. Zheng et al. [28] presented a battery pack system in a demonstrated EV with 96 cells in series and discovered the battery power fade fault during the demonstration. The preliminary analysis indicated that the internal or contact resistance increase causes the fault and calculating the Shannon entropy clearly identified the cause of the power fade fault. Rezvanizanian et al. [29] examined the mobility prediction of LiFeMnPO4 batteries for an emission-free electric vehicle. Through the comparison with an adaptive recurrent neural network (ARNN) with regression, the former performs with better accuracy in two different road types and driving modes. All of these mentioned studies have modeled under online detection and prediction on the SOH of battery system. However, the literature has rarely explored temperature fault diagnosis and prognosis issues of battery systems directly for the real-time running vehicles. The conventional threshold methods lack the ability of identifying the time and location that the abnormity occurs if the abnormal data remains within the permitted limits together with the safety data. The existing BMS technology generally cannot achieve an early warning effect of battery thermal runaway.
This paper focuses on a prognosis method for the thermal runaway of battery systems caused by a temperature fault during vehicular operations. For addressing these mentioned issues, the entropy method was employed. Furthermore, the abnormity coefficient was set up using the Z-score method to evaluate the fault severity. Accordingly, homologous management strategies were proposed to handle detected temperature fault problems and make real-time assessments of the fault levels. A vast quantity of real-time voltage monitoring data was derived from the NSMC-EV in Beijing to validate the proposed method. The results show that the proposed method can accurately forecast both the time and location of the temperature fault within battery packs.
The remainder of this paper is structured as follows: Section 2 gives a brief introduction of the proposed prognosis method. Section 3 describes the big data platform for data acquisition. Section 4 presents the detailed prognosis analysis and discussions about temperature faults for battery systems. Finally, the key conclusions is summarized in Section 5.
2. Diagnosis and Prognosis Method
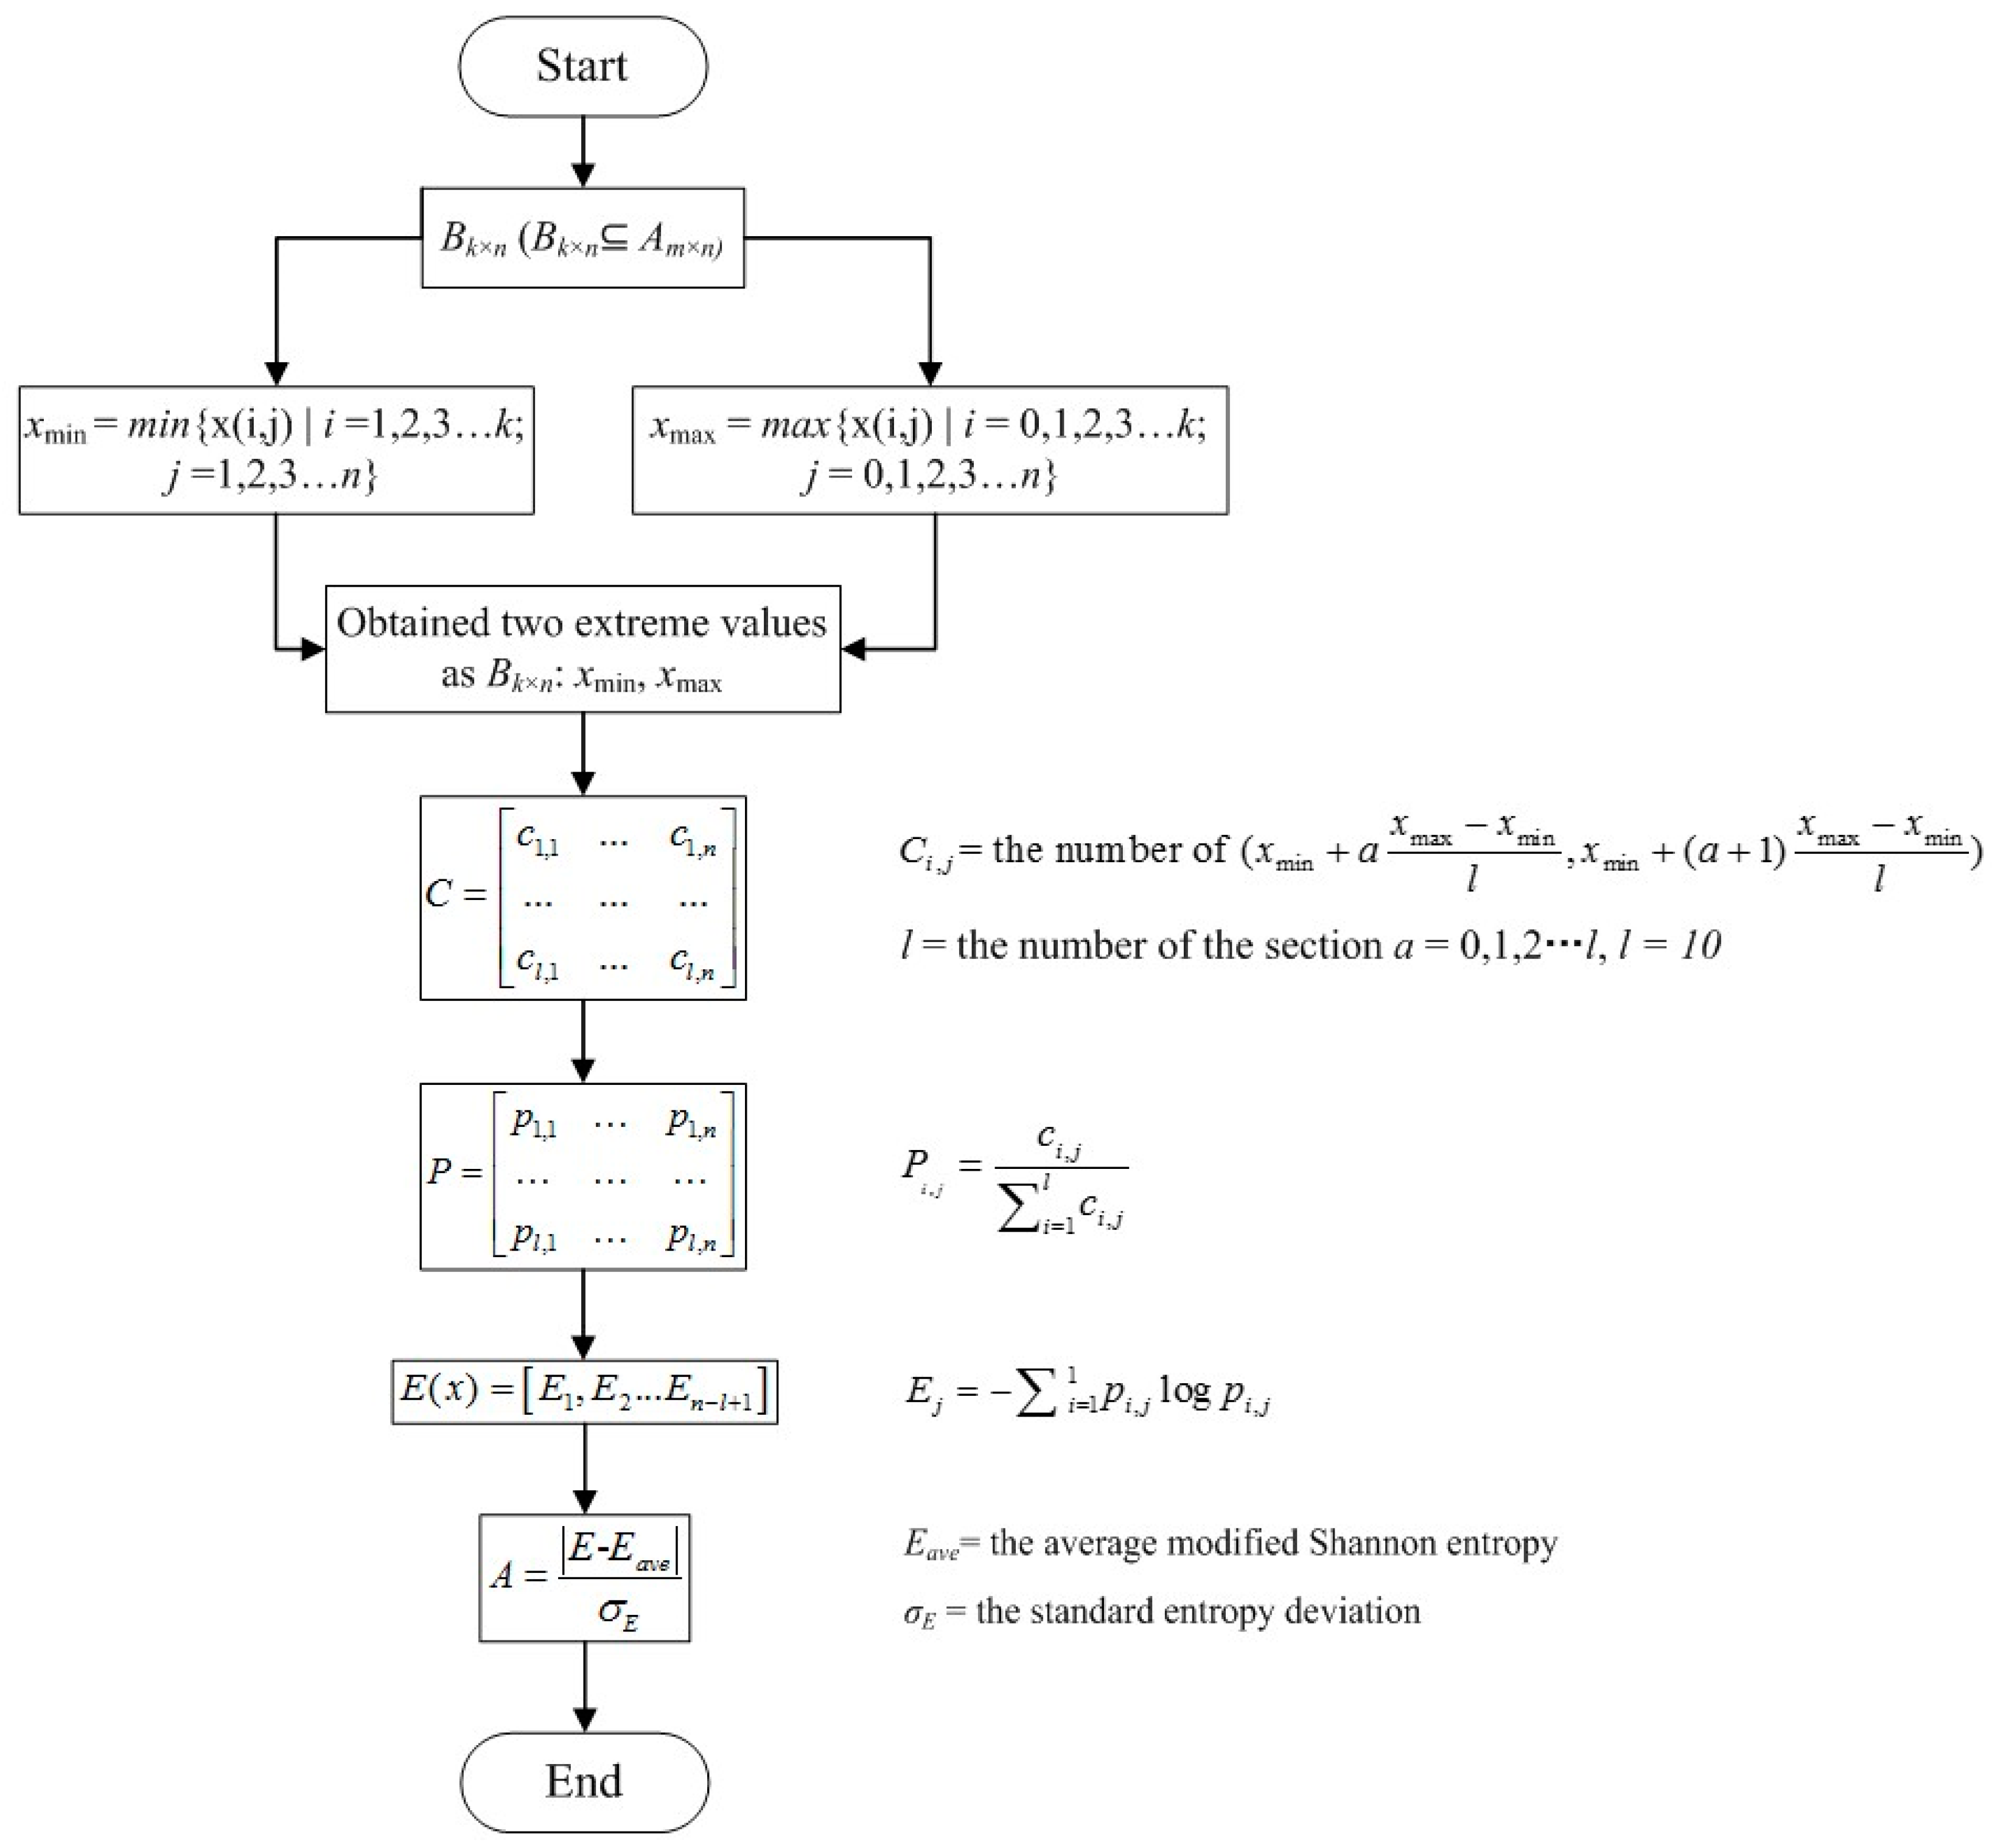
Information entropy has been widely employed to judge the degree of system disorder in thermodynamics, information science, and other fields, which was firstly introduced by Laude Elwood Shannon in 1948 [30]. It generally judges the degree of system disorder in a wide range of scientific fields and is still an important method nowadays [31]. Due to the capability of measuring the information content, combined with the case of information processing, it is a useful and popular method for information entropy. The typical calculation process of the Shannon entropy is shown as follows:
where H(X) is the Shannon entropy, p(xi) is the data probability density in the ith region, and n is the number of regions.
The Z-score denotes the standard score, which has the function of risk prediction in the fields of statistics and finance. For instance, Nanayakkara [32] developed a financial distress prediction model for Sri Lankan companies using the Z-score model. Chadha and Aloy et al. [33,34] used Altman’s Z-score model to evaluate the financial performance and avoided the high cost that is associated with distress in predicting bankruptcy. However, the Z-score method has not demonstrated the ability and potential of risk prediction of mechanical or electrical faults, especially electric vehicles. In this paper, the Z-score method is applied to quantitatively evaluate the temperature fault within battery packs, which can perform real-time detection and prognosis of abnormal temperature by setting the abnormal coefficient. The voltages and temperatures of different cells are different due to the inconsistency of the battery pack. The formula of the Z-score is expressed as:
where x is a specific score, μ is the average score and σ is the standard deviation.
In order to confirm a reasonable real-time detection and evaluation standard, the abnormity coefficient based on the Z-score is implemented as follows:
where E denotes the Shannon entropy, Eave denotes the average Shannon entropies, and σE denotes the standard deviation of entropy.
It is worth mentioning that there are multiple iterations of the past data in the entropy calculation. However, monitoring and diagnosis are required in real-time to predict the state of the battery and connection failure, thus, the Shannon entropy calculation needs to be appropriately modified to accommodate the online implementation requirement of EVs. The diagnosis and prognosis algorithm flowchart based on the different extreme value selections for the Shannon entropy is shown in Figure 1.
3. Data Acquisition Platform
The temperature and voltage data was derived from the NSMC-EV [35], which has the functions of monitoring and collecting the real-time running data of EVs, such as the voltage and temperature of the battery systems, conducting in-depth analysis and research through big data techniques. The monitoring and management process of the NSMC-EV is shown in Figure 2. The data acquisition frequency from the monitored vehicles ranges from 0.03 Hz to 1 Hz. In addition, the failure statistics of the vehicle running state are categorized into six levels according to failure types, where the first level is the most dangerous. When anomalous information, such as the temperature reaching the limit threshold, a corresponding fault alarm will be immediately dispatched to the relevant vehicle according to the established response protocols. Eventually, the statistical statements about the vehicle-running characteristic and fault statistics will be detected in the forms of daily, weekly, and annual reports.
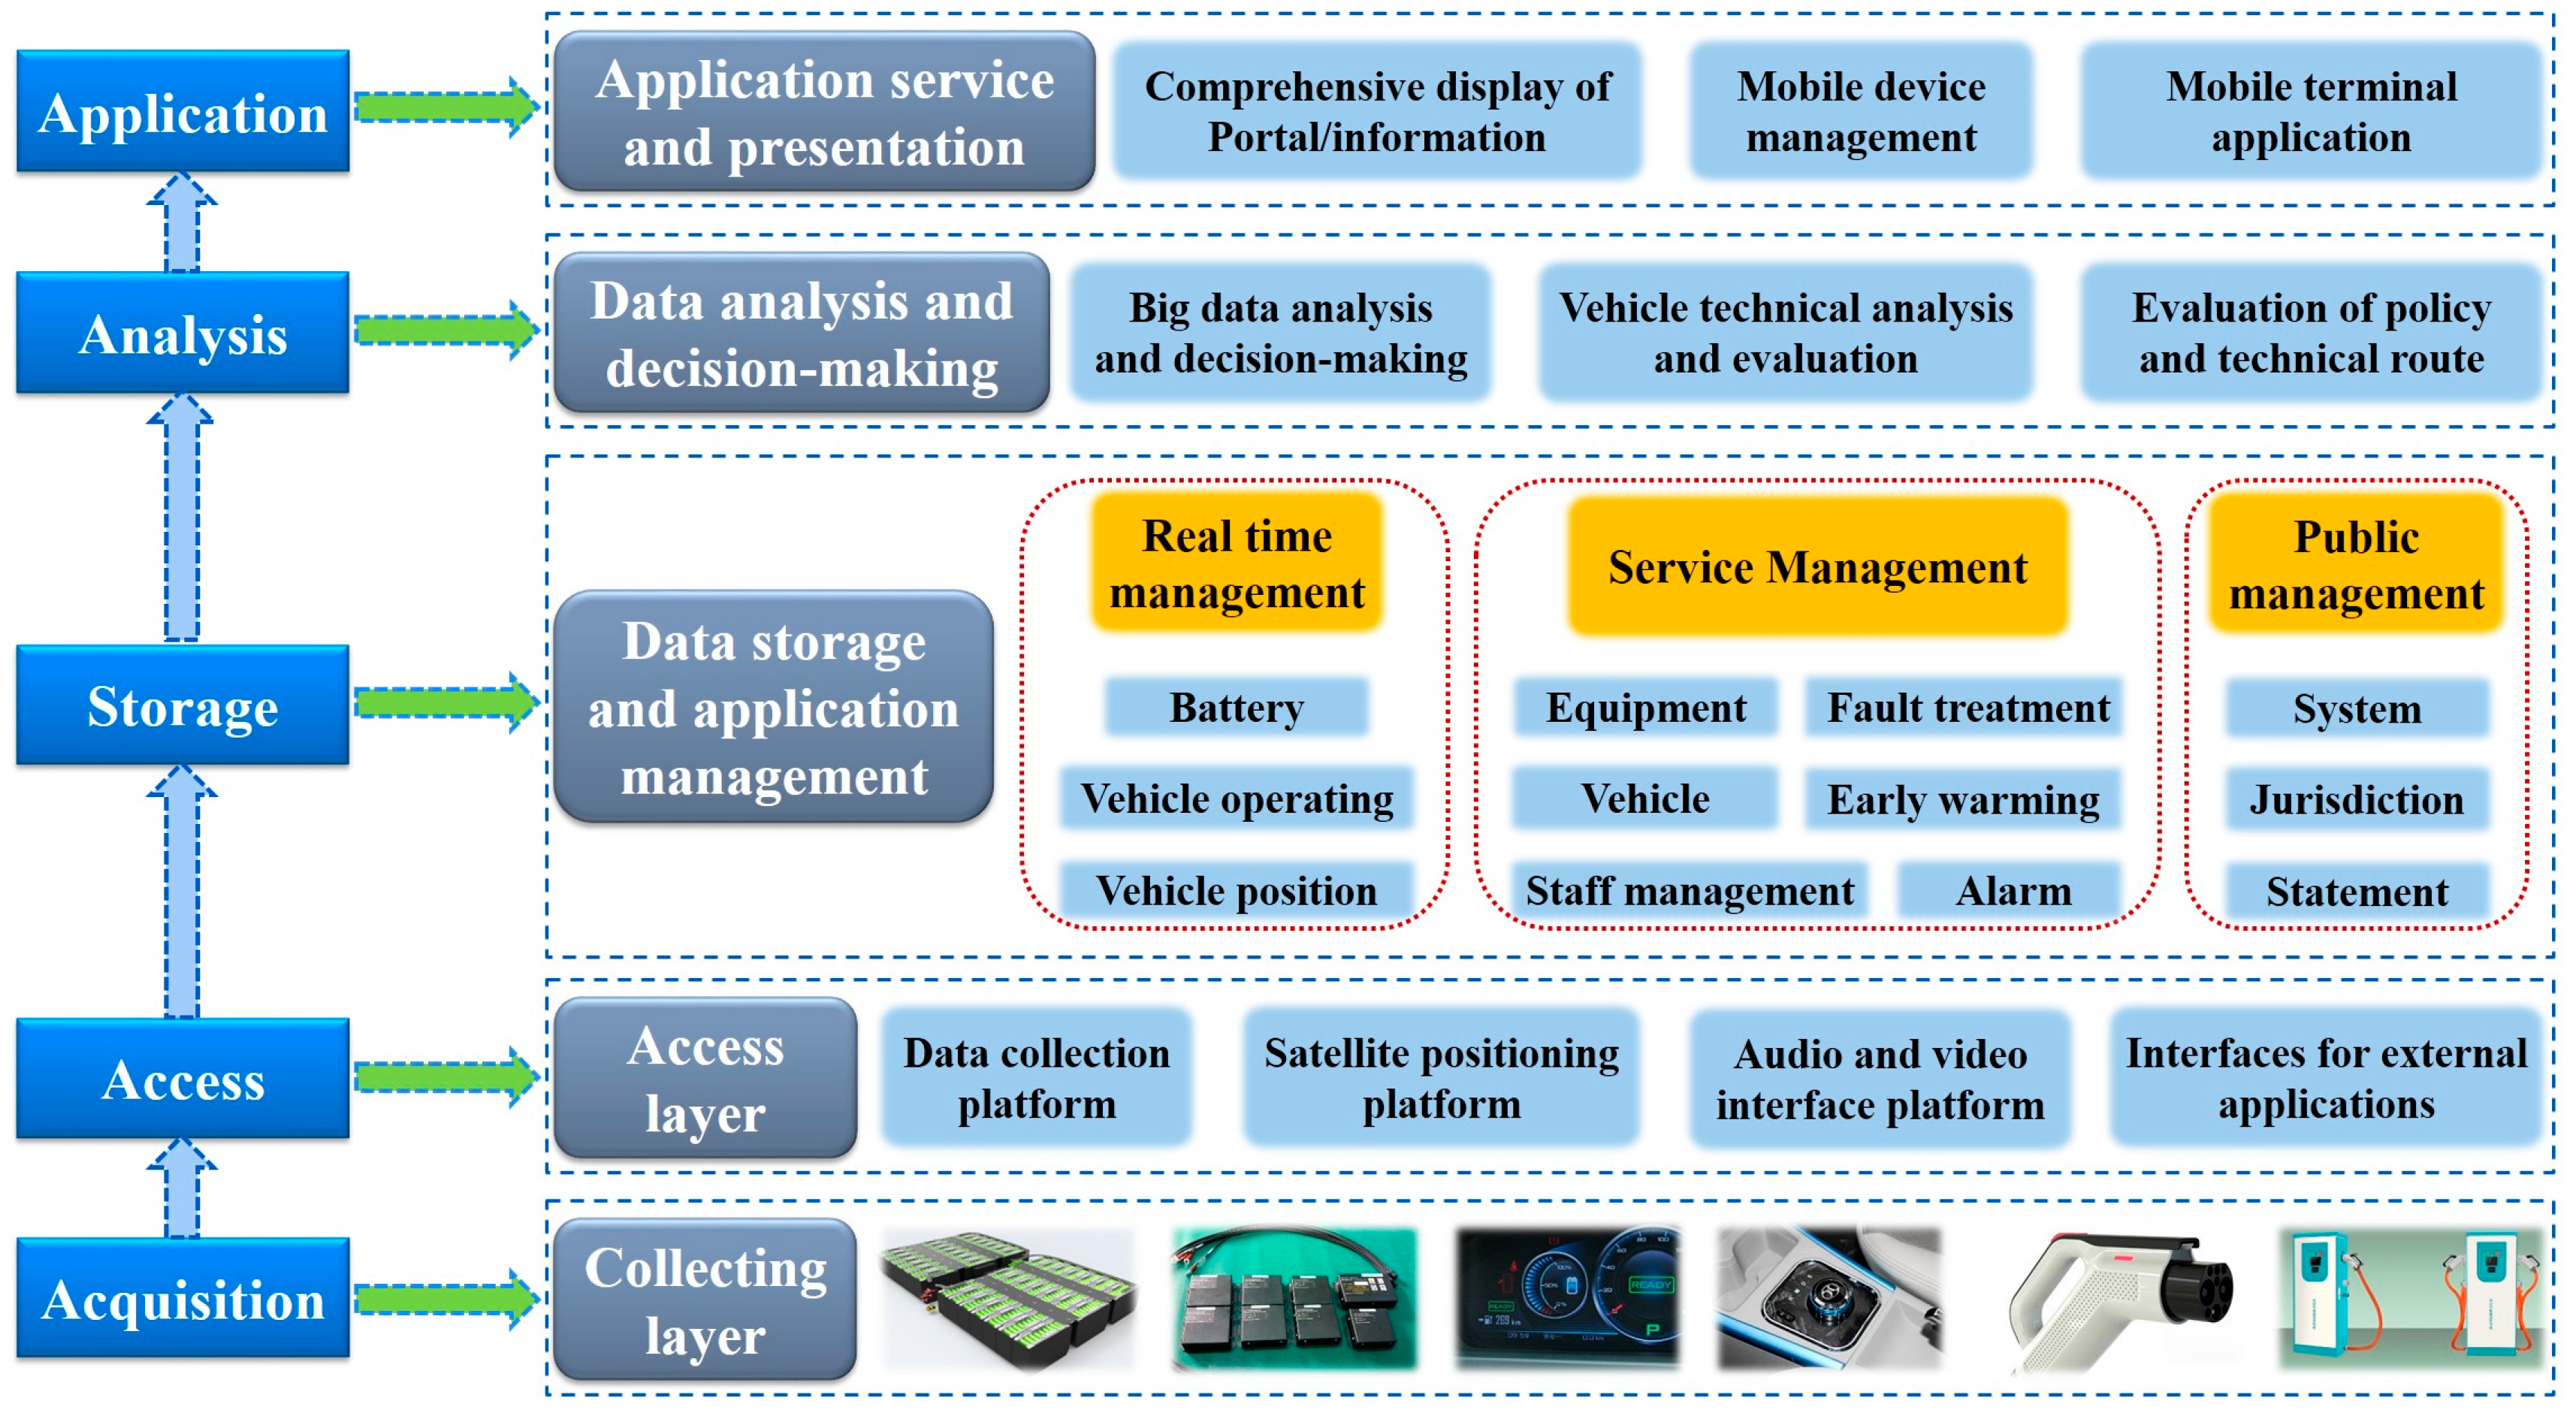
Through the big data platform, running information and the key component states of the monitored vehicles can be obtained using the vehicle-to-platform communication. The main monitoring objects and purposes of NSMC-EV are shown in Table 1, which illustrates that there is a potential thermal runaway risk once the battery temperature reaches beyond the maximum threshold. Meanwhile it requires human intervention for identifying potential problems to safeguard vehicle operation and maintain the battery cycle life. The logical topological management structure of NSMC-EV is sketched in Figure 3, which is a multi-level structure of “acquisition/access-storage-analysis-application”, implementing the fusion and centralized supervision multi-source information, one-stop query and service, as well as data-supporting the whole series of models. Until now, this center has provided around-the-clock monitoring service for over 7000 units of EVs mainly consisting of public vehicles, such as taxis, buses, and sanitation vehicles, etc.
4. The Thermal Fault Prognosis Analysis and Discussion
4.1. Thermal Management Schematic
A well-designed thermal management system possesses the function of regulating EV and HEV battery pack temperatures evenly, keeping them within the desired operating range. Proper thermal design of every module has a positive impact on overall pack thermal management with the corresponding thermal behavior. In general, a battery thermal management system (BTMS) with few battery modules, using air as the heat transfer medium, is less complicated, which is more effective than using liquid for cooling/heating. Nevertheless, a battery thermal management system with a large number of battery modules faces the opposite issues. General schematics of BTMS using air and liquid are shown in Figure 4a,b, respectively [36]. Either natural or forced air convection can be used for air BTM. Figure 4a illustrates three air BTM methods including passive air cooling, passive air cooling/heating and active air cooling/heating. As opposed to air, liquid has higher thermal conductivity and heat capacity. Liquid BTM is regarded as a better solution, which can be divided into passive or active methods, shown as Figure 4b. The thermal management system may be passive (i.e., only the ambient environment is used) or active (i.e., a built-in source provides heating and/or cooling at cold or hot temperatures). The thermal management control strategy is settled through the electronic control unit. A thermal management system probably uses air for heating/cooling ventilation or liquid as the cooling/heating insulation layer. In addition, phase change materials are another choice for cooling/heating as thermal storage. However, the combination of these three methods are the most common scheme in current BTMS.
Generally, for parallel HEVs, an air thermal management system is suggested, whereas for EVs and series HEVs, liquid-based systems are more suitable for optimum thermal performance. NiMH batteries require a more elaborate thermal management system than lithium-ion and valve-regulated lead acid (VRLA) batteries. Lithium-ion batteries need a well-behaved thermal management system due to the concerns of safety and low-temperature performance. Furthermore, the location of the battery pack has a strong impact on the type of BTMS and whether the pack is air-cooled, liquid cooled, or another method is used.
In addition to considering the temperature of a battery pack, uneven temperature distribution should also be taken into account. Temperature variation from module to module could lead to different charging/discharging behaviors for each module. This, in turn, leads to electrically-unbalanced modules or packs and reduced pack performance. Higher temperatures degrade batteries more quickly, while low temperatures reduce power and energy capabilities, resulting in cost, reliability, safety, range, or drivability implications. Therefore, battery thermal management is all-important for EVs to keep the cells in the desired temperature range, minimize cell-to-cell temperature variations, prevent the battery from going above or below acceptable limits, and maximize the useful energy from the cells and the pack with little energy for operation.
A perfect BTMS not only heats and cools the battery system as soon as possible, but also controls the system’s thermal safety to prevent thermal runaway. The typical types of temperature faults in NSMC-EV are over-temperature and excessive temperature difference (TD), which are usually caused by abnormal temperature variation. Detecting when and where the abnormal temperature occurs will play an extremely important role in safe battery management. The normal operating temperature range of lithium-ion batteries is −20 to 60 °C, which is generally controlled at 15–60 °C for the safe operation of the vehicles. The maximum permissible TD is 5 °C, which means the limitation of TD within 5 °C. There are a certain amount of temperature probes in different locations of the battery pack for different vehicles, the monitoring platform of NSMC-EV will send an over-temperature alarm when any temperature probe exceeds 45 °C and an excessive TD alarm when TD > 5 °C.
4.2. The Fault Prognosis of Over-Temperature
In order to verify the feasibility and reliability of the proposed prognosis method for temperature anomaly, the cell data of Vehicle 1 (vehicle plate: Jing Q6S772, Fukuda pure electric sanitation truck, a style of 5023ZLJEV 2T dump truck, with a top speed of 45 km/h. The type of battery is a lithium-ion phosphate battery with 120 cells in series, the monomer voltage is 3.3 V and total voltage is 396 V) on March 6th, 2017 was retrieved from NSMC-EV and the work period of the monitored vehicle was 09:48:39–16:07:52 (more than 6 h), which experienced an over-temperature alarm of T > 45 °C at 11:07:20. There are 16 temperature probes in the different locations of the battery pack and the data acquisition frequency of 0.05 Hz. The temperature and SOC curves of Vehicle 1 are shown in Figure 5, which demonstrates that the temperature of Probe 1 and Probe 9 had different fluctuations form the other probes. In addition, Probe 1 experiences an over-temperature fault with the vehicle running. However, although the abnormity appeared early, it cannot be identified before the alarm occurs by the conventional temperature sensor because it is still in the normal temperature range of T < 45 °C.
As for the presented entropy method in Section 2, the length of the computation window K has significant influence on the accuracy of entropy. If K is too small, the temperature fluctuations cannot be fully revealed. On the contrary, the iterations would become too few to pick out the abnormal temperature fluctuations. Furthermore, because of the graduality and stability of temperature, the temperature fluctuations are relatively small and the position of the abnormal temperature is difficult to detect in a short period of time, so K = 100 was selected as the length of the computation window in this study through the trial-and-error method.
With the vehicle operation and the rise of the battery temperature, the temperature of all probes will gradually stabilize. It is difficult to detect the abnormal temperature fluctuations after temperature stability or failure, so the monitoring data should be processed from the vehicle starting every day. Figure 6a shows the abnormal coefficients of Vehicle 1 in the first 6 h. Probe 1 and Probe 9, especially Probe 1, have obviously larger abnormal coefficients than the others do. This fluctuation of abnormal coefficients is consistent with the temperature fluctuation shown in Figure 5, which verifies that the proposed method can accurately identify the time and location of the abnormal temperature. In order to verify the prognosis performance of the proposed method, the first 3 h were chosen as the calculation unit, during when the over-temperature has not been triggered. The abnormal coefficient in the first 3 h of Vehicle 1 is shown in Figure 6b, which shows that both Probe 1 and Probe 9 with abnormal temperature can be detected. Therefore, the proposed method can accurately predict the over-temperature fault.
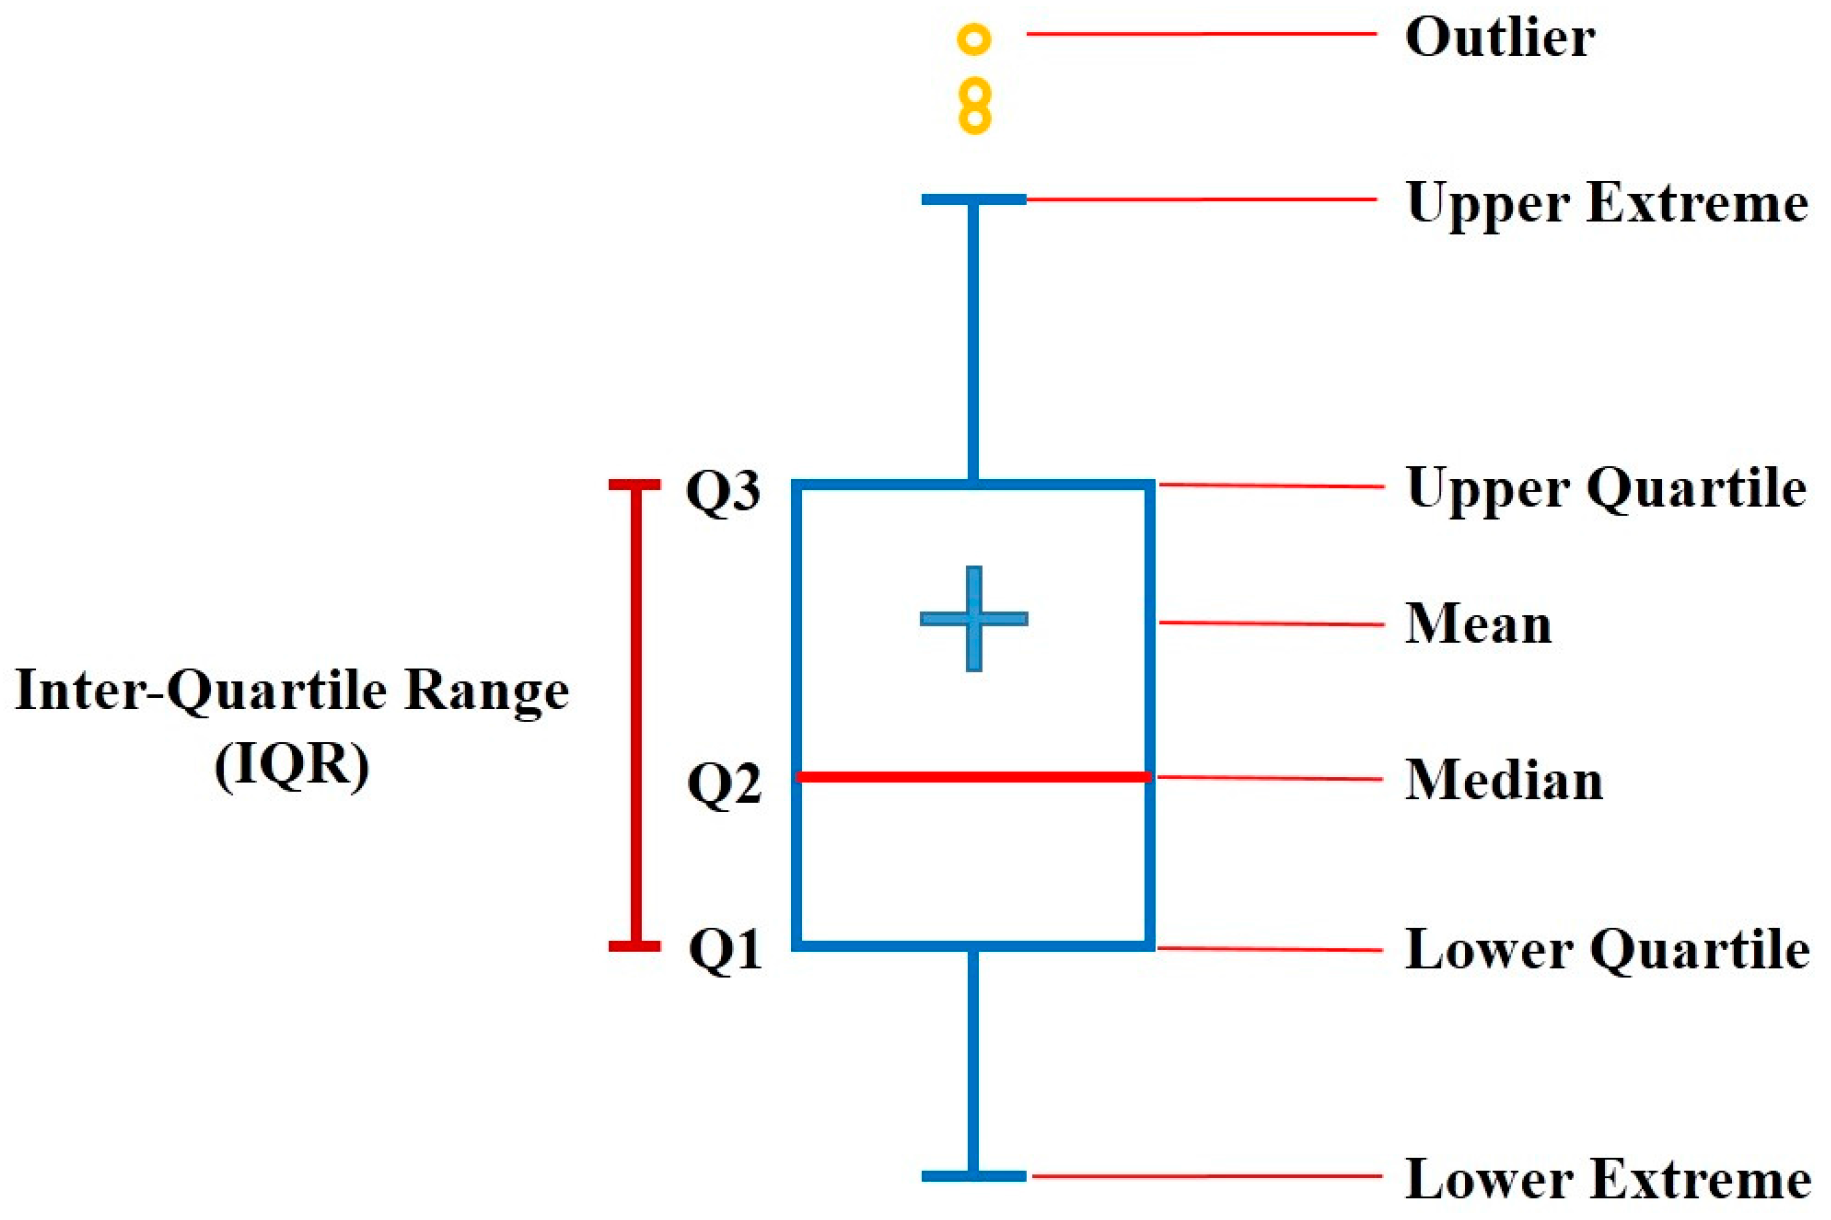
As shown in Figure 6, the anomaly coefficient curves have crosses and accidental extremes, which are not conducive to quantifying the level of the abnormal coefficient. In order to make the abnormal coefficient more readable, and to facilitate a horizontal comparison and evaluation between different temperature probes, a boxplot was employed to express the abnormal coefficient to forecast the temperature faults in this section, which is represented as Ab. Boxplots can reflect the center and spread scope of the data distribution. By drawing the boxplots of multiple sets of data on the same coordinates, the distribution difference is clearly displayed. The structure diagram of the boxplot is shown in Figure 7. The boxplot requires the statistical concept of quartiles, which means the position numbers of three segmentation points. Q1 denotes the lower quartile, which is equal to the number of 25% of all values. Q2 is the median, which is equal to the number of 50% of all values. Q3 is the upper quartile, which is equal to the number of 75% of all values. The abnormal coefficient Ab is the median of the boxplot in this paper.
The abnormal coefficient boxplot in the first 6 h and the first 3 h of Vehicle 1 are shown in Figure 8a,b, respectively. The results reveal that both Probe 1 and Probe 9 can be easily detected and the Ab of Probe 1 is much greater than that of Probe 9 and the others. By defining certain detection thresholds as Ab = 1 and Ab = 1.2, the over-temperature fault alarm can be avoided if the abnormal temperature is detected in advance by this method. Actually, for the purpose of accurate over-temperature fault prognosis, much more monitoring data were derived from NSMC-EV. The evaluation strategy of the abnormal temperature was obtained by the trial-and-error method through a large number of analytical results, which is feasible, reliable, and can accurately forecast both the time and location of over-temperature faults. Thus, this method can effectively prevent the over-temperature fault by detecting the abnormal temperature in real-time.
4.3. The Fault Prognosis of Temperature Difference
The other typical thermal fault in NSMC-EV is excessive temperature difference (TD). The cell data of Vehicle 2 (vehicle plate: Jing B1Y163, CA E30 electric taxi) on November 2nd, 2016 was retrieved from NSMC-EV and the work period of the monitored vehicle was 07:55:57–23:59:54 (more than 16 h), which experienced an excessive TD fault alarm with a TD > 5 °C at 18:14:55, after the tested vehicle traveled for more than 9 h. There are 16 temperature probes in the different locations of the battery pack and the data acquisition frequency is 0.1 Hz. The temperature curves of Vehicle 2 are shown in Figure 9. This revealed that the temperature of Probe 11 has an abnormal fluctuation with the vehicle running, which directly leads to the generation of the TD fault. However, this abnormity cannot be detected by the conventional temperature sensor because it is still in the normal temperature range of 0–30 °C.
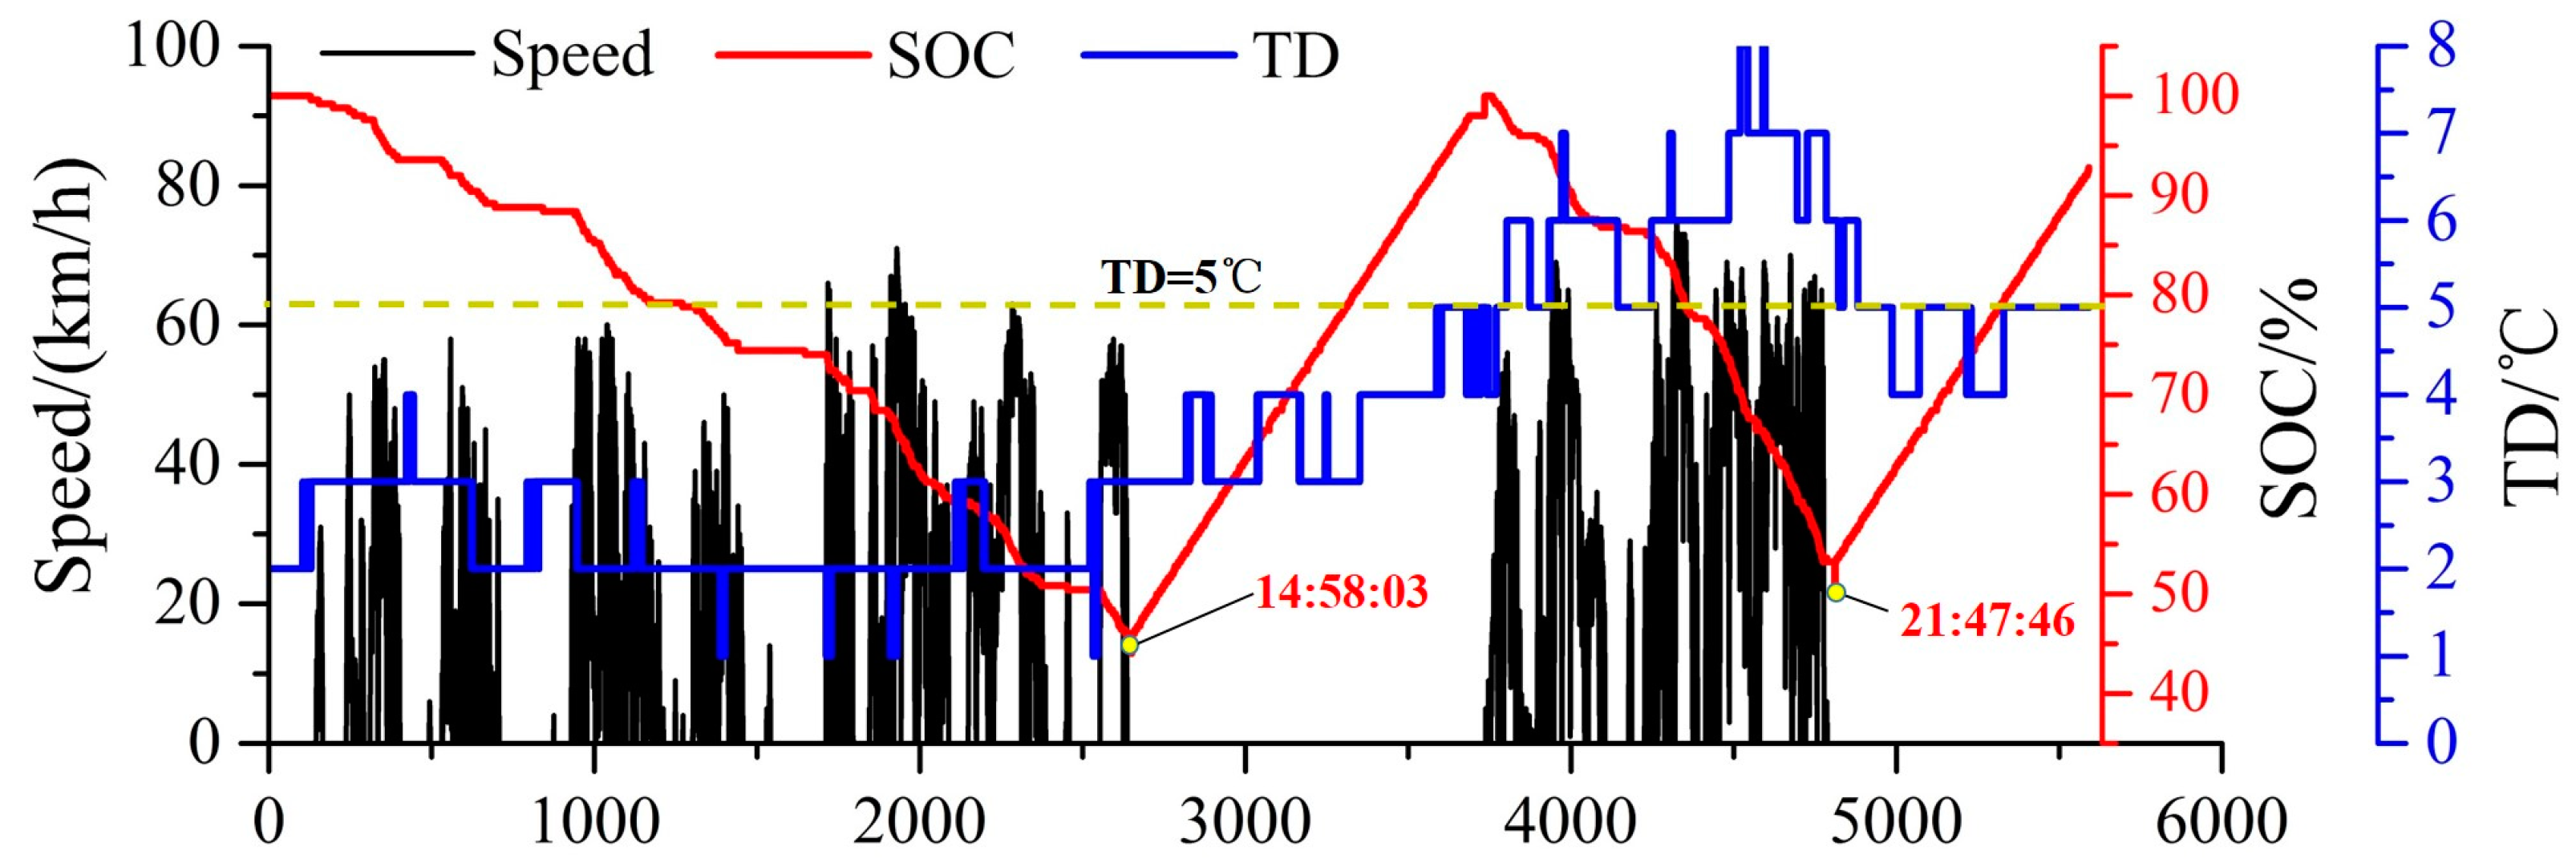
The SOC, speed, and TD curves of Vehicle 2 on November 2nd, 2016 are shown in Figure 10. This demonstrates that this car charged twice and parked several times at 14:58:03 and 21:47:46. In addition, the TD curves rise slowly with the increase of speed and vehicular running.
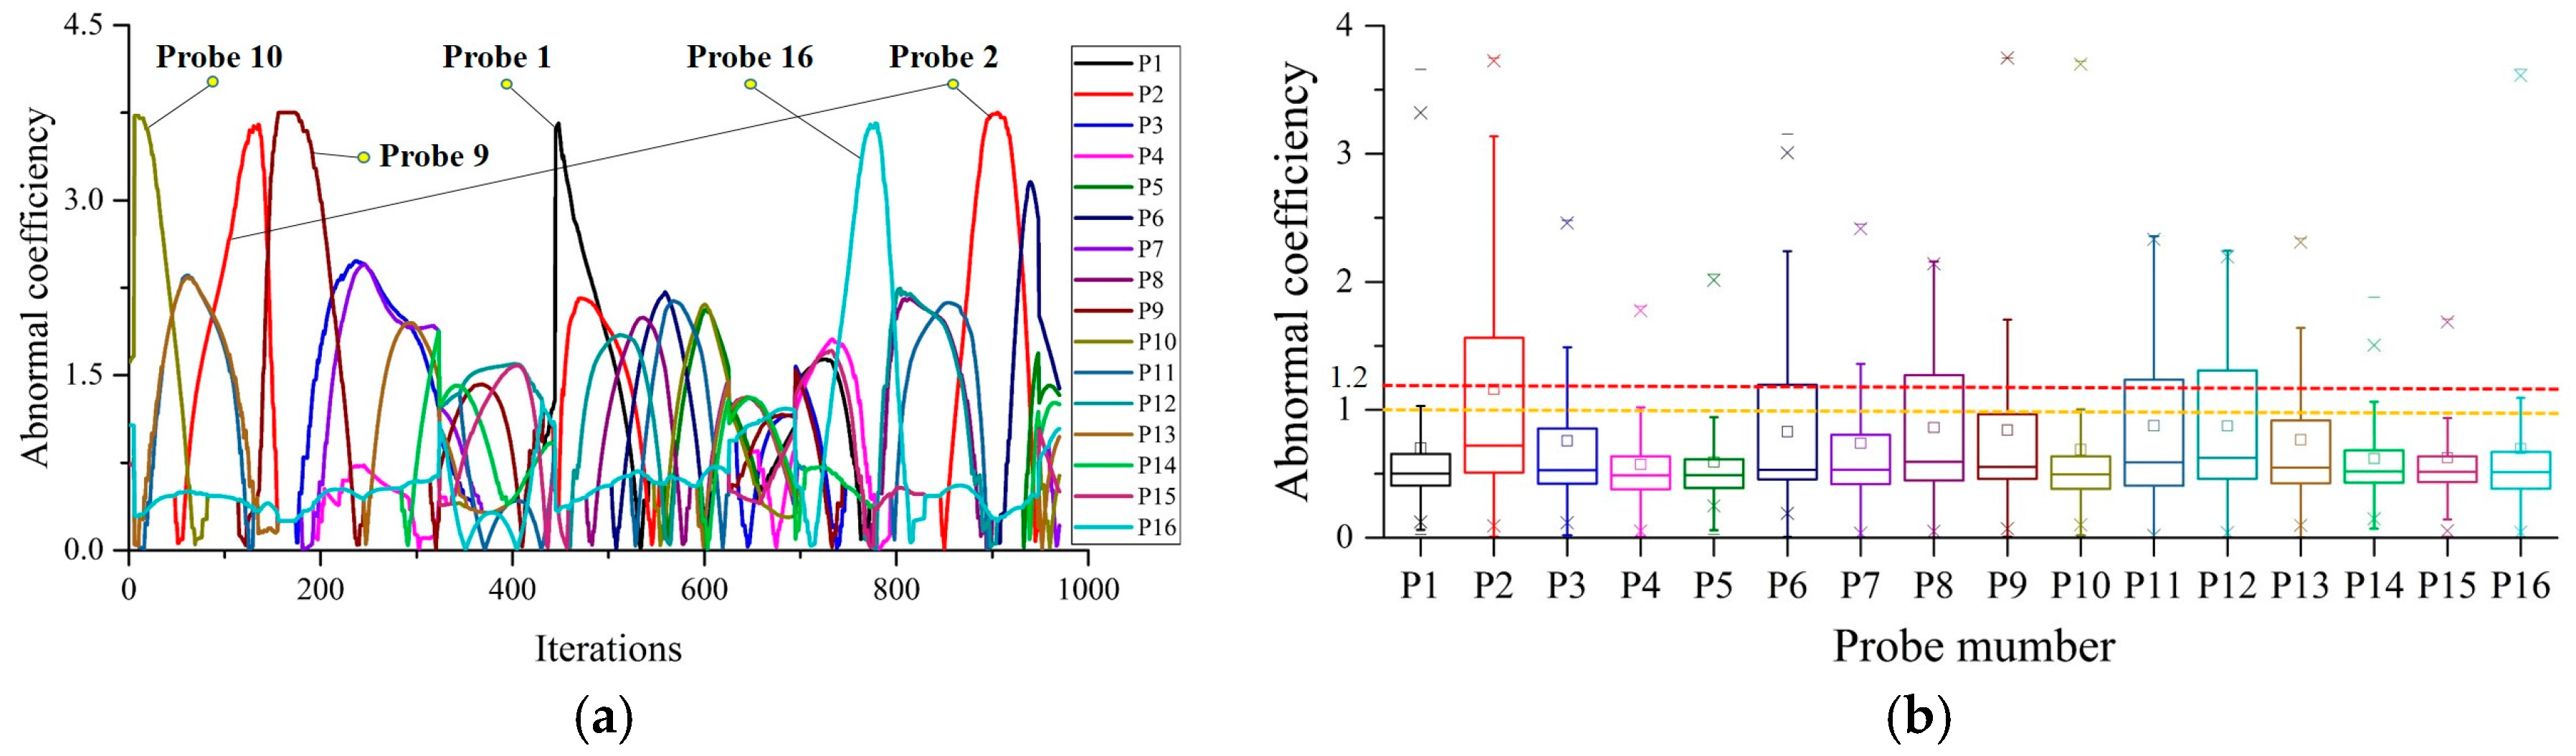
The abnormal coefficient and boxplot of Vehicle 2 in the first 3 h on November 2nd, 2016 are shown in Figure 11a,b, respectively. It is observed from Figure 11a that some probes have anomalous extremum points but no probe has obviously larger abnormity coefficients than the others. Figure 11b displays that the median position of all probes that also be confirmed to Ab < 1, which is consistent with the temperature curves in Figure 9. Thus, all of the probes have a safe temperature status and no abnormal temperature can be detected in the first 3 h.
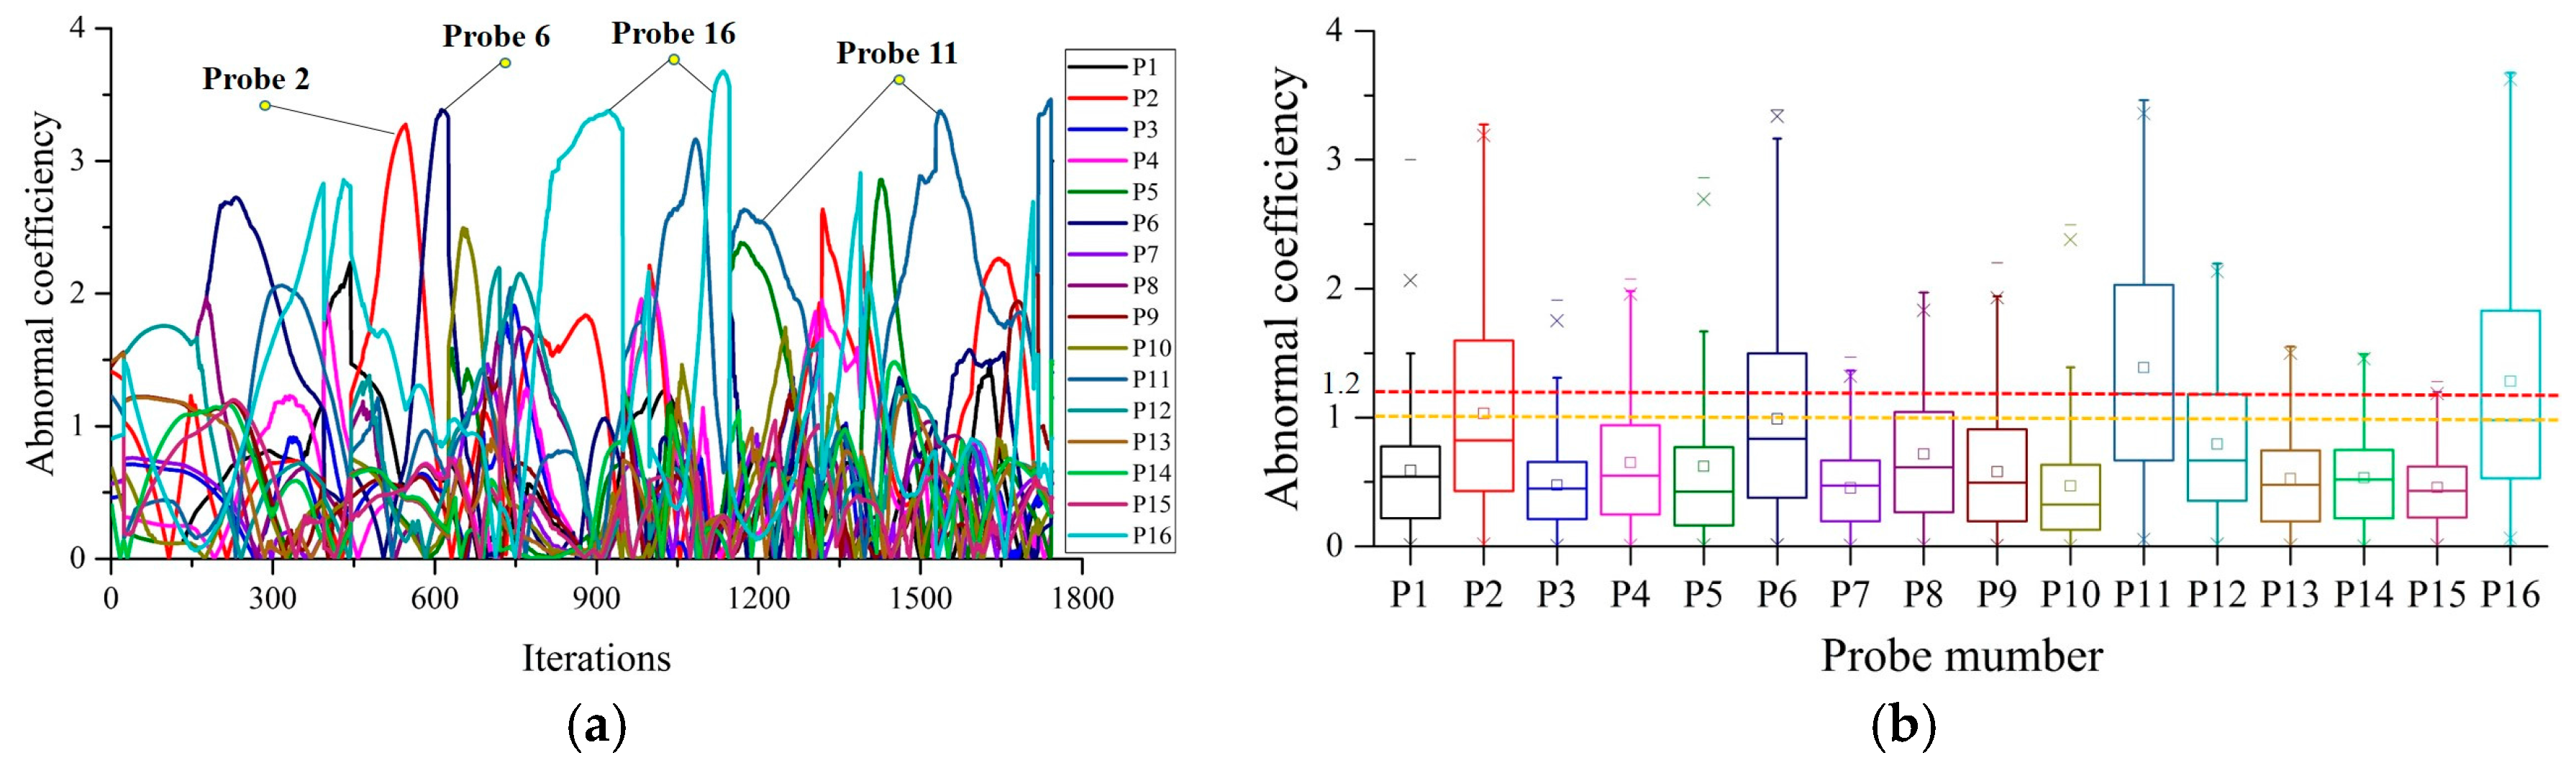
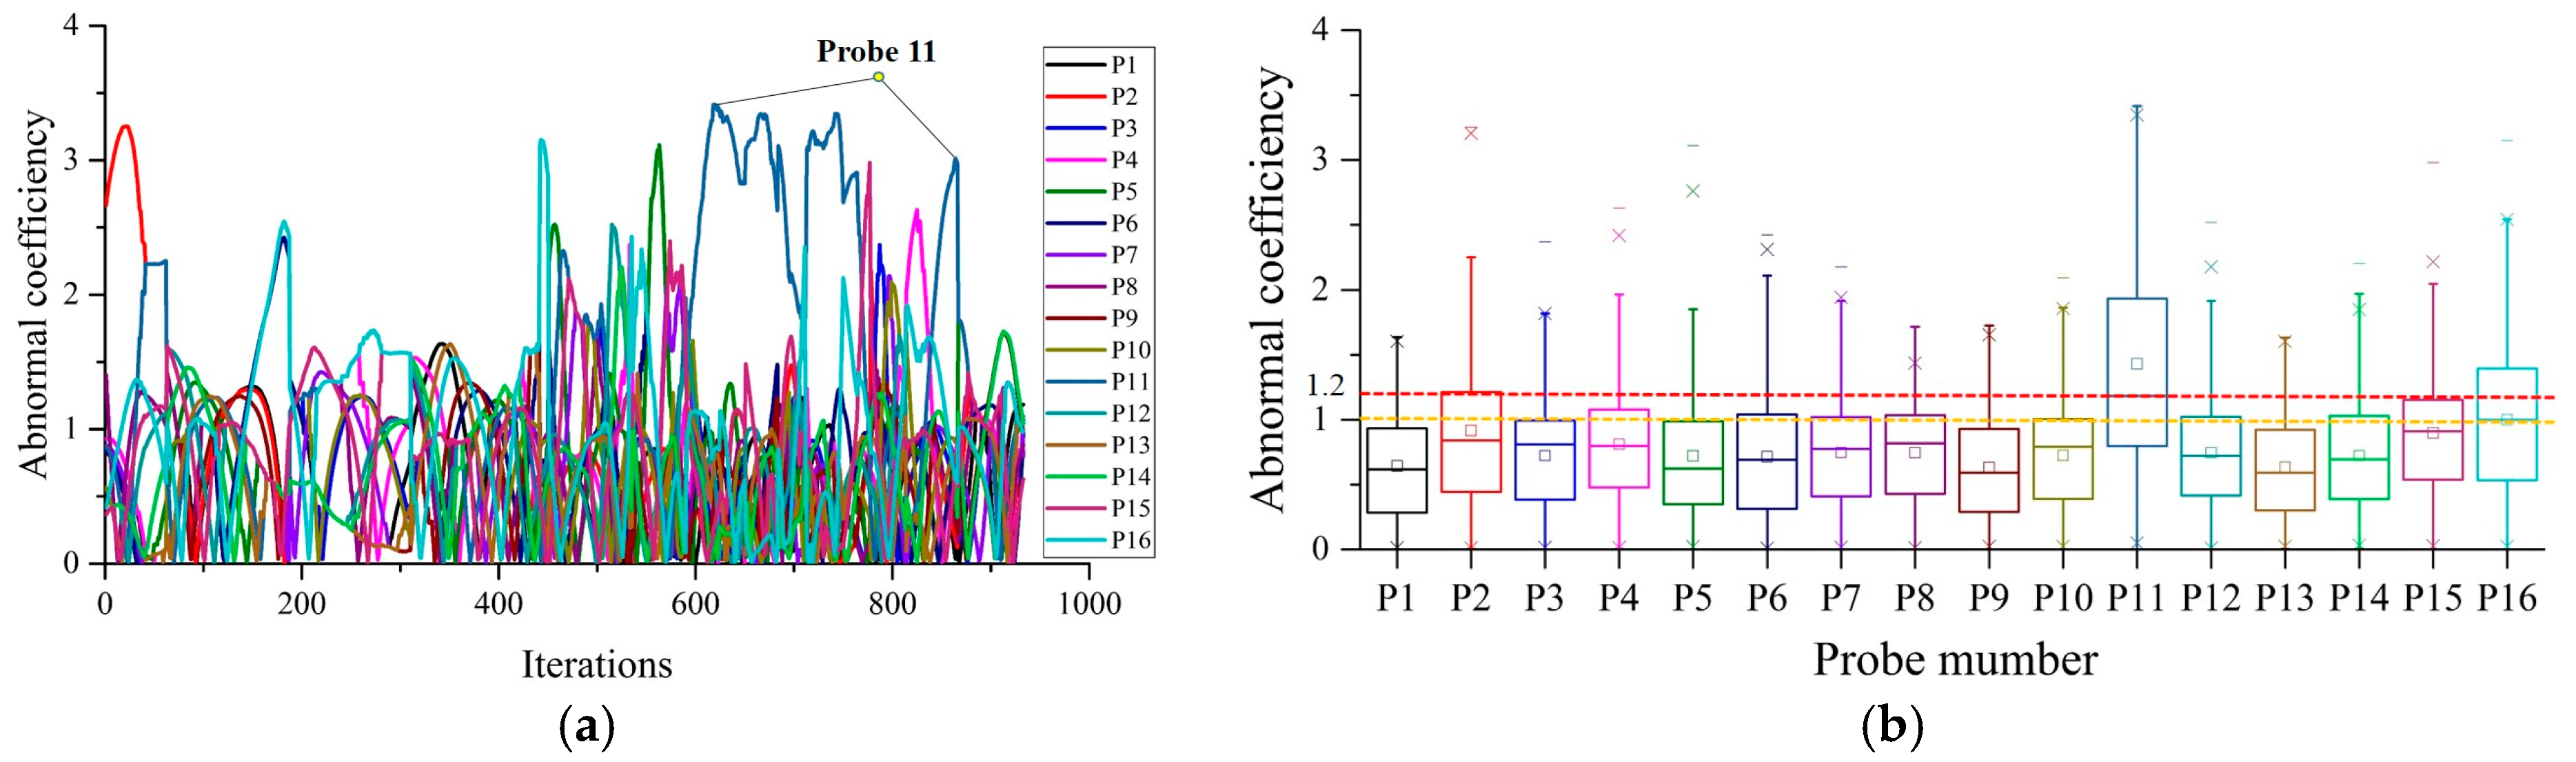
Due to the design flaws of the battery box or the thermal runaway of batteries, the tendency of the temperature change of different temperature probes will have certain differences. With the vehicle operation and the rising of the battery temperature, the temperature will be gradually stabilize. It is difficult to detect the abnormal temperature fluctuations after the temperature become stable, or there is a failure, so the first 3 h from the starting point are taken as the initial calculation window, if the abnormal temperature probe cannot be detected, then continues to calculate for the next 3 h. The abnormal coefficient and boxplot of Vehicle 2 at the first 6 h and the first 9 h on November 2nd, 2016 are shown in Figure 12 and Figure 13, respectively. Figure 12a indicates that Probe 11 has an abnormal temperature fluctuation, but is difficult to detect due to the interference of Probe 2, Probe 6 and Probe 16. Figure 12b shows that the median position of Probe 11 is greater than those of the others and the abnormal coefficient Ab > 1, which is consistent with the temperature curves in Figure 9. Thus, abnormal temperature of Probe 11 can be detected in the first 6 h. From Figure 13a, Probe 11 has a distinct abnormal fluctuation and is easier to detect. Figure 13b demonstrates that the median position of Probe 11 is higher compared to those of other probes and the abnormal coefficient Ab > 1. The results show excellent consistency with the previous temperature curves in Figure 9. The excessive TD fault of Vehicle 2 occurred after it traveled more than 9 h. Therefore, the proposed prognosis method can detect the abnormal probe in real-time and identify the fault location in advance.
In order to verify the stability of this method, the cell data of Vehicle 2 on November 1st, 2016 was derived from NSMC-EV and the period of the monitoring data was 10:51:05–23:36:38. An alarm of excessive temperature difference of TD > 5 °C at 17:12:15 occurred in Vehicle 2 after the tested vehicle traveled for more than 9 h. The temperature curves of Vehicle 2 are shown in Figure 14, which illustrates that the temperature of Probe 11 has different fluctuations with the vehicle running. However, the abnormal temperature cannot be identified as long as it is still in the safe temperature range.
The abnormal coefficient and boxplot at the first 3 h of Vehicle 2 are shown in Figure 15. Figure 15a indicates that Probe 11 has an abnormal temperature fluctuation and can be detected out. Figure 15b demonstrate that Probe 11 can be easily detected and the limitation of the abnormal coefficient of Probe 11 is Ab > 1. However, the excessive TD fault can be avoided if the abnormal temperature is detected in advance. Actually, for accurate excessive TD fault prognosis, much more monitoring data were retrieved from NSMC-EV and analyzed, which reveals the proposed method is feasible, reliable, and stable to accurately predict the time and location of excessive TD faults within a battery pack. Thus, this method can effectively prevent the excessive TD fault by detecting the abnormal temperature in real-time.
4.4. The Security Management Strategy and Discussion
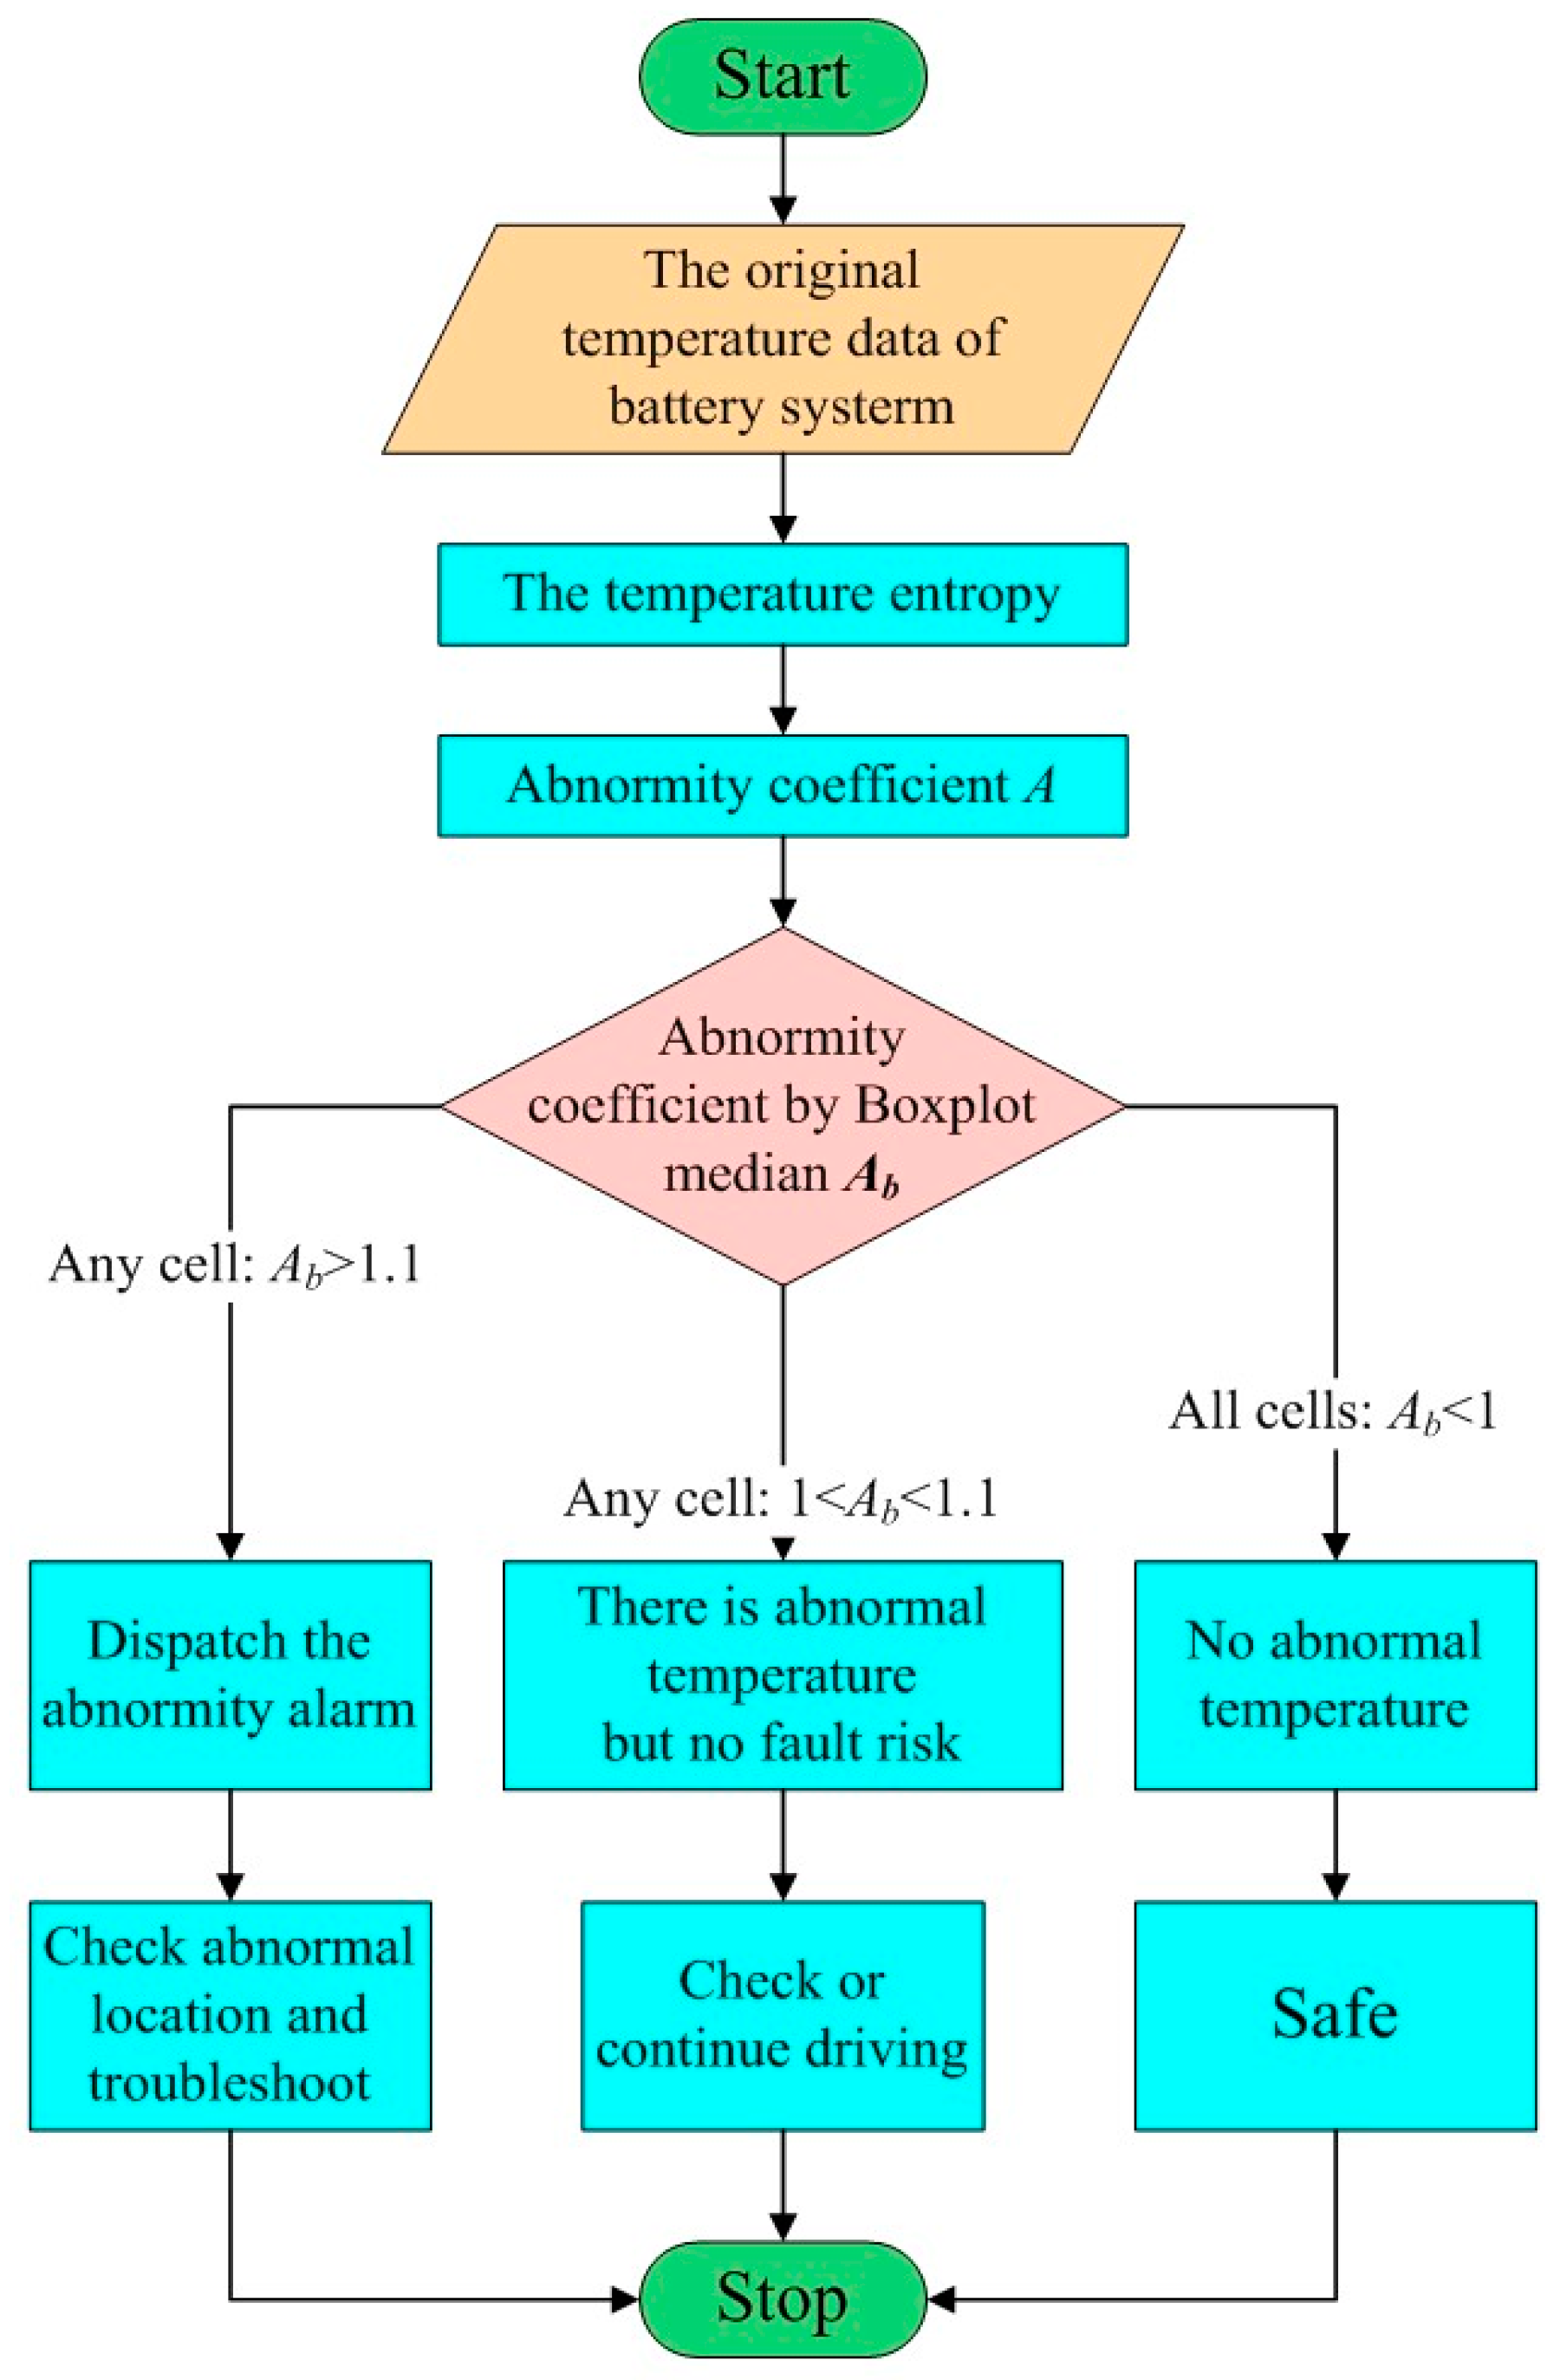
Through the above analysis, the over-temperature fault and excessive TD fault can be predicted using the proposed method and it has well-behaved reliability and stability. By implementing a certain detection threshold as Ab = 1 and Ab = 1.2, the cell with abnormal temperature can be detected before the thermal faults occur, which has vital significance for the future prognosis and safety management of the battery fault, especially for the prevention of thermal runaway. The prognosis strategy of the thermal fault can be obtained through analyzing much more monitoring data retrieved from NSMC-EV using the trial-and-error method. The prognosis strategy flowchart of the thermal fault is shown in Figure 16.
NSMC-EV currently provides around-the-clock monitoring services, mainly for public vehicles apart from private cars, such as taxis, buses, and sanitation vehicles, which always have a relatively small number of cells. Nevertheless, according to the analysis and discussion of different sets of monitoring data, by setting a suitable value of the calculation window K, this technique is still valid even if the EV has a larger number of cells (i.e., Tesla, with 6000+ cells). Therefore, it has a strong timeliness and will have greater application prospects if some private cars with more cells are monitored and managed by NSMC-EV in the future, which will also provide a foundation for the establishment of safety precaution mechanisms for battery thermal runaway.
5. Conclusions
This paper presents a real-time thermal fault diagnosis and prognosis method based on the NSMC-EV in Beijing. A vast quantity of real-time voltage monitoring data was collected from this big data platform to verify the effectiveness of the presented prognosis method. The Shannon entropy was applied to analyze the monitoring data. The analysis results showed that the proposed method could detect probes with abnormal temperature, which can also effectively predict the occurrence time and location. These were achieved with a relatively small calculation effort, which makes it implementable in a real safety BMS. The feasibility, reliability, and stability of the prognosis capability were also discussed and verified by analyzing extensive monitoring data. Furthermore, the prognosis and safety management strategy for thermal faults of battery systems were also developed by applying the Z-score method, and the abnormity coefficients were implemented to make real-time evaluation on the faulty levels. The presented method is flexible in all disorder systems with abnormal fluctuations regardless the data types and application fields, so it possesses widespread application potential in not only electric vehicles, but also other areas with complex abnormally fluctuating environments.
Acknowledgments
The project is supported by the State Key Program of National Natural Science Foundation of China (No. U1564206) and the Special Innovation Methods Program of Science and Technology Ministry of China (grant No. 2015IM030100).
Author Contributions
Jichao Hong provided algorithms, analyzed the data and wrote the paper; and Zhenpo Wang and Peng Liu conceived the structure and research direction of the paper.
Conflicts of Interest
The authors declare no conflict of interest.
References
- Tarascon, J.; Armand, M. Issues and challenges facing rechargeable lithium batteries. Nature 2001, 414, 359–367. [Google Scholar] [CrossRef] [PubMed]
- Wang, Q.S.; Ping, P.; Zhao, X.J.; Chu, G.Q.; Sun, J.H.; Chen, C.H. Thermal runaway caused fire and explosion of lithium ion battery. J. Power Sources 2012, 208, 210–224. [Google Scholar] [CrossRef]
- Tugce, Y.; Shawn, L.; Venkatasubramanian, V.J.; Jeremy, J.M. Plug-in hybrid electric vehicle LiFePO4 battery life implications of thermal management, driving conditions and regional climate. J. Power Sources 2017, 338, 49–64. [Google Scholar]
- Daowd, M.; Antoine, M.; Omar, N.; Lataire, P.; Van, D.P.; Van, M.J. Battery Management System-Balancing Modularization Based on a Single Switched Capacitor and Bi-Directional DC/DC Converter with the Auxiliary Battery. Energies 2014, 7, 2897–2937. [Google Scholar] [CrossRef]
- Panchal, S.; Mathewson, S.; Fraser, R.; Culham, R.; Fowler, M. Thermal Management of Lithium-Ion Pouch Cell with Indirect Liquid Cooling using Dual Cold Plates Approach. SAE Int. J. Altern. Powert. 2015, 4, 293–307. [Google Scholar] [CrossRef]
- Panchal, S.; Dincer, I.; Agelin-Chaab, M.; Fraser, R.; Fowler, M. Experimental and theoretical investigations of heat generation rates for a water cooled LiFePO4 battery. Int. J. Heat Mass Transf. 2016, 101, 1093–1102. [Google Scholar] [CrossRef]
- Lan, C.; Xu, J.; Qiao, Y.; Ma, Y. Thermal management for high power lithium-ion battery by minichannel aluminum tubes. Appl. Therm. Eng. 2016, 101, 284–292. [Google Scholar] [CrossRef]
- Qian, Z.; Li, Y.; Rao, Z. Thermal performance of lithium-ion battery thermal management system by using mini-channel cooling. Energy Convers. Manag. 2016, 126, 622–631. [Google Scholar] [CrossRef]
- Mastali, M.; Samadani, E.; Farhad, S.; Fraser, R.; Fowler, M. Three-dimensional Multi-Particle Electrochemical Model of LiFePO4 Cells based on a Resistor Network Methodology. Electrochim. Acta 2016, 190, 574–587. [Google Scholar] [CrossRef]
- Sun, F.; Xiong, R.; He, H. A systematic state-of-charge estimation framework for multi-cell battery pack in electric vehicles using bias correction technique. Appl. Energy 2016, 162, 1399–1409. [Google Scholar] [CrossRef]
- Blanco, C.; Sanchez, L.; Gonzalez, M.; Anton, J.C.; Garcia, V.; Viera, J.C. An Equivalent Circuit Model with Variable Effective Capacity for Batteries. IEEE Trans. Veh. Technol. 2014, 63, 3592–3599. [Google Scholar] [CrossRef]
- Xiong, R.; Sun, F.; Gong, X.; Gao, C. A data-driven based adaptive state of charge estimator of lithium-ion polymer battery used in electric vehicles. Appl. Energy 2014, 113, 1421–1433. [Google Scholar] [CrossRef]
- Xiong, R.; Tian, J.; Mu, H.; Wang, C. A systematic model-based degradation behavior recognition and health monitor method of lithium-ion batteries. Appl. Energy 2017, 5, 124. [Google Scholar] [CrossRef]
- Sun, F.; Xiong, R. A novel dual-scale cell state-of-charge estimation approach for series-connected battery pack used in electric vehicles. J. Power Sources 2015, 274, 582–594. [Google Scholar] [CrossRef]
- Xiong, R.; Sun, F.; Chen, Z.; He, H. A data-driven multi-scale extended Kalman filtering based parameter and state estimation approach of lithium-ion polymer battery in electric vehicles. Appl. Energy 2014, 113, 463–476. [Google Scholar] [CrossRef]
- Lin, X.; Perez, H.E.; Siegel, J.B.; Stefanopoulou, A.G.; Li, Y.; Anderson, R.D.; Ding, Y.; Castanier, M.P. Online parameterization of lumped thermal dynamics in cylindrical lithium ion batteries for core temperature estimation and health monitoring. IEEE Trans. Control Syst. Technol. 2013, 21, 1745–1755. [Google Scholar]
- Forgez, C.; Do, D.V.; Friedrich, G.; Morcrette, M.; Delacourt, C. Thermal modeling of a cylindrical LiFePO4/graphite lithium-ion battery. J. Power Sources 2010, 195, 2961–2968. [Google Scholar] [CrossRef]
- Xiong, R.; Yu, Q.; Wang, L.; Lin, C. A novel method to obtain the open circuit voltage for the state of charge of lithium ion batteries in electric vehicles by using H infinity filter. Appl. Energy 2017, 5, 136. [Google Scholar] [CrossRef]
- Seo, M.; Goh, T.; Park, M.; Koo, G.; Kim, S.W. Detection of Internal Short Circuit in Lithium Ion Battery Using Model-Based Switching Model Method. Energies 2017, 10, 76. [Google Scholar] [CrossRef]
- Zhang, H.; Pei, L.; Sun, J.L.; Song, K.; Lu, R.G.; Zhao, Y.P.; Zhu, C.B.; Wang, T.S. Online Diagnosis for the Capacity Fade Fault of a Parallel-Connected Lithium Ion Battery Group. Energies 2016, 9, 387. [Google Scholar] [CrossRef]
- Chen, C.; Xiong, R.; Shen, W. A lithium-ion battery-in-the-loop approach to test and validate multi-scale dual H infinity filters for state of charge and capacity estimation. IEEE Trans. Power Electr. 2017, PP, 1. [Google Scholar] [CrossRef]
- Liu, Z.; He, H. Model-based Sensor Fault Diagnosis of a Lithium-ion Battery in Electric Vehicles. Energies 2015, 8, 6509–6527. [Google Scholar] [CrossRef]
- Bai, H.; Miao, S.; Zhang, P.; Bai, Z. Reliability Evaluation of a Distribution Network with Microgrid Based on a Combined Power Generation System. Energies 2015, 8, 1216–1241. [Google Scholar] [CrossRef]
- Dey, S.; Biron, Z.A.; Tatipamula, S.; Das, N.; Mohon, S.; Ayalew, B.; Pisu, P. Model-based real-time thermal fault diagnosis of Lithium-ion batteries. Control Eng. Pract. 2016, 56, 37–48. [Google Scholar] [CrossRef]
- Wu, C.; Zhu, C.; Ge, Y.; Zhao, Y. A diagnosis approach for typical faults of lithium-ion battery based on extended kalman filter. Int. J. Electrochem. Sci. 2016, 11, 5289–5301. [Google Scholar] [CrossRef]
- Sidhu, A.; Izadian, A.; Anwar, S. Adaptive Nonlinear Model-Based Fault Diagnosis of Li-Ion Batteries. IEEE Trans. Ind. Electron. 2016, 62, 1002–1011. [Google Scholar] [CrossRef]
- Chen, Z.; Lin, F.; Wang, C.; Wang, L.; Xu, M. Active Diagnosability of Discrete Event Systems and its Application to Battery Fault Diagnosis. IEEE Trans. Control Syst. Technol. 2014, 22, 1892–1898. [Google Scholar] [CrossRef]
- Zheng, Y.; Han, X.; Lu, L.; Li, J.; Ouyang, M. Lithium ion battery pack power fade fault identification based on Shannon entropy in electric vehicles. J. Power Sources 2013, 223, 136–146. [Google Scholar] [CrossRef]
- Rezvanizanian, S.M.; Huang, Y.; Chuan, J.; Lee, J. A Mobility Performance Assessment on Plug-in EV Battery. Int. J. Progn. Health Manag. 2012, 3, 102. [Google Scholar]
- Shannon, C.; Weaver, W. The Mathematical Theory of Communication; University of Illinois Press: Champaign, IL, USA, 1949. [Google Scholar]
- Montani, F.; Deleglise, E.; Rosso, O. Efficiency characterization of a large neuronal network: A causal information approach. Physics A 2014, 401, 58–70. [Google Scholar] [CrossRef]
- Nanayakkara, K.G.M.; Azeezz, A.A. Predicting Corporate Financial Distress in Sri Lanka: An Extension to Z-Score Model. Int. J. Bus. Soc. Res. 2015, 5, 41–52. [Google Scholar]
- Chadha, P. Exploring the Financial Performance of the Listed Companies in Kuwait Stock Exchange Using Altman’s Z-Score Model. Int. J. Econ. Manag. Sci. 2016, 5, 341. [Google Scholar] [CrossRef]
- Aloy, N.J.; Pratheepan, T. The Application of Altman’s Z-Score Model in Predicting Bankruptcy: Evidence from the Trading Sector in Sri Lanka. Int. J. Bus. Manag. 2015, 10, 269–275. [Google Scholar]
- Wang, Z.; Hong, J.; Liu, P.; Zhang, L. Voltage fault diagnosis and prognosis of battery systems based on entropy and Z-score for electric vehicles. Appl. Energy 2017, 196, 289–302. [Google Scholar] [CrossRef]
- Wang, Q.; Jiang, B.; Li, B.; Yan, Y. A critical review of thermal management models and solutions of lithium-ion batteries for the development of pure electric vehicles. Renew. Sustain. Energy Rev. 2016, 64, 106–128. [Google Scholar] [CrossRef]
Figure 1.
The diagnosis and prognosis algorithm flowchart.

Figure 2.
The monitoring and management process of the NSMC-EV.
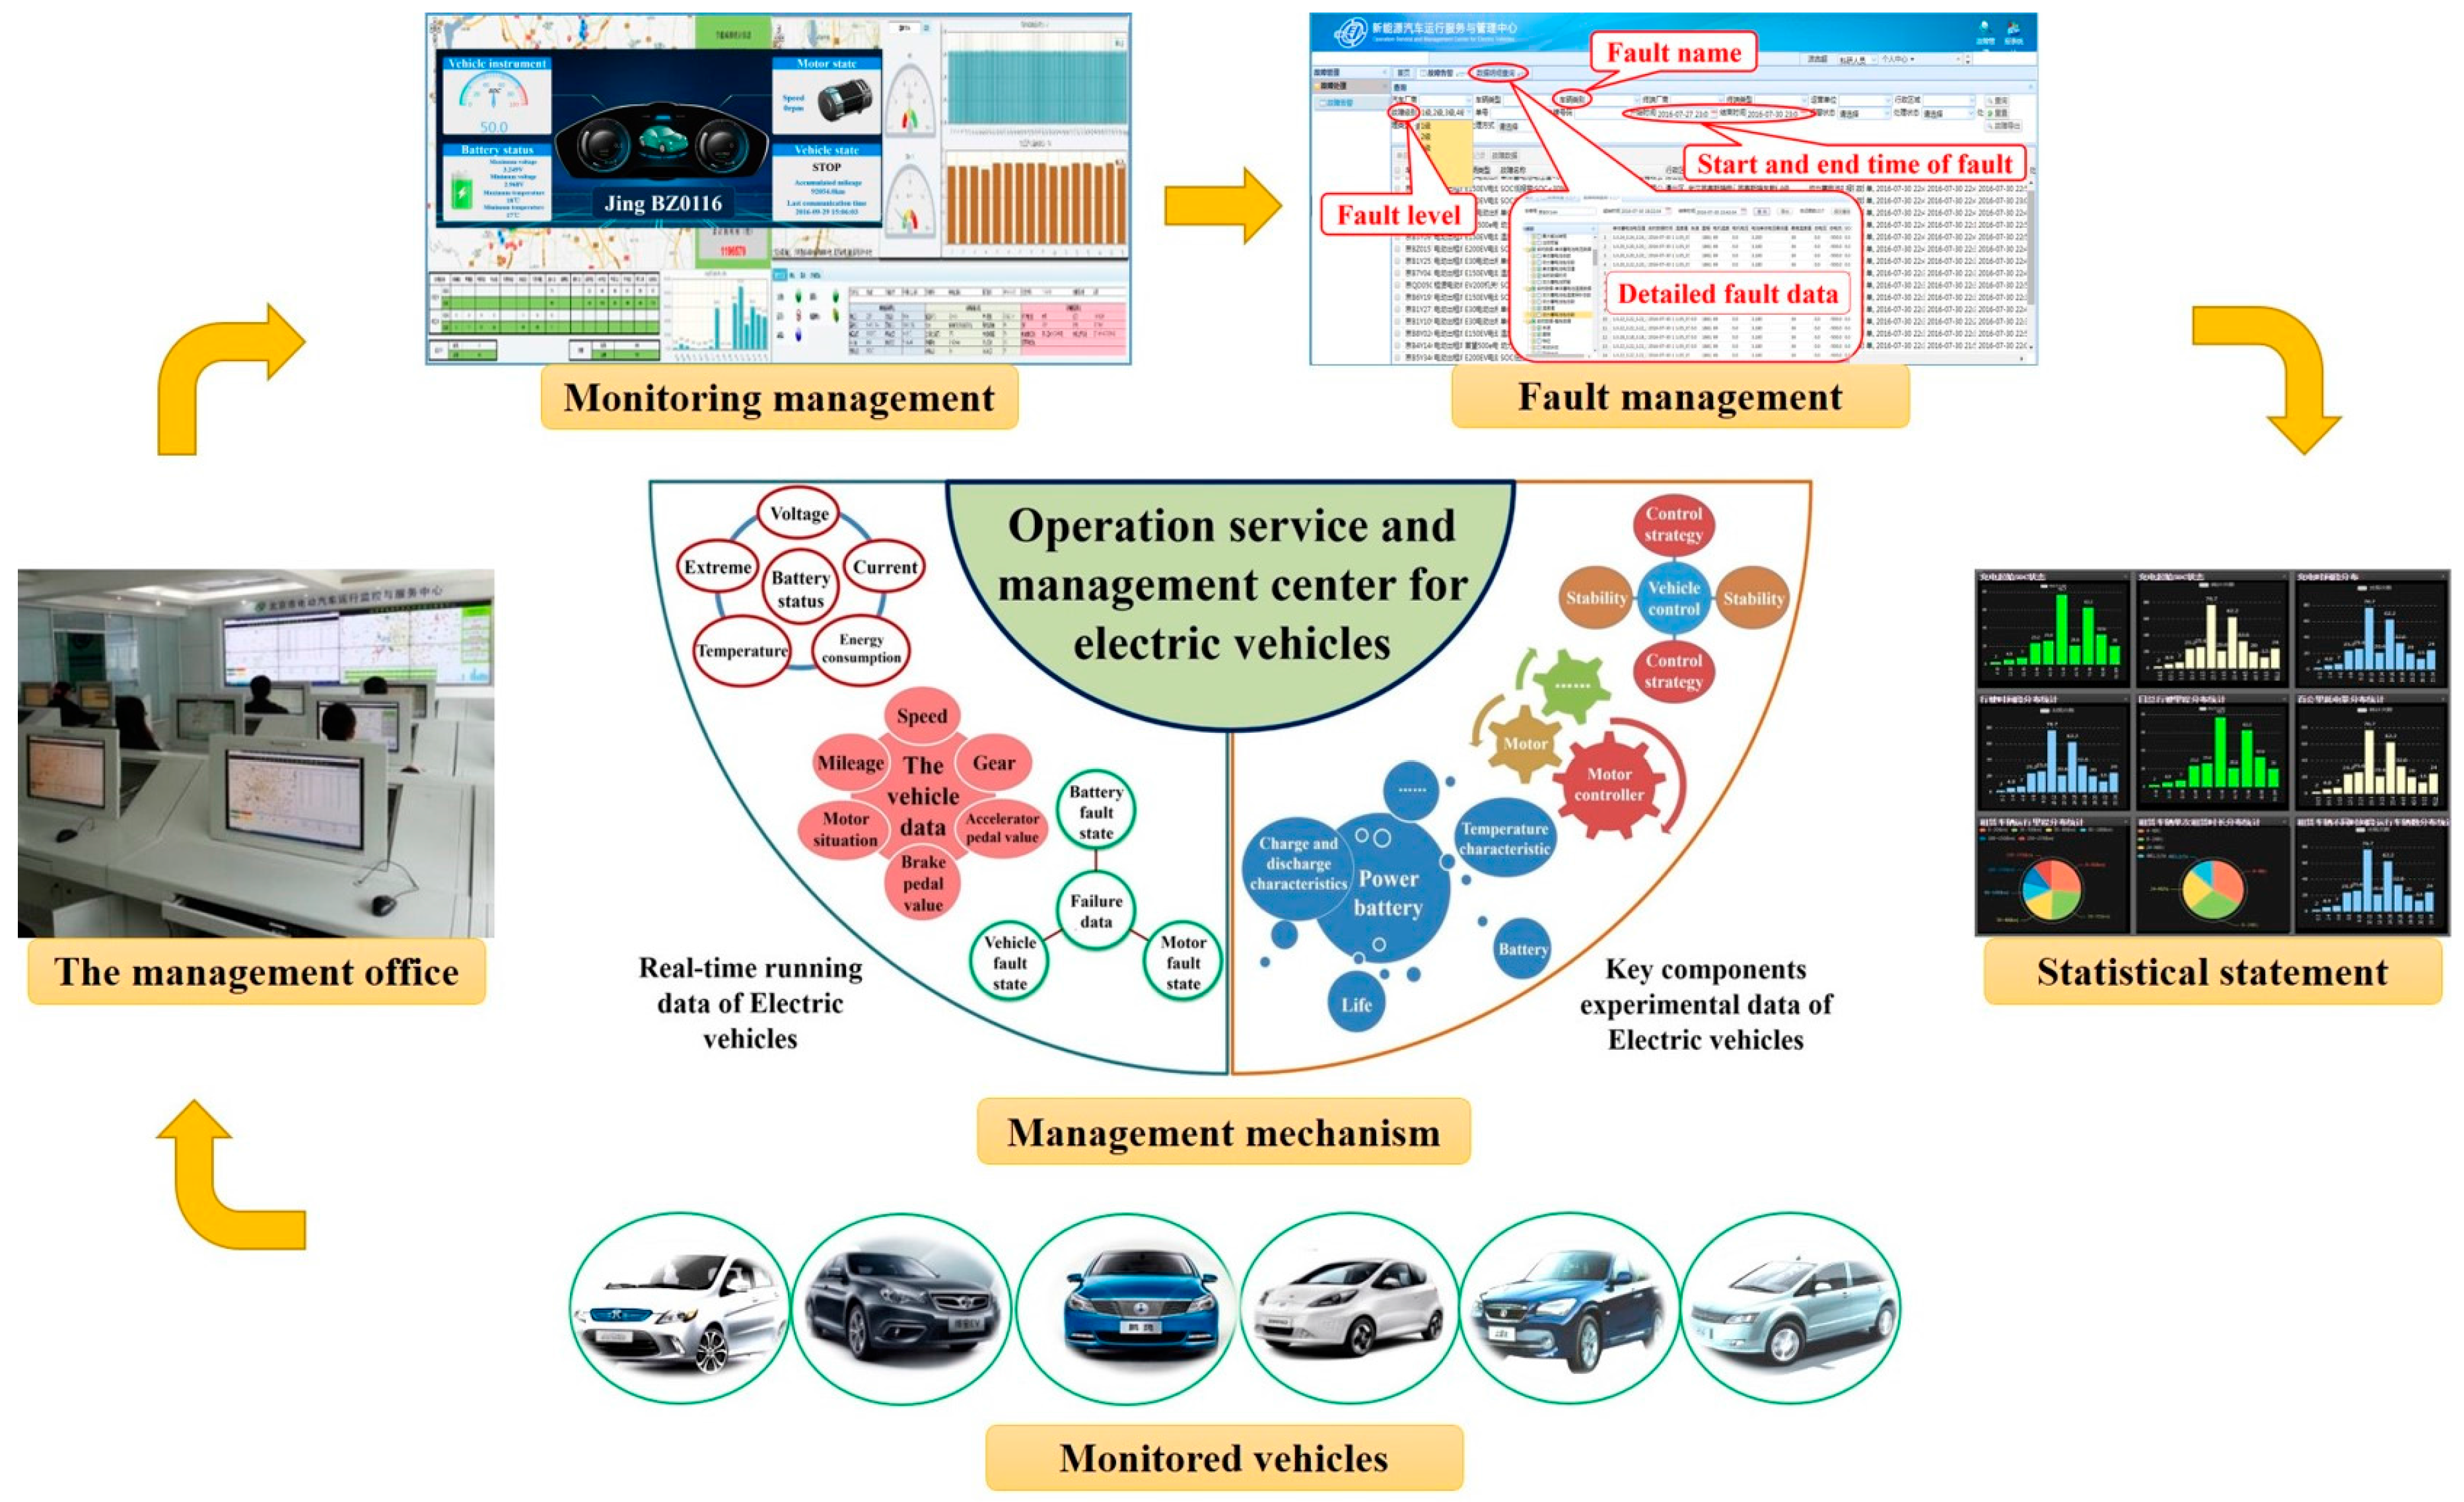
Figure 3.
The logical topological management structure of the NSMC-EV.

Figure 4.
General schematic of BTMS using air and liquid. (a) Three air BTM methods; (b) Three liquid BTM methods.
Figure 4.
General schematic of BTMS using air and liquid. (a) Three air BTM methods; (b) Three liquid BTM methods.
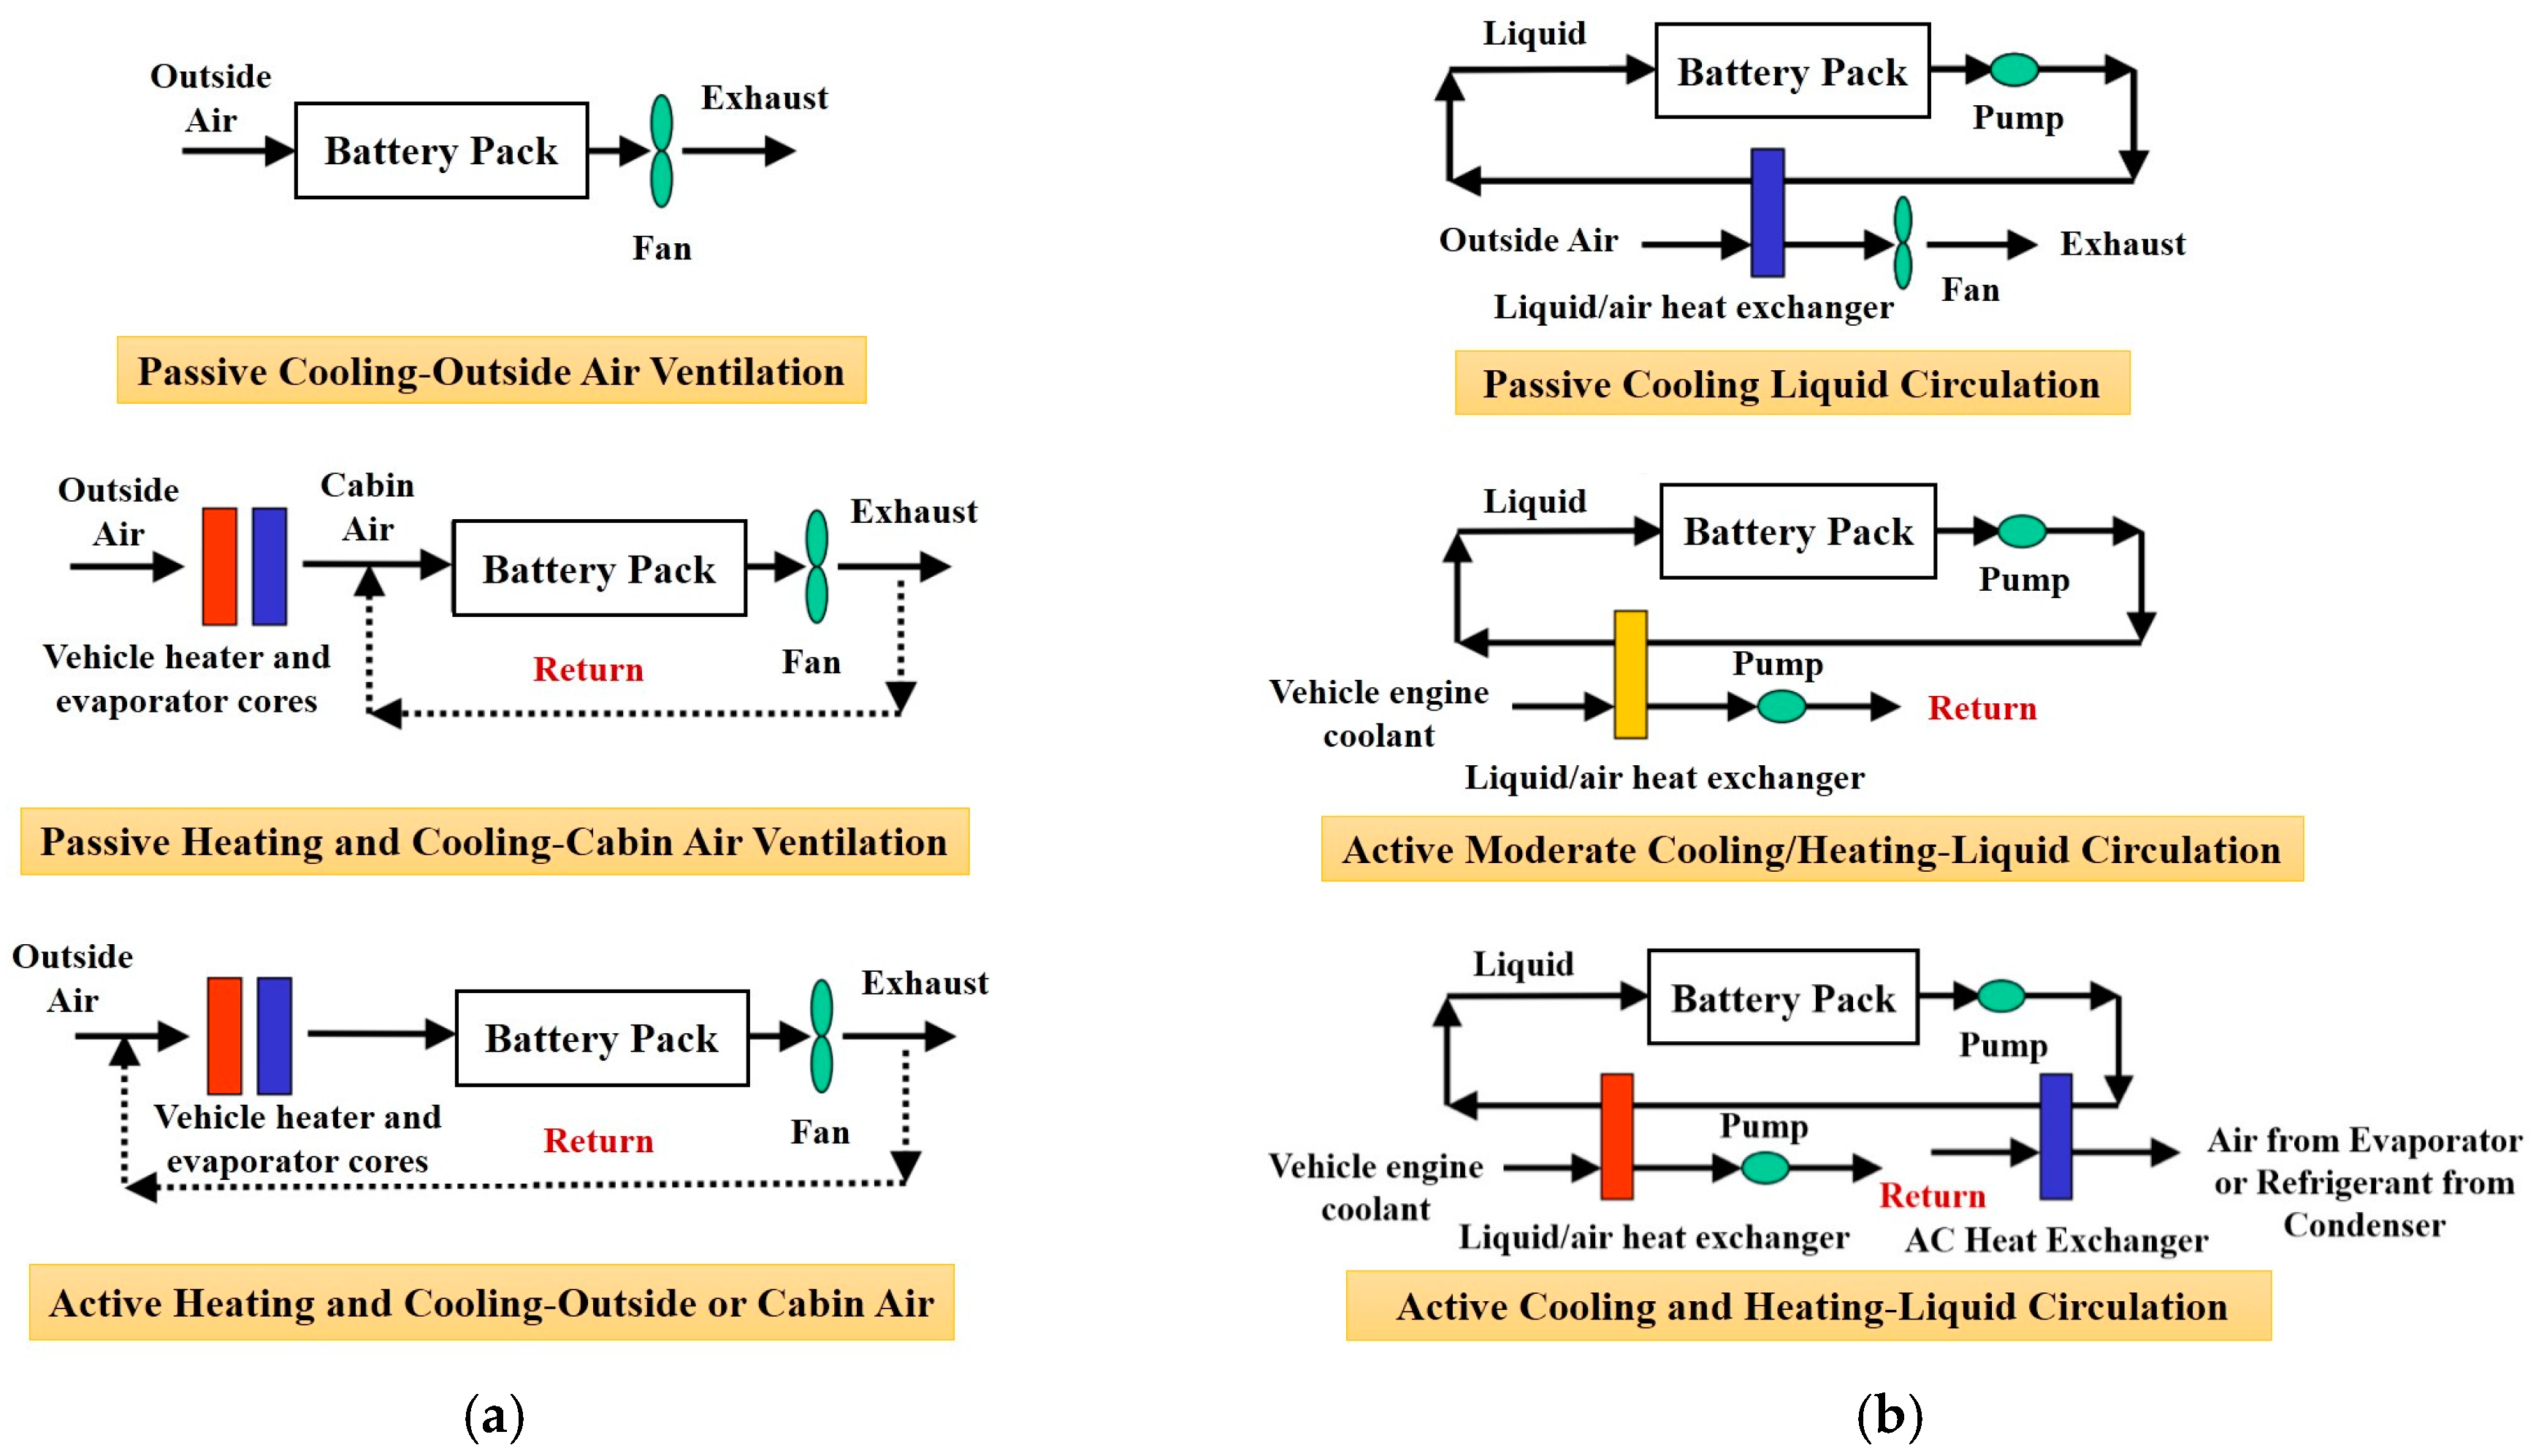
Figure 5.
The temperature and SOC curves of Vehicle 1.
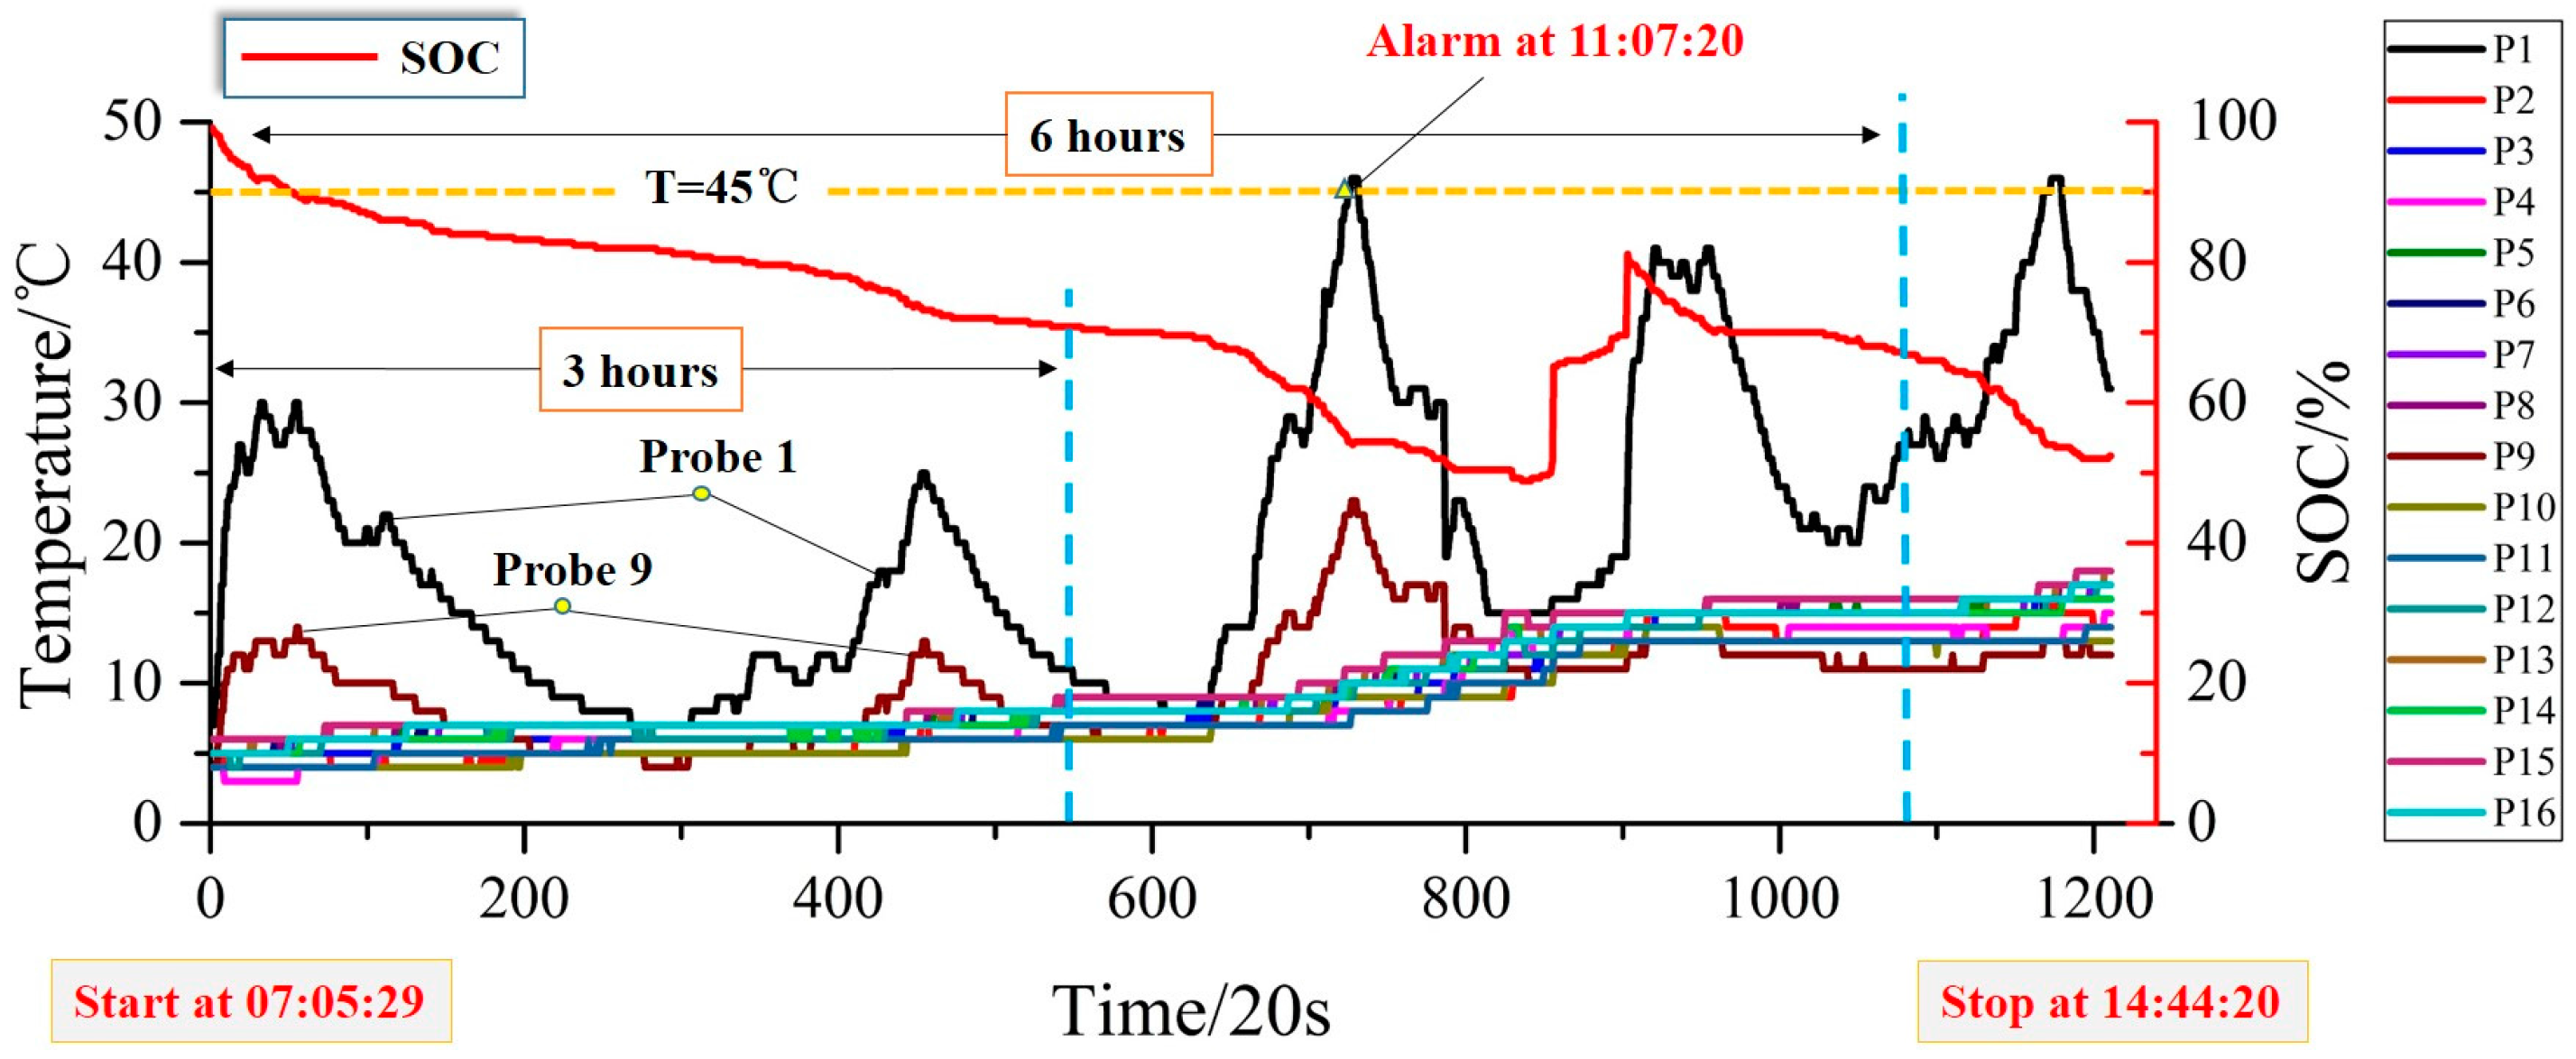
Figure 6.
The abnormal coefficient in the (a) first 6 h and (b) first 3 h of Vehicle 1.
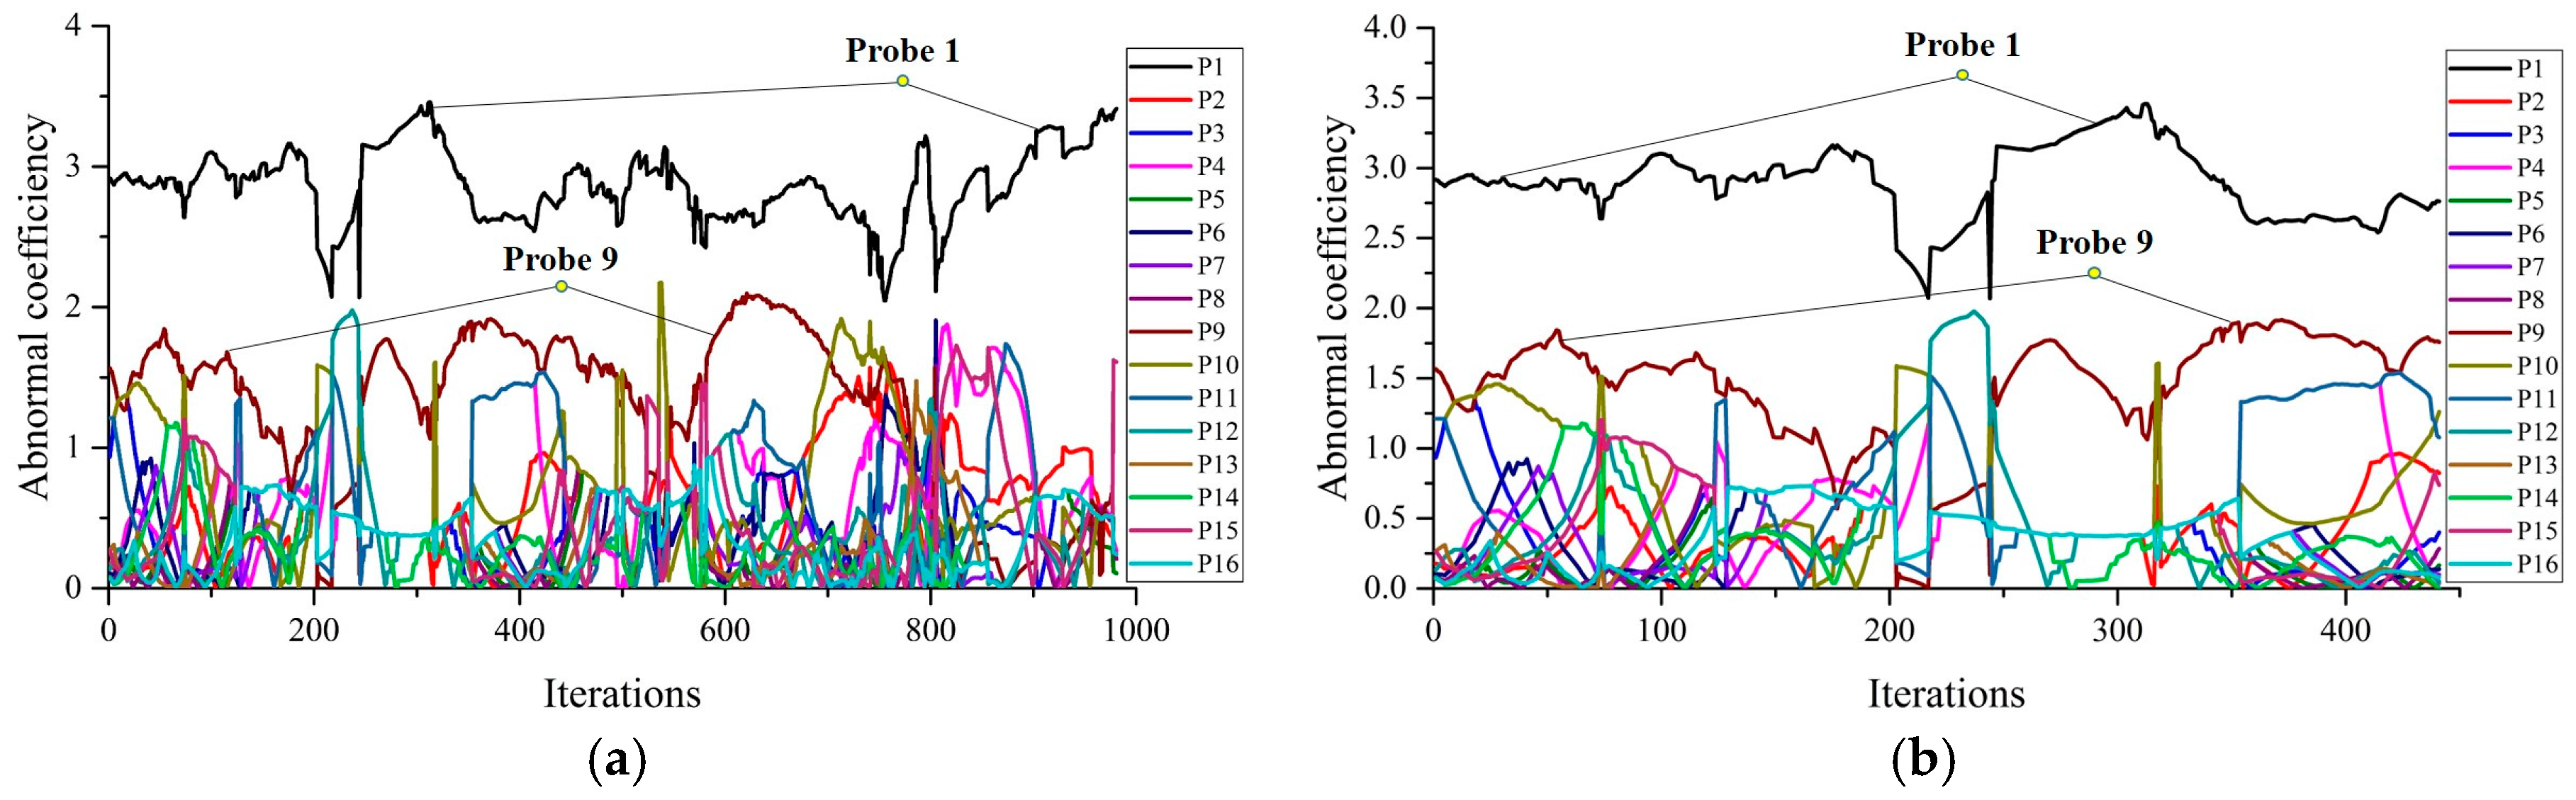
Figure 7.
The structure diagram of the boxplot.

Figure 8.
The abnormal coefficient boxplot of the (a) first 6 h and (b) the first 3 h of Vehicle 1.
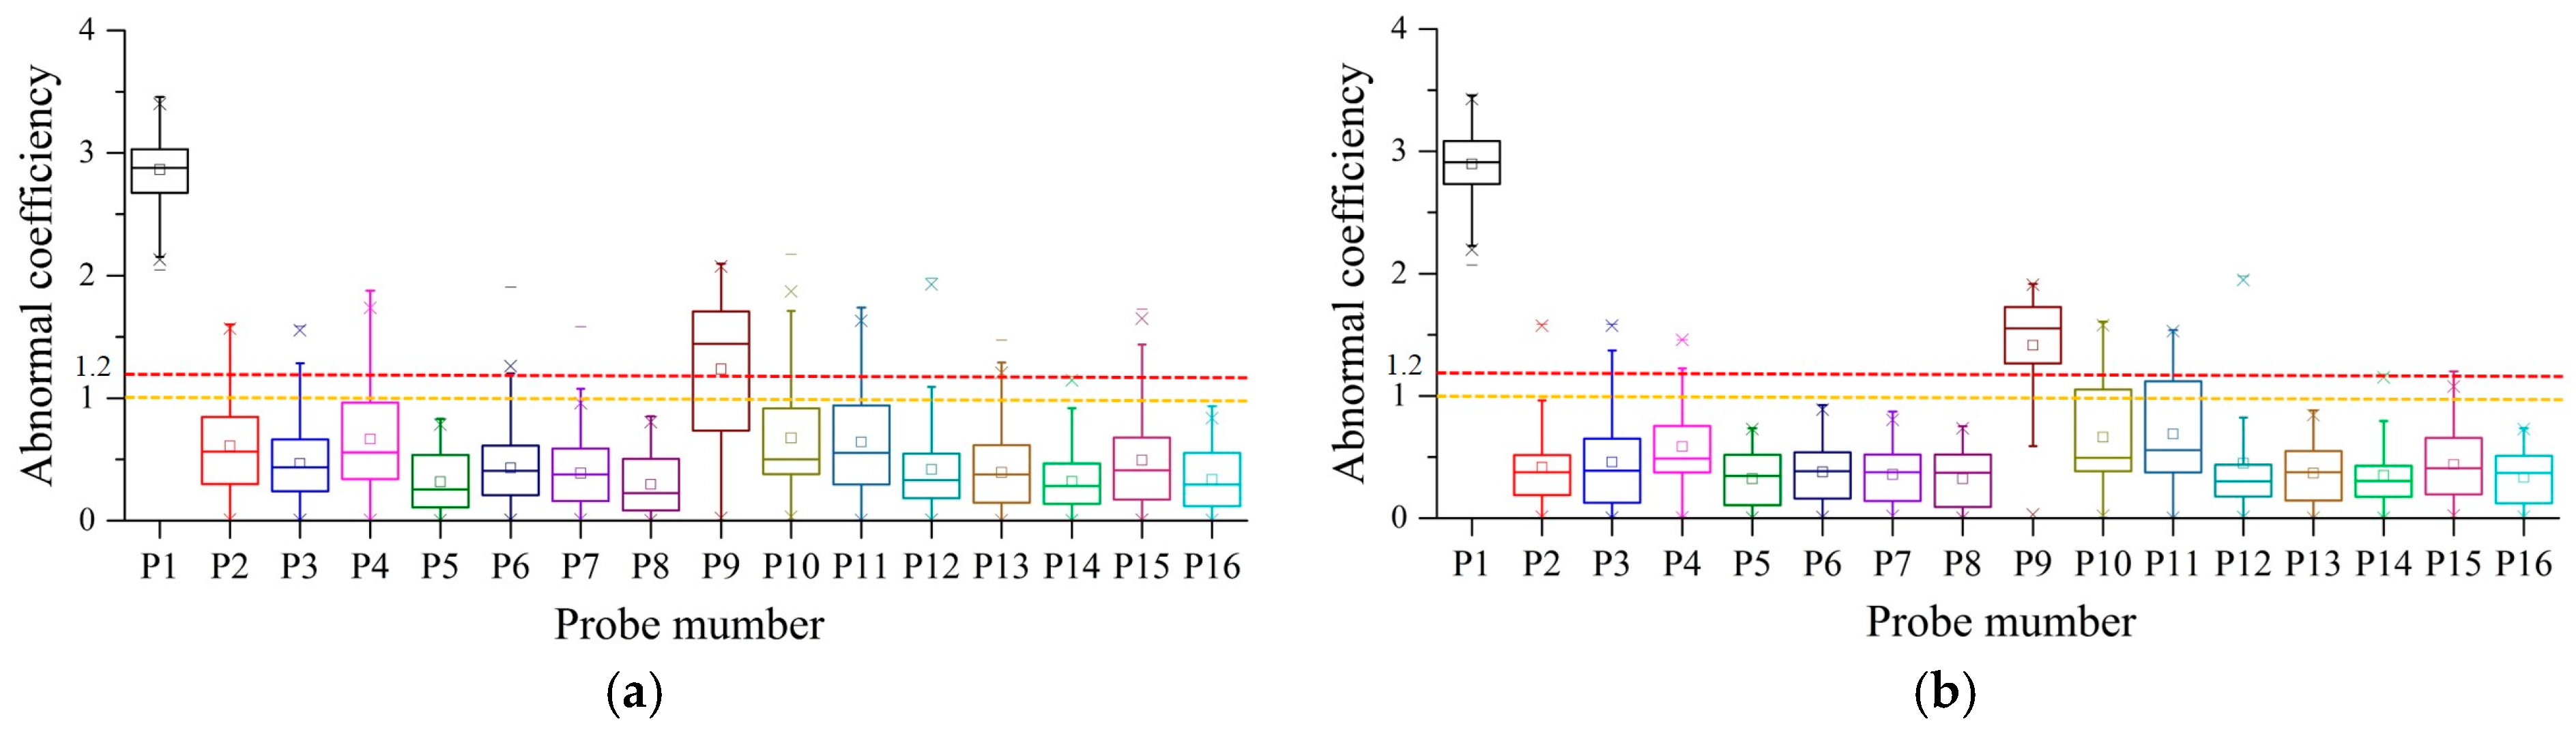
Figure 9.
The temperature curves of Vehicle 2.
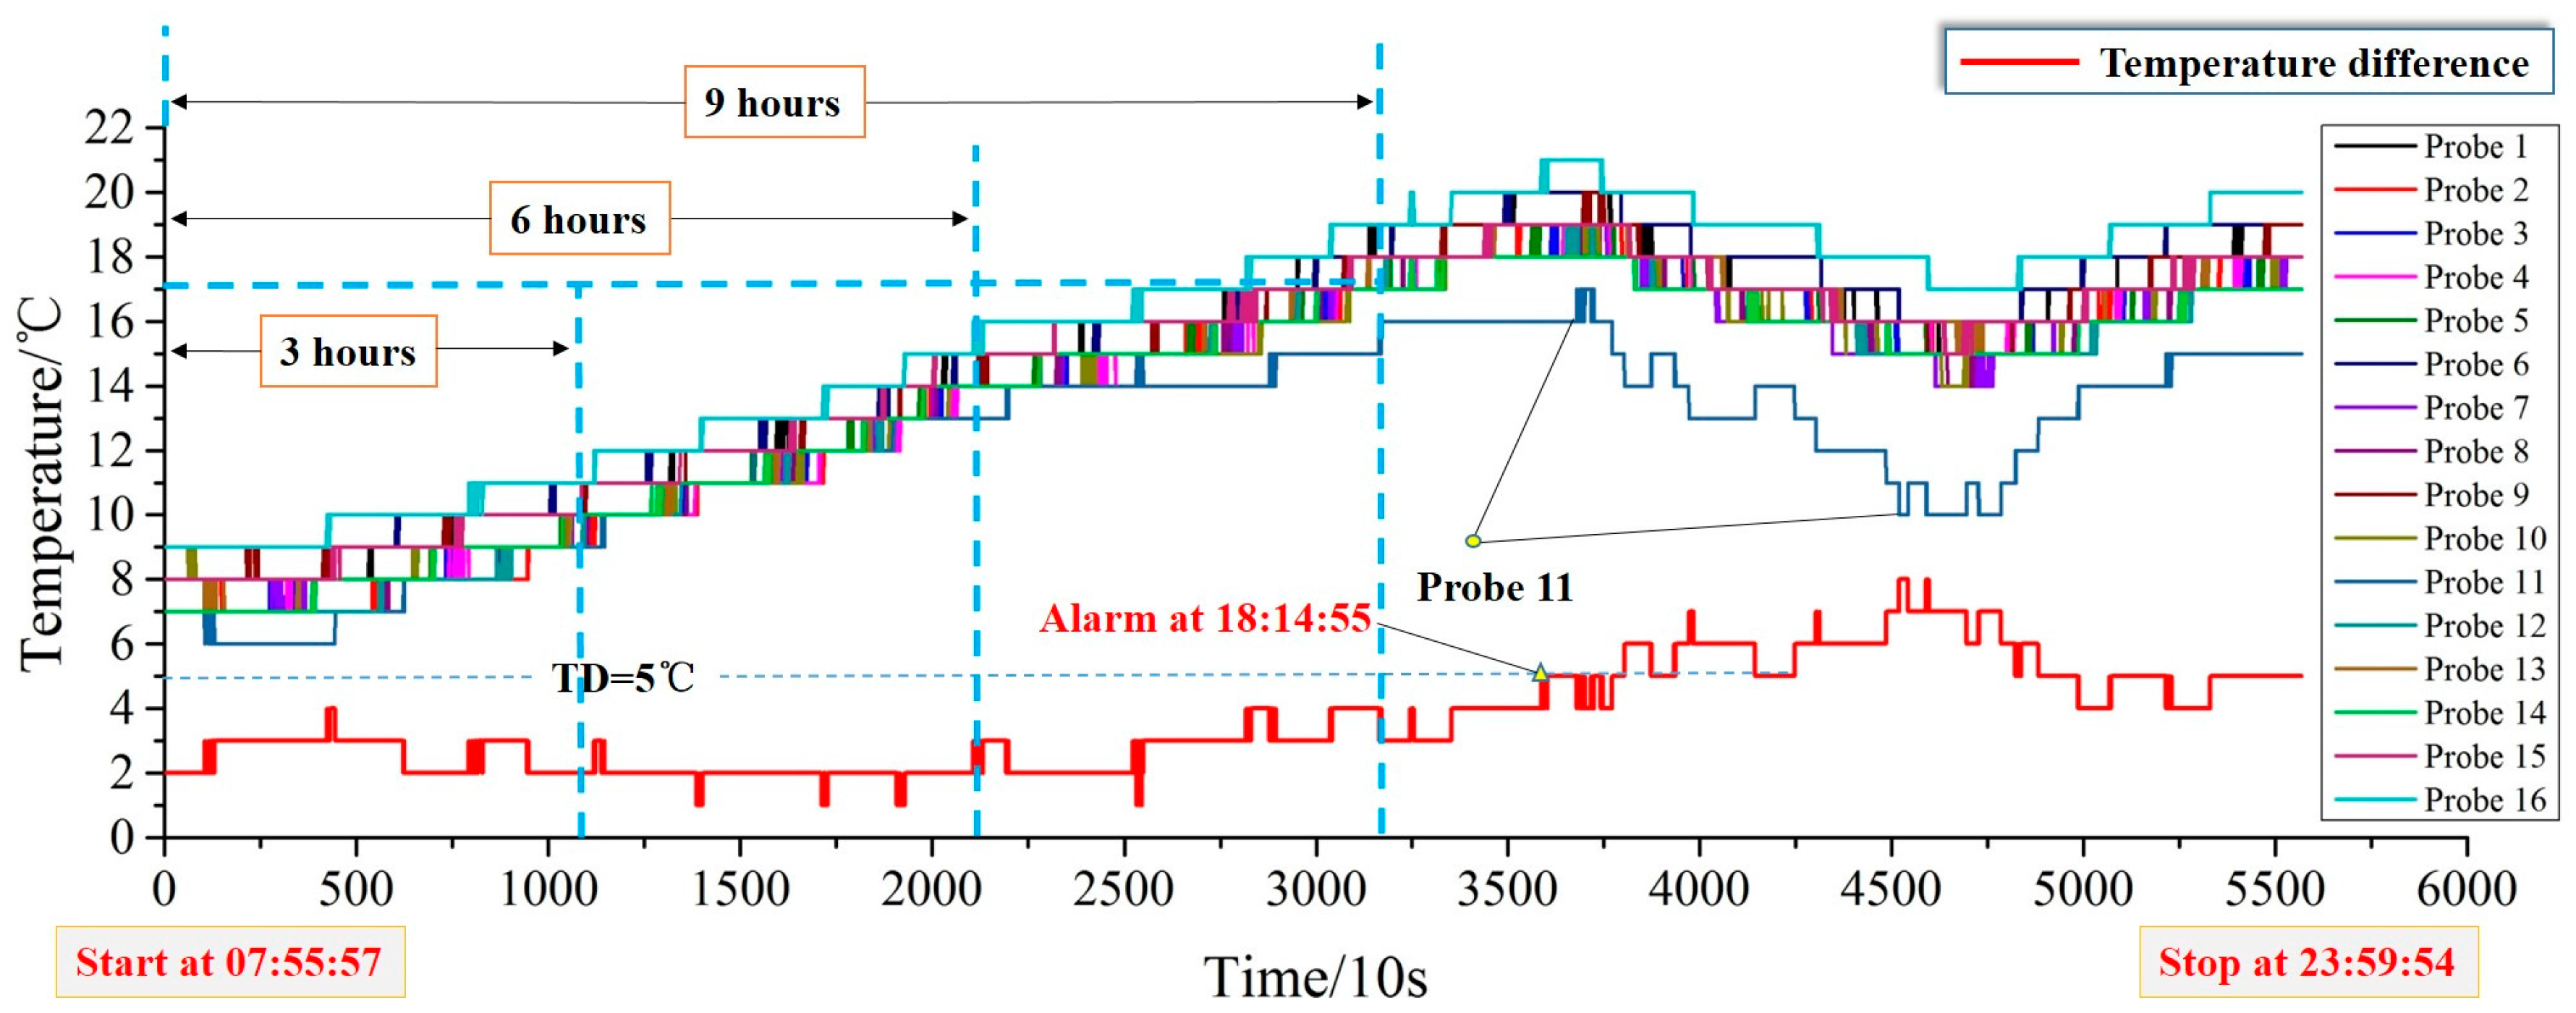
Figure 10.
SOC, speed and TD curves of Vehicle 2.

Figure 11.
The abnormal coefficient and boxplot at the first 3 h of Vehicle 2. (a) The abnormal coefficient curves; (b) Boxplot of the abnormal coefficient.
Figure 11.
The abnormal coefficient and boxplot at the first 3 h of Vehicle 2. (a) The abnormal coefficient curves; (b) Boxplot of the abnormal coefficient.

Figure 12.
The abnormal coefficient and boxplot at the first 6 h of Vehicle 2. (a) The abnormal coefficient curves; (b) Boxplot of the abnormal coefficient.
Figure 12.
The abnormal coefficient and boxplot at the first 6 h of Vehicle 2. (a) The abnormal coefficient curves; (b) Boxplot of the abnormal coefficient.

Figure 13.
The abnormal coefficient at the first 9 h of Vehicle 2. (a) The abnormal coefficient curves; (b) Boxplot of the abnormal coefficient.
Figure 13.
The abnormal coefficient at the first 9 h of Vehicle 2. (a) The abnormal coefficient curves; (b) Boxplot of the abnormal coefficient.
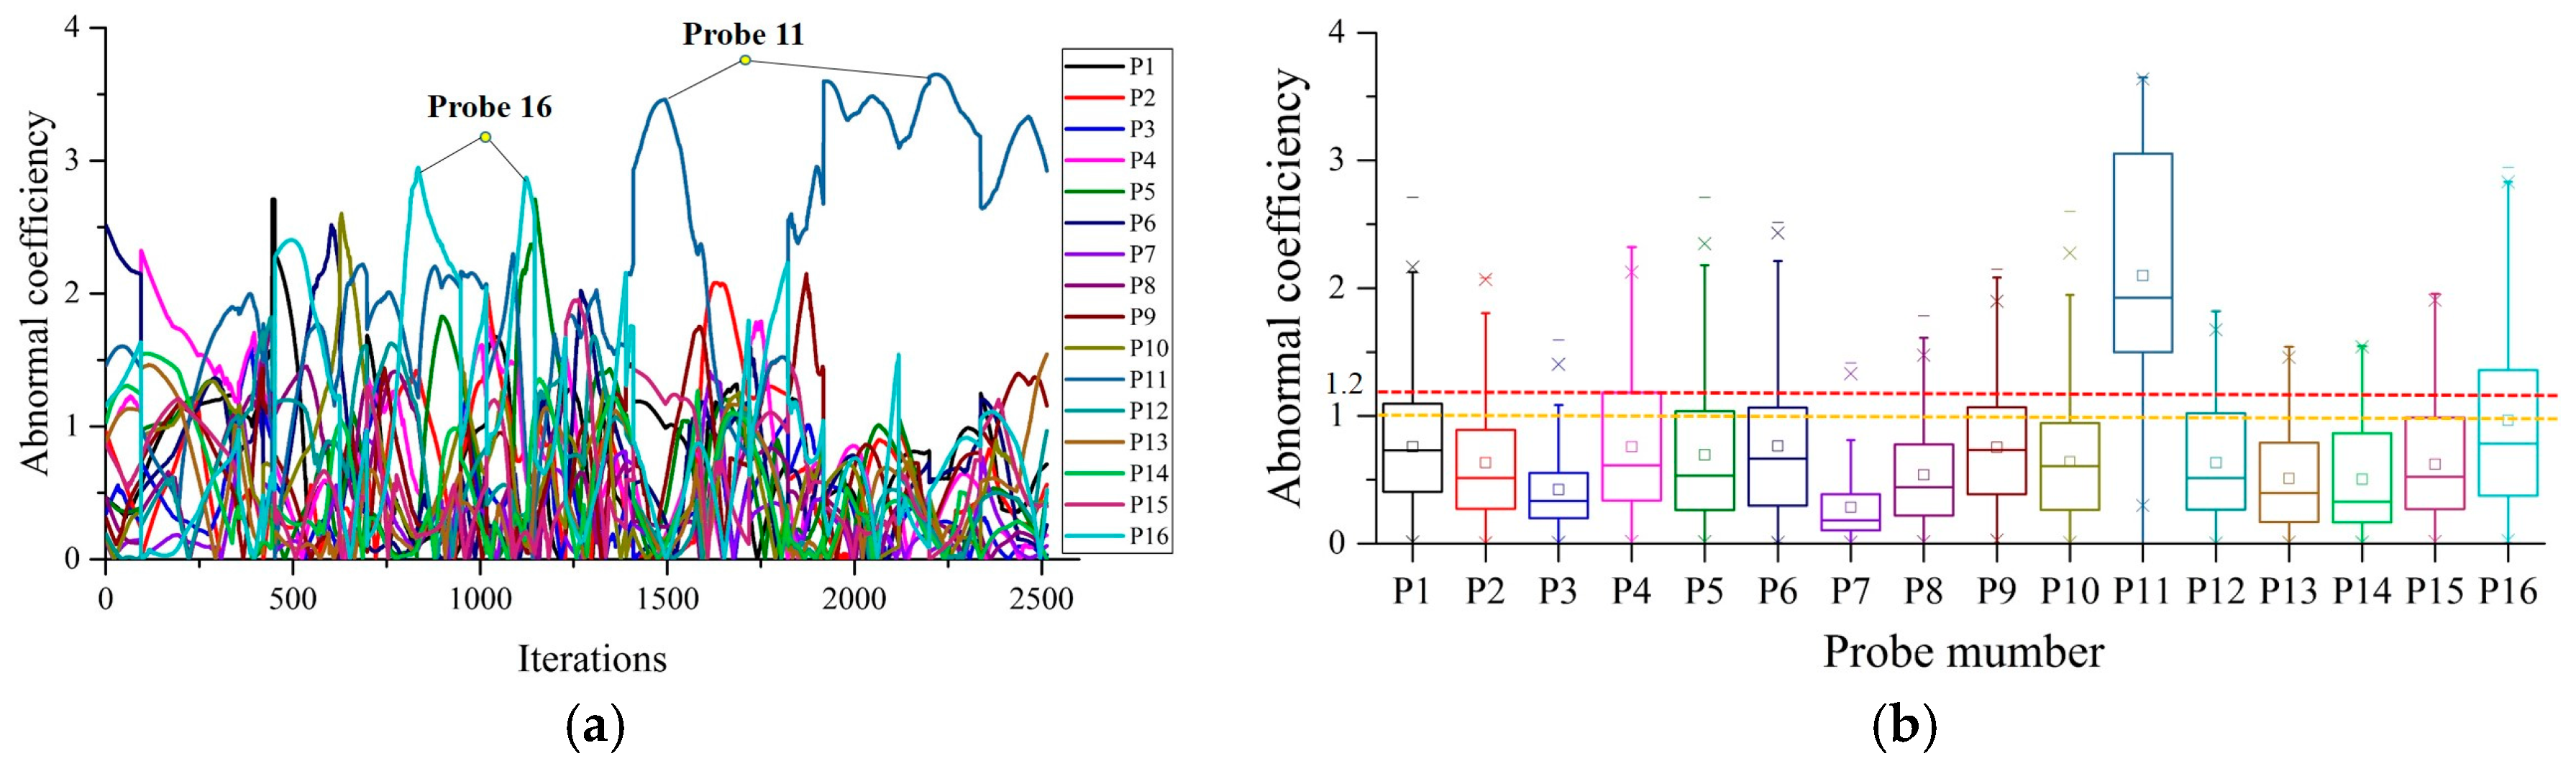
Figure 14.
The temperature curves of Vehicle 2.
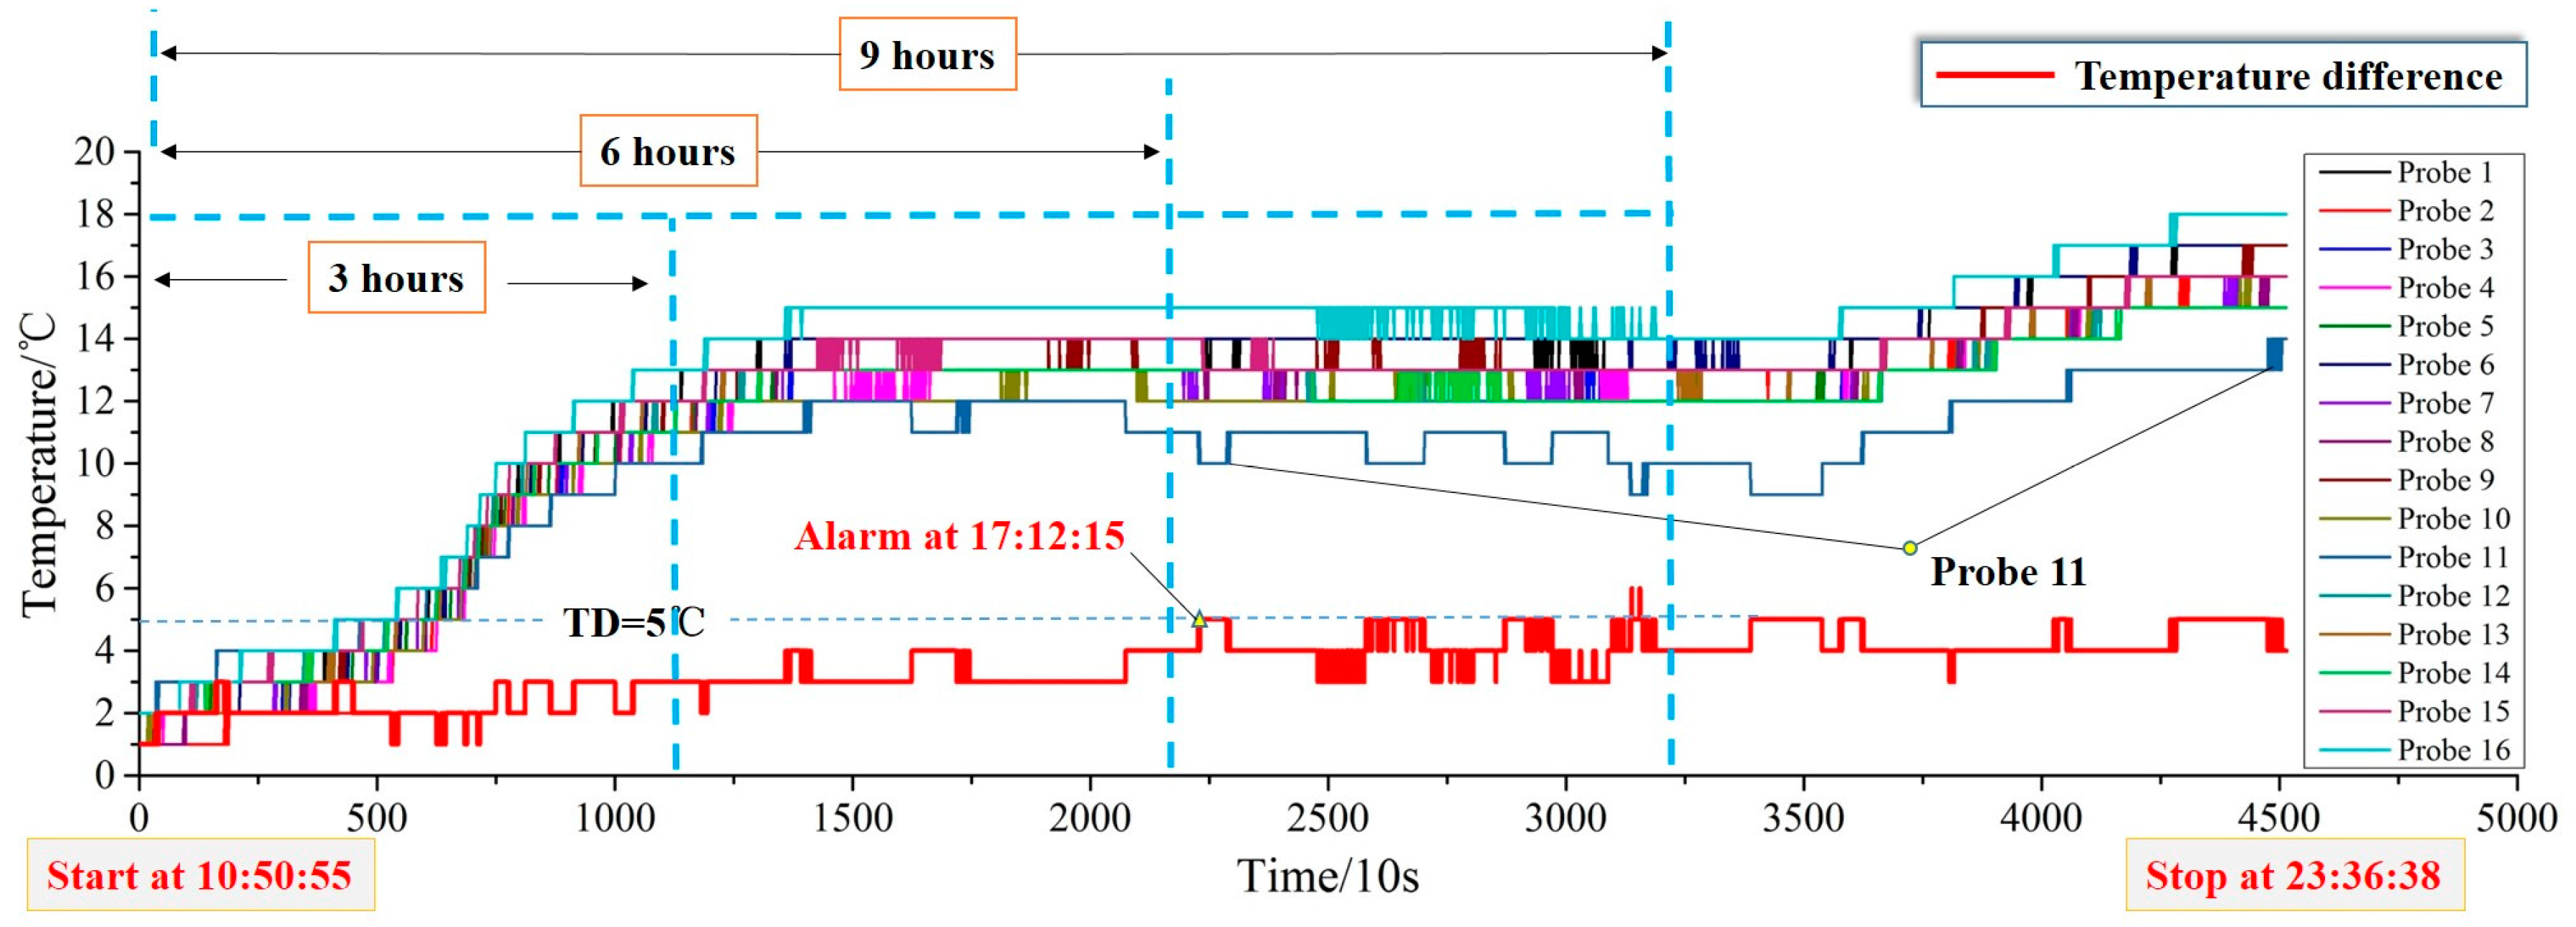
Figure 15.
The abnormal coefficient and boxplot at the first 3 h of Vehicle 2. (a) The abnormal coefficient curves; (b) Boxplot of the abnormal coefficient.
Figure 15.
The abnormal coefficient and boxplot at the first 3 h of Vehicle 2. (a) The abnormal coefficient curves; (b) Boxplot of the abnormal coefficient.

Figure 16.
The prognosis strategy flowchart of a thermal fault.

Table 1.
The main monitoring objects and purposes of NSMC-EV.
| Order Number | Monitoring Object | Monitoring Purpose |
|---|---|---|
| 1 | Battery voltage | To confirm whether there is a value beyond the range. |
| 2 | Cell voltage | The low voltage will lead to insufficient capacity, and the high voltage will cause high temperature, gas precipitation, water losses, and grid corrosion of the battery. |
| 3 | Battery temperature | To identify potential problems and optimize the vehicle operation and cycle life of the battery. Once beyond the maximum value means that there is a potential thermal runaway and it requires human intervention. |
| 4 | Ambient temperature | Too high an ambient temperature will shorten battery life and too low an ambient temperature will lead to battery capacity decline. |
| 5 | Temperature difference | Large temperature difference is because of the inconsistency of the battery, which will cause endurance deterioration. |
| 6 | Charge and discharge current | Provide the health state information of the battery to users, which can be used to indicate the operating state and the integrity of the battery connection. |
© 2017 by the authors. Licensee MDPI, Basel, Switzerland. This article is an open access article distributed under the terms and conditions of the Creative Commons Attribution (CC BY) license (http://creativecommons.org/licenses/by/4.0/).
Share and Cite
MDPI and ACS Style
Hong, J.; Wang, Z.; Liu, P. Big-Data-Based Thermal Runaway Prognosis of Battery Systems for Electric Vehicles. Energies 2017, 10, 919. https://doi.org/10.3390/en10070919
AMA Style
Hong J, Wang Z, Liu P. Big-Data-Based Thermal Runaway Prognosis of Battery Systems for Electric Vehicles. Energies. 2017; 10(7):919. https://doi.org/10.3390/en10070919
Chicago/Turabian StyleHong, Jichao, Zhenpo Wang, and Peng Liu. 2017. "Big-Data-Based Thermal Runaway Prognosis of Battery Systems for Electric Vehicles" Energies 10, no. 7: 919. https://doi.org/10.3390/en10070919
Note that from the first issue of 2016, this journal uses article numbers instead of page numbers. See further details here.