Linking the Power and Transport Sectors—Part 1: The Principle of Sector Coupling

 , , ,
, , , 
Abstract
:1. Introduction
- (1)
- Continuing the use of fossil fuels in conjunction with the capture and storage of carbon dioxide.
- (2)
- The usage of nuclear power.
- (3)
- The usage of renewable energy sources (RESs).
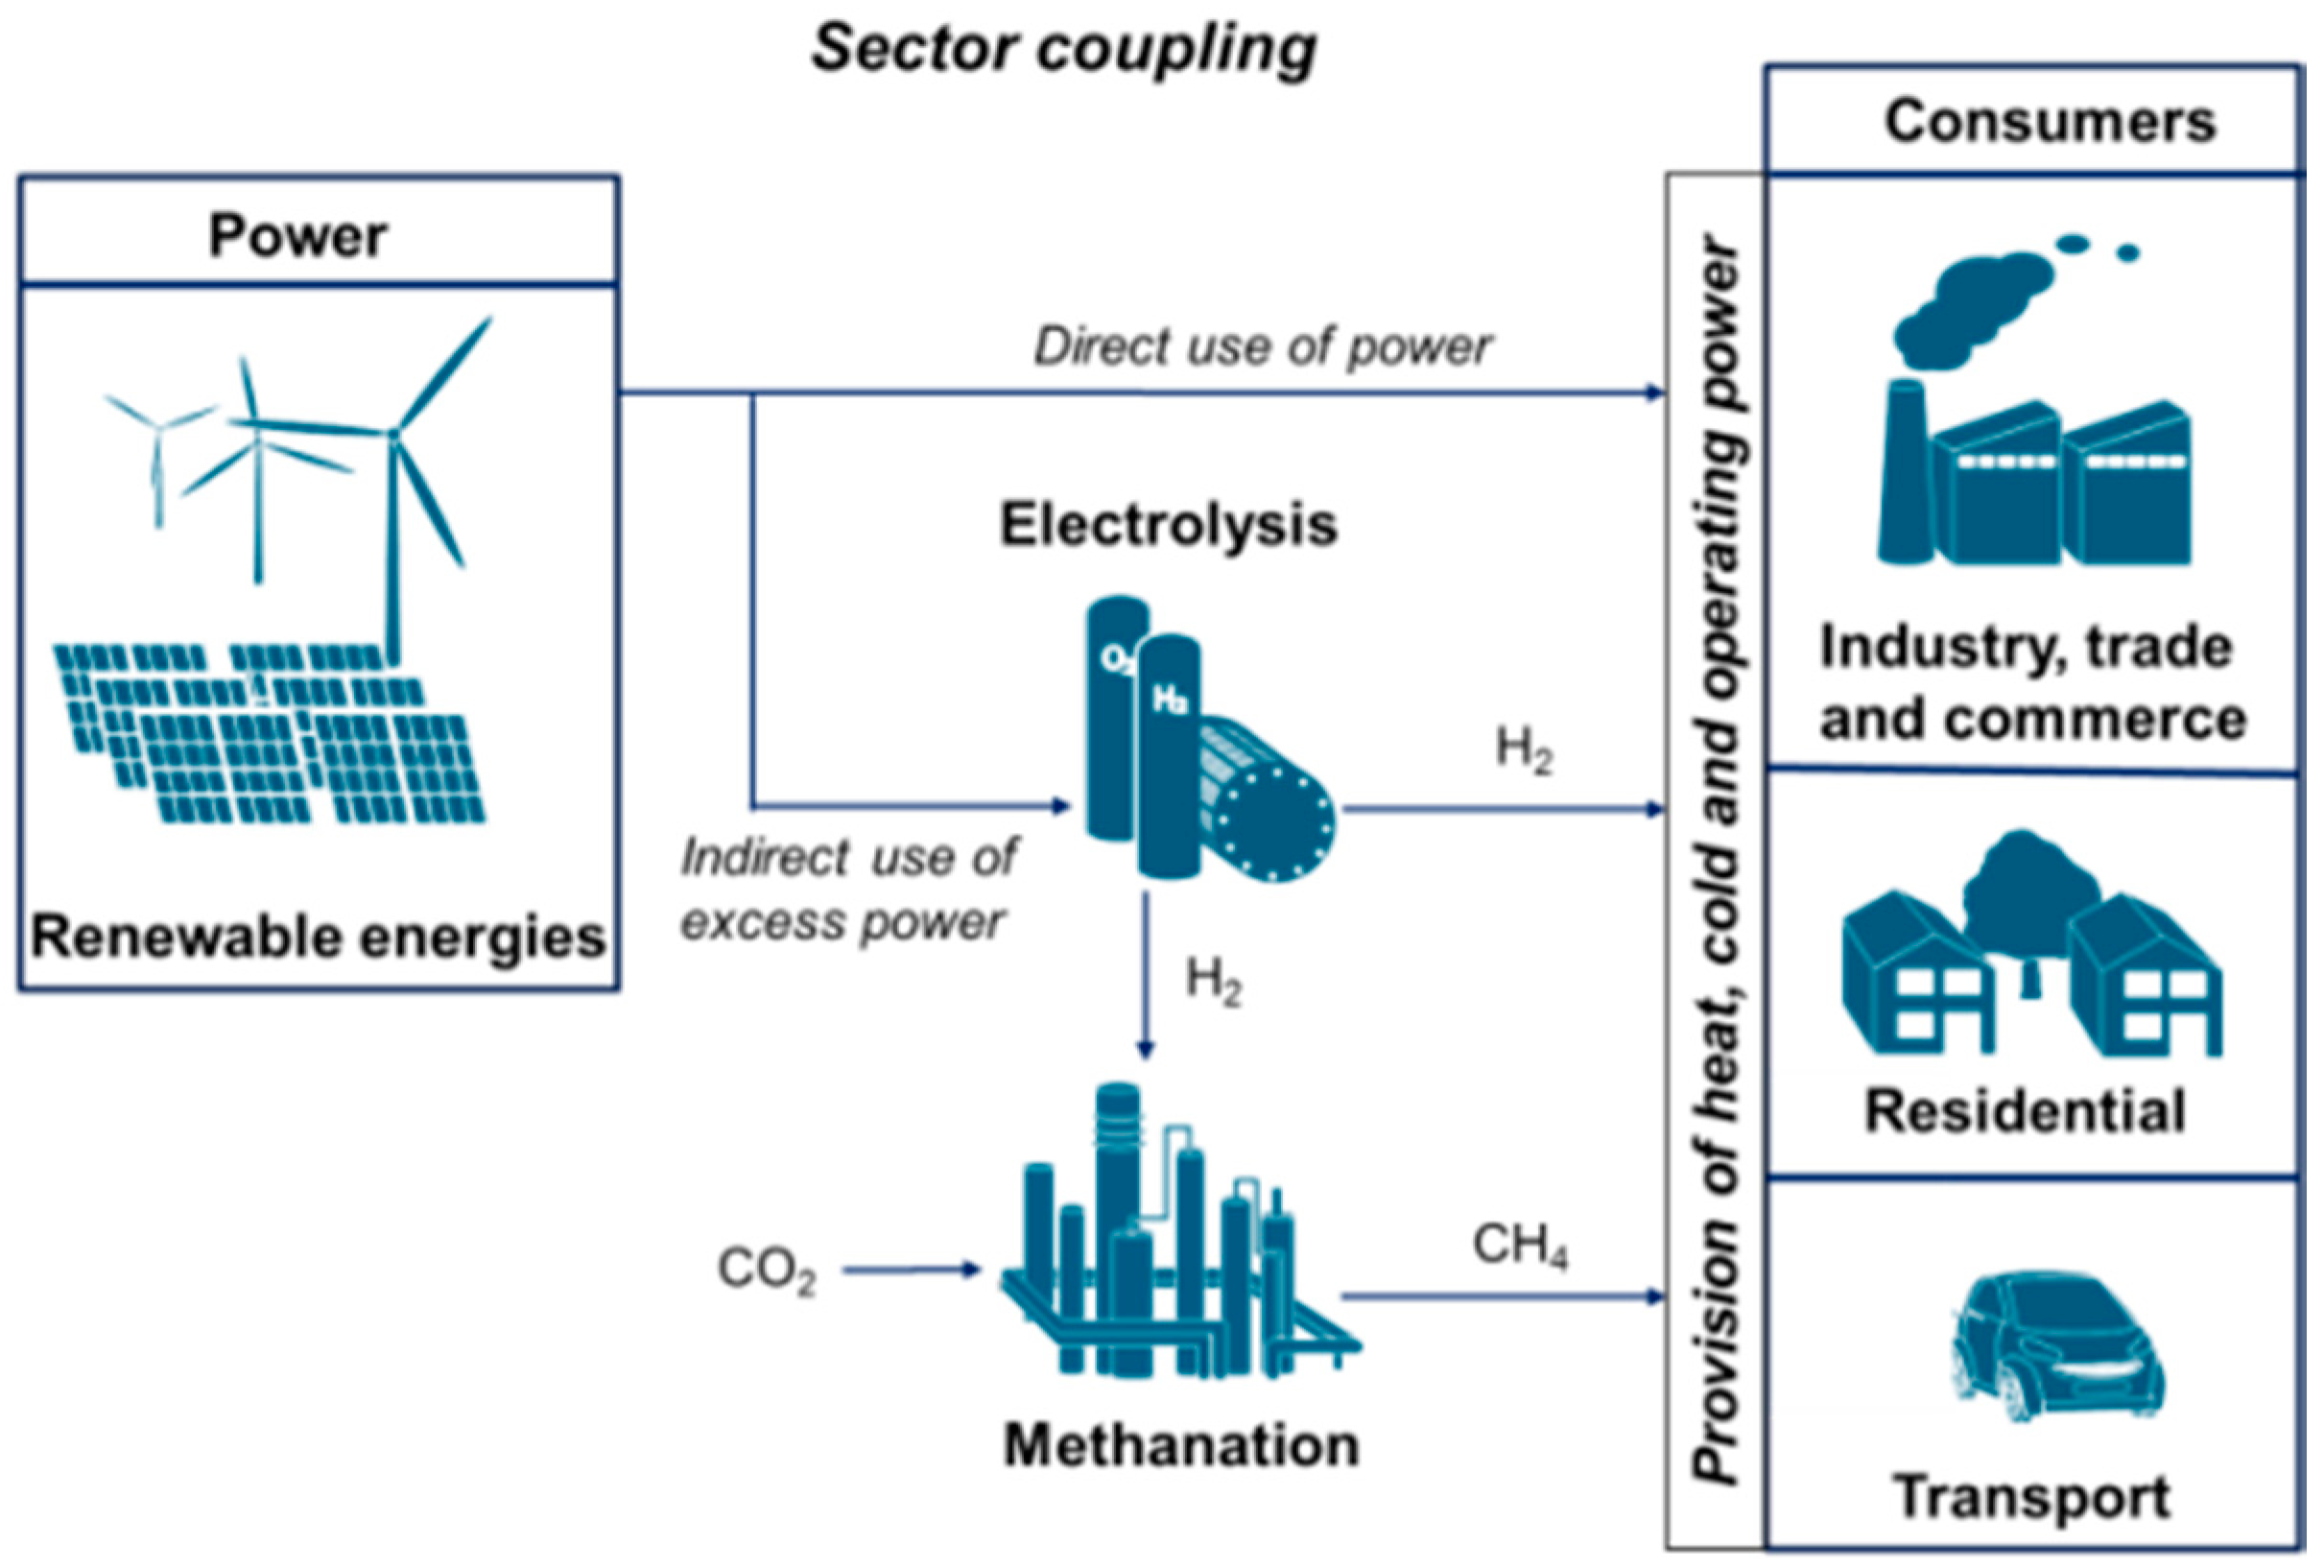
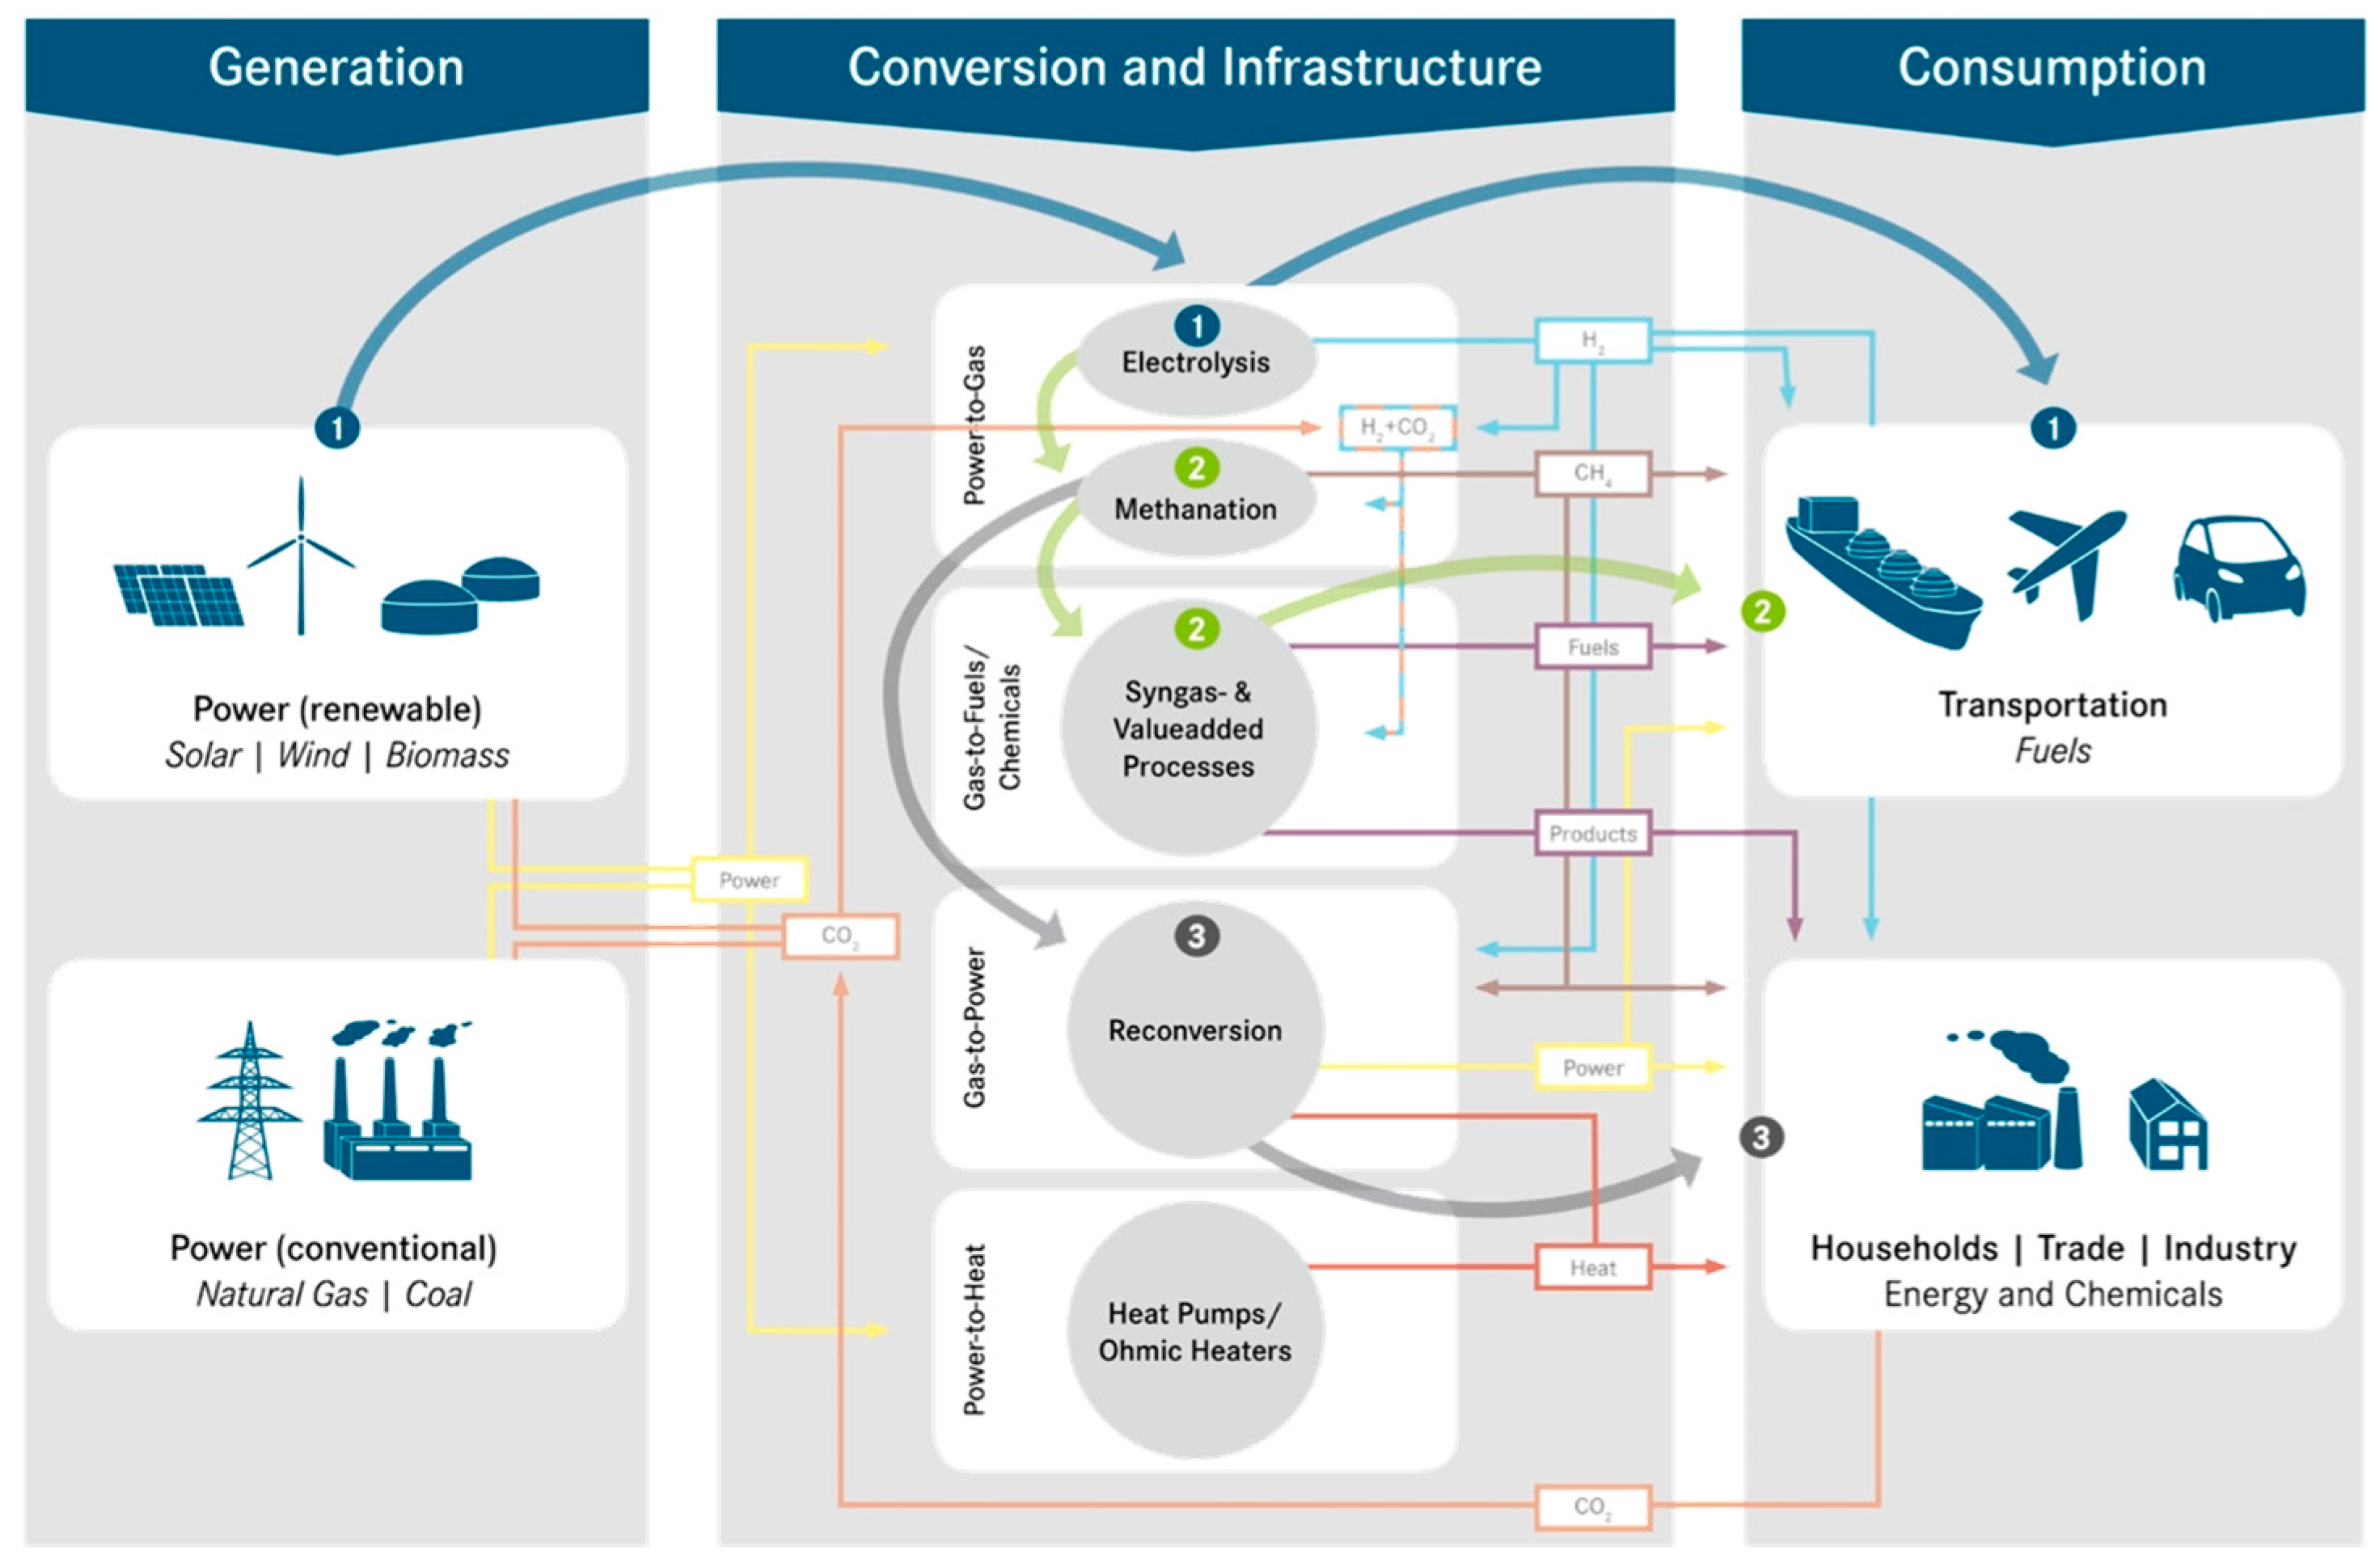
2. The Principle of Sector Coupling
- Industry, trade and commerce
- Residential/household
- Transport
3. Potential Pathways for Sector Coupling in the Transport Sector
3.1. Electric Mobility with Battery Electric Vehicles and Fuel Cell Vehicles
3.2. Power-to-Fuel
3.3. Power-to-Gas
4. Sector Coupling—Literature Review
4.1. Approaches to Sector Coupling
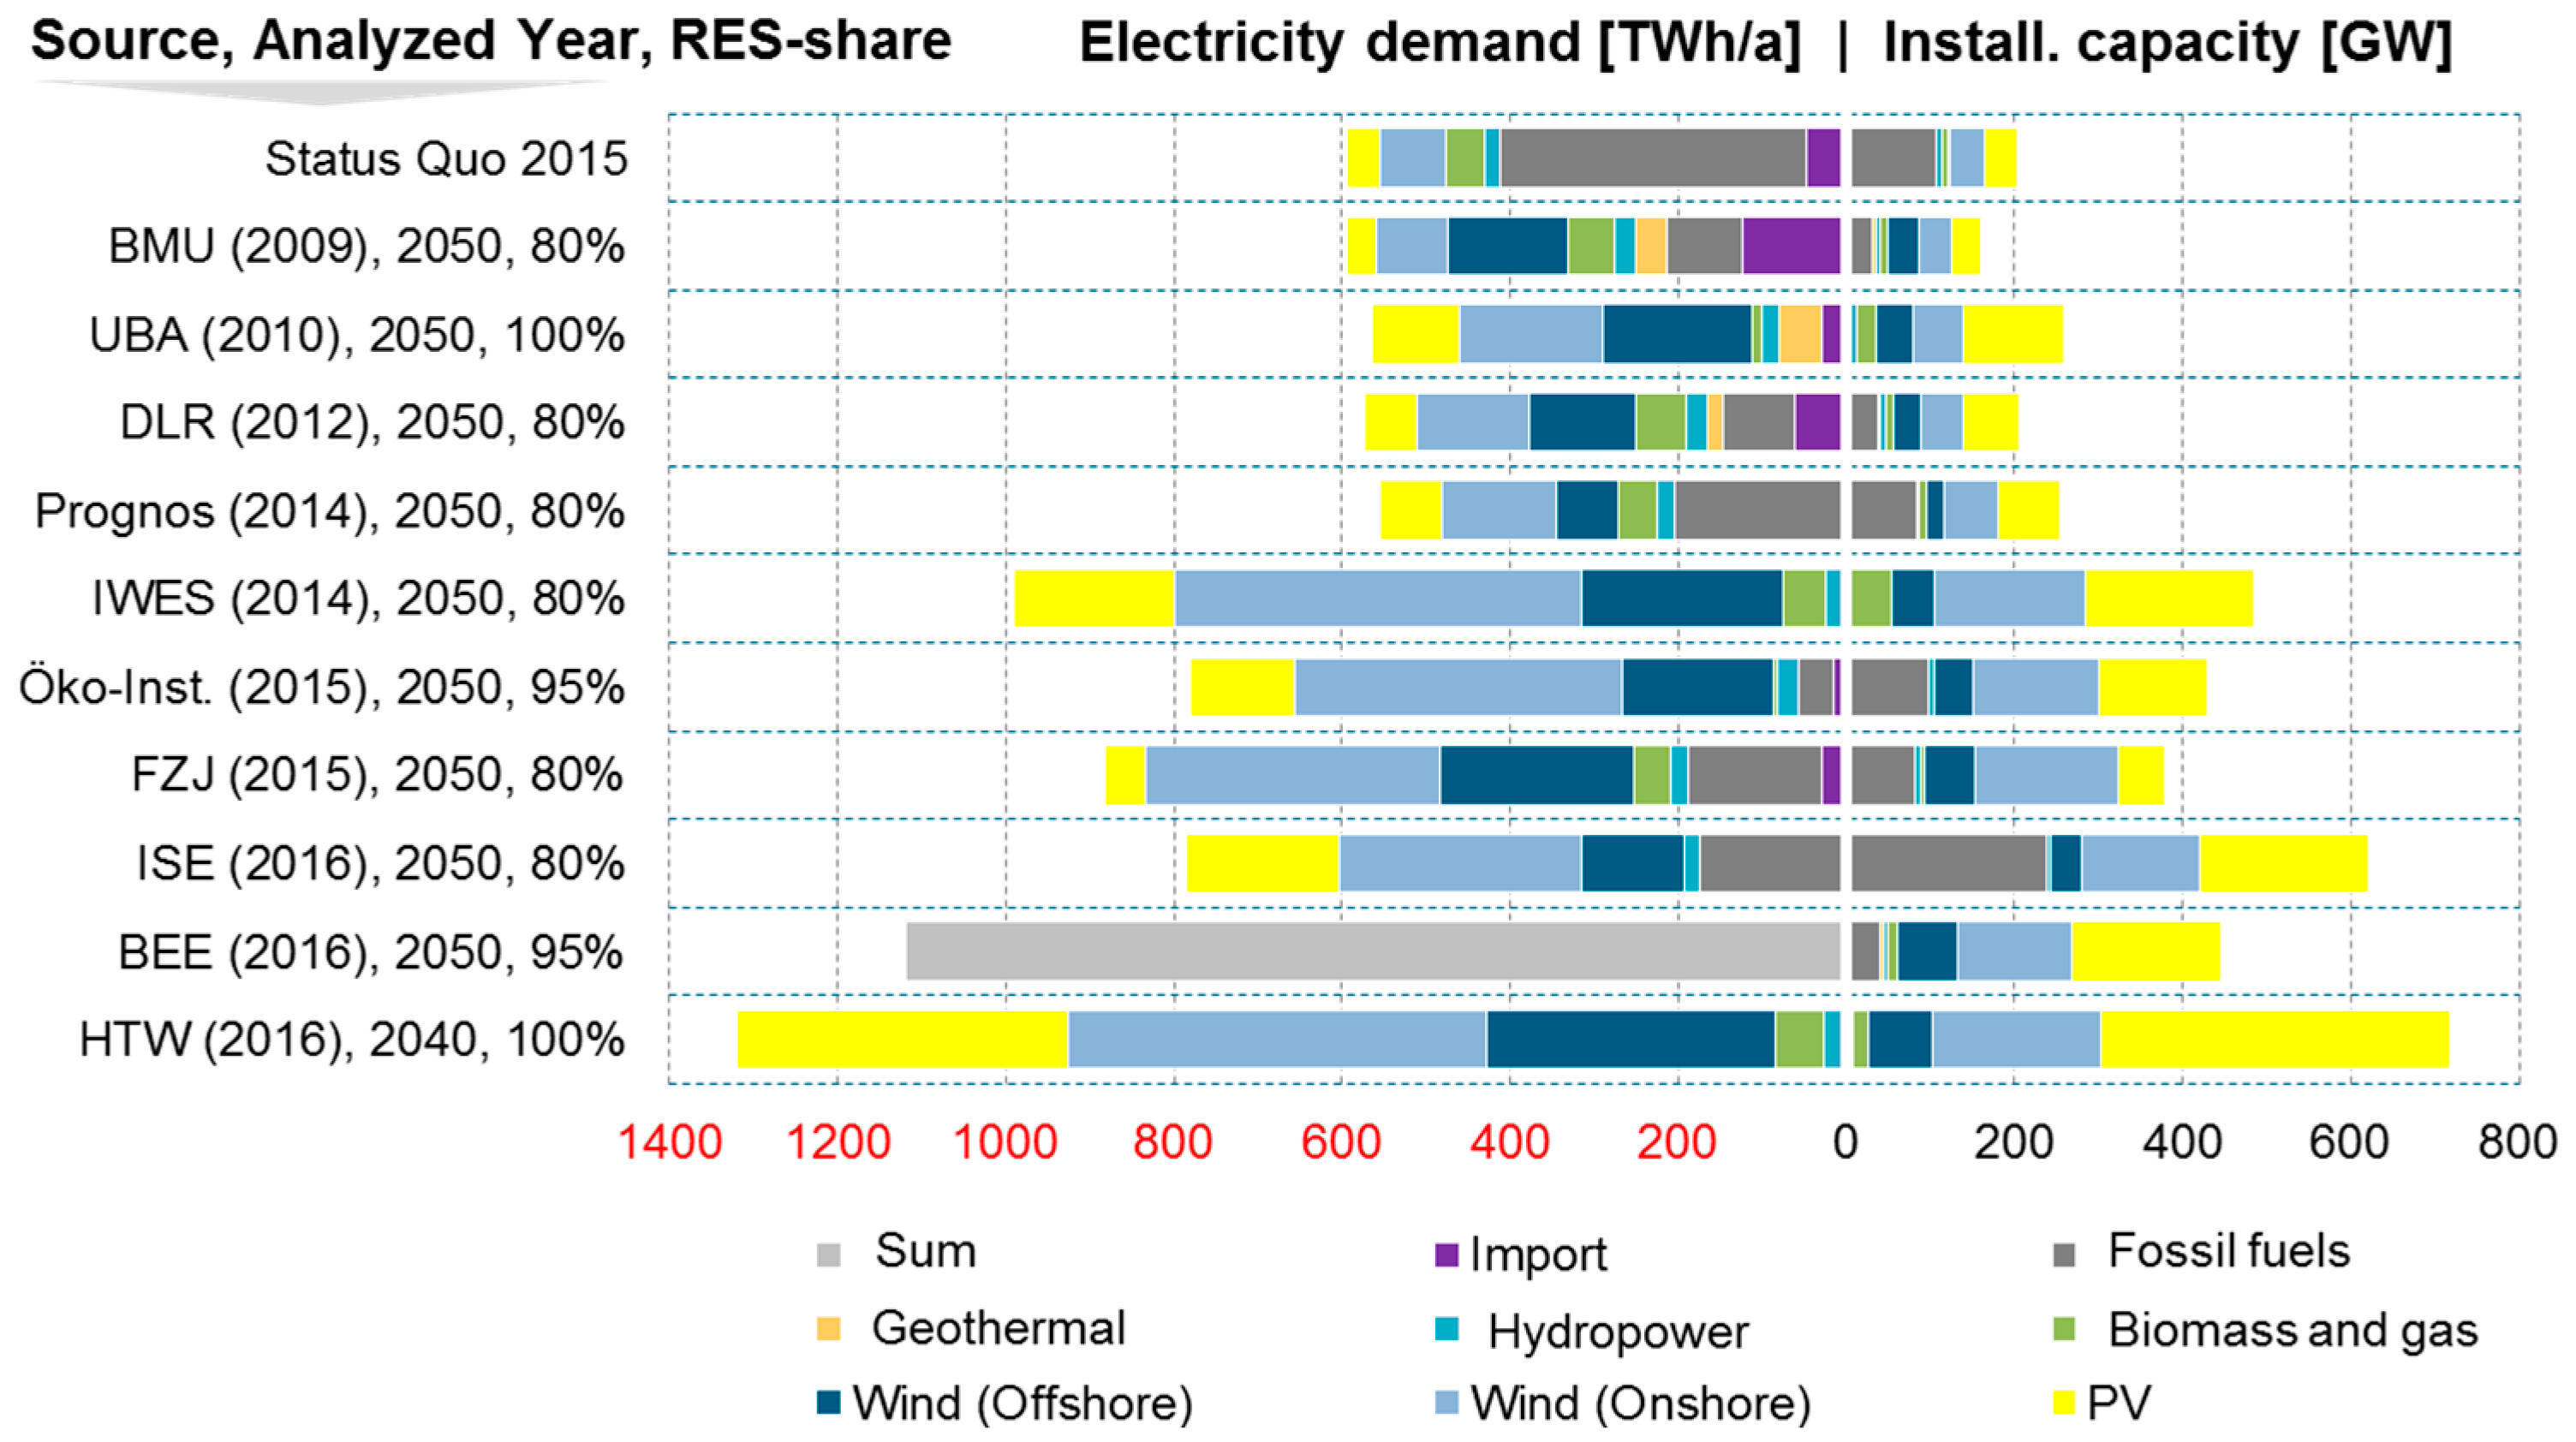
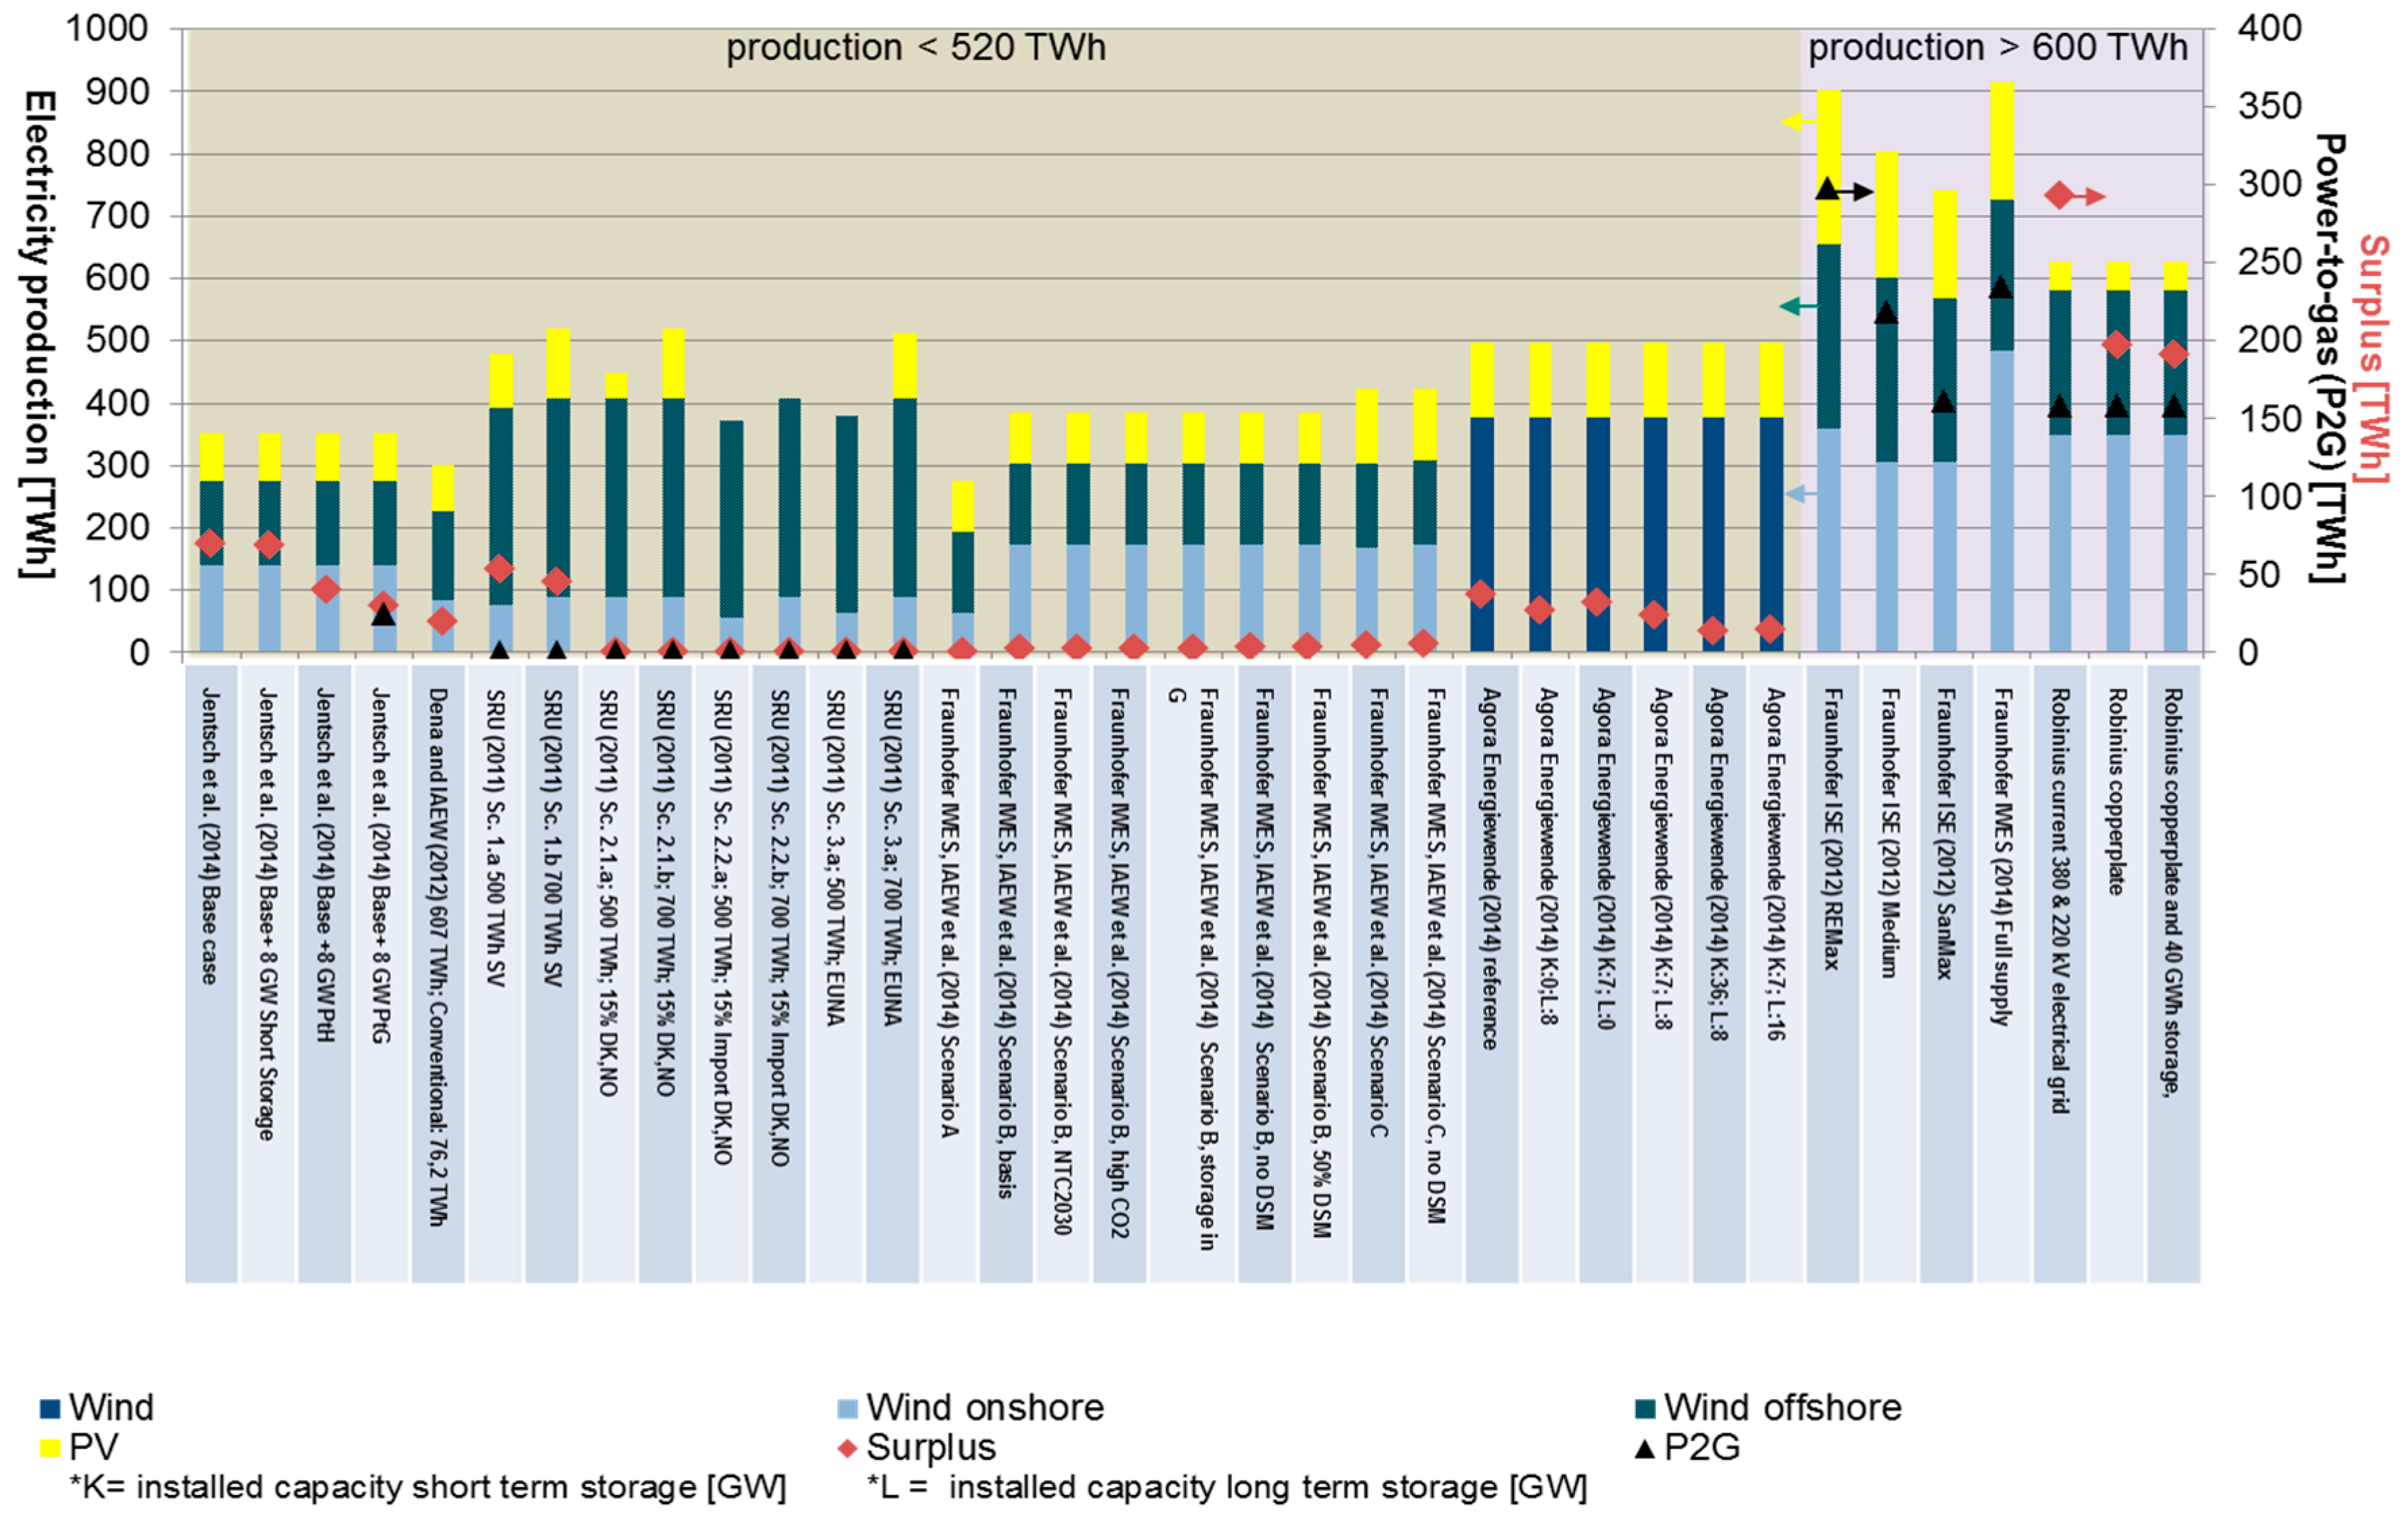
4.2. Studies on Germany
5. Status of the Power and Transport Sectors
5.1. Worldwide
5.2. European Union
5.3. Germany
6. Summary and Conclusions
Acknowledgments
Author Contributions
Conflicts of Interest
References
- International Energy Agency (IEA). Energy and Climate Change; World Energy Outlook Special Report; IEA: Paris, France, 2015. [Google Scholar]
- Schellnhuber, H.J.; Rahmstorf, S.; Winkelmann, R. COMMENTARY: Why the right climate target was agreed in Paris. Nat. Clim. Chang. 2016, 6, 649–653. [Google Scholar] [CrossRef]
- Roberts, D. A global roadmap for climate change action: From COP17 in Durban to COP21 in Paris. S. Afr. J. Sci. 2016, 112, 9–11. [Google Scholar] [CrossRef]
- Pfeiffer, A.; Millar, R.; Hepburn, C.; Beinhocker, E. The ‘2 °C capital stock’ for electricity generation: Committed cumulative carbon emissions from the electricity generation sector and the transition to a green economy. Appl. Energy 2016, 179, 1395–1480. [Google Scholar] [CrossRef]
- Bundesministerium für Wirtschaft und Energie. Was Bedeutet “Sektorkopplung”? 2016. Available online: http://www.bmwi-energiewende.de/EWD/Redaktion/Newsletter/2016/14/Meldung/direkt-erklaert.html (accessed on 16 June 2017). (In German).
- DVGW. Sektorenkopplung—Unverzichtbar für eine zügige Energiewende. 2017. Available online: https://www.dvgw.de/themen/gas-und-energiewende/sektorenkopplung/ (accessed on 16 June 2017).
- BDEW. Positionspapier—10 Thesen zur Sektorkopplung. 2017. Available online: https://www.bdew.de/internet.nsf/id/3cc78be7f576bf4ec1258110004b1212/$file/bdew%20positionspapier_10%20thesen%20zur%20sektorkopplung_o%20a.pdf (accessed on 12 June 2017). (In German).
- Armaroli, N.; Balzani, V. Towards an electricity-powered world. Energy Environ. Sci. 2011, 4, 3193–3222. [Google Scholar] [CrossRef]
- Eberle, D.U.; von Helmolt, D.R. Sustainable transportation based on electric vehicle concepts: A brief overview. Energy Environ. Sci. 2010, 3, 689–699. [Google Scholar] [CrossRef]
- Bundesnetzagentur. Szenariorahmen 2011. Genehmigung; Bundesnetzagentur: Bonn, Germany, 2011. (In German) [Google Scholar]
- Nissan. Nissan Leaf—Zero Emission. 2011. Available online: https://www.nissan.de/fahrzeuge/neuwagen/leaf.html (accessed on 25 October 2016).
- Peugeot. Peugeot iOn—100% ELEKTRISCH. 2013. Available online: http://media.peugeot.de/file/41/8/katalog-ion-2013-07.37418.pdf#_ga=1.120718157.412744831.1480946278 (accessed on 25 October 2016). (In German).
- 50 Hertz, Amprion, Tennet, and Transnet BW. Bericht Der Deutschen Übertragungsbetreiber zur Leistungsbilanz 2013 Nach EnWG § 12 Abs. 4 und 5; Übertragungsnetzbetreiber: Bonn, Germany, 2013. Available online: https://www.bmwi.de/Redaktion/DE/Publikationen/Energie/leistungsbilanbericht-2013.pdf?__blob=publicationFile&v=3 (accessed on 15 March 2015). (In German).
- Renault S.A.S. Renault ZOE—100% ELEKTRISCH—0% EMISSIONEN. 2014. Available online: www.dieschneidergruppe.de/wp-content/uploads/2015/07/Broschuere_Zoe.pdf (accessed on 25 October 2016). (In German).
- Citroën Deutschland GmbH. C-ZERO—LE CARACTÈRE. Available online: www.autohaus-kelch.de/Download/Info_C-Zero.pdf (accessed on 25 October 2016). (In German).
- Ford Werke GmbH: Köln. Ford Focus Electric. 2015. Available online: http://www.ford.de/cs/BlobServer?blobtable=MungoBlobs&blobcol=urldata&blobheadervalue1=attachment%3Bfilename%3D%22Ford+Focus+Electric+-+Broschuere.PDF%22&blobheadervalue2=abinary%3Bcharset%3DUTF-8&blobheadername1=Content-Disposition&blobheadername2=MDT-Type&blobheader=application%2Fpdf&blobwhere=1214494378636&blobkey=id (accessed on 25 October 2016).
- Kia Austria GmbH. Soul EV Eco Electric. 2015. Available online: https://www.kia.com/de/dialog/broschuere-download/download/download/?ebrochure=&model= (accessed on 16 March 2016). (In German).
- Honda Deutschland. Verkaufsstart Des Honda Clarity Fuel Cell in Japan. 2016. Available online: http://www.honda.de/cars/honda-welt/news-events/2016-03-16_verkaufsstart-des-honda-clarity-fuel-cell-in-japan.html (accessed on 16 March 2016). (In German).
- Daimler AG. Unter Der Lupe: Mercedes-Benz GLC F-CELL: Die Brennstoffzelle Bekommt Einen Stecker; Daimler AG: Stuttgart, Germany, 2016. Available online: http://media.daimler.com/marsMediaSite/de/instance/ko/Unter-der-Lupe-Mercedes-Benz-GLC-F-CELL-Die-Brennstoffzelle-.xhtml?oid=11111320 (accessed on 25 October 2016). (In German).
- BMW AG. Der BMW i3; BMW AG: Munich, Germany, 2016. Available online: http://www.bmw.de/dam/brandBM/marketDE/countryDE/newvehicles/allfacts/catalogue/BMW_i3_Katalog.pdf?download.1424447309599.pdf (accessed on 25 October 2016). (In German).
- Daimler AG. Mercedes Benz B-Klasse Sports Tourer B 250 e. 2016. Available online: http://www.mercedes-benz.de/content/germany/mpc/mpc_germany_website/de/home_mpc/passengercars/home/new_cars/models/b-class/w242/facts/technicaldata/model.html (accessed on 25 October 2016). (In German).
- Volkswagen AG. Der Neue e-Up! 2016. Available online: http://www.volkswagen.de/content/medialib/vwd4/de/dialog/pdf/up-0/e-up_preisliste/_jcr_content/renditions/rendition.download_attachment.file/e-up_preisliste.pdf (accessed on 25 October 2016). (In German).
- Volkswagen AG. Der e-Golf. 2016. Available online: http://www.volkswagen.de/content/medialib/vwd4/de/dialog/pdf/golf-a7/egolf_preisliste/_jcr_content/renditions/rendition.download_attachment.file/e-golf_preisliste.pdf (accessed on 25 October 2016). (In Germany).
- Tesla Motors. Model S—Premium Electric Sedan. 2016. Available online: https://www.tesla.com/models/design (accessed on 25 October 2016). (In German).
- Tesla Motors. Tesla Model X. 2016. Available online: https://www.tesla.com/de_DE/modelx/design (accessed on 25 October 2016).
- Adam Opel AG. Opel Ampera-e mit über 500 Kilometer Reichweite. 2016. Available online: http://media.opel.de/media/de/de/opel/news.detail.html/content/Pages/news/de/de/2016/opel/09-29-paris-motor-show-2016-summary.html (accessed on 25 October 2016). (In German).
- McKinsey & Co. A Portfolio of Powertrains for Europe: A Fact Based Analysis—The Role of Battery Electric Vehicles, Plug-in-Hybrids and Fuel Cell Electric Vehicles. 2010. Available online: http://www.eesi.org/files/europe_vehicles.pdf (accessed on 25 October 2016).
- Contestabile, M.; Offer, G.J.; Slade, R.; Jaeger, F.; Thoennes, M. Battery electric vehicles, hydrogen fuel cells and biofuels. Which will be the winner? Energy Environ. Sci. 2011, 4, 3754–3772. [Google Scholar] [CrossRef]
- Schemme, S.; Samsun, R.C.; Peters, R.; Stolten, D. Power-to-fuel as a key to sustainable transport systems—An analysis of diesel fuels produced from CO2 and renewable electricity. Fuel 2017, 205, 198–221. [Google Scholar] [CrossRef]
- Otto, A.; Robinius, M.; Grube, T.; Schiebahn, S.; Praktiknjo, A.; Stolten, D. Power-to-Steel: Reducing CO2 through the Integration of Renewable Energy and Hydrogen into the German Steel Industry. Energies 2017, 10, 451. [Google Scholar] [CrossRef]
- Grueger, F.; Möhrke, F.; Robinius, M.; Stolten, D. Early power to gas applications: Reducing wind farm forecast errors and providing secondary control reserve. Appl. Energy 2016, 192, 551–562. [Google Scholar] [CrossRef]
- Lehmann, H. Energy-rich Japan, in Institute for Sustainable Solutions and Innovations. 2013. Available online: http://www.energyrichjapan.info/pdf/EnergyRichJapan_summary.pdf (accessed on 25 November 2016).
- Krajačić, G.; Martins, R.; Busuttil, A.; Duić, N.; da Graça Carvalho, M. Hydrogen as an energy vector in the islands’ energy supply. Int. J. Hydrog. Energy 2008, 33, 1091–1103. [Google Scholar] [CrossRef]
- Lund, H.; Kempton, W. Integration of renewable energy into the transport and electricity sectors through V2G. Energy Policy 2008, 36, 3578–3587. [Google Scholar] [CrossRef]
- Sørensen, B. A renewable energy and hydrogen scenario for northern Europe. Int. J. Energy Res. 2008, 32, 471–500. [Google Scholar] [CrossRef] [Green Version]
- Lund, H.; Mathiesen, B.V. Energy system analysis of 100% renewable energy systems—The case of Denmark in years 2030 and 2050. Energy 2009, 34, 524–531. [Google Scholar] [CrossRef]
- Lund, H.; Möller, B.; Mathiesen, B.V.; Dyrelund, A. The role of district heating in future renewable energy systems. Energy 2010, 35, 1381–1390. [Google Scholar] [CrossRef]
- Zervos, A.; Lins, C.; Muth, J. RE-Thinking 2050: A 100% Renewable Energy Vision for the European Union; EREC: Brussels, Belgium, 2010. [Google Scholar]
- Connolly, D.; Lund, H.; Mathiesen, B.V.; Leahy, M. The first step towards a 100% renewable energy-system for Ireland. Appl. Energy 2011, 88, 502–507. [Google Scholar] [CrossRef]
- Delucchi, M.A.; Jacobson, M.Z. Providing all global energy with wind, water, and solar power, Part II: Reliability, system and transmission costs, and policies. Energy Policy 2011, 39, 1170–1190. [Google Scholar] [CrossRef]
- Jacobson, M.Z.; Delucchi, M.A. Providing all global energy with wind, water, and solar power, Part I: Technologies, energy resources, quantities and areas of infrastructure, and materials. Energy Policy 2011, 39, 1154–1169. [Google Scholar] [CrossRef]
- Krajačić, G.; Duić, N.; Zmijarević, Z.; Mathiesen, B.V.; Vučinić, A.A.; da Graça Carvalho, M. Planning for a 100% independent energy system based on smart energy storage for integration of renewables and CO2 emissions reduction. Appl. Therm. Eng. 2011, 31, 2073–2083. [Google Scholar] [CrossRef] [Green Version]
- Liu, W.; Lund, H.; Mathiesen, B.V.; Zhang, X. Potential of renewable energy systems in China. Appl. Energy 2011, 88, 518–525. [Google Scholar] [CrossRef]
- Ćosić, B.; Krajačić, G.; Duić, N. A 100% renewable energy system in the year 2050: The case of Macedonia. Energy 2012, 48, 80–87. [Google Scholar] [CrossRef] [Green Version]
- Connolly, D.; Mathiesen, B.V. A technical and economic analysis of one potential pathway to a 100% renewable energy system. Int. J. Sustain. Energy Plan. Manag. 2014, 1, 7–28. [Google Scholar]
- Mathiesen, B.V.; Lund, H.; Connolly, D.; Wenzel, H.; Østergaard, P.A.; Möller, B.; Nielsen, S.; Ridjan, I.; Karnøe, P.; Sperling, K. Smart Energy Systems for coherent 100% renewable energy and transport solutions. Appl. Energy 2015, 145, 139–154. [Google Scholar] [CrossRef]
- Madlener, R.; Kowalski, K.; Stagl, S. New ways for the integrated appraisal of national energy scenarios: The case of renewable energy use in Austria. Energy Policy 2007, 35, 6060–6074. [Google Scholar] [CrossRef]
- Mason, I.; Page, S.; Williamson, A. A 100% renewable electricity generation system for New Zealand utilising hydro, wind, geothermal and biomass resources. Energy Policy 2010, 38, 3973–3984. [Google Scholar] [CrossRef]
- Henning, H.-M.; Palzer, A. A comprehensive model for the German electricity and heat sector in a future energy system with a dominant contribution from renewable energy technologies—Part I: Methodology. Renew. Sustain. Energy Rev. 2014, 30, 1003–1018. [Google Scholar] [CrossRef]
- Nastasi, B.; Lo Basso, G. Hydrogen to link heat and electricity in the transition towards future Smart Energy Systems. Energy 2016, 110, 5–22. [Google Scholar] [CrossRef]
- Palzer, A.; Henning, H.-M. A comprehensive model for the German electricity and heat sector in a future energy system with a dominant contribution from renewable energy technologies–Part II: Results. Renew. Sustain. Energy Rev. 2014, 30, 1019–1034. [Google Scholar] [CrossRef]
- Robinius, M. Strom- und Gasmarktdesign zur Versorgung des deutschen Straßenverkehrs mit Wasserstoff; RWTH Aachen University; Forschungszentrum Jülich GmbH Zentralbibliothek, Verlag: Jülich, Germany, 2015; p. 255. (In German) [Google Scholar]
- Samsatli, S.; Staffell, I.; Samsatli, N.J. Optimal design and operation of integrated wind-hydrogen-electricity networks for decarbonising the domestic transport sector in Great Britain. Int. J. Hydrog. Energy 2016, 41, 447–475. [Google Scholar] [CrossRef]
- Garmsiri, S.; Rosen, M.; Smith, G. Integration of Wind Energy, Hydrogen and Natural Gas Pipeline Systems to Meet Community and Transportation Energy Needs: A Parametric Study. Sustainability 2014, 6, 2506–2526. [Google Scholar] [CrossRef]
- Rogge, M.; Wollny, S.; Sauer, D. Fast Charging Battery Buses for the Electrification of Urban Public Transport—A Feasibility Study Focusing on Charging Infrastructure and Energy Storage Requirements. Energies 2015, 8, 4587–4606. [Google Scholar] [CrossRef] [Green Version]
- Qadrdan, M.; Abeysekera, M.; Chaudry, M.; Wu, J.; Jenkins, N. Role of power-to-gas in an integrated gas and electricity system in Great Britain. Int. J. Hydrog. Energy 2015, 40, 5763–5775. [Google Scholar] [CrossRef]
- Teng, F.; Aunedi, M.; Strbac, G. Benefits of flexibility from smart electrified transportation and heating in the future UK electricity system. Appl. Energy 2016, 167, 420–431. [Google Scholar] [CrossRef]
- Kim, J.; Moon, I. The role of hydrogen in the road transportation sector for a sustainable energy system: A case study of Korea. Int. J. Hydrog. Energy 2008, 33, 7326–7337. [Google Scholar] [CrossRef]
- Elliston, B.; Diesendorf, M.; MacGill, I. Simulations of scenarios with 100% renewable electricity in the Australian National Electricity Market. Energy Policy 2012, 45, 606–613. [Google Scholar] [CrossRef]
- Krajačić, G.; Duić, N.; da Graça Carvalho, M. How to achieve a 100% RES electricity supply for Portugal? Appl. Energy 2011, 88, 508–517. [Google Scholar] [CrossRef]
- Guandalini, G.; Robinius, M.; Grube, T.; Campanari, S.; Stolten, D. Long-term power-to-gas potential from wind and solar power: A country analysis for Italy. Int. J. Hydrog. Energy 2017, 42, 13389–13406. [Google Scholar] [CrossRef]
- Reuß, M.; Grube, T.; Robinius, M.; Preuster, P.; Wasserscheid, P.; Stolten, D. Seasonal storage and alternative carriers: A flexible hydrogen supply chain model. Appl. Energy 2017, 200, 290–302. [Google Scholar] [CrossRef]
- Robinius, M.; Otto, A.; Syranidis, K.; Ryberg, D.S.; Heuser, P.; Welder, L.; Grube, T.; Markewitz, P.; Tietze, V.; Stolten, D. Linking the power and transport sectors—Part 2: Modelling a sector coupling scenario for Germany. Energies 2017, 10, 957. [Google Scholar] [CrossRef]
- REN21. Renewables 2017—Global Status Report. 2017. Available online: http://www.ren21.net/wp-content/uploads/2017/06/170607_GSR_2017_Full_Report.pdf (accessed on 12 June 2017).
- Jiang, W.; Boltze, M.; Groer, S.; Scheuvens, D. Impacts of low emission zones in Germany on air pollution levels. Transp. Res. Procedia 2017, 25, 3374–3386. [Google Scholar] [CrossRef]
- Bundesministerium für Umwelt, N.u.R. Klimaschutzplan 2050—Klimaschutzpolitische Grundsätze und Ziele der Bundesregierung. 2016. Available online: http://www.bmub.bund.de/fileadmin/Daten_BMU/Download_PDF/Klimaschutz/klimaschutzplan_2050_kurzf_bf.pdf (accessed on 12 June 2017).
- Markewitz, P.; Grube, T.; Robinius, M.; Kannengießer, T.; Stolten, D. Energietransport- und Verteilung. Brennstoff-Waerme-Kraft 2017, 69, 45–53. [Google Scholar]
- Fraunhofer IWES and Fraunhofer UMSICHT. Metastudie »Energiespeicher«. 2014. Available online: https://www.umsicht.fraunhofer.de/content/dam/umsicht/de/dokumente/pressemitteilungen/2015/Abschlussbericht-Metastudie-Energiespeicher.pdf (accessed on 10 March 2015). (In German).
- Agentur für Erneuerbare Energien e.V. Metaanalyse: Flexibilität durch Sektorkopplung. 2016. Available online: http://www.forschungsradar.de/metaanalysen/einzelansicht/news/metaanalyse-zur-flexibilitaet-durch-sektorkopplung.html (accessed on 12 May 2017). (In German).
- Robinius, M.; Rodriguez, R.A.; Kumar, B.; Andresen, G.B.; Stein, F.T.; Schiebahn, S.; Stolten, D. Optimal placement of electrolysers in a German power-to-gas infrastructure. In Proceedings of the 20th World Hydrogen Energy Conference, Gwangju, Korea, 15–20 June 2014. [Google Scholar]
- Schiebahn, S.; Grube, T.; Robinius, M.; Tietze, V.; Kumar, B.; Stolten, D. Power to gas: Technological overview, systems analysis and economic assessment for a case study in Germany. Int. J. Hydrog. Energy 2015, 40, 4285–4294. [Google Scholar] [CrossRef]
- ETG-Task Force Energiespeicherung. Energiespeicher für die Energiewende. Speicherungsbedarf und Auswirkungen auf das Übertragungsnetz für Szenarien bis 2050. Studie der Energietechnischen Gesellschaft im VDE (ETG). 2012. Available online: https://www.vde.com/de/etg/publikationen/studien/etg-vde-studie-energiespeicher-fuer-die-energiewende (accessed on 10 March 2015). (In German).
- Fraunhofer ISE. 100 % Erneuerbare Energien für Strom und Wärme in Deutschland. 2012. Available online: http://www.ise.fraunhofer.de/de/veroeffentlichungen/veroeffentlichungen-pdf-dateien/studien-und-konzeptpapiere/studie-100-erneuerbare-energien-in-deutschland.pdf (accessed on 28 March 2017).
- Fraunhofer UMSICHT and Fraunhoder IOSB. Modellbasierte, Regional Aufgelöste Analyse Zum Bedarfs an Netzgekoppelten Elektrischen Energiespeichern Zum Ausgleich Fluktuierender Energien; Fraunhofer UMSICHT and Fraunhoder IOSB: Oberhausen, Germany, 2013. (In German) [Google Scholar]
- SRU. Wege Zur 100% Erneuerbaren Stromversorgung. Sondergutachten; Erich Schmidt Verlag: Berlin, Germany, 2011. [Google Scholar]
- Umweltbundesamt. Energieziel 2050: 100% Strom Aus Erneuerbaren Quellen. In Vorabdruck für die Bundespressekonferenz am 7. Juli 2010; Umweltbundesamt: Dessau-Roßlau, Germay, 2010. (In German) [Google Scholar]
- Agora Energiewende. Stromspeicher in der Energiewende. Untersuchung Zum Bedarf an Neuen Stromspeichern in Deutschland für den Erzeugungsausgleich, Systemdienstleistungen und im Verteilnetz; Agora Energiewende: Berlin, Germany, 2014. [Google Scholar]
- DLR; Fraunhofer IWES; IfnE. Langfristszenarien und Strategien für den Ausbau Erneuerbarer Energien in Deutschland bei Berücksichtigung der Entwicklung in Europa und Global. 2012. Available online: http://www.fvee.de/fileadmin/publikationen/Politische_Papiere_anderer/12.03.29.BMU_Leitstudie2011/BMU_Leitstudie2011.pdf (accessed on 5 March 2015). (In German).
- EWI and energynautics. Roadmap 2050—A Closer Look. Cost-Efficient RES-E Penetration and the Role of Grid Extensions. Final Report. 2011. Available online: http://www.ewi.uni-koeln.de/fileadmin/user_upload/Publikationen/Studien/Politik_und_Gesellschaft/2011/Roadmap_2050_komplett_Endbericht_Web.pdf (accessed on 5 March 2015).
- Frontier Economics and swissQuant Group. Bewertung von Pumpspeicherkraftwerken in der Schweiz im Rahmen der Energiestrategie 2050. Studie für das Bundesamt für Energie (BFE). Schlussbericht; Frontier Economics and swissQuant Group: Bern, Switzerland, 2013; Available online: https://www.newsd.admin.ch/newsd/message/attachments/33124.pdf (accessed on 5 March 2015). (In German).
- Jentsch, M.; Trost, T.; Sterner, M. Optimal Use of Power-to-Gas Energy Storage Systems in an 85% Renewable Energy Scenario. Energy Procedia 2014, 46, 254–261. [Google Scholar] [CrossRef]
- Prognos AG, EWI, and GWS. Energieszenarien für ein Energiekonzept der Bundesregierung. Projekt Nr. 12/10. 2010. Available online: http://www.ewi.uni-koeln.de/fileadmin/user_upload/Publikationen/Studien/Politik_und_Gesellschaft/2010/EWI_2010-08-30_Energieszenarien-Studie.pdf (accessed on 5 March 2015). (In German).
- ZSW. Dynamische Simulation der Ausbauszenarien für Erneuerbare Stromversorgung in Baden-Württemberg bis 2050 Nach dem Gutachten zur Vorbereitung Eines Klimaschutzgesetzes (SimBW). Speicherbedarf in Deutschland und Baden-Württemberg. Abschlussbericht, 2014. Available online: https://www.zsw-bw.de/uploads/media/Abschlussbericht_SimBW_2014.pdf (accessed on 5 March 2015). (In German).
- Bussar, C.; Melchior, M.; Alvarez, R.; Wolf, P.; Thien, T.; Chen, H.; Cai, Z.; Leuthold, M.; Sauer, D.U.; Moser, A. Optimal Allocation and Capacity of Energy Storage Systems in a Future European Power System with 100% Renewable Energy Generation. Energy Procedia 2014, 46, 40–47. [Google Scholar] [CrossRef]
- Czisch, G. Szenarien zur zukünftigen Stromversorgung. Kostenoptimierte Variationen zur Versorgung Europas und seiner Nachbarn mit Strom aus erneuerbaren Energien. Ph.D. Thesis, Universität Kassel, Kassel, Germany, 2005. (In German). [Google Scholar]
- Integration der Erneuerbaren Energien in den Deutsch-Europäischen Strom-Markt. (Integration EE); DENA: Berlin, Germany; IAEW: Aachen, Germany, 2012. (In German)
- Droste-Franke, B. Balancing renewable electricity. Energy storage, demand side man-agement, and network extension from an interdisciplinary perspective. In Ethics of Science and Technology Assessment; Springer: Berlin, Germany, 2012. [Google Scholar]
- Fraunhofer ISI. Tangible Ways Towards Climate Protection in the European Union (EU Long-Term Scenarios 2050); Fraunhofer ISI: Karlsruhe, Germany, 2011. [Google Scholar]
- ROADMAP SPEICHER. Bestimmung des Speicherbedarfs in Deutschland im Europäischen Kontext und Ableitung von Technisch-ökonomischen Sowie Rechtlichen Handlungsempfehlungen für die Speicherförderung; Fraunhofer IWES/IAEW/Stiftung Umweltenergierecht: Kassel, Germany, 2014. (In German)
- Pleßmann, G.; Matthias, E.; Hlusiak, M.; Breyer, C. Global Energy Storage Demand for a 100% Renewable Electricity Supply. Energy Procedia 2014, 46, 22–31. [Google Scholar] [CrossRef]
- Schabram, J.; Wiernes, P.E.; Linnemann, C.; Kraemer, C.; Moser, A.; Mercado, P.E. Planning the future European power system. In Proceedings of the IEEE Grenoble PowerTech, Grenoble, France, 16–20 June 2013. [Google Scholar]
- Fraunhofer IWES. Geschäftsmodell Energiewende. Eine Antwort auf das “Die-Kosten-der-Energiewende”-Argument; Fraunhofer IWES: Kassel, Germany, 2014. (In German) [Google Scholar]
- International Energy Agency (IEA). CO2 Emissions from Fuel Combustion Highlights; IEA: Paris, France, 2015. [Google Scholar]
- Kahraman, Z.; Ringenbach, C.; Benichou, L. Breakdown of Electricity Generation by Energy Source. 2016. Available online: http://www.tsp-data-portal.org/Breakdown-of-Electricity-Generation-by-Energy-Source#tspQvChart (accessed on 24 October 2016).
- REN21 Renewable Energy Policy Network for the 21st Century. Renewables 2016 Global Status Report—Key Findings. Available online: http://www.ren21.net/wp-content/uploads/2016/06/GSR_2016_Full_Report.pdf (accessed on 15 February 2017).
- Frankfurt School—United Nations Environmental Programme Collabortating Centre for Climate and Sustainable Energy Finance. Global Trends in Renewable Energy Investment. 2016. Available online: http://fs-unep-centre.org/sites/default/files/publications/globaltrendsinrenewableenergyinvestment2016lowres_0.pdf (accessed on 18 July 2017).
- U.S. Energy Information Administration. International Energy Outlook 2016; U.S. Energy Information Administration: Washington, DC, USA, 2016. Available online: http://www.eia.gov/forecasts/ieo/pdf/0484%282016%29.pdf (accessed on 20 February 2017).
- Kenworthy, J. Decoupling Urban Car Use and Metropolitan GDP Growth. World Transp. Policy Pract. 2013, 19, 8–21. [Google Scholar]
- Edenhofer, O.; Minx, J.C.; Adler, A.; Eickemeier, P.; Schlömer, S.; Pichs-Madruga, R.; Farahani, E.; Kadner, S.; Baum, I.; Kriemann, B.; et al. Climate Change 2014—Migitation of Climate Change; International Panel on Climate Change: Cambridge, UK, 2014. [Google Scholar]
- International Energy Agency (IEA). World Balance (2013). 2016. Available online: http://www.iea.org/sankey/ (accessed on 24 October 2016).
- Commission of the European Communities. Communication from the Commission to the European Council and the European Parliament: An Energy Policy for Europe; Commission of the European Communities: Brüssel, Belgium, 2007; Available online: http://eur-lex.europa.eu/legal-content/EN/TXT/PDF/?uri=CELEX:52007DC0001&from=EN (accessed on 28 March 2017).
- European Commission. Communication from the Commission to the European Parliament, the Council, the European Economic and Social Committee and the Committee of the Regions: Energy Roadmap 2050; COM(2011) 885 Final; European Commission: Brüssel, Belgium, 2011. [Google Scholar]
- European Commission. Communication from the Commission to the European Parliament, the Council, the European Economic and Social Committee and the Committee of the Regions: A Policy Framework for Climate and Energy in the Period from 2020 to 2030; COM(2014) 15 Final; European Commission: Brüssel, Belgium, 2014. [Google Scholar]
- European Environment Agency. Renewable Energy in Europe—Approximated Recent Growth and Knock-on Effects. 2015. Available online: https://www.eea.europa.eu/publications/renewable-energy-in-europe-approximated (accessed on 18 July 2017).
- European Commission. White Paper—Roadmap to a Single European Transport Area—Towards a Competitive and Resource Efficient Transport System; European Commission: Brüssel, Belgium, 2011; Available online: http://eur-lex.europa.eu/legal-content/EN/TXT/PDF/?uri=CELEX:52011DC0144&from=EN (accessed on 10 October 2016).
- Kitzing, L.; Mitchell, C.; Morthorst, P.E. Renewable energy policies in Europe: Converging or diverging? Energy Policy 2012, 51, 192–201. [Google Scholar] [CrossRef] [Green Version]
- Verband der Industriellen Energie- und Kraftwirtschaft e.V. Statistik der Energiewirtschaft; Verband der Industriellen Energie- und Kraftwirtschaft: Essen, Germany, 2016. [Google Scholar]
- European Commission. Reducing Emissions from Transport—A European Strategy for Low-Emission Mobility. 2016. Available online: http://ec.europa.eu/clima/policies/transport/index_en.htm (accessed on 24 October 2016).
- Eurostat. Greenhouse Gas Emission Statistics. 2016. Available online: http://ec.europa.eu/eurostat/statistics-explained/index.php/Greenhouse_gas_emission_statistics#Main_tables (accessed on 24 October 2016).
- European Environment Agency. Final Energy Consumption by Mode of Transport. 2016. Available online: http://www.eea.europa.eu/data-and-maps/indicators/transport-final-energy-consumption-by-mode/assessment-5 (accessed on 24 October 2016).
- BMWi. Energiedaten: Gesamtausgabe; BMWi: Berlin, Germany, 2016. Available online: http://www.bmwi.de/DE/Themen/Energie/Energiedaten-und-analysen/Energiedaten/gesamtausgabe,did=476134.html (accessed on 25 October 2016). (In German).
- Umweltbundesamt. Emissionsquellen. 2016. Available online: https://www.umweltbundesamt.de/themen/klima-energie/klimaschutz-energiepolitik-in-deutschland/treibhausgas-emissionen/emissionsquellen (accessed on 24 October 2016). (In German).
- Radke, S.; Stühmke, M.; Niemann, W. Verkehr in Zahlen 2014/2015; Bundesministerium für Verkehr und digitale Infrastruktur: Berlin, Germany, 2014. (In German) [Google Scholar]


| BEVs | FCVs |
|---|---|
|
|
|
|
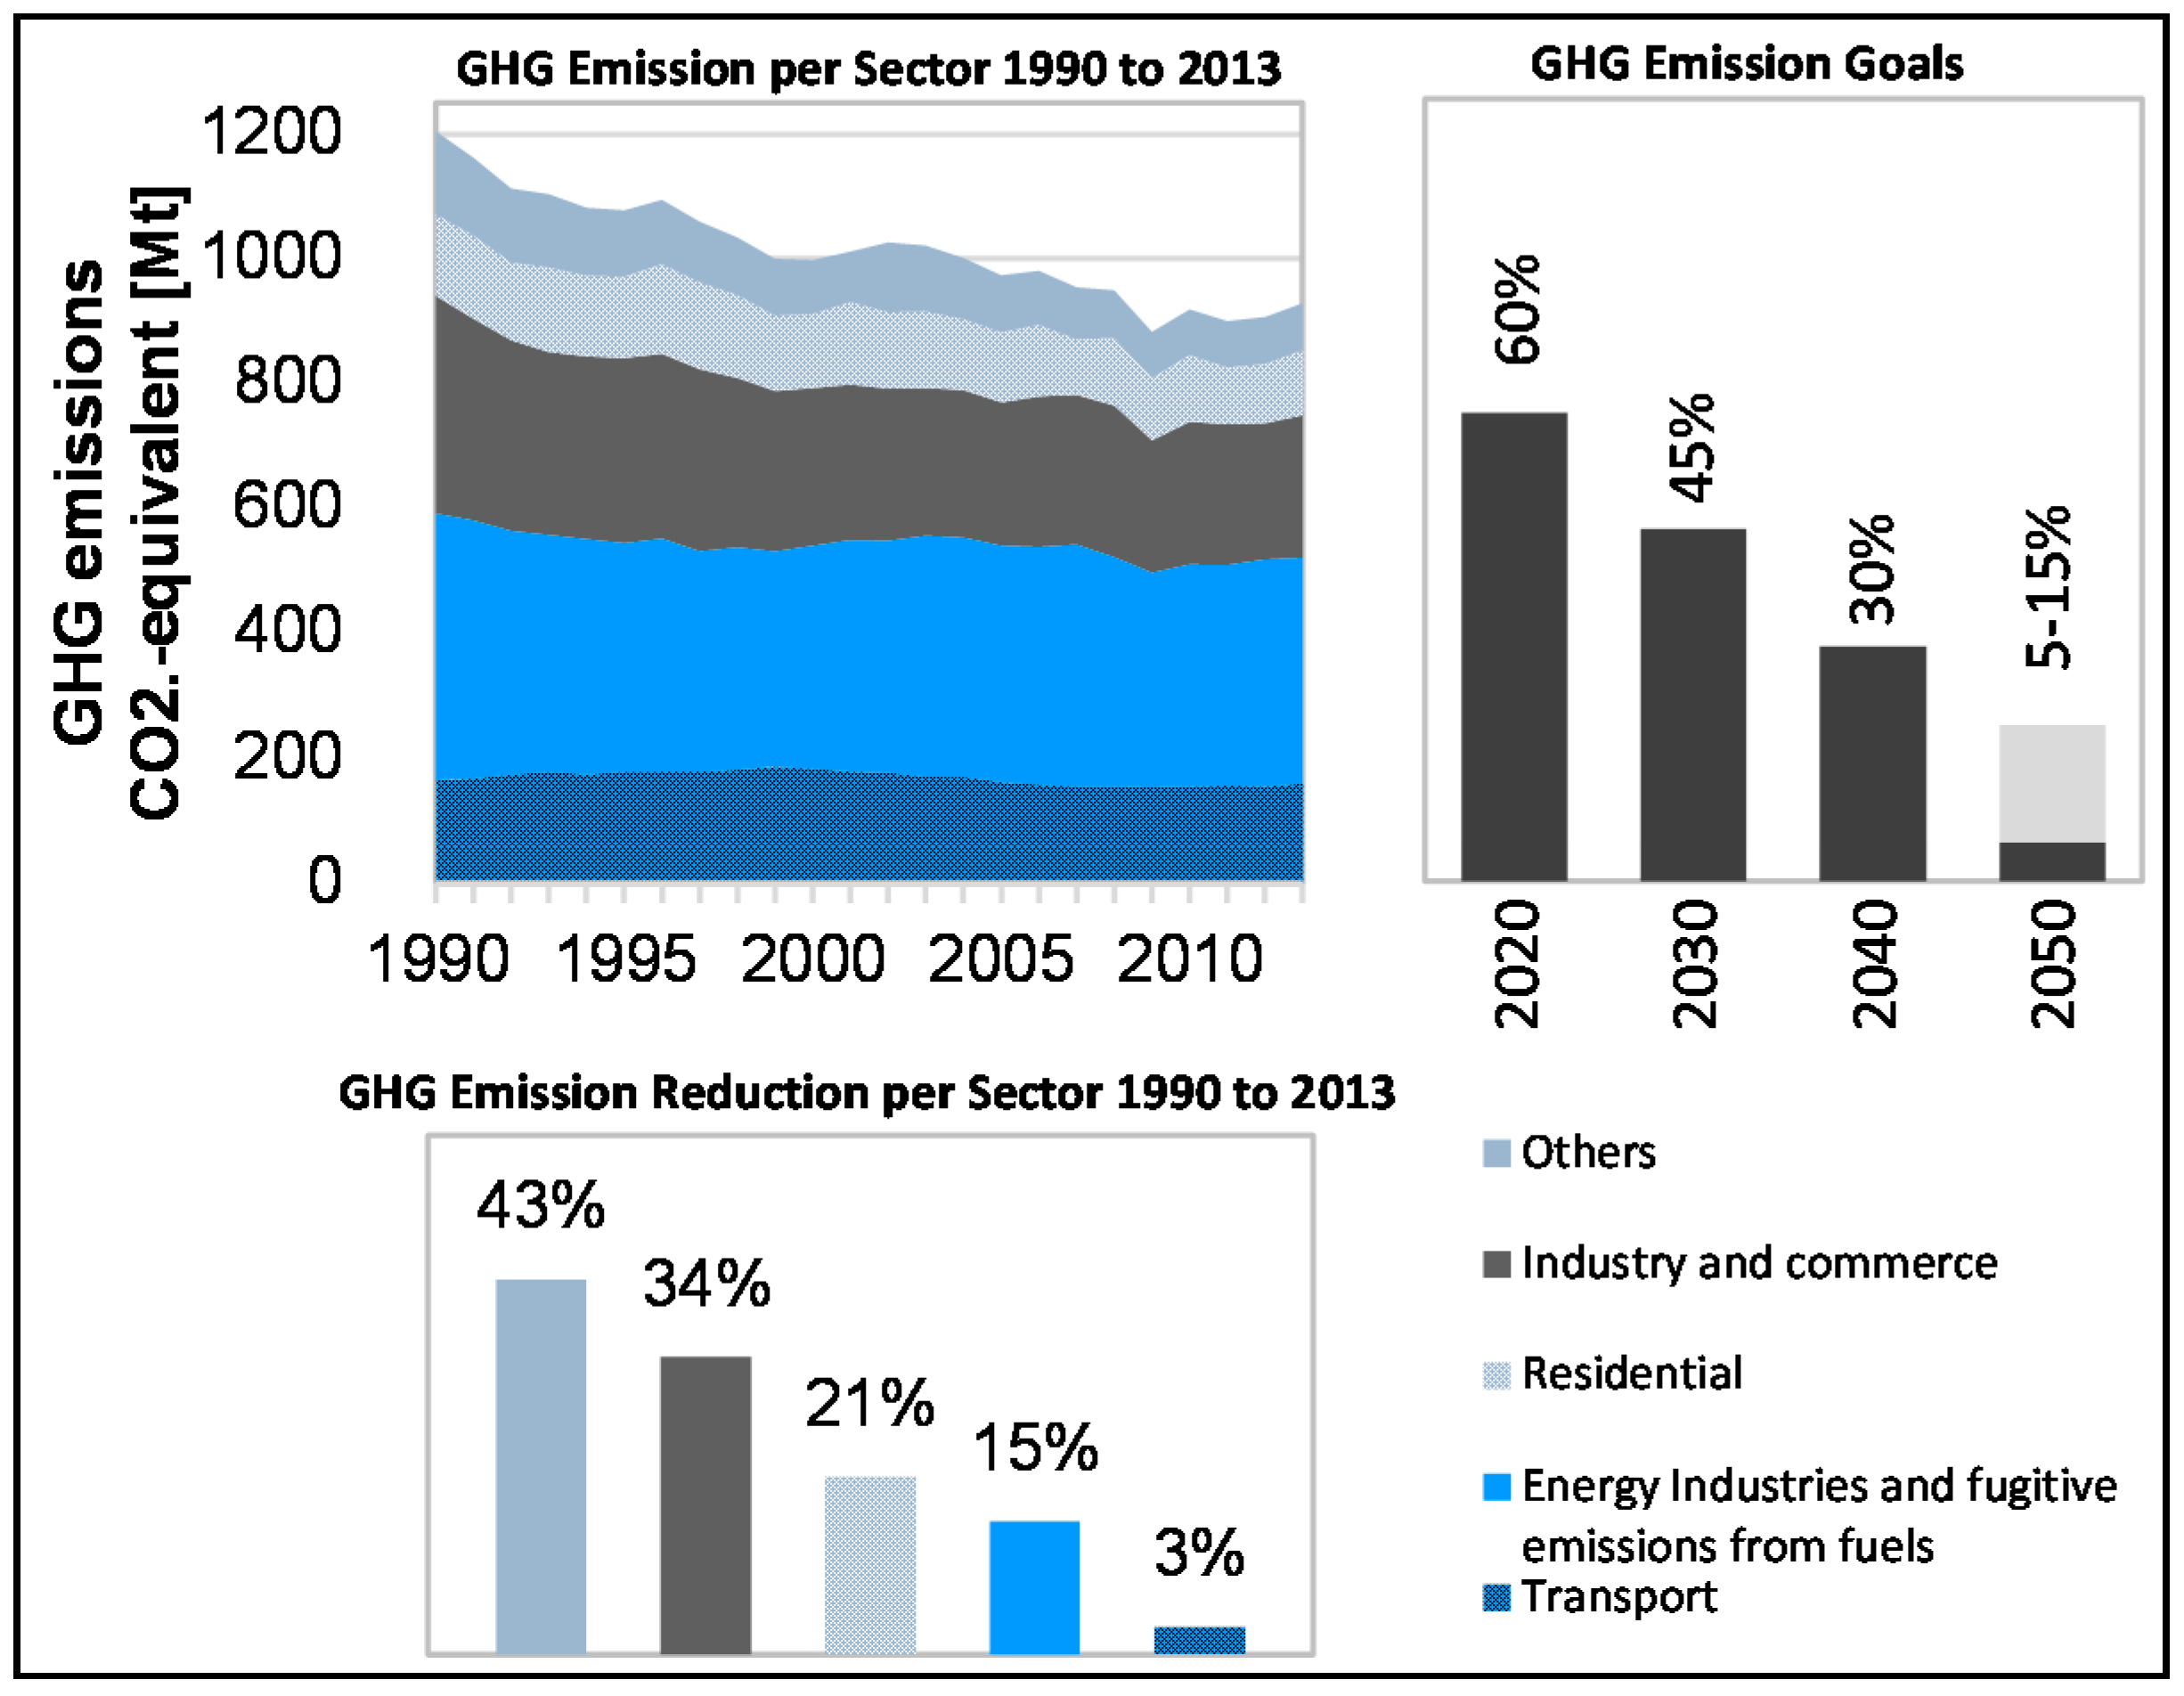
| Sectors | 1990 (tCO2eq) | 2014 (tCO2eq) | 2014 vs. 1990 | Goals: 2030 (tCO2eq) | Goals: 2030 vs. 1990 |
|---|---|---|---|---|---|
| Energy industries | 466 | 358 | −23.2% | 175–183 | 62–61% |
| Residential | 209 | 119 | −43.1% | 70–72 | 67–66% |
| Transport | 162 | 160 | −1.2% | 95–98 | 42–40% |
| Industry and commerce | 283 | 181 | −36% | 140–143 | 51–49% |
| Agriculture | 88 | 72 | −18.2% | 58–61 | 34–31% |
| Others | 39 | 12 | −69% | 5 | 87% |
| Sum | 1248 | 902 | −27.7% | 543–562 | 56–55% |
| ETG-Task-Force (2012) [72] Fraunhofer ISE (2012) [73] Fraunhofer UMSICHT & Fraunhofer IOSB/AST (2013) [74] SRU (2011) [75] Umweltbundesamt (2010) [76] | Robinius (2016) [52,70,71] | Germany |
| Agora (2014) [77] DLR et al. (2012) [78] EWI & energynautics (2011) [79] Frontier Economics & swissQuant Group (2013) [80] Jentsch et al. (2014) [81] Prognos AG et al. (2010) [82] ZSW (2014) [83] | EWI & energynautics (2011) [79] | ↑ Strategic development of the power supply system ↓ |
| Bussar et al. (2014) [84] Czisch (2005) [85] DENA & IAEW (2012) [86] Droste-Franke (2012) [87] EWI & energynautics (2011) [79] Fraunhofer ISI (2011) [88] Fraunhofer IWES et al. (2014) [89] Pleßmann et al. (2014) [90] Schabram et al. (2013) [91] SRU (2011) [75] | - |
© 2017 by the authors. Licensee MDPI, Basel, Switzerland. This article is an open access article distributed under the terms and conditions of the Creative Commons Attribution (CC BY) license (http://creativecommons.org/licenses/by/4.0/).
Share and Cite
Robinius, M.; Otto, A.; Heuser, P.; Welder, L.; Syranidis, K.; Ryberg, D.S.; Grube, T.; Markewitz, P.; Peters, R.; Stolten, D. Linking the Power and Transport Sectors—Part 1: The Principle of Sector Coupling. Energies 2017, 10, 956. https://doi.org/10.3390/en10070956
Robinius M, Otto A, Heuser P, Welder L, Syranidis K, Ryberg DS, Grube T, Markewitz P, Peters R, Stolten D. Linking the Power and Transport Sectors—Part 1: The Principle of Sector Coupling. Energies. 2017; 10(7):956. https://doi.org/10.3390/en10070956
Chicago/Turabian StyleRobinius, Martin, Alexander Otto, Philipp Heuser, Lara Welder, Konstantinos Syranidis, David S. Ryberg, Thomas Grube, Peter Markewitz, Ralf Peters, and Detlef Stolten. 2017. "Linking the Power and Transport Sectors—Part 1: The Principle of Sector Coupling" Energies 10, no. 7: 956. https://doi.org/10.3390/en10070956