
On the Response of Nascent Soot Nanostructure and Oxidative Reactivity to Photoflash Exposure

1
Key Laboratory of Thermal Control of Electronic Equipment, Ministry of Industry and Information Technology, Nanjing University of Science and Technology, Nanjing 210094, China
2
Advanced Combustion Laboratory, School of Energy and Power Engineering, Nanjing University of Science and Technology, Nanjing 210094, China
*
Authors to whom correspondence should be addressed.
Energies 2017, 10(7), 961; https://doi.org/10.3390/en10070961
Submission received: 16 June 2017
/
Revised: 3 July 2017
/
Accepted: 3 July 2017
/
Published: 10 July 2017
Abstract
:Soot particles are a kind of major pollutant from fuel combustion. To enrich the understanding of soot, this work focuses on investigating detailed influences of instantaneous external irradiation (conventional photoflash exposure) on nanostructure as well as oxidation reactivity of nascent soot particles. By detailed soot characterizations flash can reduce the mass of soot and soot nanostructure can be reconstructed substantially without burning. After flash, the degree of soot crystallization increases while the soot reactive rate decreases and the activation energy increases. In addition, nanostructure and oxidative reactivity of soot in air and Ar after flash are different due to their different thermal conductivities.
1. Introduction
Soot particles are one kind of major pollutant from fuel combustion. Soot emission to the environment reduces air quality, affects the climate and can cause health problems such as asthma, lung cancer, and cardiovascular disease [1,2]. For this reason , soot formation in combustion has been widely investigated in diesel engine [3,4,5] and different flame structures [6,7] over the years. Therefore, the reduction of soot emission is a great challenge and it is of great importance to understand the soot formation process and characteristics at different operating conditions.
Investigations of soot nanostructure and reactivity can contribute to fully understanding soot formation and characteristics. Soot nanostructure impacts soot oxidation reactivity and has been widely studied [8,9,10,11]. Vander Wal et al. [12] investigated the dependence of soot oxidation rate upon the nanostructure including fringe length, curvature and separation distance of the carbon layers. They found that soot with shorter fringe length, higher curvature and larger separation distance had higher oxidation reactivity. Raj et al. [13] investigated the effect of planar and curved PAHs (polycyclic aromatic hydrocarbons) structures comprising primary soot particles on their oxidation reactivity. They found the average activation energy of curved soot (soot with higher fringe curvature) was lower than that of planar soot (soot with tinier fringe curvature), and curved soot showed higher reactivity. Quantum calculations were conducted to confirm the impact of curvature on reducing the activation energy.
Soot formation and characteristics are not only dependent on flame conditions, but also may be highly related to the external environment such as external irradiation. However, the latter aspect has not been well studied until now. In recent years, the studies have found that externally introduced irradiation based on the different physical and chemical characteristics has good emission characteristics and high economic performance [14,15]. It has been proved that a continuous externally introduced irradiation source can increase the soot loading of the flame, influence soot morphology and the in-flame soot growth processes [16]. The studies above are almost always restricted to continuous irradiation, but influences of instantaneous irradiation on soot materials have rarely been studied and are still not well understood to date.
Since flash ignition of carbon nanotubes using conventional photoflash was first discovered by Ajayan et al. [17], the processing and ignition of nanomaterials using normal photoflash have been attracting increased interests from many researchers [18,19,20,21]. That is not only because of its low energy requirement for processing and ignition nanomaterials, but also because of its low cost, distributed light area and easy access etc. The color temperature of photoflash is about 5500 K, intrinsically the same to that of solar light. However, the light from the photoflash can be considered as one kind of instantaneous irradiation, which is different to solar irradiation. Therefore, the photoflash is of great interest because it can provide a useful discussion and give better understanding for controlling the soot properties by introducing external instantaneous radiation.
Moreover, the present work is focused on the response of nascent soot properties to photoflash exposure. Several previous investigations have been confirmed that the flame configuration known as an inverse diffusion flame (IDF) appears to be a good alternative for studying the chemistry of the soot inception process [22,23,24]. Compared to other types of configurations, the precursor material and young soot particles can be collected from an IDF without oxidation. As a result, the soot generated from an IDF is selected as the samples’ exposure to photoflash in the present work.
The aim of the present work is to investigate the effects of conventional photoflash exposures as one kind of instantaneous irradiation on soot nanostructure and oxidative reactivity under different operating conditions. The morphology and structures of soot samples before and after flash are examined by X-ray diffraction (XRD), high-resolution transmission electron microscopy (HRTEM) and helium ion microscopy (HIM). Temperature-programmed oxidation (TPO) experiments are performed in a flow-reactor. The deeper oxidative reactivity and apparent kinetic parameters are evaluated by thermogravimetric analysis (TGA).
2. Materials and Methods
2.1. Sample Preparation
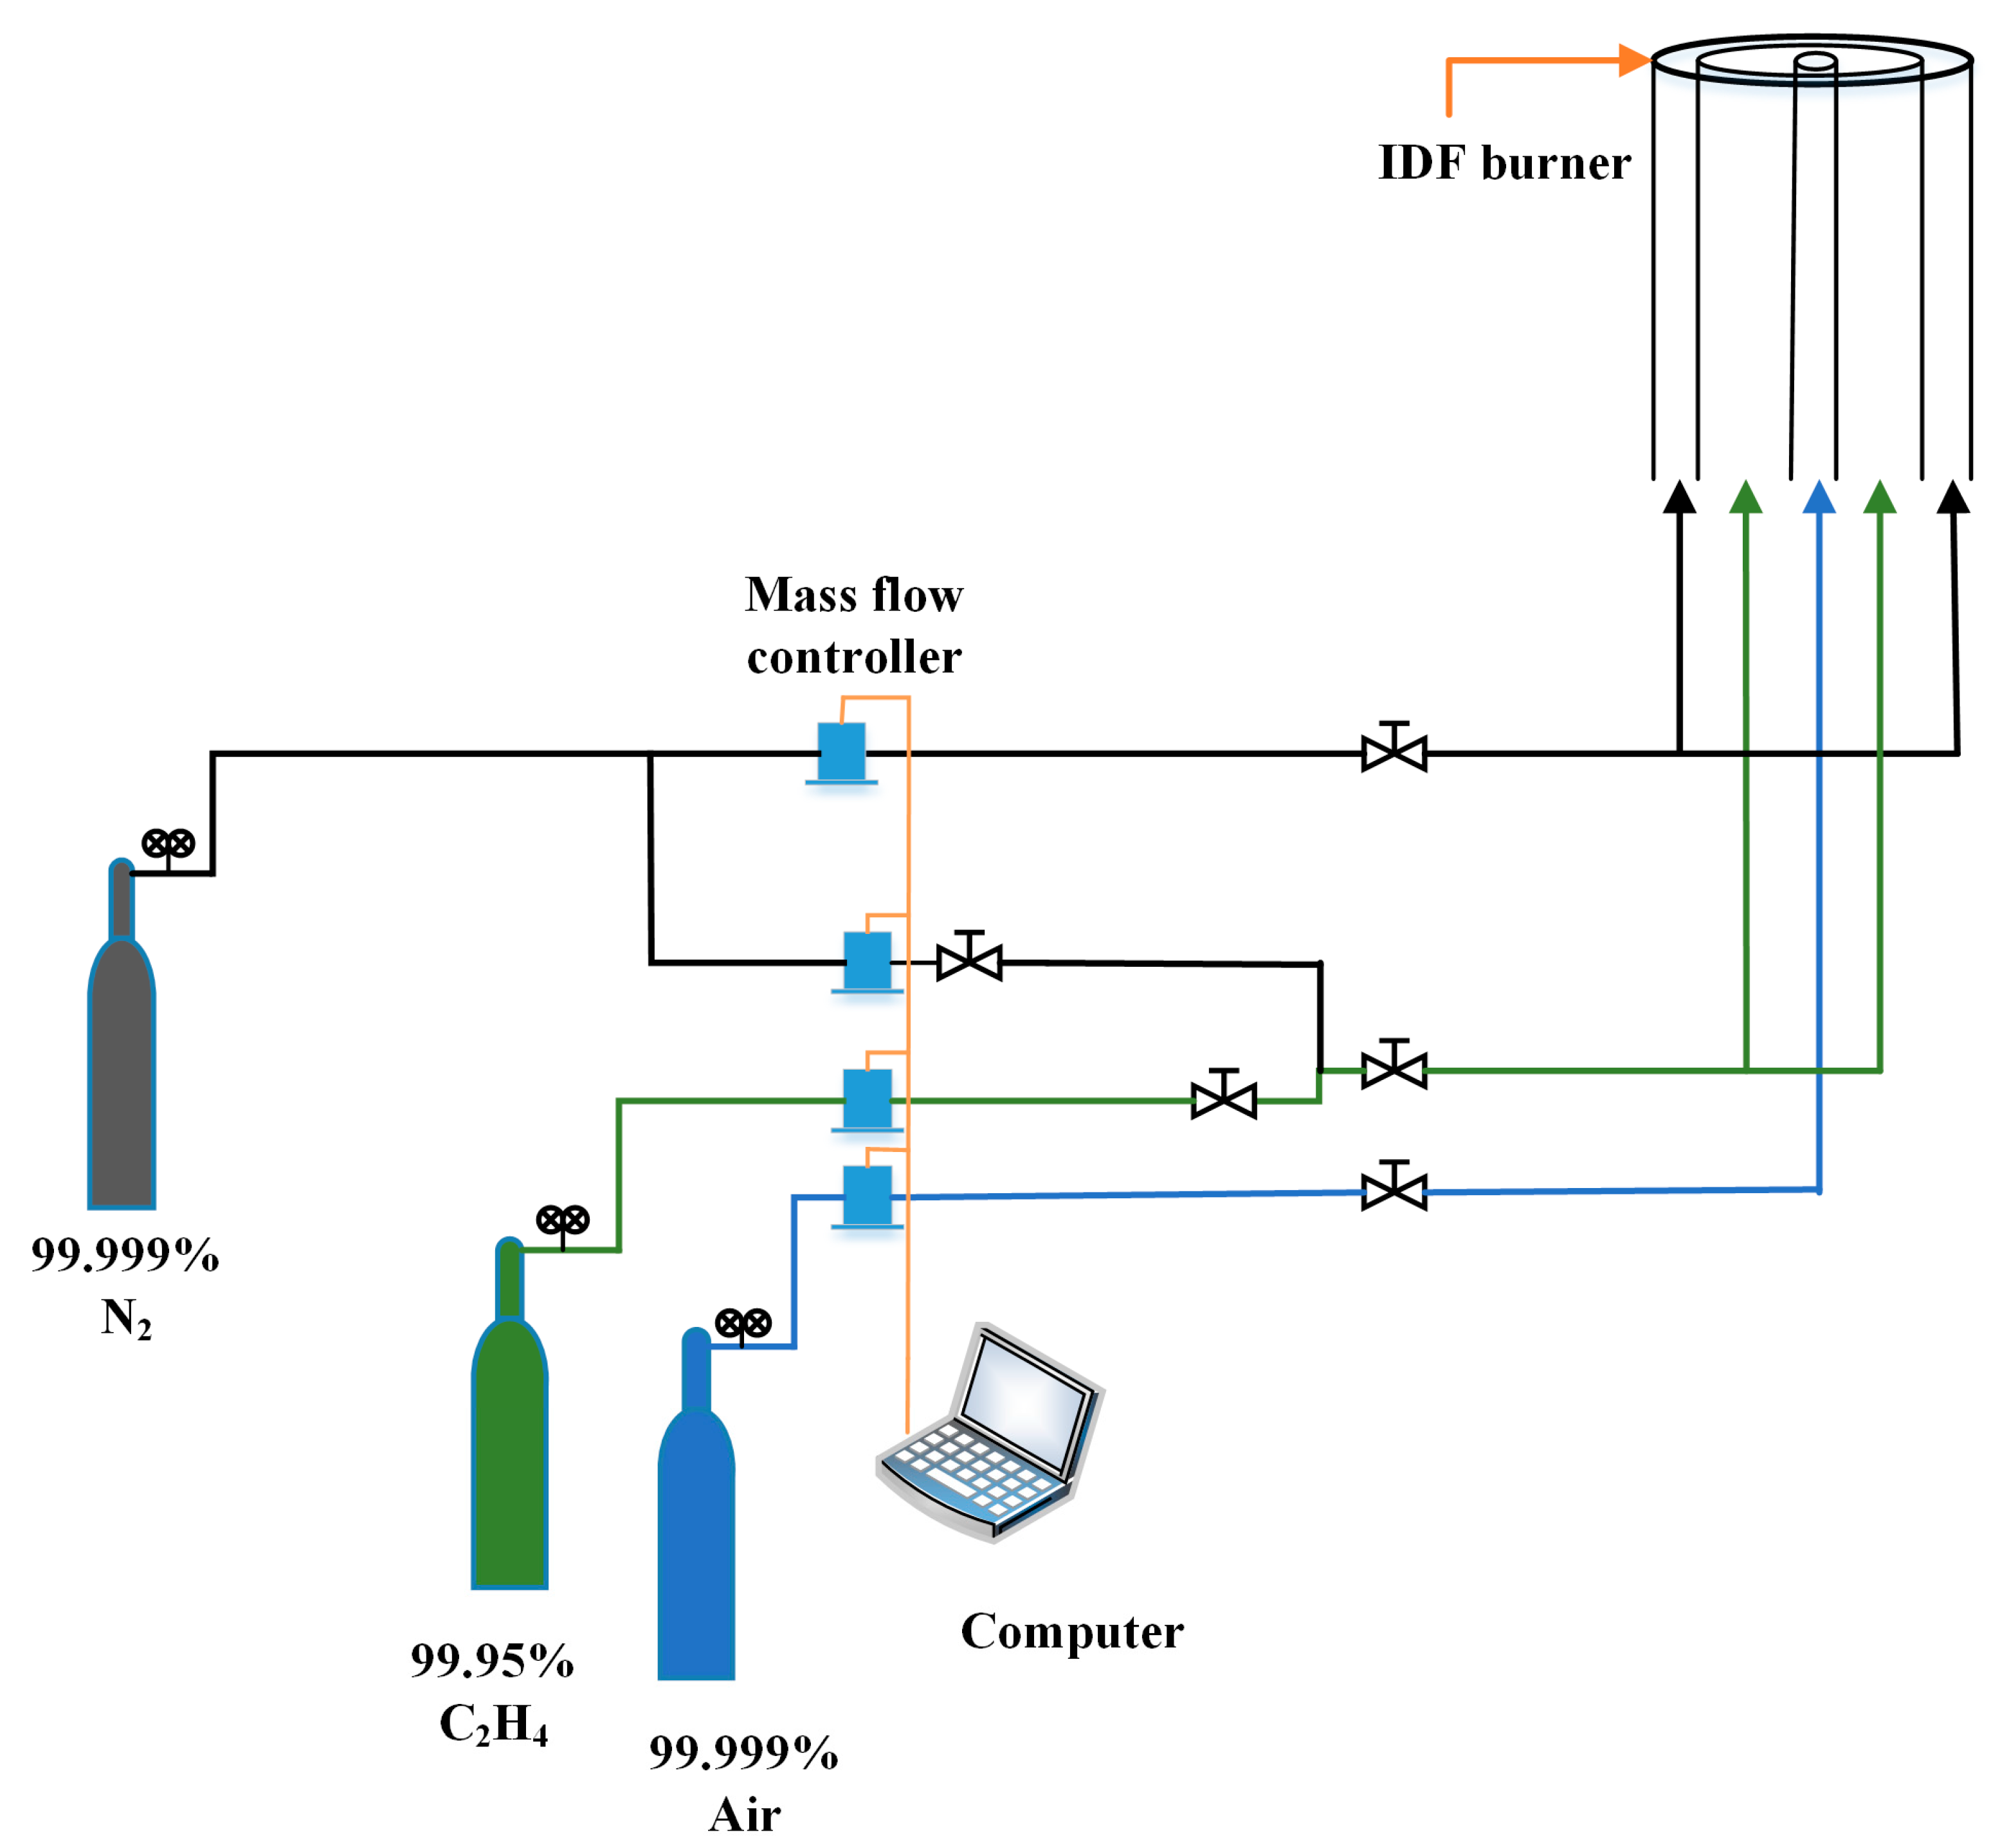
The nascent soot was collected from the ethylene IDFs. A co-annular laminar IDF burner was setup for the present study. The IDF burner consists of three concentric stainless steel tubes, as shown in Figure 1. The inner diameters of the central tube, the intermediate tube and the outer tube are 3.86 mm, 15.30 mm and 32.36 mm respectively. In the IDF configuration, the central tube is for the oxidizer stream (air with 99.999% purity), and the intermediate tube is for the fuel stream (ethylene with 99.95% purity). Nitrogen, with 99.999% purity, was ejected from the outer tube as a shield to prevent the formation of secondary flames between the fuel and ambient air. The experimental conditions were summarized in Table 1. The soot particles were collected from 30 mm from the burner tip using a quartz disk with a diameter of 50 mm. Soot collection time was determined for 30 min. Soot particles were sampled onto the quartz surface, which was kept cold by circulating water. The soot samples were subsequently scraped from the quartz disk and ground into powder by a spatula for several minutes.
2.2. Flash-Exposure
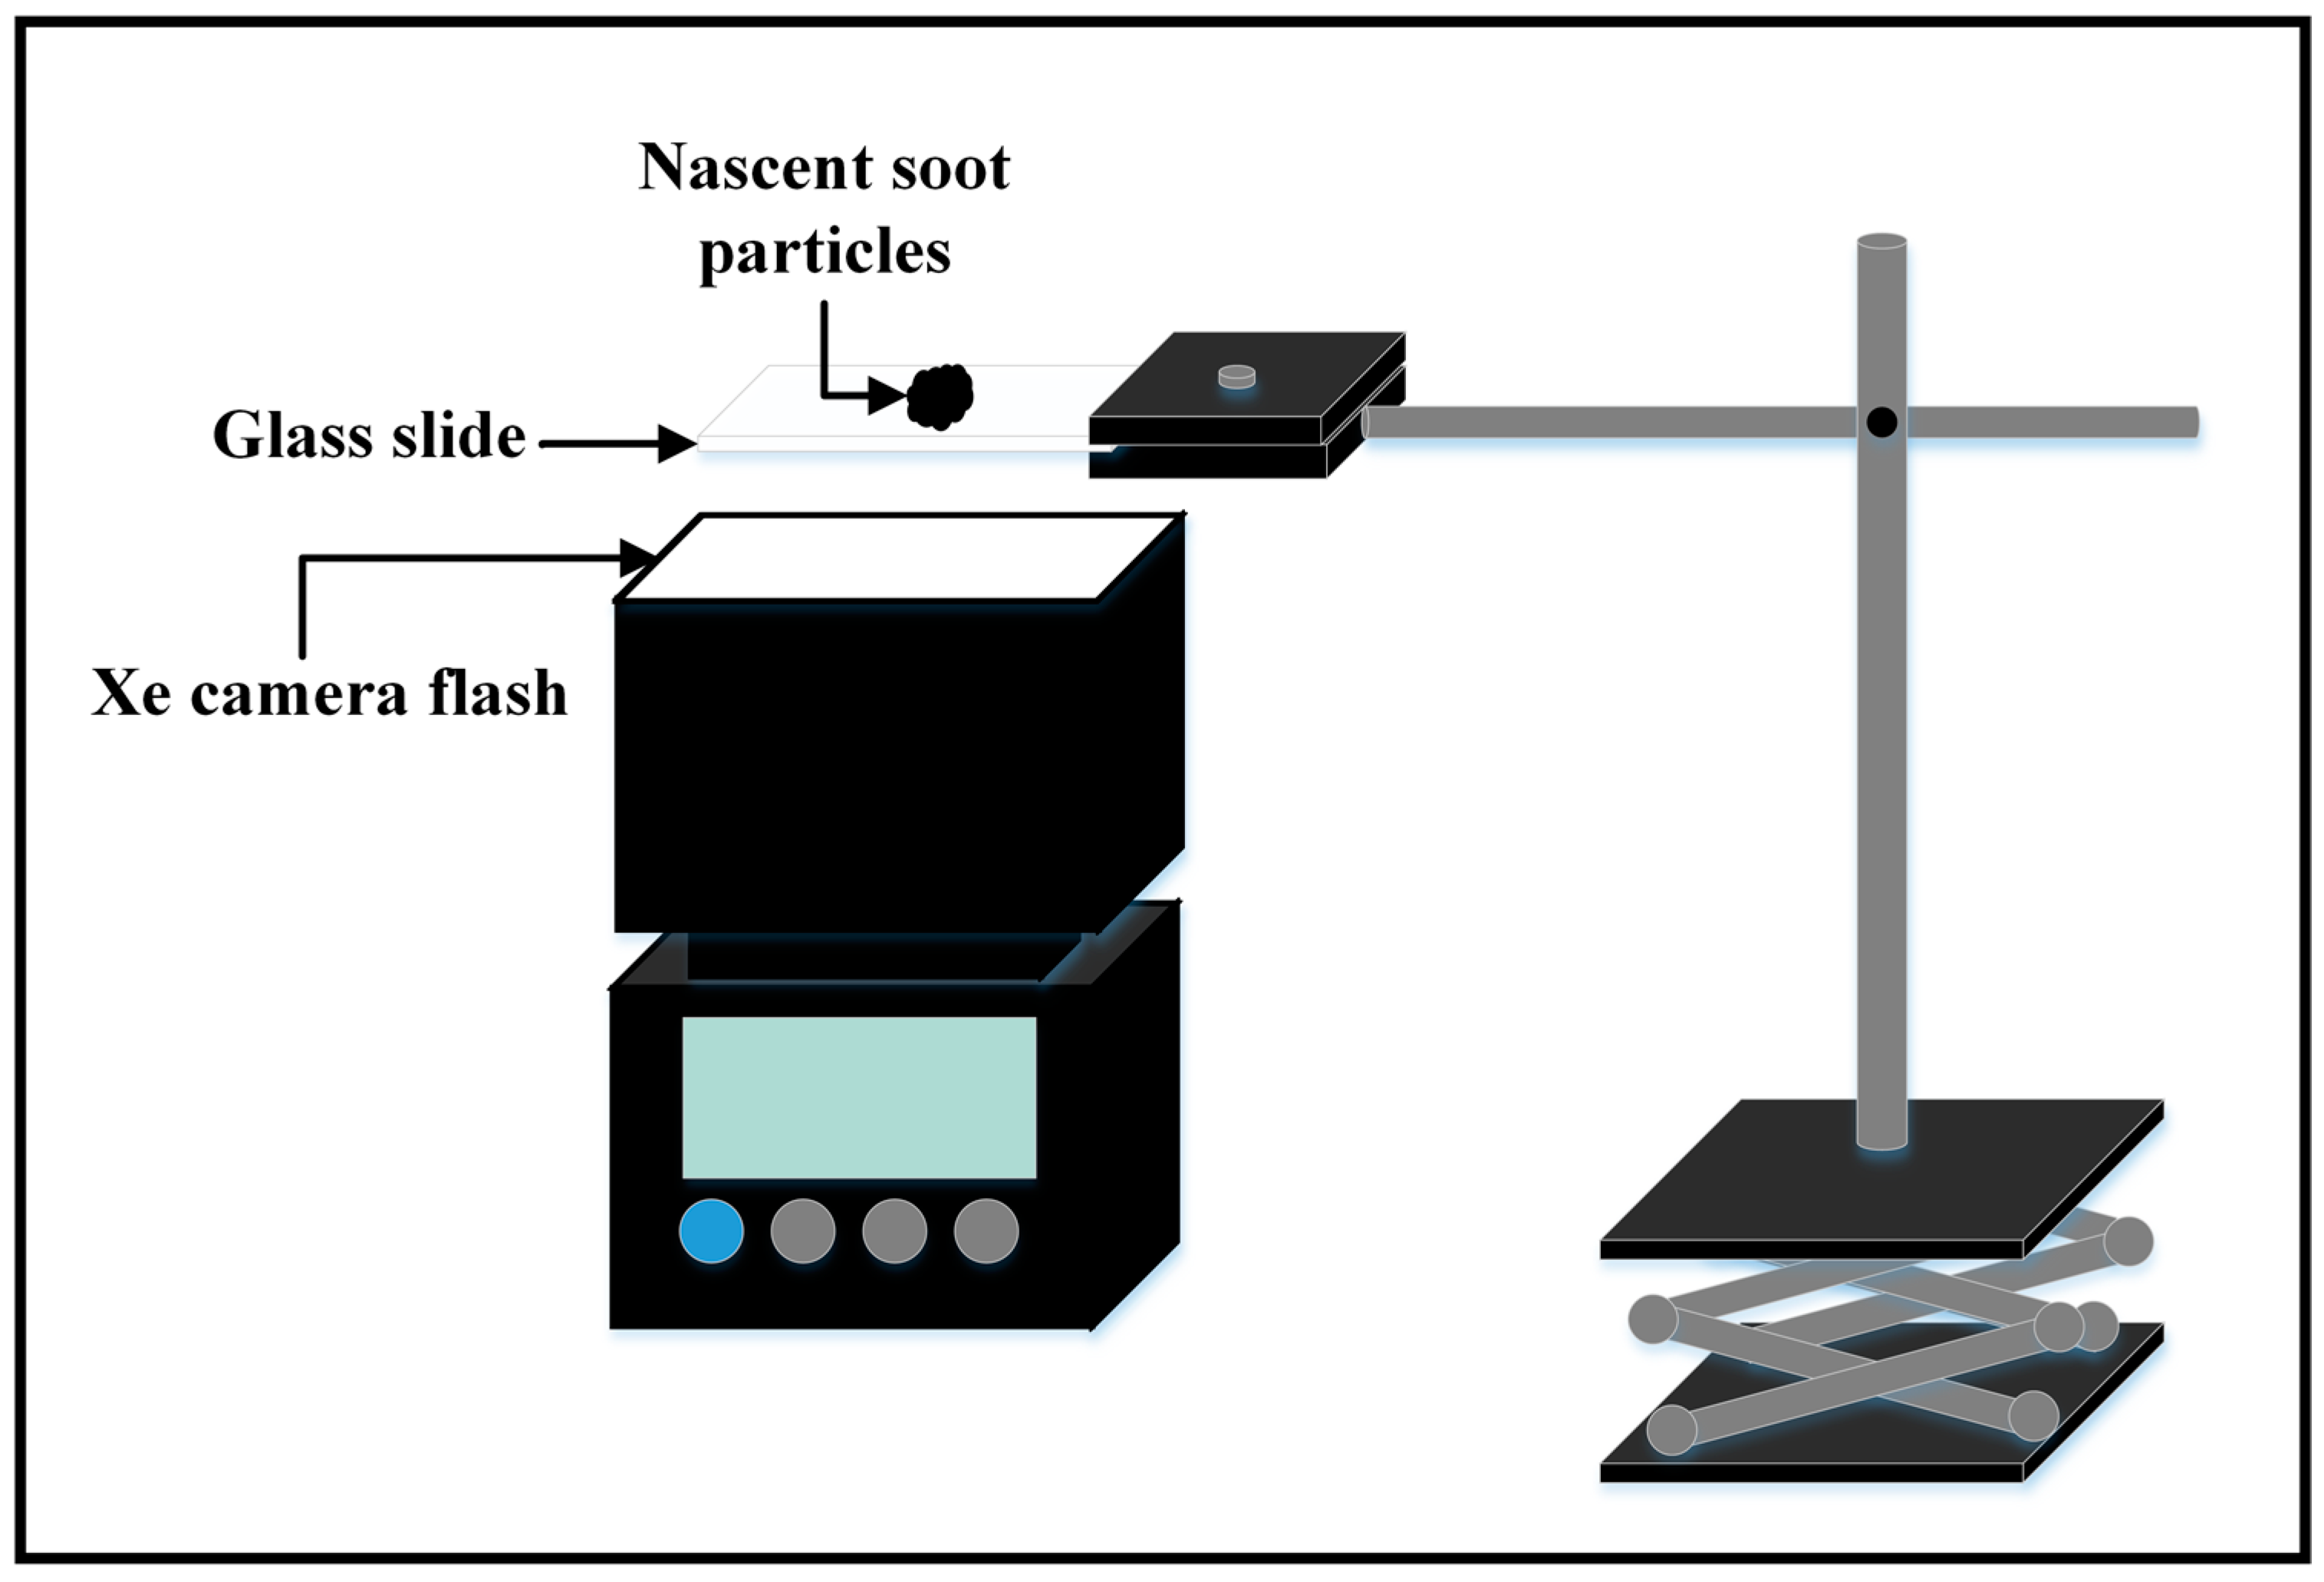
A camera flash light (Triopo 690N, Triopo, Guangzhou, China) equipped with a xenon lamp (Figure 2) was used for the flash test and the flash duration time is about 7.8 ms. The maximum areal energy density of the photoflash was about 1.97 J/cm2 per pulse. The emission spectrum (Figure 3) for the conventional xenon photoflash, which was measured by the Ocean Optics USB 2000+ (Ocean Optics, Shanghai, China) equipped with QP400-2-VIS-NIR fiber (Ocean Optics, Shanghai, China). The flashlight mainly consists of visible and infrared light. 5 mg of soot was placed on top of a 1 mm thick glass slide above the photoflash. Concerning the effects of total flash times and flash environment/atmosphere, 1 time and 20 times flash were carried out in air and argon under the ambient temperature, respectively. Nascent soot with no flash, 1 time flash and 20 times flash in air and argon were denoted as F0, Fair1, Fair20, Far1 and Far20, respectively.
2.3. Characterization
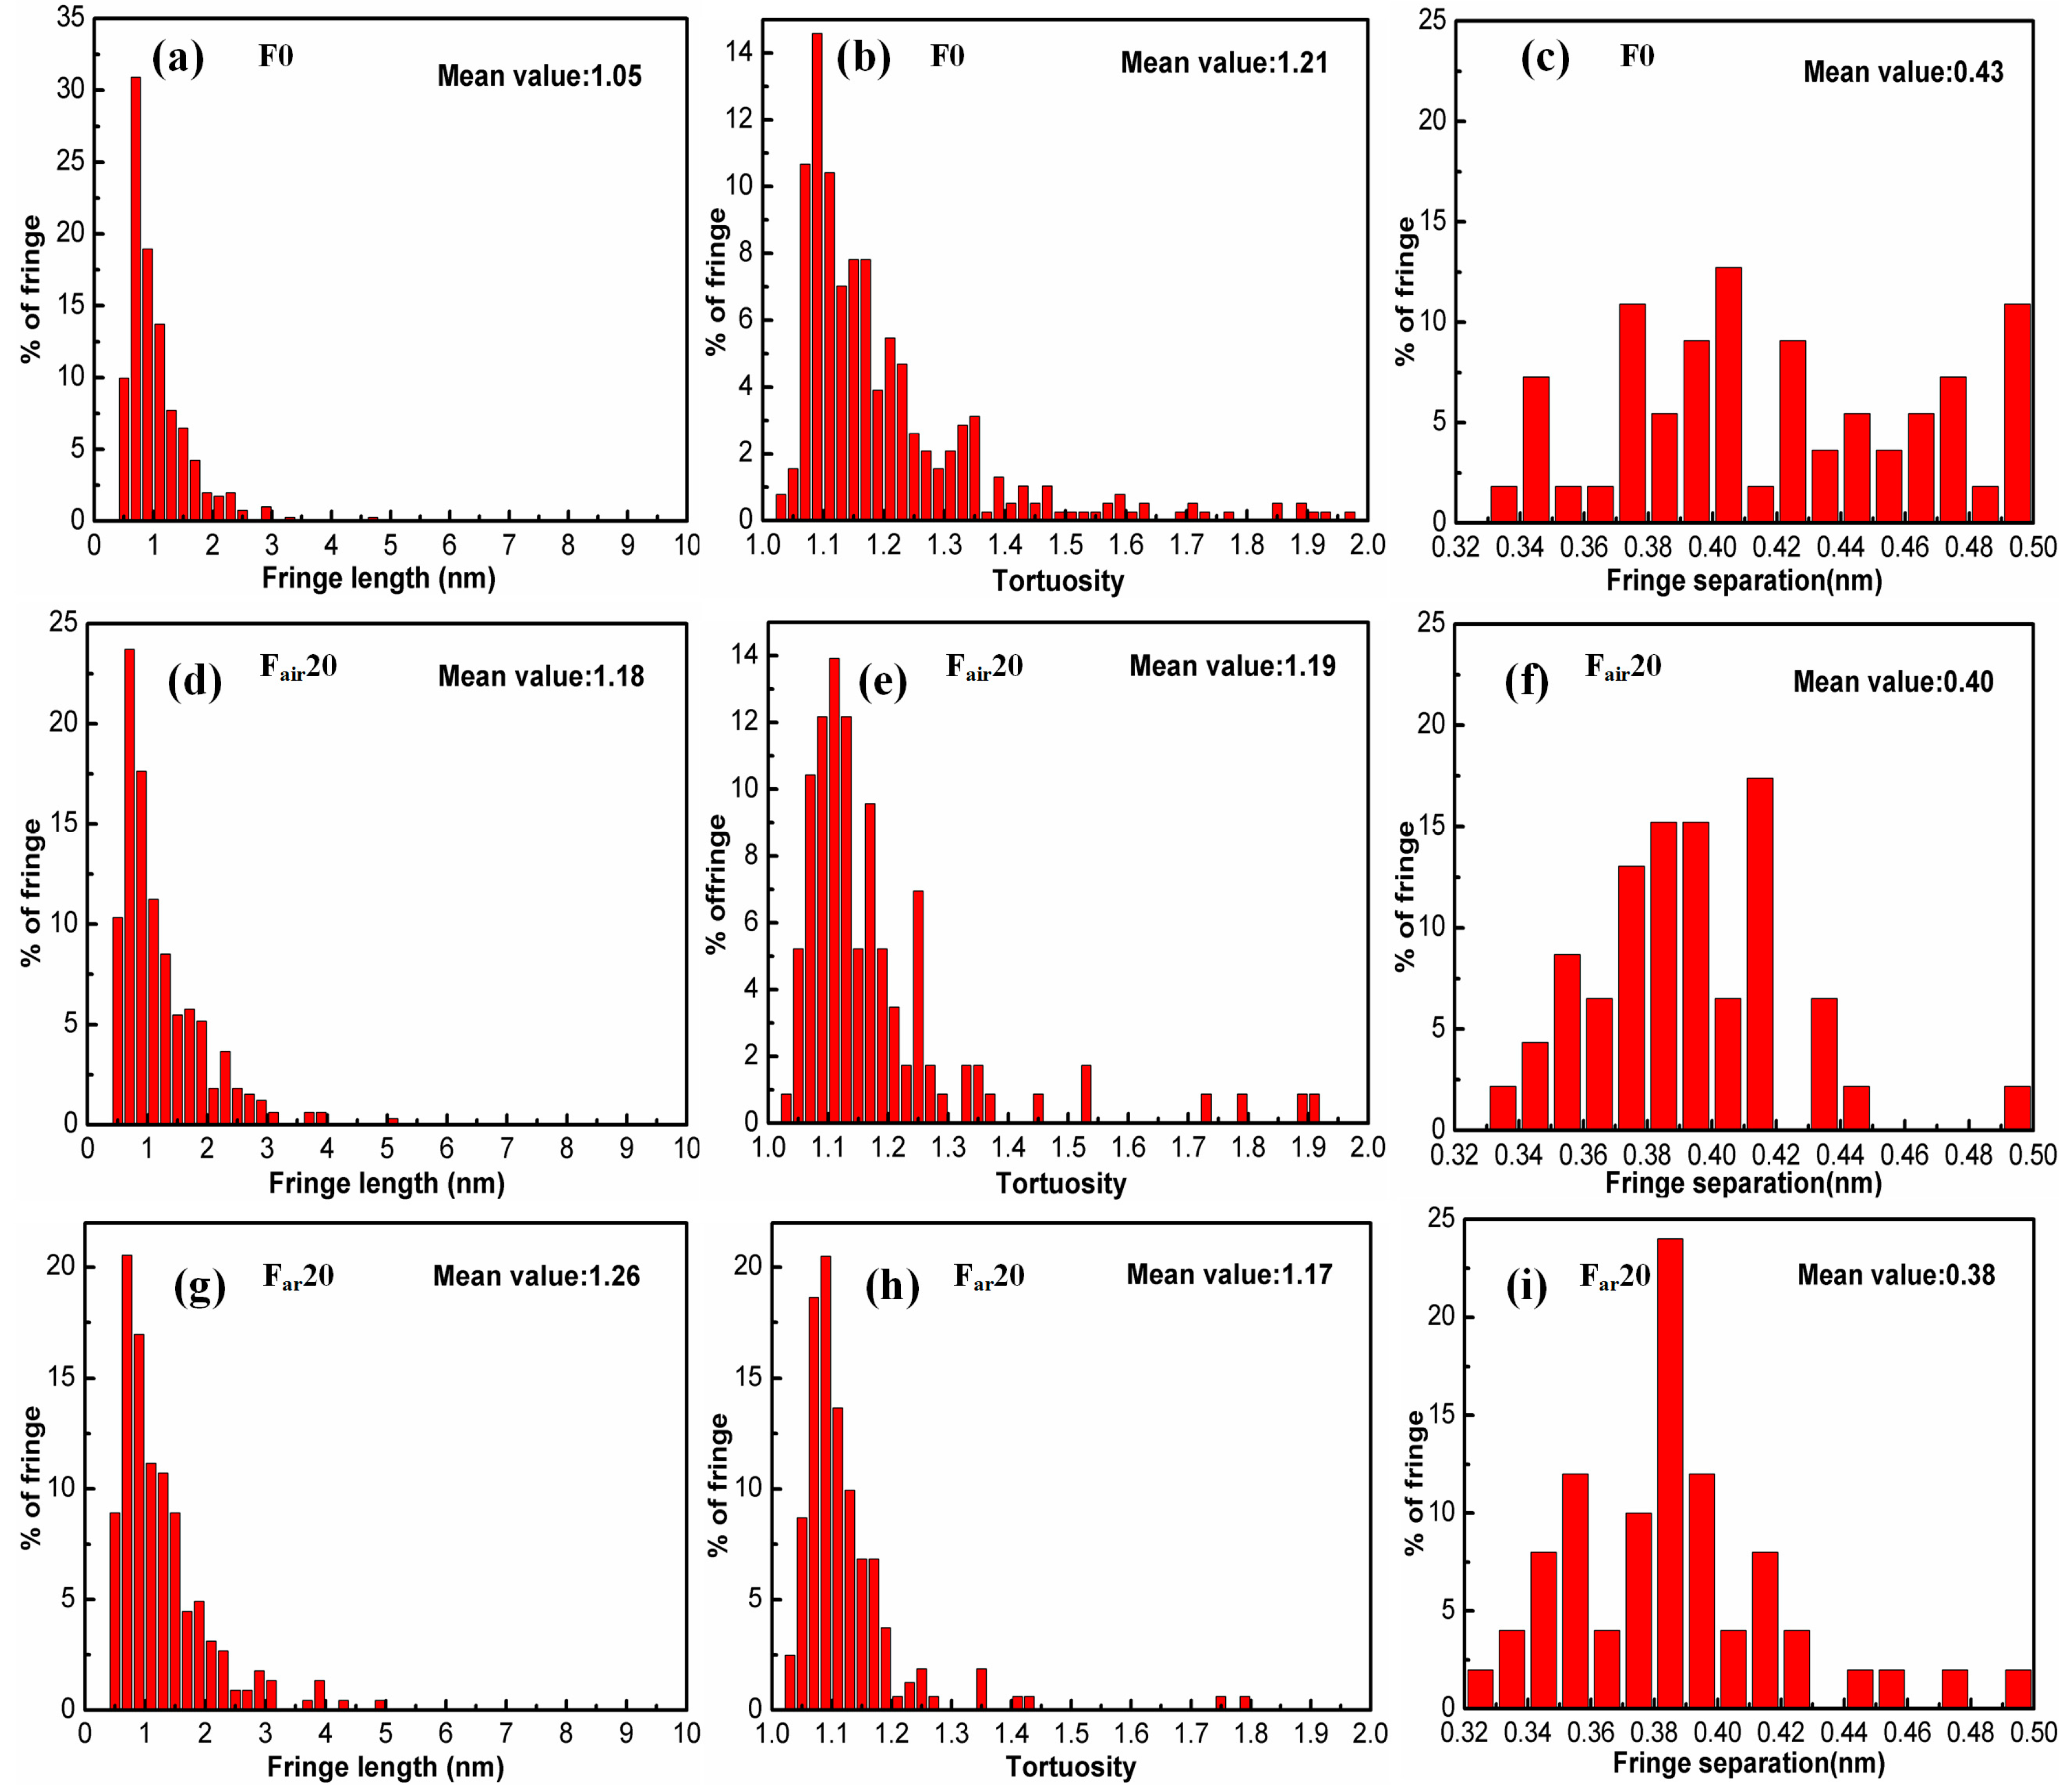
The microscopic morphology of the samples was observed using HIM taken on ZEISS ORION (Carl Zeiss AG, Oberkochen, Germany). TEM images were captured with a magnification of 43,000× and 670,000× by a FEI Titan G2 60-300 instrument (Field Emission Inc., Hillsboro, OR, USA). The HRTEM image processing was performed by homemade MATLAB analysis algorithms. The method is similar to the ones developed by Yehliu et al. [25,26] and Ying et al. [9,10]. The image processing involves several operations such as negative transformation, region of interest selection, contrast enhancement, Gaussian low pass filter, top-hat transformation, thresholding to obtain a binary image, morphological modification, skeletonization, and short fringes and boundary fringes removal. The fringe length is a measurement of the physical size of the carbon layer planes; tortuosity is a measurement of the degree of curvature for the fringe and is defined as the ratio of the actual fringe length to the straight-line distance; separation is the distance between two adjacent carbon layer planes and is defined as the vertical distance of two mutual parallel carbon crystallites. The flow chart of HRTEM image processing was presented in Figure S1. The largest standard deviation of fringe length, tortuosity and separation is 0.02 nm, 0.01 and 0.02 nm, respectively.
XRD patterns of the samples were collected using a D8 Advance X-ray diffractometer (Bruker, Karlsruhe, Germany) with CuKα radiation (1.5418 Å, 45 kV, 25 mA). The scan range of 20θ–100θ was used with scan step size of 0.05 and scan speed of 0.2 s/step.
The TPO experiments were conducted in a flow reactor (BTF-1500C, BEQ, Hefei, China), which consists of a quartz tube (100 cm long, 5 cm inner diameter) housed in a tube furnace. With a total flow rate of 400 mL/min, the samples were initially heated in N2 from 50 °C to 200 °C at a rate of 10 °C/min for water removal and then heated in O2/N2 (50% O2) stepped by 3 °C/min to 500 °C. The effluent gas was connected to a gas chromatograph (GC, Agilent 7890B, Agilent, Santa Clara, CA, USA) for composition analysis.
In order to further understand the soot oxidation reactivity and kinetics, a NETZSCH STA 449 F3 (NETZSCH, Bavarian, Germany) thermogravimetric analyzer was used. Approximate 10 mg of the soot sample was loaded in a quartz crucible and heated under O2/Ar (100 mL/min, 22% O2 + 78% Ar) from 50 °C to the desired temperature (480–550 °C) stepped by 20 °C/min. The final temperatures remained for 40 min for isothermal oxidation and the corresponding kinetics analysis.
2.4. The Calculation Processes of TGA Experiments
The kinetics of soot oxidation is typical gas-solid reaction, which can be studied by the reported kinetics models [27,28,29,30]. According to these models, the reaction rate is modeled by
where α is the mass fraction of oxidized soot, k is the rate constant of soot oxidation (min−1), and t is reaction time (min). F(α) is a function determined by the chosen mechanisms. The mt and m0 in Equation (2) are mass of the soot oxidized at any time and initially existing in the initial soot.
Seven common forms of F(α) are listed in Table 2. Appropriate forms of F(α) are determined by fitting F(α)-t. On the basis of Equation (1), a form of F(α) that gives a linear fit is an appropriate model for the N-desorption reaction (N refers to the reaction order), where the slope of the line is equal to k. The reaction rate coefficient is related to the activation energy through the Arrhenius form
where, Ea is the activation energy, R is the molar gas constant, T is the absolute temperature, and A is the frequency factor and it refers to the collision probability of particles and is related to the material physical parameters such as the morphology. The activation energy and frequency factor can be determined for a sample by making a linear fit to the relationship between lnk and 1/T.
3. Results and Discussion
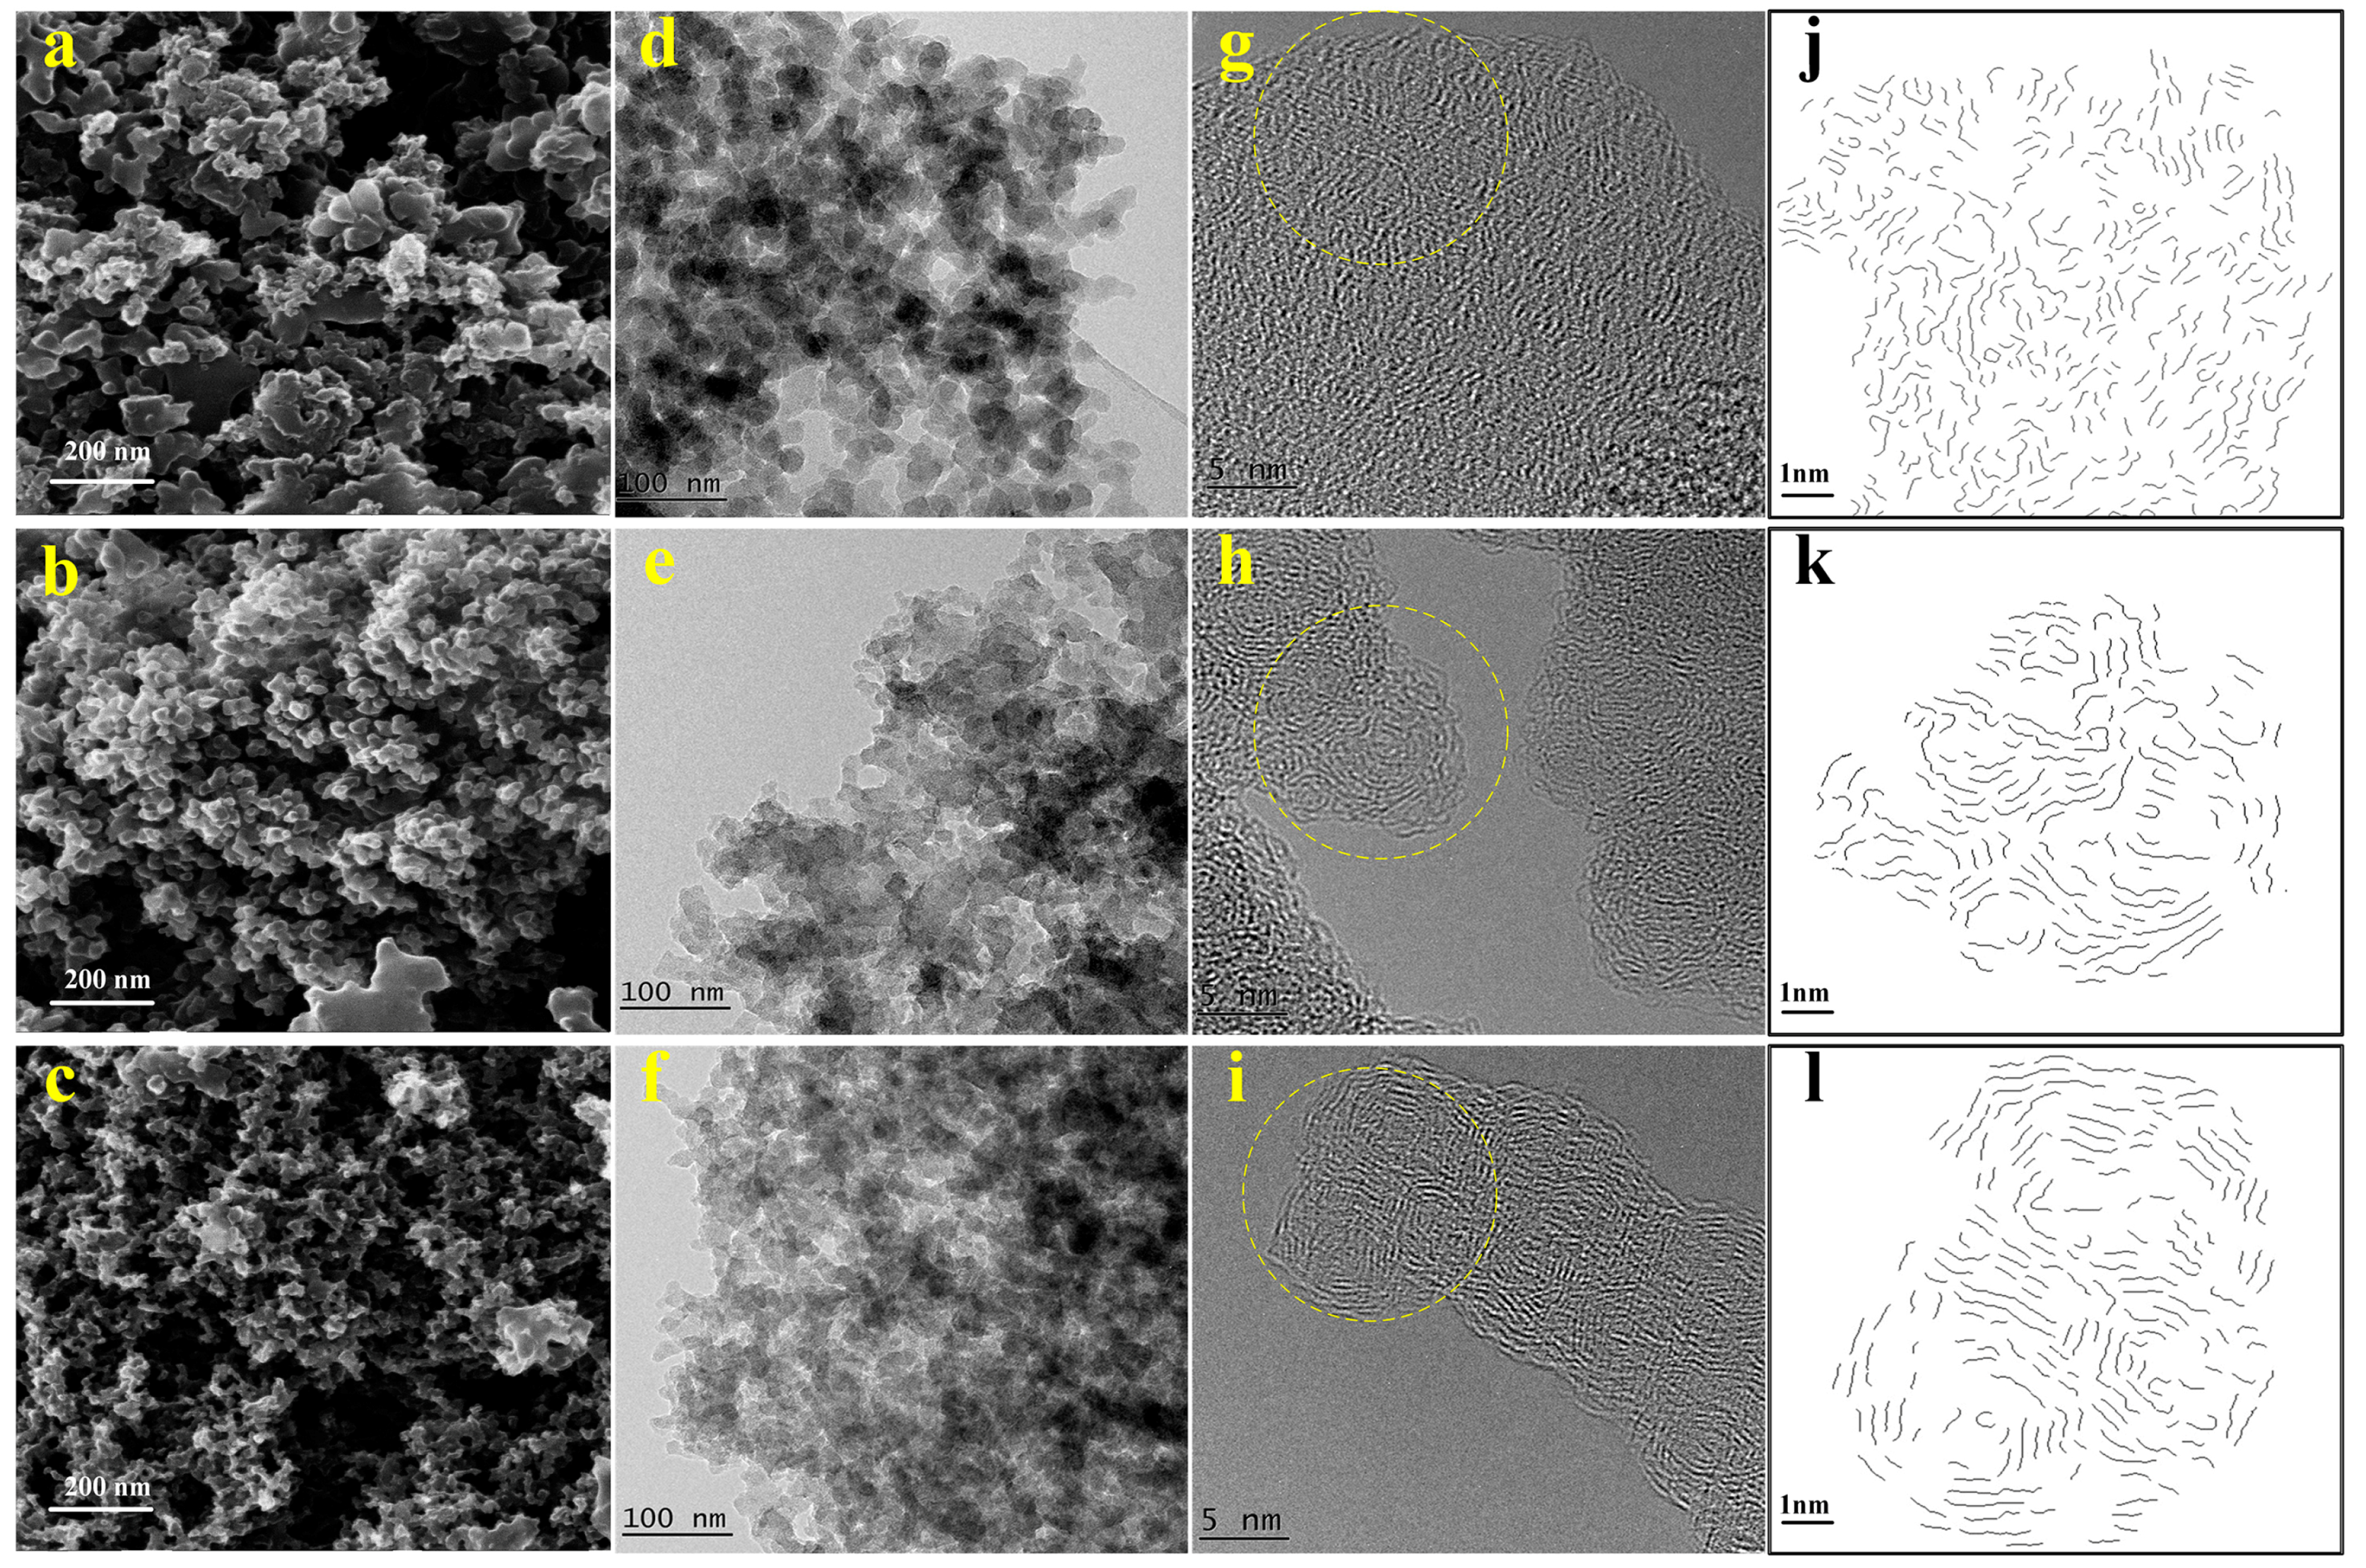
Upon the flash exposure, some pale yellow smoke, which was considered to be volatile, escaped from soot and the mass of soot Fair20 reduced about 17%. Compared with F0, morphology, nanostructure and oxidative reactivity of Fair1 and Far1 have no significant differences (Figures in Supplementary Materials). Moreover, based on the analysis of oxidation, there is no obvious difference among the soot in F0, Fair1 and Far1. Therefore, the present work is focused on the 20 time flash in air and argon, compared to F0. Figure 4 shows morphologies and nanostructures of F0, Fair20 and Far20. In numerous previous experimental investigations of flames, the primary particles covered by a film-like deposition with irregular shape were considered as nascent soot particles [9,22,23,24]. As Figure 4d shows the morphology of the soot particles from pure ethylene flames (F0), we can clearly see that particles in F0 show liquid-like materials with irregular shapes, which are partially transparent to the electron beam. As a result, we classify the particles observed in Figure 4d as nascent soot particles that are just beginning to carbonize. Figure 4a–c show the typical HIM images of F0, Fair20 and Far20. In all micrographs a large number of soot aggregates can be observed. There are differences in the particle size distribution. Among the average particle size of the three samples, F0 occupies the first place and Fair20 comes the second. It is also noted that there are many tiny particles (Figure 4e,f) in comparison with Figure 4d in the typical TEM images, which are consistent with HIM analysis. Carbon nanotubes (CNTs) can be ignited by a photoflash in the previous works [31]. Similarly, the emissivity of soot is very high and the soot samples can absorb a large amount of flash light and convert it to heat. The heat cannot be dissipated in such a short flash time and then is confined within the particles, resulting in a rapid temperature increase of soot particles. The temperature causes a large of quantity of volatile material to be released from soot. It also results in larger soot particles broken into several small particles agglomerates [32]. Figure 4g–i show the HRTEM images of three soot samples. Figure 4g, corresponding to F0, shows shorter graphitic layers with no apparent defined orientation in relation to each other. In contrast, corresponding to Fair20 and Far20, the graphitic layers are large and parallel to each other in Figure 4h,i. Therefore, the changes observed in soot should be mainly due to combinations of heating effects and photo physical processes.
To further analyze carbon morphology characteristics of the samples, lattice fringe analysis on fringe length, tortuosity and separation information derived from the corresponding skeleton images (Figure 4j–l) are summarized in Figure 5. The skeleton images (extracted from the yellow circles marked in Figure 4g–i) show the regions of interest of the primary particles and the layer within these areas as line segments in a binary image. As shown in Figure 5, there are significant differences of the fringe length, tortuosity and separation distance histograms among F0, Fair20 and Far20. F0 has the lowest mean fringe length; Fair20 and Far20 have a concentrated distribution of separation between 0.32 and 0.4 nm. From the histograms of tortuosity for these three samples, the breadth of the tortuosity distributions decreases, and the mean shifts toward smaller values, reflecting the less-amorphous structure of Fair20 and Far20. These results suggest that the nascent soot have higher graphitization degree in Fair20 and Far20 than in F0.
XRD spectra of the three samples are presented in Figure 6. The diffraction peaks shift to the right and are approaching up the band 0.02 (2θ ≈ 25) after flash exposure. It indicates that the degree of graphite in nascent soot has been increased by photoflash. This result proves the analyses above on the nanostructure of nascent soot and shows good agreement with the HRTEM results. The samples after flash in air and Ar atmosphere reveal that soot nanostructure can be reconstructed substantially without burning. In air, the flash makes the sample exhibit longer graphitic layers. Compared with air, the degree of graphitization of soot in Ar is higher. The reason may be that the thermal conductivity of air (0.023 W m−1 K−1) is higher than that of Ar (0.0177 W m−1 K−1) [17].
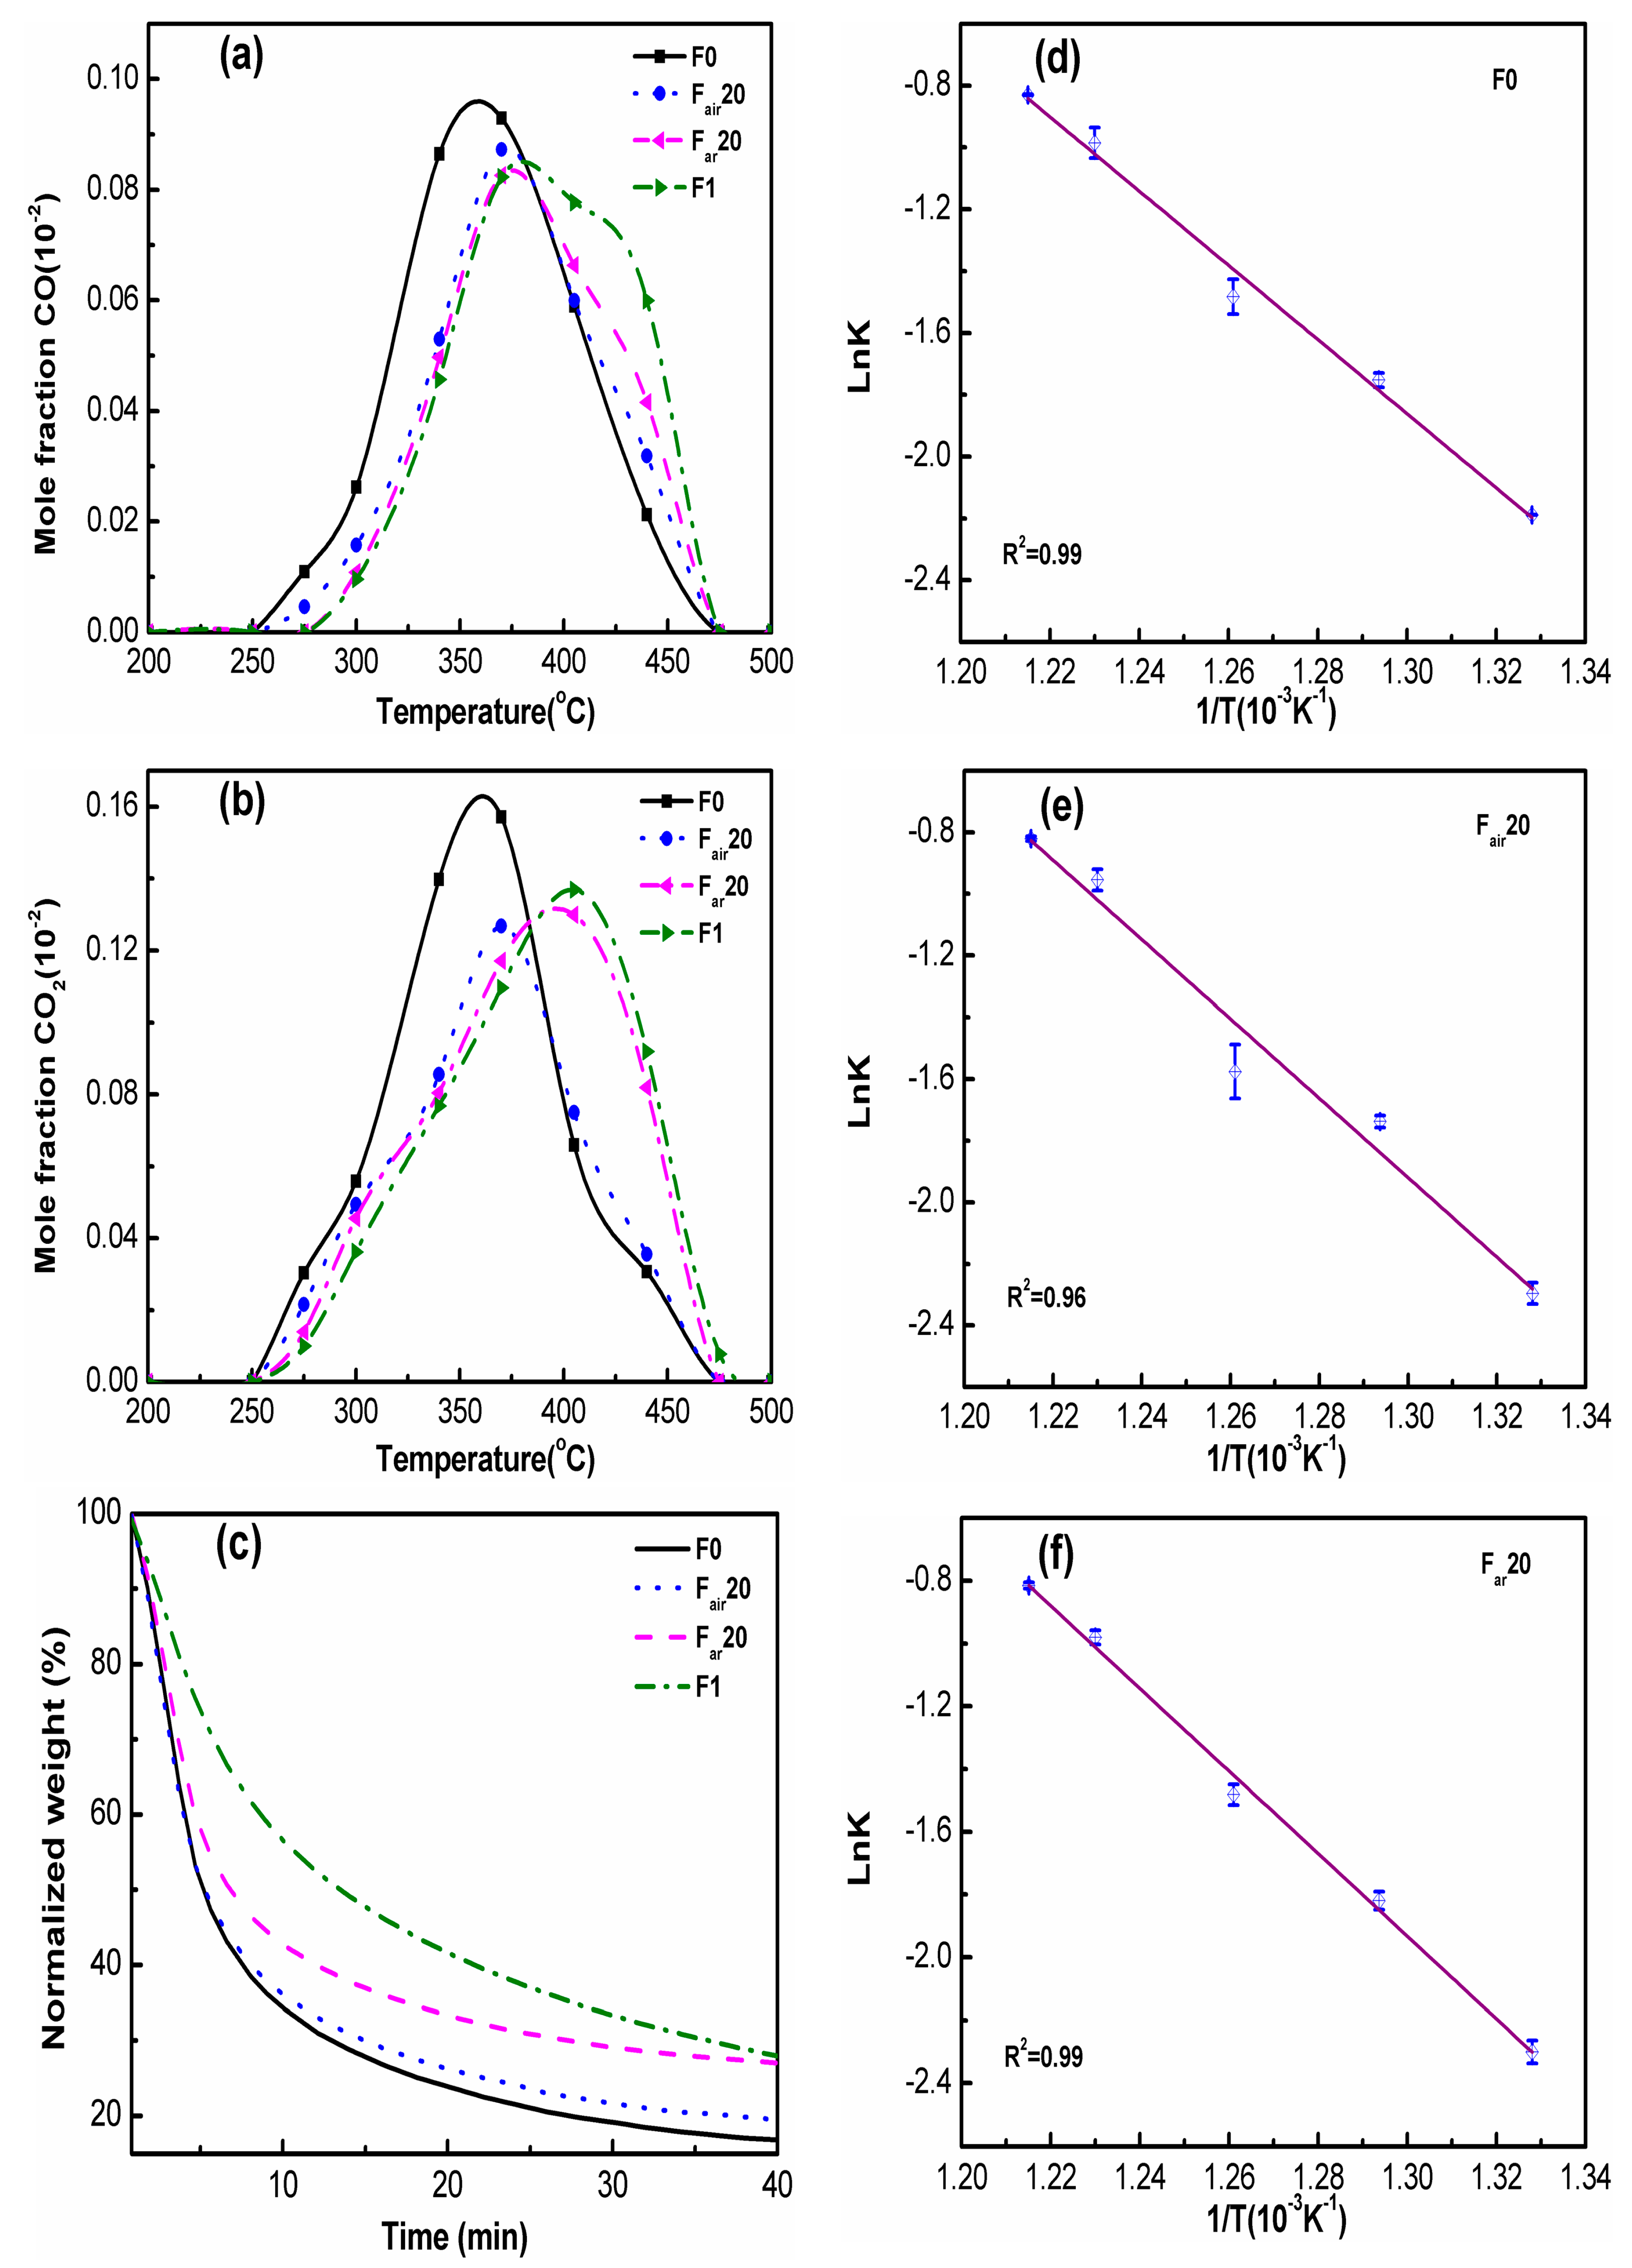
As a comparison, oxidation of nascent soot with volatile removal (denoted as F1) is analyzed by the flow-reactor and TGA. The soot sample for F1 is loaded in a quartz tube, heated under N2 (400 mL/min) at 320 °C and the temperature lasts for 60 min. Figure 7a–c show TPO in a flow-reactor and isothermal oxidation in TGA for four samples. The mole fraction peak of CO and CO2 measured by GC in TPO experiments follow the order of F0 > Fair20 > Far20 > F1 (in Figure 7a,b). It implies that the carbon conversion of F0 is larger than the other three samples at the peak value. Also, the mass loss curves of four samples in TGA at 500 °C show similar a tendency feature in Figure 7c and it indicates that the oxidation of F0 is faster than that of Fair20 and Far20. In the TGA experiments, according to the kinetic analysis, the best appropriate model F(α) is Avrami-Erofeyev model and the reaction order for the model is 1. Arrhenius plot of intrinsic rate constant for all samples are shown in Figure 7. Also, the apparent kinetic parameters including activation energies and pre-exponential factors are presented in Table 3. According to the kinetics analysis, the resulting activation energy for oxidation of the soot samples ranges from 99.39 to 108.1 kJ/mol and shows a ranking of F0 < Fair20 < Far20. As mentioned before, the longer the graphitic layer, the lower their reactivity, which confirms the oxidative reactivity of nascent soot has been reduced by the photoflash exposure.
4. Conclusions
In summary, we have investigated the role of photoflash exposure on nascent soot nanostructure and oxidative reactivity. The findings suggest that photoflash exposure can reduce the mass of nascent soot. Soot nanostructure can be reconstructed substantially without burning. After flash, the degree of soot crystallization increases while the soot reactive rate decreases and the activation energy increases. Moreover, nanostructure and oxidative reactivity of Fair20 and Far20 are different due to their different thermal conductivities.
Supplementary Materials
The following are available online at www.mdpi.com/1996-1073/10/7/961/s1, Figure S1: Flow chart of HRTEM image processing. Figure S2: HIM images, typical TEM images and HRTEM images of Fair1 and Far1. (a) HIM image of Fair1; (b) typical TEM image of Fair1; (c) HRTEM image of Fair1; (d) HIM image of Far1; (e) typical TEM image of Far1; (f) HRTEM image of Far1. Figure S3: Histograms of fringe length, tortuosity and separation for Fair1 and Far1. Figure S4: Oxidative behaviors for the three samples. (a) CO mole fraction of three samples in TPO experiments; (b) CO2 mole fraction of three samples in TPO experiments; (c) TGA results of isothermal oxidation for three samples at 500 °C.
Acknowledgments
This work was supported by the National Natural Science Foundation of China (51576100, 51506095), the Jiangsu Provincial Natural Science Foundation of China (BK20140034), the Jiangsu Provincial Innovative Project of Graduate Education (KYZZ16_0184) and the Jiangsu Provincial Project of “Six Talent Summit” (2014-XNY-002, 2015-XNY-004). HRTEM experiment was performed at Materials Characterization Facility of Nanjing University of Science and Technology by Jizi Liu.
Author Contributions
Wei Wang performed the experiments, analyzed the data and wrote the paper; Dong Liu supervised this project, designed the experiments, analyzed the data and revised the paper; Yaoyao Ying and Guannan Liu helped the experiments and analyzed the data; Ye Wu revised the paper and discussed.
Conflicts of Interest
The authors declare no conflict of interest.
References
- Ramanathan, V.; Carmichael, G. Global and regional climate changes due to black carbon. Nat. Geosci. 2008, 1, 221–227. [Google Scholar] [CrossRef]
- Chameides, W.L.; Bergin, M. Soot takes center stage. Science 2002, 297, 2214–2215. [Google Scholar] [CrossRef] [PubMed]
- Mattarelli, E.; Rinaldini, C.A.; Savioli, T. Combustion Analysis of a Diesel Engine Running on Different Biodiesel Blends. Energies 2015, 8, 3047–3057. [Google Scholar] [CrossRef]
- Giakoumis, E.G.; Zachiotis, A.T. Investigation of a Diesel-Engined Vehicle’s Performance and Emissions during the WLTC Driving Cycle—Comparison with the NEDC. Energies 2017, 10, 240. [Google Scholar] [CrossRef]
- Yoon, S.H.; Han, S.C.; Lee, C.S. Effects of High EGR Rate on Dimethyl Ether (DME) Combustion and Pollutant Emission Characteristics in a Direct Injection Diesel Engine. Energies 2013, 6, 5157–5167. [Google Scholar] [CrossRef]
- Yan, W.; Chen, D.; Yang, Z.; Yan, E.; Zhao, P. Measurement of Soot Volume Fraction and Temperature for Oxygen-Enriched Ethylene Combustion Based on Flame Image Processing. Energies 2017, 10, 750. [Google Scholar] [CrossRef]
- De Falco, G.; Moggia, G.; Sirignano, M.; Commodo, M.; Minutolo, P.; D’Anna, A. Exploring Soot Particle Concentration and Emissivity by Transient Thermocouples Measurements in Laminar Partially Premixed Coflow Flames. Energies 2017, 10, 232. [Google Scholar] [CrossRef]
- Seong, H.J.; Boehman, A.L. Studies of soot oxidative reactivity using a diffusion flame burner. Combust. Flame 2012, 159, 1864–1875. [Google Scholar] [CrossRef]
- Ying, Y.; Xu, C.; Liu, D.; Jiang, B.; Wang, P.; Wang, W. Nanostructure and Oxidation Reactivity of Nascent Soot Particles in Ethylene/Pentanol Flames. Energies 2017, 10, 122. [Google Scholar] [CrossRef]
- Ying, Y.; Liu, D. Effects of butanol isomers additions on soot nanostructure and reactivity in normal and inverse ethylene diffusion flames. Fuel 2017, 205, 109–129. [Google Scholar] [CrossRef]
- Vander Wal, R.L.; Yezerets, A.; Currier, N.W.; Kim, D.H.; Wang, C.M. HRTEM Study of diesel soot collected from diesel particulate filters. Carbon 2007, 45, 70–77. [Google Scholar] [CrossRef]
- Vander Wal, R.L.; Tomasek, A.J. Soot Nanostructure: Definition, Quantification and Implications. SAE Trans. 2005, 114, 429–436. [Google Scholar]
- Raj, A.; Yang, S.Y.; Cha, D.; Tayouo, R.; Chung, S.H. Structural effects on the oxidation of soot particles by O2: Experimental and theoretical study. Combust. Flame 2013, 160, 1812–1826. [Google Scholar] [CrossRef]
- Choi, M.; Altman, I.S.; Kim, Y.J.; Pikhista, P.V.; Lee, S.T.; Jeong, G.S.; Yoo, J.B. Formation of Shell-Shaped CNPs Above a Critical Laser Power in Irradiated Acetylene. Adv. Mater. 2004, 16, 1721–1725. [Google Scholar] [CrossRef]
- Medwell, P.R.; Nathan, G.J.; Chan, Q.N.; Alwahabi, Z.T.; Dally, B.B. The influence on the soot distribution within a laminar flame of radiation at fluxes of relevance to concentrated solar radiation. Combust. Flame 2011, 158, 1814–1821. [Google Scholar] [CrossRef]
- Wang, C.; Chan, Q.N.; Kook, S.; Hawkes, E.R.; Lee, J.; Medwell, P.R. External irradiation effect on the growth and evolution of in-flame soot species. Carbon 2016, 102, 161–171. [Google Scholar] [CrossRef]
- Ajayan, P.M.; Terrones, M.; de la Guardia, A.; Huc, V.; Grobert, N.; Wei, B.Q.; Lezec, H.; Ramanath, G.; Ebbesen, T.W. Nanotubes in a flash--ignition and reconstruction. Science 2002, 296, 705. [Google Scholar] [CrossRef] [PubMed]
- Kim, J.H.; Kim, S.B.; Choi, M.G.; Kim, D.H.; Kim, K.T.; Lee, H.M.; Lee, H.W.; Kim, J.M.; Kim, S.H. Flash-ignitable nanoenergetic materials with tunable underwater explosion reactivity: The role of sea urchin-like carbon nanotubes. Combust. Flame 2015, 162, 1448–1454. [Google Scholar] [CrossRef]
- Ohkura, Y.; Rao, P.M.; Zheng, X. Flash ignition of Al nanoparticles: Mechanism and applications. Combust. Flame 2011, 158, 2544–2548. [Google Scholar] [CrossRef]
- Cote, L.J.; Cruzsilva, R.; Huang, J. Flash Reduction and Patterning of Graphite Oxide and Its Polymer Composite. J. Am. Chem. Soc. 2009, 131, 11027–11032. [Google Scholar] [CrossRef] [PubMed]
- Xiang, X.; Xiang, S.-B.; Wang, Z.; Wang, X.; Hua, G. Photo-responsive behaviors and structural evolution of carbon-nanotube-supported energetic materials under a photoflash. Mater. Lett. 2012, 88, 27–29. [Google Scholar] [CrossRef]
- Velásquez, M.; Mondragón, F.; Santamaría, A. Chemical characterization of soot precursors and soot particles produced in hexane and diesel surrogated using an inverse diffusion flame burner. Fuel 2013, 104, 684–690. [Google Scholar] [CrossRef]
- Blevins, L.G.; Fletcher, R.A.; Benner, B.A., Jr.; Steel, E.B.; Mulholland, G.W. The existence of young soot in the exhaust of inverse diffusion flames. Proc. Combust. Inst. 2002, 29, 2325–2333. [Google Scholar] [CrossRef]
- Santamaría, A.; Yang, N.; Eddings, E.; Mondragón, F. Chemical and morphological characterization of soot and soot precursors generated in an inverse diffusion flame with aromatic and aliphatic fuels. Combust. Flame 2010, 157, 33–42. [Google Scholar] [CrossRef]
- Yehliu, K.; Vander Wal, R.L.; Boehman, A.L. Development of an HRTEM image analysis method to quantify carbon nanostructure. Combust. Flame 2011, 158, 1837–1851. [Google Scholar] [CrossRef]
- Yehliu, K.; Vander Wal, R.L.; Boehman, A.L. A comparison of soot nanostructure obtained using two high resolution transmission electron microscopy image analysis algorithms. Carbon 2011, 49, 4256–4268. [Google Scholar] [CrossRef]
- Mendiara, T.; Alzueta, M.U.; Millera, A.; Bilbao, R. Oxidation of Acetylene Soot Influence of Oxygen Concentration. Energ. Fuel 2007, 21, 3208–3215. [Google Scholar] [CrossRef]
- Mendiara, T.; Alzueta, M.U.; Millera, A.; Bilbao, R. Acetylene soot reaction with NO in the presence of CO. J. Hazard. Mater. 2009, 166, 1389–1394. [Google Scholar] [CrossRef] [PubMed]
- Dutcher, B.; Fan, M.; Leonard, B.; Dyar, M.D.; Tang, J.; Speicher, E.A.; Liu, P.; Zhang, Y. Use of Nanoporous FeOOH as a Catalytic Support for NaHCO3 Decomposition Aimed at Reduction of Energy Requirement of Na2CO3/NaHCO3 Based CO2 Separation Technology. J. Phys. Chem. C 2011, 115, 15532–15544. [Google Scholar] [CrossRef]
- Zouaoui, N.; Labaki, M.; Jeguirim, M. Diesel soot oxidation by nitrogen dioxide, oxygen and water under engine exhaust conditions: Kinetics data related to the reaction mechanism”. C. R. Chim. 2014, 17, 672–680. [Google Scholar] [CrossRef]
- Tseng, S.H.; Tai, N.H. Variations in the microstructure and electrical resistance of the SWCNT films under consecutive photoflash exposures. Carbon 2010, 48, 1652–1661. [Google Scholar] [CrossRef]
- Inagaki, M.; Kang, F. Materials Science and Engineering of Carbon: Fundamentals, 2nd ed.; Tsinghua University Press: Beijing, China, 2014; pp. 219–525. [Google Scholar]
Figure 1.
Schematic diagram of IDF experimental system.

Figure 2.
Schematic diagram of flash-exposure experimental setup.

Figure 3.
The emission spectrum for the conventional xenon photoflash.
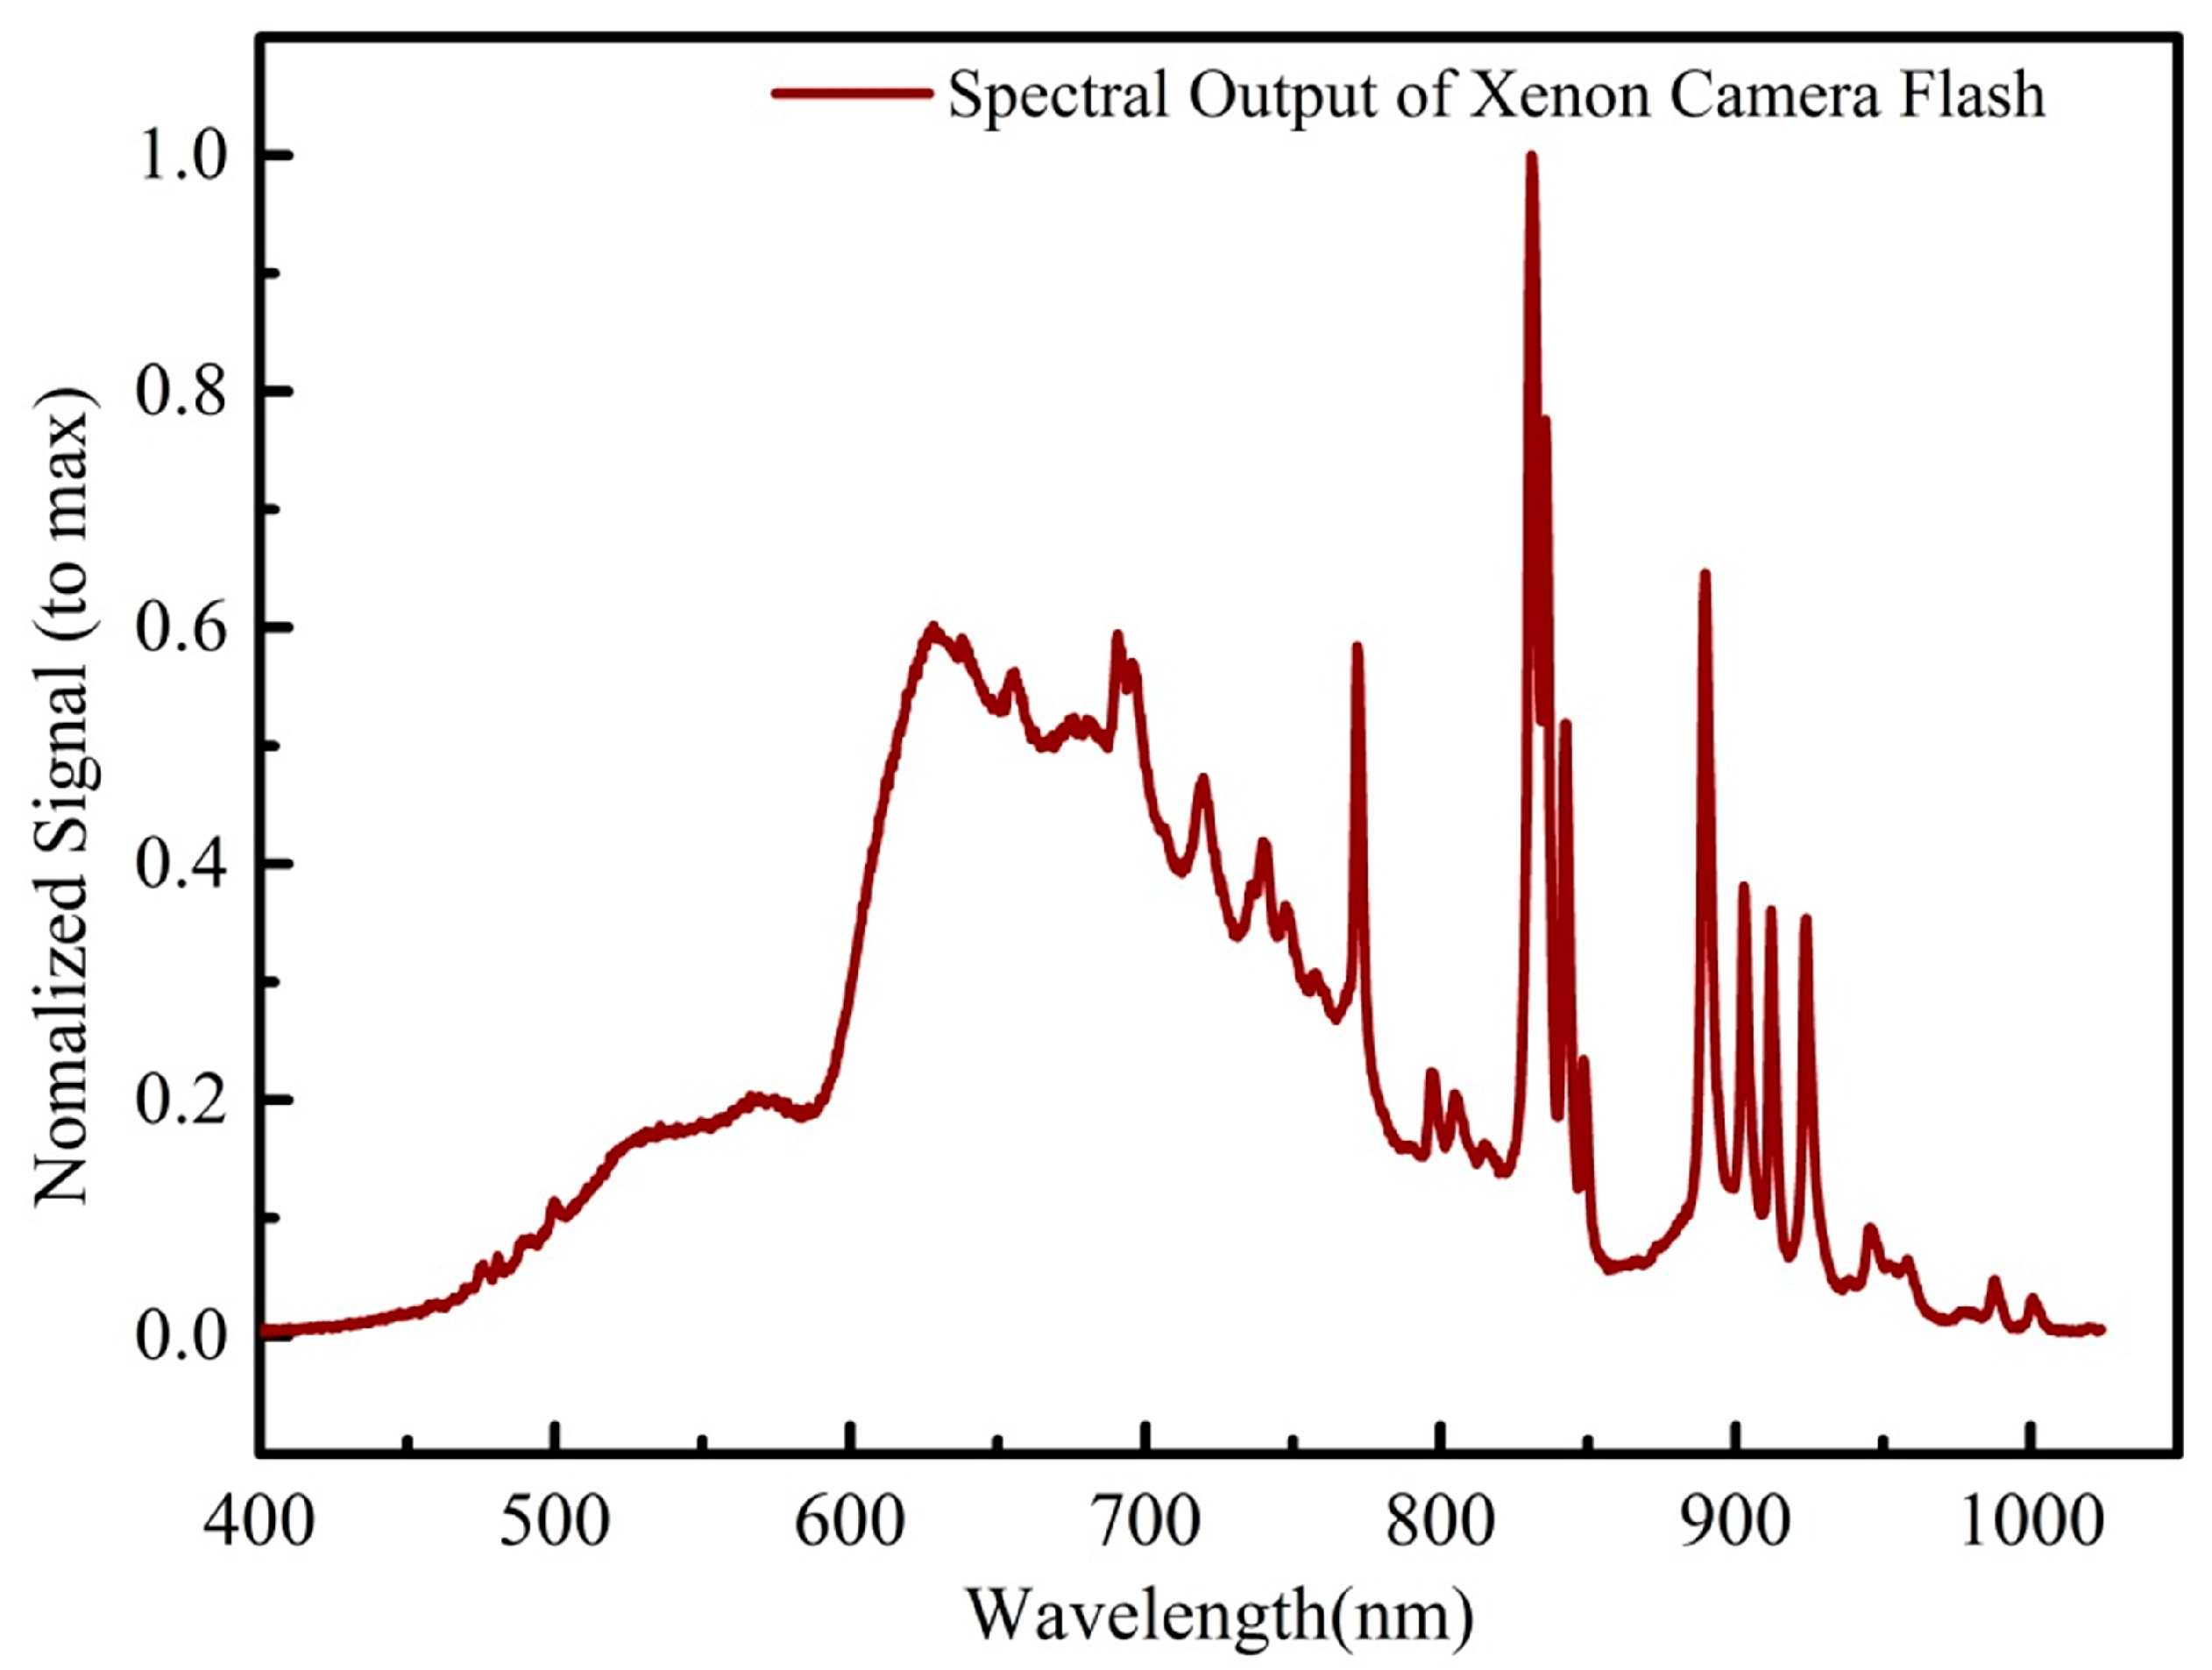
Figure 4.
HIM images, typical TEM images and HRTEM images of F0, Fair20 and Far20. (a) HIM image of F0; (b) HIM image of Fair20; (c) HIM image of Far20; (d) typical TEM image of F0; (e) typical TEM image of Fair20; (f) typical TEM image of Far20; (g) HRTEM image of F0; (h) HRTEM image of Fair20; (i) HRTEM image of Far20; (j) the skeleton image of F0; (k) the skeleton image of Fair20; (l) the skeleton image of Far20.

Figure 5.
Histograms of fringe length, tortuosity and separation for F0, Fair20 and Far20 derived from the corresponding skeleton images: (a) Histograms of fringe length for F0; (b) Histograms of tortuosity for F0; (c) Histograms of separation for F0; (d) Histograms of fringe length for Fair20; (e) Histograms of tortuosity for Fair20; (f) Histograms of separation for Fair20; (g) Histograms of fringe length for Far20; (h) Histograms of tortuosity for Far20; (i) Histograms of separation for Far20.

Figure 6.
XRD spectra of F0, Fair20 and Far20.

Figure 7.
Oxidative behaviors and Arrhenius plot of intrinsic rate constant for samples. (a) CO mole fraction of four samples in TPO experiments; (b) CO2 mole fraction of four samples in TPO experiments; (c) TGA results of isothermal oxidation for four samples at 500 °C; (d) Arrhenius plot of intrinsic rate constant for F0; (e) Arrhenius plot of intrinsic rate constant for Fair20; (f) Arrhenius plot of intrinsic rate constant for Far20.


Table 1.
Experimental conditions in inverse diffusion flame.
| Gas | Gas Flow Rate (L/min) | |
|---|---|---|
| IDF | C2H4 | 0.7 |
| Air | 0.7 | |
| N2 (Carrier) | 0.7 | |
| N2 (Protector) | 13 |
Table 2.
Seven Common Forms of F(α) a.
| Model Type (Based on Mechanism) | Symbol | F(α) |
|---|---|---|
| 1D diffusion | D1 | α2 |
| 2D diffusion | D2 | α + (1 − α)ln(1 − α) |
| 3D diffusion | D3 | [1 − (1 − α)1/3]2 |
| Ginstling-Brounshtein | D4 | 1 − (2/3)α − (1 − α)2/3 |
| Prout-Tompkins | Au | ln(αn(α − α)) |
| contracting surface/volume | Rn | 1 − (1 − α)1/n |
| Avrami-Erofeyev | Am | [− ln(1 − α)]1/m |
a The values of n and m are reaction orders.
Table 3.
Apparent kinetic parameters from Arrhenius plot from isothermal oxidation in TGA under different temperatures.
Table 3.
Apparent kinetic parameters from Arrhenius plot from isothermal oxidation in TGA under different temperatures.
| Sample | Ea (kJ/mol) | A (min−1) | R2 |
|---|---|---|---|
| F0 | 99.39 ± 1.86 | 8.7 × 10⁵ | 0.99 |
| Fair20 | 106.79 ± 2.14 | 2.6 × 10⁶ | 0.96 |
| Far20 | 108.10 ± 1.25 | 3.2 × 10⁶ | 0.99 |
© 2017 by the authors. Licensee MDPI, Basel, Switzerland. This article is an open access article distributed under the terms and conditions of the Creative Commons Attribution (CC BY) license (http://creativecommons.org/licenses/by/4.0/).
Share and Cite
MDPI and ACS Style
Wang, W.; Liu, D.; Ying, Y.; Liu, G.; Wu, Y. On the Response of Nascent Soot Nanostructure and Oxidative Reactivity to Photoflash Exposure. Energies 2017, 10, 961. https://doi.org/10.3390/en10070961
AMA Style
Wang W, Liu D, Ying Y, Liu G, Wu Y. On the Response of Nascent Soot Nanostructure and Oxidative Reactivity to Photoflash Exposure. Energies. 2017; 10(7):961. https://doi.org/10.3390/en10070961
Chicago/Turabian StyleWang, Wei, Dong Liu, Yaoyao Ying, Guannan Liu, and Ye Wu. 2017. "On the Response of Nascent Soot Nanostructure and Oxidative Reactivity to Photoflash Exposure" Energies 10, no. 7: 961. https://doi.org/10.3390/en10070961
Note that from the first issue of 2016, this journal uses article numbers instead of page numbers. See further details here.