1. Introduction
The growing demand for advanced internal combustion engines (ICEs) in automobiles, caused by several reasons, such as fuel economy, better performance, lower emissions, etc., has paved the way for the introduction of technologies such as turbochargers and superchargers [
1,
2,
3,
4,
5]. Turbocharging is the process of using the kinetic energy of the exhaust gases to run a turbine coupled with a compressor to allow extra intake of air, thereby improving the efficiency and power output [
6,
7,
8,
9,
10]. Turbochargers have found its way into automotive and motorsport industries and gradual developments and optimization techniques have been implemented. Several methods have been adopted to improve the efficiency of a diesel engine, in terms of fuel consumption, efficiency, etc. The most common methods that are adopted for this purpose are as follows [
11,
12,
13,
14,
15,
16,
17,
18,
19,
20]:
Rankine cycle: working medium is steam or any organic fluid with additional power obtained from expanders [
21,
22].
Thermoelectric Generators: exhaust gas heat is directly converted into electric power by the phenomenon of thermoelectricity.
Turbocompounding: Using an additional power turbine after the turbocharger (mechanical turbocompounding) or coupling an electric generator (electrical turbocompounding) to extract excess power lost through exhaust.
The organic Rankine cycle (ORC) system uses a series of devices in order to supply additional energy to the engine and improve its thermal efficiency. It consists of a heat exchanger that the hot gases pass through and increases the temperature of the working fluid to an extent that it changes state from liquid to superheated vapor. After the evaporator, the working fluid expands isentropically providing work in an expansion device, which is connected to an electric generator. Then the expanded vapor passes through a condenser to change its state to liquid and reaches the pump to repeat the whole process from the beginning. Theoretically, the ORC systems can offer several benefits to the whole powertrain configuration; in the best way power output of the powertrain can be increased around 15% depending on each engine scenario. As a consequence of the increased efficiency of the engine, the fuel consumption can be decreased by the respective percentage, making the ORC systems desirable for various applications [
23,
24].
Turbocompounding is the process of recovering exhaust heat by the addition of technology in a turbocharged engine. The addition may be in the form of power turbine to extract mechanical power from the exhaust gas, which is called as mechanical turbocompounding. Alternatively, an electrical generator can be coupled to the turbocharger from which energy can be harnessed and stored in batteries, which is called as electrical turbocompounding [
25,
26,
27]. In mechanical turbocompounding, a power turbine is added downstream of the turbocharger and is coupled to the engine through a crankshaft via a gear unit. In order to reduce, mechanical losses due to the usage of gear units, electrical generators may also be used to harness the energy. In case of electrical turbocompounding, instead of using an additional power turbine, generator motors are used to which produces electrical power from the additional mechanical power in the turbine. Both mechanical and electrical turbocompounding are beneficial to the engine performance in terms of fuel consumption and emissions [
28,
29,
30]. Many heavy duty OEMs such as Caterpillar, IVECO USA. Cummins and SCANIA have tested in the past turbocompounding technology, which was found to improve BSFC from 3% to 6%, depending on the engine load conditions [
21,
22,
31,
32,
33]. A more recent study validates that a highly efficient turbocompounding system can improve BSFC in the range of 3.3–6.5% [
34]. Turbocompounding will play a significant role in better utilization of the exhaust gas energy, thereby improving the efficiency of the engine. Turbocompounding has also paved way into the motorsport industry through Formula One vehicle technology, etc. owing to its better utilization of fuel, which subsequently improves the fuel economy [
35,
36,
37]. The potential efficiency benefit from turbocompounding can significantly exceed 6% on a theoretical base, but it is limited due to the high exhaust backpressure caused by the turbocompounding. The increased pumping losses of the engine result in an additional penalty on fuel consumption that compromises the total engine net efficiency [
38].
ORC is an alternative waste heat recovery (WHR) solution that in recent years has been gaining ground in automotive industry due to stricter legislation emission standards, in order to extend the goal of 50% brake thermal efficiency. The Rankine cycle is a closed cycle where the working fluid exchanges heat with a hot medium in an evaporator at constant pressure. The evaporated fluid then expands in an expander and produces the power output of the system. After the expansion process the working media is condensed at constant pressure, and then pumped again to the evaporator. On a theoretical base, an integrated ORC system in the powertrain of a vehicle can increase thermal efficiency from 6% up to 15% [
34,
39,
40,
41]. The level of the thermal efficiency is related with the quality (temperature range) and quantity (mass flow rate) of the heat sources and the engine conditions. Exhaust gases are a grade heat source of high quality and quantity to extract energy through a heat exchanger for an ORC system. The implementation of a heat exchanger in the exhaust manifold increases backpressure, but compared to the turbocompounding technology this increment is approximately one order of magnitude lower [
38]. Although both turbocompounding and ORC WHR systems have been investigated in many studies in the past, literature comparing these two technologies is limited [
8,
9,
13,
17,
18,
21,
32,
34,
36,
37,
38].
This study aims to investigate the effect of utilizing of ORC heat recovery system and turbocompounding on the performance of a turbocharged diesel engine using a detailed simulation study in GT-Power software and to discuss about advantages and disadvantages of operating the engine with both the technologies at different operating regions (e.g., engine speed and BMEP).
2. Engine Modeling and Calibration
A 6-cylinder heavy-duty diesel engine boosted by a Variable Geometry Turbine (VGT) Holset HDX55V turbocharger is taken into consideration as base engine in order to investigation the engine performance parameters. The main specifications of the engine are presented in
Table 1. The same model is then used to incorporate the turbocompounding model by adding a second turbine element in the downstream of the main turbine.
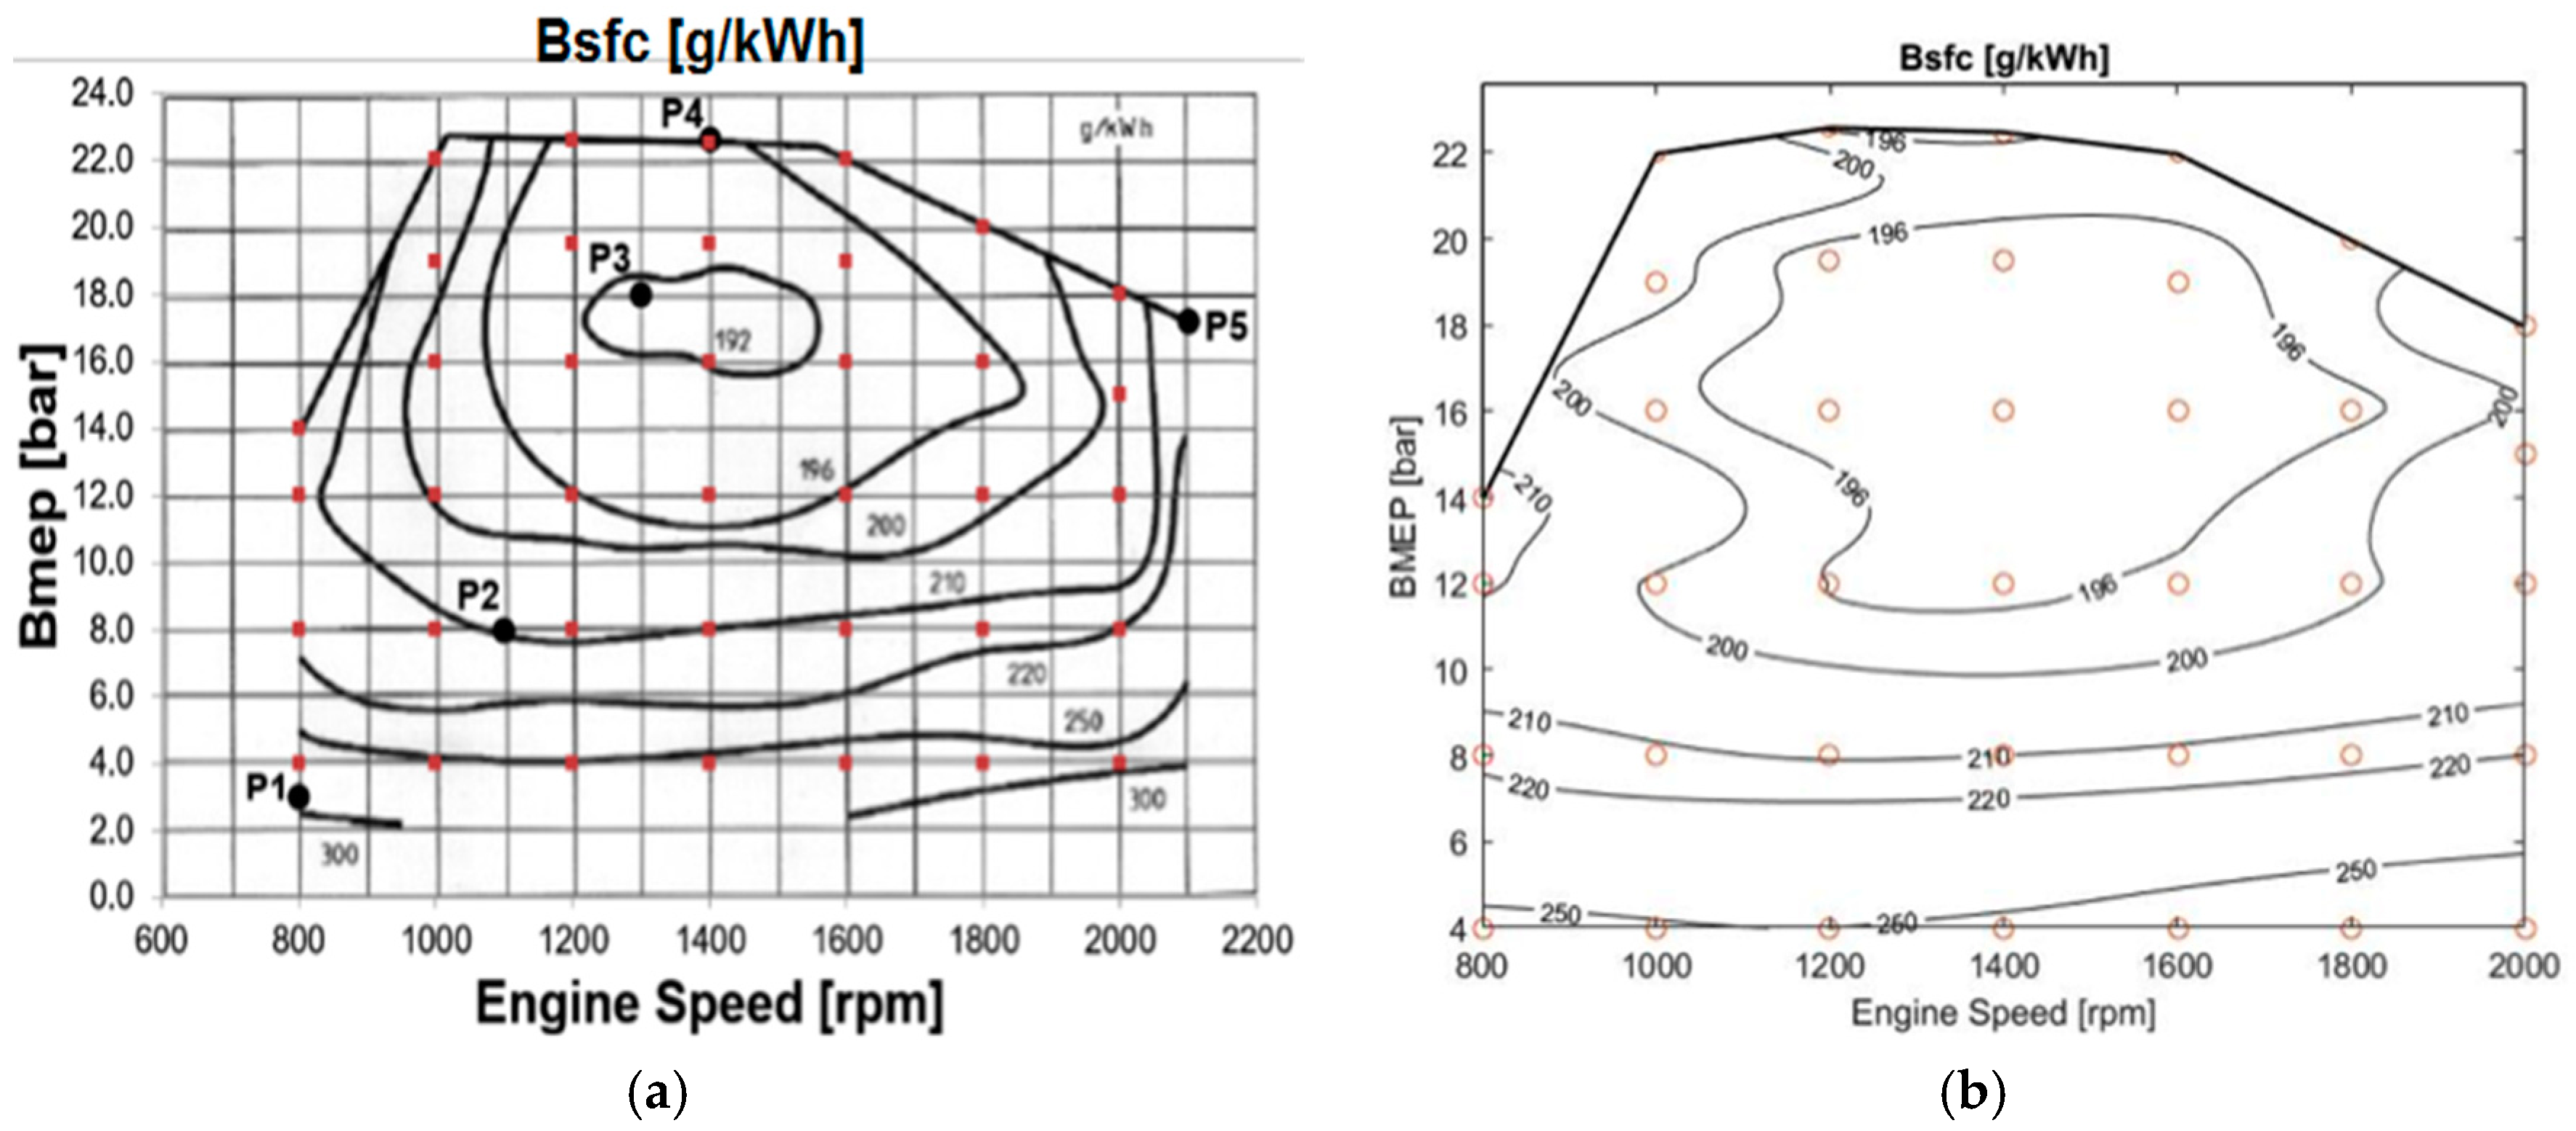
Figure 1a shows the BSFC map used for calibration with five major points of operation considered, namely P1, P2, P3, P4 and P5. They have been chosen based on operating states of the engine such as Idling (P1), Partial Load (P2), Ideal BSFC (P3), Maximum Torque (P4) and Maximum Power (P5). Having these points as a basis, several points are taken at regular intervals of speeds between 800–2000 rpm for increasing BMEP values. These essential points are then used as the benchmarks for several parameters such as injection timing, mass flow rates and combustion duration etc. in the calibration procedure. The calibration points are then chosen to meet the maximum BMEP at each given engine speed. At 800 rpm, four points are chosen at steps of BMEP = 4 bar, reaching a maximum of BMEP = 14 bar. Similarly, at other engine speeds the points are superimposed as shown in
Figure 1a. All the calibrated points are represented in
Appendix A along with the main engine parameters. These operating points are simulated as cases in a turbocharged diesel engine model, which is developed in GT-Power Software. The main parameters to be calibrated for the model are Injection Timing, Combustion Duration and VGT Rack Position. By using target values of BSFC taken from the standard map, the model can be calibrated.
The major factor is that at several cases at a particular speed, the same BSFC can be achieved. Hence, during calibrating the rack positions are maintained around the same at a particular speed and the injection timings and combustion durations are changed. By increasing the injection timing and combustion duration more fuel is consumed, thereby increasing the BSFC.
When the target BSFC is achieved, further points are calibrated using the first point as benchmark. The final calibrated parameters at 800 rpm are shown in
Appendix A. It can be seen that, as the BMEP increases, the combustion duration has been slightly reduced to achieve the target BSFC, although the rack positions remain nearly equal. The same method was followed for calibration at the other engine speeds, as shown in
Appendix A.
3. Engine Simulation
After the calibration of the engine simulation works are carried out to obtain the BSFC values at each point considered in the investigation. By using MATLAB codes and taking BMEP and engine speed as main variables, a BSFC map is plotted for the modeling of engine.
Figure 1b shows the BSFC map, with the red markings indicating the 38 operating points that were taken for calibration. On comparison of the achieved BSFC map with the map used for calibration provided in
Figure 1b, it can be seen that they are the same. Hence, the obtained BSFC map is considered reliable for the study. In
Figure 1b the region denoting the least BSFC values of 196 g/kWh or lower, is located around BMEP = 12–18 bar and engine speeds of 1100–1700 rpm. Hence, when the operating point of the engine is at a medium speed and medium-high power ranges, the fuel economy is relatively better. At conditions where the BMEP is very low (e.g., 4 bar), the BSFC is very high, and is almost constant, independent of the engine speeds. Observing along the maximum power line denoted in solid black line in the plot, it can be seen that the BSFC values reduce gradually as the engine speeds increase.
Hence, the major focus must be on finding alternate methods to improve the fuel consumption at the regions where the BSFC is higher. At other regions where the engine is working at its peak performance, there will be little scope for improvement as most of the energy is already utilized as useful work. Although, the BSFC values vary in different manner with change in speeds, depending upon the BMEP values, the energy available at exhaust is more predictable and gradually increases as shown in
Figure 2a.
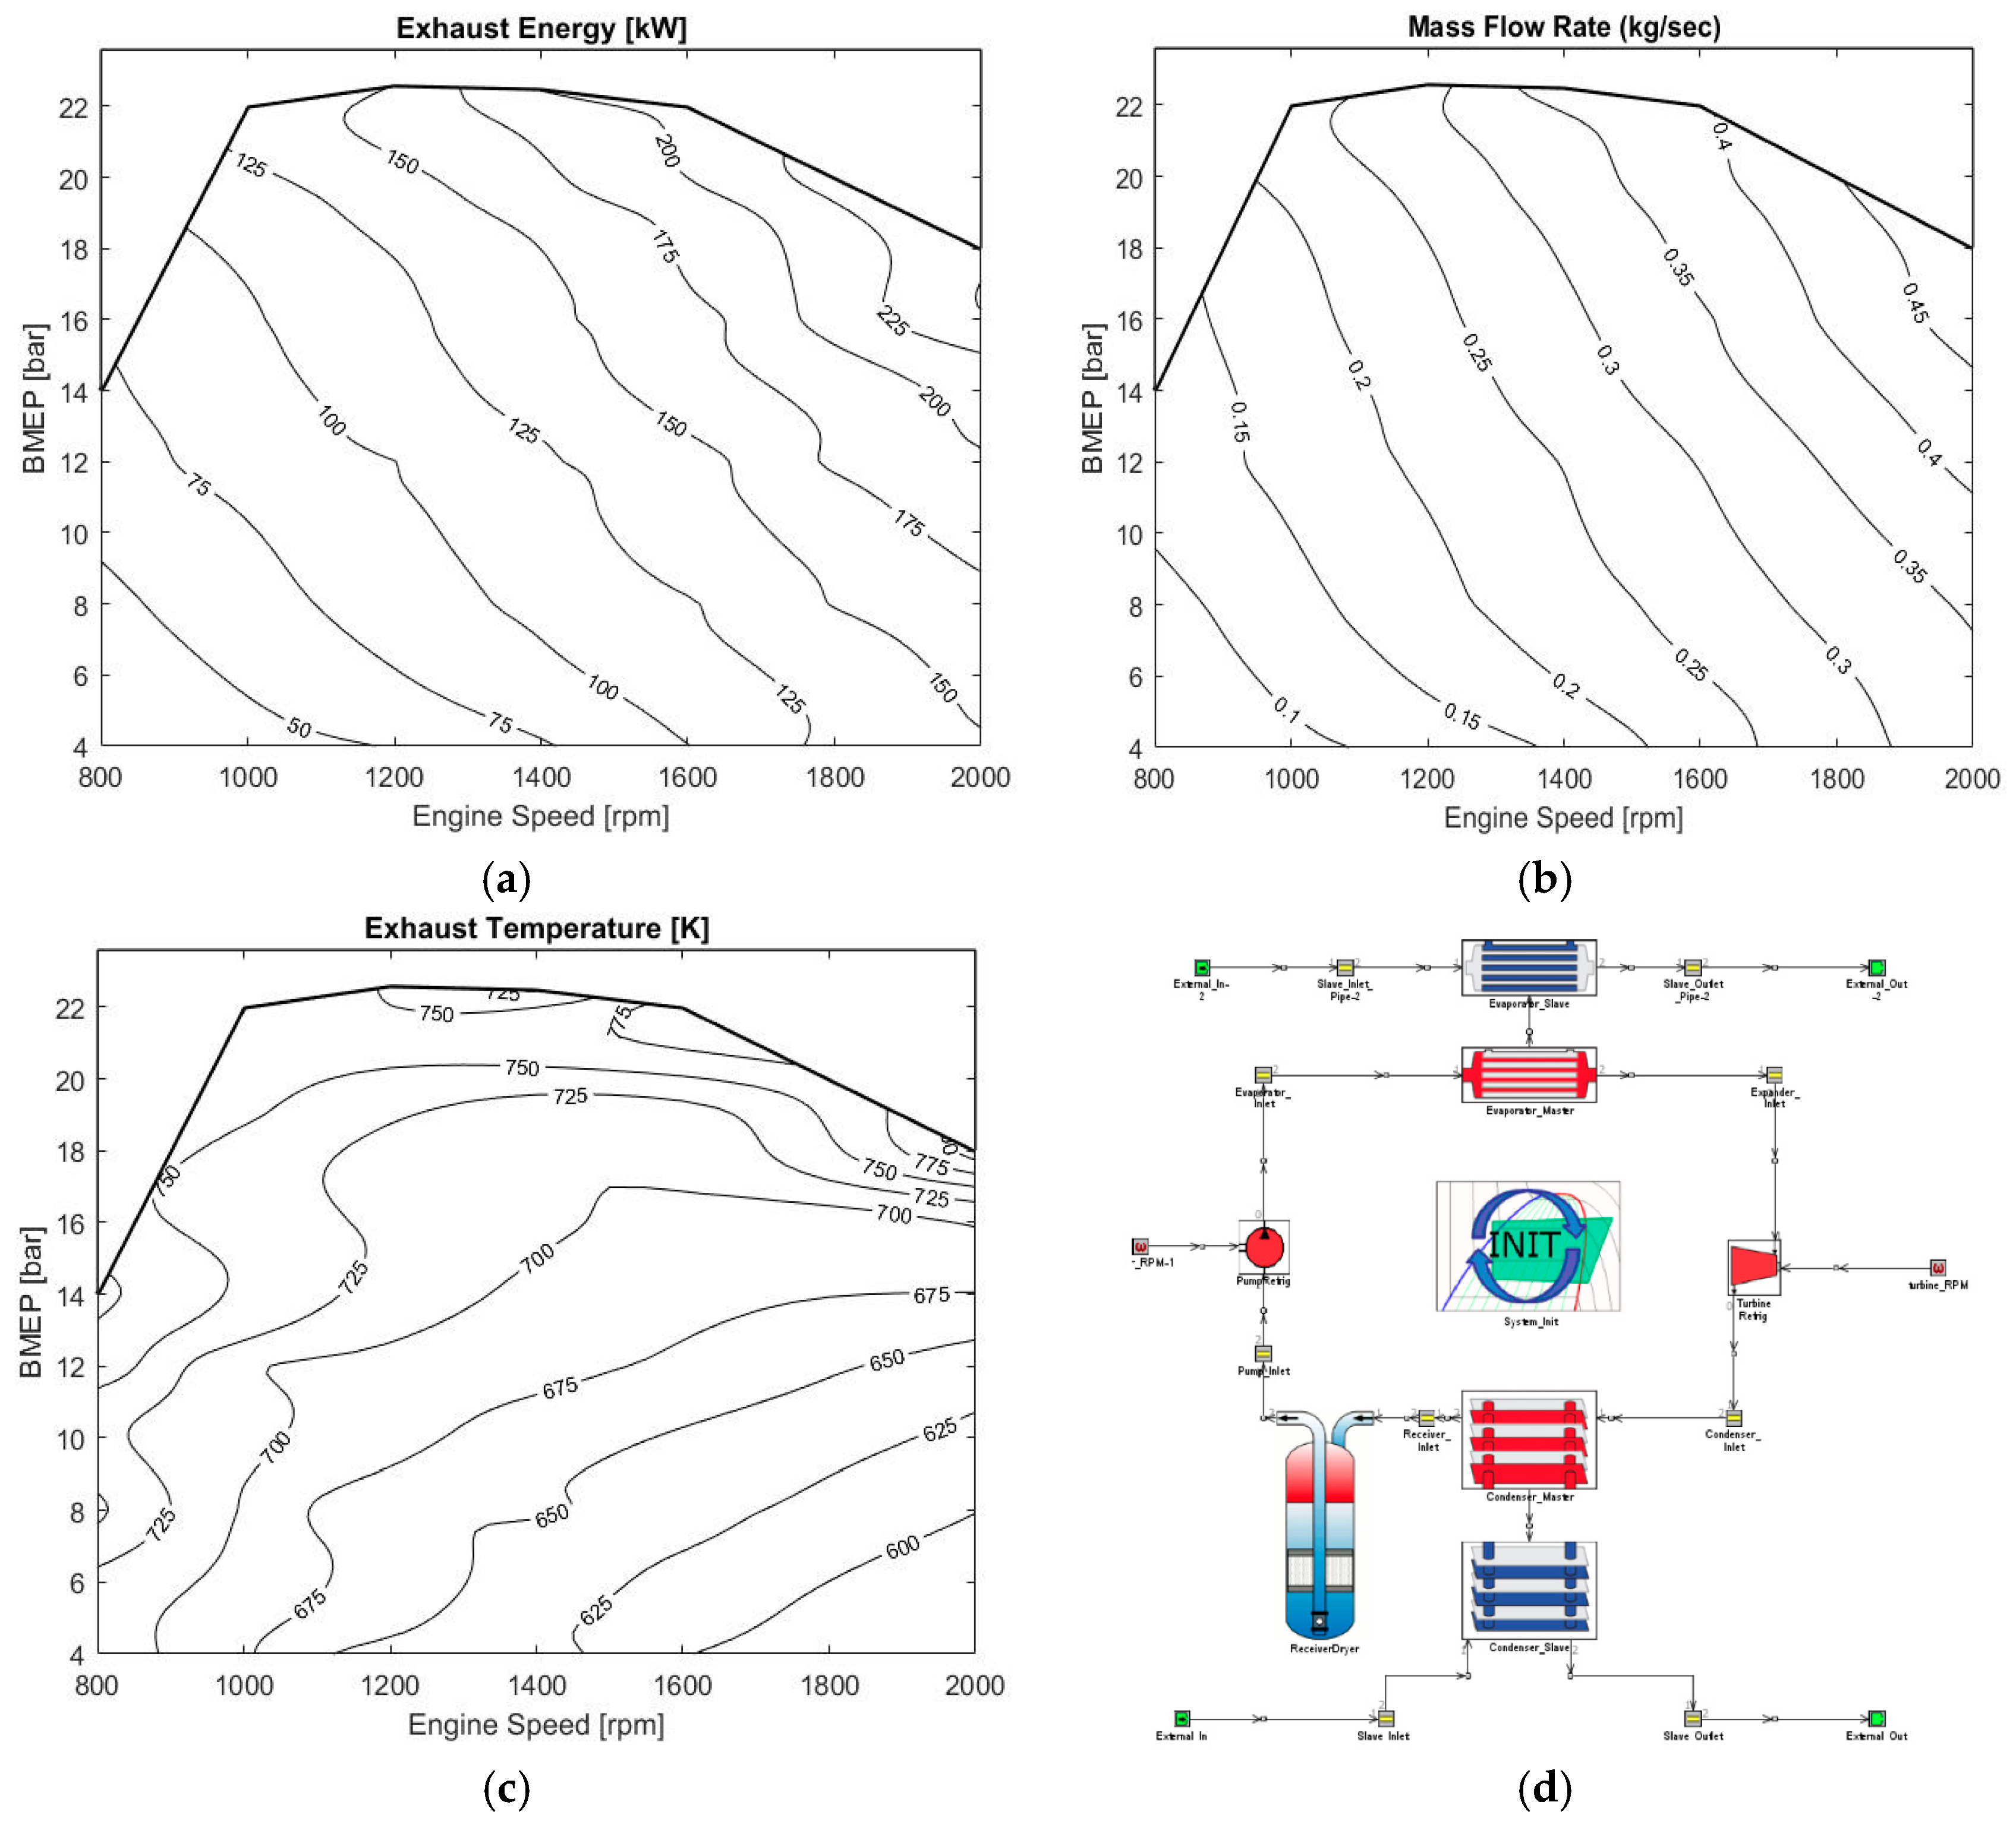
The exhaust energy is estimated using the mass flow rates at the exhaust and the exhaust temperature for the various operating points. These values are obtained from the simulation models at the turbine of the turbocharger. The exhaust energy increases as the engine operating speed increases, and also as the power increases. Since, the most important factor in energy recovery is the availability of the energy, it is easier to recover energy efficiently at higher speeds and when the engine operates at higher power.
Figure 2b illustrates the exhaust mass flow rates used to calculate the exhaust energy wherein a similar trend can be noticed, where the mass flow is higher at higher engine speeds and high BMEP. Hence, higher the flow of mass, greater will be the energy available to be recovered. Hence, it can be concluded that the exhaust mass flow is directly proportional to the exhaust energy. But, the exhaust temperatures do not follow the similar trends as shown in
Figure 2c. The exhaust temperatures at low speed and low BMEP is comparatively higher, than that at high speed-low BMEP. At very low speeds (e.g., 800 rpm), maximum torque is attained faster and due to this, the temperature difference at low and high pressures is very small. However, at medium and high speeds (e.g., 2000 rpm), the temperature difference at low and high pressures is greater. Hence, if exhaust temperatures are indications to the efficiency of the heat recovery, then the performance at both low and high speeds will be the same, since the temperatures do not vary considerably. Practically, this is not the case as the heat recovery is better when the availability of incoming heat is high. Therefore, it is more dependent on the mass flow and exhaust energy available rather than on the exhaust temperature directly.
4. ORC Waste Heat Recovery Modeling
Using the simulation results of the engine model, exhaust temperature and mass flow rates are obtained at the different operating points. These parameters are the major factors that contribute to the performance of the ORC heat recovery system. In theory, more the heat energy available, more the ORC system can utilize it to produce useful work. Hence, a successful model of ORC heat recovery will have higher efficiencies at very high speeds and high torque, whereas at lower speeds, the efficiency will be comparatively lower. Since the other operating conditions of the system are unknown, it is kept at a constant value at all the points. The average speed of the turbine is maintained at 1350 rpm and the coolant temperature is also a constant at 300 K. The backpressure produced as a result of using the ORC system is also neglected for all calculations and study. In the simulation under these conditions, the power output from turbine and power input to the pump is considered, from which the net power can be calculated. Moreover, the power in the evaporator system is used to calculate the efficiency of the system at each point. The ORC heat recovery system that has been modeled in the simulation is presented in
Figure 2d. Due to the usage of ORC heat recovery system, it is predicted that the BSFC will be reduced. Accordingly, the new BSFC at each operating points and the reduction in BSFC is also studied to understand the effectiveness of using the system at different engine conditions.
The selection of the appropriate organic fluid for each respective application is a demanding challenge for engineers since the performance and efficiency of the organic Rankine cycle system is seriously affected by the working fluid. However, the properties of the fluid are not the only of criteria for selection, as the cost and the environmental impact of each fluid may limit the list of available fluids. As far as the cost is concerned, the engineer should decide which fluid would decrease the payback period and offer the maximum output and thermal efficiency at the same time. The properties of the organic fluids can be divided into four categories, each one of them being equally important for the efficient and safe operation of the ORC system. Thermodynamic properties of the organic fluids vary in several aspects, as is the density, viscosity, boiling point temperature and pressure and the latent heat of vaporization. Each one of these parameters affects not only the thermal efficiency of the system, but also the design and construction of the respective internal combustion engine configuration. Critical and maximum operating constitutes the process related properties and they are linked with the efficiency of the organic Rankine cycle system. As far as the safety and environmental aspects are concerned, the toxicity and flammability of the fluid concern the engineers, while the global warming potential and ozone depletion danger are the major dangers for the environment. The working fluids should compromise among several criteria specified below [
23,
42,
43]:
Low condensation temperature.
Very low freezing point.
No need to superheat (dry fluid).
Eco friendly (low Global Warming Potential and Ozone Depletion Potential).
Low flammability and toxicity.
Considering all of aforementioned requirements, R245fa was selected as the working fluid in this study considering entirely prior experience and potential for widespread use. This organic fluid has no ozone impact, low global warming impact, it is non-flammable and its thermodynamic properties fulfill the above criteria. After the selection of the working fluid, the final model was created. In GT-Power software some assumptions were considered and are shown below [
23,
44]:
The evaporator exhaust gas initial pressure and temperature are equal with the exhaust gas outlet pressure and temperature respectively.
The condenser coolant initial pressure and temperature are equal with the coolant outlet pressure and temperature respectively.
No heat is lost to the surroundings.
The input values for ORC model such as exhaust temperature and exhaust mass flow rate were obtained from 38 different the engine operating condition cases (refer to
Appendix A) at several engine speeds and BMEP ranges. This data included parameters such as the evaporator energy, turbine power, pump efficiency, turbine efficiency and the pressure rise in the pump. The design parameters of ORC used in the simulation are presented in
Table 2.
The exhaust temperature and exhaust mass flow rates obtained as a result of the simulations of the engine model, are used as inputs to the ORC heat recovery system to study the recovery of the energy to improve the efficiency and fuel economy of the engine. Depending upon the heat energy available, the turbine work output varies. Hence, the actual performance of the ORC system is estimated by calculating the efficiency at each operating point for the simulation. The efficiency of ORC system can be calculated by Equation (1):
where
Wt is the power output from the turbine and
Qin is the heat energy available in the evaporator. Using the calculated values of efficiencies, a plot is generated using MATLAB as shown in
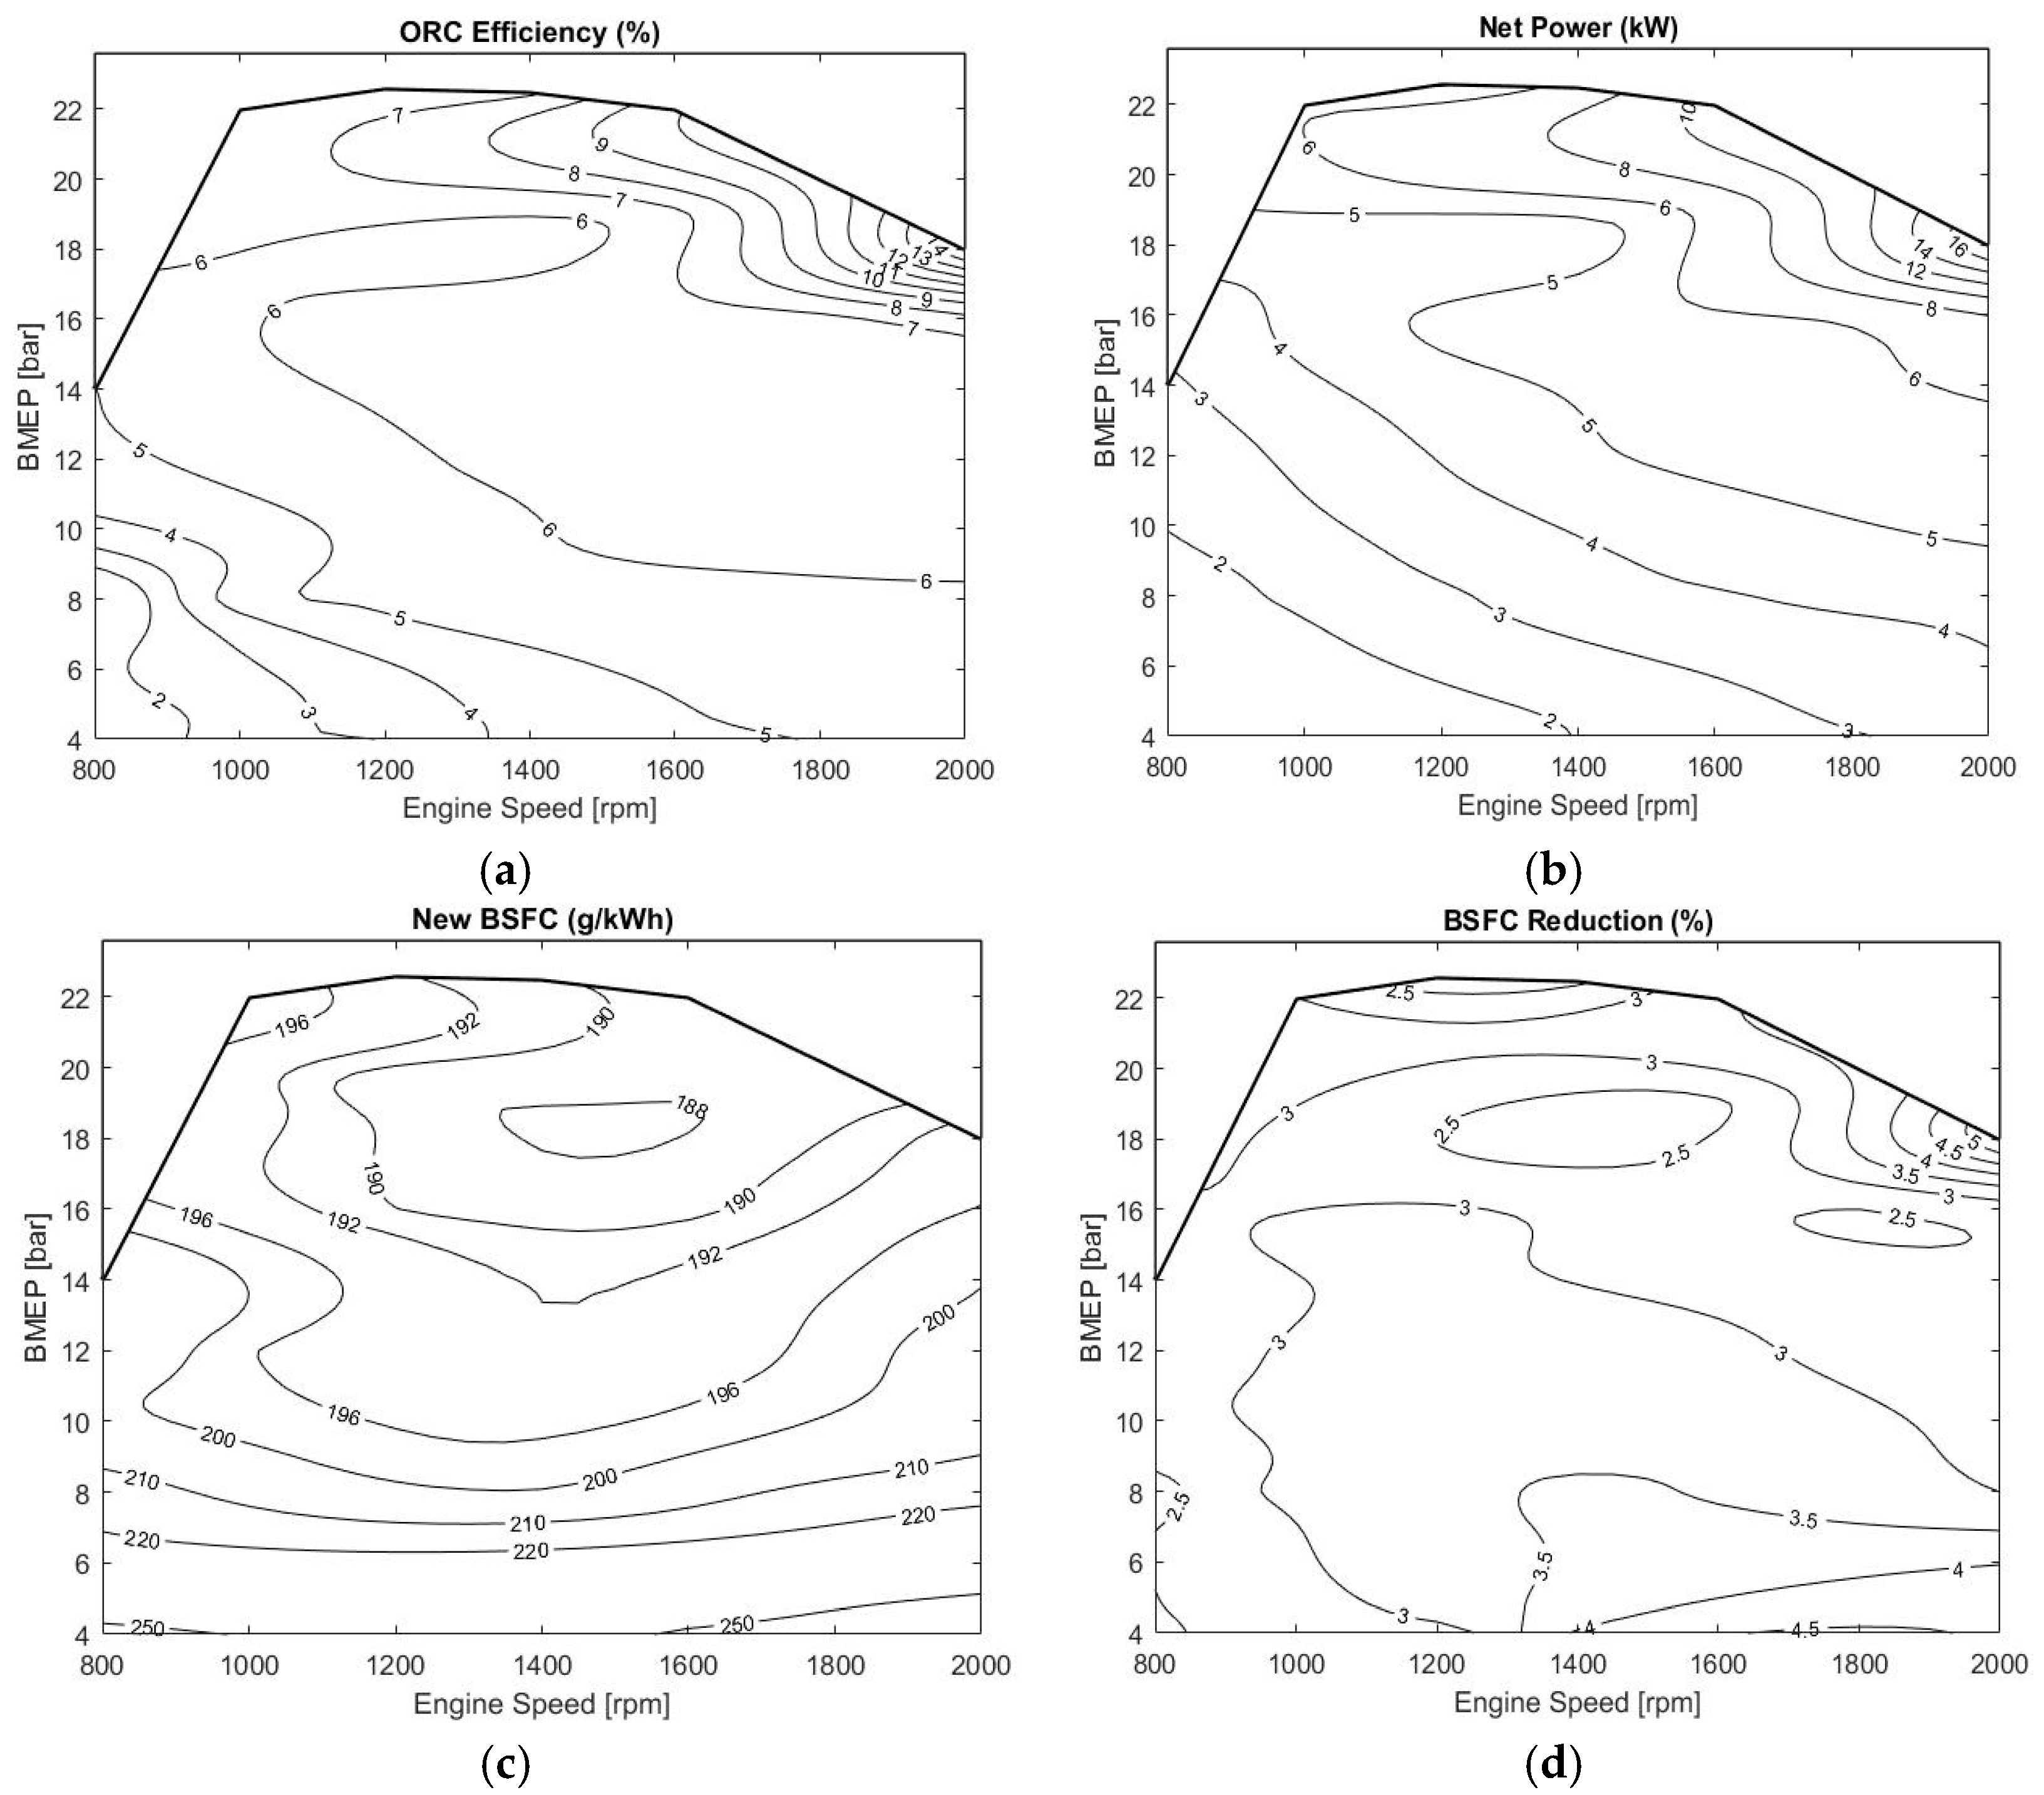
Figure 3a. At regions of high energy, the difference in efficiencies between two nearby points is larger than that at low energy regions. Comparing the plot with
Figure 2a, it can be noted that the greater the energy available, the higher the efficiency will be. This trend is evident from the plot, where it can be noted that at low speeds the efficiency is lower, whereas at high speeds the efficiency is higher, but, on comparison with
Figure 2c, it can be seen that several points have similar temperatures at different operating conditions, but the efficiencies at those points are not the same.
In
Figure 2c, at rpm = 1200 and BMEP = 20 bar, and at engine speed of rpm = 2000 and BMEP = 18, the temperature ranges are quite similar. However, the efficiency of heat recovery at the former point is about 6.5–7%, whereas at the latter point the efficiency is 10–13%. This is attributed to the exhaust mass flow rates that contribute to the energy available at the exhaust to be recovered by the ORC Heat Recovery System.
Although the efficiency of heat recovery is dependent only on the power from the turbine, practically, the power in the pump also has an effect on the BSFC improvement. Hence, the net power, which includes both the turbine and pump power is calculated using Equation (2):
The net power obtained as a result of the recovered heat is plotted as shown in
Figure 3b. The net power follows the same trend as that of the mass flow rate and ORC efficiency. Hence, there exists a direct correlation to the exhaust energy, mass flow rates and net power. However, this does not mean that the amount of reduction in BSFC also increases as the speed and BMEP increases. To study this, the BSFC is recalculated by taking into account the recovered power from the exhaust heat by the ORC system. In general, the BSFC is calculated using Equation (3):
where
mf is the mass flow rate of fuel and
Pb is the brake power of the engine. But due to the additional power that has been recovered from the ORC heat recovery system, the BSFC is calculated using Equation (4):
It is evident from the relation that the BSFC will be reduced, but the reduced BSFC is not changing linearly. The new BSFC is plotted to obtain the BSFC map after the heat recovery by the ORC system in
Figure 3c. The lowest BSFC in the map is 187.95 g/kWh whereas the highest BSFC is only 276.82 g/kWh. On comparison with the original BSFC map in
Figure 1b, the lowest and highest BSFC values are 192.62 and 289.68 g/kWh, respectively. However, the lowest and highest BSFC points that are obtained from the two maps are not at the same operating point. This indicates that the reduction in BSFC is not uniform and linear throughout the engine operation and is affected by several parameters. But, there is a similarity in the two maps, which suggests that the overall trend in reduction is quite uniform, by which similar BSFC maps are obtained. It can be seen from the original BSFC map that, the lowest BSFC range denoted by 196 g/kWh is enclosed within engine speeds rpm = 1000–1800 and BMEP = 12–20 bar. In the same region in the new BSFC map obtained as a result of installation of the ORC heat recovery system, the values range from 188–192 g/kWh. This region is the ideal operating range of the engine, where the fuel consumption is optimum and maximum work output is produced. As explained earlier, the reduction in BSFC is not linear throughout the map. In order to study, the reduction of BSFC, at each operating point the percentage of reduction is calculated using Equation (5) where BSFC
old is the original BSFC of the engine and BSFC
new is the modified BSFC due to heat recovery:
Using the values of percentage reduction of BSFC at each operating point, a plot is generated in MATLAB as shown in
Figure 3d. The reduction in BSFC is around 2–2.5% at very low engine speeds and increases to about 3–4% as the speed increases. Also, at very high speeds where the ORC efficiency was seen to be maximized the BSFC reduction is also high at about 4.5–5%. However, there is a region of BSFC reduction in the plot with a value of 2.5% at medium engine speeds. This is the region where the engine is performing in its peak, and optimum work output is produced as result. Hence, there is very little excess heat to be recovered by the ORC system in this region due to which reduction in BSFC is also comparatively low. This can be further validated from the ORC efficiency and net power plots in
Figure 3a,b, where there is a small fluctuation in the same region compared to nearby values.
5. Turbocompounding System Modeling
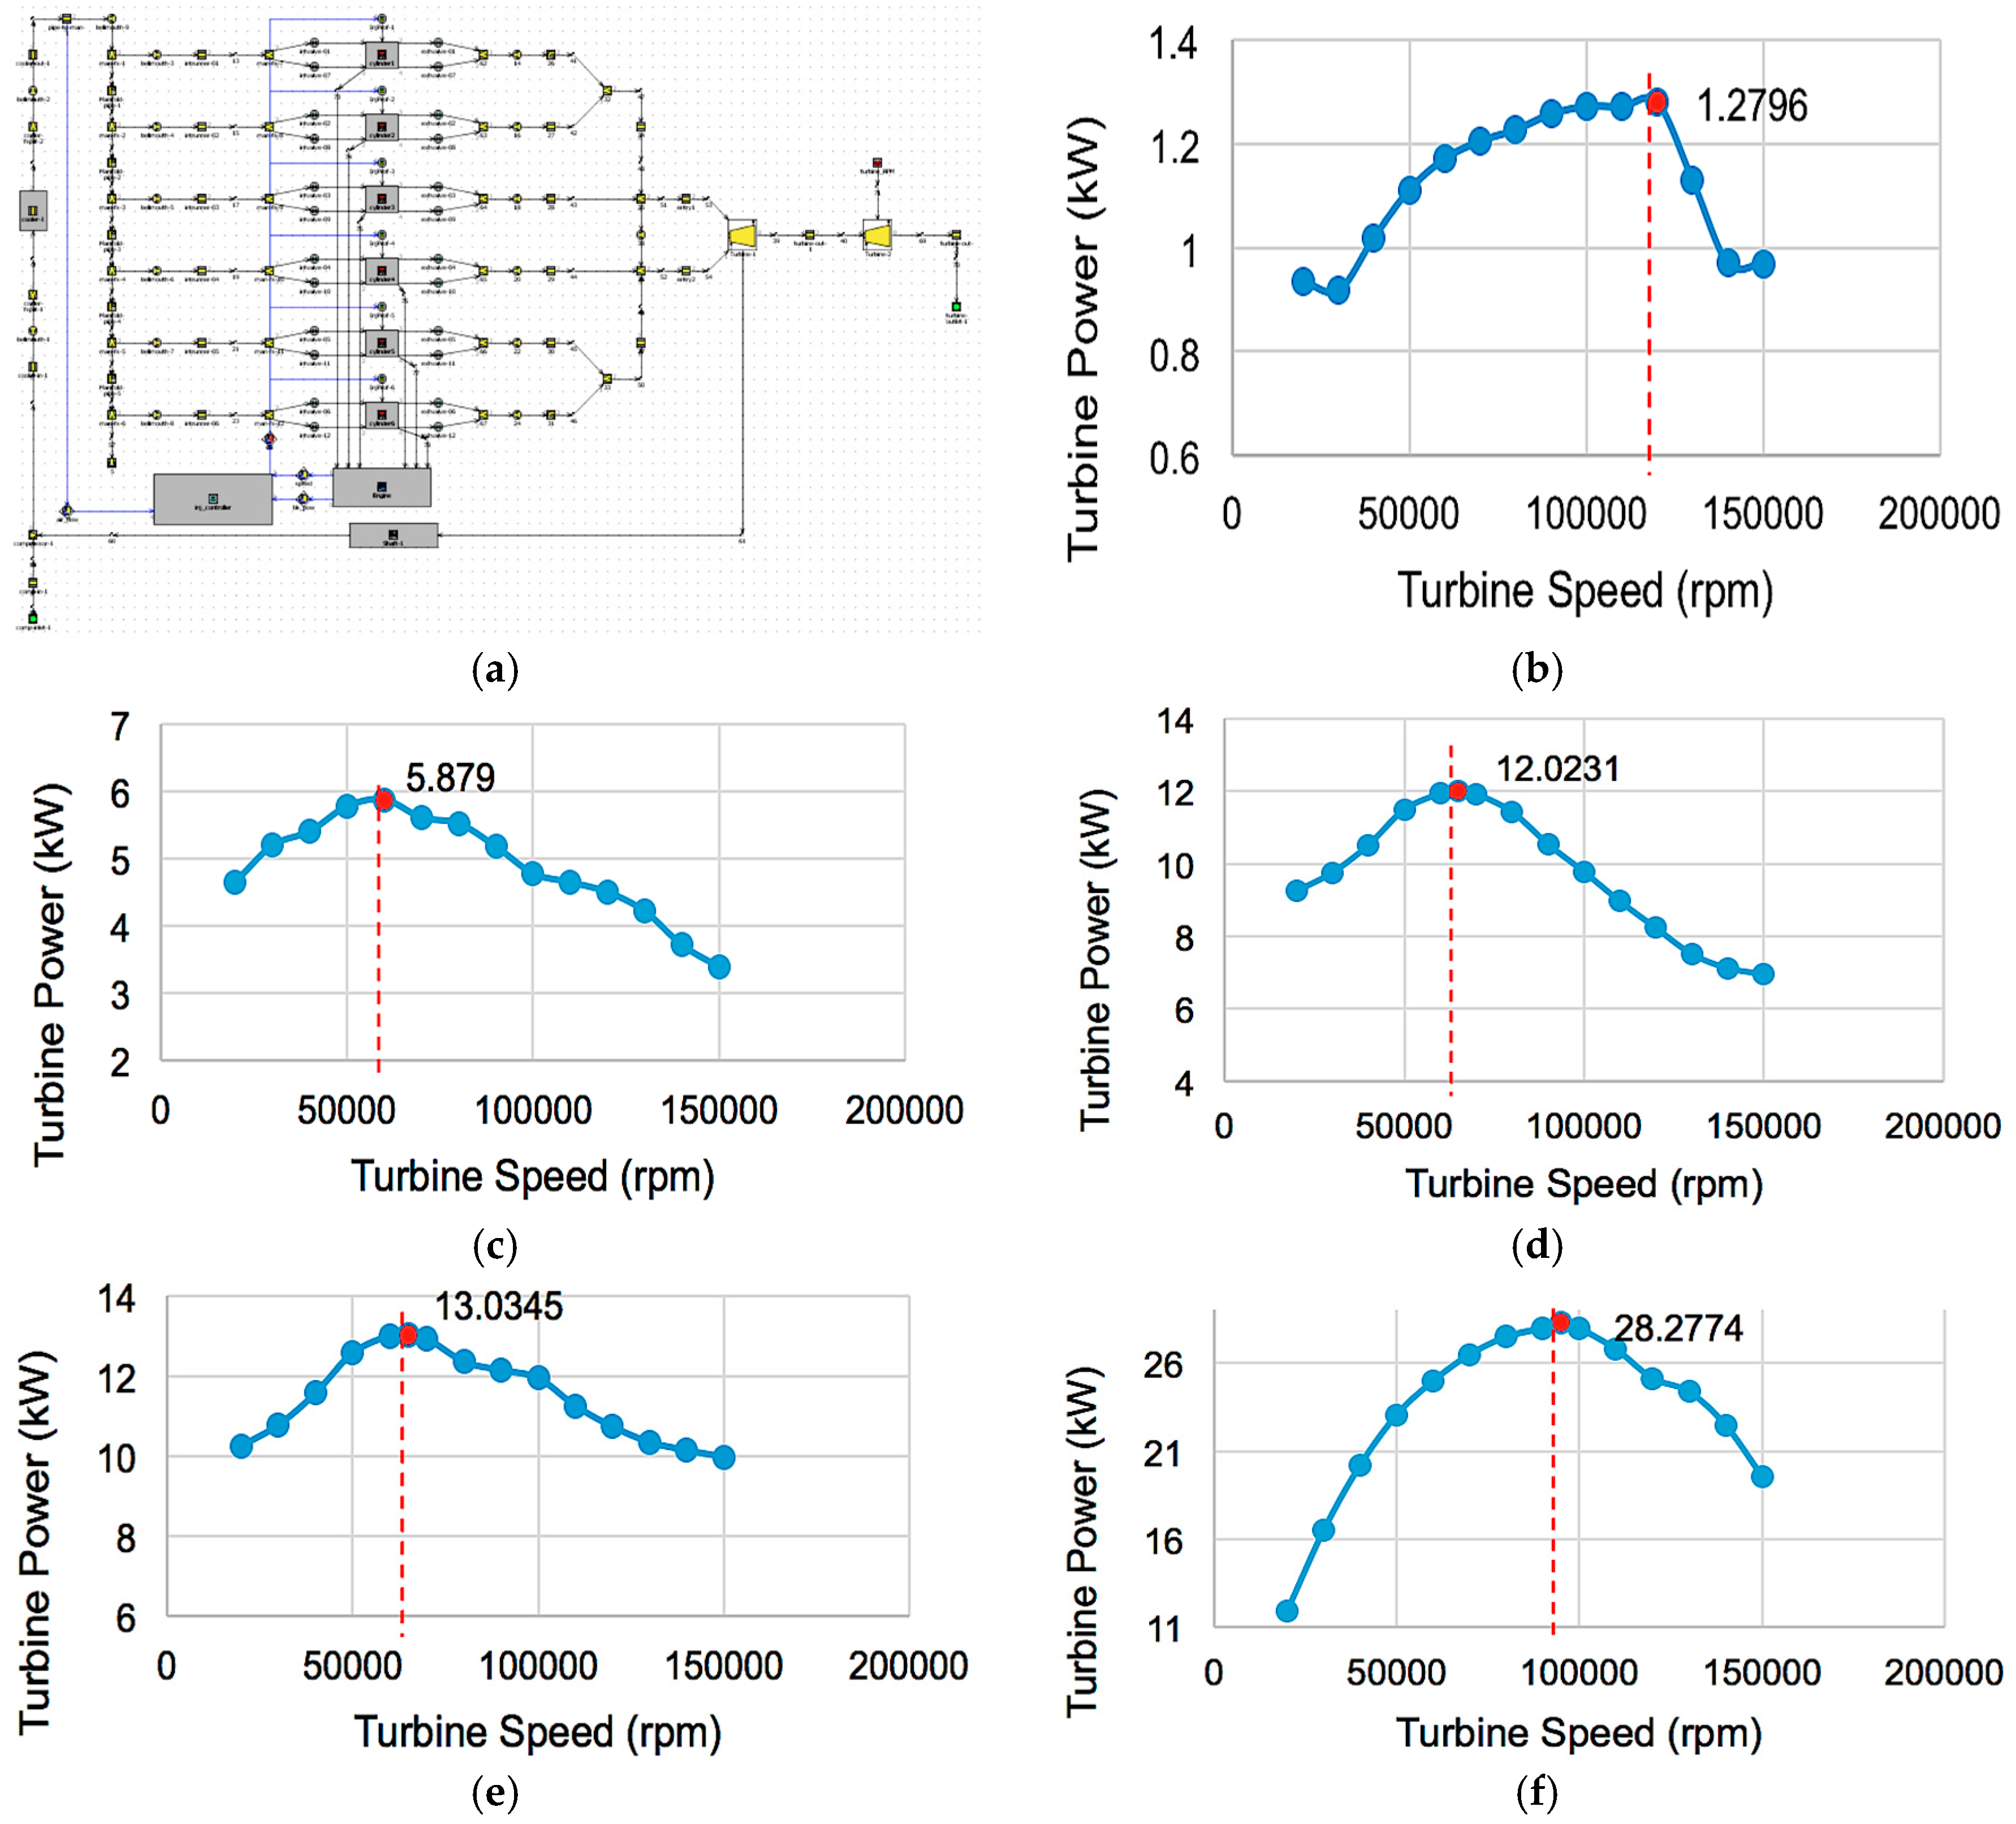
For turbocompounding, it is time consuming to simulate an engine model with a motor/generator system to investigate the electrical energy that can be produced during operation. Hence, to the engine model that was used earlier, an additional turbine is added after the existing turbine. Just like the simulation done in ORC heat recovery system, the power generated from the turbine can be examined by connecting it to the model template called “turbine rpm” as demonstrated in
Figure 4a. Due to the installation of turbocompounding, the BSFC is expected to be reduced. Also, as a result of this arrangement, the exhaust gas temperature is increased slightly which suggests, which there will be higher exhaust energy available to be recovered. However, due to an additional turbo that is added, BSFC is increased slightly by the backpressure that is created. In other words, the pressure before the second turbine is greater than the pressure after it. But, due to the turbine operation, power can be generated from the exhaust gases. This power is a major factor for the study, as the peak power is not achieved at all the operation points at the same rpm of the turbine. For instance, the peak power at very small loads is achieved at very high rpm, whereas the optimum rpm for medium and high loads is comparatively lower. Hence, it is important to identify the ideal turbine rpm at the different operation points to examine the maximum possible BSFC reduction. Therefore, simulations were performed at different engine rpms and at different turbine rpms ranging from 20,000–150,000 rpm. The increased BSFC due to backpressure, and the subsequent reduction in BSFC by considering the power from turbine is then studied to compare its performance with that of ORC heat recovery system.
As explained earlier, to implement a turbocompounding system, an additional turbine is added after the existing turbine in the model to simulate and identify the power that can be generated. However due to the dependency of power to the turbine rpm, it is necessary to identify the optimum rpm wherein the turbine produces maximum power at a particular engine speed. Since, it is not possible to identify the optimum turbine rpms at each individual point, the plot, which was initially used for engine calibration, is performed. Five points P1–P5 are used as benchmarks to set the optimum rpm for simulations.
Figure 1a shows the BSFC map denoting the points taken for identifying the optimum rpm. At point P1, simulations were carried out in GT-Power for turbine speeds of 20,000–150,000 rpm and the power from the turbine was noted. The plot for the power with respect to the turbine rpm is given in
Figure 4b. It can be seen from the plot that the maximum power of 1.279 kW, is obtained at a turbine rpm of 120,000 rpm. This means that at that particular turbine speed, maximum power can be recovered, but this is only applicable from P1. For other points, similar parametric sweeps are made to identify the optimum rpm as given in
Figure 4c–f. The results from the above plots are presented in
Table 3, which shows the maximum power and the optimum rpm at that point. It also details what rpms are taken for simulations on the basis of the results obtained for the 38 points used for the study. Using these results, simulations are carried out similar to previous simulations on the original engine model to study the BSFC, and the subsequent reduction due to the recovered power from the second turbine.
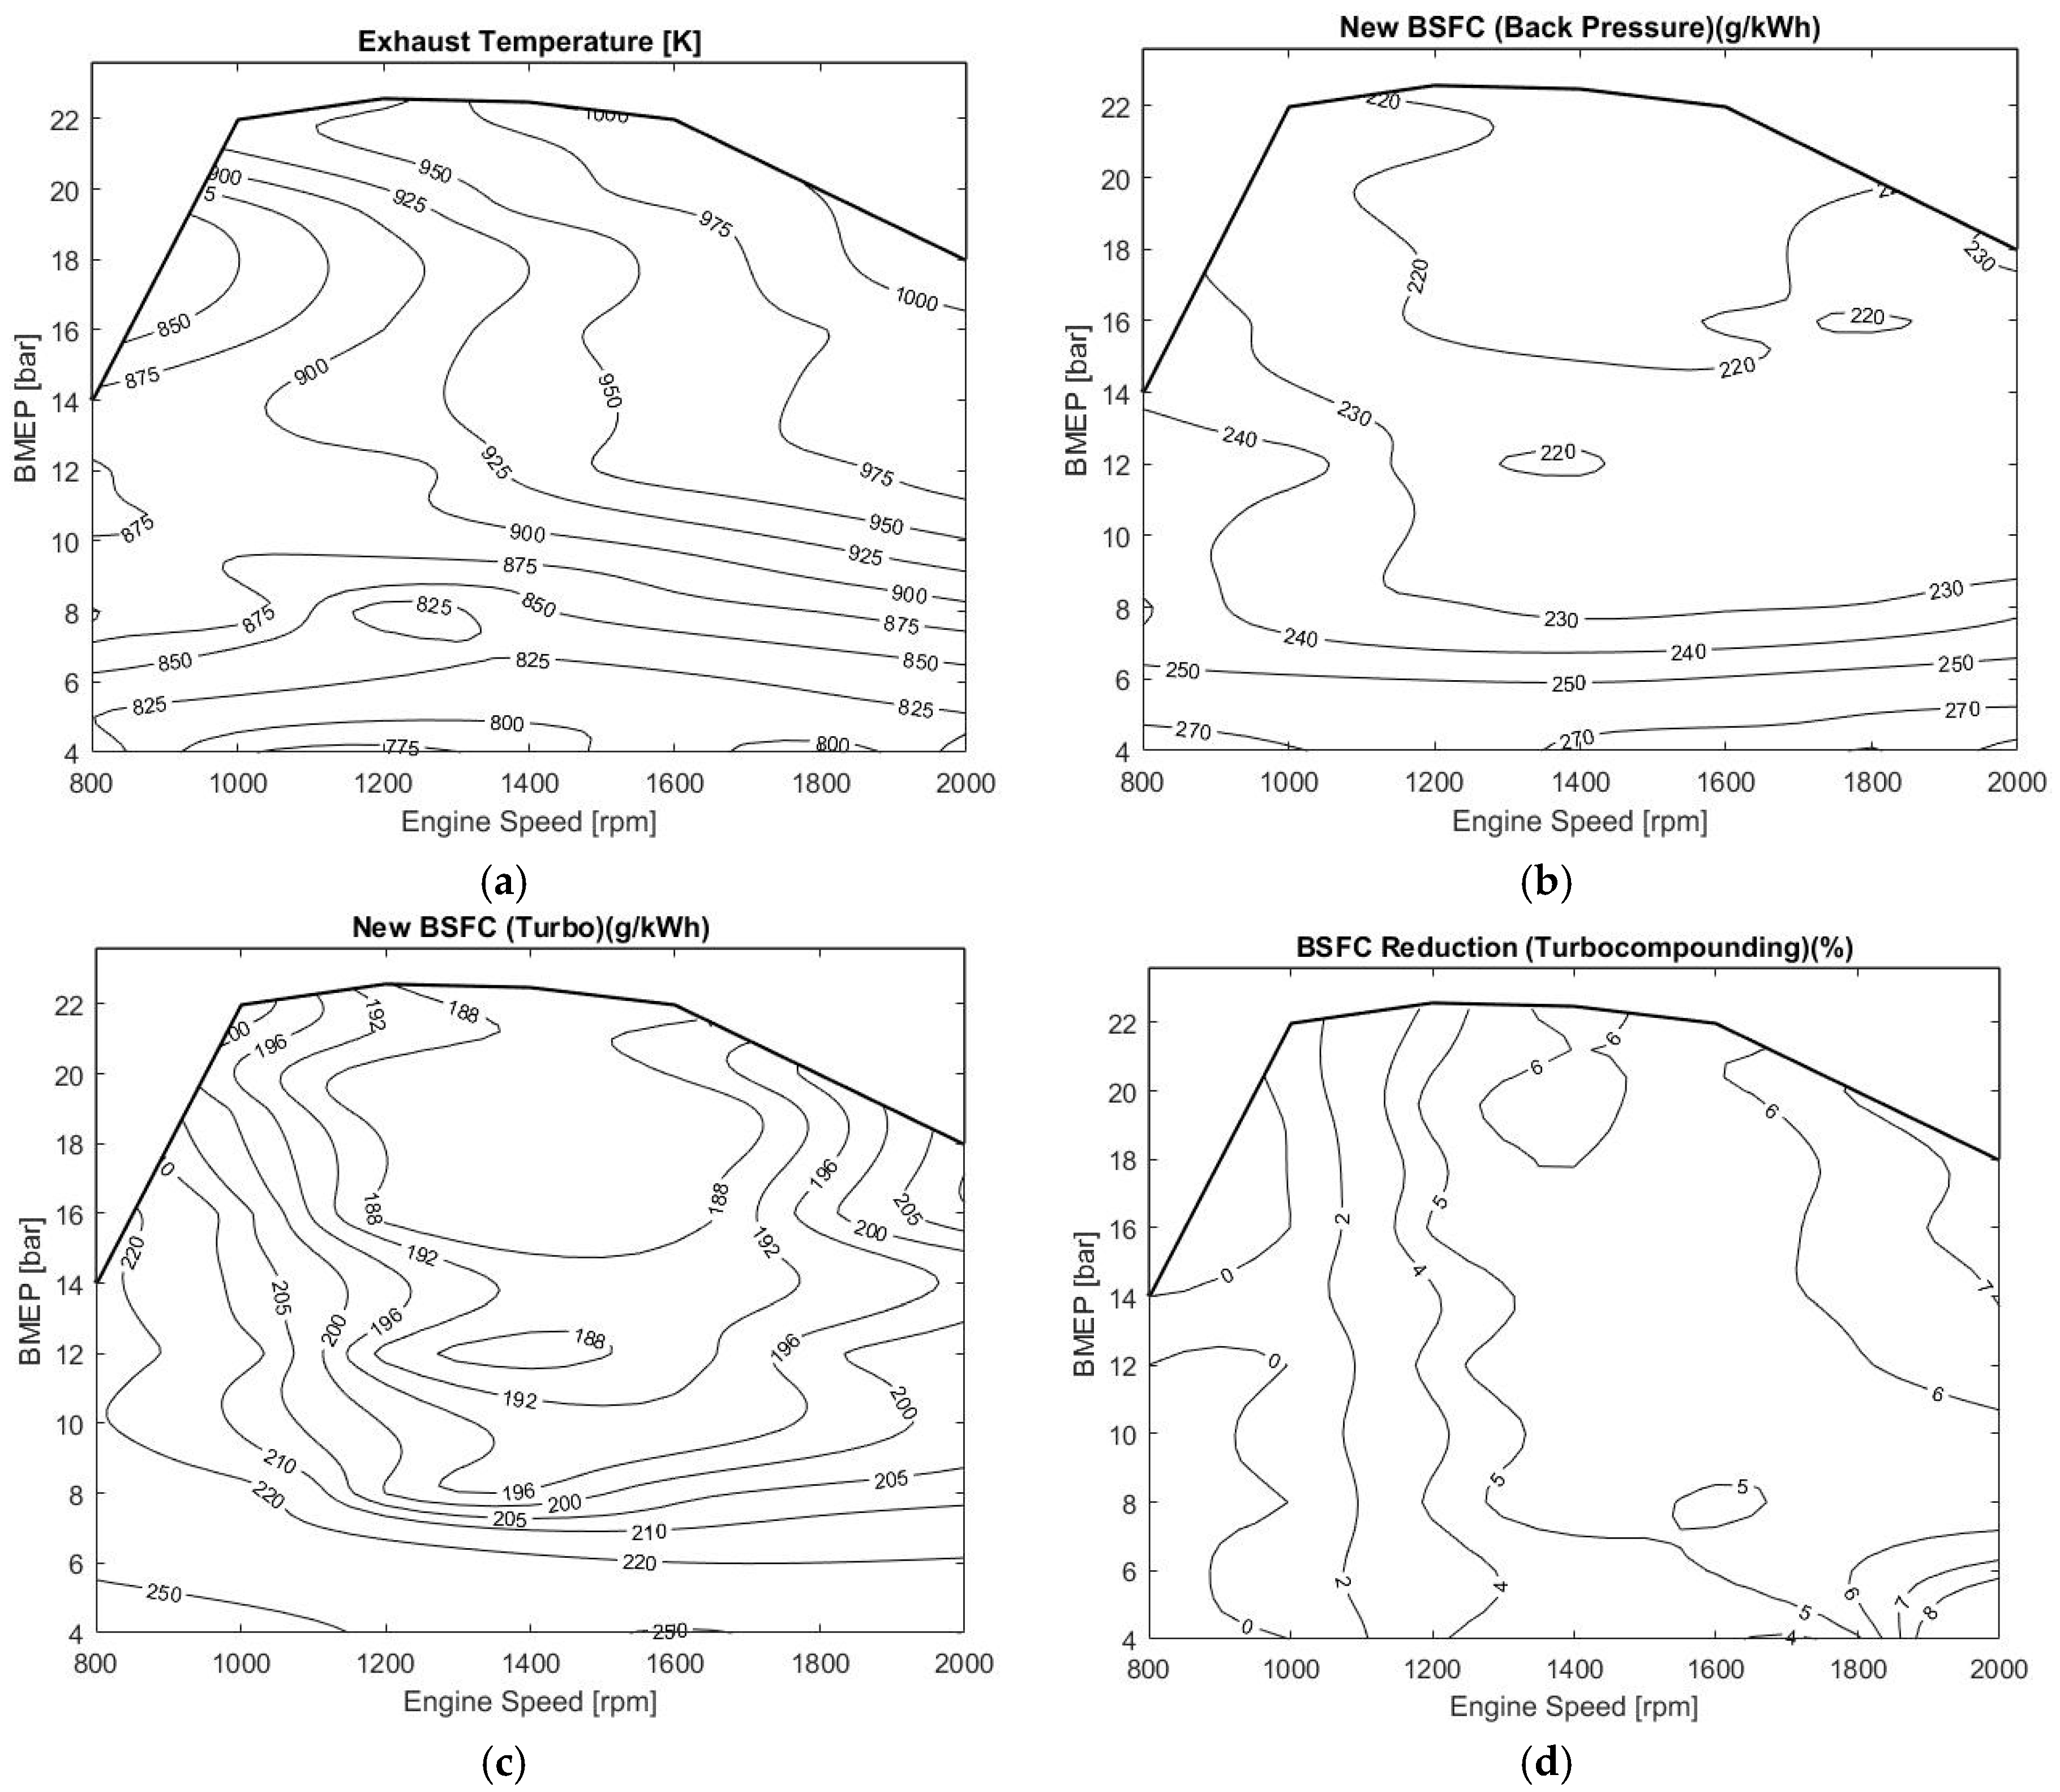
Using the benchmarked values of optimum turbine rpm at points P1 to P5, the 38 points are simulated with an appropriate rpm, depending upon its proximity towards the benchmark points. Due to the presence of an additional turbine, there is a backpressure that arises due to which the BSFC raises. Also, the temperature of the exhaust gases is comparatively higher compared to the normal turbocharged engine model. The temperatures of the exhaust gases are plotted as shown in
Figure 5a. In comparison with the plot in
Figure 2c, which shows the temperature plot of the turbocharged engine model, a similar trend in temperature changes can be noticed. The rise in temperature increases the exhaust energy, which can be converted into useful work further due to turbocompounding. But the high-pressure before the turbine, when compared to the pressure after that, increases the BSFC as plotted in
Figure 5b. This plot does not take into account the power from the turbine that can be utilized.
The lowest BSFC is 213.703 g/kWh and the highest value is 318.896 g/kWh, which is on an average a rise of about 6–8% from the original BSFC Map (
Figure 1b). The region where there is least fuel consumption enclosed by the isocurve “220”, covers about the same area as that covered by the low BSFC region in the old BSFC map. This means that the rise in BSFC is uniform in nature and is only majorly affected by the backpressure than any other parameters. Although, this BSFC rise exists, with the power generated in the turbine, more useful work can be produced due to which the BSFC reduces. The actual BSFC taking into account the power generated by the turbine is calculated using the Equation (6) and is plotted in
Figure 5c:
Comparing the BSFC map with
Figure 1b, it can be seen that at low engine speeds, the BSFC values of the original map are lower than those of the BSFC map for turbocompounding. This suggests that by the implementation of turbocompounding, the BSFC actually increases at low engine speeds. However, at medium engine speeds, there is a descent in BSFC values, which means that the power generated by the second turbine is sufficient to produce a better engine operation consuming lesser fuel.
Also at high engine speeds, the BSFC map for turbocompounding is ideal when compared to the original map because the BSFCs range from 200–220 g/kWh in the former compared to 250 g/kWh in the latter. This trend means that the reduction in BSFC increases with increase in engine speed, unlike the BSFC map of ORC heat recovery system where the reduction was rather uneven and dependent on the region of operation. The percentage reduction in BSFC is calculated using Equation (7), and plots are made using MATLAB as shown in
Figure 5d:
It can be seen from the plot that at low engine speeds from 800–1000 rpm, that BSFC reduction is denoted as 0%. This is attributed to since the BSFC was not reduced due to turbocompounding, but rather increased at these speeds. However, as the engine speed increases the BSFC improves from 2–5% at medium speeds and from 5–8% at very high speeds.
The reduction percentage increases linearly and on direct comparison with the BSFC reduction due to ORC heat recovery it can be noticed that the reduction percentages are comparatively higher at higher engine speeds. Hence, it can be concluded that the use of turbocompounding is not ideal for engine low speed operation. Although the magnitude varies, the maximum reduction in BSFC occurs at the highest engine speed of 2000 rpm, the same as in the case of ORC heat recovery. The utilization of both ORC heat recovery and turbocompounding systems to an engine is advantageous. However, it is important to compare the actual performance characteristics based on the viability and effectiveness of installing one system as an alternative to the other.
It is worth mentioning that the global assumptions considered for the ORC heat recovery and turbocompounding configuration of the vehicle powertrain that even though the backpressure caused by the ORC’s evaporator placed in the exhaust pipe and also all extra weight imposed by ORC/turbocompounding components to the vehicle system deteriorate the overall performance and the fuel consumption of the vehicle to some extent, in this early evaluation study of ORC/turbocompounding heat recovery systems for vehicle, it has been assumed that the effects of them are negligible but should be borne in mind by the reader when considering the results.
6. Comparison between ORC Heat Recovery and Turbocompounding Systems
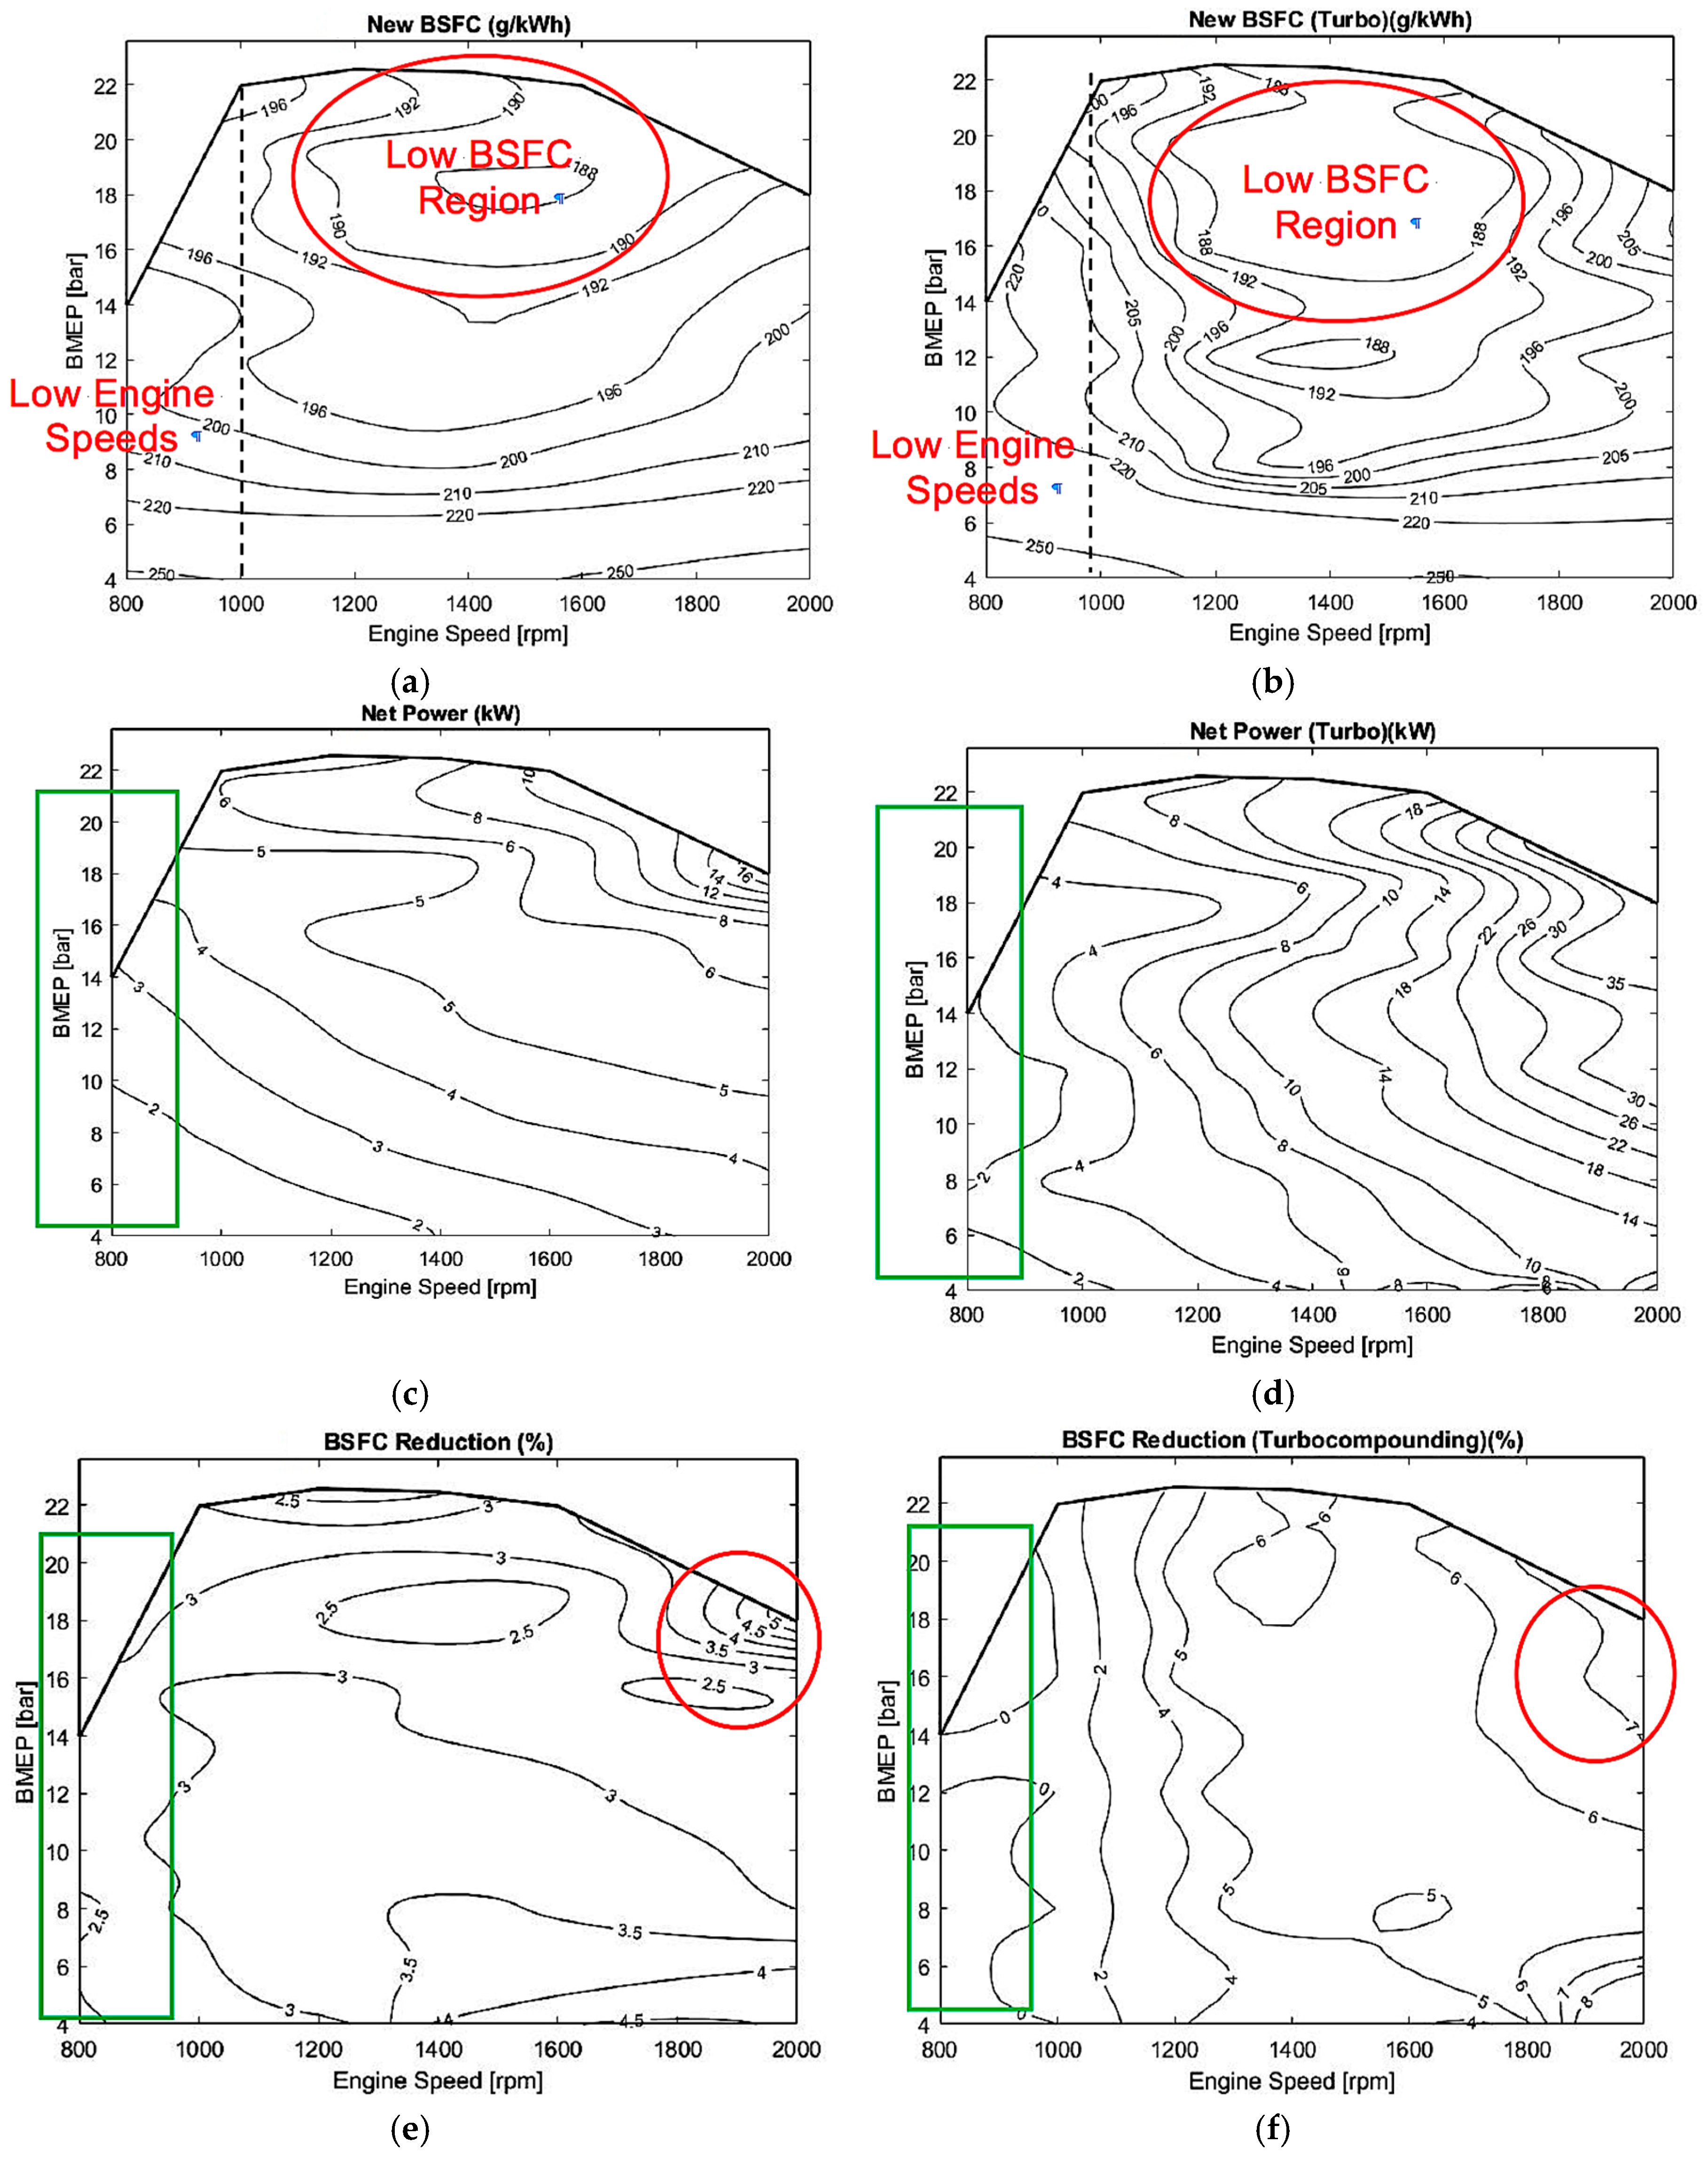
The BSFC maps after the implementation of ORC heat recovery and turbocompounding systems have been plotted in
Figure 6a,b, with important regions highlighted. The red ellipses marked in both plots indicate the regions where the BSFC is the least for both operations.
It can be seen clearly that the BSFC values are much lower for turbocompounding when compared to ORC heat recovery, enclosing a much larger area for BSFC value of 188 g/kWh than the latter. This indicates that the turbocompounding can effectively produce better results for operation in medium engine speeds (i.e., 1200–1800 rpm). However, at low engine speeds marked by the black dotted lines, the BSFC values are much greater for turbocompounding than ORC heat recovery. This is mainly because of the backpressure produced due to the second turbo, and unavailability of excess power from the turbine to compensate for it. This is further validated by comparing the plots for the power produced by the turbine in ORC heat recovery and turbocompounding as given in
Figure 6c,d. In both plots, the power produced is almost identical at low engine speeds, which is the reason for the BSFC for turbocompounding at low speeds being higher. Since, the backpressure increases the BSFC slightly, extra power must be produced further to improve the efficiency. Since, it is not the case at low speeds, turbocompounding fails to produce ideal results at these speeds. But, as the engine speed increases for turbocompounding, the power generated is greater in magnitude, which improves the percentage reduction in BSFC as indicated in
Figure 6e,f. The plot also shows the ineffectiveness of turbocompounding at low speeds marked by the green region. The linear increase in power for turbocompounding also causes reduction in BSFC to increase linearly with engine speed whereas, for ORC heat recovery the trends are comparatively non-uniform. From the plots obtained through simulations, the optimum regions for engine operations using turbocompounding and ORC heat recovery system have been studied and the viability of installation and parameters that affect them have also been explored successfully.

 ,
, 