An Improved Time-Frequency Analysis Method for Hydrocarbon Detection Based on EWT and SET


1
Geomathematics Key Laboratory of Sichuan Province, Chengdu University of Technology, Chengdu 610059, China
2
Postdoctoral Station of Geophysics, Chengdu University of Technology, Chengdu 610059, China
*
Author to whom correspondence should be addressed.
Energies 2017, 10(8), 1090; https://doi.org/10.3390/en10081090
Submission received: 6 July 2017
/
Revised: 21 July 2017
/
Accepted: 24 July 2017
/
Published: 26 July 2017
Abstract
:Oil and gas reservoirs can cause increased attenuation of seismic waves, which can be revealed by time-frequency analysis for direct detection of hydrocarbons. In this paper, a new method applying the empirical wavelet transform (EWT) in association with the synchroextracting transform (SET), named EWT-SET, is proposed as an improved time-frequency analysis method for hydrocarbon detection. The SET is a novel time-frequency analysis method which can be considered as a post-processing procedure of short-time Fourier transform and can improve the energy concentration of the time-frequency representation by retaining only the time-frequency information most related to the signal time-varying features. Given the potential limitations of SET for broadband nonstationary seismic signals, using the EWT-SET method which applies SET to the signal after EWT decomposition, not only effectively extracts time-varying features of seismic signals but also improves the performance of SET in concentrating instantaneous energy. The preliminary model tests demonstrate that EWT-SET can effectively depict the location and extent of attenuation anomalies related to hydrocarbons with changing thicknesses of the gas-bearing layer. Application to field data further confirms the capacity for hydrocarbon detection of the presented method. Thus, the EWT-SET method shows significant application prospects and promotion value for hydrocarbon detection.
1. Introduction
Due to the long-term exploitation of conventional oil and gas reservoirs, there is a small space to promote for the development of conventional oil and gas. However, global unconventional oil and gas resources are almost four times conventional oil and gas resources and the exploration of unconventional oil and gas is still stay in the developing stage [1]. Besides, unconventional reservoirs have complex geological structure and usually show poor petrophysical properties, such as strong heterogeneities, low porosity and permeability, which makes seismic signals more complex [2,3,4,5]. Therefore, it is necessary to find reliable methods, which can use seismic data directly for hydrocarbon detections in unconventional reservoirs. Time-frequency analysis can reveal the distribution of signal energy or strength in both time and frequency domains, which has played a significant role in seismic data processing and interpretation, such as reservoir characterization [6,7,8,9] and hydrocarbon detection [10,11,12].
Widely used time-frequency analysis methods, including short-time Fourier transform (STFT), wavelet transform (WT), S transform, Wigner–Ville distribution (WVD), and matching pursuit (MP) have been successfully applied for seismic time-frequency analysis [9,13,14,15,16]. However, restricted by cthe Heisenberg uncertainty principle, unexpected cross-terms, or increased computational costs [17], these methods show some limitations for practical purposes. More recently, some methods have been proposed to improve time-frequency resolution. These methods can be mainly classified as: (1) methods based on signal decomposition techniques, such as empirical mode decomposition (EMD) in combination with instantaneous frequency [18,19,20,21]; or (2) methods based on the combination of time-frequency methods followed by a reassignment step, such as synchrosqueezed wavelet transforms (SST) [22,23,24].
In 2017, inspired by the recently proposed SST and the theory that the signal energy of ideal time-frequency analysis should only appear in the instantaneous frequency trajectory, Yu et al. [25] proposed a novel time-frequency analysis method called synchroextracting transform (SET). Differing from the main idea of SST, which squeezes all time-frequency coefficients into the instantaneous frequency trajectory, SET removes the most-smeared time-frequency energy and only retains the time-frequency information from the STFT results most related to the time-varying features of the target signal, thus greatly enhancing the energy concentration [25].
SET is appropriate for exploring the trend in and instantaneous attributes of non-linear and nonstationary signals while different components of the target signal are separated by sufficient distance. Since seismic signals are nonstationary and non-linear and show the characteristics of broadband and multifrequency, the SET method alone is not effective when applied to seismic signals. Thus, it is necessary to decompose the target seismic data into monocomponent Amplitude Modulation-Frequency Modulation (AM-FM) signals before performing time-frequency analysis using SET.
Empirical wavelet transform (EWT), proposed by Gilles [26] in 2013, is a fully adaptive signal decomposition technique based on the frequency domain, which can decompose a multicomponent signal into a finite number of gradual AM-FM components also known as intrinsic mode functions (IMFs). Each IMF obtained by the EWT has a compact support Fourier spectrum and contains information on the local characteristics of the original signal. EWT differs from EMD and its variations in that it not only has stronger decomposition ability of signals, but also reduces the problems of mode-mixing and redundant mode [26,27].
In this paper, in combining the characteristics of SET and EWT, a new high-precision time-frequency analysis method named EWT-SET is proposed to process seismic signals for the purpose of hydrocarbon detection. The rest of this paper is organized as follows: Section 2 details the theory of EWT, SET, and the steps of realizing EWT-SET for hydrocarbon detection; in Section 3, a synthetic signal is used to demonstrate the high time-frequency resolution of EWT-SET compared to the methods combining EWT with Hilbert transform (EWT-HT) or only using SET; Section 4 applies three designed models of different thickness and the field data respectively to explore the capacity of EWT-SET for hydrocarbon detection in tight sandstone reservoirs; and lastly, conclusions are drawn in Section 5.
2. Theory
2.1. Empirical Wavelet Transform (EWT)
EWT, proposed by Gilles [26], is a novel and adaptive signal decomposition technique. The algorithm segments the Fourier spectrum based on the detected local maxima of the spectrum signal, and defines an appropriate wavelet filter bank on each segment, so as to extract the different modes, namely AM-FM signals.
Assume the Fourier spectrum is divided into N continuous segments and each segment is defined as , where () denotes the boundaries of each segment. Then define the empirical wavelets band-pass filters on each and center on each a transition phase of width is defined. Several options are possible for , i.e., is simplest; thus, the expressions for the Fourier transform of scaling function and the empirical wavelets are given as:
where the function is most used as:
Hence, the main steps of EWT are shown as:
- (1)
- Apply the FFT to the analyzed signal to obtain the frequency spectrum .
- (2)
- Estimate the relative optimal number N of modes, identify the largest N−1 maxima in , and sort them in decreasing order. Calculate the center between two consecutive maxima as the boundaries , thus obtain N−1 extra boundaries except 0 and .
- (3)
- According to the same method for the classic wavelet transform, the detail coefficients is defined by the inner products with the empirical wavelets. The approximation coefficient is denoted by the convention , which is given by the inner products with scaling function. The reconstruction can be given by:where represents the convolution operation.
- (4)
- According to the above formalism, the empirical mode can be expressed as:
2.2. Synchroextracting Transform (SET)
SET is a new time-frequency analysis method proposed by Yu in 2017 [25], which can be regarded as a post-processing procedure of STFT. The greatest advantage of SET is that this algorithm can obtain a more energy-concentrated time-frequency representation compared with classical time-frequency analysis methods through only obtaining the time-frequency information of STFT results most related to time-varying features of the target signal.
SET assumes that the multicomponent signal under investigation is the sum of nonstationary modes,
and the different modes are well separated by sufficient distance, i.e.,
where are the modes, their corresponding instantaneous amplitude (IA) and instantaneous phase, respectively. , as a one-order derivative of , denotes the instantaneous frequency (IF). Δ represents the frequency support of the window function. The STFT representation of signal is given in the following first-order approximation form:
Instantaneous frequencies (IF) are then calculated by:
where denotes the Fourier transform of the window function .
In order to enhance the energy concentration of the time-frequency representation, Yu et al. proposed to only retain the time-frequency information of the STFT results most related to time-varying features of the target signal and remove most of the smeared time-frequency energy, thus the SET expression should be written as:
where , which is called the synchroextracting operator (SEO).
Combining Equation (8) with Equation (10), the following expression can be deduced:
2.3. EWT-SET as a Hydrocarbon Detection Tool
Seismic attenuation is usually separated into attenuation connected to various physical processes, such as scattering effects, and attenuation corresponding to the conversion of seismic energy into heat or fluid flow [18,19,20,21,22,23,24,25,26,27,28,29,30]. When seismic signals propagate through hydrocarbon reservoirs, waves induced by fluid flow are the main causation of attenuation of energy and frequency. The characteristics of the loss of high-frequency energy and the conservation of strong low-frequency energy resulting from the above mention that attenuation can be found in different frequency data, which have been successfully applied for reservoir characterization and hydrocarbon detection by many scholars [31,32,33,34]. Time-frequency analysis is an important tool for revealing the variation of signals in both the time and frequency domains. Thus, hydrocarbon detection can be realized from the energy distribution of the different common frequency sections with time-frequency analysis methods.
To ensure adequate separation of each mode from the time-frequency representation, SET presupposes that different modes of the target signal are separated by sufficient distance, namely that there is the least possible aliasing of instantaneous frequency of different modes. It means that SET may not perform well when the instantaneous frequency of different modes is close. To take full advantage of SET, the seismic signals under investigation, which are usually considered as broadband nonlinear and nonstationary signals, are recommended to be decomposed into a group of AM-FM signals using signal decomposition technologies before applying SET. However, EWT can adaptively decompose a complicated seismic signal into a series of gradual AM-FM signals, which can better meet the conditions of SET compared to the original signal.
Therefore, the newly presented method in this paper combining EWT with SET shows potential for improved time-frequency resolution and it is theoretically possible to use EWT-SET as an effective time-frequency analysis tool for hydrocarbon detection.
The method using EWT-SET for hydrocarbon detection can be summarized as follows:
- (1)
- Decompose the target seismic signal into a series of IMFs using EWT, which can be expressed as gradual AM-FM signals.
- (2)
- Apply the SET to the IMFs to remove the most-smeared time-frequency energy and to obtain the energy-concentrated time-frequency spectrum.
- (3)
- Choose characteristic frequencies based on the attenuation comparison of several seismic traces.
- (4)
- Extract common frequency data based on the time-frequency spectrum obtained from EWT-SET, which can be employed to reveal the abnormal attenuation associated with hydrocarbons.
3. Comparative Analysis Between SET, EWT-SET, and EWT-HT
In this section, in order to illustrate the advantages of EWT-SET in terms of capturing valuable information of the different frequency components of a seismic signal, we designed a synthetic signal to compare the performance of EWT-SET, SET, and EWT-HT. The synthetic signal (Figure 1b) is a superposition of five distinct subsignals (Figure 1a) as follows:
is a seismic record simulated by an attenuated Ricker wavelet. The dominant frequency of the wavelet is 80 Hz and the attenuation factor (Q) is 70.
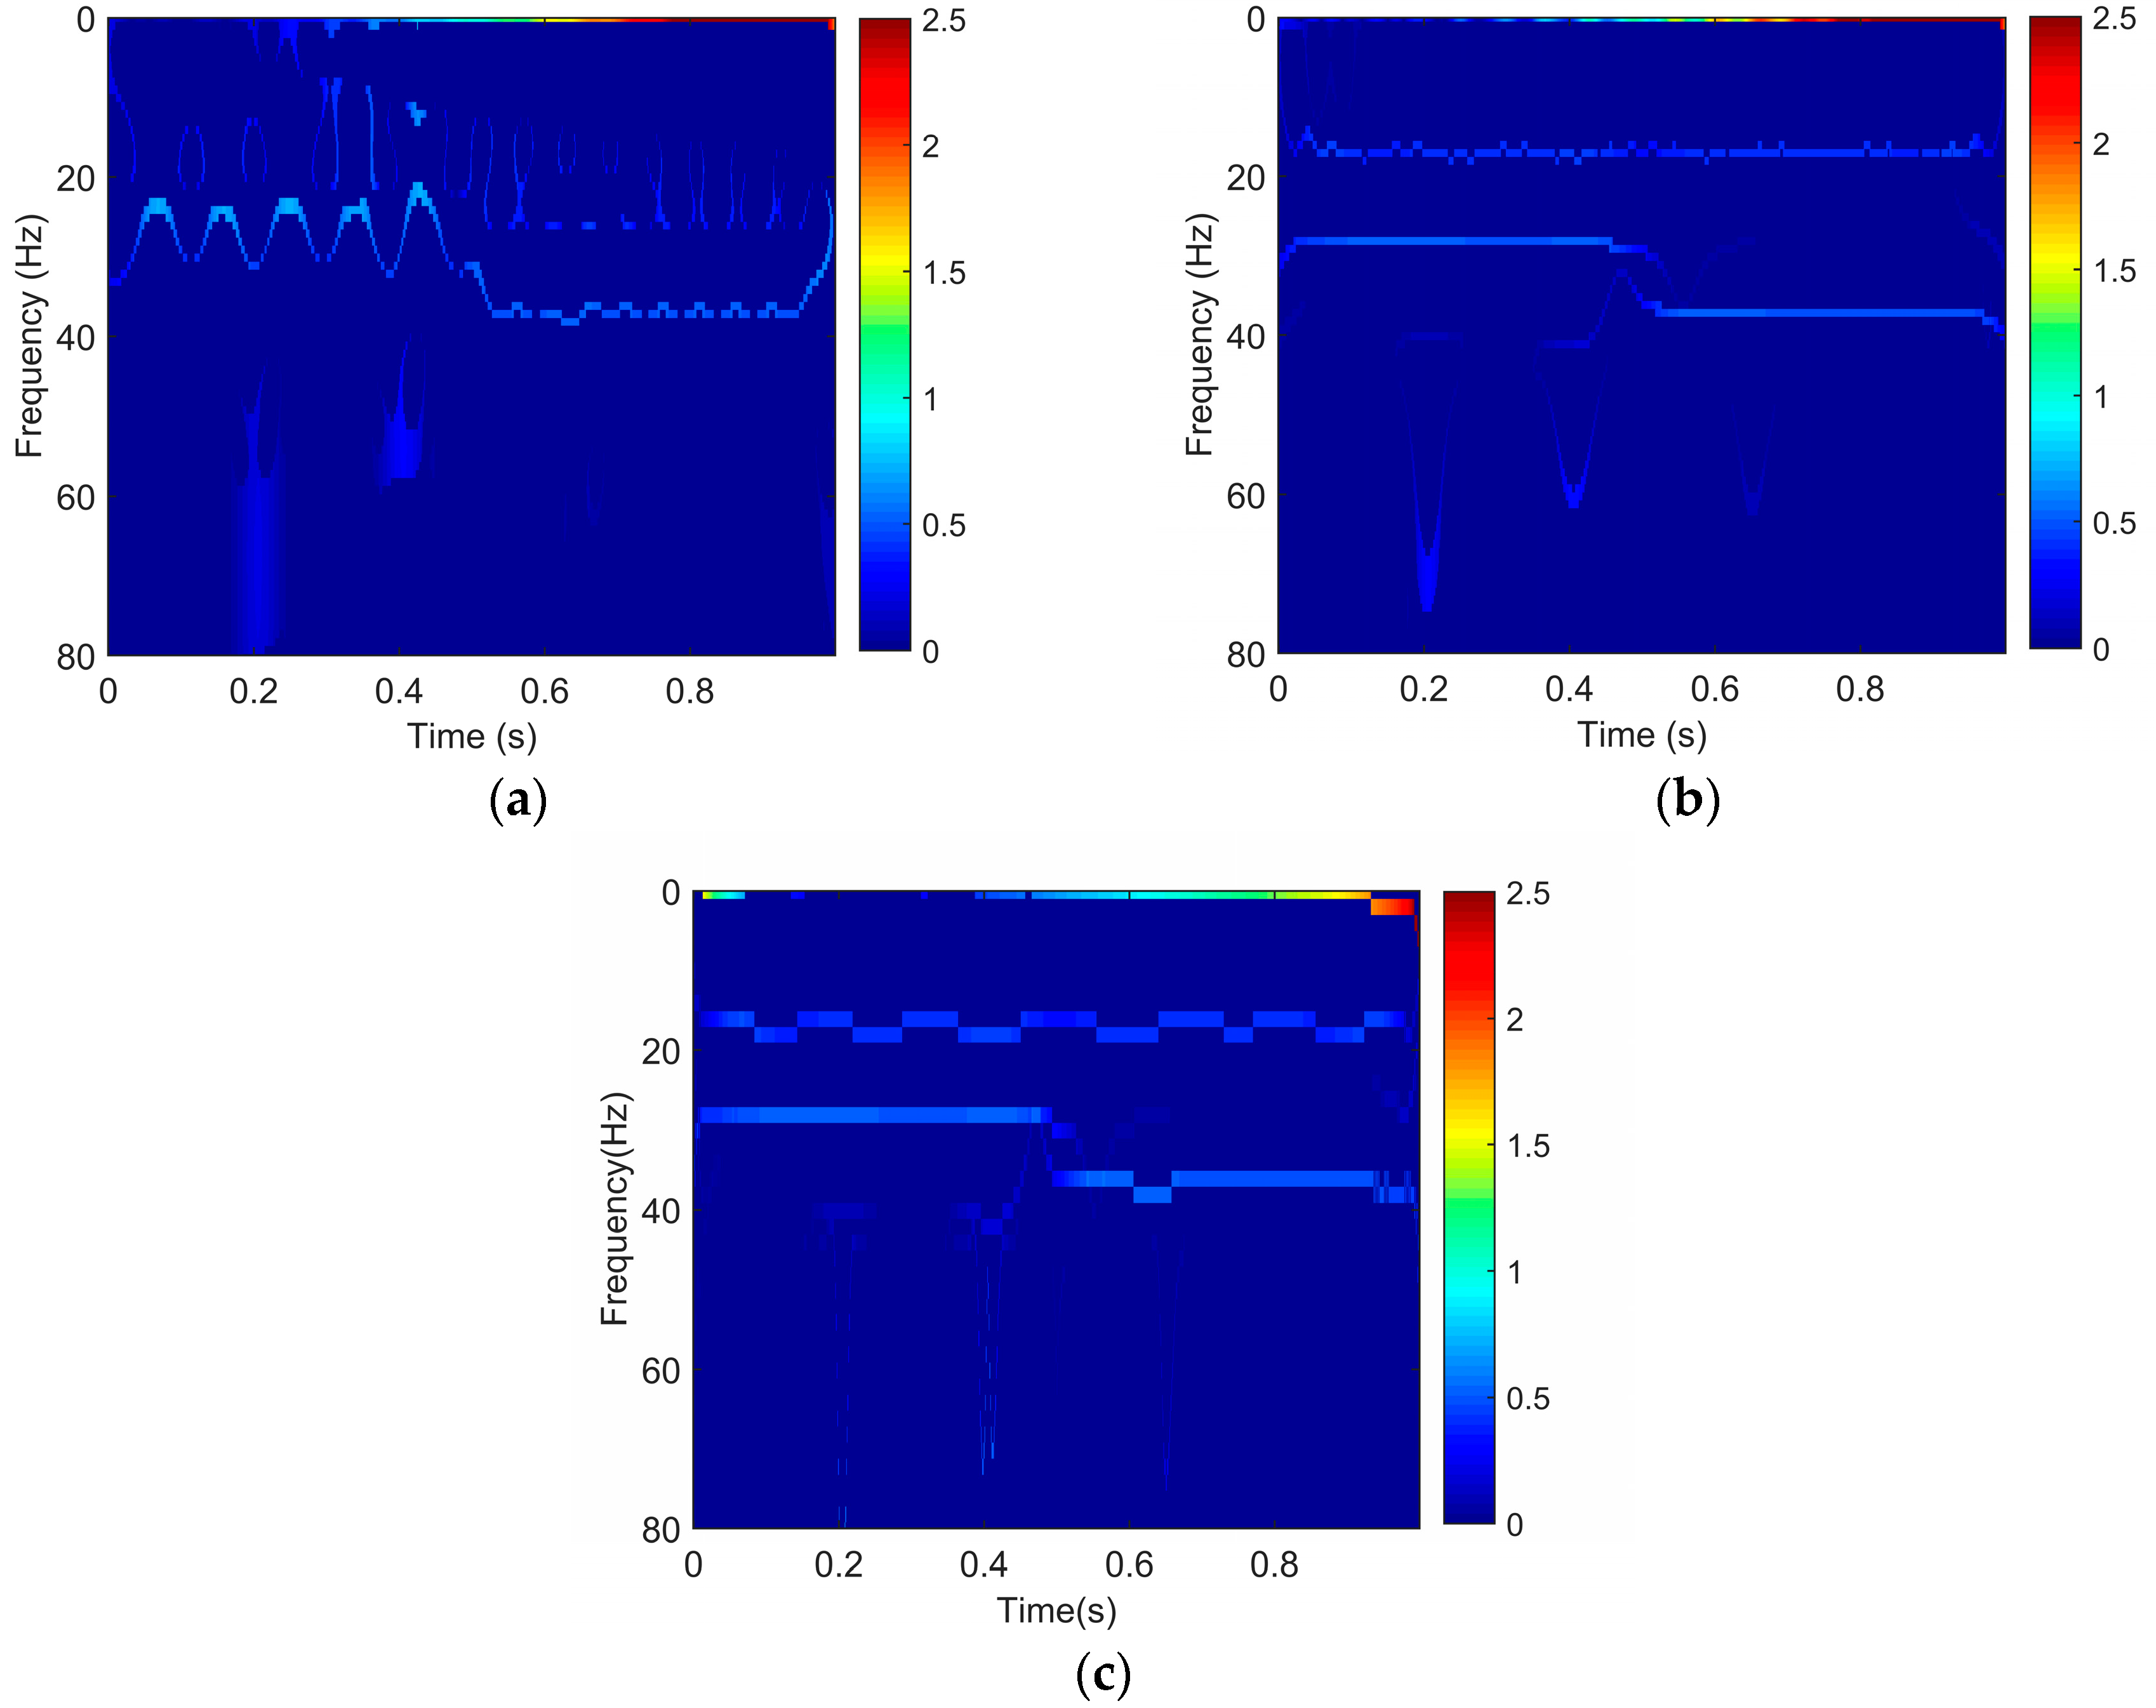
We utilize the SET, EWT-SET, and EWT-HT methods to obtain time-frequency spectra of the synthetic signal, which are presented in Figure 2. Figure 2a shows the SET result. It can be seen that it is difficult to accurately identify the frequency of 17 Hz and 28 Hz cosine wave. However, the EWT-SET method not only clearly identifies all individual components of the synthetic signal, but also can precisely depict frequency of the signal (Figure 2b), which demonstrates that it is necessary to adopt EWT for the decomposition of multicomponent signals before the SET is applied. Although the EWT-HT result shown in Figure 2c is similar to EWT-SET at first glance, the EWT-SET method (Figure 2b) can obtain a higher frequency resolution compared to EWT-HT (Figure 2c).
Thus, the EWT-SET method is beneficial for extracting valuable information from different frequency components and becomes a valuable tool for high-resolution time-frequency analysis of seismic signals.
4. Hydrocarbon Detection Using EWT-SET
Tight sandstone reservoirs show strong heterogeneities and have the geological characteristics of low porosity and low permeability [2,35], thus making it important to find a high-resolution time-frequency analysis method for the identification of hydrocarbon reservoirs. In this section, we attempt to apply the EWT-SET method to the field data, which is typical of tight sandstone reservoirs from the Zhongjiang gas field located in Western Sichuan, China. Three models and the field data are adopted to preliminarily demonstrate and confirm the effectiveness and reliability of the EWT-SET method for hydrocarbon detection in the tight sandstone reservoir.
4.1. Model Test
Inspired by the method that simulated the seismic response based on the diffusive viscous wave equation [36,37] and considering that the different locations within the reservoir have different thicknesses in field data, we designed three geological modes with different thicknesses of gas-bearing layers to obtain a reliable result of EWT-SET for hydrocarbon detection.
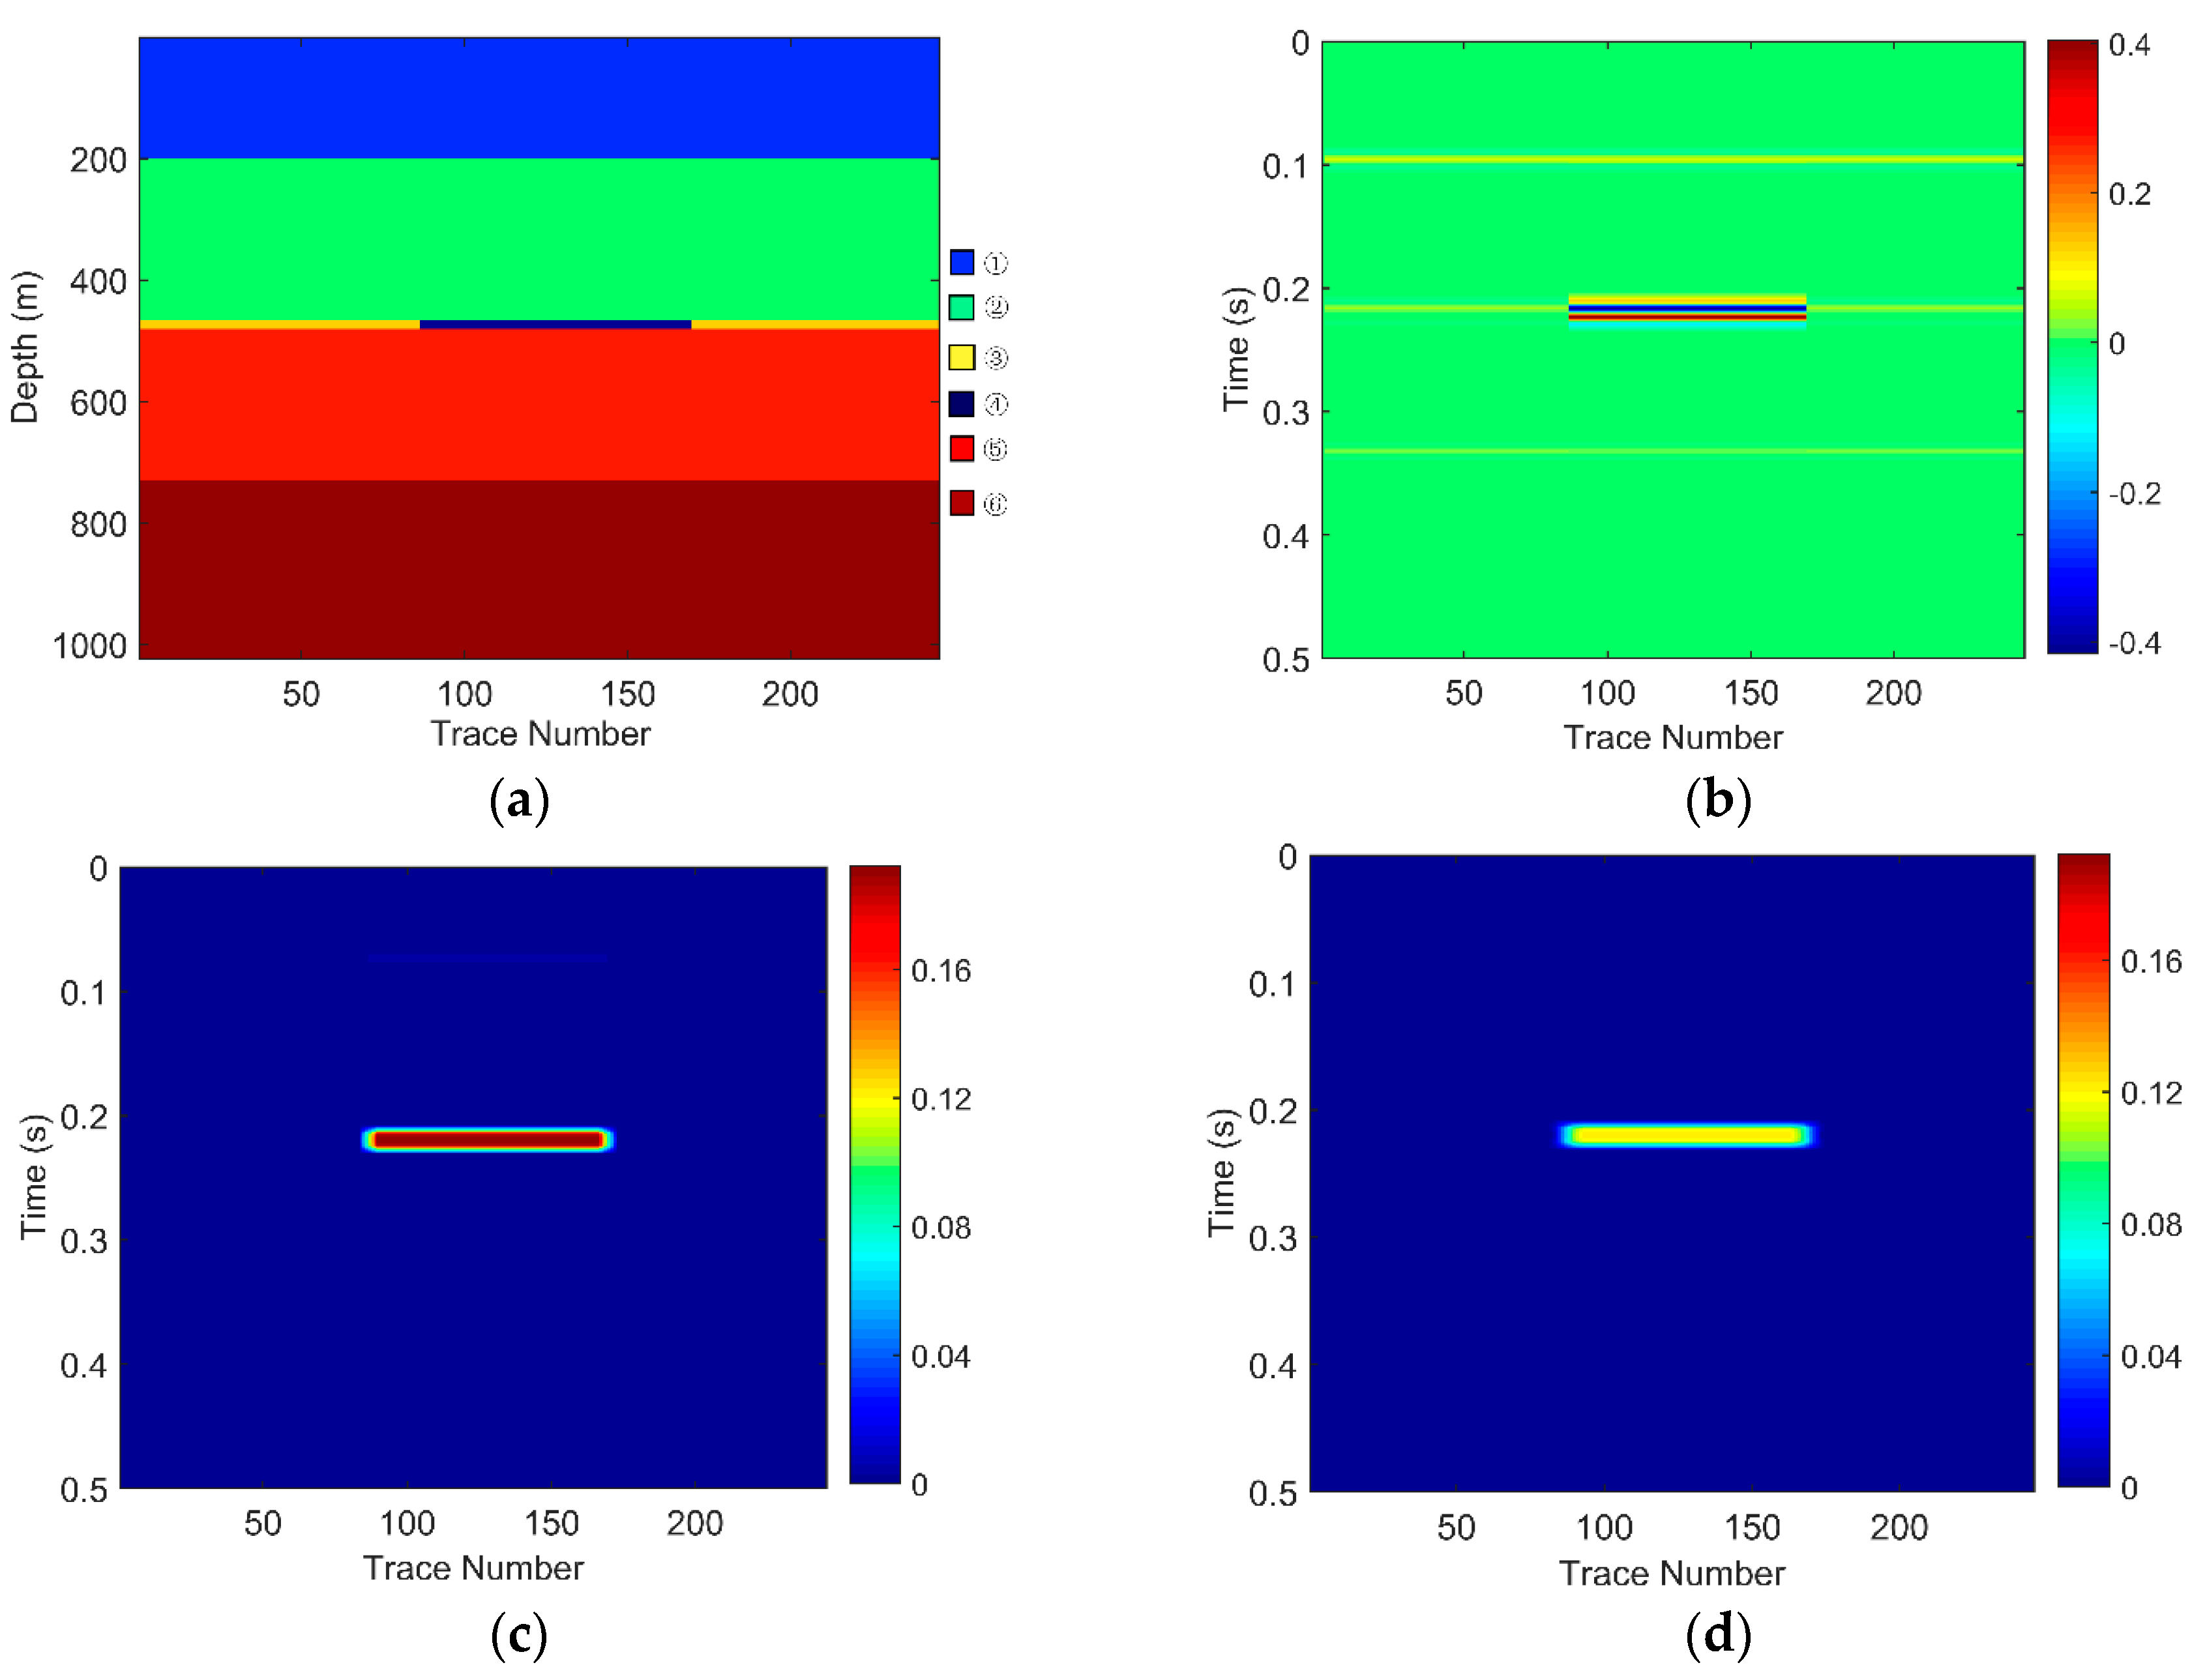
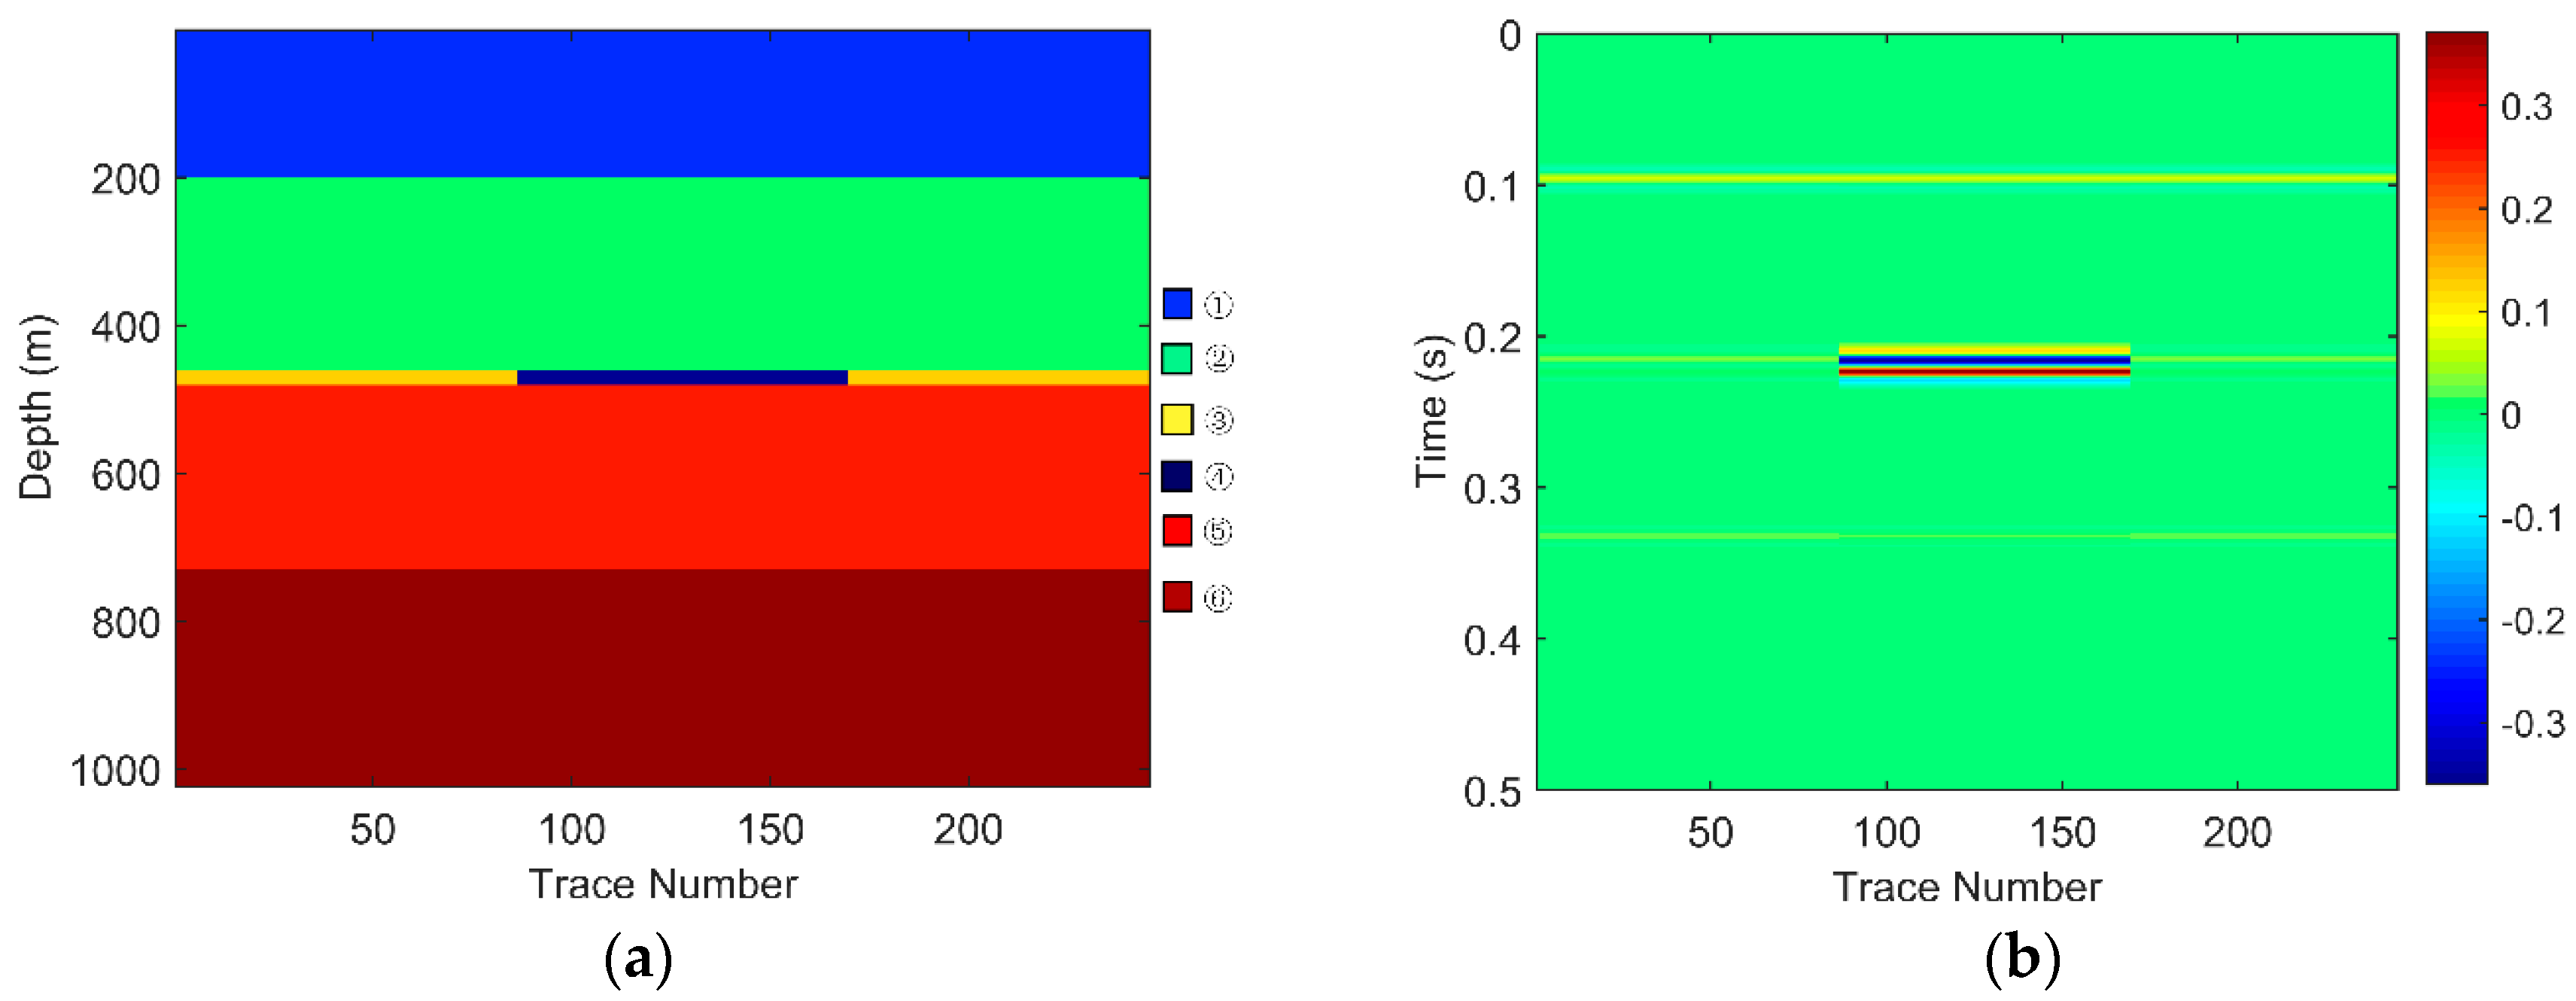
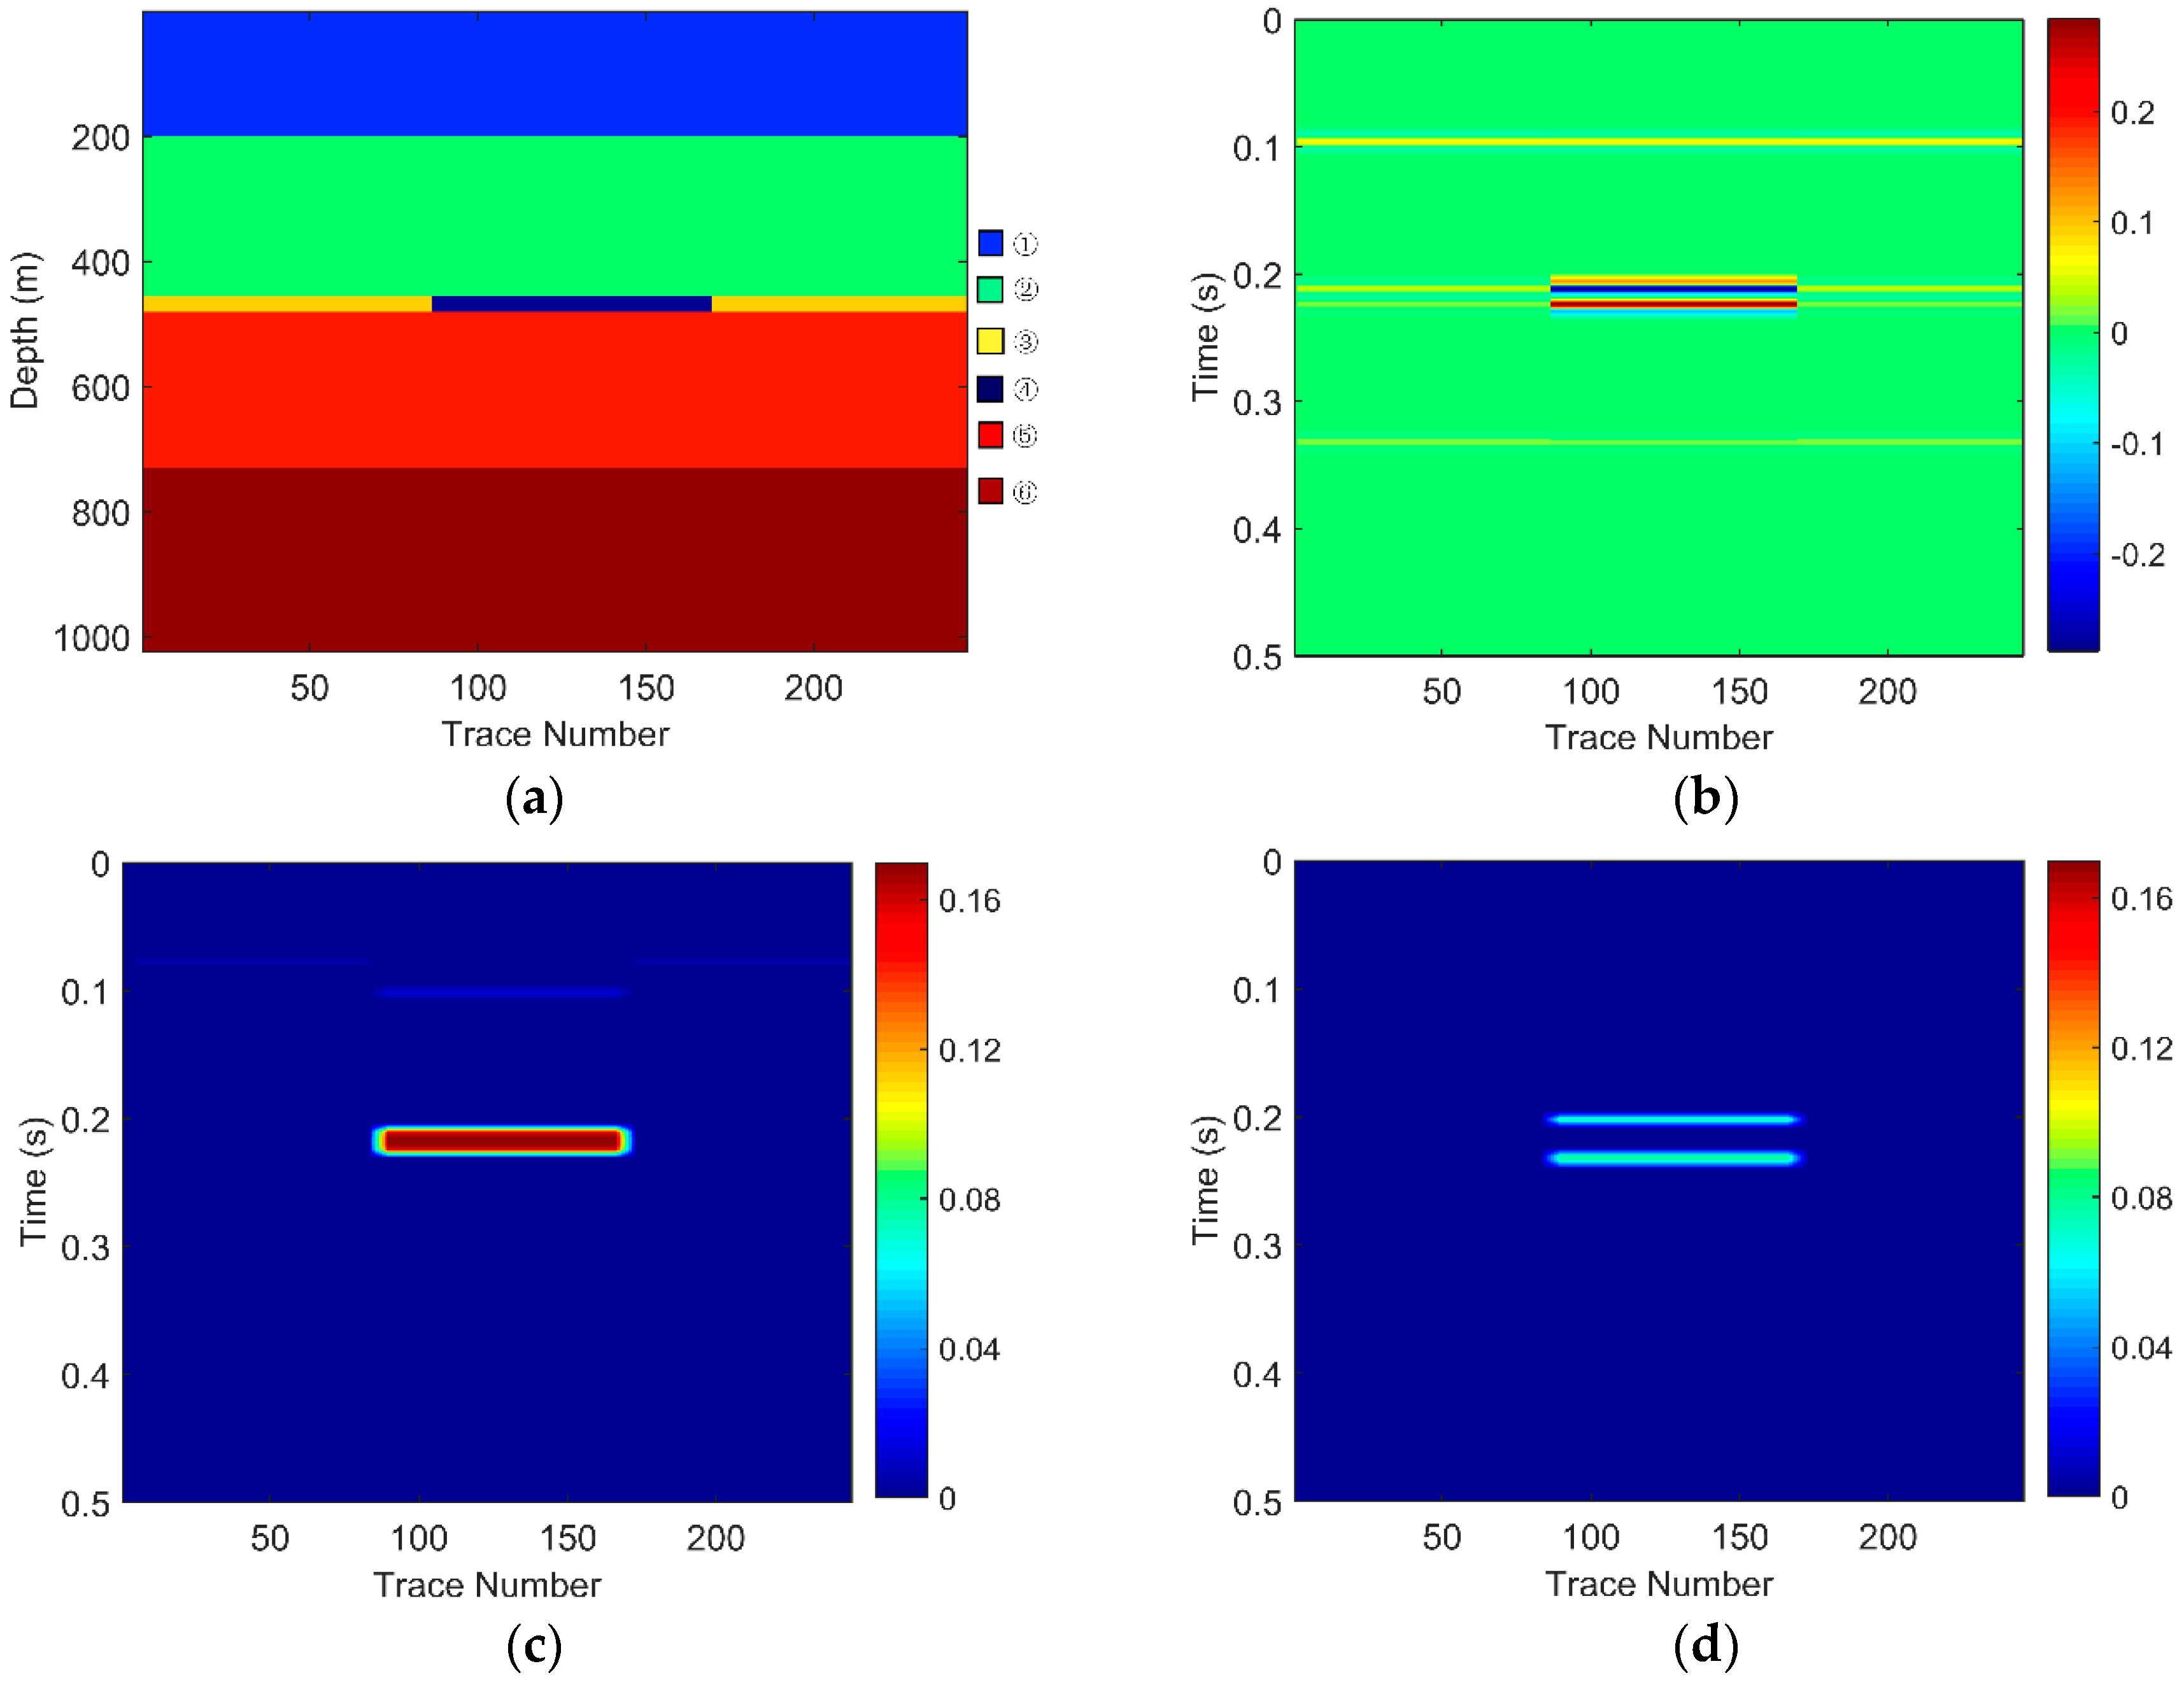
There are six layers in the models. The layer marked ④ is a gas-bearing reservoir. The parameters of each layer shown in Table 1 are set as the equivalent parameters of the seismic data and logging data from the Zhongjiang gas field located in the Western Sichuan Basin, China. The gas-bearing layers of three models are 15 m, 20 m, and 30 m, respectively. Considering that the dominant frequency of the field data is around 30 Hz, the frequency of the wavelet of these three models was set to 30 Hz. Sampling frequency was 1000 Hz. The geological models and their corresponding seismic responses are, respectively, shown in Figure 3, Figure 4 and Figure 5.
The EWT-SET method is applied to the simulated seismic sections of the models (Figure 3b, Figure 4b and Figure 5b). Following this, we extract the 26 Hz low-frequency sections (Figure 3c, Figure 4c and Figure 5c) and the 37 Hz high-frequency sections (Figure 3d, Figure 4d and Figure 5d) on the time-frequency spectra based on the EWT-SET method.
As can be seen from Figure 3, Figure 4 and Figure 5, compared with other regions, the areas of the gas-bearing reservoir all appear with strong reflection. In the low frequency sections, we can easily find the strong energy in the gas reservoir but the strong energy is weakened while in the high frequency sections. This phenomenon is consistent with the attenuation characteristic of seismic waves when they propagate through hydrocarbon reservoirs, which not only demonstrates that the EWT-SET method can be adopted but also illustrates the availability of EWT-SET for hydrocarbon detection with a changing thickness in the gas-bearing layer. Furthermore, as the thickness of the gas-bearing layer is increased, the attenuation of high frequency energy becomes more obvious and the upper and lower boundaries of the reservoir are gradually depicted.
Therefore, the EWT-SET method is not only effective for hydrocarbon detection, but also shows potential ability to provide an initial estimate of the thickness of the gas-bearing reservoir.
4.2. Field Data
We adopt the two-dimensional (2-D) seismic field data from the Zhongjiang gas field located in Western Sichuan, China for further analysis, which consists of 1079 seismic traces with a time sample interval of 2 ms, as shown in Figure 6a. The zone between a black solid curve and a black dotted curve is a gas reservoir-developed area. The three red vertical lines denote three wells, which are represented symbolically by A, B, and C. Among them, well A and well C are gas wells and well B is a dry well. We extract seismic signals intersecting well B and well C, and display their waveforms in Figure 6b.
4.2.1. Characteristic Frequency Selection
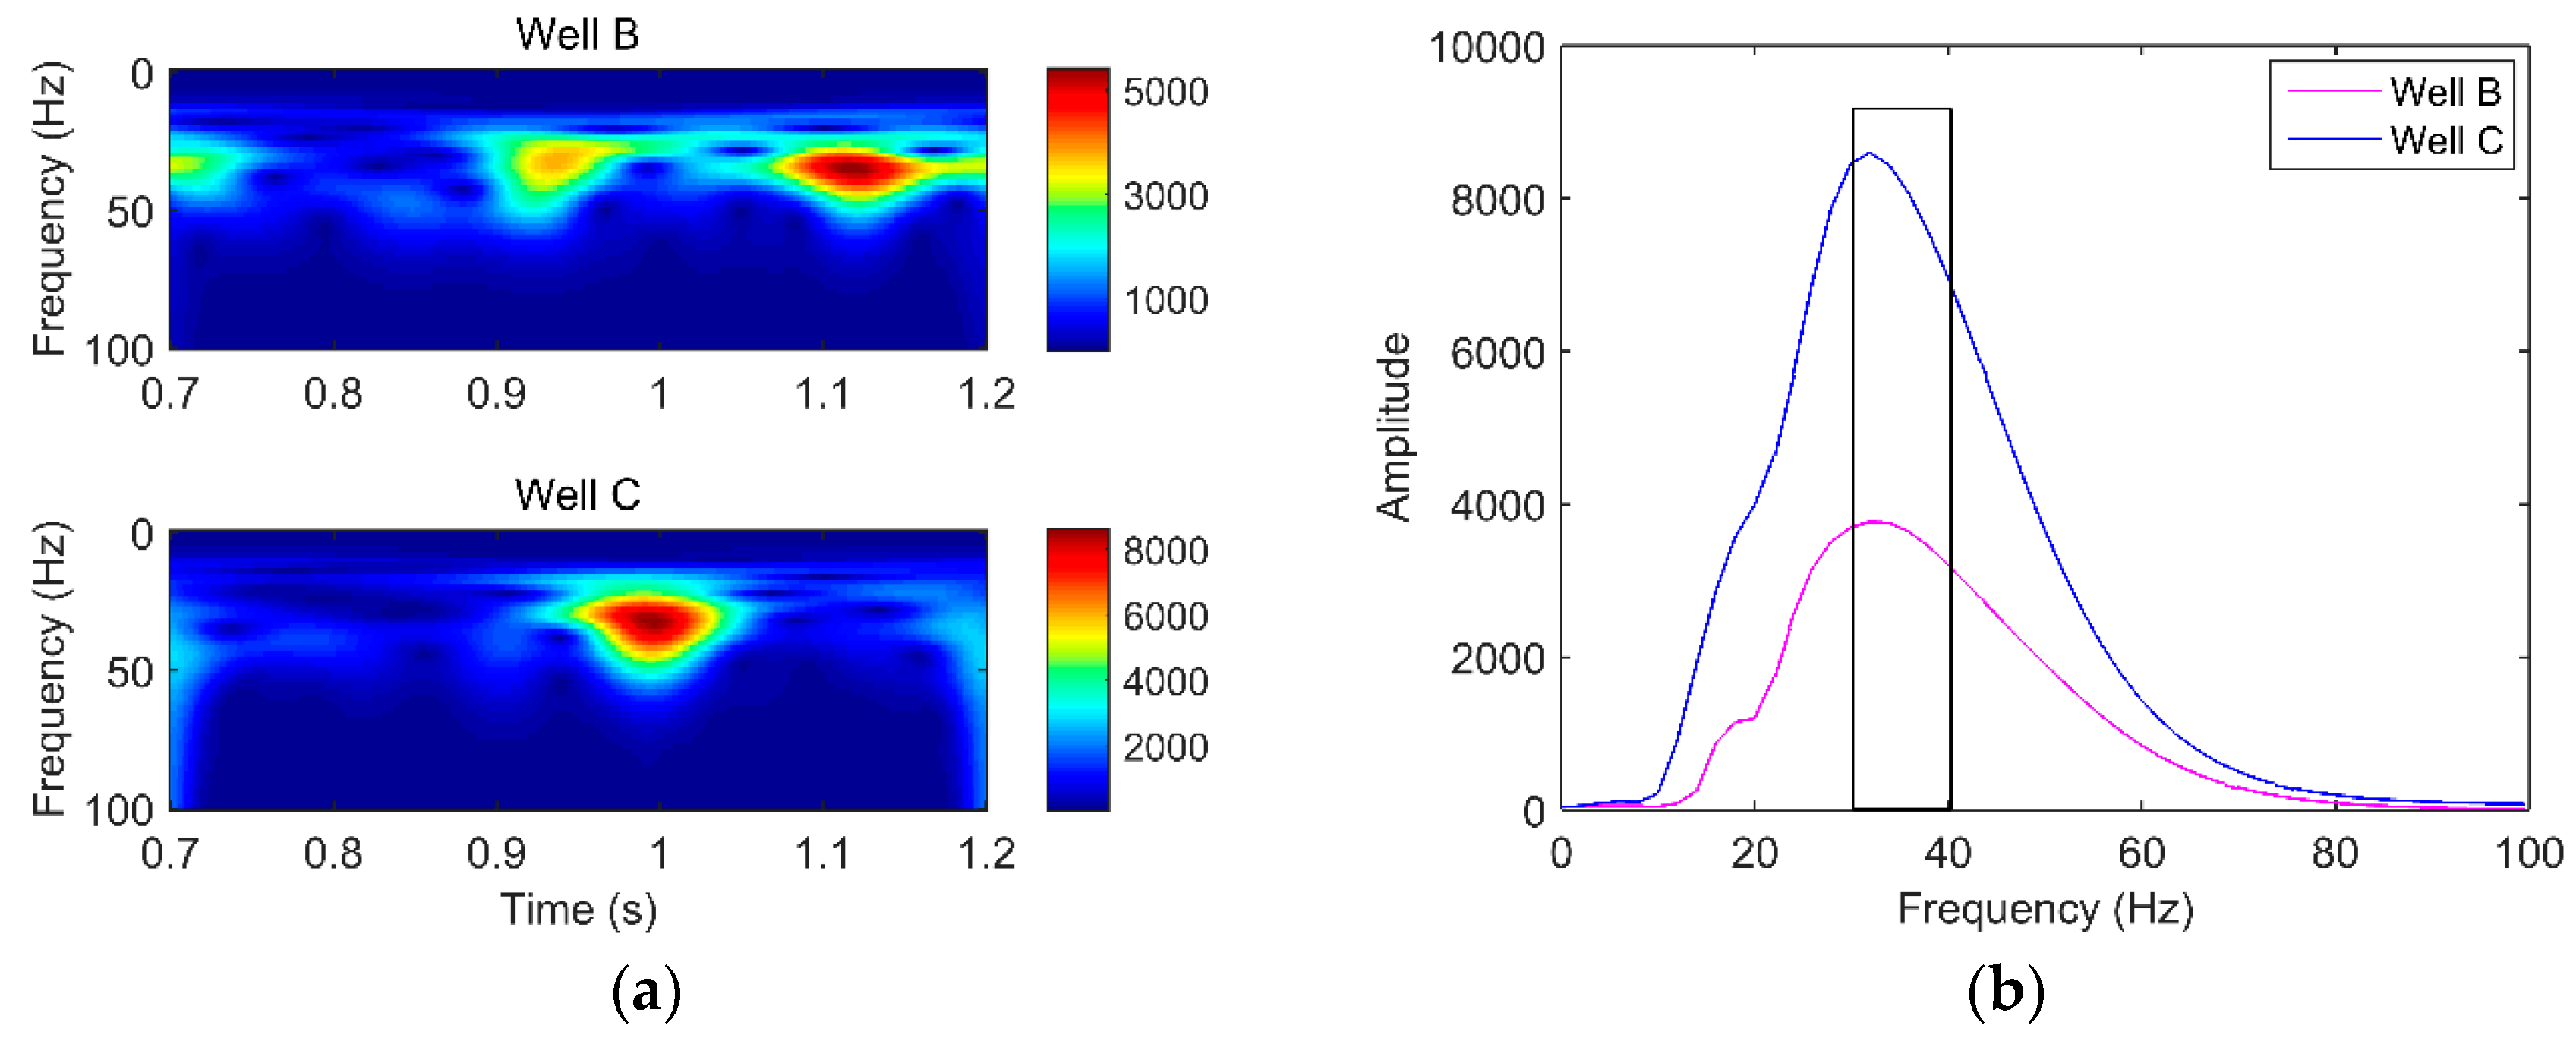
To select appropriate characteristic frequencies for further hydrocarbon detection, we first obtained the dominant frequency range of the seismic section by the time-frequency analysis of well B and well C. As can be seen from Figure 7a, no matter whether the seismic signal travels across the reservoir or not, we find that the range of frequency with a strong amplitude is 27–45 Hz. Then, slices of the spectrogram from well B and well C at the reservoir interval were extracted for the comparison of energy attenuation. From the black rectangle in Figure 7b, it can be seen that well B decayed more rapidly than well C. According to the above analysis, we reasonably selected 30 Hz and 40 Hz as the low and high frequencies, respectively.
4.2.2. Hydrocarbon Detection
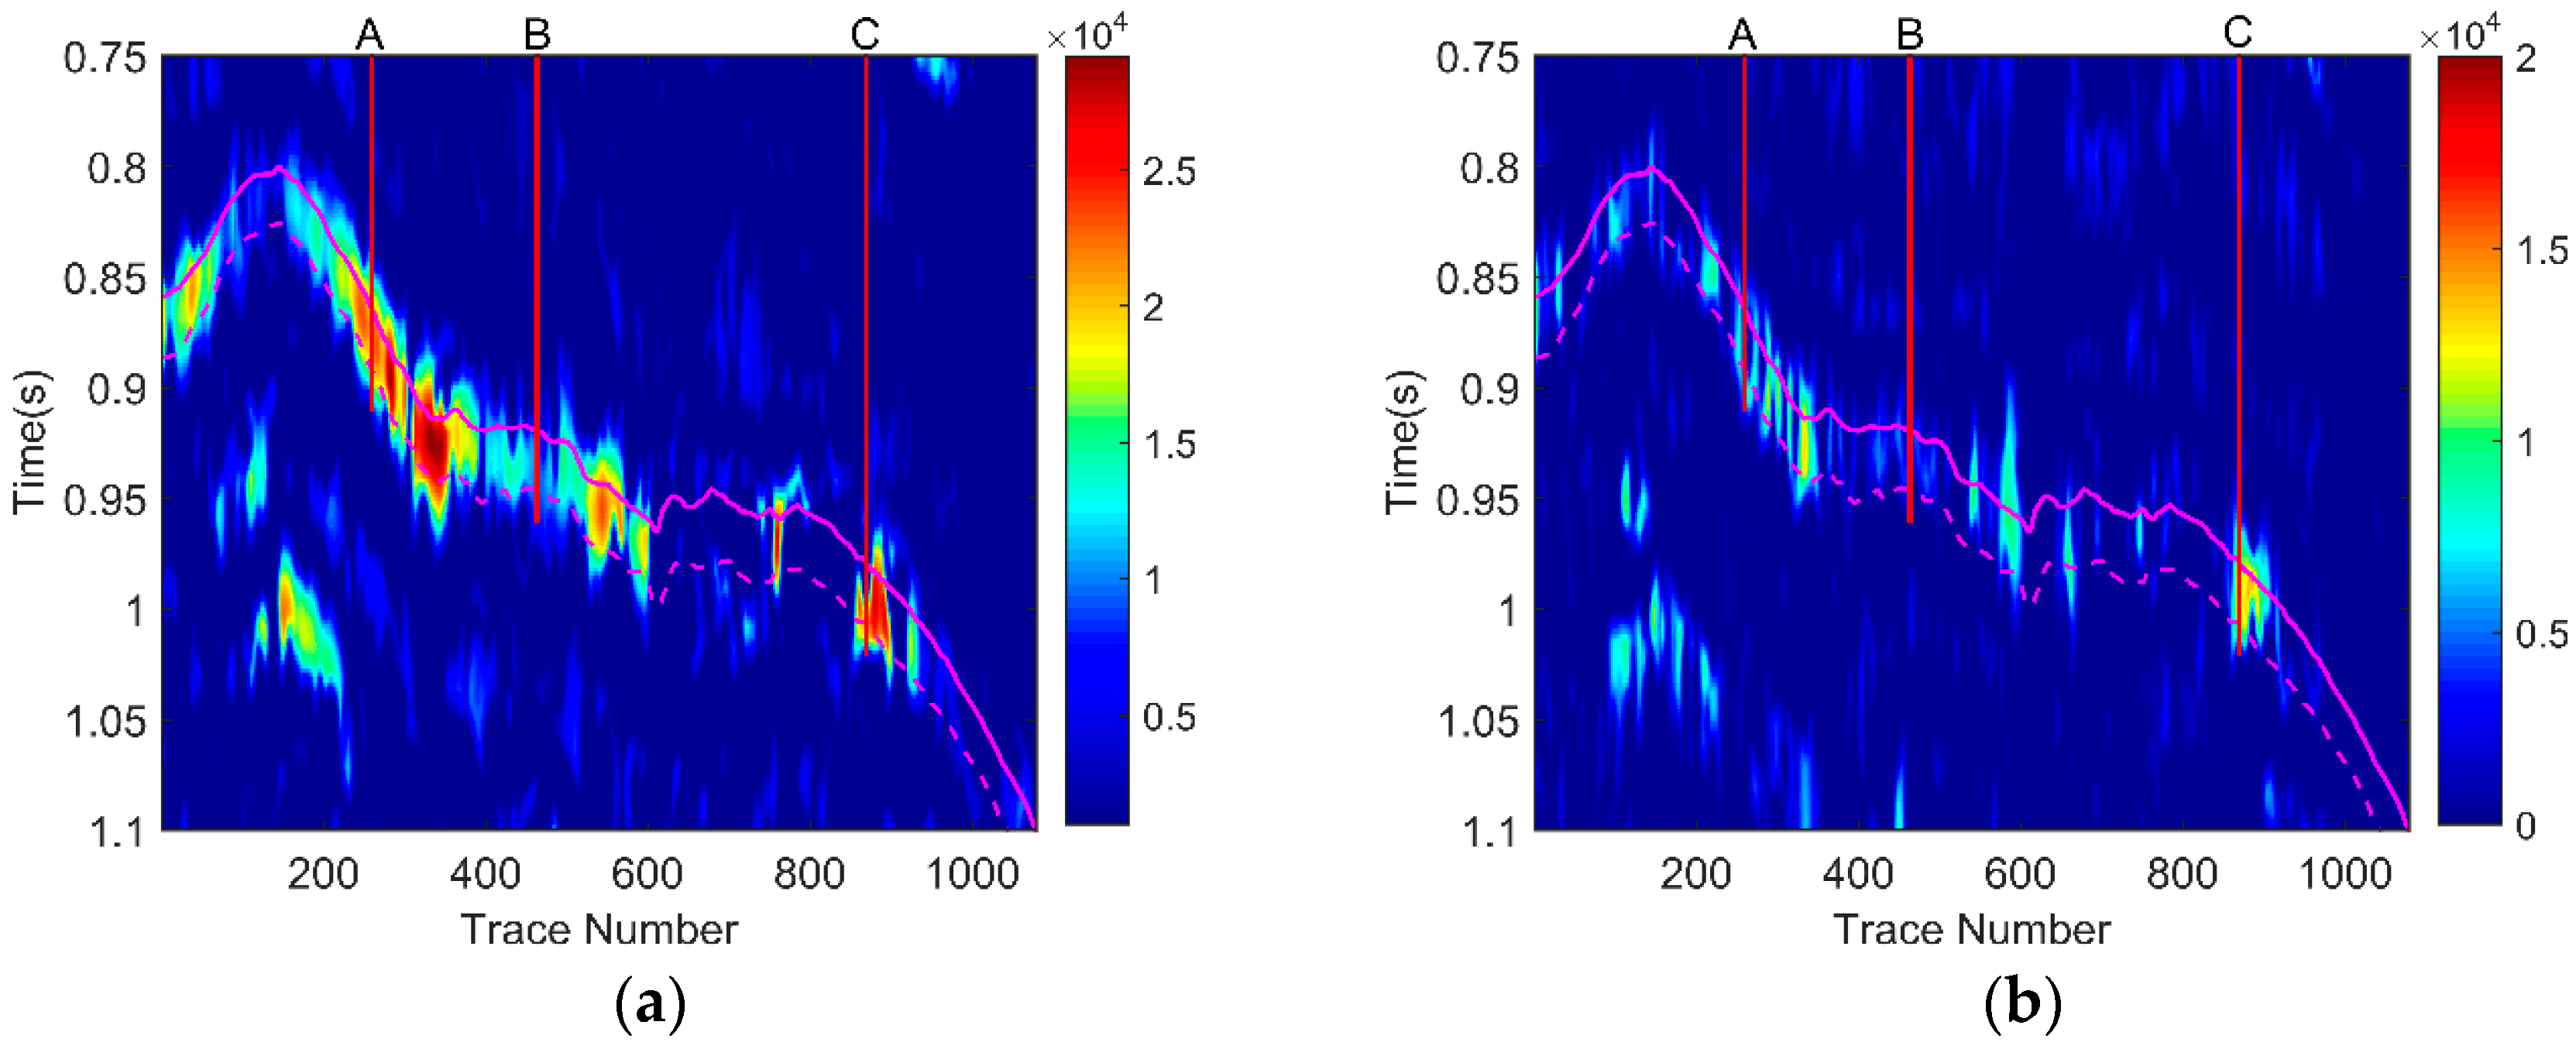
In the following, we extracted common frequency sections (Figure 8) based on time-frequency spectra obtained by the EWT-SET process of every seismic trace from the 2-D seismic field data (Figure 6a).
Figure 8 displays the low-frequency section of 30 Hz (Figure 8a) and the high-frequency section of 40 Hz (Figure 8b). The gas reservoir developed area has been depicted clearly using EWT-SET. Comparing the low-frequency section (Figure 8a) with the high-frequency section (Figure 8b), we can find that in the low-frequency section, there exists a strong energy near wells A and C, but in the high-frequency section the energy has been absorbed. However, for the energy of well B, there is no obvious change whether in the high-frequency or low-frequency section. This phenomenon is consistent with the fact that wells A and C are gas wells and well B is dry. Thus, the EWT-SET method is an effective tool for hydrocarbon detection in tight sandstone gas reservoirs.
5. Conclusions
In this paper, inspired by the newly developed SET, an improved time-frequency analysis method combining EWT and SET is proposed for hydrocarbon detection, which is termed EWT-SET. The proposed method employing EWT to produce IMFs before time-frequency analysis by SET not only inherits both the merits of EWT and SET, which makes it effective for separating and identifying the frequency components of multicomponent signals, but also provides higher resolution in the synthetic signal compared to using EWT-HT or only using SET. The three models with different thicknesses of gas-bearing layer have been used to confirm the effectiveness of EWT-SET for hydrocarbon detection in the tight sandstone reservoir. The application of the presented method to the Zhongjiang gas field located in Western Sichuan, China illustrates that the proposed method can be successfully applied to the field data for the purpose of hydrocarbon detection. Thus, the EWT-SET method is suitable for seismic data analysis and is highly promising for the depiction of the increased attenuation associated with hydrocarbon.
Acknowledgments
The work presented in this paper has been supported by the National Natural Science Foundation of China (No. 41304111), key project of Science Technology Department of Sichuan Province (No. 2016JY0200), Natural Science project of Education Department of Sichuan Province (No. 14ZA0061, 16ZB0101 and 17ZA0030), the Sichuan Provincial Youth Science and Technology Innovative Research Group Fund (No. 2016TD0023) and the Cultivating Programme of Excellent Innovation Team of Chengdu University of Technology (No. KYTD201410).
Author Contributions
Ying Hu and Hui Chen conceived the idea of this research. Ying Hu, Hui Chen, and Jiaxing Kang build a detail analysis framework. Jiaxing Kang, Yuanchun Chen and Dan Xu conceived, designed and performed the experiments under supervision of Ying Hu and Hui Chen. Ying Hu provide seismic data. Yuanchun Cheng and Dan Xu analyzed the data. The paper was written by all the authors with different degree of contribution.
Conflicts of Interest
The authors declare no conflicts of interest.
References
- Zou, C.; Yang, Z.; Dai, J.; Dong, D.; Zhang, B.; Wang, Y.; Deng, S.; Huang, J.; Liu, K.; Yang, C.; et al. The characteristics and significance of conventional and unconventional Sinian–Silurian gas systems in the Sichuan Basin, central China. Mar. Pet. Geol. 2015, 64, 386–402. [Google Scholar] [CrossRef]
- Holditch, S.A. Tight gas sands. J. Pet. Technol. 2006, 58, 86–93. [Google Scholar] [CrossRef]
- Cander, H. What is unconventional resources. In Proceedings of the AAPG Annual Convention and Exhibition, Long Beach, CA, USA, 22–25 April 2012; pp. 1–3. [Google Scholar]
- Dewhurst, D.N.; Jones, R.M.; Raven, M.D. Microstructural and petrophysical characterization of Muderong Shale: Application to top seal risking. Pet. Geosci. 2002, 8, 371–383. [Google Scholar] [CrossRef]
- Bourdet, J.; Pironon, J.; Levresse, G.; Tritlla, J. Petroleum accumulation and leakage in a deeply buried carbonate reservoir, Níspero field (Mexico). Mar. Pet. Geol. 2010, 27, 126–142. [Google Scholar] [CrossRef]
- Partyka, G.; Gridley, J.; Lopez, J. Interpretational applications of spectral decomposition in reservoir characterization. Lead. Edge 1999, 18, 353–360. [Google Scholar] [CrossRef]
- Liu, J.L.; Marfurt, K.J. Instantaneous spectral attributes to detect channels. Geophysics 2007, 72, P23–P31. [Google Scholar] [CrossRef]
- Huang, Z.; Zhang, J.; Zhao, T.; Sun, Y. Synchrosqueezing S-Transform and Its Application in Seismic Spectral Decomposition. IEEE Trans. Geosci. Remote Sens. 2016, 54, 817–825. [Google Scholar] [CrossRef]
- Wu, X.Y.; Liu, T.Y. Seismic spectral decomposition and analysis based on Wigner–Ville distribution for sandstone reservoir characterization in West Sichuan depression. J. Geophys. Eng. 2010, 7, 126–134. [Google Scholar] [CrossRef]
- Castagna, J.P.; Sun, S.J.; Siegfried, R.W. Instantaneous spectral analysis: Detection of low-frequency shadows associated with hydrocarbons. Lead. Edge 2003, 22, 120–127. [Google Scholar] [CrossRef]
- Liu, C.C.; Chen, B.S.; Han, M.; Han, L.G.; Shang, S. Reassigned wavelet spectral decomposition and its application in hydrocarbon detection. In Proceedings of the SEG Technical Program Expanded Abstracts 2013, Houston, TX, USA, 22–27 September 2013; pp. 2611–2615. [Google Scholar]
- Liu, W.; Cao, S.; Wang, Z.; Kong, X.; Chen, Y. Spectral Decomposition for Hydrocarbon Detection Based on VMD and Teager–Kaiser Energy. IEEE Geosci. Remote Sens. Lett. 2017, 14, 539–543. [Google Scholar] [CrossRef]
- Sinha, S.; Routh, P.S.; Anno, P.D.; Castagna, J.P. Spectral decomposition of seismic data with continuous-wavelet transform. Geophysics 2005, 70, 19–25. [Google Scholar] [CrossRef]
- De Matos, M.C. Characterization of thin beds through joint time-frequency analysis applied to a turbidite reservoir in Campos Basin, Brazil. In Proceedings of the SEG Technical Program Expanded Abstracts 2005, Houston, TX, USA, 6–11 November 2005; pp. 1429–1432. [Google Scholar]
- Li, D.; Castagna, J.; Goloshubin, G. Investigation of generalized S-transform analysis windows for time-frequency analysis of seismic reflection data. Geophysics 2016, 81, V235–V247. [Google Scholar] [CrossRef]
- Zhang, X.; Han, L.; Wang, Y.; Shan, G. Seismic spectral decomposition fast matching pursuit algorithm and its application. Geophys. Prospect. Pet. 2010, 49, 1–6. [Google Scholar]
- Tary, J.B.; Herrera, R.H. Spectral estimation—What is new? What is next? Rev. Geophys. 2014, 52, 723–749. [Google Scholar] [CrossRef]
- Huang, N.E.; Shen, Z.; Long, S.R.; Wu, M.C.; Shih, H.H.; Zheng, Q.; Yen, N.-C.; Tung, C.C.; Liu, H.H. The empirical mode decomposition and the Hilbert spectrum for nonlinear and non-stationary time series analysis. Proc. R. Soc. Lond. A 1998, 454, 903–995. [Google Scholar] [CrossRef]
- Tong, W.; Zhang, M.; Yu, Q.; Zhang, H. Comparing the applications of EMD and EEMD on time–frequency analysis of seismic signal. J. Appl. Geophys. 2012, 83, 29–34. [Google Scholar]
- Han, J.J.; van der Baan, M. Empirical mode decomposition for seismic time-frequency analysis. Geophysics 2013, 78, O9–O19. [Google Scholar] [CrossRef]
- Xue, Y.; Cao, J.; Tian, R.; Du, H.; Shu, Y. Application of the empirical mode decomposition and wavelet transform to seismic reflection frequency attenuation analysis. J. Pet. Sci. Eng. 2014, 122, 360–370. [Google Scholar] [CrossRef]
- Daubechies, I.; Lu, J.; Wu, H.-T. Synchrosqueezed wavelet transforms: An empirical mode decomposition-like tool. Appl. Comput. Harmon. Anal. 2011, 30, 243–261. [Google Scholar] [CrossRef]
- Chen, Y.; Liu, T.; Chen, X.; Li, J.; Wang, E. Time-frequency analysis of seismic data using synchrosqueezing wavelet transform. J. Seism. Explor. 2014, 23, 303–312. [Google Scholar]
- Herrera, R.H.; Han, J.; van der Baan, M. Applications of the synchrosqueezing transform in seismic time-frequency analysis. Geophysics 2014, 79, V55–V64. [Google Scholar] [CrossRef]
- Yu, G.; Yu, M.; Xu, C. Synchroextracting Transform. IEEE Trans. Ind. Electron. 2017, PP, 1. [Google Scholar] [CrossRef]
- Gilles, J. Empirical wavelet transform. IEEE Trans. Signal Process. 2013, 61, 3999–4010. [Google Scholar] [CrossRef]
- Kedadouche, M.; Thomas, M.; Tahan, A. A comparative study between Empirical Wavelet Transforms and Empirical Mode Decomposition Methods: Application to bearing defect diagnosis. Mech. Syst. Signal Process. 2016, 81, 88–107. [Google Scholar] [CrossRef]
- Müller, T.M.; Gurevich, B.; Lebedev, M. Seismic wave attenuation and dispersion resulting from wave-induced flow in porous rocks—A review. Geophysics 2010, 75, 75A147–75A164. [Google Scholar] [CrossRef]
- Tary, J.B.; van der Baan, M.; Herrera, R. Attenuation estimation using high resolution time–frequency transforms. Digit. Signal Process. 2016, 60, 46–55. [Google Scholar] [CrossRef]
- Yin, X.Y.; Zong, Z.Y.; Wu, G.C. Research on seismic fluid identification driven by rock physics. Sci. China Earth Sci. 2015, 58, 159–171. [Google Scholar] [CrossRef]
- Goloshubin, G.; Van Schuyver, C. Reservoir imaging using low frequencies of seismicreflections. Lead. Edge 2006, 25, 527–531. [Google Scholar] [CrossRef]
- Xiong, X.-J.; He, X.-L.; Pu, Y.; He, Z.-H.; Lin, K. High-precision frequency attenuation analysis and its application. Appl. Geophys. 2011, 8, 337–343. [Google Scholar] [CrossRef]
- Li, F.; Li, W.; Li., Y.; Zhang, Y.; Zheng, X. Hydrocarbon detection for cavern carbonate reservoir using low-and-high-frequency anomalies in spectral decomposition. In Proceedings of the SEG Technical Program Expanded Abstracts 2012, Las Vegas, NV, USA, 4–9 November 2012; pp. 1–5. [Google Scholar]
- Xue, Y.; Cao, J.; Tian, R. A comparative study on hydrocarbon detection using three EMD-based time–frequency analysis methods. J. Appl. Geophys. 2013, 89, 108–115. [Google Scholar] [CrossRef]
- Zou, C.; Zhu, R.; Liu, K.; Su, L.; Bai, B.; Zhang, X.; Yuan, X.; Wang, J. Tight gas sandstone reservoirs in China: Characteristics and recognition criteria. J. Pet. Sci. Eng. 2012, 88, 82–91. [Google Scholar] [CrossRef]
- Korneev, V.A.; Goloshubin, G.M. Seismic low-frequency effects in monitoring fluid-saturated reservoirs. Geophysics 2004, 69, 522–532. [Google Scholar] [CrossRef]
- Xue, Y.; Cao, J.; Tian, R. EMD and Teager–Kaiser energy applied to hydrocarbon detection in a carbonate reservoir. Geophys. J. Int. 2014, 197, 277–291. [Google Scholar] [CrossRef]
Figure 1.
(a) Subsignals; and (b) synthetic signal.
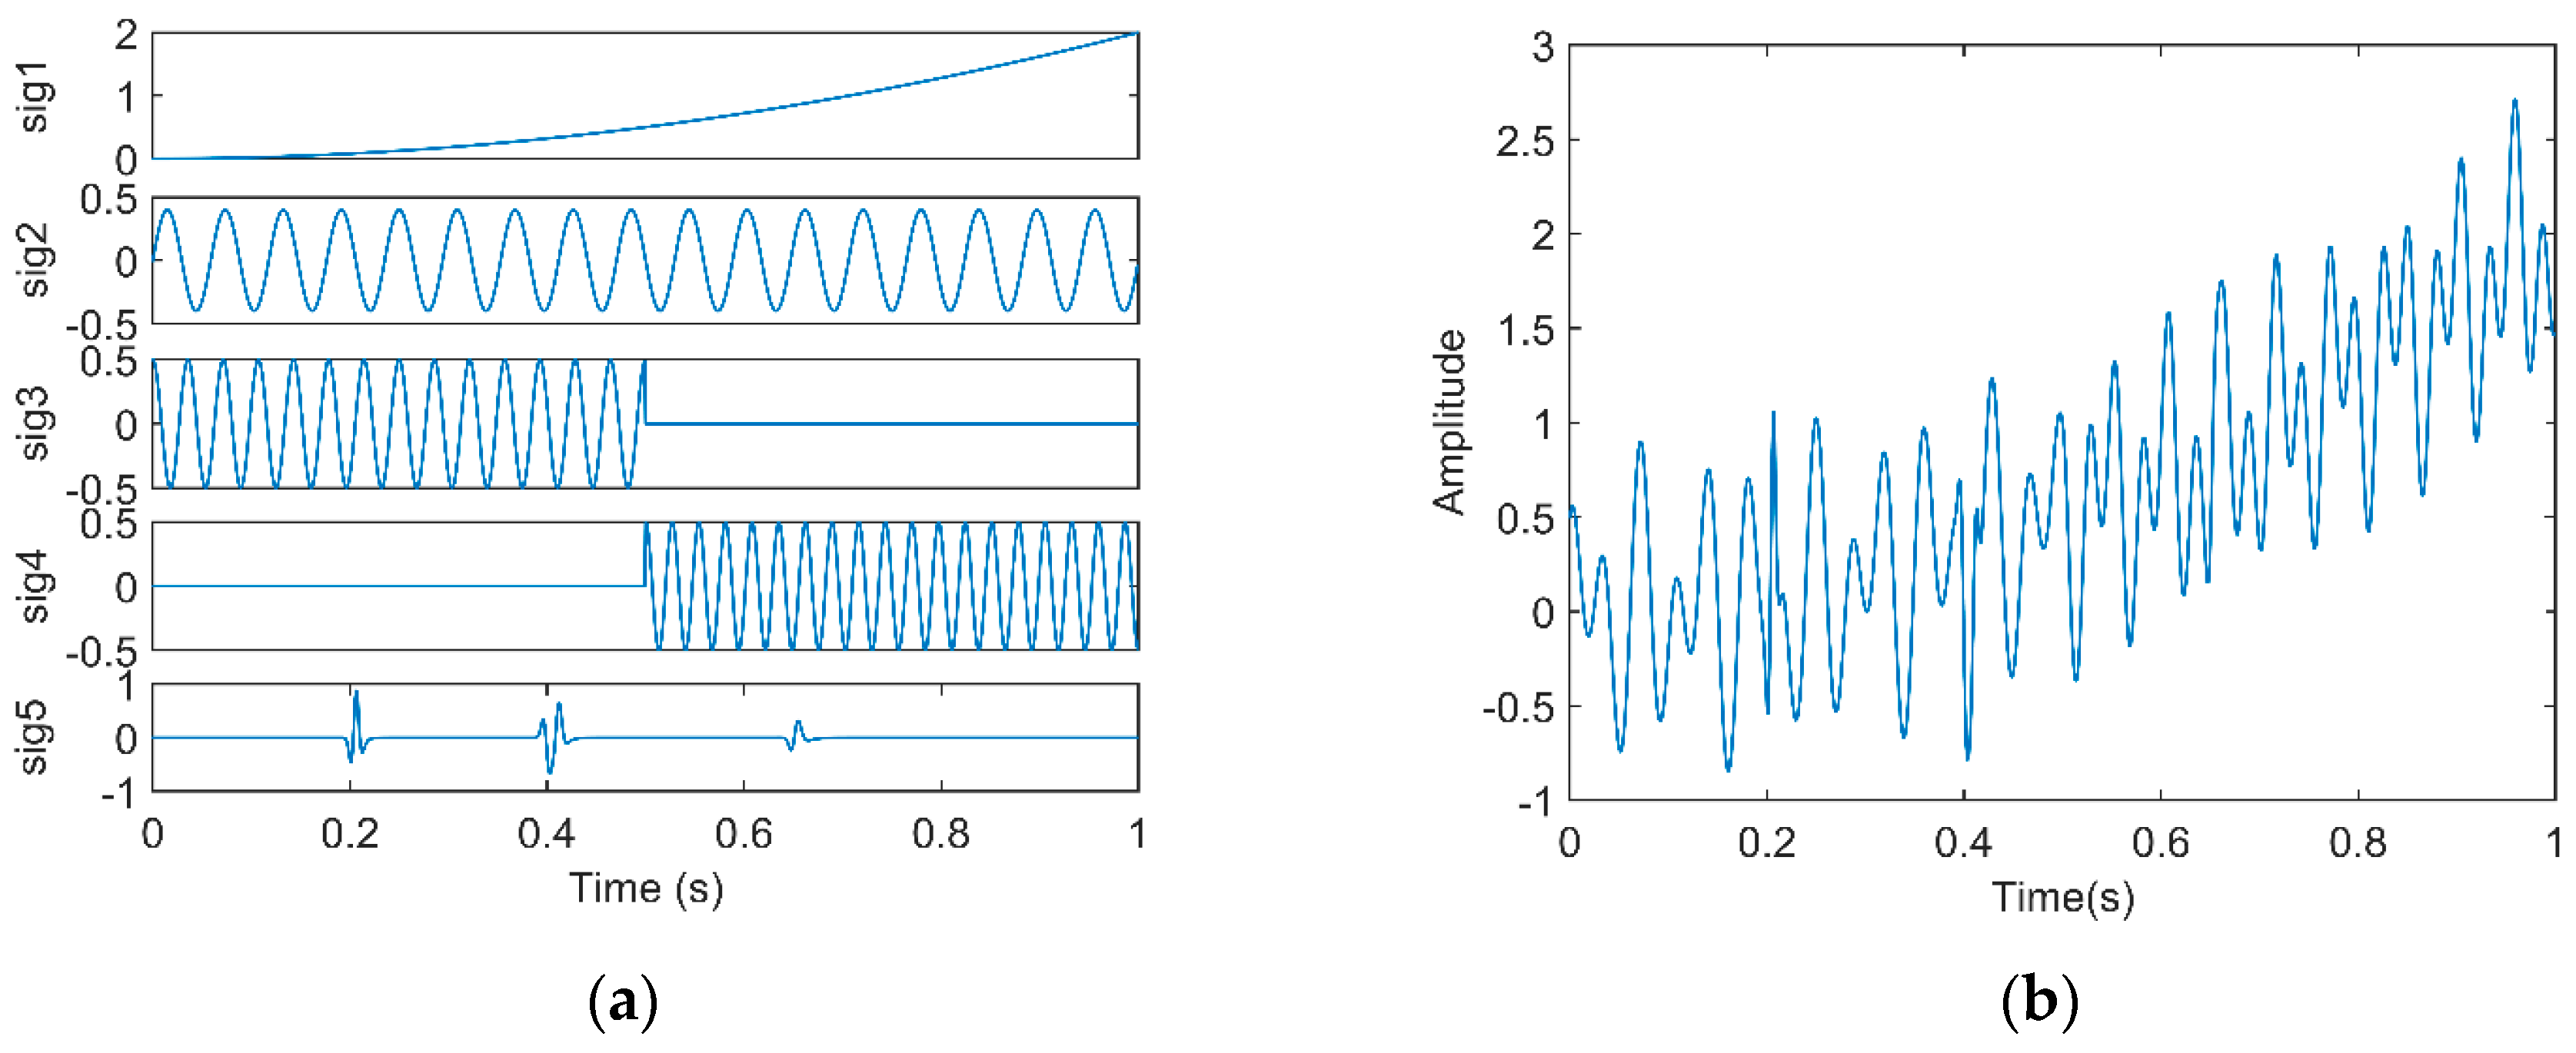
Figure 2.
Time-frequency spectra of the synthesized signal based on (a) synchroextracting transform (SET); (b) empirical wavelet transform (EWT) combined with SET (EWT-SET); and (c) EWT combined with Hilbert transform (HT) (EWT-HT).
Figure 2.
Time-frequency spectra of the synthesized signal based on (a) synchroextracting transform (SET); (b) empirical wavelet transform (EWT) combined with SET (EWT-SET); and (c) EWT combined with Hilbert transform (HT) (EWT-HT).

Figure 3.
For Geological Model 1: (a) the gas-bearing layer is 15 m; (b) the seismic response; (c) the low frequency section; and (d) the high frequency section.
Figure 3.
For Geological Model 1: (a) the gas-bearing layer is 15 m; (b) the seismic response; (c) the low frequency section; and (d) the high frequency section.

Figure 4.
For Geological Model 2: (a) the gas-bearing layer is 20 m; (b) the seismic response; (c) the low frequency section; and (d) the high frequency section.
Figure 4.
For Geological Model 2: (a) the gas-bearing layer is 20 m; (b) the seismic response; (c) the low frequency section; and (d) the high frequency section.

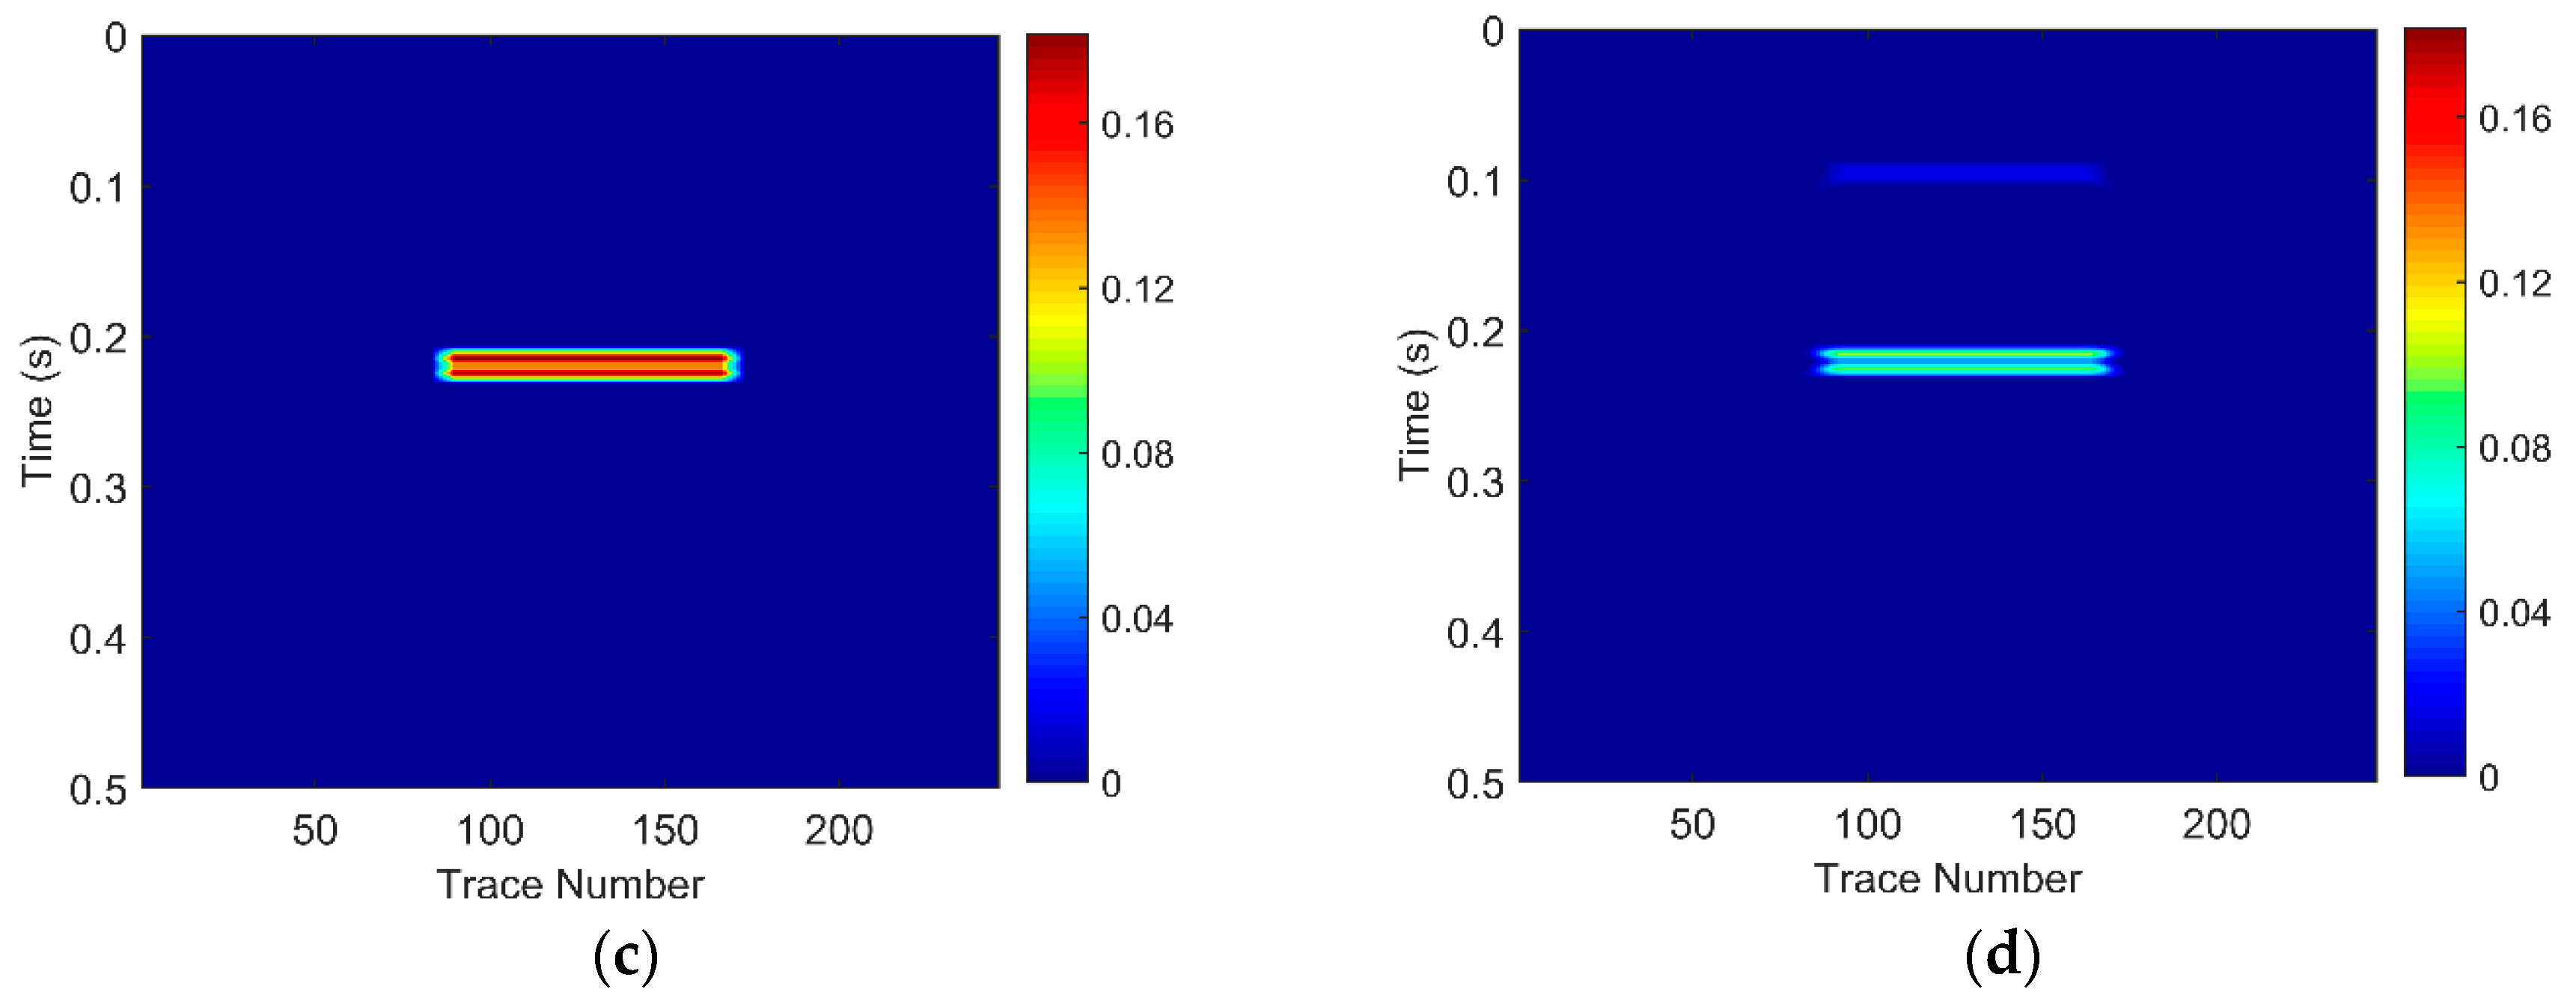
Figure 5.
For Geological Model 3: (a) the gas-bearing layer is 25 m; (b) the seismic response; (c) the low frequency section; and (d) the high frequency section.
Figure 5.
For Geological Model 3: (a) the gas-bearing layer is 25 m; (b) the seismic response; (c) the low frequency section; and (d) the high frequency section.

Figure 6.
(a) Field seismic data; (b) waveform of well B and well C.
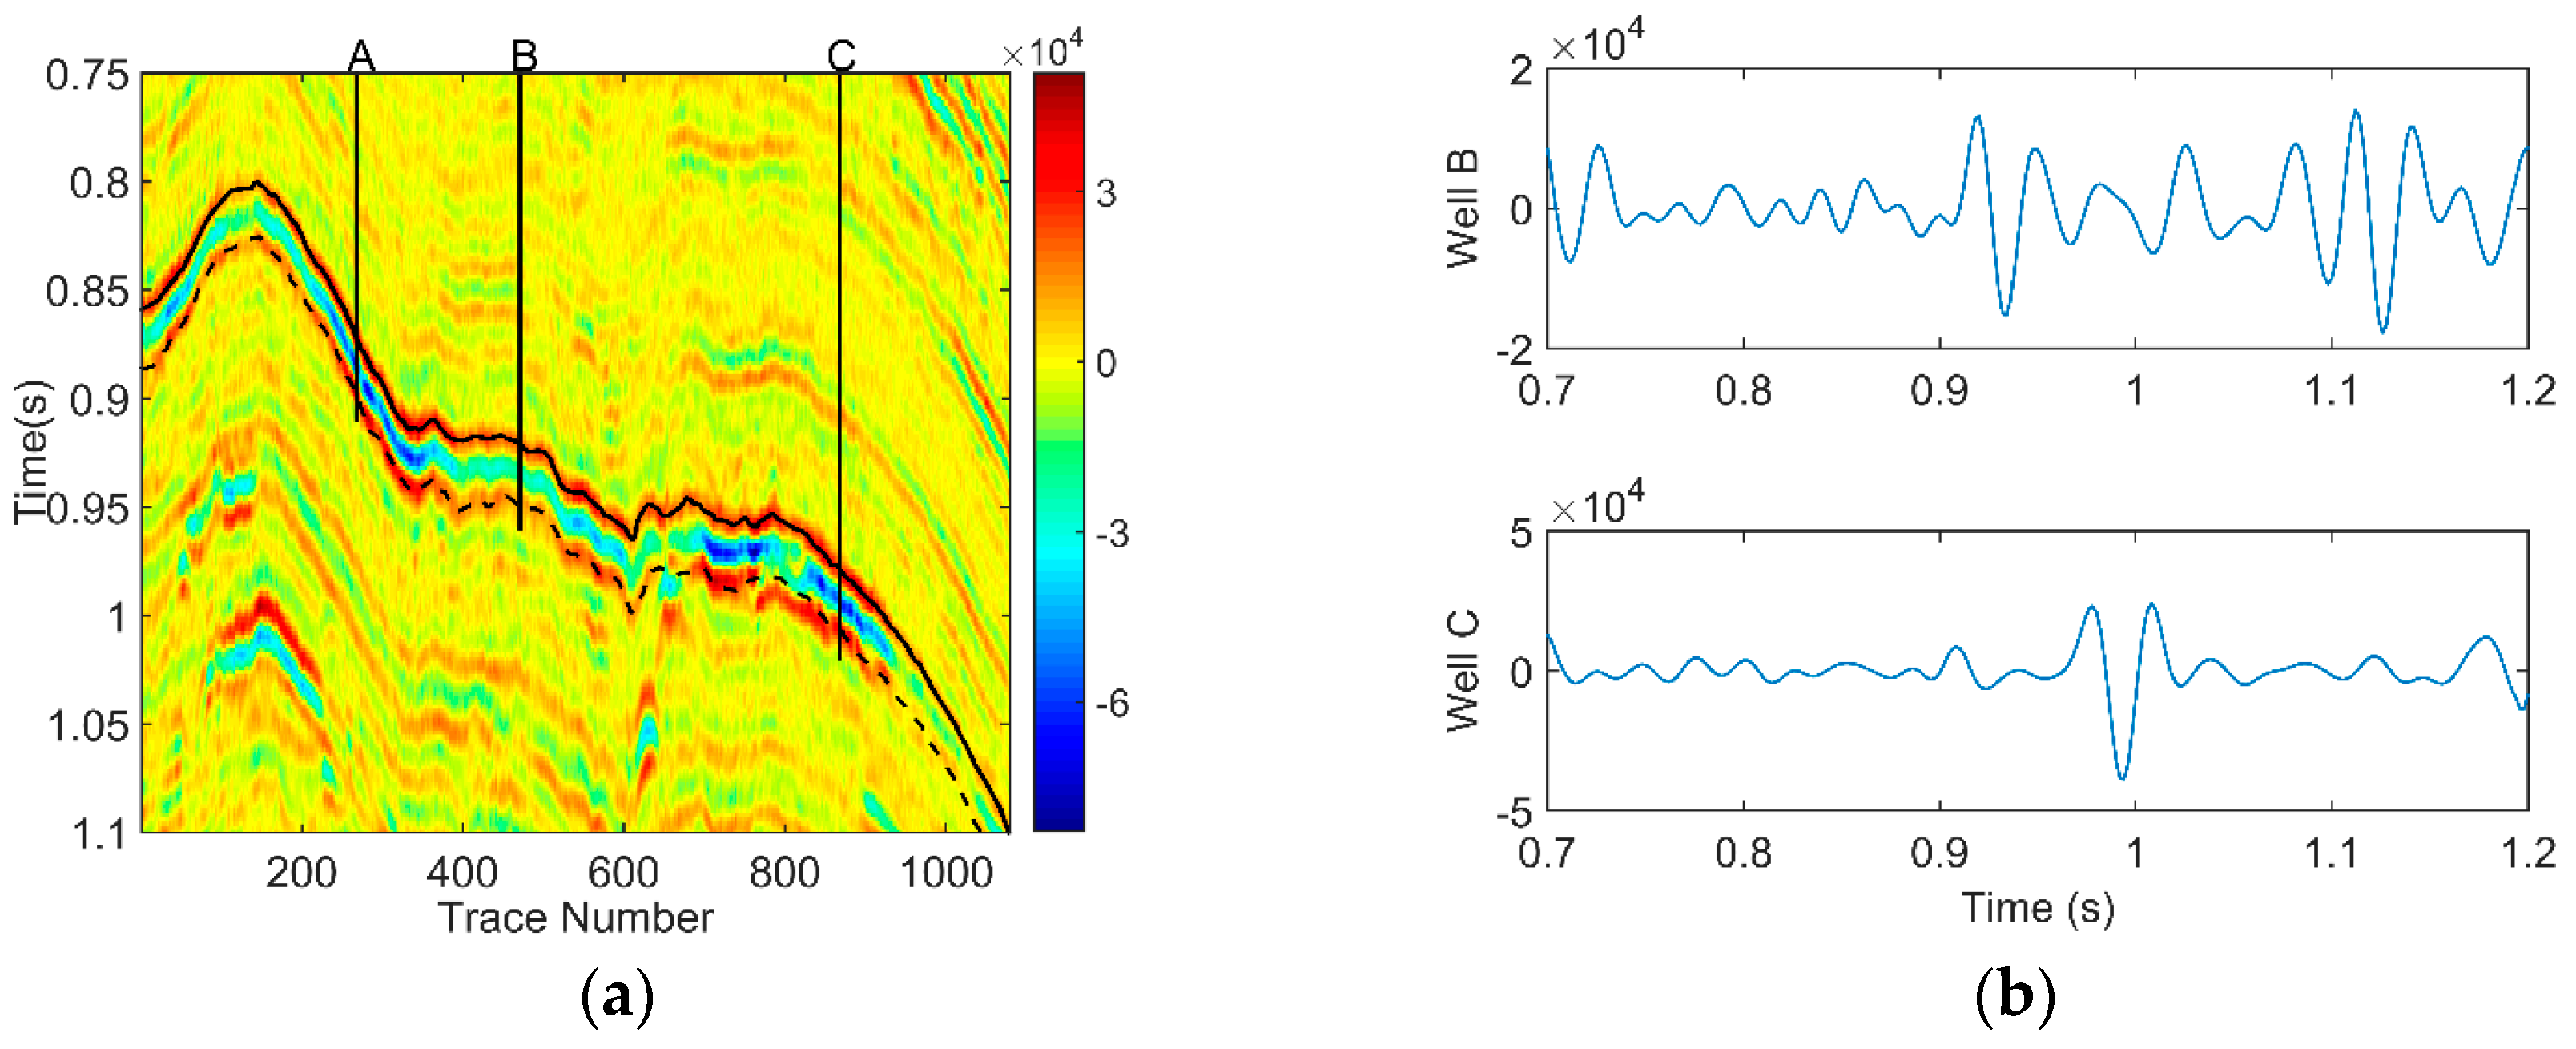
Figure 7.
(a) Time-frequency spectra of well B and C; (b) the energy absorption analysis curve of well B and C at the reservoir interval.
Figure 7.
(a) Time-frequency spectra of well B and C; (b) the energy absorption analysis curve of well B and C at the reservoir interval.

Figure 8.
Common frequency sections based on EWT-SET (a) at 30 Hz; (b) at 40 Hz.

Table 1.
Main parameters for the geological models. The diffusion coefficient, viscous coefficient, and Q represent the dispersion degree of the strata, degree of viscous of fluid, and quality factor, respectively. One of the most distinct features of the gas-bearing reservoir is very low quality factor Q (5~30). The energy attenuation of the seismic signal will be more obvious when the Q value becomes lower [36].
| Layer | Velocity (m·s−1) | Diffusion Coefficient (Hz) | Viscous Coefficient (m2·s−1) | Density (g·cm−3) | Q |
|---|---|---|---|---|---|
| ① | 4200 | 1.0 | 1.0 | 2.4 | 800 |
| ② | 4400 | 1.0 | 1.0 | 2.45 | 800 |
| ③ | 4500 | 1.0 | 1.0 | 2.5 | 800 |
| ④ | 4100 | 30.0 | 200 | 1.96 | 15 |
| ⑤ | 4600 | 1.0 | 1.0 | 2.5 | 800 |
| ⑥ | 4700 | 1.0 | 1.0 | 2.5 | 800 |
© 2017 by the authors. Licensee MDPI, Basel, Switzerland. This article is an open access article distributed under the terms and conditions of the Creative Commons Attribution (CC BY) license (http://creativecommons.org/licenses/by/4.0/).
Share and Cite
MDPI and ACS Style
Chen, H.; Kang, J.; Chen, Y.; Xu, D.; Hu, Y. An Improved Time-Frequency Analysis Method for Hydrocarbon Detection Based on EWT and SET. Energies 2017, 10, 1090. https://doi.org/10.3390/en10081090
AMA Style
Chen H, Kang J, Chen Y, Xu D, Hu Y. An Improved Time-Frequency Analysis Method for Hydrocarbon Detection Based on EWT and SET. Energies. 2017; 10(8):1090. https://doi.org/10.3390/en10081090
Chicago/Turabian StyleChen, Hui, Jiaxing Kang, Yuanchun Chen, Dan Xu, and Ying Hu. 2017. "An Improved Time-Frequency Analysis Method for Hydrocarbon Detection Based on EWT and SET" Energies 10, no. 8: 1090. https://doi.org/10.3390/en10081090
Note that from the first issue of 2016, this journal uses article numbers instead of page numbers. See further details here.