1. Introduction
In the operation of power transmission systems, problems related to reactive voltage/power may occur at any time due to contingencies and/or changes in demand. Therefore, adequate control decisions are required over a relatively short period to improve the state of operation so as not to compromise the safety and reliability of the electrical system. Some of these situations may require solutions based on specific knowledge of the operators with the electrical system or equipment. This type of knowledge is obtained from practical operational experience gained over the years. Therefore, control decisions must be done by combining the experience of the operators with the solutions proposed by computational algorithms based on mathematical methods.
Currently, the possibility of storage and use of specific human knowledge acquired experimentally is through expert systems. Several systems are proposed in the literature to support voltage/reactive power control [
1,
2,
3]. In this paper, it is applied a maintenance program with implementation of the Total Productive Maintenance (TPM) to analyze some applications in the mode of operation of the AVR (automatic voltage regulator) to operate the system in the control of constant voltage (Voltage Droop). The implementation was based on the specific knowledge about the operation of the power grid in voltage/reactive power control.
The voltage drop is the mode of operation in which the external system determines the voltage, which, once set the value of the voltage the Master Voltage Control (MVC), it tracks the voltage in the bar of the high voltage side, to minimize possible fluctuations. The MVC sends the set point and the (mA) signal to the PLC (Programmable Logic Controller) of each generator, which is converted to a voltage at the terminals of each Automatic Voltage Regulator (AVR) (UNITROL 1000, ABB Switzerland Ltd., Turgi, Switzerland), so that the generators connected to the same bus share the reactive load, guaranteeing the voltage control.
Power factor is the mode of operation in which the machine is operating with a constant reactive load and the load variations in the External System do not affect the value of the Reactive Power in which the Machine is working. In other words, in this mode of operation, the Voltage Regulator will not control or contribute to the voltage variations of the external System. The value of the Reactive Power of the Machine can be controlled by the injection of more or less excitation current through the value of the power factor set in the PLC at the Control Room.
Disturbances in the energy system are increases or decreases in the voltage or frequency of the system, in addition to what is considered as normal tolerance. Changes in voltage can range from complete lack of voltage (interruption), lasting for seconds, minutes, or even hours, to high voltage values (over voltages). Short pulses of the normal voltage of the system last no more than a few thousandths of a second. Some of these disturbances may have an undesirable effect on equipment connected to the power system, including protection devices.
Voltage fluctuation is defined as a cyclic voltage variation, in amplitude not exceeding 10%. This variation in amplitude is generally much lower than the equipment’s support limits, so that operational problems in the equipment will rarely occur due to the occurrence of fluctuation.
Frequency is one of the most important parameters in the operation of electrical systems. It must be unique to the entire electrical system, and this form requires centralized control, which usually occurs in large generation plants. In the Network Procedures, the National Operator of the Electric System (ONS) establishes two indicators to measure the performance of the system with respect to frequency variations.
2. Literature Review
Much of the literature is concerned only with replacements, both after failures and during maintenance, and disregards the possibility of the type of maintenance where less improvement is achieved at lower cost. Among the oldest replacement schemes are the “age replacement” [
4,
5] and “total replacement” [
6,
7,
8] policies. In the first one, a component is replaced at a certain age or when it fails, whichever occurs first. In the second one, all devices in a given class are replaced at predetermined intervals, or when they fail.
The latter policy is easier to administer (especially if the component ages are not known) and may be more economical than a policy based on individual substitution. More recent replacement schemes are often based on probabilistic models [
9,
10,
11] and can be quite complex. In most electric utility dealers, however, maintenance is very limited and it is established as practicing the use of replacement models. In turn, the concept of simplicity in a company is associated with processes and technology solutions, whose characteristics and procedures are strictly necessary to meet the specific requirements that are easy to implement, maintain and use, in addition to being developed within the Schedule [
12].
For a thorough evaluation of the effects of a maintenance policy, it is necessary to know how much its application would extend the life of a component, measured, that is, the average time to failure. To figure this out, a mathematical model of the component deterioration process is needed, which is then combined with a model describing the maintenance effects. In the last ten years or more, several such models have been proposed [
13,
14,
15].
The situation is quite different for the deterioration processes, where sometimes the new fault condition and the times between the subsequent stages of deterioration are not exponentially distributed [
16,
17]. In such a process, the risk function is increasing, and maintenance will bring improvement regardless of the types of distribution between phases [
18,
19]. Thus, some type of monitoring (e.g., inspection) should be part of the model [
8]. Other desirable characteristics are listed in the course of the study. System identification, and the list of critical components and their functions are very important for analyzing any system or process. It is necessary to establish the failure mode and effects for each selected component, determination of failure history, and calculation of mean time between failures. The categorization of failure effects (using appropriate flowcharts) and the determination of possible maintenance tasks can be appreciated in [
20,
21,
22]. The assignment of maintenance tasks and the evaluation of the program, including cost analysis is offered in [
23].
The so-called Preventive Maintenance Optimization (PREMO) is based on extensive task analysis rather than system analysis, with a capability to reduce drastically the number of required maintenance tasks in a plant [
24,
25,
26]. Approaches such as PREMO have been very useful to ensure the economical operation of power plants. However, they do not provide all the benefits and flexibility of programs based on mathematical models [
13,
27]. Many other approaches have been developed; many of them concerned with power system applications [
28,
29,
30,
31]. In [
31], a maintenance model is derived from parallel branches of components in series, as frequently found in transformation stations, and in [
32], maintenance and reliability of the standby units are studied. Both are, in essence, replacement models, where repair and maintenance are assumed to result “as new” conditions.
Thermal Power Plants consist of a set of mechanical and electrical systems that require constant monitoring for energy production. The data obtained through the monitoring actions are required in the operation, maintenance and evaluation of the performance of the plants. For this purpose, many times, so-called Distributed Control Systems (DCS) are used [
33]
The obsolescence of this equipment (DCS) raises the risks of unavailability of the generating units, mainly in thermal plants, which have a high degree of mechanical wear, due to the high temperatures and the chemical agents used for the production of electric energy [
34]. In addition to technological obsolescence, maintenance costs over time increase due to the need to replace parts in DCS. Another observed hindrance refers to the gradual decrease of technical support by the suppliers of these systems as the manufacturer launches new similar systems. The renewal of these systems is therefore a sine qua non, imposing the need for new knowledge and technologies for the training and technological development of companies of this nature. Such a renewal/update offers the possibility of using new DCS systems based mainly on the free flow of data in real time without the need to integrate any interface into proprietary software architectures as has been practiced until now.
The basis of good maintenance engineering management is reliable information on the most critical aspects of maintenance, i.e., those elements that could result in a more substantial impact on expenditure or income [
16,
35]. A maintenance plan can be established adopting, among others, the following criteria: hours of operation and degradation of the insulation medium or cycle of equipment operation. In order to prove the savings obtained with an implanted maintenance plan, measures must be taken before and after its implementation.
The descriptions that define the process should enable its understanding and provide the basis for any critical examination necessary for the development of improvements. It is therefore essential that the descriptions of the procedure be precise, clear and concise [
36]. “It is important that in a company already in operation the flow charts are established in a participatory way” [
37].
3. Methodology
The research was carried out in four phases, starting with a detailed study of the national and foreign literature on the subject to be researched, to deepen understanding of the causes that could provoke faults, failures and unexpected stops of the equipment, as well as the methods and techniques that could be applied to meet the proposed objectives.
The second phase was carried out by means of an unstructured interview with the maintenance leader, to diagnose the difficulties in controlling the equipment failures. At this stage, the documentary study of the standards and maintenance routines folders, the preventive maintenance registration reports, and the basis for the checklist elaboration were also carried out. This was made to know the fulfillment of the aspects established at national and international level and to detect the causes of possible occurrences of undesirable events.
The third step consisted in the application of the simple direct observation technique, observing motors, auxiliary equipment and generators together with the observation of the study environment, which allowed concretizing the reality expressed at the time.
In the fourth phase, measures were proposed that allow the monitoring of the chosen equipment through vibration analysis, oil analysis and thermography. The implantations were also carried out in four phases:
Phase 1—Diagnosis: Conducted by the specialist in the operational areas where the program will be implemented, with the objective of collecting data from the operation, interviews and analysis of documents to serve as a basis for the Strategic Master Plan of Phase 2. After the Diagnostic, a report with the data collected, opportunities and recommendations for analysis, discussion, adaptations and approval was presented to the Company’s Management.
Phase 2—Strategic Master Plan: The Strategic Master Plan contemplates the opportunities and objectives defined and approved in the Diagnostic Report presented in Phase 1. Prepared by the Consultant for presentation, analysis, adaptation and approval of the Board of Directors and Management of the company and indicated persons involved in the Program to determine the specific needs and objectives of the areas where the Program will be implemented.
Phase 3—Training: This phase is necessary to improve the knowledge of the participants, who will be responsible for developing internally the program, in the roles of Leaders, Pillar Coordinators and Steering Committee members.
Phase 4—Follow-up: The Program was monitored by the Consultant in conjunction with the Program’s General Coordinator, including meetings with the Pillar Coordinators, audits during the implementation phase and orientation of the activities, concepts, premises and methodology of the Strategic Master Plan approved. Coordinators and Working Groups, with the Consultant, will develop the planned and recommended activities for each pillar internally. Necessary audits and recommendations during the period determined in the contract will be done.
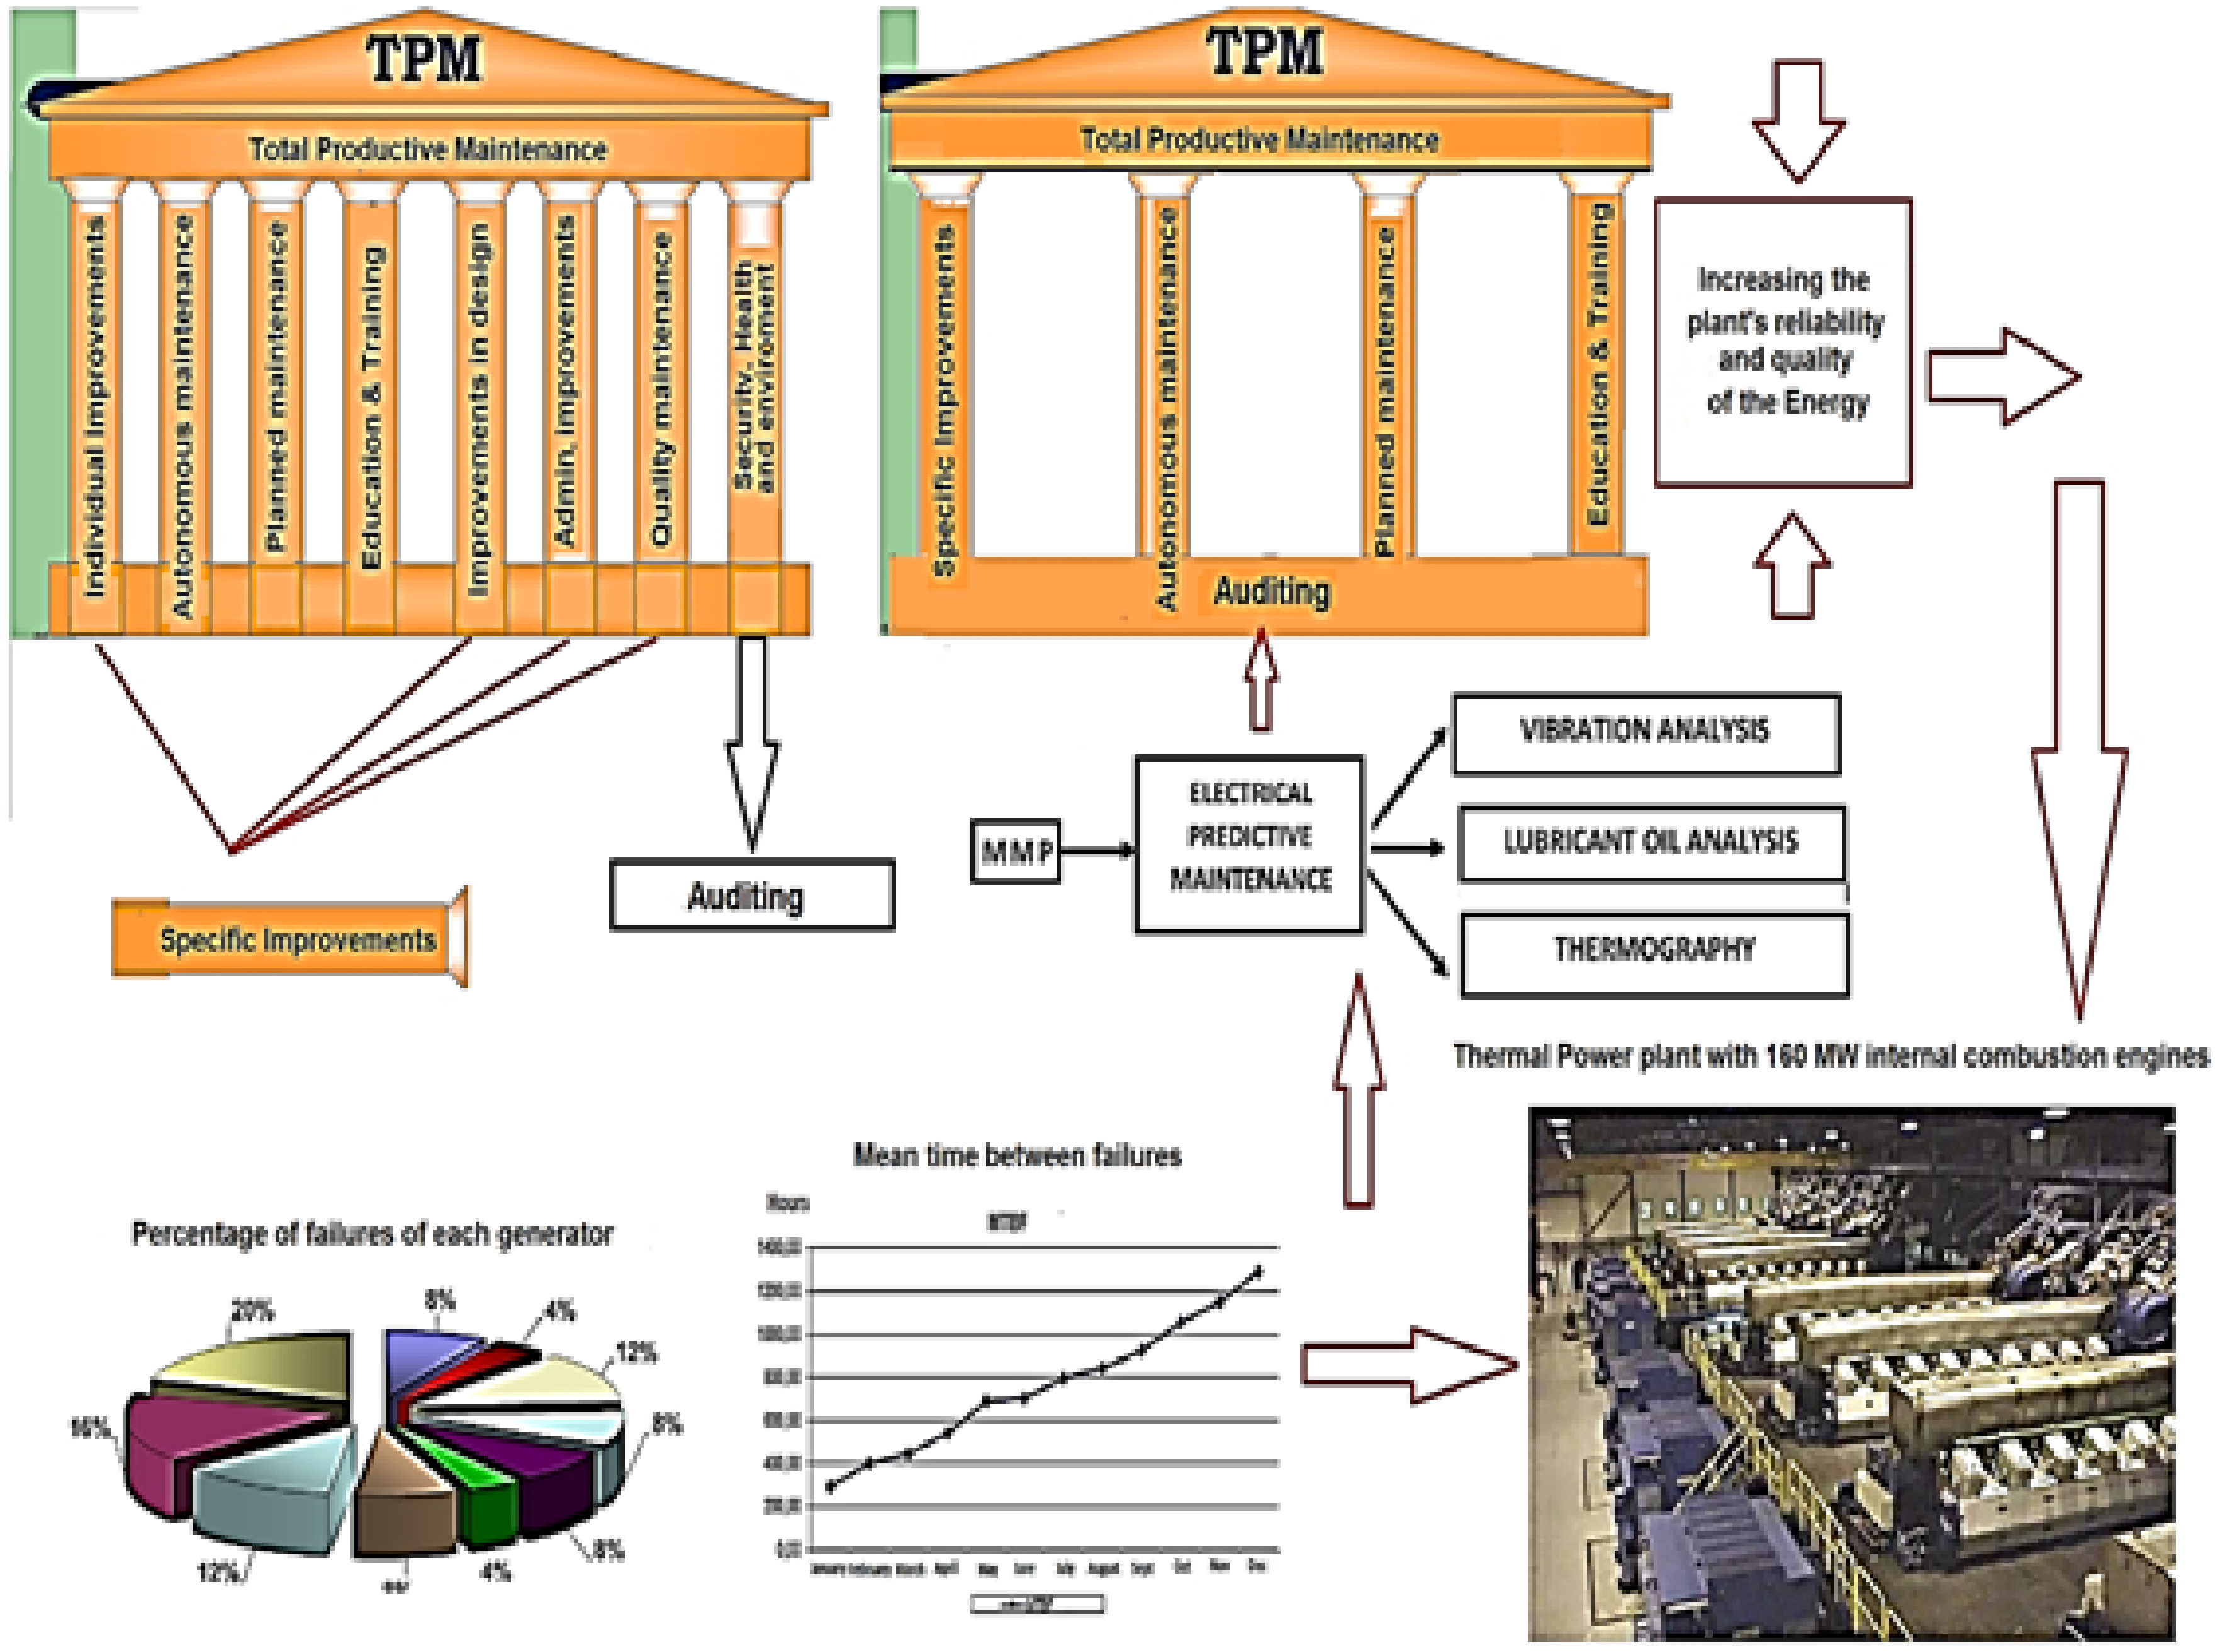
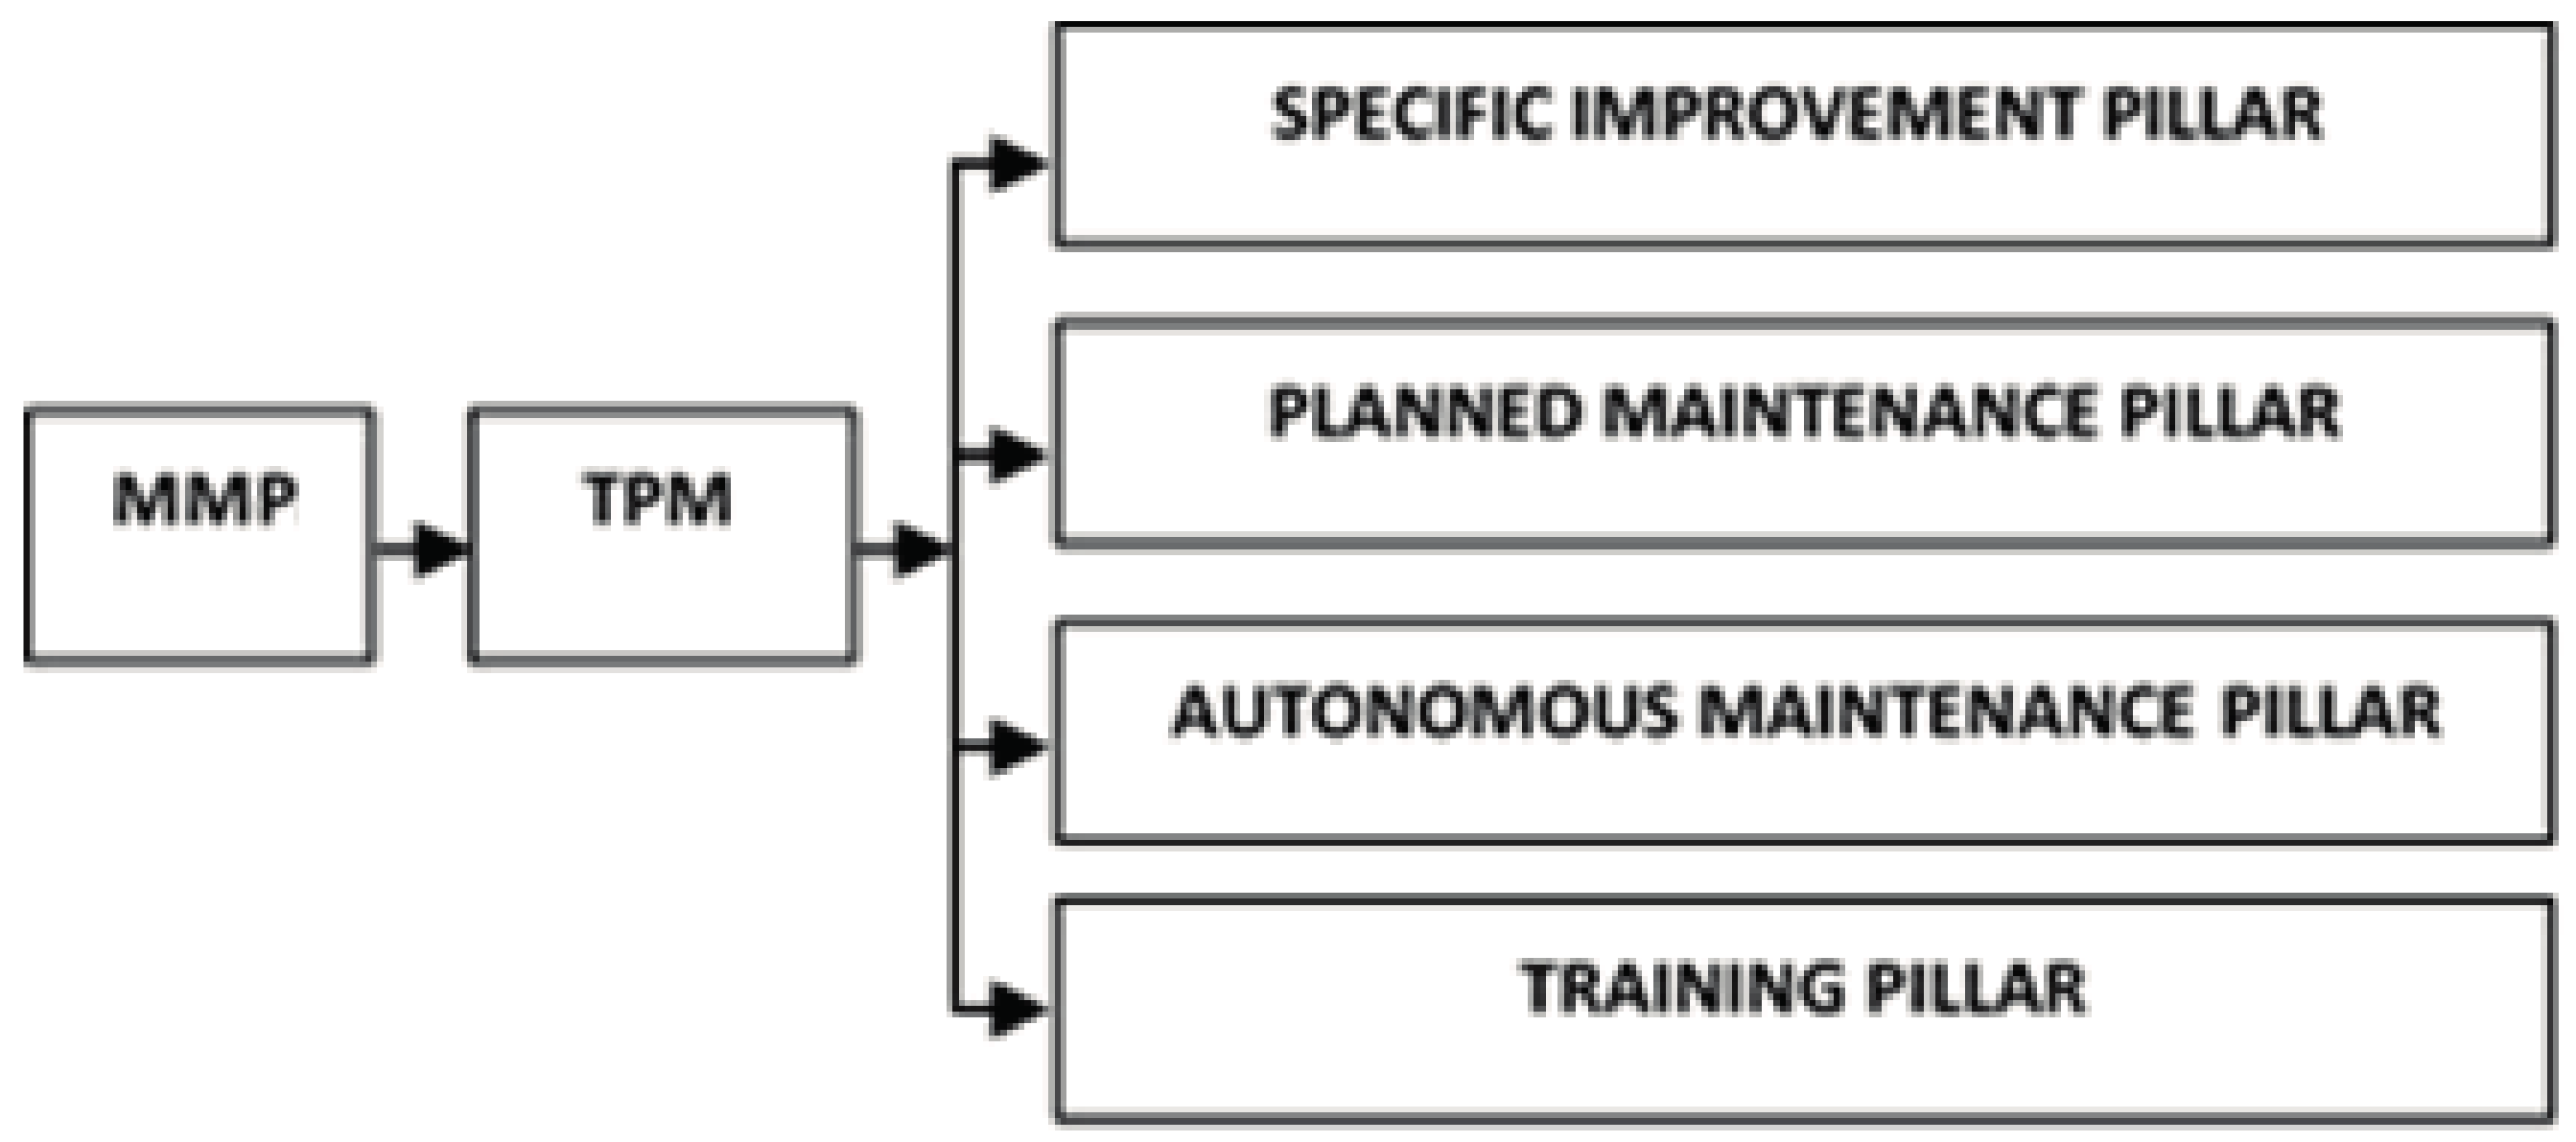
The general process is described in
Figure 1, where the combination of TPM with Predictive maintenance and diagnosis for improving the Power plant´ reliability and the energy quality is showed.
4. Case Study (Reactive Voltage/Power Control)
The case study presented in this paper describes some corrective maintenance problems that were constantly occurring in the equipment of the “Mauá” power plant, in the quality of power supplied to the system, in the constant stopping of the generator due to the problem of contamination and in the corrective maintenance of vibration between generators and engines.
Based on the observations from the case study, which diagnosed a constant problem in the operation of all the generators of the thermoelectric power plants “Mauá”, the methodology analyzed in the present paper was applied in two directions, the first one with the implementation of Electric Predictive Maintenance (EPM) and the second one with the deployment of the TPM. The results of applying the methodology in the case study are presented below.
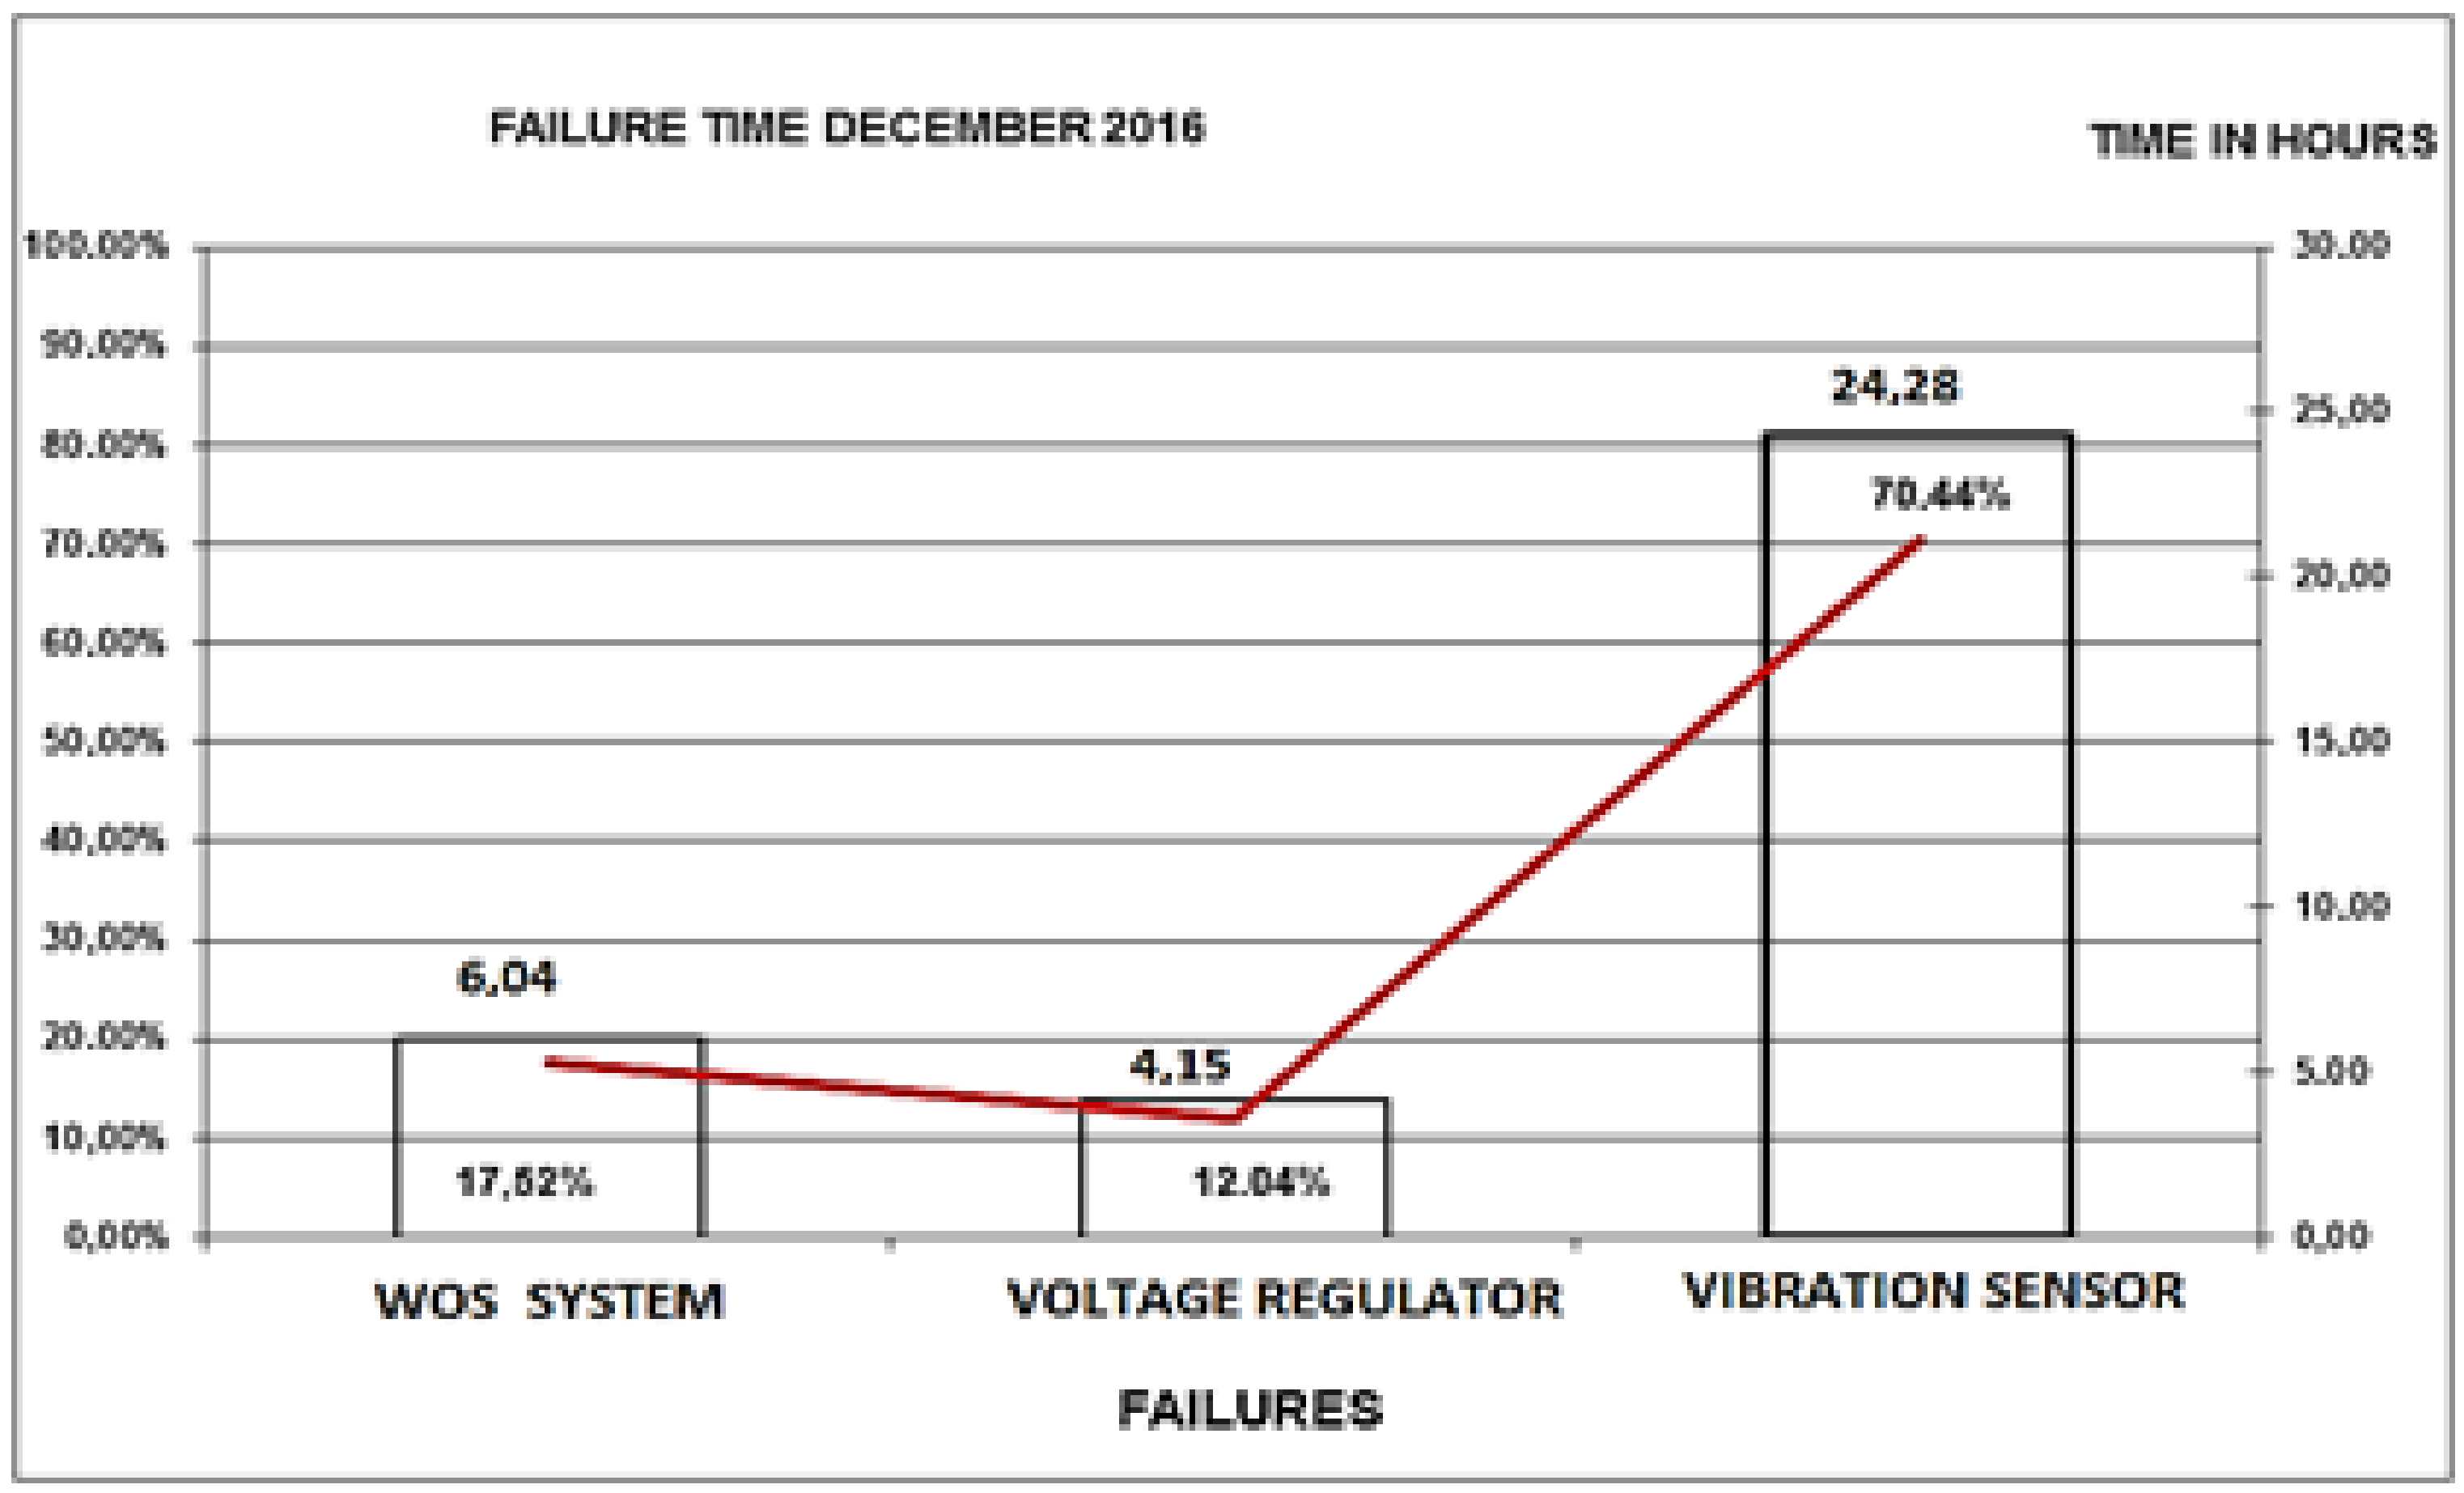
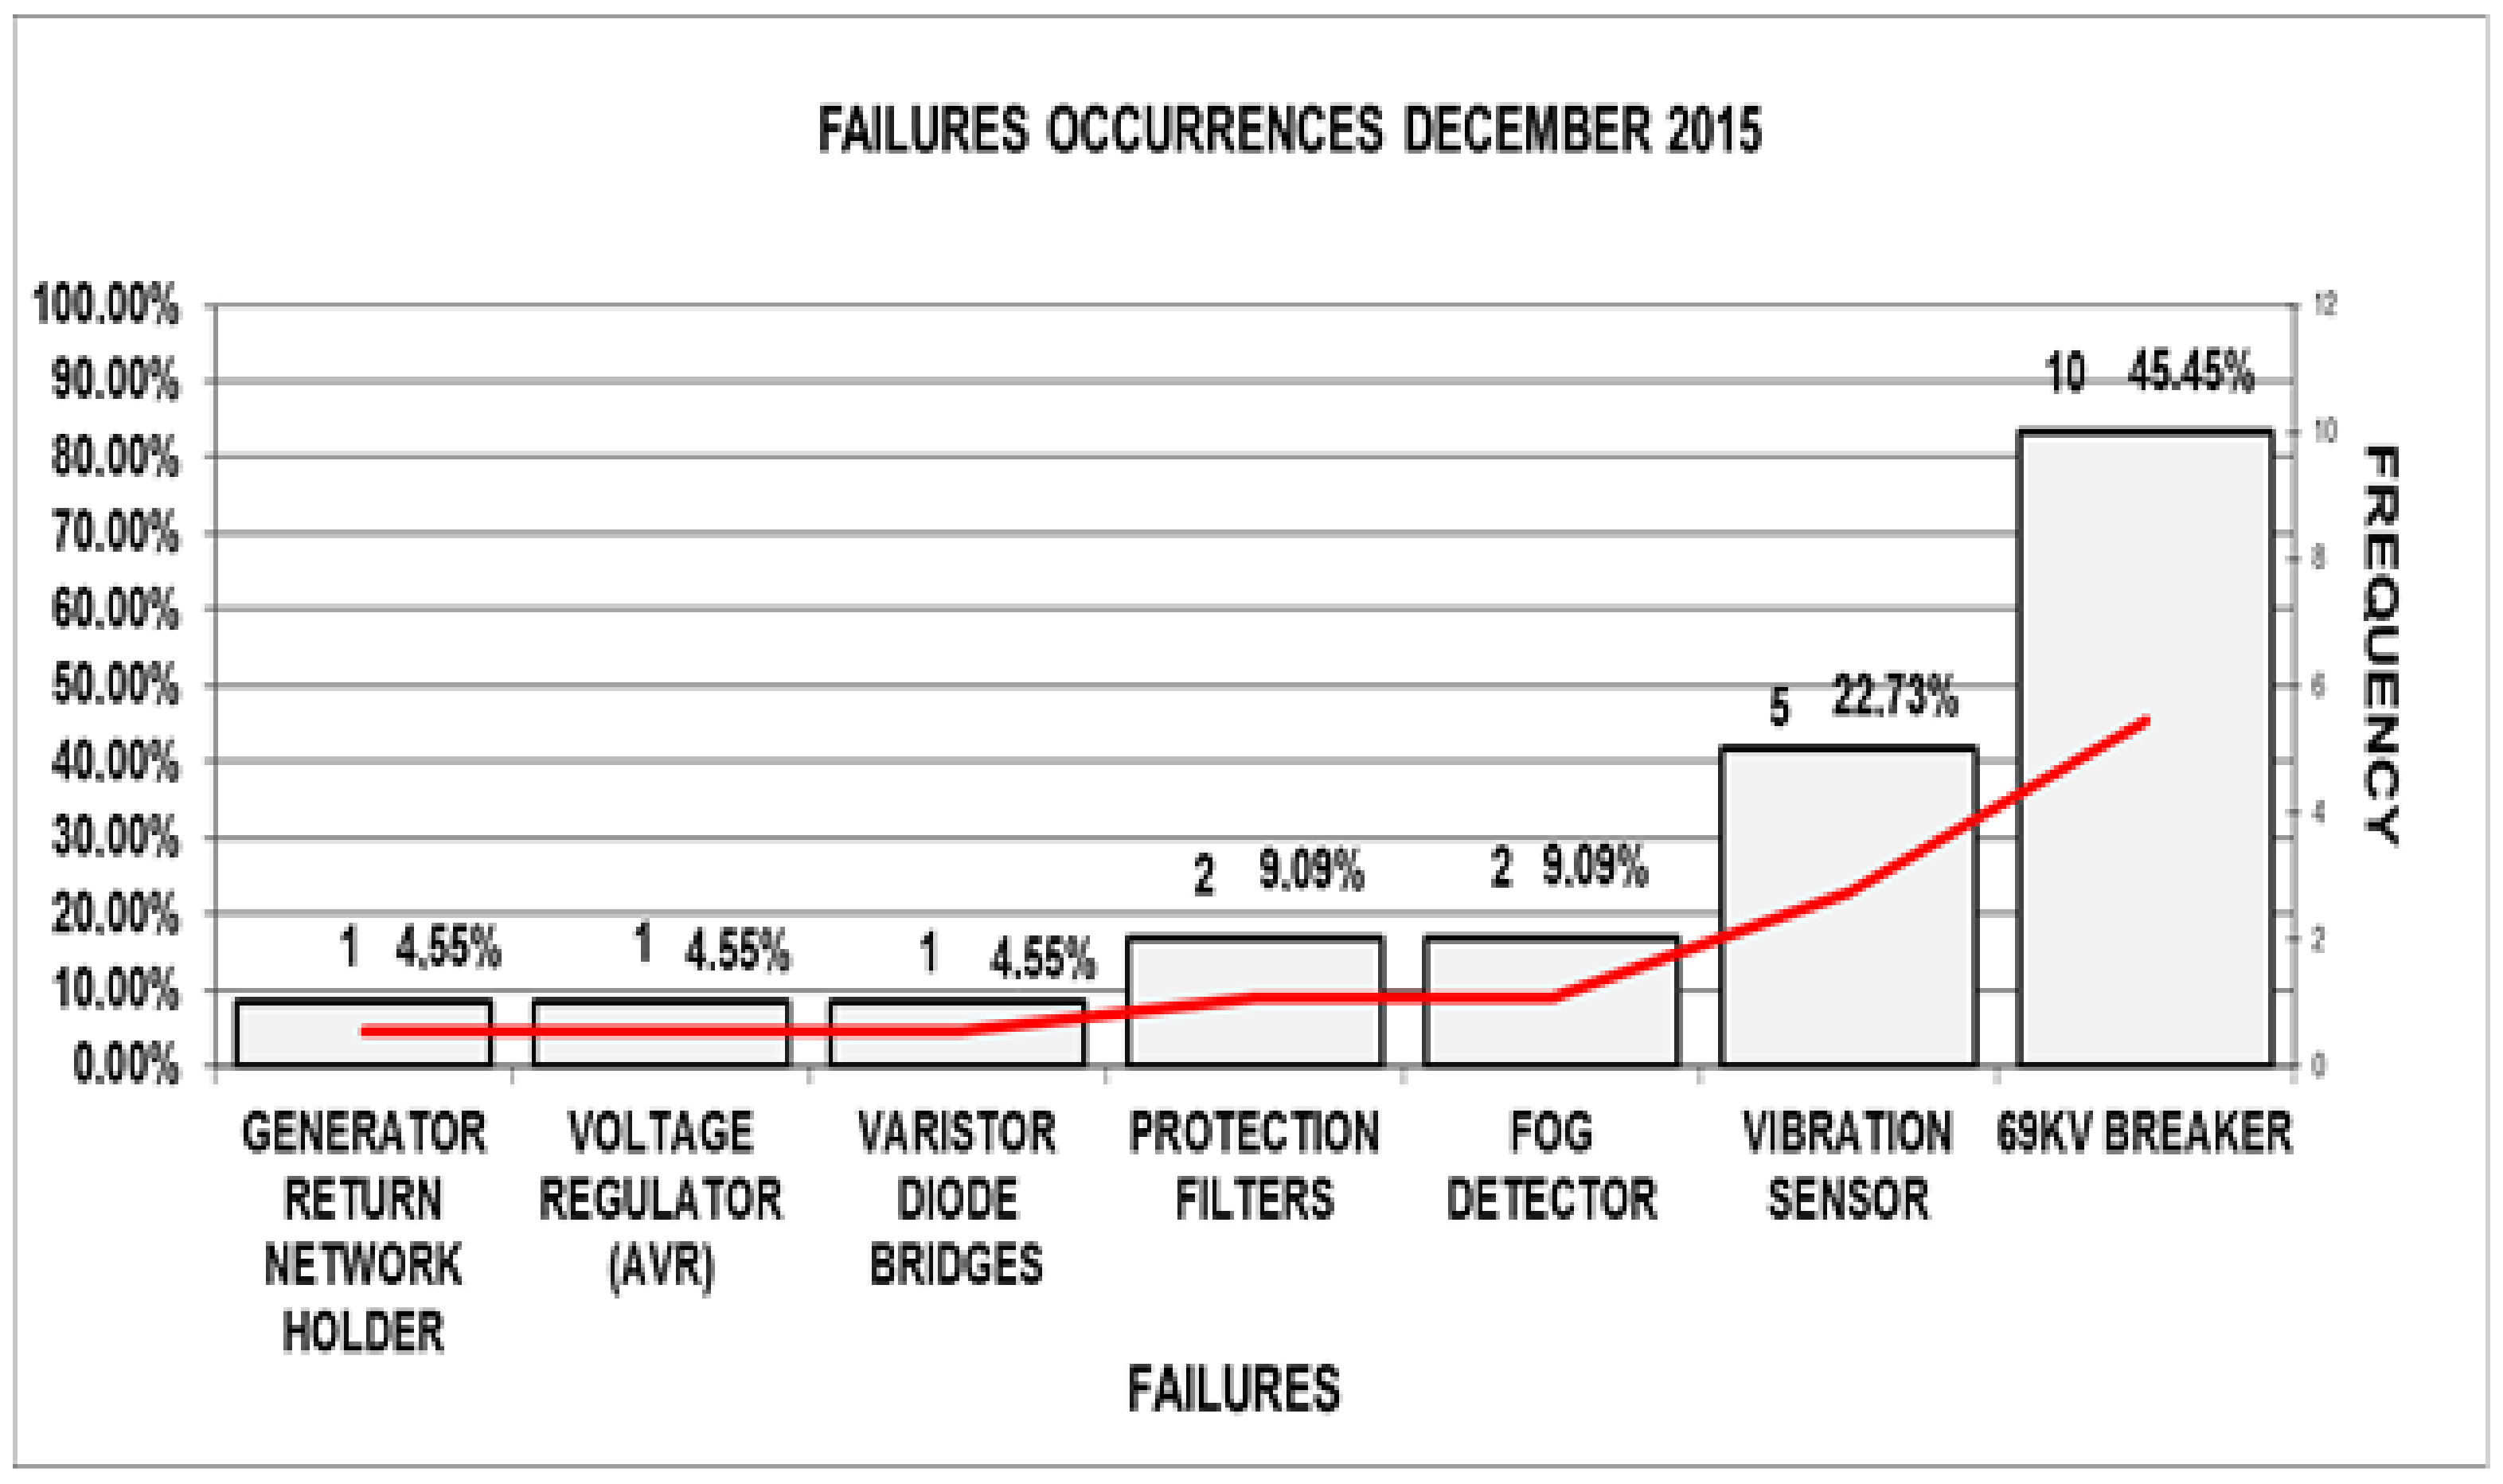
After the procedures were defined, classified failures, as shown in
Table 1 referring to December 2015, were analyzed.
To relate failures with the process, an Ishikawa Diagram was made, which presents the relationship between a process result and the process factors that, for technical reasons, may affect the result considered. Brainstorm sessions performed in-group work were used, thus, there are incorporated quality tools to the TPM and Predictive Maintenance.
In the presented case study, it is analyzed a constant voltage control/reactive power problem and constant generator stopping due to its capacitance curve; then maintenance management techniques were implemented, so it was possible to correct the problem and increase the MTBF (Mean Time between Failures) and decrease the MTTF (Mean Time To Failure). Based on the observations from the case study, which diagnosed a constant problem in the operation of all the generators of the thermoelectric power plants “Mauá”, the methodology analyzed in the present paper was applied. It was used maintenance management and the application of a quality tool for TPM implementation. The results of applying the methodology in the case study are presented below.
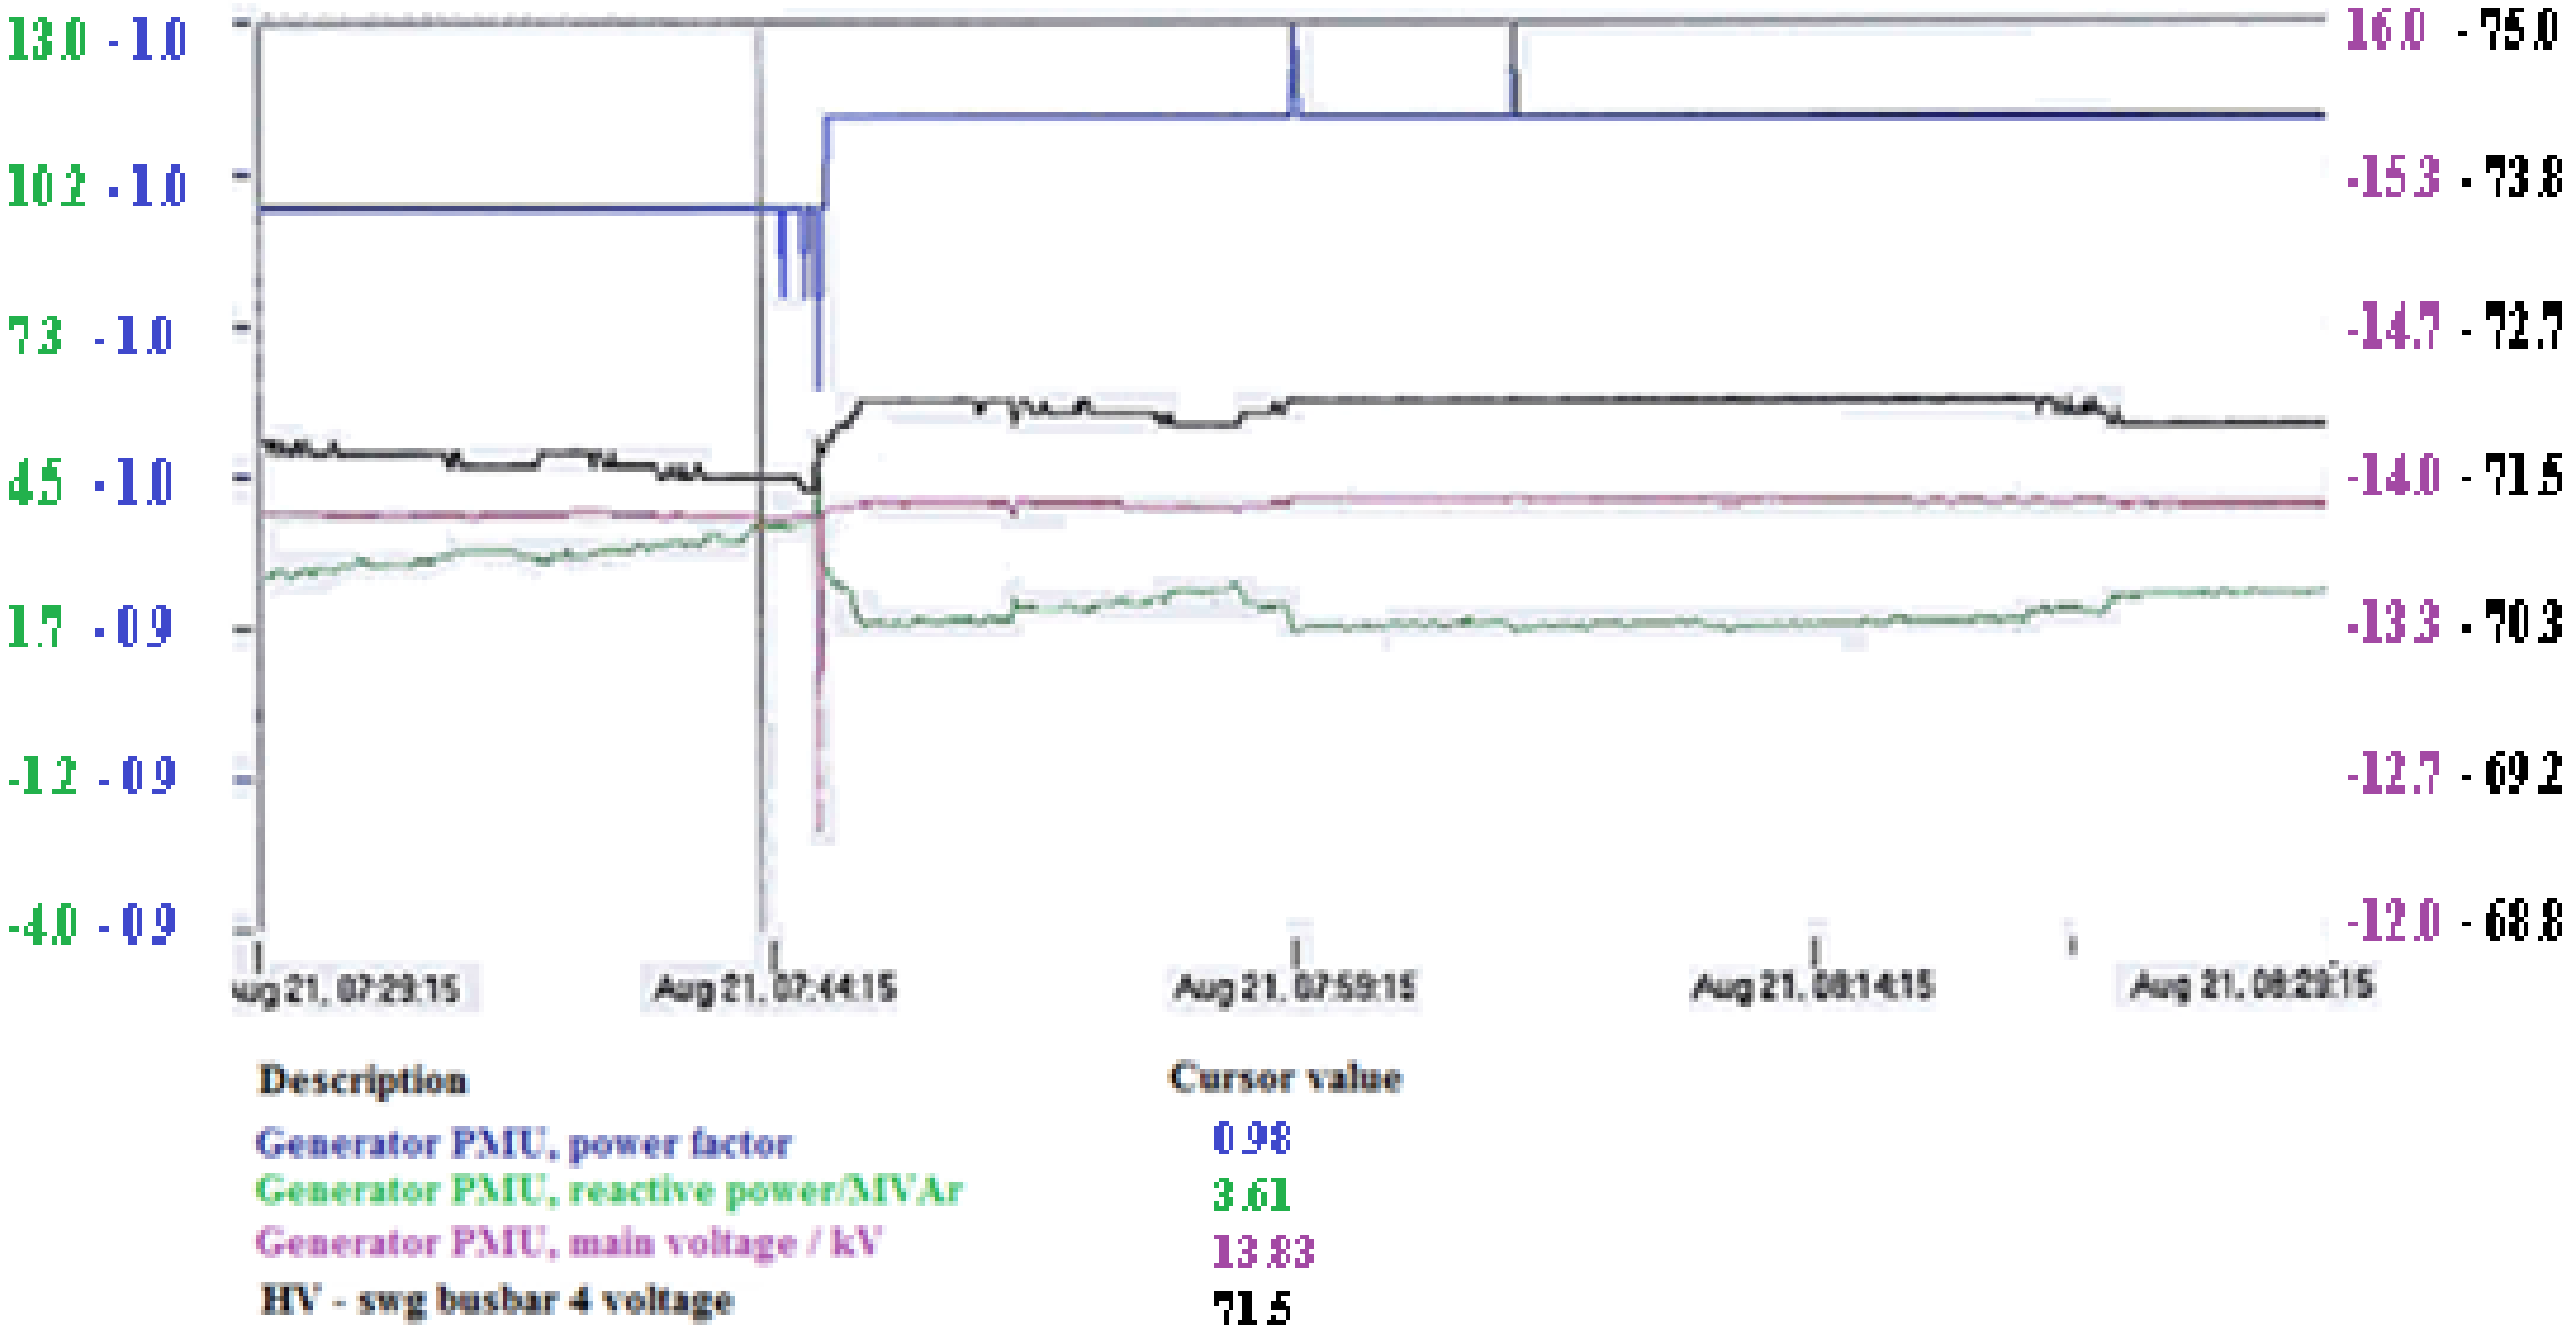
Operation with constant power factor, generated instability in the voltage, because there is no automatic response of the equipment (AVR) as a function of external voltage variation (see
Figure 2 and
Figure 3).
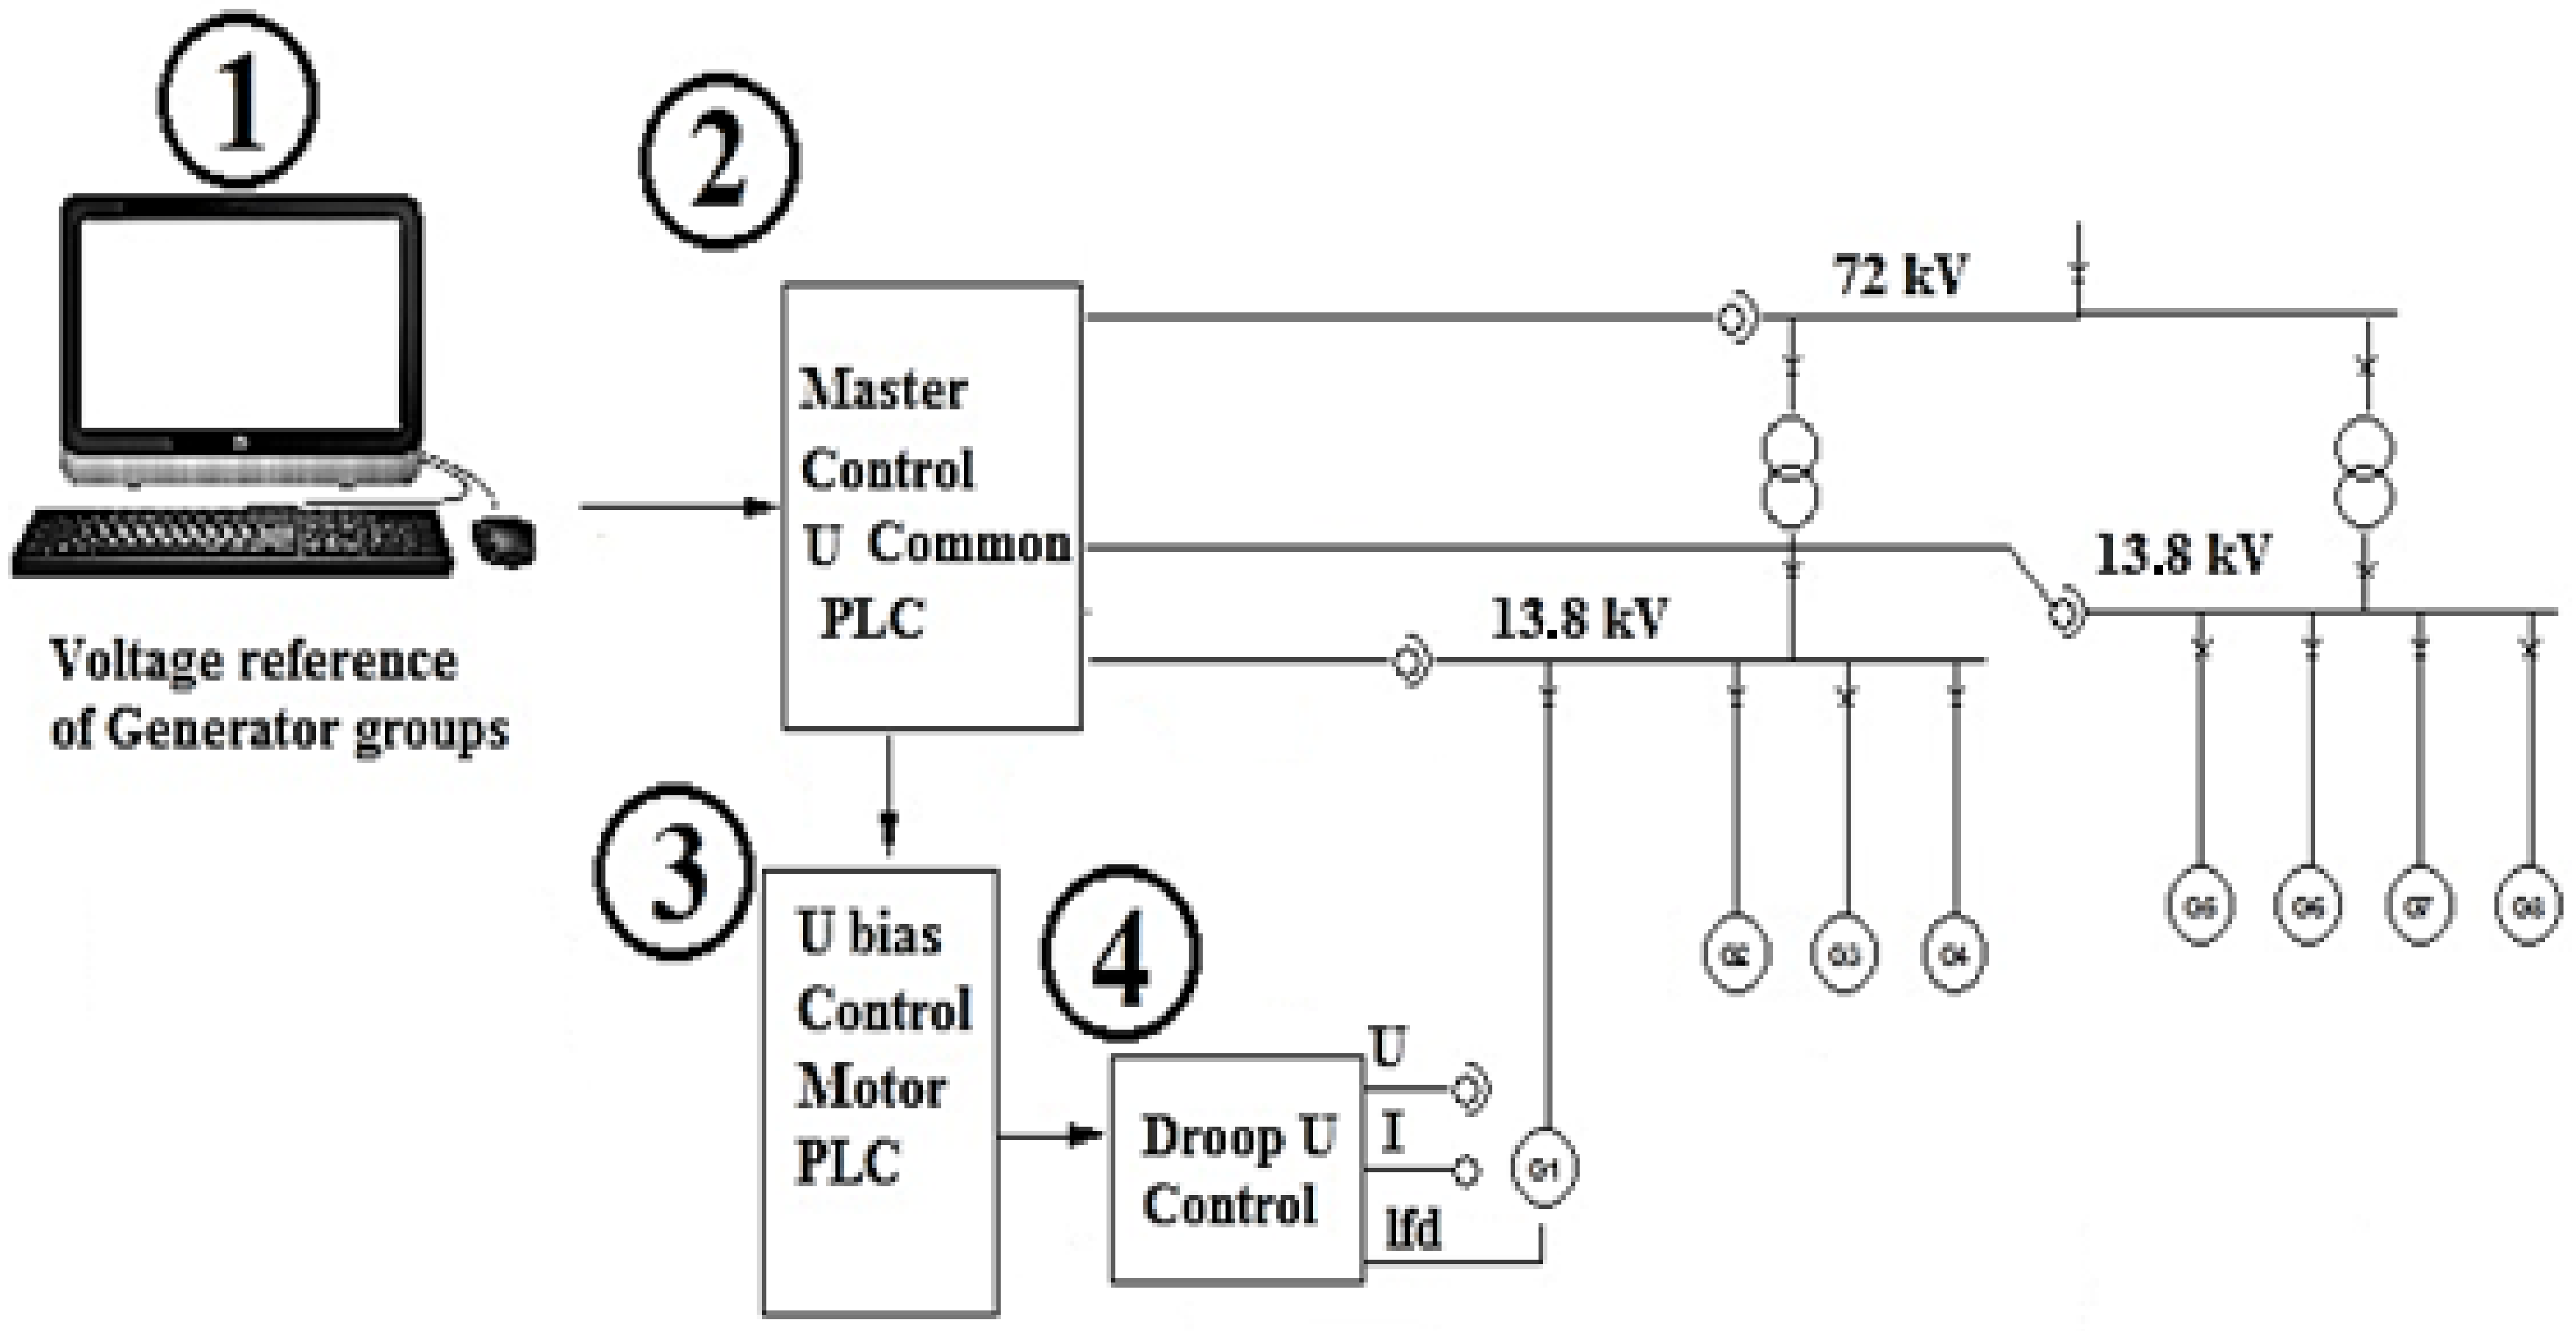
By studying the diagram above, it is observed that the operator sets the voltage reference on the high voltage side, which in practice will be adjusted by the Unitrol 1000 MVC (Master Voltage Control) (ABB Switzerland Ltd., Turgi, Switzerland) The MVC control is tracking the voltages in order to minimize eventual fluctuations when the control change. The MVC is located in the common PLCs located on the control panel 901 and 904. The MVCs send the set point and signal MVCth to the PLC of each motor, which shows a (mA) signal connected to UNITROL AVR.
This signal is the Voltage Reference. The (mA) signal (4–20) is converted to a Voltage (2–10) at the Unitrol terminals. The signal is staggered on UNITROL as 90–110% x NV (Nominal Voltage). In order for an engine to be controlled by the MVC, the following criteria must be taking into account:
The Engine is operating.
The generator circuit breaker is closed.
The parallel Genset with the grid-Machine is in parallel with the network.
Genset is in AUTO mode (key in unit-M1).
MVC switch is enabled.
In the MVC control, the Generators connected to the same MV-bus bar will share the Reactive load. In order to further share, the droop voltage is set to −7%. In the case of sensor failure at bus bar voltage 69 kV or 13.8 kV, the MVCith is set to FALSE, which means that the system will be transferred to point of failure mode.
The following changes were made to the Wärtsilä Operator’s Interface System (WOIS).
Medium Voltage Switch Screen, Common Indication when MVC is enabled. This is in accordance with the position of the key mounted on the control panel 901 and 904. When the switch is in position 1 MVC, it is enabled.
5. Electrical Predictive Maintenance
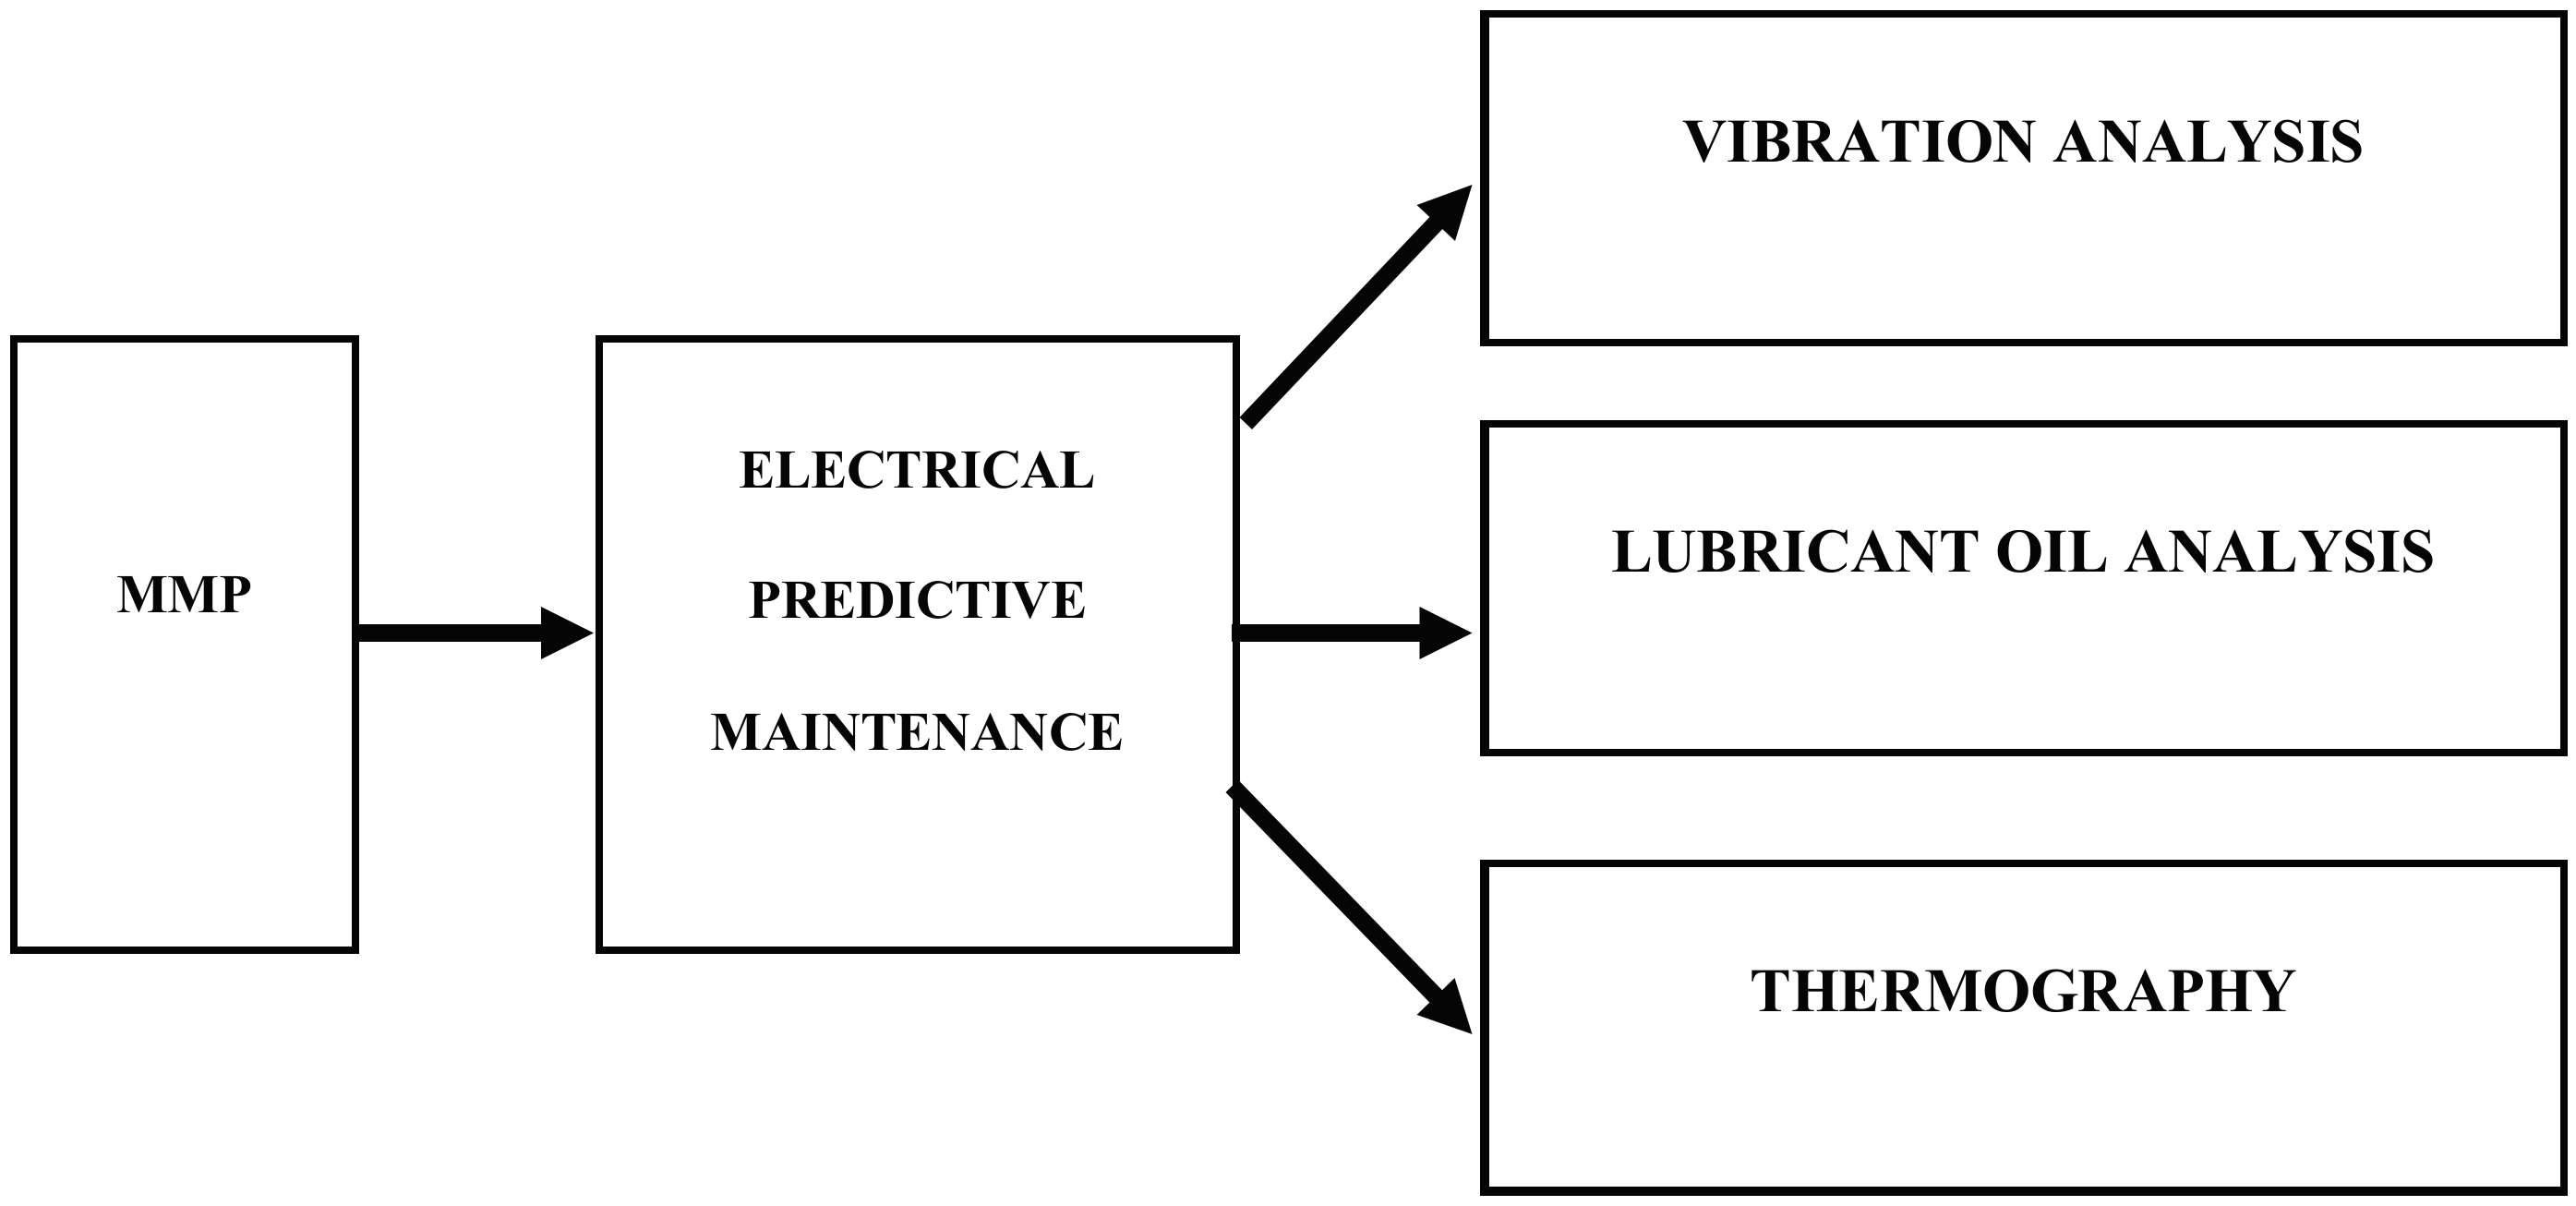
Electric predictive maintenance is the practice used most often to establish the need for maintenance is the periodic inspection on the generators. Inspection intervals vary greatly and are also different for different tasks. For example, intervals ranging from one week to five years have been reported, with entry more frequent than one month. In
Figure 4, the procedure of Electrical Predictive Maintenance is shown.
5.1. Vibration Analysis
This practice is applied periodically and used to evaluate the vibration of the motors and rotating equipment, being able to detect if the equipment needs alignment, balancing or change of bearing or parts.
The classification adopted for the vibratory severity is a function of the power of the drive, speed of rotation of the machine, and critical level for the production.
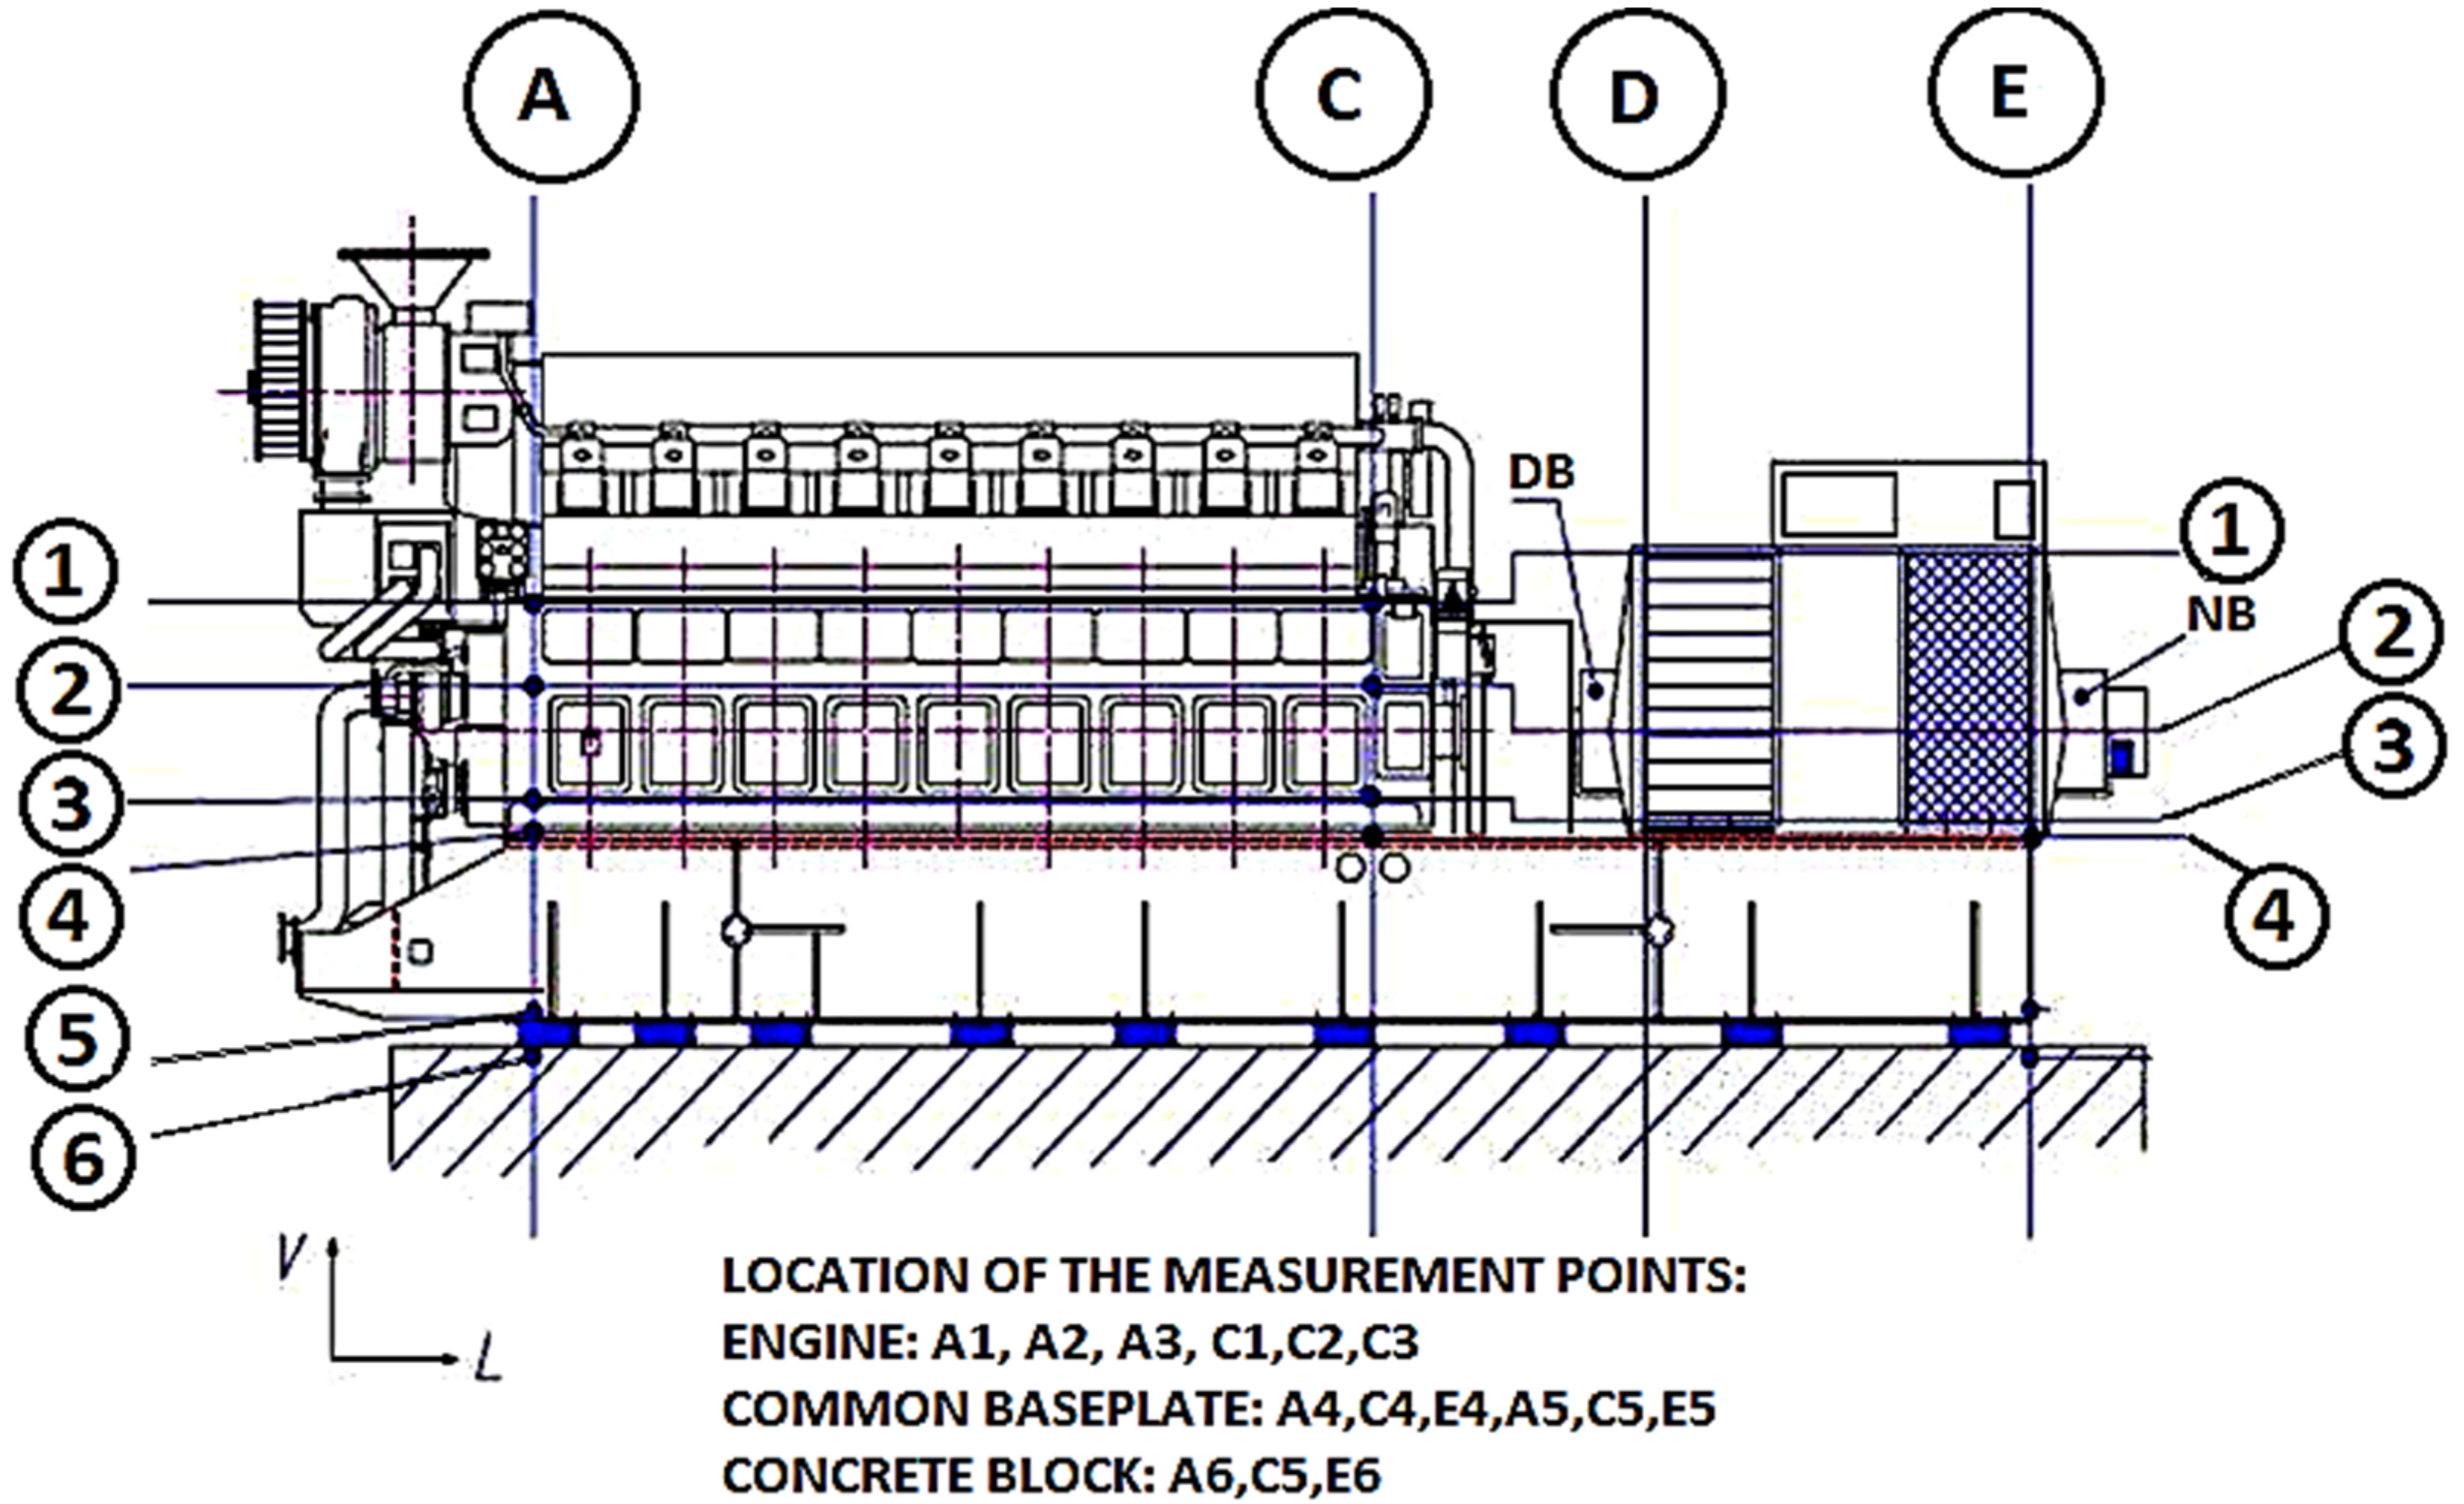
Each piece of equipment was carefully evaluated so that the vibration levels were compatible and registered with maximum fidelity in the Software Prism 4 (version 4, GraphPad Software, Inc., La Jolla, CA, USA), aiming at the management and control of the values for point analysis. In
Figure 5, the points where vibrations measures were done are shown.
Based on the ISO 10.816-6 and ISO 8528-9 standards, we can classify the engines and generators installed in the “Mauá” Plant, as belonging to group 3 of the ISO 10.816-6 table. Following this table, it was found that the vibration levels should be below 18 mm/s (RMS—root mean square) to be considered satisfactory for unrestricted operation over long periods.
Analyzing the table of values, it can be noticed that none of the measured points exceeded this limit of 18 mm/s (RMS), so it can be ensured that generators are in good operating state, being classified as satisfactory for operation use.
It has been found that most of the problems highlighted by the vibration analysis report is related to the engine coupling with the electric generator. The coupling was replaced with another from another firm with superior durability and improving the level of vibration and durability of the equipment.
5.2. Analysis of Water Content in Lubricating Oil
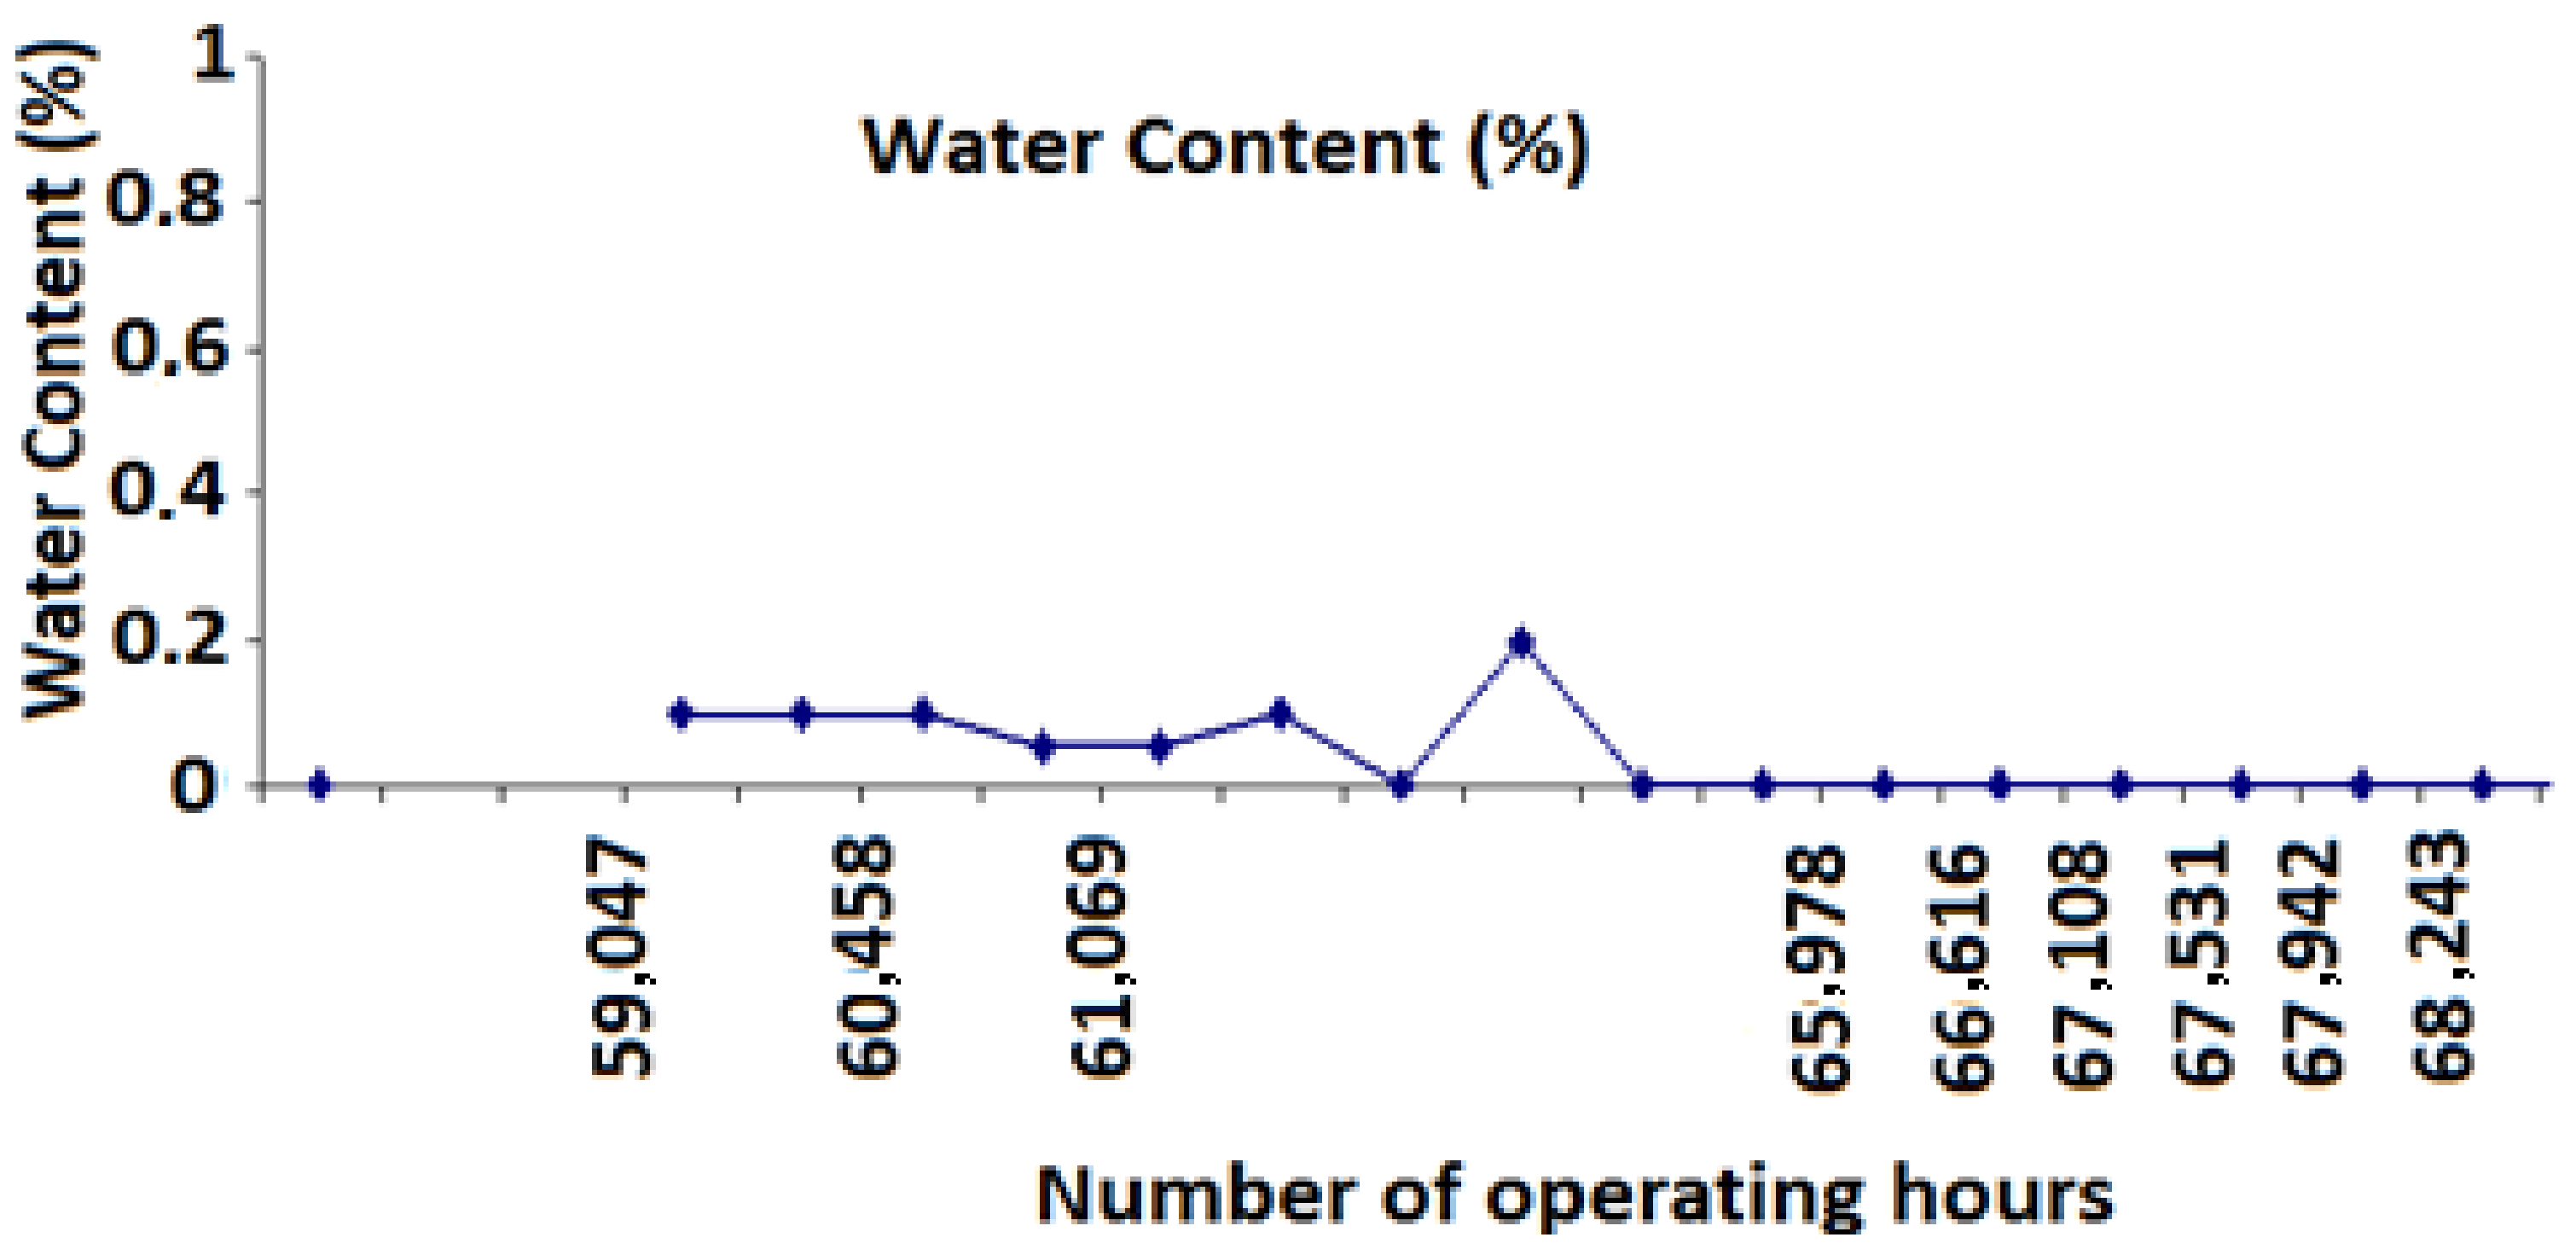
The results of the analysis of water content (see
Figure 6), done periodically as predictive maintenance, show normal levels, since the tolerable value is 0.3%.
The method used in this study is distillation, which evaluates the volatility characteristics of the lubricating oil. The test is performed by taking 100 mL of the sample of the product, which are placed, in a glass flask that is then subjected to heating for distillation under controlled conditions.
With this heating, the products are vaporized, then condensed and collected in a glass beaker, immersed in an ice bath. After this operation, the recorded temperatures are corrected taking into account the losses, which occur in the evaporation of small parts of the product.
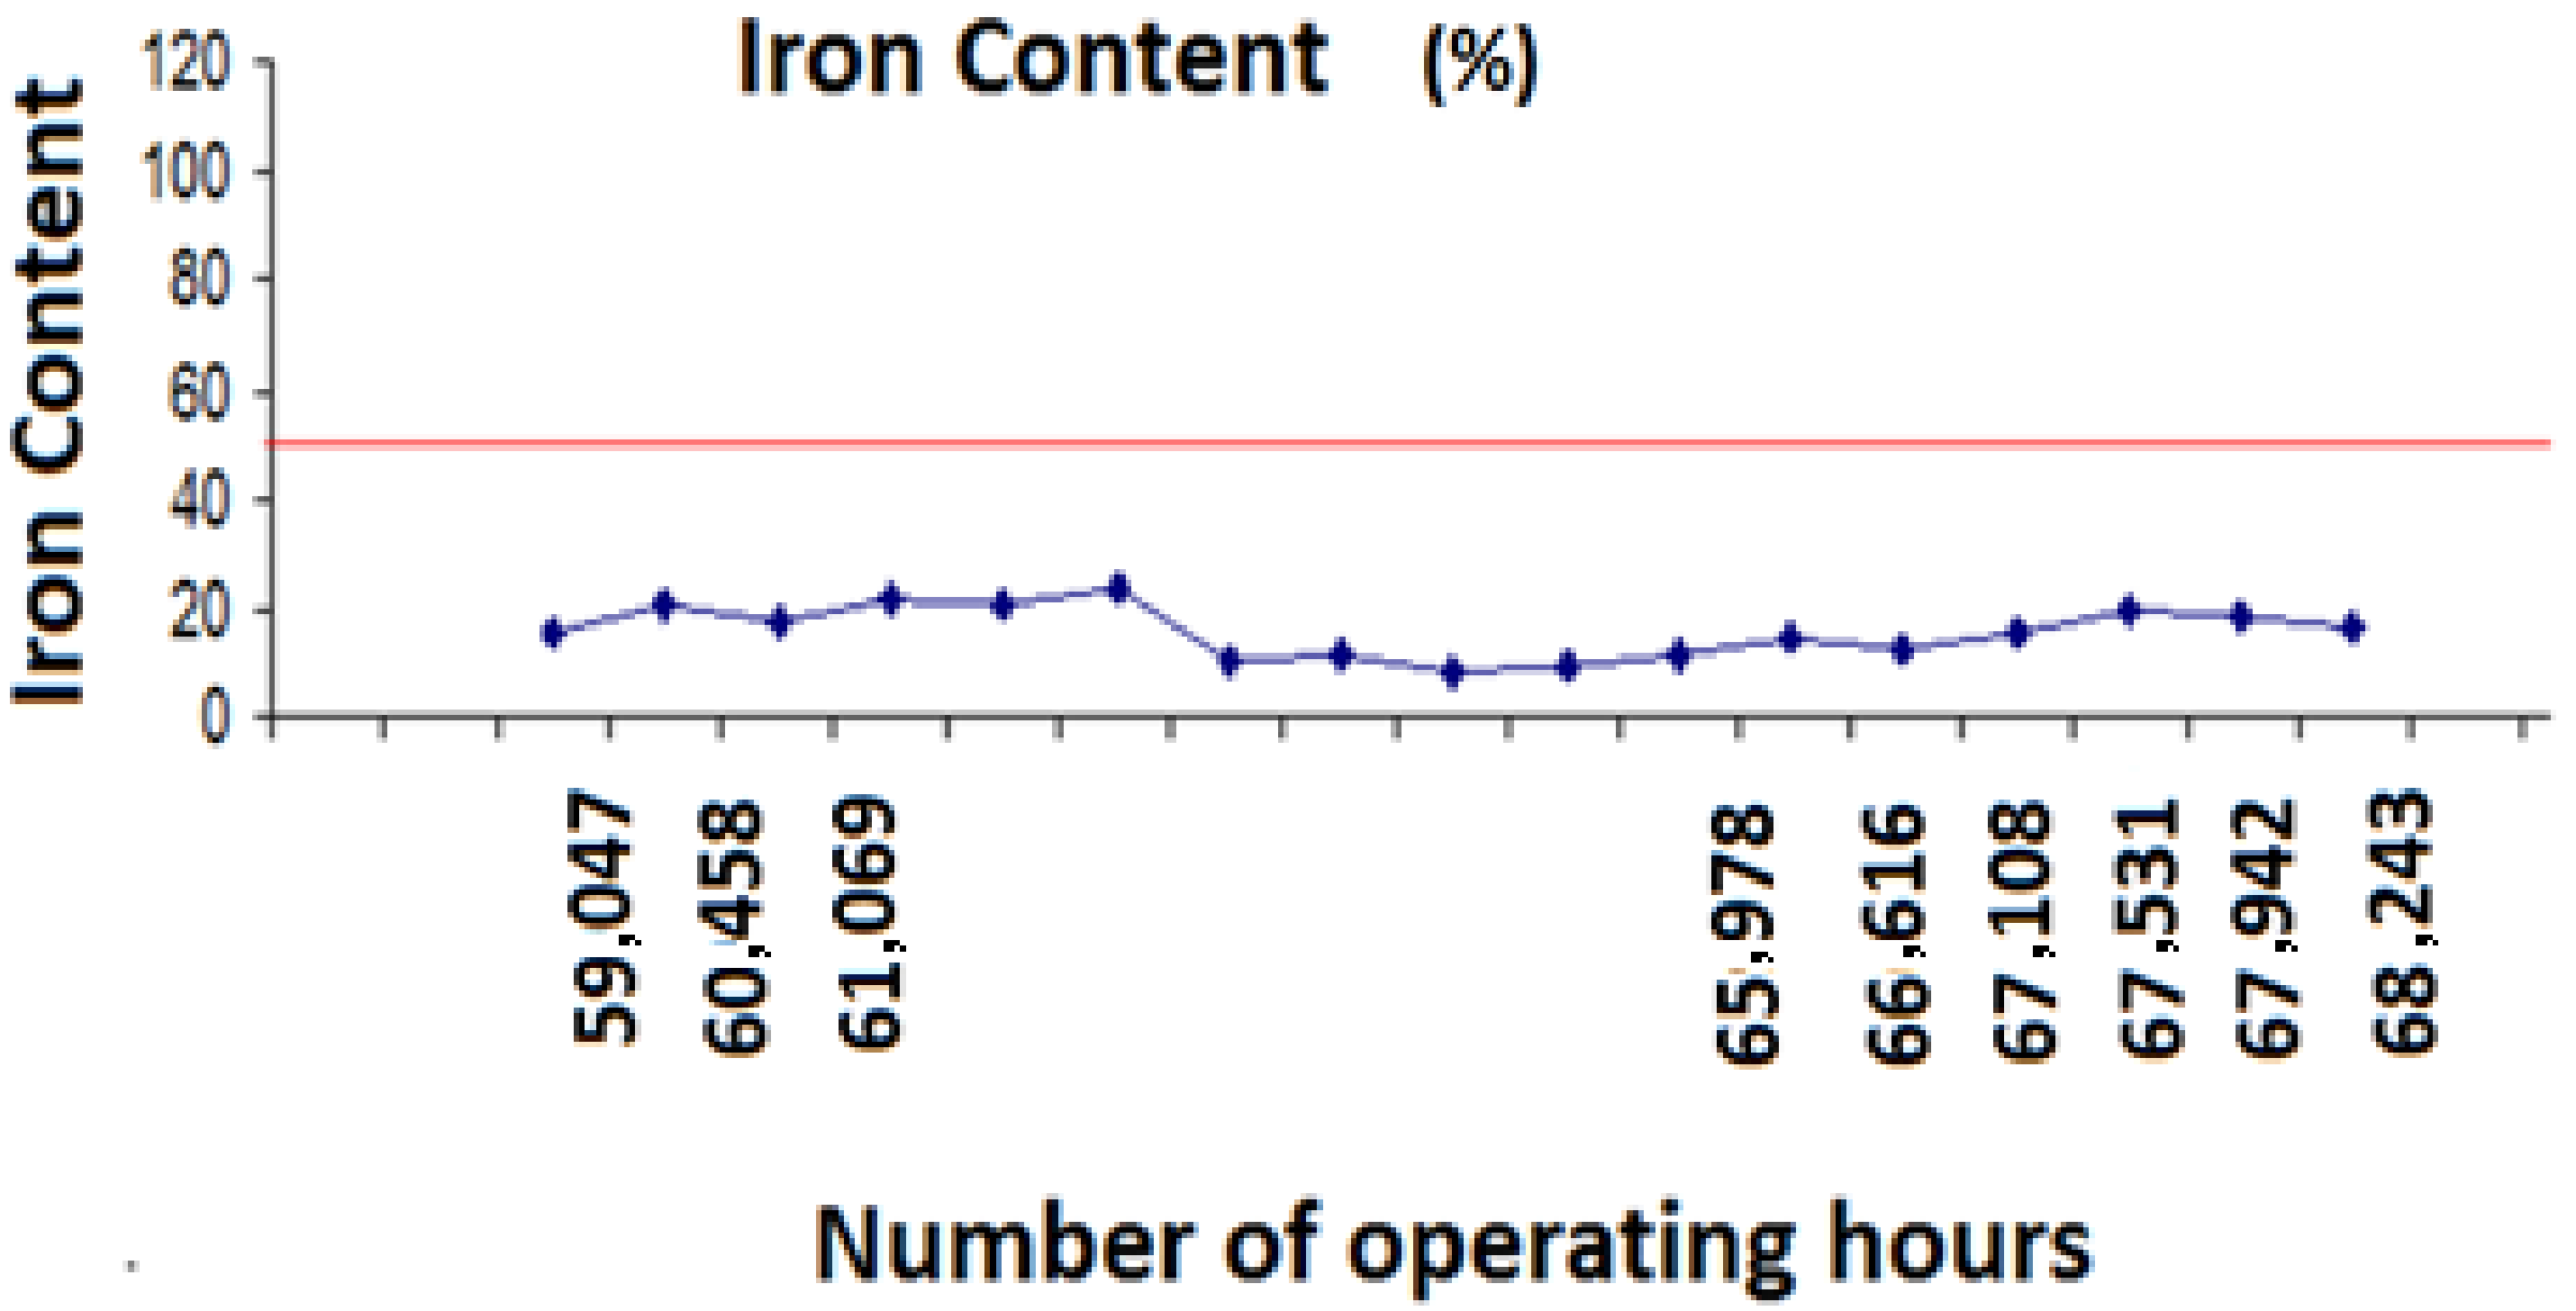
5.3. Analysis of Metal Content in Lubricating Oil
The methods describe the analysis of fluoride-methodology of analysis of metals in oils and greases by determination of Metals in Lubricating Oil. They range from atomic absorption to plasma atomic emission. The analyses were made by direct reading (iron and copper), based on the extraction of the magnetizable contaminant particles, contained in the lubricant, through the action of a magnetic field. The equipment used distributes the particles according to their size, since the smaller the distance the magnetic field travels. The non-magnetic particles are “fixed” at a still greater distance; this pattern refers to the number of particles larger than 2.5 and 15 microns in a volume of 100 mL. The number of particles larger than 2 and 5 microns is used as a reference point for sedimented particles. Particles larger than 15 microns contribute greatly to a possible catastrophic failure in the component. After the analysis,
Figure 7 and
Figure 8 were elaborated.
5.4. Thermography
Thermal imaging can detect low or high voltage electrical systems temperature variations caused by excess of electric current in these systems.
The electrical imbalance can be caused by several different sources: power supply problem, low voltage in one leg or failure of the insulation resistance inside the motor winding. This paper looks at the root causes of overheating in the power plant case study, as well as the tests and tools most often used to reveal overheating problems.
6. Results and Discussion
6.1. Results of the Implementation of the TPM
The monitoring of the indicators was carried out for a period of 12 months, allowing analyzing the implications of the application of TPM tools in the company.
The analysis of the results obtained from each pillar described in the methodology undoubtedly indicated the significant gains obtained with the adoption of the TPM, as shown in
Figure 9.
6.1.1. Pillar of Education and Training
The recommended Group to execute this pillar is the Human Resource group and all Employees related to operation and maintenance. All employees participating in the TPM Program should receive the Basic Training provided by the Pillar Coordinators.
Teaching material for the Basic Training, completed, approved by the Steering Committee and made available to the Pillar Coordinators must be supplied to this group. More rigorous scheduling with up-to-date training schedules to be conducted with indications of trainers with defined dates and Trainers should also be established with constant and updated dissemination of the number of employees trained and hours of training performed. Worksheet of skills and qualification of the Maintenance and Operators teams completed and updated by human resources department indications of the basic and specific training required for the company are also involved. The Planning for conducting the training identified in the previous item, including lectures, meetings of the TPM performed within the approved standards, with minutes, time, agenda, etc. should also be taken into account. Finally, the TPM Visual Management framework is approved and updated, containing the information of the Program together with the employees involved
6.1.2. Pillar of Specific Improvements
The recommended Group to execute this pillar is the group integrated by: Coordinators of ME, MA (Managers of power plants), Predictive Maintenance (PM) and Environment Supervisors (ES). Aspects to be considered:
Working Group formed, Operational Flow completed in a clear and didactic way, equipment, priorities and main risks identified and being known by all participants.
Generators, Auxiliary Equipment and Operations identified with their nominal and actual capacities.
Criteria for analyzing and identifying the main losses of the operation
In the PDCA (Plan-Do-Check-Action) cycle, Fishbone, Methodology should be used to investigate and eliminate losses.
Plan of Action prepared by the Working Group with actions, responsible, deadlines and progress of activities.
Implementation of the Action Plan and comparison of results before and after implementation.
Temporary Operational Standard completed and being used by Operators in each Generator and Auxiliary Equipment.
Performance of Generators and ancillary equipment should be evaluated by comparing the indicators and objectives defined for each one. Information of the operational reports should be provided with quality and accompanied by the Managers, Supervisors and Operators.
No data distortion: Results should be evaluated continuously by the Managers, Supervisors and Operators—before and after, including financial gains, materials, etc.
Operators must be able to identify any distortion in operational indicators.
Operational Standards must be followed, compared and corrected by Managers, Supervisors and Operators.
Operation should be monitored continuously by the Operators and acting within the specifications.
6.1.3. Autonomous Maintenance Pillar
To carry out the Autonomous Maintenance Pillar, the Recommended Group is integrated by: Managers, Supervisors and Operators of each Plant. Aspects to be considered:
In initial cleanup, operators and personnel involved must be trained to identify abnormalities in generators, auxiliary equipment, facilities, and workplace through labels.
Areas, generators, auxiliary equipment and facilities must always be clean and maintained under these conditions, with no signs of disorganization and poor hygiene being tolerated.
Use the “5S program” (Sort-Seiri: Removing all unnecessary items from the workplace, Set In Order-Seiton: Creating a specific location for everything, Shine-Seiso: Clean the work area, Standardise-Seiketsu: Standardise the best practice within the workplace, Sustain-Shitsuke: Never slip back into the old ways). Locations that are not meeting this requirement should at least be flagged and their future repair should be included in a timely, responsible action plan.
After the placement of labels, a control should be created indicating: the type of problem, the number of labels placed and removed and the areas involved in the abnormalities, such as: maintenance, operation, safety and environment.
Operators must always check the ideal conditions of generators and auxiliary equipment, the staff should always inspect the facilities and work areas if they are always marked with industrial safety colors, nameplates, lighting and cleaning.
Label indicators have to be updated, indicating the volume of labels placed and removed in the month.
All of the above activities must be carried out correctly, to begin identifying hard-to-reach places, eliminating sources of dirt and drafting the provisional standards for cleaning, lubrication, inspection, safety and the environment.
Structuring the Autonomous Maintenance Pillar presented the organization chart of the Plants.
Determining how abnormalities are identified. (Labeling) Train workgroup for labeling procedure.
Determining how to do the initial cleaning. Initial cleaning. Establish form of control of the labels.
Start the labeling process. Inform through KPI (Key Performance Indicator) the number of tags used.
Start the process of removing the labels.
Inform through KPI (Key Performance Indicator) number of labels removed. Perform internal audits to ensure program success.
6.1.4. Planned Maintenance Pillar
Recommended Group: Managers, Supervisors and Operators of each Plant. Aspects to be considered:
Complete prioritization worksheet containing pertinent questions from the areas involved in the Operation (Operation, Maintenance, Engineering, Safety and Environment).
To evaluate and to classify in A, B and C all Engines, Auxiliary Equipment and Facilities of the company. This classification should be done according to the importance of each piece of equipment for the functioning of the entire thermal Plant.
The stock management has to be according to classification: (A) most important that must not be missing in the inventory; (B) intermediary level that must be contained in the stock; and (C) minimal stock.
The maintenance and operation team must carry out inspection planning on all equipment cataloged.
Maintenance team should also review the generators and equipment of the facilities to meet the maintenance standards as described by the manufacturer to rescue the desired conditions of operation of the equipment.
Action plan has to be defined with: activities, materials, deadlines, estimated time in each repair activity and maintenance team in equipment A, B and C classified and with the type and recommended maintenance plan completed.
Perform planning and schedule of maintenance activities for Generators, Auxiliary Equipment and Facilities.
Report on completed and initiated maintenance activities. The engineering should perform critical analysis of the graphs and reports of the new documents indicating Mean Time Between Failure (MTBF)/TMEF (Average Time Between Failures) and MTTR (Average Time to Repair) per Engine.
6.2. Results Analysis of Voltage Quality
After the application of the developed procedure, the control of the voltage at 72.20 kV was maintained, with little voltage variation in the Electric Generators and consequently with the generation of Reactive Energy, ensuring the energy quality and maintaining the set value of 72.20 KV constant in the output bar (high voltage). When there is a disturbance in the System such as the output of a Machin, other Machines react and maintain the tension set on control.
It is very important to comply with the operative contract, contributing to the generation of reactive power, to have a more stable voltage control system and to carry out real simulations of rejection tests to guarantee the perfect functioning of the AVR Unitrol 1000.
6.3. Applied Improvements
Less consumption, and more quality energy: Reducing reactive power consumption results in improved quality of power supply, which reduces voltage drops and electrical losses at Customer’s and the concessionaire’s premises.
Tension control should ensure a more stable system for industry and society in Manaus. Replacement of AVR (automatic voltage regulator) equipment, on the other hand, to be capable of operating in voltage control to reduce voltage drops caused by excessive reactive loads. Automatic voltage control prevents voltage drops caused by consumption excessive of reactive, thus guaranteeing the society a perfect functioning of its equipment and providing a longer useful life of the same.
To facilitate the analysis of the evolution of the results, tables were used as figures, presenting consolidated values of Indicators used; focusing on the results before and after the application of TPM (Total Productive Maintenance) and the implementation of the PM (Predictive Maintenance), according to graphs. Thus, the improvements obtained in the results of the MTBF and MTTR maintenance area was evidenced.
MTBF (Mean Time Between Failures) is a value assigned to a particular device or device to describe its reliability. This assigned value indicates when a device failure may occur. The higher this index, the greater the reliability of the equipment and, consequently, maintenance will be evaluated in efficiency issues.
The MTBF calculation is done as follows. The manufacturer defines the number of parts tested simultaneously and the number of hours that the test will be performed. By multiplying one by the other, it is obtained the total number of hours connected, which is divided by the total number of parts that were defective in the period.
The average MTTR time for repair is a measure on the basis of repairable item maintenance. It represents the average time required to repair a component failure.
6.4. Quality Statistics Tools
The main statistical techniques that can be used in an integrated way in cycles of continuous improvement of processes and services are the following according to
Table 2,
Table 3,
Table 4,
Table 5,
Table 6 and
Table 7.
6.5. Pareto Graphs of the Indicator Analyzes
Vertical bar charts provide information in a way that makes it clear and visual to prioritize themes. The information thus prepared also allows the establishment of numerical targets that can be achieved according to
Figure 10,
Figure 11,
Figure 12 and
Figure 13.
Calculations of MTBF and MTTR were done in the classical way, according to [
38,
39,
40]. In
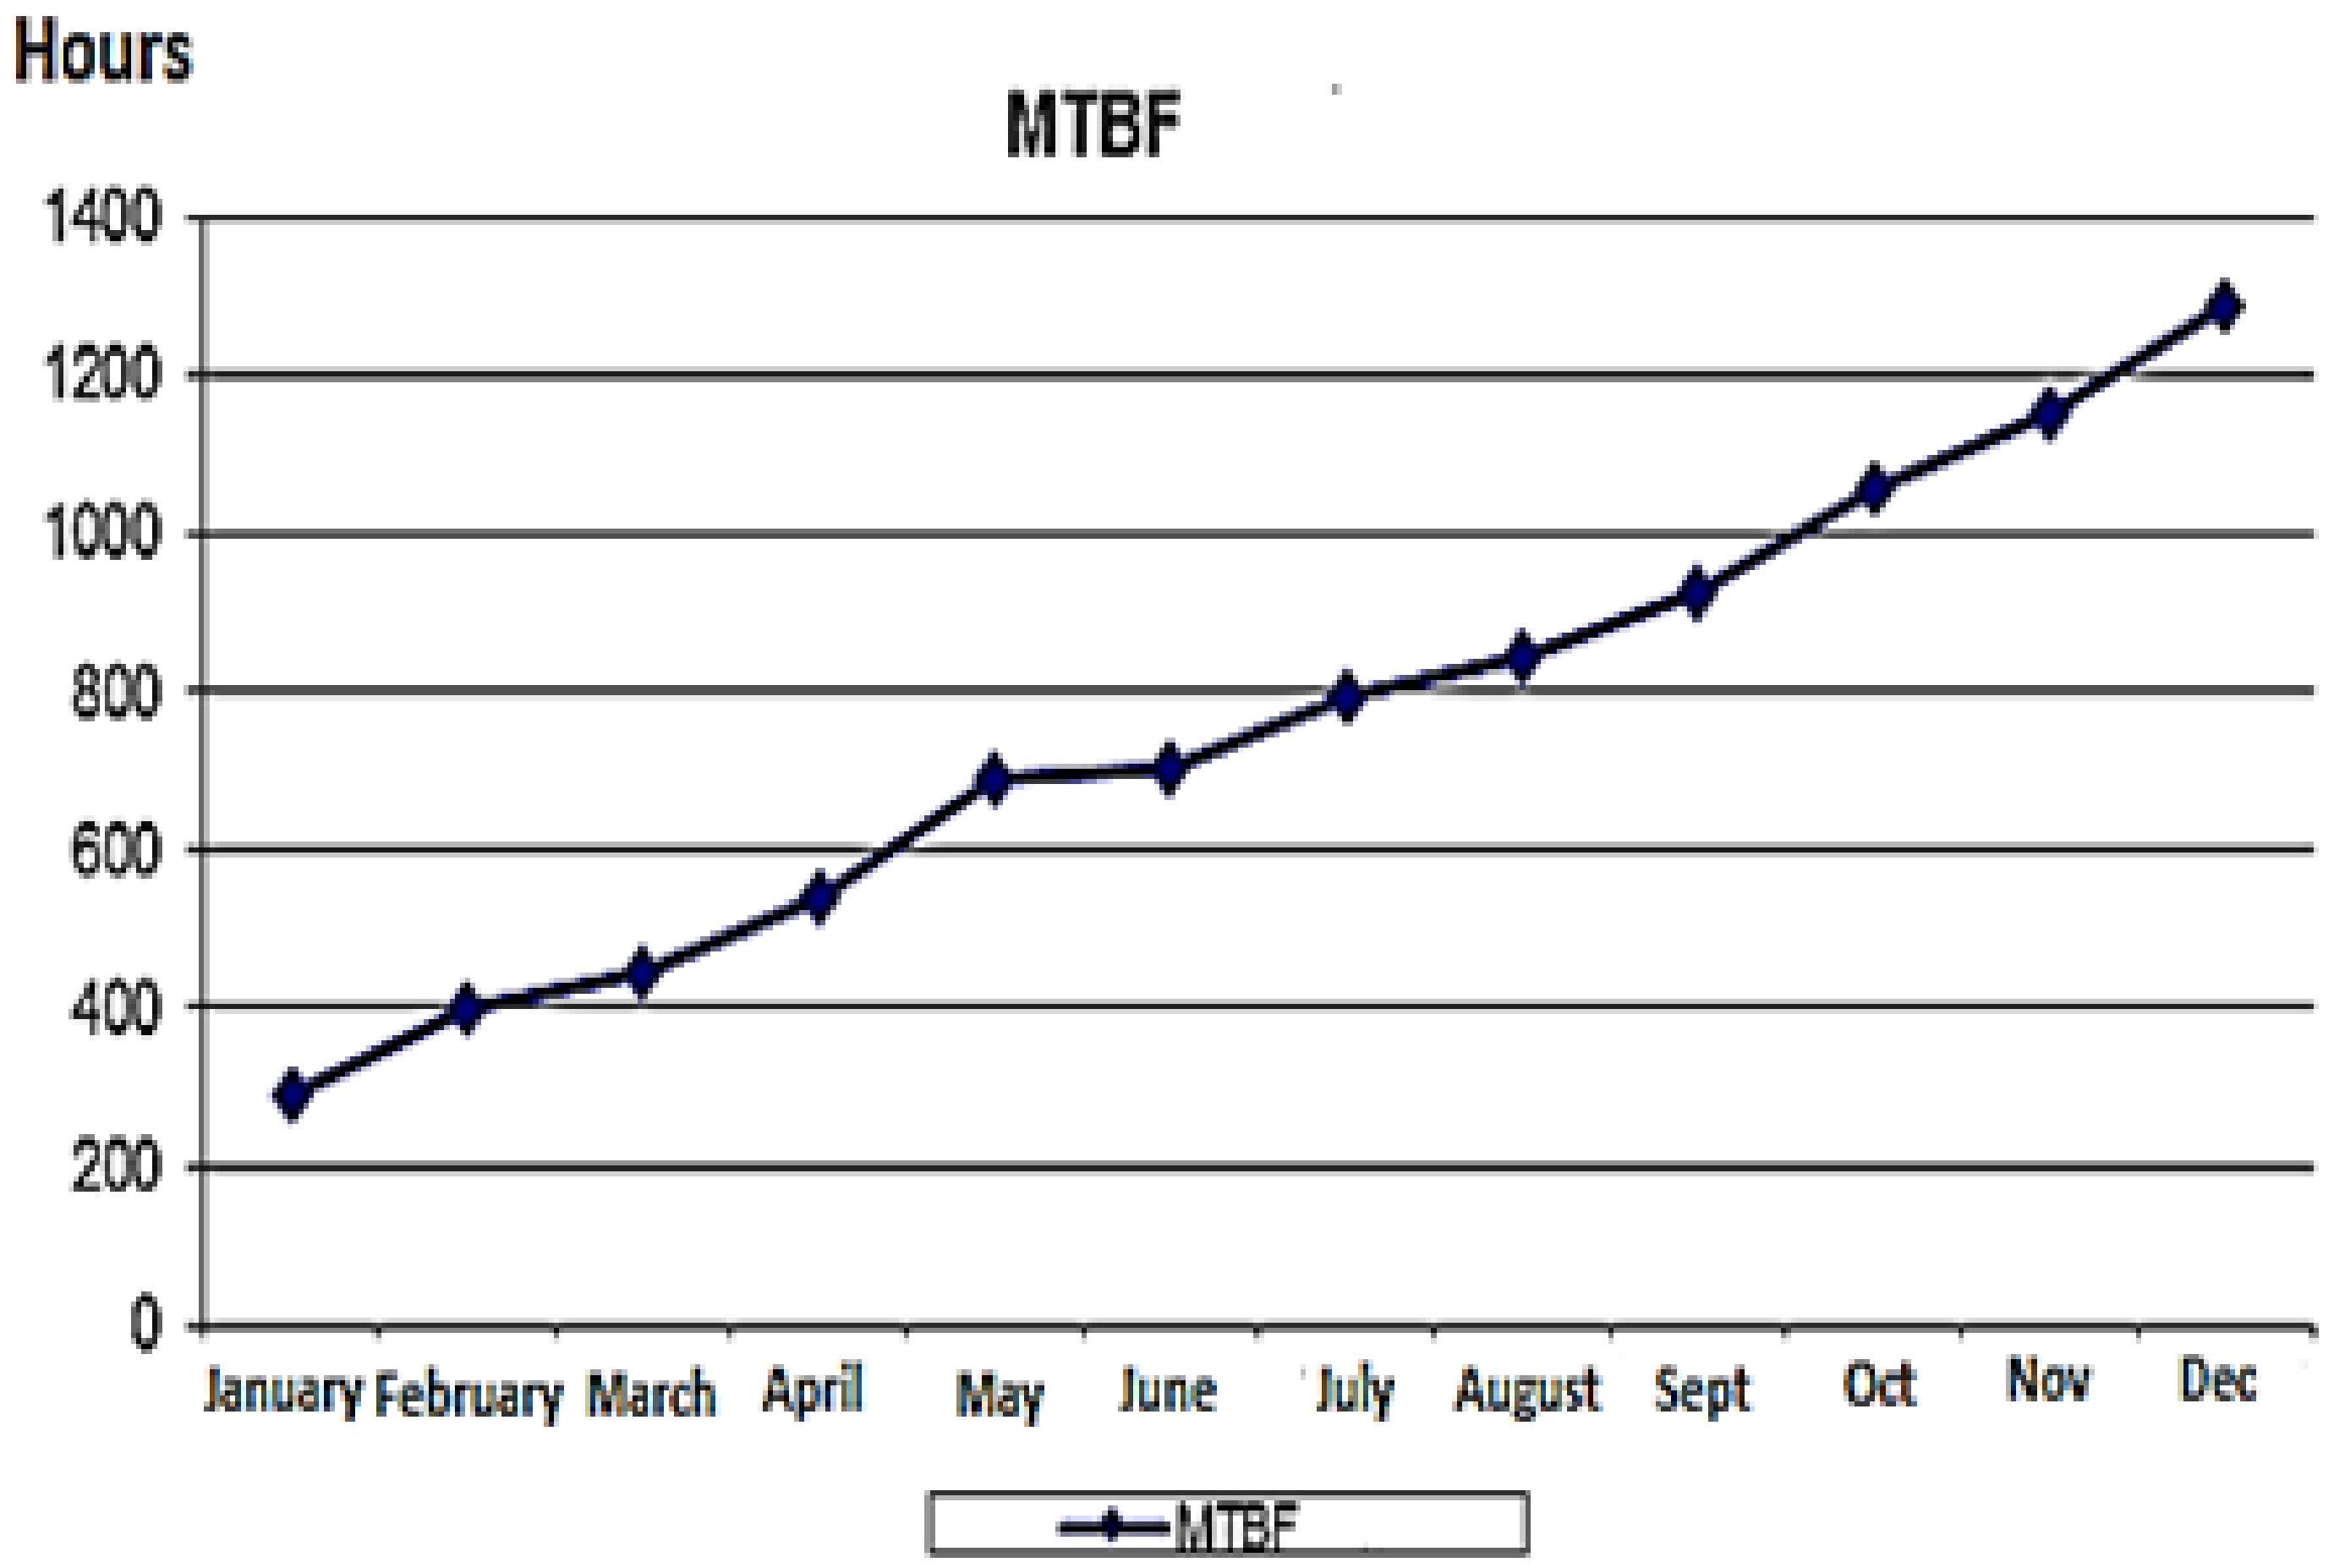
Table 8 and
Figure 14, it is shown the MTBF in hours for the 12 months of 2016, the year after the application of Maintenance Management Program.
With the analysis of the results and discussion of the facts, it was verified that the implantation of TPM and PM is economically feasible, as shown by the increase of MTBF and the decrease of MTTR.
6.6. Frequency Failures by Generator in 2016
In
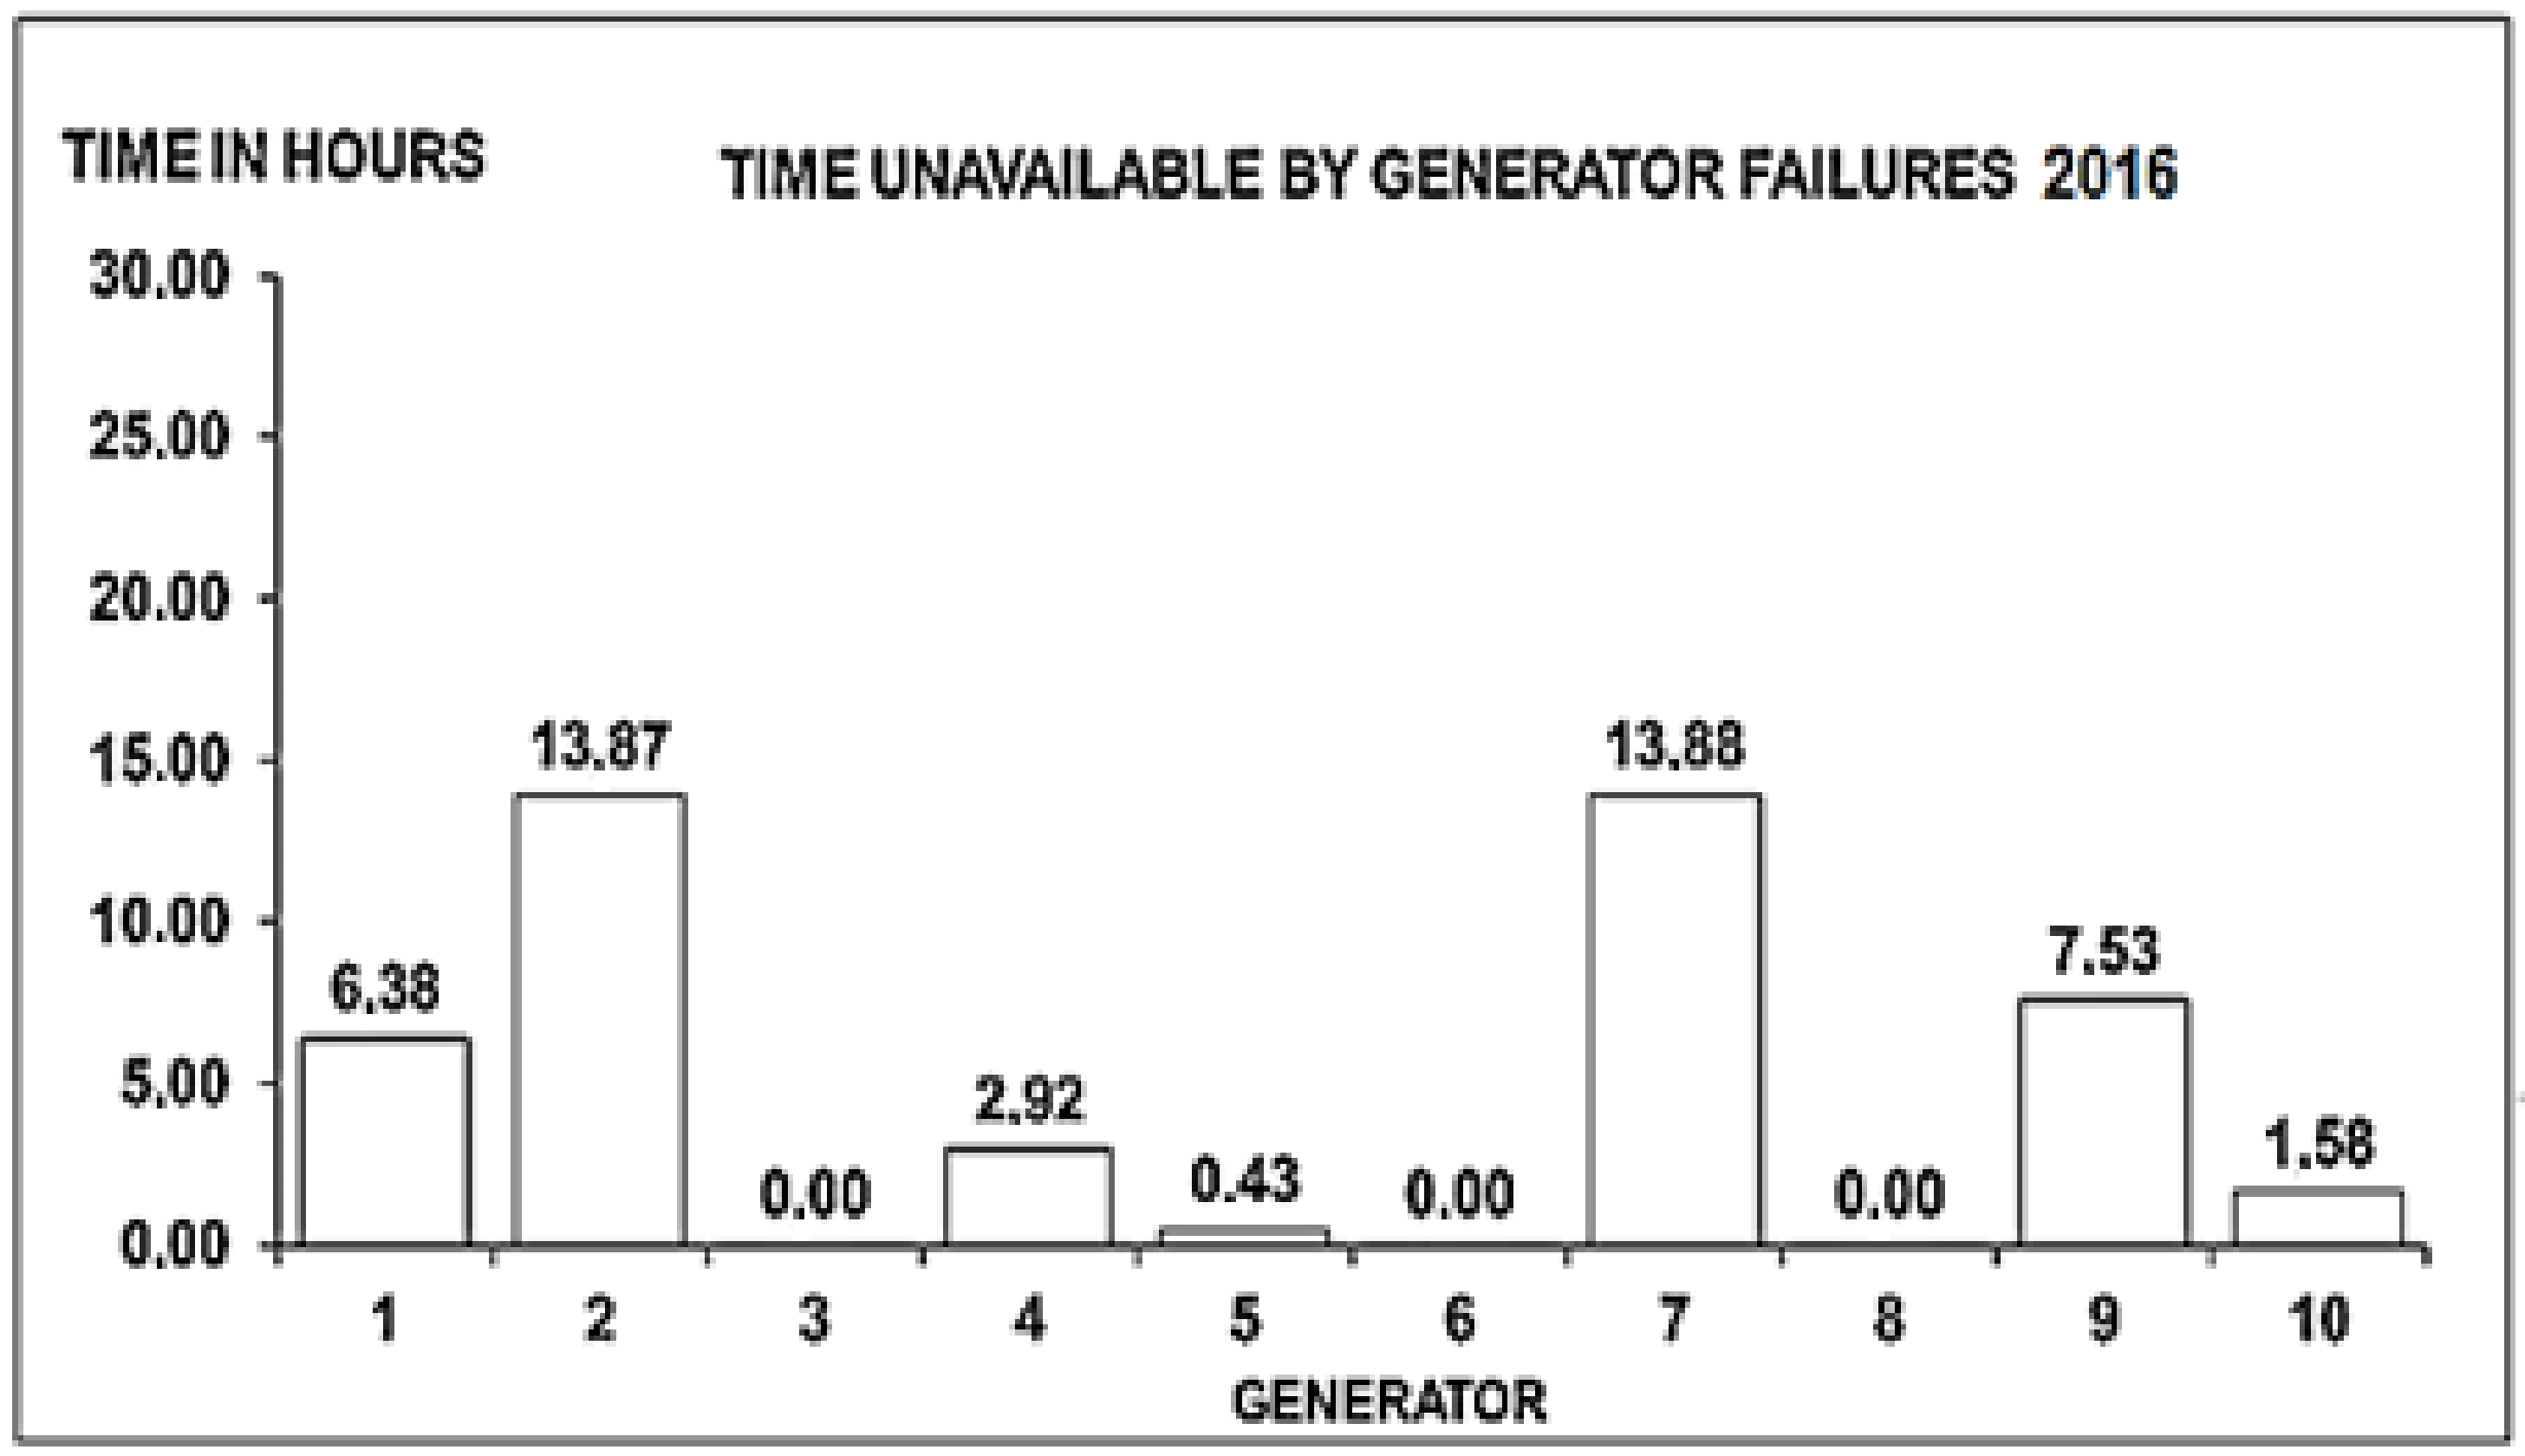
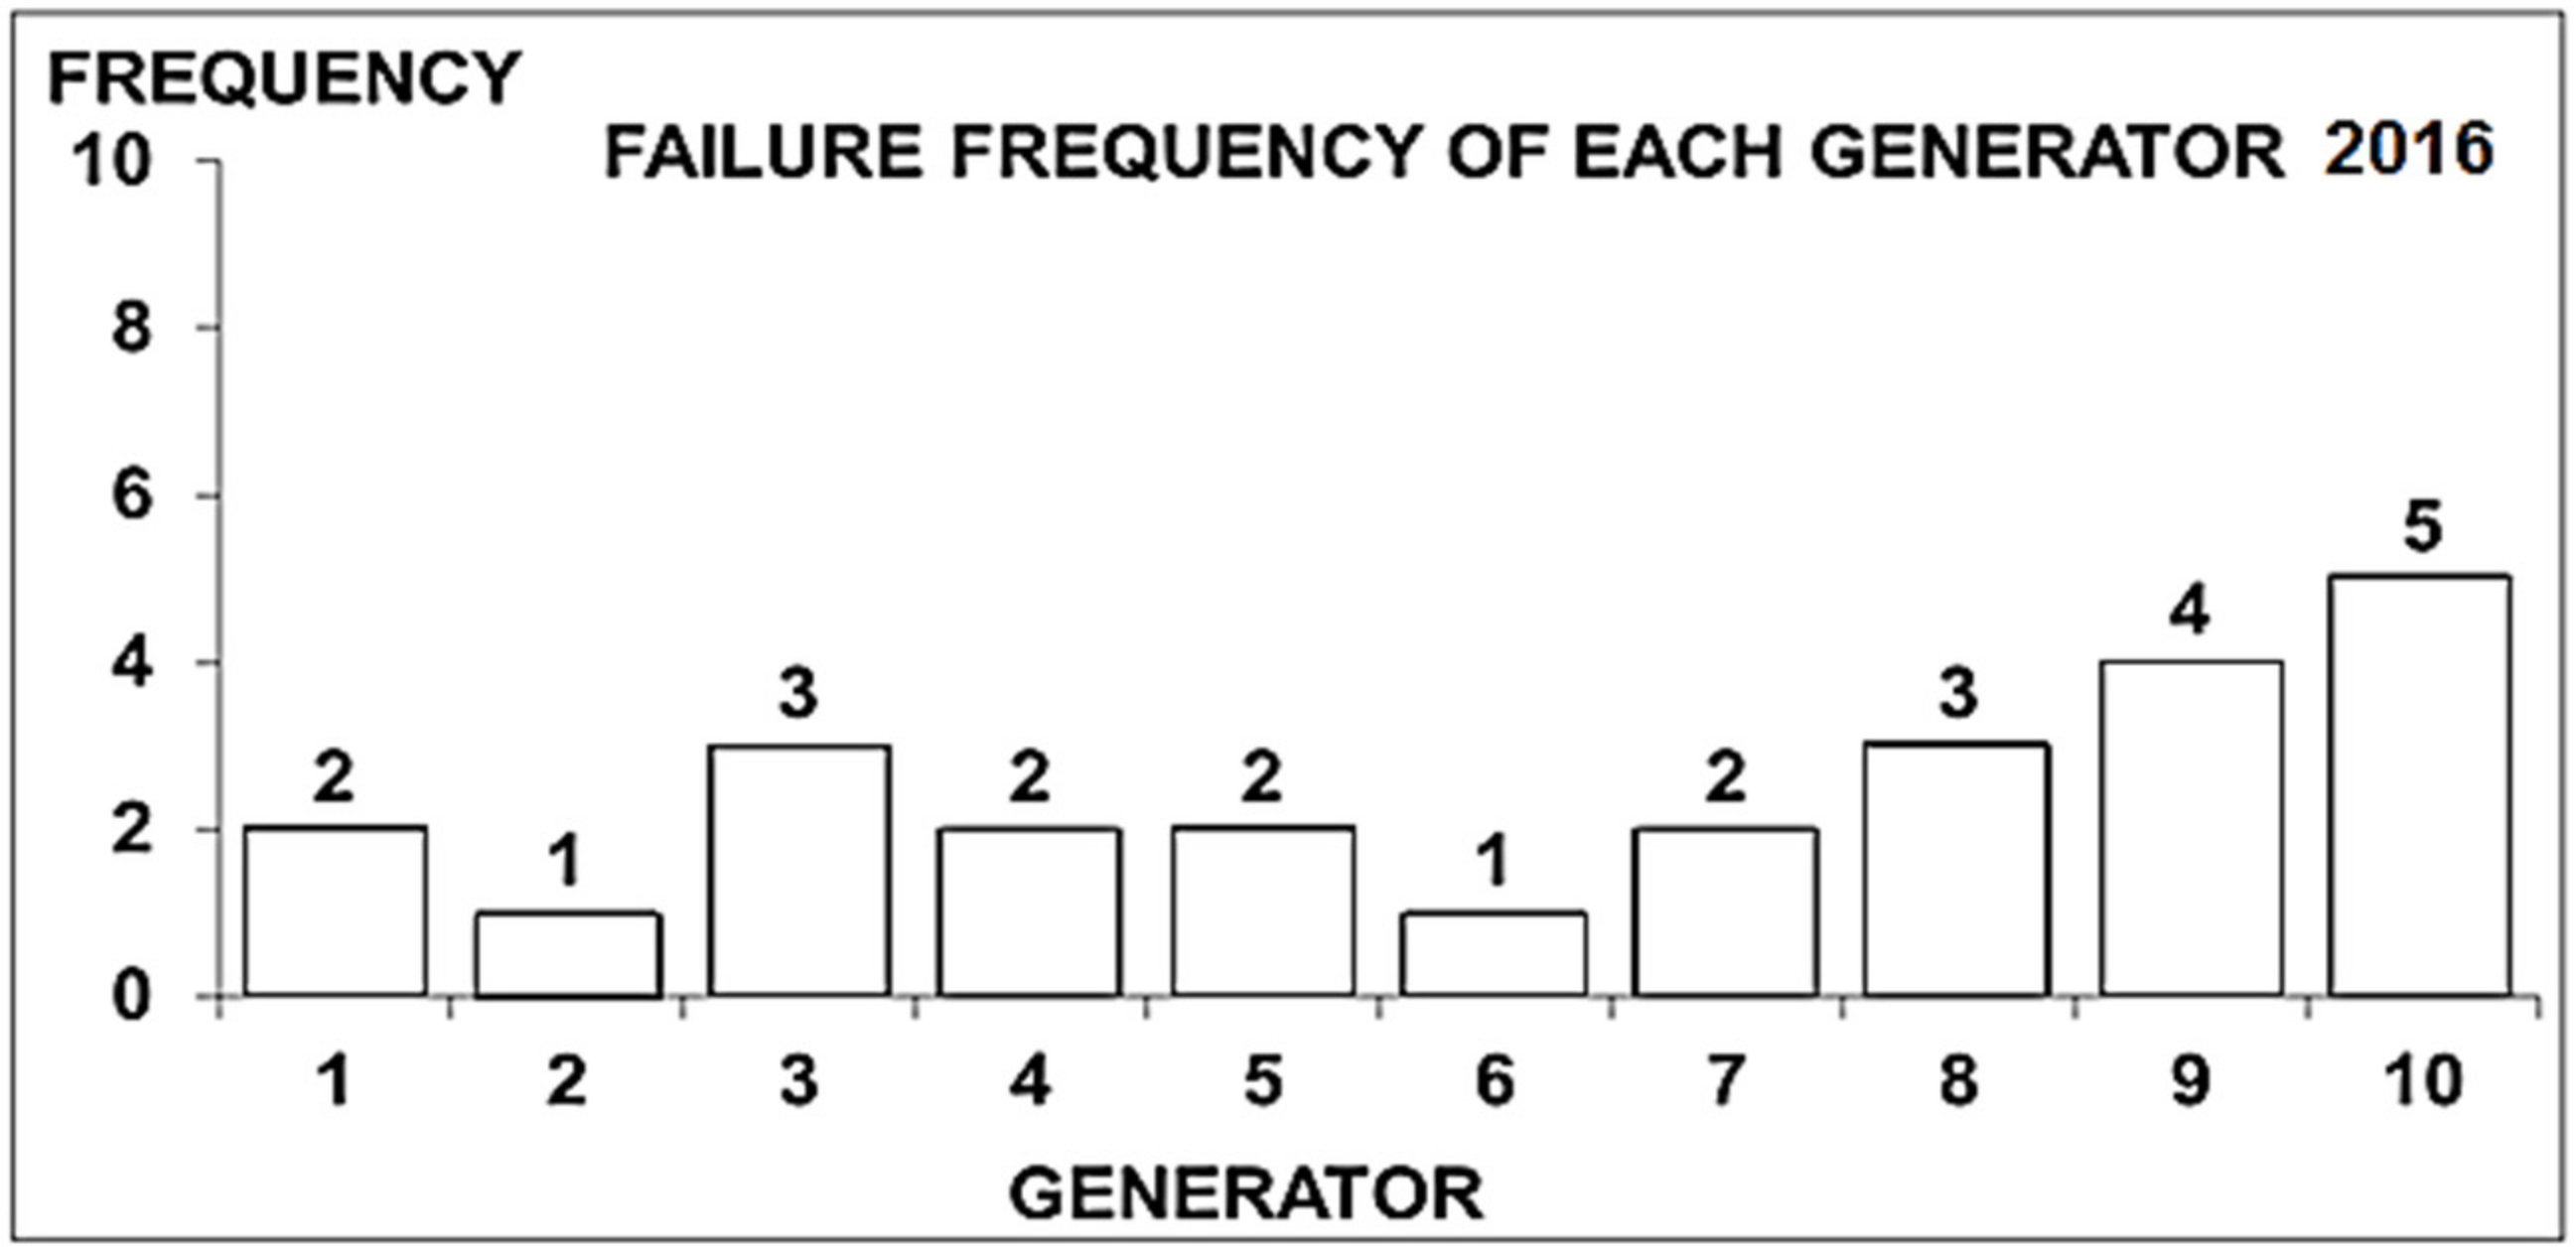
Figure 15 and
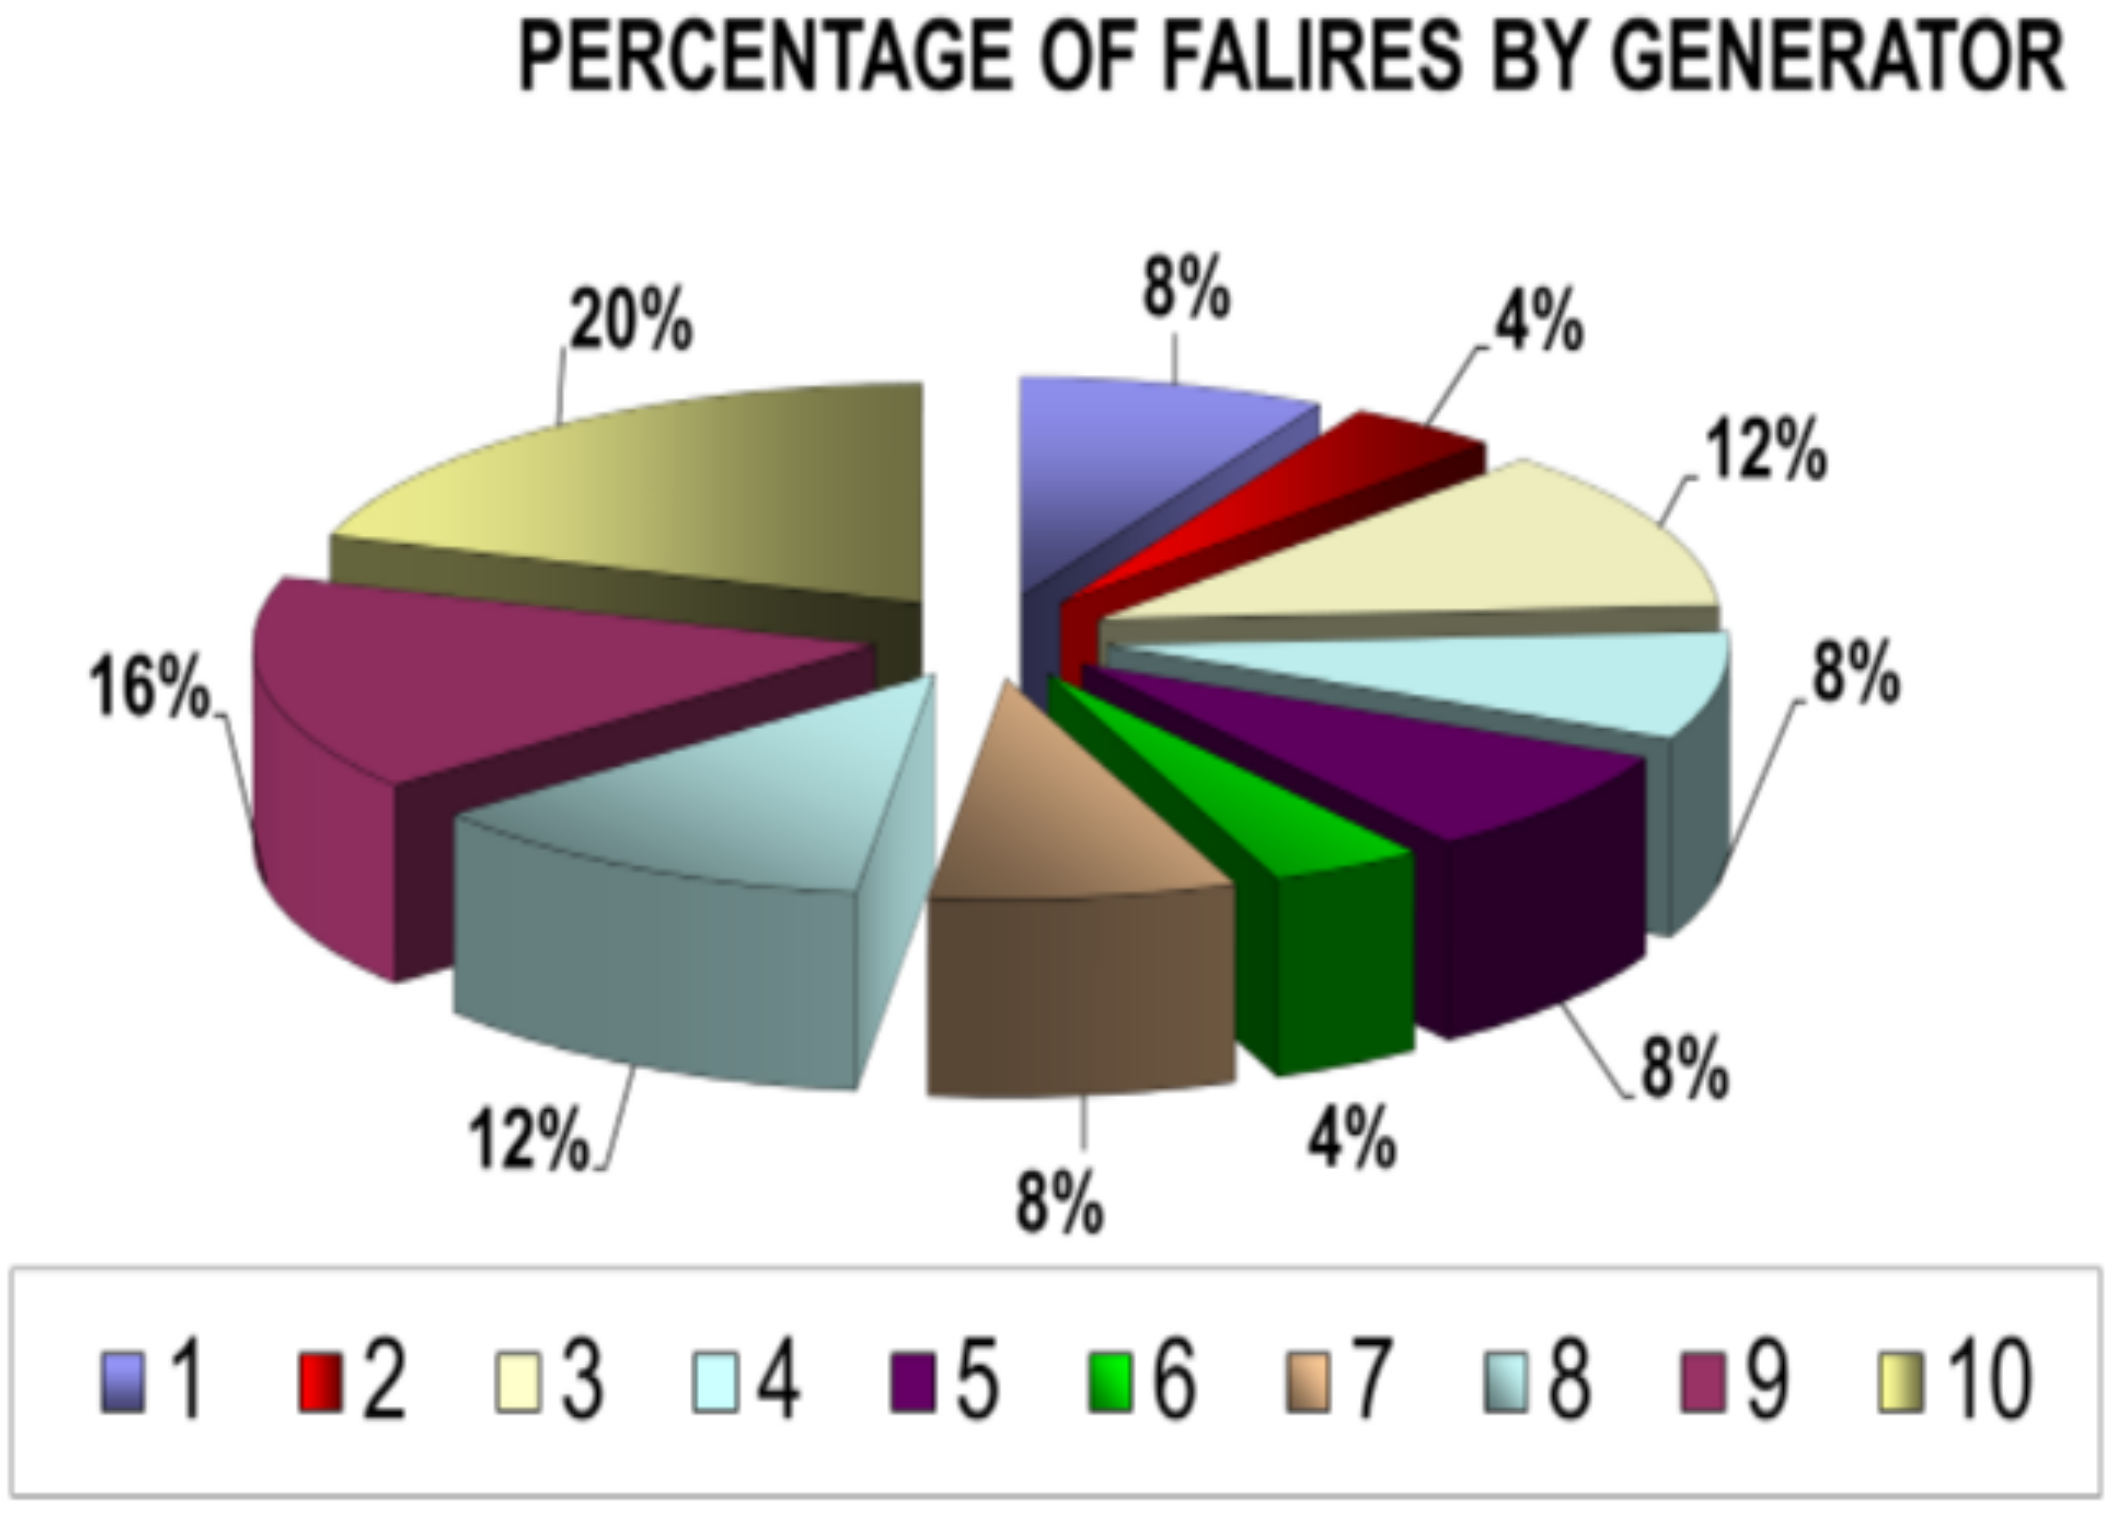
Figure 16, the generators’ performance during 2016 is shown. Failures diminish in relation to 2015. It can also be observed that generators 2 and 7 were critical related to the other ones considering the time they were unavailable. The frequency of failures of generators 9 and 10 were higher, but the time that they were unavailable was lesser. In
Figure 17, the percentage of failures of each generator during 2016 is shown.
After the implementation of the Maintenance Management Program, in 2016, an increase in the autonomous maintenance performed by the operators was verified, including an increase in predictive maintenance and reduction of corrective maintenance in the 10 generators, the reduction of unavailable time, the frequency of failures and the percentage of failures by generators.
6.7. Costs Involved in Maintenance at the Power Plant Case Study
Next,
Table 9,
Table 10 and
Table 11 present a survey of the direct costs involved in the corrective maintenance of the ten engines and generators of the “Mauá” thermoelectric power plant, including the costs to restore the power generated by the Manaus-Brazil thermoelectric power plants.
7. Conclusions
Based on the data for the thermal power plant in Brazil, it was possible to identify the causes of equipment shutdowns. It was verified the solution of a problem in real situation of the company, with this they were presenting gains with the two plans mentioned above, could be gauged on the basis of the information of the case study, which, over time, presented a high number of occurrences of corrective maintenance.
Therefore, as soon as the problems were detected, the maintenance area of the company proposed the implantation, first of a program of predictive maintenance; and, in a second step, the implementation of a total maintenance program. After the implementation of the programs, it was verified, through the improvement of maintenance indicators, the solution of a problem in real situation with the continuous decrease of corrective maintenance in a period of one year in the company case study.
It can be concluded that, with little investment, the problem of corrective maintenance in the power plant, without compromising the power production of the plant, safety and efficiency, can be solved.
The implemented solution is friendly to the environment, maintaining the reliability of the Manaus Electric System, without compromising the security of the facilities, at a cost always lower than the US$ 51,613,876.36 spent annually.

 ,
, 


