Study on Electrode Potential of Zinc Nickel Single-Flow Battery during Charge

1
School of Energy and Power Engineering, Jiangsu University of Science and Technology, Zhenjiang 212003, China
2
Zhangjiagang Smartgrid Fanghua Electrical Energy Storage Research Institute Co., Ltd., Zhangjiagang 215600, China
*
Author to whom correspondence should be addressed.
Energies 2017, 10(8), 1101; https://doi.org/10.3390/en10081101
Submission received: 21 June 2017
/
Revised: 15 July 2017
/
Accepted: 17 July 2017
/
Published: 27 July 2017
(This article belongs to the Section D: Energy Storage and Application)
Abstract
:In this study of zinc nickel single-flow batteries (ZNB), the ion concentration of the convection area and the electrode surface of the battery runner were investigated first. Then, the relationships between the electrode over-potential (or equilibrium potential) and the charge time were studied. This was based on the electrochemical reaction rate equation and the equilibrium potential equation, from which a mathematical model of the stack voltage (as affected by the internal parameters of the battery) was obtained. By comparison with experimental data, it was determined that the relative error of the simulated stack voltage of a 300 Ah battery was restricted to <0.62% while charging under the condition of 100 A constant-current charging. This shows that the mathematical model can accurately describe the dynamic characteristics of the battery stack voltage, and is very accurate for predicting the stack voltage of the battery during charging under 100 A constant-current charging conditions.
1. Introduction
Flow batteries are widely used with renewable energy sources, the construction of smart grids, and in some other fields; and they have become a popular area of research for energy storage batteries [1,2]. Cheng et al. [3,4], proposed using zinc nickel single-flow batteries because of advantages such as their low cost and long cycle life. They could provide a cost-effective solution to the problems associated with development and application of large-scale power supply. The battery charge/discharge process can be described using a battery model, and an accurate battery model can reflect the battery characteristics well enough to predict them. At present, the modeling of battery characteristics generally involves the use of mathematical, circuit, and mechanism models. The circuit model is intuitive and convenient, and is suitable for a corresponding simulation experiment, but in this case, the battery model data is difficult to obtain, and the model accuracy is low [5]. A mathematical model can predict the external characteristics of the battery; but because the battery state quantity is more abstract, the electrical performance parameters are not intuitive [6].
Because the internal reaction mechanism of a flow battery is the essential reason for change in the dynamic characteristics of the battery, the mechanism of the interaction between the process of internal transmission and the electrochemical reaction can reflect the inherent factors and changing laws that affect the battery’s performance. Most simulation studies of single cells use a mechanism model. Shah proposed a mechanism model for a vanadium redox flow battery considering the side effects of hydrogen evolution in the cathode [7] in 2010, while Al-Fetlawi, in the same year, proposed a mechanism model of a vanadium redox flow battery considering the side effects of oxygen evolution in the anode [8]. Yao et al. [9,10] established a three-dimensional steady-state model for the internal reaction and mass transfer of zinc nickel batteries (ZNB), and the distribution of the ion concentration and current density in the battery was studied. Based on the Nernst equation and the electrolyte recirculation loop, the electrochemical model of the battery was studied, in relation to the stack voltage output characteristic of the battery under constant-current charge/discharge. However, the model did not consider the influence of the internal reaction parameters of the battery. In addition, Zhang et al., of the Dalian Institute of Chemical Physics, did a series of studies on battery charge/discharge efficiency [11,12,13].
For the zinc nickel single-flow battery, there is little research on stack voltage modeling using the mechanism model. In this paper, based on study of the battery runner ion concentration, electrode over-potential, and equilibrium potential, a mathematical model of the battery voltage is established for the ZNB. The voltage variation law of the charging process of ZNB is obtained by simulation analysis, and then verified and analyzed using the experimental results to describe the dynamic characteristics of the stack voltage more accurately during charging of ZNBs.
2. Materials and Methods
2.1. The Working Principle of a ZNB
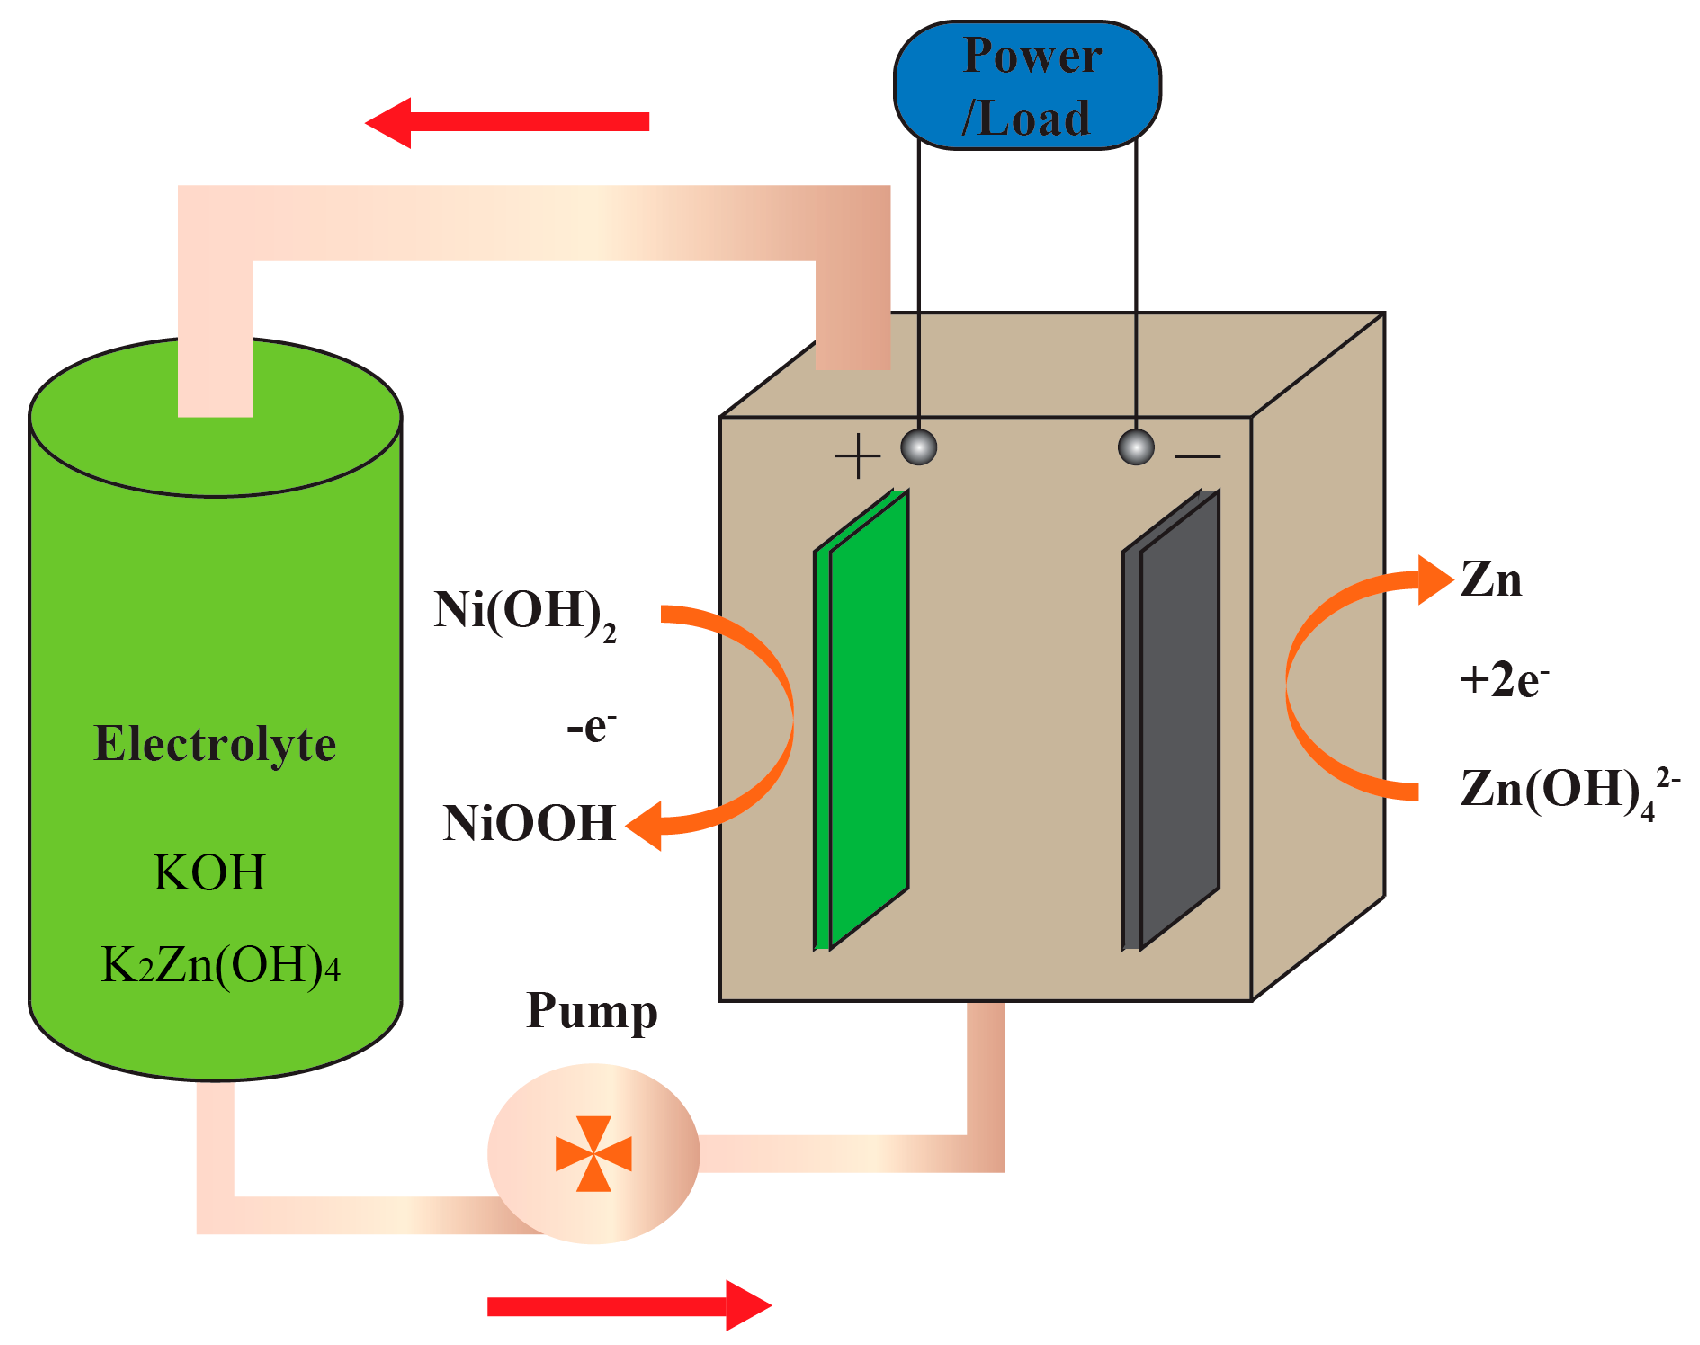
Figure 1 shows the schematic diagram of a zinc nickel single-flow battery. The main components are storage tanks, stacks, pumps, and flow plate. A zinc nickel single-flow battery uses nickel oxide for the positive electrode, an inert metal collector as the negative electrode, and a highly concentrated zinc acid alkaline solution as the electrolyte. The electrolyte flows through the stack during charge and discharge by pump circulation, and the positive battery reaction is completed in the solid phase. The negative reaction is the surface deposition/dissolution reaction. The electrode chemical reactions are as follows:
Positive electrode:
Negative electrode:
Total Reactions:
The stack is the core of the battery, and for the work reported in this paper, we used a ZNB with 1.6 V/300 Ah as the research object. The electrolyte flows through the plate from bottom-to-top in laminar flow, and the flow rate is constant. The design parameters and test operating parameters of the battery are shown in Table 1.
2.2. Concentration of Active Substances in the Battery
The electrolyte in the battery runner moves in laminar flow, and in this area (the convection area) there is convective mass transfer. Only a thin layer of solution on the surface of the electrodes remains fixed, and this layer (called the diffusion area) is the main area of diffusion mass transfer. Because of the high efficiency of convective mass transfer, it is assumed that the solution concentration in the whole convection area is uniform.
During charging, positive and negative electrodes continue to consume reactive ions (hydroxide ions and zinc ion ions, respectively), while the active ions in the runner are continuously added to the electrode surface. In the electrochemical polarization and concentration polarization stages, the following material balance relationships exist [14]:
where Cin is the electrolyte concentration at the inlet of the runner, Cout is the concentration of the electrolyte at the outlet of the runner, I is the charge and discharge current, F is the Faraday constant, Q is the electrolyte flow, and z is the number of electrons transferred (−1 and 2 for OH− and Zn(OH)42−, respectively).
The zincate ion is continuously consumed during charging, in order to ensure that the electrode reaction rate and electrolyte convection are always in equilibrium, and the electrolyte flow rate should be greater than a critical value. It is assumed that the zincate ion is completely consumed, that the charge time is three hours, and that the critical flow rate is Qcr = 0.0311 L/min. Therefore, the experimental electrolyte flow rate (10 L/min) should ensure that the electrode reaction rate and electrolyte convection are always in equilibrium during charging.
Because the electrolyte volume of the runner is 5.3 L, accounting for 62% of the total volume of electrolyte (8.5 L) in one cycle, the ion concentration should have been fully mixed. Therefore, when the current is constant, regardless of battery side reactions, the change of the ion concentration in the runner after one circulation of the electrolyte can be approximated by Equation (5):
where Ct is the concentration of the active substance in the runner after the electrolyte circulates once; C0 is the initial concentration of the active substance in each circulation in the runner; V is the volume of the electrolyte; and ∆t is the time for one electrolyte cycle.
According to Equation (5), the curves of the changing ion concentrations in relation to charge time can be obtained as shown in Figure 2 (assuming a 100% current efficiency during charging).
As shown in Figure 2, in the state of laminar flow, the concentration of hydroxide ions in the runner of the ZNB increases linearly during charging (without considering side reactions), and the hydroxide ion concentration is about 9.8 mol/L at the end of charging. In contrast, the concentration of zincate ion in the runner decreases linearly during charging; so the concentration of zincate ion is about 0.34 mol/L at the end of charging.
2.3. Over-Potential and Equilibrium-Potential of the Positive Electrode
When simulating the charge process of the nickel oxide electrode, mainly the reaction rate in Equation (1) is considered, and in this paper, we do not consider the side reactions of the battery. The concentration affecting the reaction rate in the nickel oxide electrode mainly includes the concentration of the liquid hydroxide, the concentration of nickel hydroxide, and the concentration of nickel oxyhydroxide on the solid phase surface. When charging, the electrochemical reaction occurs at the solid/electrolyte interface inside the electrode. The protons in the solid phase react with the hydroxide ions in the electrolyte phase to generate H2O; at the same time, the nickel hydroxide is converted into nickel oxyhydroxide, and the electrons produced by the reaction are transmitted to the metal base of the electrode. Thus, the concentration of nickel hydroxide and the concentration of nickel oxyhydroxide can be expressed by the solid-phase proton concentration. The electrochemical reaction rate equation can be obtained by the Butler-Volmer equation, adjusted by the concentration as follows [15,16]:
where j is the surface reaction current density, α1 is the anodic transfer coefficient for the nickel reaction, is the reaction over-potential of the nickel oxide electrode, R is the ideal gas constant: 8.314 J/(mol·K), T is the Kelvin temperature: 298 K, F is the Faraday constant, and the apparent exchange current density is expressed as a function of hydroxide concentration in the electrolyte phase and proton concentration in the solid phase at the solid/electrolyte interface inside the electrode, but its functional form is different, generally expressed using the following formula:
Here, i is the exchange current density, C is the concentration of the active substance, the superscript OH represents the hydroxide ion, and H represents the proton. The subscript ref represents to the reference state, se represents the solid-liquid contact surface, and max represents the maximum value. Here, the reference proton concentration in the nickel oxide electrode is assumed to be 0.5 times the maximum concentration of proton, as shown below:
The maximum concentration of protons can be calculated by ρavg/MNi(OH)2 [17], where the average density of active material ρavg = 3.55 g/cm3 [18], MNi(OH)2 represents the relative molecular mass of Ni(OH)2, and Ni(OH)2 is a proton conducting solid electrolyte. The proton concentration in the nickel oxide electrode is related to the state of charge of the positive electrode, which can be calculated by the following formula [14]:
where θ is the state of charge of the positive electrode.
Normally, the state of charge (SOC) of a fully-charged battery cannot reach 1. The so-called 100% SOC is usually 95%, 98%, etc. It needs to be determined by non-electrochemical analysis methods, such as energy spectrum, titration, etc. For a zinc nickel single-flow battery with 300 Ah, the state of charge of the positive electrode is 82% when full charged (assuming 100% coulomb efficiency).
where ase is the specific electroactive surface area, and Vtotal is the total volume of positive electrode, Vtotal = 831.15 cm3.
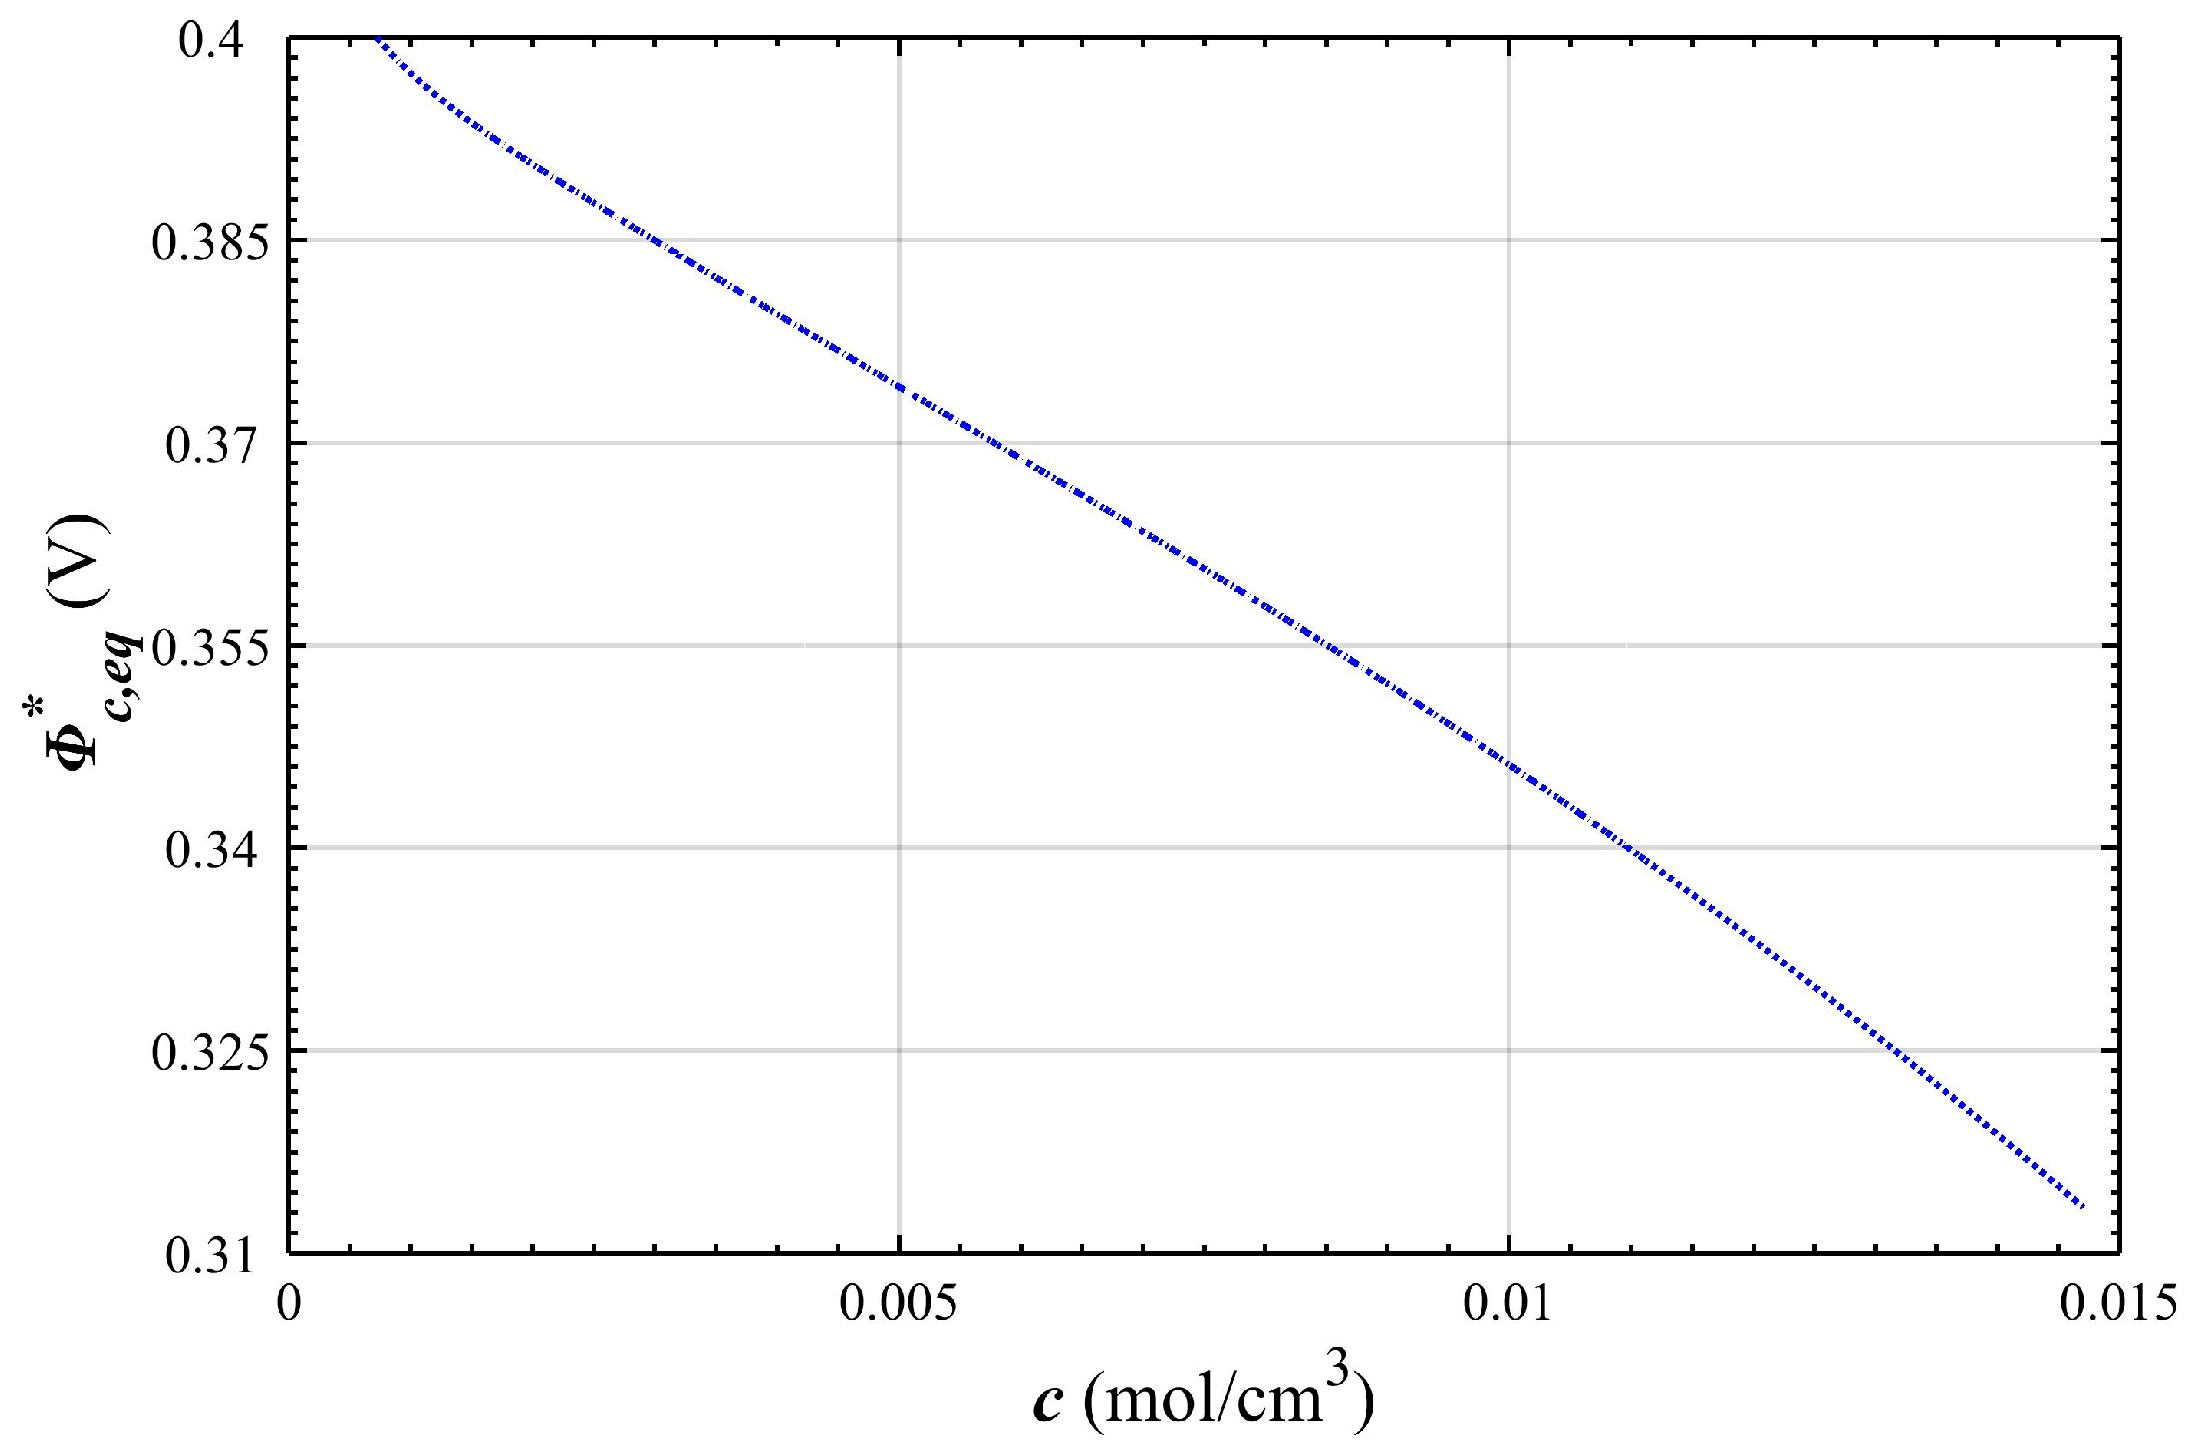
The reference electrode potential used in the reaction rate is the equilibrium electrode potential of the nickel oxide electrode. The mixing potential of the nickel oxide electrode of the ZNB is close to the reaction equilibrium potential of Ni(OH)2/NiOOH, for which the changes are more complex. Due to the production process, and the doping composition and content of nickel oxide electrodes are different, the equilibrium potential of nickel oxide electrodes varies widely [19,20]. Mao et al. [17] gave the equilibrium potential for a NiOOH electrode, as shown the following:
where c represents the concentration of potassium hydroxide, is the molar activity coefficient of electrolyte, which can be calculated by the following formula [17]:
If the value of c ranges from 7.0 × 10⁻⁴ to 14.7 × 10⁻³ mol/cm3 [21], the equilibrium potential curve of NiOOH electrode, as shown in Figure 3, can be obtained.
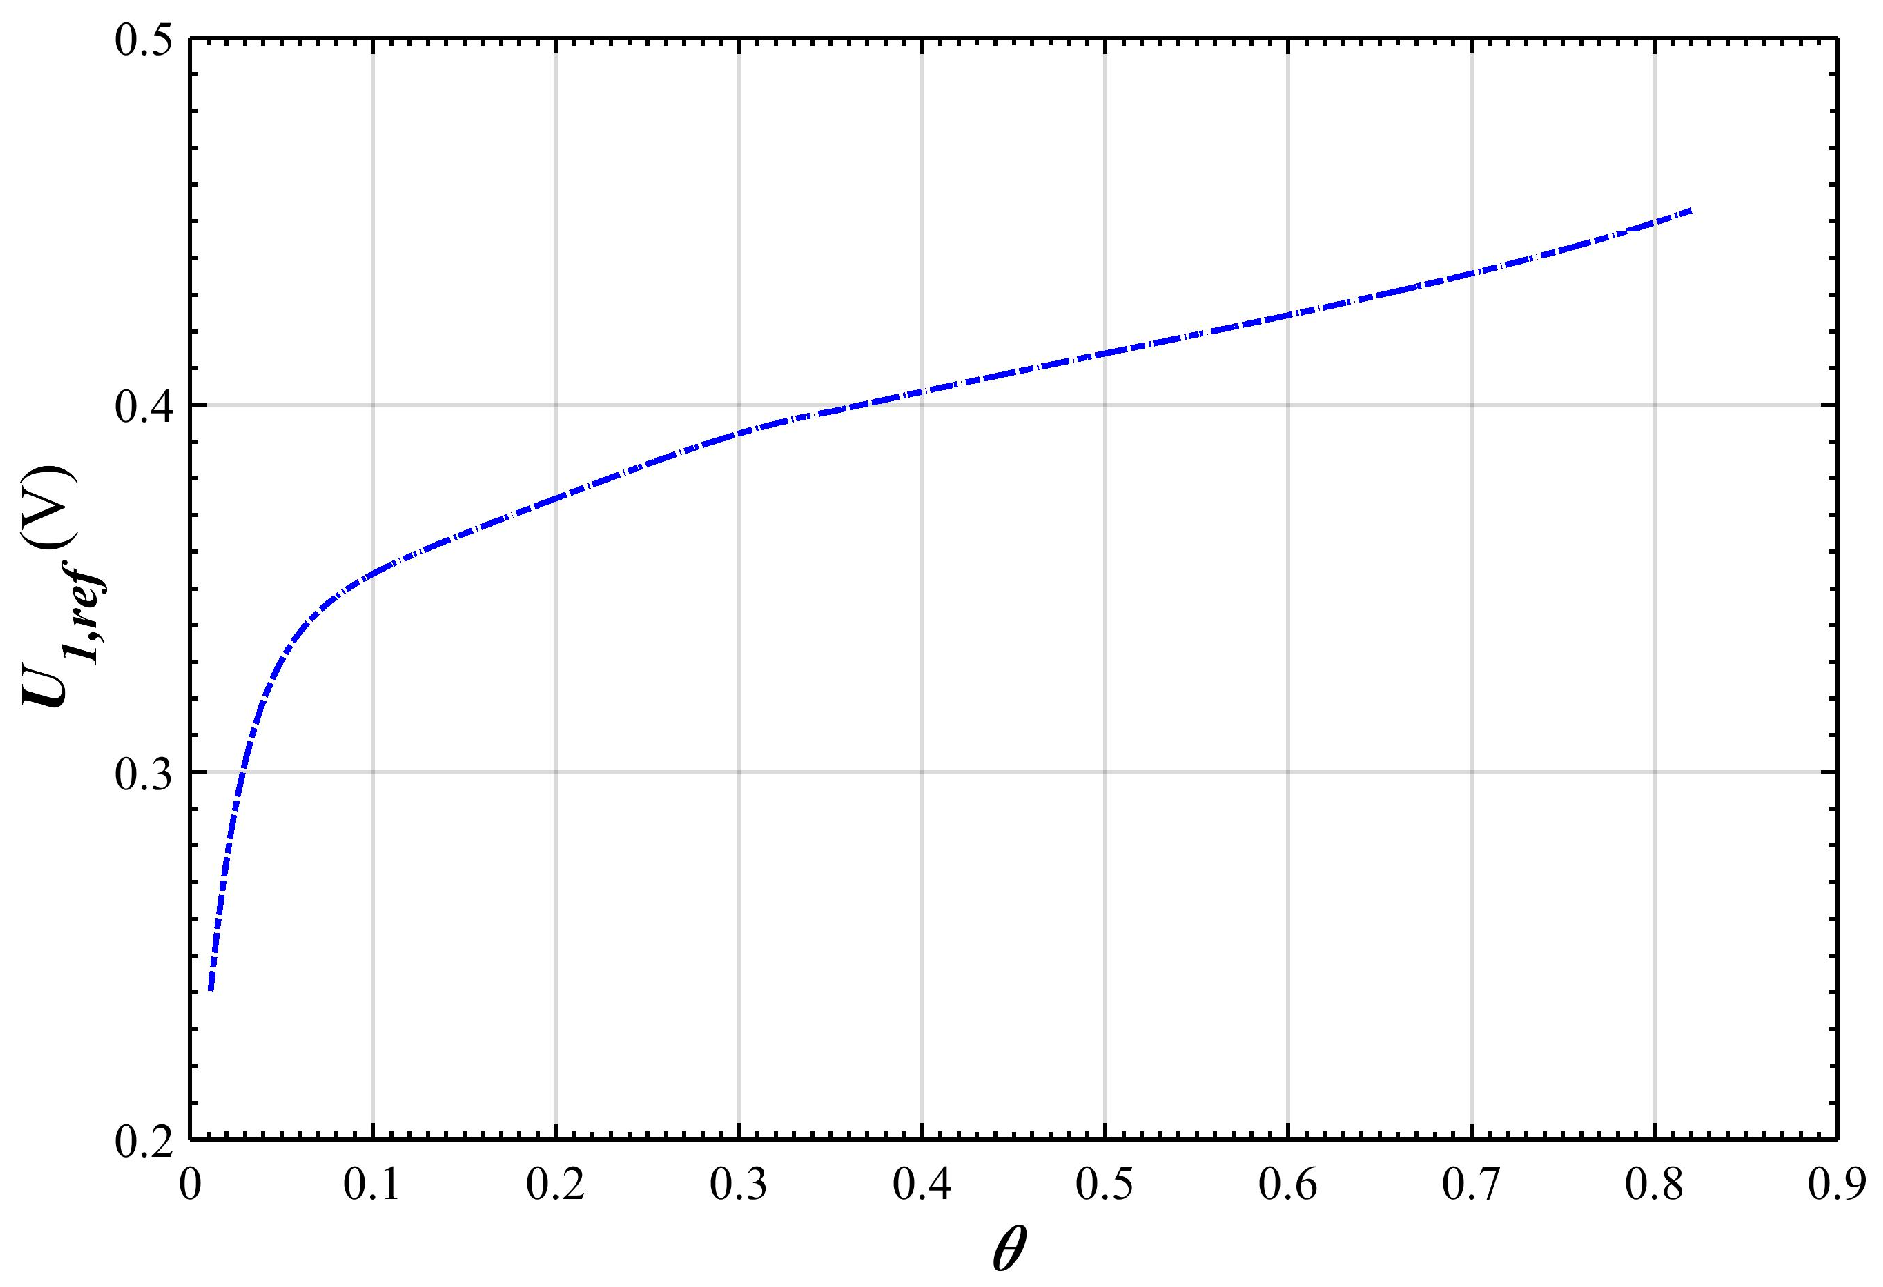
From the positive half reaction, it can be known that the concentration of potassium hydroxide decreases during charge. Thus, the equilibrium potential of nickel oxide electrode is basically linearly increasing. However, for the equilibrium potential of nickel oxide electrode of ZNB, there is a rapid increase at the initial stage of charging (see Figure 4), so the Equation (11) no longer applies to the equilibrium potential of nickel oxide electrode of ZNB. Therefore, it is necessary to use another equilibrium potential model, due to the different material system of nickel oxide electrode of ZNB and the different trends of equilibrium potential at the initial stage of charging. Here, we first test the equilibrium potential of nickel oxide electrodes, and then piecewise fitting is used to obtain a more accurate equation of equilibrium potential, as shown below:
2.4. Over-Potential and Equilibrium-Potential of the Negative Electrode
The current density of surface reaction of the negative electrode can be calculated according to the Buttler-Volume equation [22]:
where iZn,ref represents the reference exchange current density of zinc reaction, represents the anodic transfer coefficient for the zinc reaction, and represents the reaction over-potential of the zinc electrode. Here, jZn can be calculated by the following formula:
where Stotal is the total effective reaction area of negative electrode, Stotal = 13,852.44 cm2.
According to the Nernst equation of the electrode-equilibrium potential, the equilibrium-potential equation of a negative ZNB electrode can be expressed as:
The simulation parameters used in calculating the over-potential and equilibrium-potential of positive and negative electrodes are shown in Table 2.
2.5. Battery Stack Voltage
While charging, the stack voltage of a battery is determined by the over-potential and equilibrium-potential of the positive and negative electrode. Because the over-potential calculated by Equations (6), (7), and (14) does not take into account the over-potential generated by the ohmic polarization, the stack voltage can better be calculated using the following formula:
where Ustack is the battery stack voltage and Req is the equivalent ohmic resistance of the battery during charge. Here, Req = 2.9 mΩ.
Here, the current density is constant value due to the condition of 100 A constant-current charging, thus the variables in Equations (6) and (14) are the over-potential and , and jNi and jZn need to be calculate through Equations (10) and (15) firstly.
3. Results and Discussion
Simulation Results and Analysis
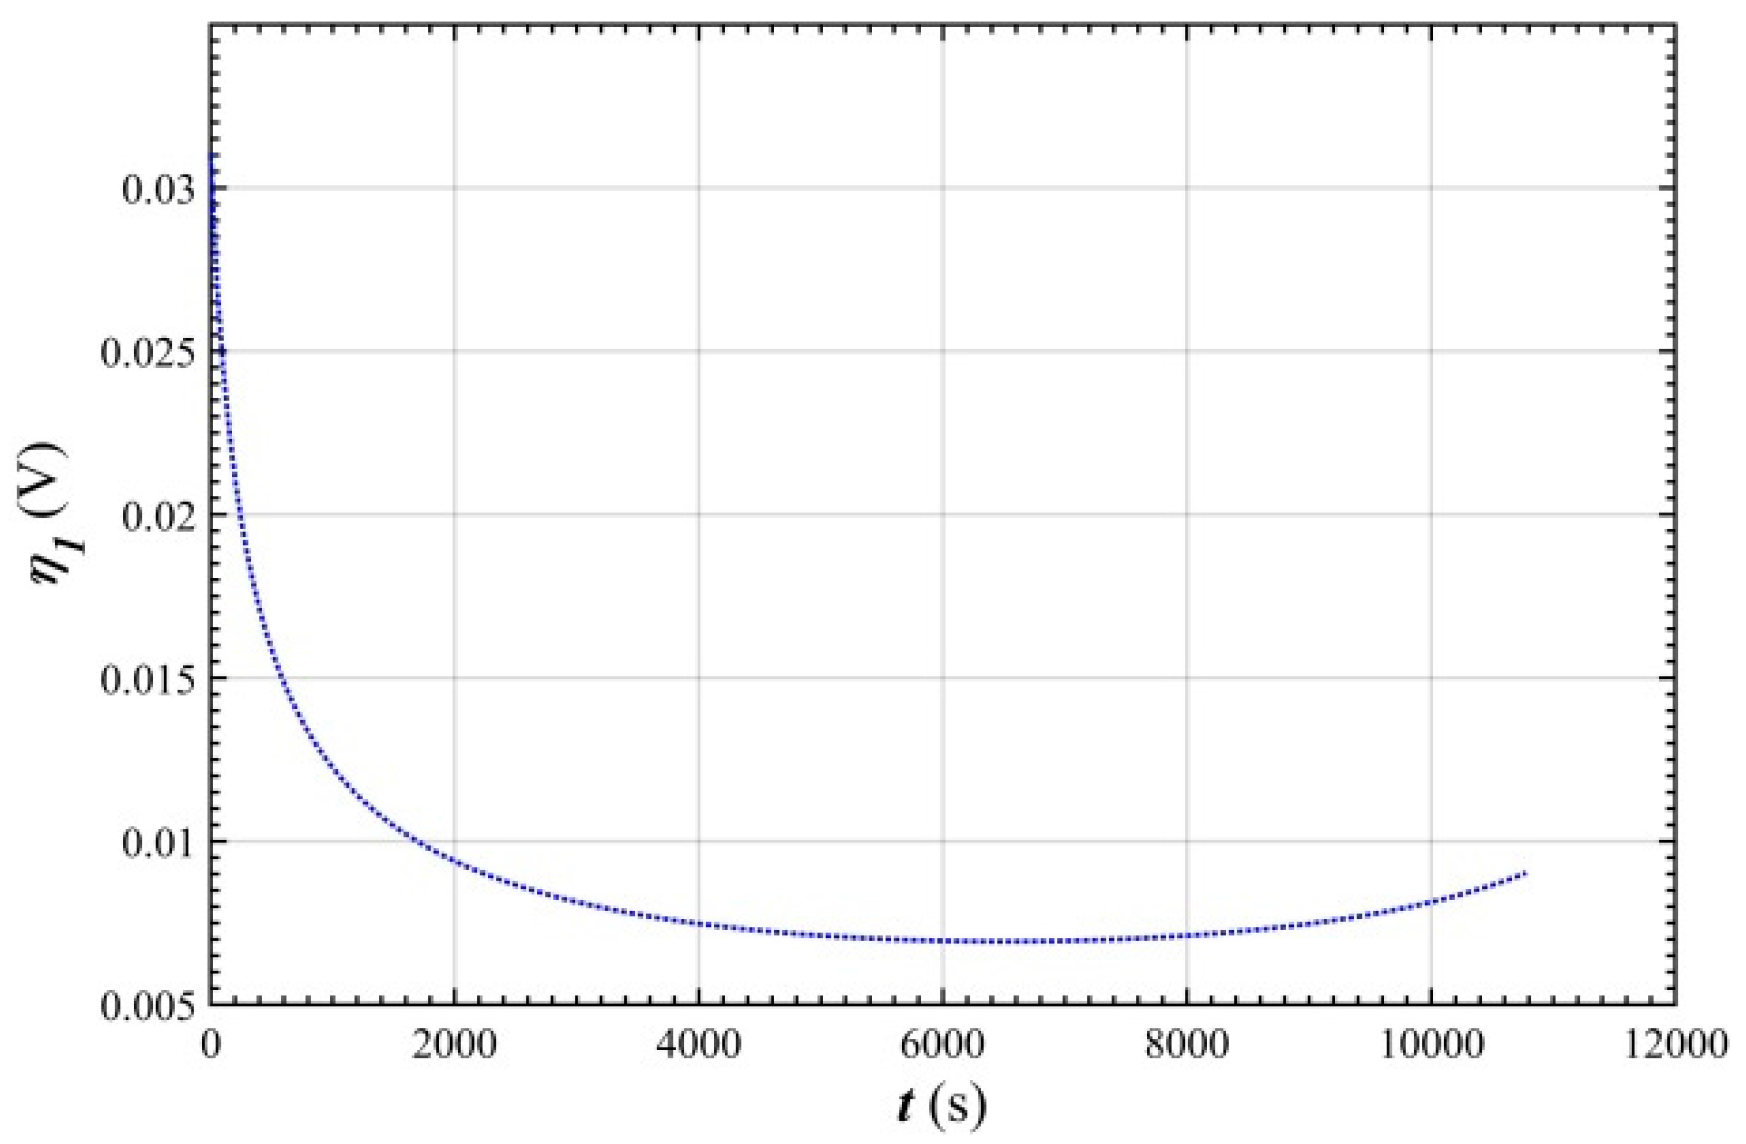
Based on the above theory, under conditions of 100 A constant-current charging, constant electrolyte flow rate, and uniform ion concentration in the runner; the equilibrium-potential, over-potential and stack voltage of a zinc nickel single-flow battery was simulated by programming. Several results were obtained by comparative analysis with the experimental values, and the initial conditions and calculation parameters of the simulation are shown in Table 2. Figure 5 corresponds to the curve of changes in the over-potential of the positive electrode over time during charging. Figure 6 and Figure 7 correspond to the curves of over-potential and equilibrium-potential, respectively, during change of the negative electrode over time while charging. Figure 8 and Figure 9 present the compared curves of the simulation values, the experimental values of the stack voltage, and the relative error curve of the simulated value of the stack voltage during charging.
As shown in Figure 5, the over-potential of the positive electrode is rapidly reduced from 0.03 V to 0.01 V, and then stabilizes near 0.007 V during charging. This is because the proton concentration at the positive electrode surface is constantly reduced at the initial stage of charging, and thus it is necessary to keep the current constant by increasing the potential of the nickel oxide electrode. In addition, due to the continuous conversion of Ni(OH)2 to NiOOH during charging, and to the different diffusion rate of the protons in Ni(OH)2 and NiOOH (the protons in NiOOH diffuse much faster than those in Ni(OH)2); the performance of the nickel oxide electrode is poor at the beginning of charging, resulting in a larger over-potential of the electrode, after which the performance of the nickel oxide electrode improves due to the increasing amount of NiOOH.
As shown in Figure 6, the over-potential of the negative electrode of the zinc nickel single-flow battery increases linearly from 1.9 mV to 4 mV during charging. The cause of the change in over-potential of the negative electrode is that the amount of zinc ions at the surface of the zinc electrode continues to diminish.
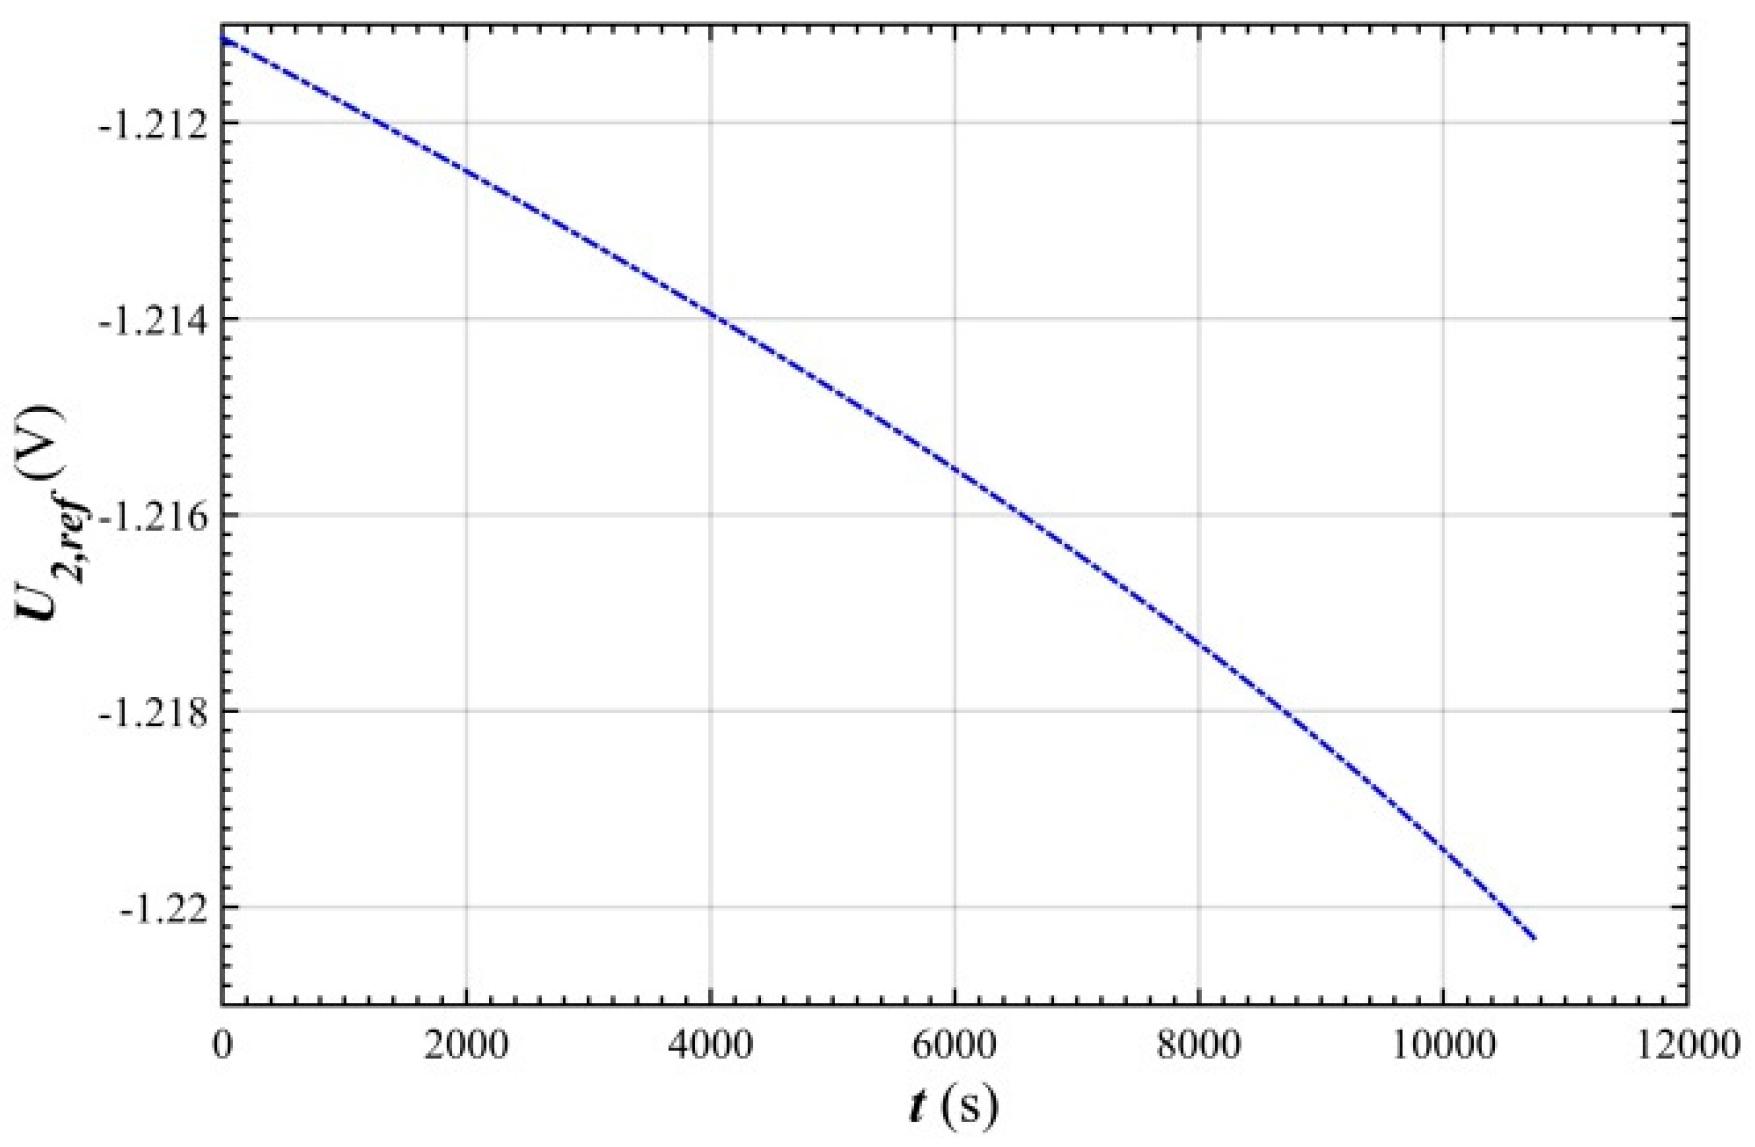
As shown in Figure 7, the equilibrium potential of the negative electrode during the process of charging the ZNB increases gradually with time under the constant-current charging condition of 100 A. The change gets faster and faster (from −1.21 V to −1.22 V), which is due to the increase in the concentration of zincate ions and increase in the concentration of hydroxide ions (see Figure 2) during charging. Both of these cause the electrode equilibrium potential to change in a negative direction. However, due to the different diffusion coefficients of zincate and hydroxide ions, the concentration gradient of zincate ions on the surface of the electrode is different from that of hydroxide ions, and their concentrations on the electrode surfaces are also different. The concentration gradient of zincate ions is slightly steeper, so the concentration of zincate ion on the electrode surface decreases much less than the bulk concentration does, and the concentration of hydroxide ion increases less than the bulk concentration does. In addition, because the initial concentration (1 mol/L) of zincate ions is much lower than the initial concentration (8.5 mol/L) of the hydroxide ions, the zincate ion concentration varies greatly with respect to the initial concentration, and its contribution value is also larger.
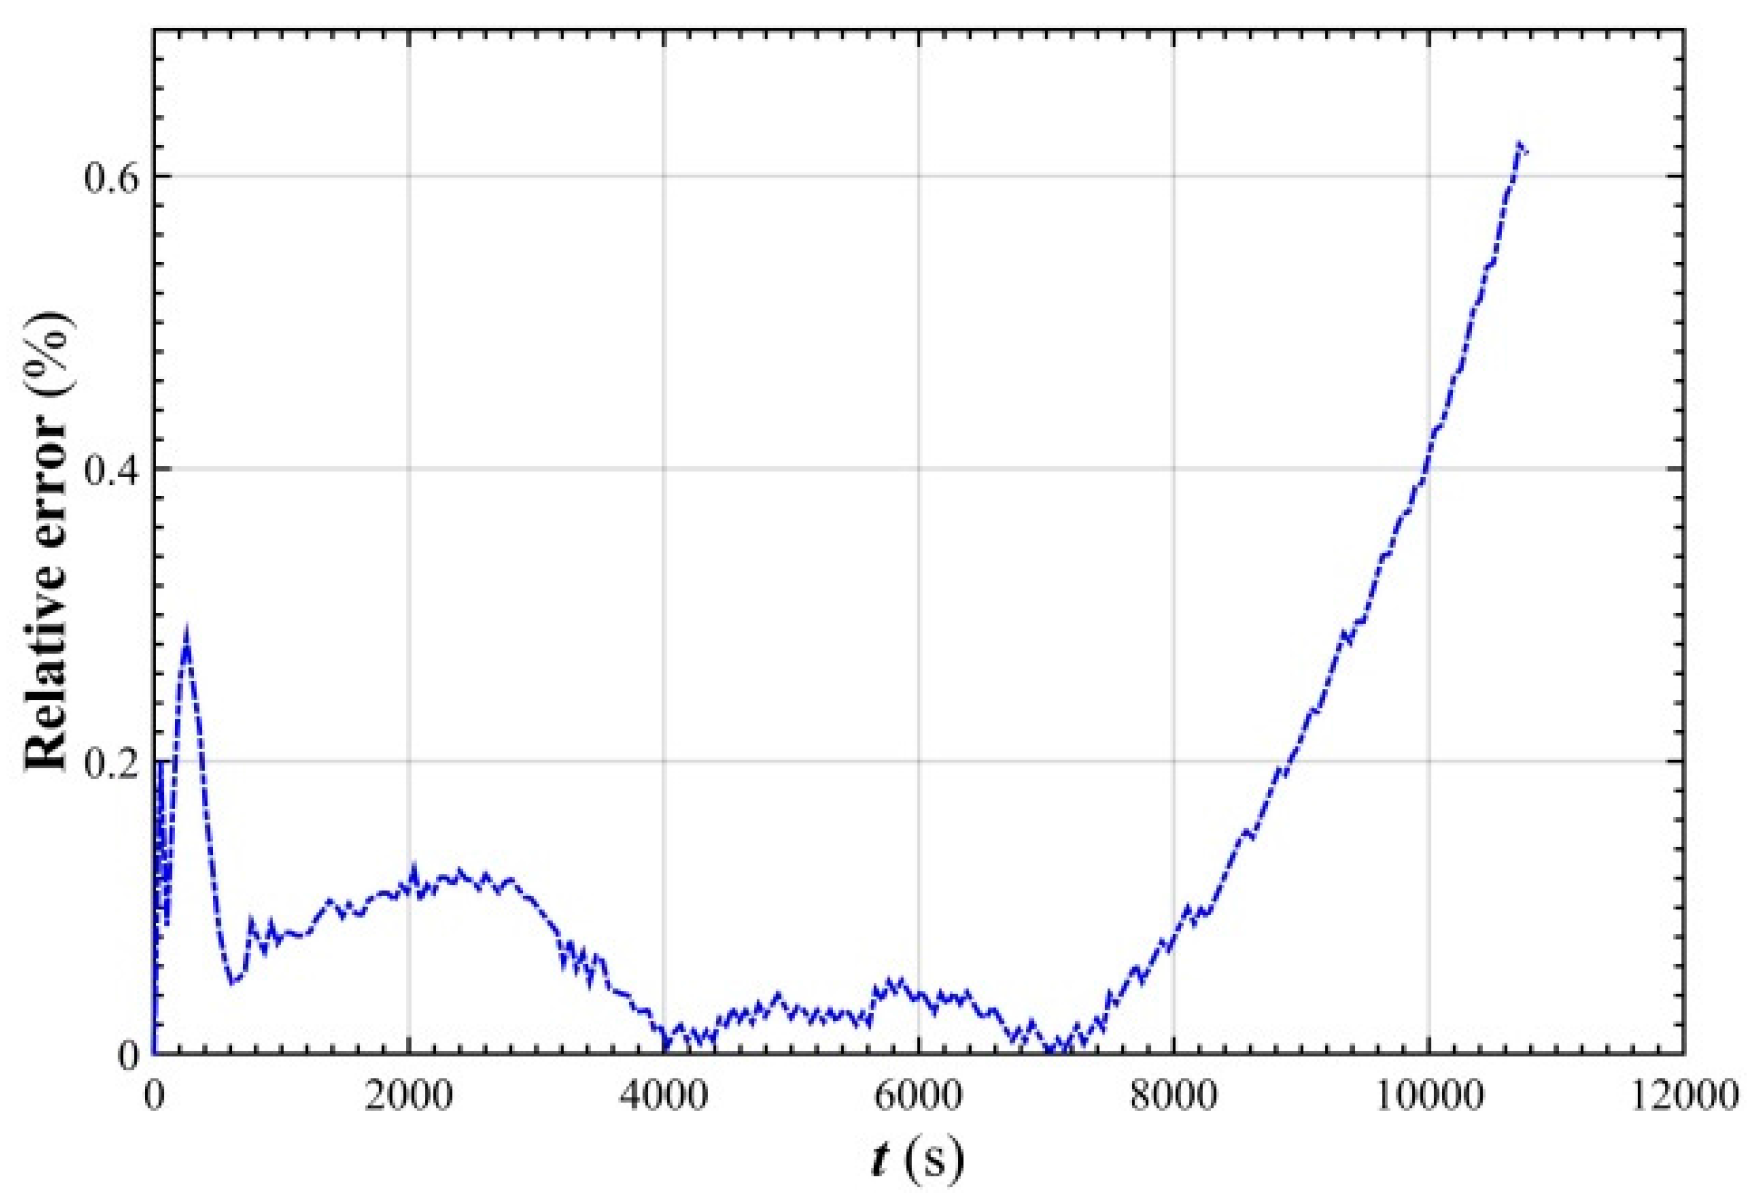
It can be seen from Figure 8 that the simulated value of the stack voltage in the charging process of the ZNB is in good agreement with the experimental value, and that the calculated value deviates from the experimental value at the beginning and the end of the simulation (see Figure 9). The beginning stage error of the simulation is mainly due to the fact that the initial state of the simulation is different from the starting state of the experimental battery, and thus, the calculated value is higher than the experimental value at the end of the simulation. This is possibly due to the fact that the state of charge of the positive electrode when fully charged (82%) is calculated according to the lowest specific capacity of the positive-electrode factory requirements. The actual specific capacity is slightly higher, so 82% is higher. In addition, it is also possible that the nickel electrode concentration is higher than the calibration capacity of the electrode, and when the solid-phase proton concentration is low, some NiOOH is oxidized to NiO2 to increase the actual capacity of the electrode. As shown in Figure 9, the simulated relative error of the stack voltage of ZNB is restricted to <0.62% during charging. At the end of charging, the relative error of the stack voltage continues to increase, until the maximum relative error reaches 0.62%. In summary, the mathematical model of the stack voltage established in this paper can accurately characterize the dynamic characteristics of the stack voltage of a ZNB during charging.
4. Conclusions
In the work reported in this paper, the change of the ion concentration in the convection area and the electrode surface of the flow channel, and the change of the over-potential and the equilibrium-potential of the electrode with charge time were studied, on the basis of which the mathematical model of the stack voltage influenced by the internal parameters of the battery was established. Through simulation analysis and comparison with an experimental curve, the correctness of the model was verified, and the following conclusions obtained.
- The simulated relative error of the stack voltage was kept below 0.62% of the ZNB under the 100 A charging condition, which indicates that the established stack voltage model accurately characterized the dynamic characteristics of the ZNB stack voltage during charging.
- In the stable charging stage, the over-potential of the positive electrode was rapidly reduced from 0.03 V to 0.01 V, and then stabilized at 0.007 V. This was mainly because the charge transfer rate of the electrode is lower than the mass transfer rate before charging stabilizes.
- In the stable charging stage, the over-potential of negative electrode tended to increase linearly from 1.9 mV to 4 mV, indicating that the polarization of the negative electrode gradually increased with the charging process, and that its change was very small with respect to the over-potential of the positive electrode.
Acknowledgments
We gratefully acknowledge the financial support of the National High Technology Research and Development Program of China (2012AA052003).
Author Contributions
Shouguang Yao conceived and designed the experiments; Wenwen Cai performed the experiments; Peng Liao analyzed the data; Jie Cheng contributed reagents/materials/analysis tools; Min Xiao wrote the paper.
Conflicts of Interest
The authors declare no conflict of interest. The founding sponsors had no role in the design of the study; in the collection, analyses, or interpretation of data; in the writing of the manuscript, and in the decision to publish the results.
References
- Cho, J.; Jeong, S.; Kim, Y. Commercial and research battery technologies for electrical energy storage applications. Prog. Energy Combust. 2015, 48, 84–101. [Google Scholar] [CrossRef]
- Skyllas-Kazacos, M.; Chakrabarti, M.H.; Hajimolana, S.A.; Mjalli, F.S.; Saleem, M. Progress in flow battery research and development. J. Electrochem. Soc. 2011, 158, R55. [Google Scholar] [CrossRef]
- Cheng, J.; Zhang, L.; Yang, Y.-S.; Wen, Y.-H.; Cao, G.-P.; Wang, X.-D. Preliminary study of single flow zinc-nickel battery. Electrochem. Commun. 2007, 9, 2639–2642. [Google Scholar] [CrossRef]
- Wen, Y.; Cheng, J.; Zhang, L.; Yan, X.; Yang, Y. The inhibition of the spongy electrocrystallization of zinc from doped flowing alkaline zincate solutions. J. Power Sources 2009, 193, 890–894. [Google Scholar] [CrossRef]
- Gu, W.B.; Wang, G.Q.; Wang, C.Y. Modeling the overcharge process of VRLA batteries. J. Power Sources 2002, 108, 174–184. [Google Scholar] [CrossRef]
- Wang, C.Y.; Srinivasan, V. Computational battery dynamics (CBD)—Electrochemical/thermal coupled modeling and multi-scale modeling. J. Power Sources 2002, 110, 364–376. [Google Scholar] [CrossRef]
- Al-Fetlawi, H.; Shah, A.A.; Walsh, F.C. Modelling the effects of oxygen evolution in the all-vanadium redox flow battery. Electrochim. Acta 2010, 55, 3192–3205. [Google Scholar] [CrossRef]
- Shah, A.A.; Al-Fetlawi, H.; Walsh, F.C. Dynamic modelling of hydrogen evolution effects in the all-vanadium redox flow battery. Electrochim. Acta 2010, 55, 1125–1139. [Google Scholar] [CrossRef]
- Xiao, M.; Wang, Y.; Yao, S.; Song, Y.; Cheng, J.; He, K. Analysis of internal reaction and mass transfer of zinc-nickel single flow battery. J. Renew. Sustain. Energy 2016, 8, 064102. [Google Scholar] [CrossRef]
- Yao, S.; Liao, P.; Xiao, M.; Cheng, J.; He, K. Modeling and simulation of the zinc-nickel single flow batteries based on MATLAB/Simulink. AIP Adv. 2016, 6, 125302. [Google Scholar] [CrossRef]
- Cheng, Y.; Zhang, H.; Lai, Q.; Li, X.; Shi, D. Performance gains in single flow zinc–nickel batteries through novel cell configuration. Electrochim. Acta 2013, 105, 618–621. [Google Scholar] [CrossRef]
- Cheng, Y.; Zhang, H.; Lai, Q.; Li, X.; Shi, D.; Zhang, L. A high power density single flow zinc–nickel battery with three-dimensional porous negative electrode. J. Power Sources 2013, 241, 196–202. [Google Scholar] [CrossRef]
- Cheng, Y.; Zhang, H.; Lai, Q.; Li, X.; Zheng, Q.; Xi, X.; Ding, C. Effect of temperature on the performances and in situ polarization analysis of zinc–nickel single flow batteries. J. Power Sources 2014, 249, 435–439. [Google Scholar] [CrossRef]
- Zhou, H.; Zhang, H.; Zhao, P.; Yi, B. A comparative study of carbon felt and activated carbon based electrodes for sodium polysulfide/bromine redox flow battery. Electrochim. Acta 2006, 51, 6304–6312. [Google Scholar] [CrossRef]
- Fan, D.; White, R.E. A mathematical model of a sealed nickel-cadmium battery. J. Electrochem. Soc. 1991, 138, 17–25. [Google Scholar] [CrossRef]
- Mao, Z.; White, R.E. A mathematical model of the self-discharge of a Ni-H2 battery. J. Electrochem. Soc. 1991, 138, 3354–3361. [Google Scholar] [CrossRef]
- Mao, Z.; Vidts, P.D.; White, R.E. Theoretical analysis of the discharge performance of a NiOOH/H2 cell. J. Electrochem. Soc. 1994, 141, 54–64. [Google Scholar] [CrossRef]
- Paxton, B.; Newman, J. Modeling of nickel/metal hydride batteries. J. Electrochem. Soc. 1997, 144, 3818–3831. [Google Scholar] [CrossRef]
- Srinivasan, V.; Weidner, J.W.; White, R.E. Mathematical models of the nickel hydroxide active material. J. Solid State Eletrochem. 2000, 4, 367–382. [Google Scholar] [CrossRef]
- Pan, Y.H.; Srinivasan, V.; Wang, C.Y. An experimental and modeling study of isothermal charge/discharge behavior of commercial Ni-MH cells. J. Power Sources 2002, 112, 298–306. [Google Scholar] [CrossRef]
- Bourgault, P.L.; Conway, B.E. The electrochemical behavior of the nickel oxide electrode Part II: Quasi-equilibrium behavior. Can. J. Chem. 1960, 38, 1557–1575. [Google Scholar] [CrossRef]
- Mao, Z.; White, R.E. Mathematical modeling of a primary zinc/air battery. J. Electrochem. Soc. 1992, 139, 1105–1114. [Google Scholar] [CrossRef]
- Liu, X.; Xie, Z.; Cheng, J.; Zhao, P.; Gu, W. Mathematical modeling of the nickel electrode for the single flow zinc-nickel battery. In Proceedings of the World Non-Grid-Connected Wind Power and Energy Conference, Nanjing, China, 24–26 September 2009. [Google Scholar]
Figure 1.
Working principle diagram of ZNB.

Figure 2.
Ion concentration curves of convection area of battery runner during charge.
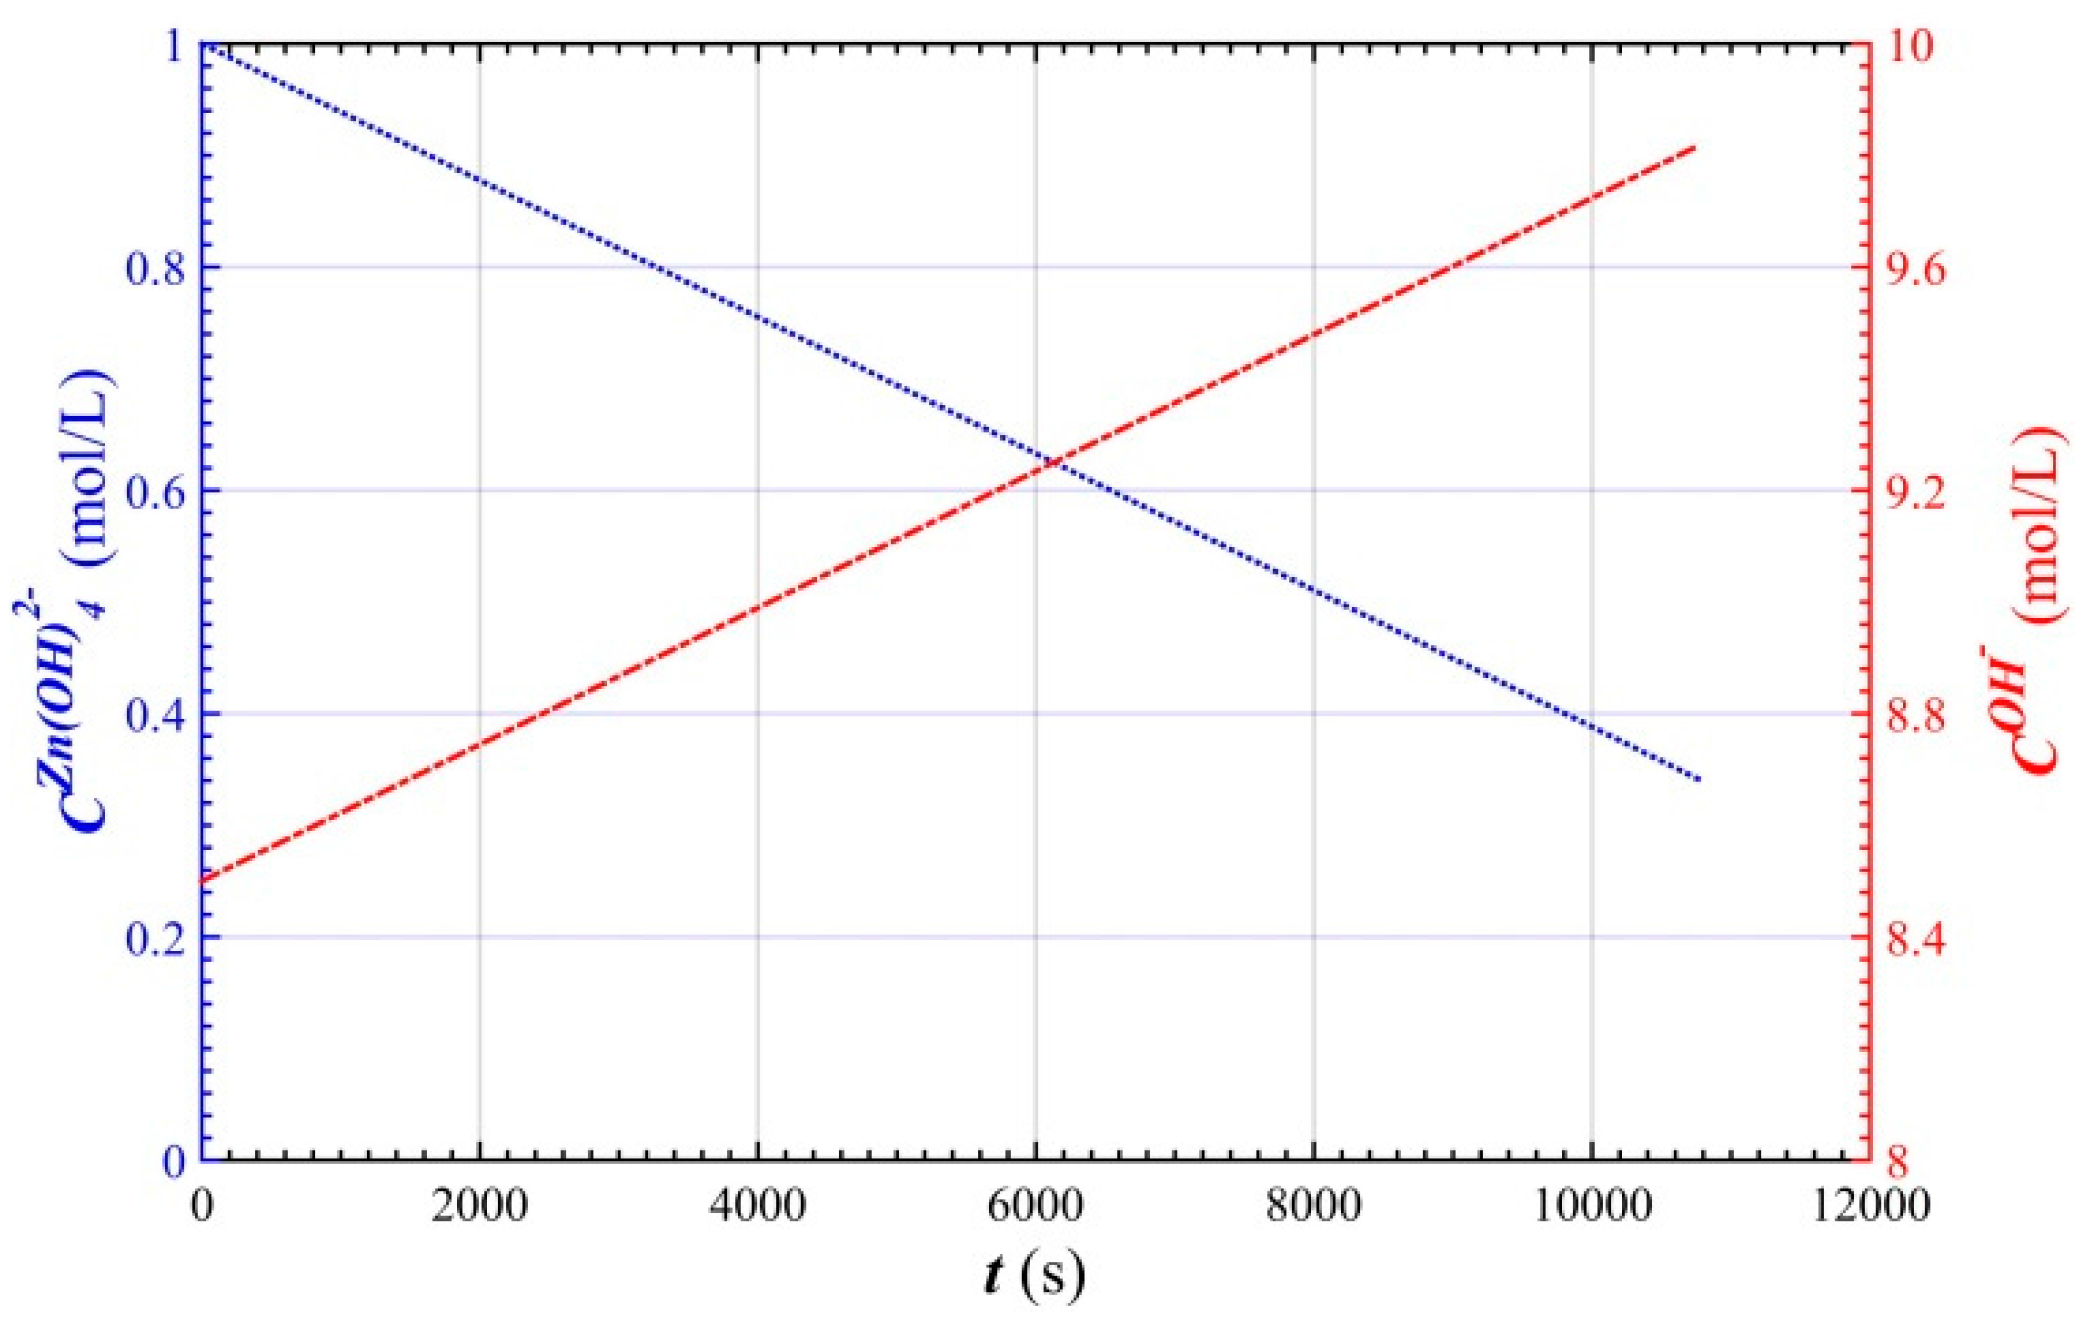
Figure 3.
Equilibrium potential of NiOOH electrode.

Figure 4.
Equilibrium potential of positive electrode changing over time.

Figure 5.
Over-potential of positive electrode changing over time.

Figure 6.
Over-potential of negative electrode changing over time.
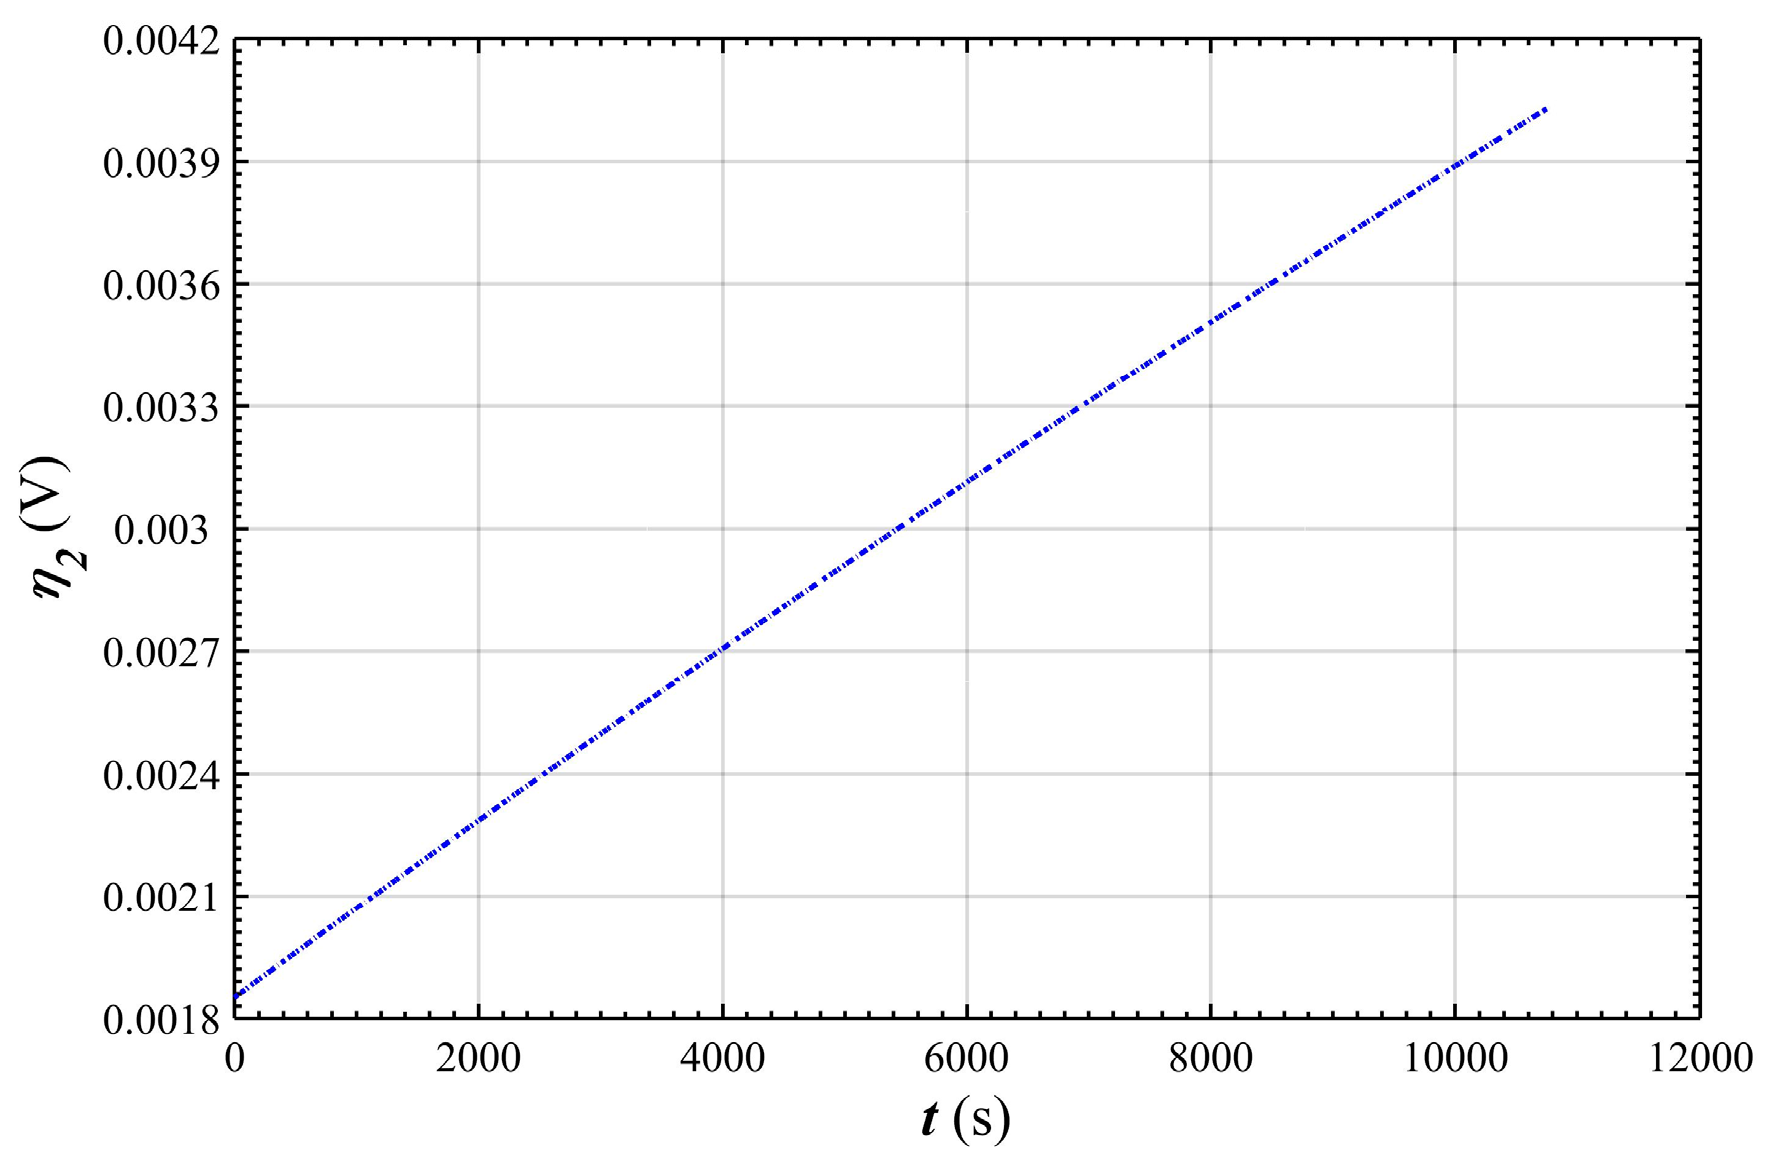
Figure 7.
Equilibrium potential of negative electrode changing over time.

Figure 8.
Comparison curves between simulation value and experimental value of stack voltage.
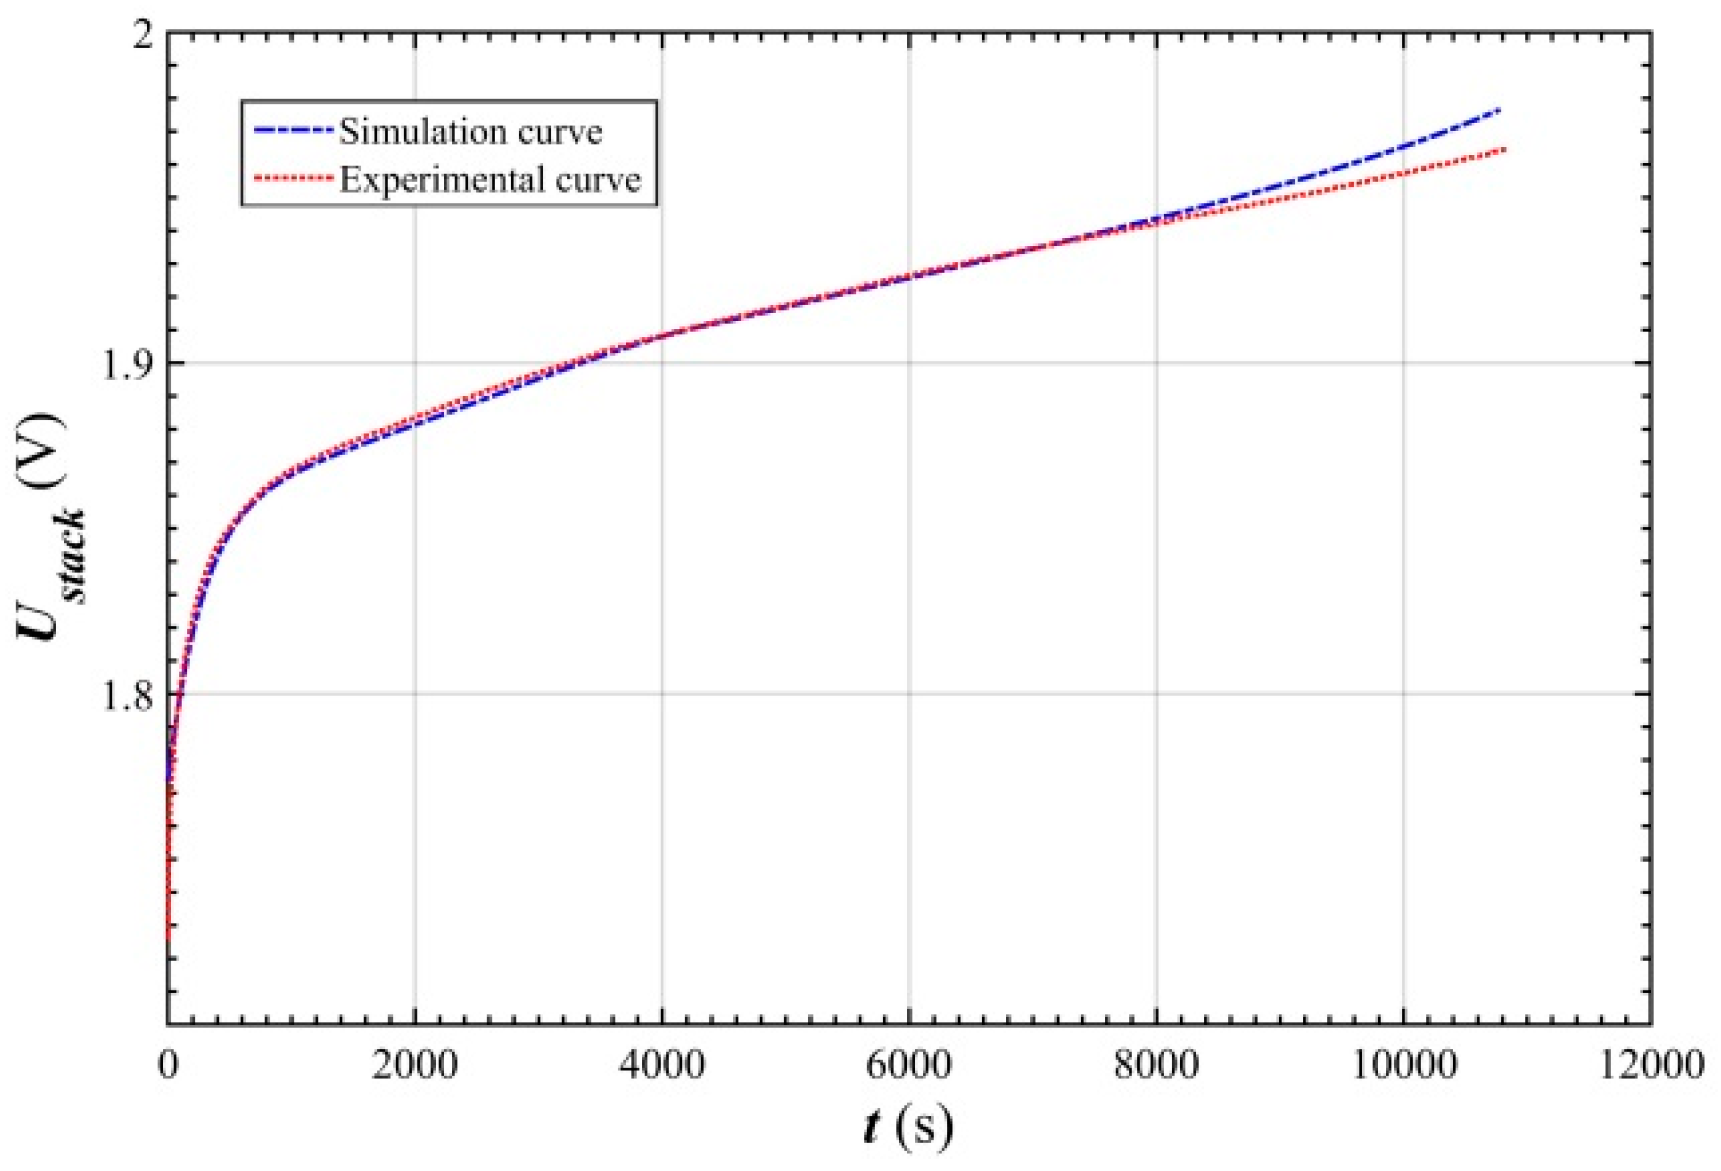
Figure 9.
Simulation relative error curve of stack voltage.

Table 1.
Battery ion concentration calculation parameters.
| Parameter | Symbol | Value |
|---|---|---|
| Current | I | 100 A |
| Faraday constant | F | 96,485 C/mol |
| Effective mass transfer area | A | 3 dm2 |
| Total volume of electrolyte | V | 8.5 L |
| Volume of the runner | V | 5.3 L |
| Flow rate | Q | 10 L/s |
| Initial concentration of hydroxide ions | 8.5 mol/L | |
| Initial concentration of zincate ions | 1 mol/L |
Table 2.
Battery potential calculation parameters.
| Electrode | Parameter | Value | Unit | Source | |
|---|---|---|---|---|---|
| Positive electrode | ase | Specific electroactive surface area | 3864 | cm2/cm3 | [23] |
| iNi,ref | Reference exchange current density of nickel reaction | 1.04 × 10⁻⁴ | A/cm2 | [23] | |
| Anodic transfer coefficient for the nickel reaction | 0.5 | [23] | |||
| Maximum concentration of proton | 35.3 | mol/dm3 | ρavg/ | ||
| Reference concentration of hydroxide ion | 7 | mol/dm3 | [23] | ||
| Negative electrode | iZn,ref | Reference exchange current density of zinc reaction | 0.03 | A/cm2 | chosen |
| Anodic transfer coefficient for the zinc reaction | 0.5 | - | chosen | ||
| Reference concentration of Zn(OH)42− | 0.5 | mol/dm3 | chosen | ||
| U0 | Initial equilibrium potential of negative electrode | −1.215 | V | [3] | |
© 2017 by the authors. Licensee MDPI, Basel, Switzerland. This article is an open access article distributed under the terms and conditions of the Creative Commons Attribution (CC BY) license (http://creativecommons.org/licenses/by/4.0/).
Share and Cite
MDPI and ACS Style
Yao, S.; Liao, P.; Xiao, M.; Cheng, J.; Cai, W. Study on Electrode Potential of Zinc Nickel Single-Flow Battery during Charge. Energies 2017, 10, 1101. https://doi.org/10.3390/en10081101
AMA Style
Yao S, Liao P, Xiao M, Cheng J, Cai W. Study on Electrode Potential of Zinc Nickel Single-Flow Battery during Charge. Energies. 2017; 10(8):1101. https://doi.org/10.3390/en10081101
Chicago/Turabian StyleYao, Shouguang, Peng Liao, Min Xiao, Jie Cheng, and Wenwen Cai. 2017. "Study on Electrode Potential of Zinc Nickel Single-Flow Battery during Charge" Energies 10, no. 8: 1101. https://doi.org/10.3390/en10081101
Note that from the first issue of 2016, this journal uses article numbers instead of page numbers. See further details here.