A New Methodology for Assessing the Energy Consumption of Building Stocks


Department of Energy, Politecnico di Torino, Corso Duca degli Abruzzi 24, 10129 Torino, Italy
*
Author to whom correspondence should be addressed.
Energies 2017, 10(8), 1102; https://doi.org/10.3390/en10081102
Submission received: 23 June 2017
/
Revised: 18 July 2017
/
Accepted: 24 July 2017
/
Published: 27 July 2017
(This article belongs to the Special Issue 17th CIRIAF National Congress – Sustainable Development, Environment and Human Health Protection)
Abstract
:The refurbishment of the existing building stocks represents a great potential for energy savings. To make the refurbishment effective, proper modeling of the current energy performance is needed. In most European countries, few and low quality data on the energy performance and on the refurbishment of building stocks are revealed, which increases the risk of not getting representative results. The article presents a new methodology for an effective bottom-up energy modeling, aimed at evaluating the current energy performance of housing stocks. The model is set up according to the IEE-EPISCOPE Project (Energy Performance Indicator Tracking Schemes for the Continuous Optimisation of Refurbishment Processes in European Housing Stocks, 2013–2016), which developed a framework of reliable data and clearly stated model assumptions, as to overcome the lack of data while guaranteeing transparency. The model, applied to an Italian region, is based on statistical data and uses the building typology approach. The energy performance is calculated by means of a quasi-steady state method. A correlation between the estimated and the real energy consumption is obtained. The model allows disaggregating the residential building stock in subsets to identify the main potential for energy savings in specific contexts. Improvements of the current data availability are strongly advisable to keep the model updated.
1. Introduction
1.1. Methodologies for the Energy Performance Assessment of Building Stocks
The building sector is responsible for 40% of the total energy consumption and for a third of CO2 emissions in Europe [1]. During the past decades, European Union has been implementing a series of measures in different energy consuming sectors aiming to achieve the climate protection targets [2,3]. The Member States have applied various instruments and policies in order to comply with the EU’s directives adopted to reduce the energy consumption and the carbon gas emissions, particularly in the building sector. In this context, Directive 2010/31/EU [4] provides a general framework of the calculation methodology and the application of minimum standards for new buildings (nZEB), for building elements and technical systems in the case of new installation, replacement or improvement of existing buildings. In addition, Directive 2012/27/EU [5] identifies energy efficiency measures that Member States have to implement in order to achieve the required goals in the forthcoming years [6]. Member States are required to mobilize investments in the refurbishment of residential and commercial buildings with a view to improving the energy performance of the building stock.
The existing building stock is wide and composed, for the most part, of buildings with poor energy performance, therefore it represents a high potential for energy and environmental savings [7]. The implementation of effective energy efficiency policies can only start from the knowledge of the available technologies, their state of maturity, economic sustainability and benefits in terms of emissions, fuel consumption and costs. In addition, a deep knowledge and a proper modeling of the current energy performance of the building stock allow quantifying the really achievable energy saving potentials.
Several studies suggest various methods and procedures for the determination of the energy consumption of building stocks by means of different energy performance modeling techniques. Kavgic et al. [8] classify the models in bottom-up and top-down approaches. The bottom-up models are considered useful instruments in scenario analysis to provide the local authorities with assessments for the effectiveness of energy policies. The bottom-up models can be either statistical or building physics based methods. According to the researchers, the energy consumption of dwellings can be assessed by means of the combination of building physics and empirical data, and assumptions on the building operation. Aydinalp-Koksal and Ugursal [9] identify three models for the residential energy consumption modeling: engineering methods, neural networks and conditioned demand analysis. The engineering methods, which can be considered as building physics based methods, include a sample of representative buildings of the housing stock and the application of a model for the building energy performance assessment.
The use of reference buildings representative of a building stock is widely applied in the European countries, as presented in Mata et al. [10], Ballarini et al. [11], Dascalaki et al. [12], Patiño-Cambeiro et al. [13] and Wyrwa et al. [14]. Methodologies to define reference buildings are provided, for instance, by Brandão de Vasconcelos et al. [15] and Filogamo et al. [16]. In this regard, a harmonized building typology concept was established by the IEE-TABULA Project (Typology Approach for Building Stock Energy Assessment) with the aim to assess the energy performance of the European residential building stocks and determine the effectiveness of the energy conservation measures and the potential energy savings [17].
Some researchers used procedures and data to compare the calculated energy use with the measured energy consumption obtained from energy balances of building stocks to determine the gap between the two assessment methods. Corgnati et al. [18] compared the calculated and the actual energy consumption of a sample of schools, offices and residential buildings in the Province of Turin (Italy); the highest gap in the results is shown for the residential buildings (around 40%). Tronchin et al. [19] applied a selection of calculation models, among which a quasi-steady-state calculation method, and compared the results with the real energy consumption; they found out that the standardized energy performance is about 35% higher than the real energy consumption. In a bottom-up energy model of the building stock using archetypes, Tuominen et al. [20] discovered a gap of about 32% between the modeled estimate and the official statistics for the detached houses. Sunikka-Blank et al. [21] plotted the calculated energy performance against the measured energy consumption of 3400 houses in Germany; their analysis revealed that, when the predicted energy performance is around 300 kWh∙m−2, the real energy consumption is 40% lower, while a predicted energy performance of 150 kWh∙m−2 corresponds to 17% lower real consumption.
In most of the European countries, the available data on the energy performance and on the refurbishment state of the building stocks are few and low quality. Kavgic et al. [8] point out that one of the limits of building physics models is the lack of data for the definition of the model structure, besides the assumptions on the user behavior. The extent of the occupancy influence on the building energy performance still remains an open issue, especially if the building stock and not a single building is concerned, as also pointed out in several works [8,21,22].
The shortage and inconsistency of data characterizing existing building energy performance is particularly evident in the Italian building stock: this increases the risk of not getting representative results, despite the effort to develop trustworthy and consistent energy models. This issue is highlighted by many research works. For instance, Di Turi et al. [23] revealed the lack of data on the existing public and private buildings in the South of Italy and solved this problem by adopting simplifications (e.g., by grouping the buildings into categories with similar features); in addition, the researchers pointed out the lack of data on occupancy behavior and of reliable real energy consumption data useful to make comparisons with the estimated energy performance. Likewise, Caputo et al. [24] developed an energy assessment approach for the city of Milan, based on statistical data and simple information to overcome audits and monitoring campaigns that are usually time consuming and not applicable in the case of poor data.
In this context, a step forward has been done by the IEE-EPISCOPE project (Energy Performance Indicator Tracking Schemes for the Continuous Optimisation of Refurbishment Processes in European Housing Stocks, April 2013–March 2016), involving seventeen EU countries. The strategic objective of the project was to ensure effectiveness and transparency to the energy refurbishment processes of the European housing sector, by focusing on building typologies, building stock monitoring and scenario analyses [25]. The project was aimed at encouraging the raise of knowledge on the building stock by increasing the availability of data and by developing models for the housing stock energy performance analysis. The models were built according to a framework of parameters, which include reliable data and clearly stated model assumptions. The project was mainly addressed at the public authorities in order to promote the monitoring of the existing residential building stocks, the analysis of the actual energy consumption of buildings, the identification of the application rate of different refurbishment measures on the stock. The final aim was to sensitize the authorities towards the problem of incomplete or completely missing data on the building stock, and thus foster them to increase the data availability and reliability for the housing stock energy assessment. In this way, the energy refurbishment processes in the European housing sector can be made more transparent and effective in order to ensure that the climate protection targets foreseen by the European directives will be actually attained and the necessary improvement actions can be taken in due time.
1.2. Aims of the Work and Novelty of the Research
A methodology for modeling the residential building stock has been developed, following the guidelines of the IEE-EPISCOPE Project. The research falls under the bottom-up energy models approach applying the building physics based methods through the building typology concept. The methodology has been applied to Piedmont region, in the Northwest of Italy.
The objective is to monitor the current state of the regional residential building stock and its subsets in terms of energy performance, with the final scope to optimize the energy refurbishment processes. The work aims to provide the public authorities with an effective methodology for the housing stock energy performance assessment to be used for different purposes, such as verifying the compliance of the current energy performance with the requirements established by the regulations, developing energy refurbishment scenario analyses, predicting future energy resource needs at local scale, identifying the subsets of the building stock toward which addressing urgent interventions.
The novelty of the research relies on the methodology; a framework of parameters, which include reliable data and stated assumptions, are introduced to describe the building stock. In the case of lack of data on the building stock, default assumptions are commonly used but seldom clearly declared. The proposed parameter framework guarantees a transparent approach in the assumptions.
The energy performance of the housing stock model is calculated by means of a quasi-steady-state method and then compared with actual consumption by fossil fuels. The deviations are discussed and a correlation function is found. The issue of the lack of detailed and updated data is stressed; these data can guarantee the future exploitation of the assessment model as an effective policy-making tool. The methodology is not only applicable to local environments, but also exploitable at international level.
2. Method and Theory
In the present work, the methodology for constructing a residential building stock model and assessing its energy performance encompasses the following activities:
- Collection of data on the size of the housing stock, on the state of thermal insulation and of thermal systems (i.e., state of energy refurbishment).
- Construction of the model by clustering the residential building stock in subsets, each one characterized by specific features (e.g., construction period, thermo-physical properties of the building envelope, type of heating system, etc.).
- Identification of representative buildings for each subset of the stock.
- Energy performance calculation of the representative buildings and of the building stock, following a bottom-up approach.
- Comparison between the estimated energy performance and the real energy consumption.
The first activity is intended to identify monitoring indicators and model assumptions, which describe the current state of the building stock; they are presented in Section 2.1. A reference for the building typology approach is the IEE-TABULA Project (Typology Approach for Building Stock Energy Assessment), which provides residential building typologies of several EU countries, including Italy, as described in Section 2.2. The energy performance calculation is carried out by means of the quasi-steady state calculation method specified in Section 2.3. The low degree of complexity of this method is consistent with the spatial scale of the energy analysis. The energy performance of the building stock is got by multiplying the energy performance of each building type by the related number of existing buildings. Finally, the comparison between estimated and real energy consumption allows identifying a correlation function for adjusting the calculated value to increase the reliability of the building stock model in scenario analyses.
2.1. Parameters Framework
The main activities in the EPISCOPE Project were led towards outlining an overview of the available data of building stocks, and identifying missing, out of date and/or low quality data. These activities were finalized to overcome the lack and incompleteness of data at present, and to develop ideas to be transferred to the public authorities for the improvement of national and local monitoring systems in the future. In the project, the development of a common language at international level allowed the achievement of these purposes. This language, which is based on a proper set of parameters for the exchange of information, represents a generally applicable set of quantities to be regularly updated [26]. The main components of the parameter framework are:
- Monitoring indicators, which include reliable data of the building stock collected by means of surveys or censuses, to be regularly updated; and
- Model assumptions, which allow overcoming the lack or incompleteness of the monitoring indicators and are needed to picture the future development of the building stock.
In the construction of the building stock model, the main challenge consists in overcoming the lack of data although guaranteeing transparency in the model definition. The model assumptions have to be clearly declared and justified in the analysis; they should be a small amount and represent the most probable conditions. They are replaced as soon as new consistent data are available.
The main parameters for the housing stock modeling, to be classified either as monitoring indicators or as model assumptions, belong to the following categories:
- Building stock size (e.g., number of buildings, number of apartments, and mean dwelling floor area);
- Thermal characteristics of the envelope (e.g., mean U-value of external walls and windows);
- Features of the technical building systems (e.g., type of heating system, type of heat generator, and energy carrier).
2.2. Italian Building Typology
The IEE-TABULA Project (Typology Approach for Building Stock Energy Assessment, 2009–2012) aimed at creating a harmonized structure of the European residential building typologies. The “building typology” is a set of model reference buildings or “building types”, each of them with its specific energy related properties. Each building type is considered representative of a climatic area, a construction period and a building size.
The Italian residential building typology developed in TABULA refers to the middle climatic zone (i.e., Italian municipalities having from 2100 to 3000 HDD (heating degree-days)), which represents most of Piedmont as well. The set of building types is representative of four building size classes (single-family houses, terraced houses, multi-family houses and apartment blocks) and eight building age classes (up to 1900, 1901–1920, 1921–1945, 1946–1960, 1961–1975, 1976–1990, 1991–2005, and after 2005), as shown in Figure 1 [27]. Each building type is representative of a subset of the residential building stock as regards both the geometric data (conditioned floor area, conditioned volume, shape factor) and the thermo-physical properties of envelope and thermal systems. Anyway in TABULA, the latter features reflect the original condition of the building and do not take into account the refurbishment actions occurred since the construction year. Therefore, due to the scope of the present work, the building types of TABULA can be used to represent the housing stock of Piedmont for their geometric data, while the construction and thermal systems features should be derived from other data sources, as presented later in Section 3.
2.3. Energy Performance Assessment
As specified in ISO 52000-1 [28], the building energy performance (EP) is expressed as the overall primary energy demand divided by the conditioned floor area. The calculation method applied in the analysis refers to UNI/TS 11300 series [29], which is the Italian transposition of EN ISO 13790 [30] and EN 15316 series [31]. A tailored energy rating, as defined in [28], is performed by using actual data for building, climate and occupancy. The calculation procedure is applied on a monthly basis and is characterized by the following main steps:
- Calculation of the energy need for space heating and space cooling, which relies on the balance between the total heat transfer by transmission and ventilation and the solar and internal heat gains, and calculation of the energy need for domestic hot water;
- Calculation of the energy consumption for each energy service and for each energy carrier, by applying a heat balance equation for each subsystem (i.e., generation, distribution, emission and control) of the technical building systems;
- For each energy service, calculation of the energy delivered to the heat generators by each energy carrier and calculation of the electricity need for the system auxiliaries;
- Calculation of the non-renewable primary energy associated with the delivered energy and the exported energy for each energy carrier and energy service, using the conversion factors according to UNI/TS 11300 (part 5) and the Italian Ministerial Decree 26 June 2015 [32].
The analysis of the real energy consumption of the residential building stock, known as measured energy performance [28], and its comparison with the calculated energy performance (tailored energy performance) is carried out through the energy signature method (EN 15378-3 [33]), by relating the annual delivered energy to the heating degree-days for each analyzed year.
3. The Residential Building Stock Model of Piedmont Region
The present Section describes the steps of development of the housing stock model for Piedmont. The monitoring indicators and the model assumptions are presented in Section 3.1. The clustering process for the construction of the model is provided in Section 3.2 and the application of the building typology approach is presented in Section 3.3. In Section 3.4, the real energy consumption data of the regional housing stock are reported. Finally, the input data and the assumptions applied in the energy performance calculation are presented in Section 3.5.
3.1. Monitoring Indicators and Model Assumptions
Piedmont region has a land surface of 25,402 km2, 4.36 million inhabitants and 1206 municipalities. The parameters used for modeling the regional housing stock are listed in Table 1; each parameter is classified as either a monitoring indicator (MI) or a model assumption (MA). The monitoring indicators were collected and processed from different data sources, such as the census of population and dwellings by the National Institute of Statistics (ISTAT, census 2011) [34], the regional observatory of the real estate market (OMI) [35], the database of the building energy performance certificates (EPCs) of Piedmont Region, and reports of the Italian National Agency for New Technologies, Energy and Sustainable Economic Development (ENEA) [36]. The database of the building Energy Performance Certificates (EPCs) of Piedmont, issued in the period 2010–2013, is the main data source of monitoring indicators concerning the building envelope and the thermal system features. The monitoring indicators derived from statistical analysis of the EPCs issued for sale and rent were considered suitable representative of the average existing building stock. A detailed analysis of the above data sources and their degree of reliability are presented in a previous work [37].
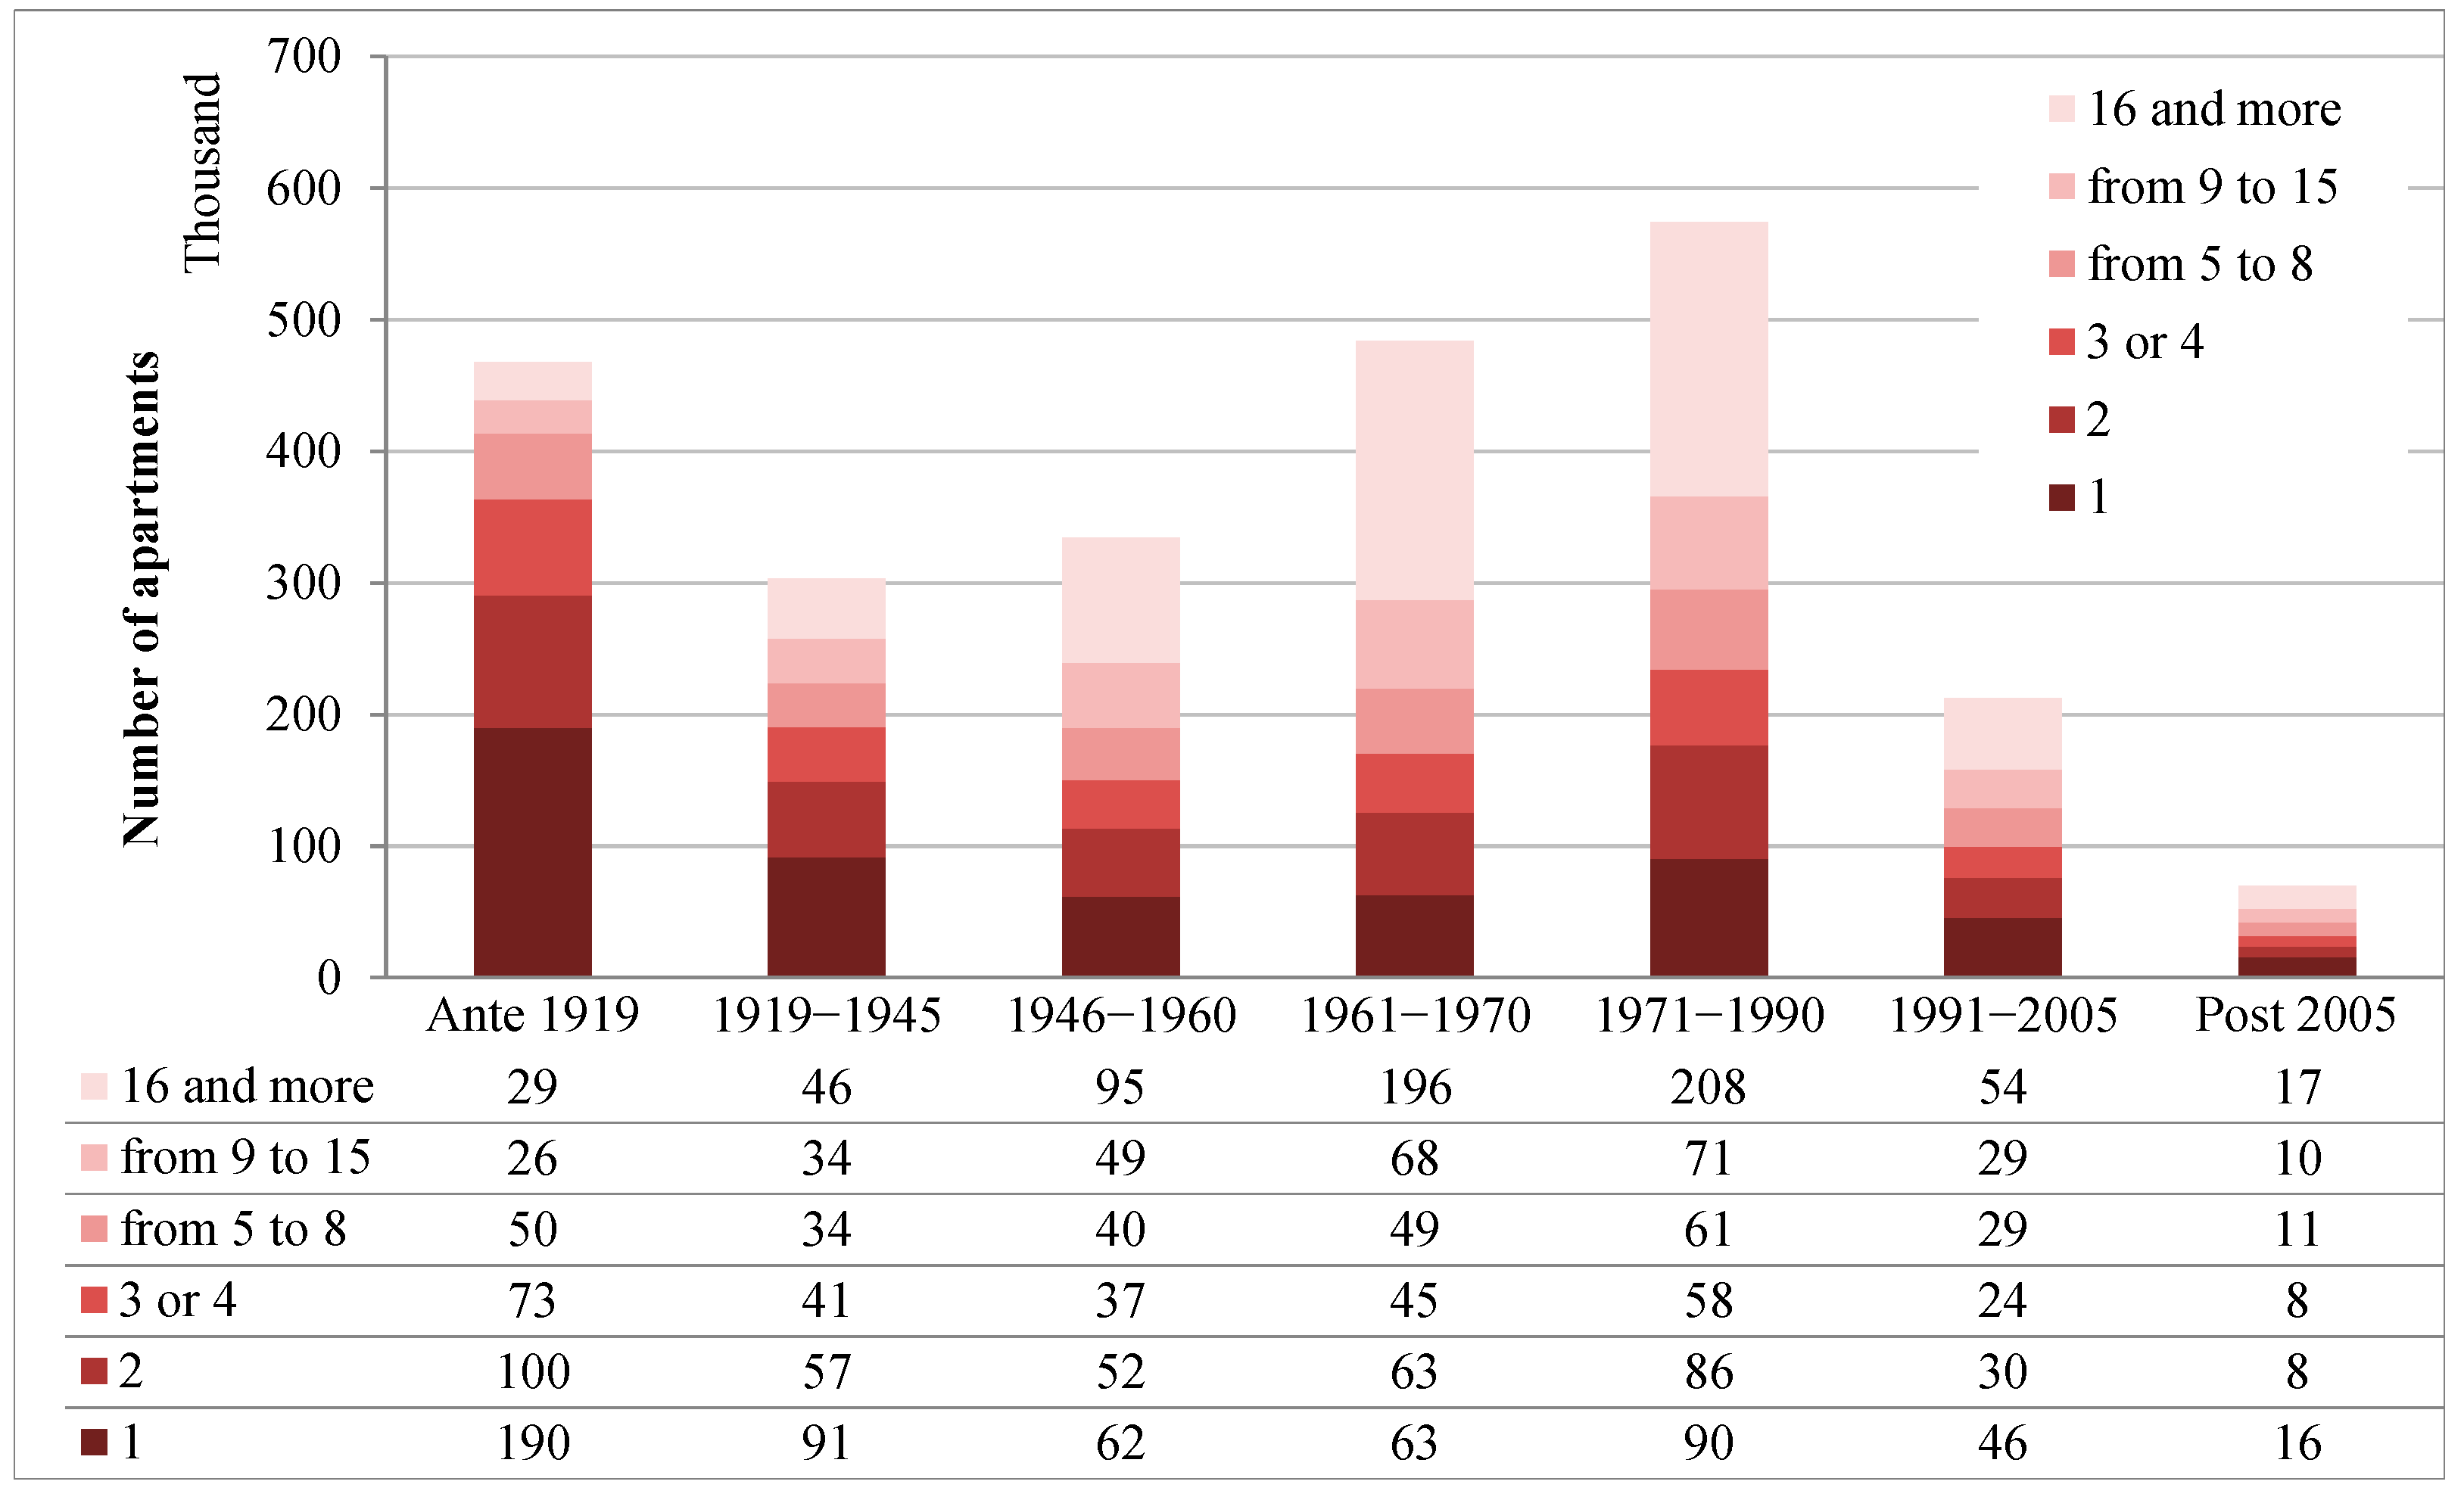
An example of monitoring indicator, concerning the number of apartments in Piedmont by construction period and number of apartments in the building, is provided in Figure 2. This graph would help to understand how the apartments are distributed according to the size of the building, in each construction period. Through this representation, it is possible to identify the prevalence of buildings with small, medium or big size in each age. For instance in Piedmont, most of the single-family houses were built in the period “ante 1919”, while the highest number of dwellings in big buildings (16 and more apartments) was built in the period “1971–1990”.
3.2. Construction of the Building Stock Model
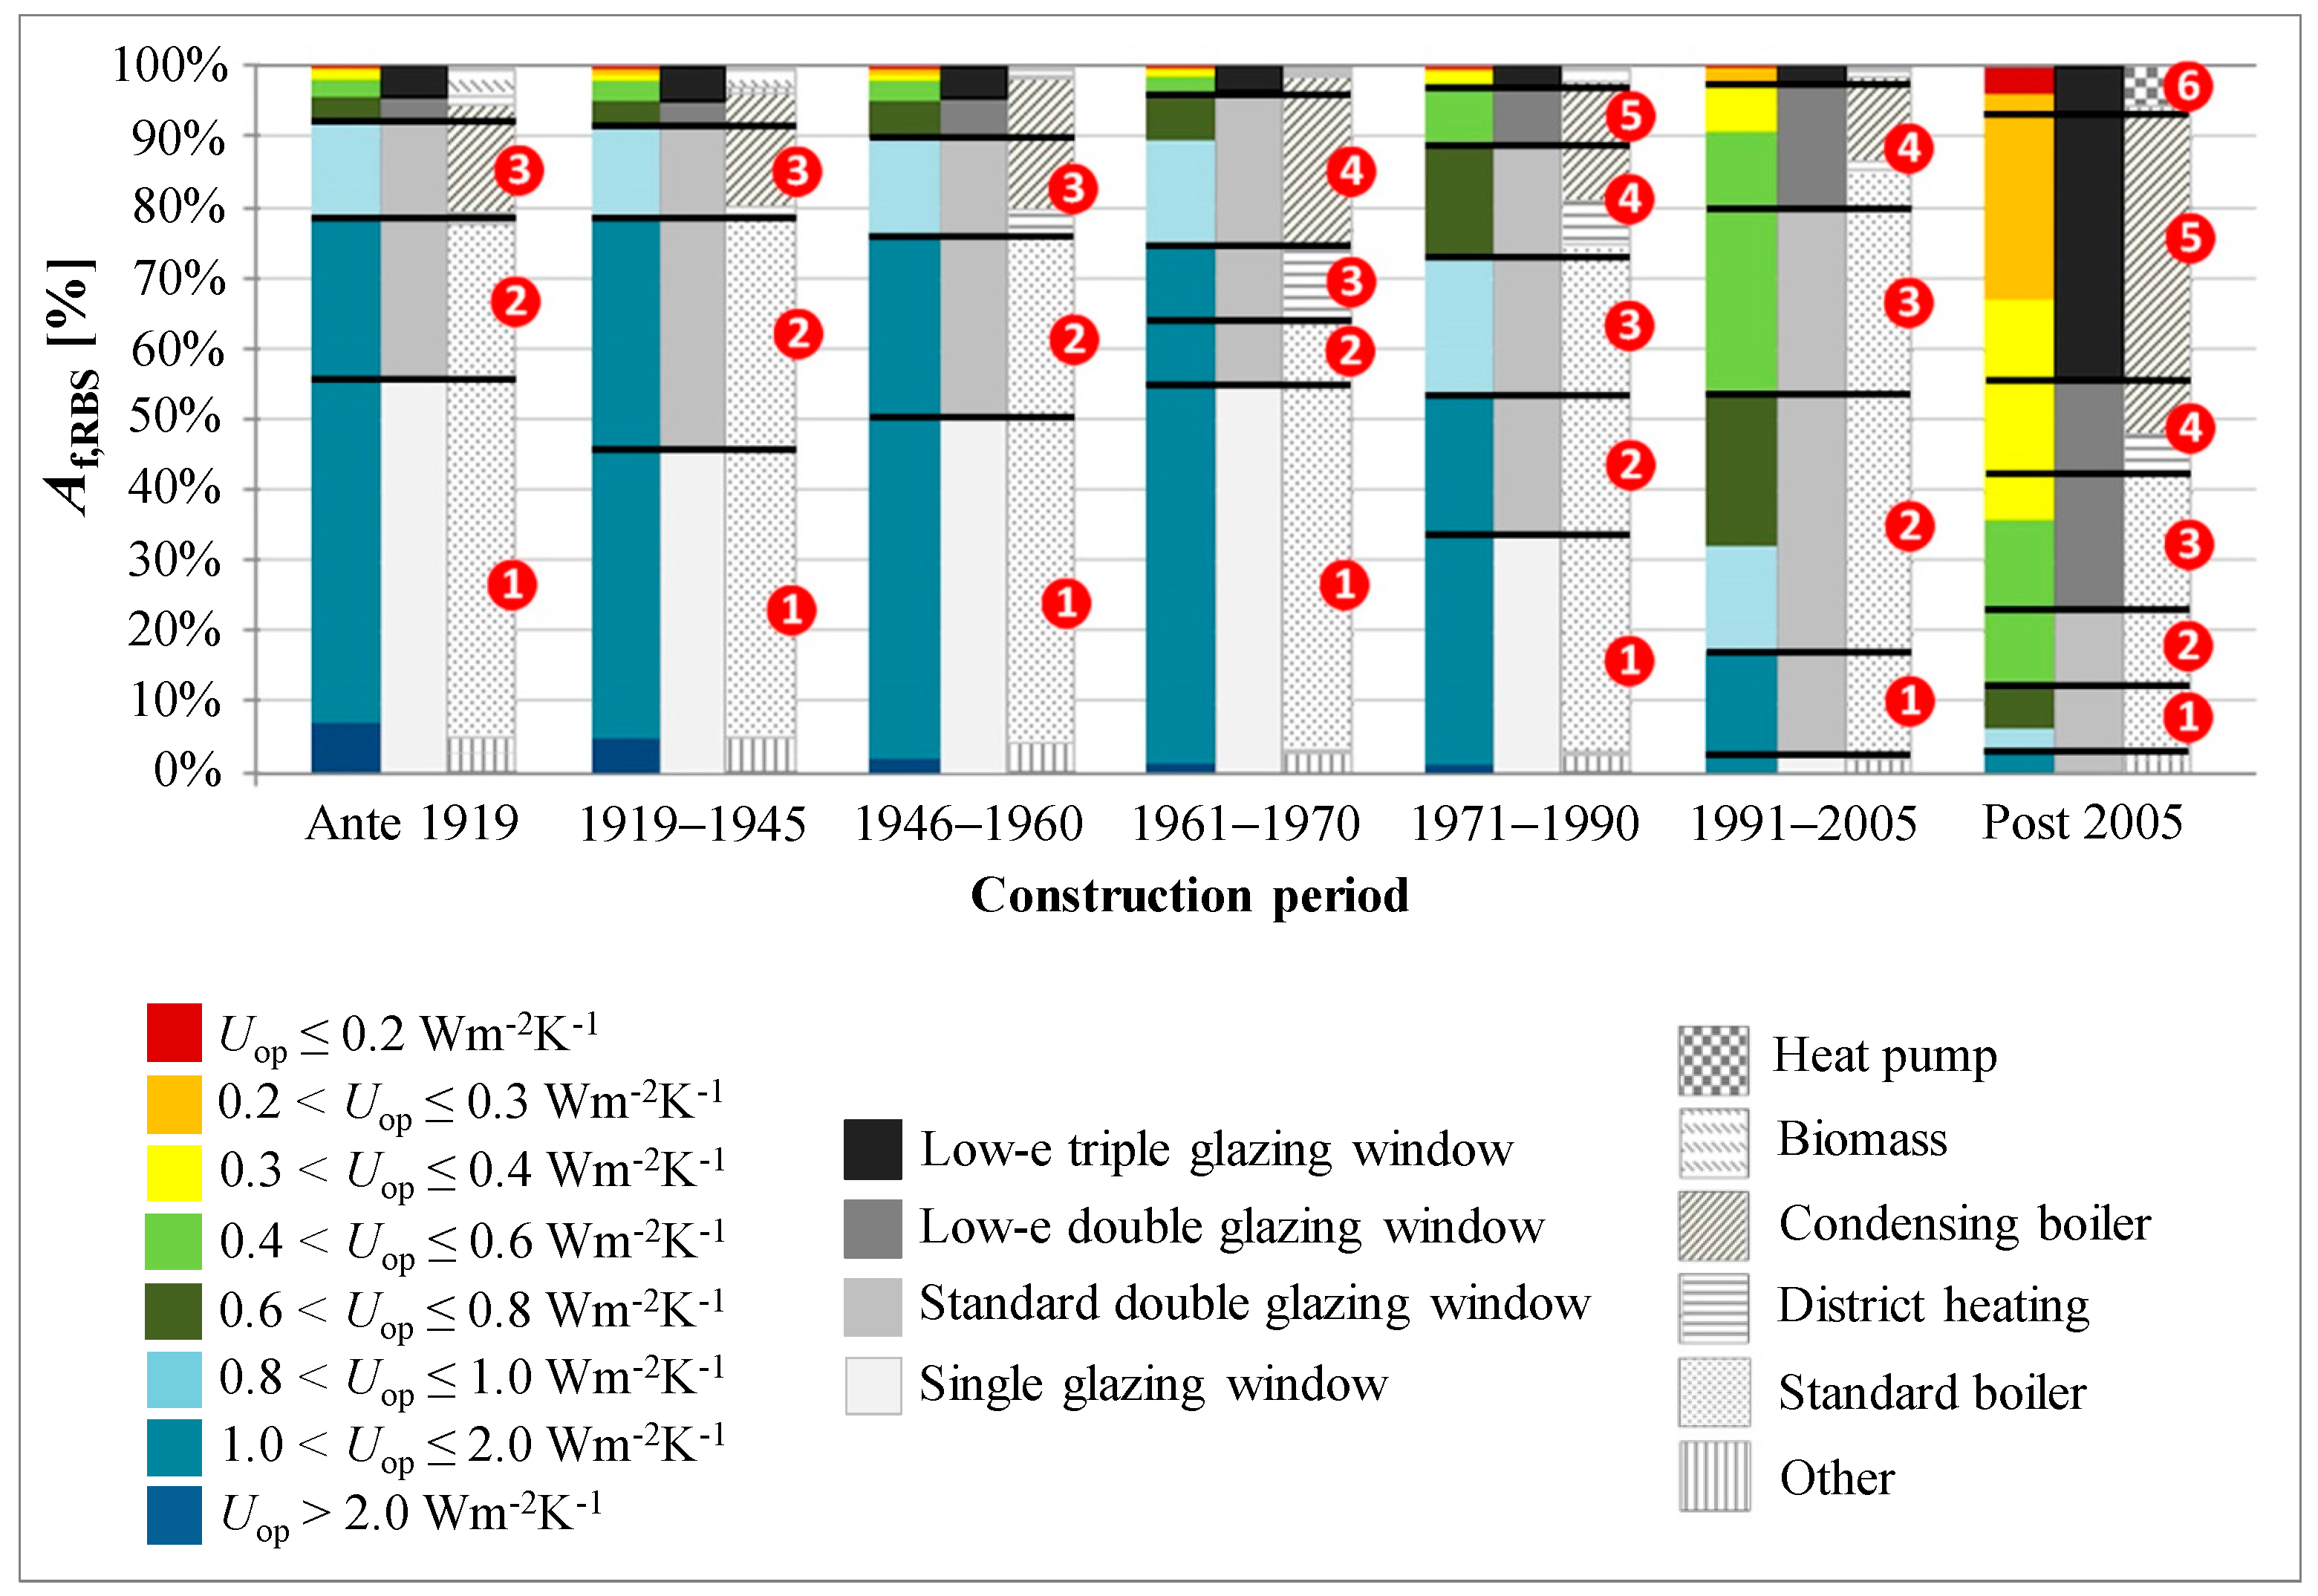
The structure of the residential building stock model of Piedmont is shown in Figure 3. It has been obtained through the following procedure, which was carried out through statistical analysis of the regional energy performance certificates (EPCs) database.
The residential building stock (RBS) was clustered by construction period, and for each period, by range of external walls thermal transmittance (Uop), by type of window (glazing type) and by type of heat generator. These are monitoring indicators, as listed in Table 1. In each construction period, equivalent performance levels of the building envelope and of the thermal system have been associated. For instance, higher performance walls (i.e., lower U-values) and windows correspond to higher efficiency heat generators. The following ranking has been considered for heat generators (from higher to lower efficiency): heat pump, biomass, gas condensing boiler, district heating, gas standard boiler and other heat generators (e.g., electrical appliances). The performance levels are represented by the numbers in the red circles of Figure 3. Due to the lack of detailed information, the following clustering assumptions were applied: (1) for each construction period, energy refurbishment actions occur along the building lifespan and increasing levels of energy performance are determined by more recent energy refurbishments; and (2) the energy efficiency measures are applied to the envelope and to the thermal systems in a balanced way.
These assumptions find justification in the national regulations, which since 1980 have established provisions for energy saving both on thermal envelope and on technical building systems (assumption No. 2). In addition, increasingly higher performance levels for envelope and thermal systems have been required since 1980 by the regulations (assumption No. 1). Note that the highest performance levels do not match with each other in all construction periods. In fact, as shown in Figure 3, the highest performance levels in the oldest construction periods are less efficient than those of the recent years. This is due to technical feasibility issues that arise in the refurbishment of historical buildings; in addition, it can be supposed that the oldest buildings were subjected to renovation in a more distant period progressively, when the regulations in force did not require as high energy efficiency improvements as nowadays.
The performance level clustering criterion is dominated by the window type, secondly by the heat generator type, then by the wall U-value range. In the case of a heat generator poorly represented in a construction period, the performance level can include two heat generator types of similar efficiency (e.g., condensing boiler and district heating, like in the period 1946–1960). This choice would avoid making the model too complex with a large amount of performance levels in the same construction period. In addition, as just 1% of the Piedmont dwellings are equipped with an electric system for space heating (included in the “other” category of Figure 3), these systems were considered negligible. More performance levels are defined in the latest construction periods, due to a wide variability of the thermal insulation levels of the building envelope (i.e., in the case of new buildings).
A total amount of 28 performance levels, which represent 94% of the total RBS floor area of Piedmont region, result in the model. The remaining 6%, which includes very high energy performance levels in the oldest construction periods and very low energy performance levels in the latest construction periods, is discarded as it represents unrealistic conditions.
An example that may help to better understand the model (Figure 3) is provided for the construction period “ante 1919”. Following the clustering process, the residential building stock floor area (Af,RBS) of Piedmont built before 1919 includes three performance levels, as follows:
- Performance level No. 1 that represents 55.6% of the RBS built before 1919 and is characterized by a mean U-value of the external walls higher than 1 W·m2·K−1, single glazing windows and standard boilers;
- Performance level No. 2 that represents 22.7% of the RBS built before 1919 and is characterized by a mean U-value of the external walls higher than 1 W·m2·K−1, double glazing windows and standard boilers;
- Performance level No. 3 that represents 13.7% of the RBS built before 1919 and is characterized by a mean U-value of the external walls between 0.8 and 1 W·m2·K−1, double glazing windows and condensing boilers.
In the calculation of the energy performance of the housing stock, some data are lacking, so appropriate model assumptions are needed to close the information gap. This occurs for the U-values of floors and ceilings, and for the efficiency of the technical building sub-systems (e.g., heat distribution and heat emission), as listed in Table 1. Reference values were derived from the IEE-TABULA Project, which provides typical technologies classified by building size and construction period [27].
3.3. Application of the Building Typology
The geometry of some representative residential buildings was attributed to the performance levels. Twenty-one reference building types among the ones of the Italian residential building typology of TABULA were selected according to the following criteria:
- Three building size classes were chosen, including the multi-family houses, the apartment blocks and the single-family houses. The terraced houses were excluded because no information on this building type is provided by statistical data sources.
- Seven building age classes were taken into account, from class 1901–1920 to class after 2005, in line with the construction periods considered in the model (see Figure 3).
Each of the 21 building types represents a share of the regional RBS. For each construction period, the residential building stock of Piedmont referred to the number of dwellings shown in Figure 2 was split by building size class, according to the following criteria:
- A building having one dwelling is supposed to be a single-family house;
- A building having from two to fifteen dwellings is supposed to be a multi-family house;
- A building having sixteen and more dwellings is supposed to be an apartment block.
These criteria comply with the guidelines of the TABULA Project, which provide the following definitions of the building size classes: (a) the single-family house (SFH) is a single dwelling of one or two floors; (b) the multi-family house (MFH) is a small dimension building with a limited number of apartments (generally up to 15 apartments); and (c) the apartment block (AB) is a big dimension building with a higher number of apartments [27].
To get the RBS floor area by building size class, the mean dwelling area of each building type was multiplied by the number of dwellings of Figure 2.
The share of RBS floor area by performance level (Figure 3) was then further subdivided by building size class according to the following procedure. As no statistical information about each analysed monitoring indicator is available by building size class, the split of each performance level has been assumed proportional to the weight of each building size class on the total RBS floor area in each construction period. This derives from the assumption that in the same construction period the energy refurbishments are equally distributed among single-family houses, multi-family houses and apartment blocks. This assumption is justified by the lack of references, established in the regulations and/or applied in the normal practice. The share of the regional RBS floor area by performance level and by building size class is shown in Figure 4.
The RBS model is now represented by a total of 84 reference buildings resulting from 28 performance levels and 3 building sizes. The main data about the geometry, the construction features and the thermal system properties of each building type are listed in Table 2. The thermal transmittance of the external walls (Uop) is the mean value of the range included in each performance level of Figure 3. The types of heating system (centralized or individual) and DHW system (combined or separated heat production) are those prevalent in each construction period by statistical analysis. The domestic hot water is mostly produced by gas heat generators, followed by individual electric water heaters (20% of the RBS floor area); both were taken into account in the model (see Table 2). The two highest performance levels of the last construction period (post 2005) have a thermal solar system covering 50% of the annual energy need for domestic hot water.
3.4. Real Energy Consumption of the Housing Stock
The real energy consumption of the RBS of Piedmont was derived from the Regional Energy Balances (BER) of the Italian National Energy Agency for New Technologies, Energy and Sustainable Economic Development (ENEA) [38,39]. This reference provides the energy consumption of the residential sector by energy carrier. However, limitations are revealed in the use of the BER; the most recent available energy consumption data are referred to the year 2011 and no other data source provides updated information at regional level. In addition, aggregated electricity consumption data, not split by final energy use, are available. Therefore, it was not possible to derive the annual electricity consumption for space heating and DHW. More detailed information is available for fossil fuels, of which natural gas and oil-based fuels cover 80% of the overall energy use of the residential sector of Piedmont.
In Table 3, the annual delivered energy by fossil fuels (natural gas and oil-based fuels) for space heating and domestic hot water of the regional RBS and the heating degree-days are reported for some available years. The heating degree-days, i.e., the accumulated daily temperature difference, were calculated according to EN ISO 15927-6 [40] as in Equation (1), that is:
where θb is the base temperature (here assumed 20 °C), θdm is the daily mean temperature derived from the weather database of the Regional Agency for Environmental Protection (ARPA) [41]. The sum refers to the days of the conventional heating season (15 October–15 April). This is the legal period established for the Italian climatic zone E (from 2100 to 3000 HDD), to which most of the Piedmont municipalities belong.
3.5. Use and Climate Data and Calculation Assumptions
The occupancy data applied in the energy performance calculation include the internal heat gains, the ventilation air flow, the heating set-point temperature, the operation of the thermal system and the heating season length. They were derived from technical standards and national literature in accordance with a typical real use. Real occupancy profiles differentiated by type of residential building were considered in accordance with a research work of Corrado et al. [42]. The occupancy parameters for household types have been derived from national time use surveys, carried out since the late 1990s from the Italian National Institute of Statistics (ISTAT) [34]. The internal heat gains take into account the presence of occupants and their activities, the use of domestic appliances and lighting in rooms and the preparation of meals. The internal heat flow was determined separately for the multi-unit housing (multi-family houses and apartment blocks) and the single-unit housing (single-family houses) and its mean monthly value amounts at 7.1 and 3.5 W∙m−2 respectively.
The technical specification UNI/TS 11300 (part 1) states that an average monthly value of 0.3 h−1 can be assumed for the natural ventilation in the case of residential use, or, alternatively, a more accurate definition of the air change rate can be done by taking into account the indoor air quality requirements. Anyway in the existing buildings, it is not possible to determine the air change rates with enough certainty: many factors, like the boundary climatic conditions, the building envelope tightness, the user behavior, affect the natural ventilation rate. At this regard, the national technical specification also suggests to refer to the EN 15251 standard [43].
According to EN 15251, the natural ventilation rate of the building should be determined for the occupied periods and the unoccupied periods separately. These periods were defined on hourly basis, consistently with the internal heat gains. By applying the EN 15251 standard, the air change rate in the occupied periods was assumed 0.47 h−1, considering a moderate level of expectation with regard to the indoor air quality (to be applied for the existing buildings, according to the standard); while in the unoccupied periods, a minimum air flow of 0.075 l∙s−1·m−2 (or a rate of 0.10 h−1) was considered. The resulting mean monthly value of the air change rate is 0.31 h−1, in line with the conventional value provided by UNI/TS 11300 (part 1).
The heating set-point temperature was fixed at 20 °C in the normal heating mode and an intermittent daily operation of the heating system was considered, according to the national regulation. The thermal system was assumed to be switched on 12 h per day in the multi-unit housing with a centralized heating system and 8 h per day in the single-unit housing and in the multi-unit housing with an individual heating system, as it generally occurs in the residential buildings of Piedmont. The effect of the thermal system intermittency on the energy need for space heating was taken into account according to EN ISO 13790 [30,44].
The length of the heating season is set according to the national regulation in function of the climatic zone. In the calculation, the heating season was considered from 15 October to 15 April. The climatic data of Turin, which is the capital of Piedmont, were applied in the calculation. This location is quite representative: it presents average climatic conditions over the region and almost half of the dwellings of Piedmont are located in its province. The monthly values of the mean daily air temperature and solar irradiance were derived from the weather database of the Regional Agency for Environmental Protection (ARPA) [40]. The climatic values of the year 2012 were assumed, consistently with the period of the statistical data used for constructing the model. In addition, in order to compare the estimated with the real energy consumption of the RBS, as the energy consumption data of the RBS in 2012 are lacking, the energy performance of the model was recalculated applying the climatic data of the most recent available years for which the real energy consumption is known (see Table 3). Every year from 2004 to 2011 was considered, except 2005 and 2007 that present relevant gaps of climatic data.
The comparison between estimated and real energy consumption was developed based on fossil fuels consumption (Table 3) and excluding electricity. Therefore, the estimated energy use for DHW of the buildings equipped with an individual electric water heater, the electricity use of heat pumps and of technical systems auxiliaries were not considered.
To make the comparison with the real consumption consistent, a portion of the RBS floor area of the model representing the constructions after 2005 was removed. Moreover, it was supposed that the buildings built before 2005 remained unchanged between 2005 and 2012. The above assumptions are justified by the fact that the average annual trend of new dwellings in Piedmont after 2005, provided by the observatory of the real estate market (OMI) [35], is lower than 0.5%, and the mean refurbishment trend of existing dwellings is about 1.8% per year, as reported by ENEA [45].
As regards the energy services, space heating and domestic hot water production are included in the analysis, while space cooling and electrical appliances are not considered because of the low influence of these energy services in the overall energy consumption of the residential sector. In addition, the cooling systems are scarcely widespread in Piedmont and the use of single cooling devices (i.e., mini-split air conditioners) in dwellings is hardly monitored [34].
4. Results and Discussion
4.1. Results of the Energy Performance Calculation
The calculated primary energy use for space heating and domestic hot water normalized on the heated net floor area of each of the 84 reference buildings is shown in Figure 5, represented in function of the heated net floor area of each reference building. Each bar shown in this graph represents the energy performance range related to the different performance levels for the same building size class and construction period. In fact, each bar includes the set of building types with the same geometry but different U-values of the envelope components and efficiencies of the thermal systems.
All the building size classes show, on the average, high energy consumption in the construction periods up to 1970, above all as concerns the lowest performance levels, which generally correspond to the building in the original state, without any renovation. The improvement of the energy behavior of the buildings subsequent to 1970 is due to the entry into force of the first Italian legislation on energy saving. By comparing different building size classes in the same construction period, the single-family houses reveal a poorer energy performance on the average, which is mainly due to a higher compactness ratio (Aenv/Vg). For the same reason, a higher EP variability among the performance levels is shown.
In Figure 6, the annual primary energy use for space heating and DHW normalized on the heated net floor area of each of the 84 reference buildings vs. the total heated net floor area of the regional residential building stock represented by each reference building is shown. The acronym associated to each building type identifies the size (SFH, MFH, AB), the construction period (from A = “Ante 1919” to G = “Post 2005”) and the performance level (from 1 to 6). This type of graph allows identifying both the numerousness and the energy performance of each building type in the building stock. Four virtual quadrants can be outlined in the graph: the upper right quadrant includes the buildings that represent a bigger floor area of the RBS (>2 × 10⁶ m2) with the lowest energy performance (>100 kWh·m−2), while the lower left quadrant includes the buildings that represent a smaller floor area of the RBS (<2 × 10⁶·m2) with the highest energy performance (<100 kWh·m−2). For instance, the former case is represented by the oldest single-family houses, the latter case is represented by the new buildings, as highlighted in Figure 6. The information provided by Figure 6 is also useful for identifying the subset of the housing stock towards which addressing the most effective energy refurbishment actions.
The annual primary energy use of the entire housing stock of Piedmont can be obtained by applying Equation (2), where EPH+W,i is the normalized annual primary energy for space heating and DHW of the i-th reference building, and ARBS,i is the heated net floor area of the residential building stock represented by the i-th reference building.
The results are shown in Figure 7 for each building size class. The estimated primary energy for space heating and domestic hot water of the entire housing stock of Piedmont in 2012 is 27.7 TWh (EPH+W,RBS = 137 kWh·m−2), while the delivered energy by fossil fuels and by electricity (technical building systems auxiliaries included) for the same energy services amounts at 25.3 and 0.46 TWh respectively. The single-family houses present the highest annual energy consumption (57%), followed by the multi-family houses (31%) and then by the apartment blocks (12%). Sixty percent of the RBS floor area was built before 1970 (see also Figure 4) and represents 77% of the total energy consumption.
4.2. Comparison between Estimated and Real Energy Consumption
The comparison between the real energy consumption (measured energy performance) and the calculated energy performance (tailored energy performance), in terms of annual delivered energy by fossil fuels for space heating and DHW of the regional RBS, is shown in Figure 8a through the energy signature method. Both the energy performance ratings show a linear trend with the heating degree-days and a very high coefficient of determination.
The predicted energy model overestimates the energy consumption in a range between 19% and 27%. This deviation, even if quite high, represents an improved finding if compared with the outcomes of research works on a similar topic; they revealed a 30–40% deviation between the energy assessment methods, as presented in Section 1.1. The deviation is generally due to many factors related to the building modeling, on the one hand, and to the user behavior, on the other hand. The energy signature helps to identify the reasons; the slope of the signature is determined by the terms of the building energy balance that depend on the indoor-outdoor temperature difference (i.e., heat transfer by thermal transmission and by ventilation), while the constant value is related to heat gains, efficiency of thermal systems and energy need for DHW. In this analysis, the energy signature slope of the estimated energy performance is slightly greater than that of the real energy consumption. This could depend on the overestimation of the thermal transmittance of the building envelope; the U-values are not measured, but theoretically determined through conservative options. The higher value of the constant in the energy signature of the tailored energy rating can be explained by an underestimation of the thermal systems efficiencies and an overestimation of the energy need for DHW; both aspects are due to conservative options provided for in the quasi-steady-state calculation model. Other non-deterministic reasons of deviation include the occupant behavior, for instance in the operation of the heating system, the windows opening, the amount of the internal heat gains.
The linear correlation between the estimated and the real energy consumption of the Piedmont RBS is shown in Figure 8b. The gap between the two assessment methods increases when the heating degree-days increase. The correlation function is valid for the developed housing stock model in quite wide HDD range (2150–2500) and considering a period of years with a very limited trend of new constructions and retrofit actions. In order to enable the model to foresee future energy needs at regional scale, an upgrade of the RBS model is needed when new boundary conditions occur and updated data of the building stock are made available.
5. Conclusions
The development of monitoring procedures and bottom-up models should be encouraged to enable key actors and stakeholders at national or regional scale to ensure effective energy refurbishment actions and to boost the refurbishment processes toward the attainment of the EU goals in the forthcoming years. A precondition for the achievement of effective energy savings and CO2 emissions reductions is to create reliable building stock models, to correctly evaluate the current energy performance of the existing building stocks and to really predict future energy needs.
Through the application of the guidelines of the IEE-EPISCOPE Project, which are based on the use of monitoring indicators and model assumptions and on the application of the building typology concept, a methodology for constructing a building stock model has been presented in the article. It has been applied for evaluating the current energy performance of the housing stock of Piedmont.
A major weakness of the building stock models is in the use of assumptions, which are necessary in the case of lack of data. According to scientific literature, serious issues concerning shortage of data for the characterization of the building stocks are revealed. The quality of available survey data is low, with incomplete, not statistically robust or out of date information. This issue has been partially overcome by providing a clear and transparent methodology: all the assumptions are completely declared so as they can be replaced by reliable data when they become available. The building stock model can be used as a policy-making tool, within the limit of validity of the assumptions.
In the presented work, the realm of validity is mainly related to the following aspects:
- The assumptions declared in the construction of the residential building stock model, concerning for instance the use of typical U-values for upper and bottom floors and the methodology applied for clustering the housing stock in performance levels;
- The calculation method of the building energy performance;
- The procedure and the assumptions used for determining the internal heat gains and the ventilation rate.
The methodology also presents advantages and strengths. By using the building typology approach, the model allows to disaggregate the residential building stock in subsets including buildings of different envelope and thermal systems features to identify the main potential for energy savings in specific contexts. In addition, this model is characterized by a plain structure, with a complexity level that is proportionate to the territorial scale to which it is applied. The model can be easily understood and used by non-experts of the energy sector, like regional officers and local administrators. These key actors would take advantage of this instrument in scenario analyses to quantify the influence of different energy efficiency measures on the delivered energy of the housing stock and to set an effective energy policy.
The results of the energy performance calculations allow identifying the portion of the residential building stock of Piedmont that presents the highest energy saving potential because of both the lowest energy performance and the highest amount of floor area in the stock. This is the case of the residential building stock built before 1970, which represents 77% of the total energy consumption of the regional housing stock. Within this segment, the single-family houses present the highest amount of floor area and the highest annual energy consumption for space heating and domestic hot water.
Many improvements of the current data availability are necessary to track the energy performance of the observed building stock. This concerns above all the real energy consumption data; they are provided by the Regional Energy Balances (BER) and the most recent data date back to 2011. The collection of consumption values of fossil fuels has become increasingly difficult since several energy providers compete on the market. The comparison between actual energy consumption and estimated energy performance of the RBS is aimed at identifying the reasons of deviation and calibrating the model. In the present work, the deviation revealed to be lower compared with that found in literature. The correlation function between the two energy ratings can be useful for increasing the trustworthiness of the building stock model in scenario analyses. Anyway, the model should be kept updated by considering the annual trends of refurbishment; in this regard, future research work will investigate different correlation functions for refurbished and non-refurbished buildings separately. The calibration of the building stock model would be desirable but it cannot be performed as long as no detailed data on the real energy consumption are provided, diversified for instance by energy service, energy carrier, building construction period, building size. In this way, the calibration might be carried out for subsets of the housing stock individually.
Procedures and methodologies for setting up a regular monitoring of the residential building stock should concern the enhancing of the building energy certification system, the execution of representative surveys, the improvement of the regional or national census, and the energy management of buildings. The building energy performance certification system should include more detailed data, and more strict controls should be applied on the data input to increase both the quantity and the quality of information. In addition, new data sources are going to be made available by the building energy audits, which are being carried out through procedures established by standards (according to Directive 2012/27/EU), and the energy cadastres.
Acknowledgments
This work is based on the European Project EPISCOPE, supported by the European Commission within the European program “Intelligent Energy Europe” (IEE), under the coordination of the Institut Wohnen und Umwelt GmbH, Germany.
Author Contributions
Ilaria Ballarini and Vincenzo Corrado contributed equally to this work. Ilaria Ballarini and Vincenzo Corrado designed and performed the analysis and shared the writing of the paper.
Conflicts of Interest
The authors declare no conflict of interest.
Nomenclature
| A | Area [m2] |
| COP | Coefficient of performance [-] |
| E | Energy [Wh] |
| EP | Energy performance [kWh·m−2] |
| HDD, θΣd | Heating degree-days [°Cd] |
| U | Thermal transmittance [W·m−2·K−1] |
| V | Volume [m3] |
| η | Efficiency [-] |
| θ | Temperature [°C] |
| Subscripts | |
| b | Base |
| bld | Buildingdel delivered (energy) |
| dm | Daily mean |
| dwl | Dwelling |
| E | Estimated |
| env | Envelope |
| f | Floor |
| ff | Fossil fuels |
| g | Gross |
| gn | Generation (subsystem) |
| H | Space heating |
| op | Opaque (envelope) |
| P | Primary (energy) |
| R | Real |
| W | Domestic hot water |
| w | Windows |
| Abbreviations and Acronyms | |
| AB | Apartment block |
| BER | Regional Energy Balances |
| CB | Combined system for space heating and domestic hot water |
| CE | Centralized (system) |
| DH | District heating |
| DHW | Domestic hot water |
| EHP | Electric heat pump |
| EPC | Energy performance certificate |
| GCB | Gas condensing boiler |
| GSB | Gas standard boiler |
| IN | Individual, per apartment (system) |
| MA | Model assumption |
| MFH | Multi-family house |
| MI | Monitoring indicator |
| RBS | Residential building stock |
| SFH | Single-family house |
| SPI | Separated and individual system for domestic hot water |
References
- Europe in Figures—Eurostat Yearbook; Eurostat: Luxembourg, 2014.
- COM (2014) 15 Final. A Policy Framework for Climate and Energy in the Period from 2020 to 2030; European Commission: Brussels, Belgium, 2014.
- COM (2011) 885 Final. Energy Roadmap 2050; European Commission: Brussels, Belgium, 2011.
- European Union. Directive 2010/31/EU of the European Parliament and of the Council of 19 10 on the energy performance of buildings (recast). Off. J. EU 2010, 18, 13–35. [Google Scholar]
- European Union. Directive 2012/27/EU of the European Parliament and of the Council of 25 October 2012 on Energy Efficiency, Amending Directives 2009/125/EC and 2010/30/EU and Repealing Directives 2004/8/EC and 2006/32/EC. Available online: http://www.eib.org/epec/ee/documents/directive-2012-27-eu-of-the-ep-and-of-the-council.pdf (accessed on 26 July 2017).
- COM (2008) 772 Final. Communication from the Commission, Energy Efficiency: Delivering the 20% Target; European Commission: Brussels, Belgium, 2008.
- Dascalaki, E.; Balaras, C.; Zavrl, M.Š.; Rakušček, A.; Corrado, V.; Corgnati, S.; Ballarini, I.; Renders, N.; Vimmr, T.; Wittchen, K.B.; et al. Application of Building Typologies for Modelling the Energy Balance of the Residential Building Stock. TABULA Thematic Report No. 2; Institut Wohnen und Umwelt GmbH: Darmstadt, Germany, 2012. [Google Scholar]
- Kavgic, M.; Mavrogianni, A.; Mumovic, D.; Summerfield, A.; Stevanovic, Z.; Djurovic-Petrovic, M. A review of bottom-up building stock models for energy consumption in the residential sector. Build. Environ. 2010, 45, 1683–1697. [Google Scholar] [CrossRef]
- Aydinalp-Koksal, M.; Ugursal, V.I. Comparison of neural network, conditional demand analysis, and engineering approaches for modeling end-use energy consumption in the residential sector. Appl. Energy 2008, 85, 271–296. [Google Scholar] [CrossRef]
- Mata, É.; Sasic Kalagasidis, A.; Johnsson, F. Building-stock aggregation through archetype buildings: France, Germany, Spain and the UK. Build. Environ. 2014, 81, 270–282. [Google Scholar] [CrossRef]
- Ballarini, I.; Corgnati, S.P.; Corrado, V. Use of reference buildings to assess the energy savings potentials of the residential building stock: The experience of TABULA project. Energy Policy 2014, 68, 273–284. [Google Scholar] [CrossRef]
- Dascalaki, E.G.; Droutsa, K.G.; Balaras, C.A.; Kontoyiannidis, S. Building typologies as a tool for assessing the energy performance of residential buildings—A case study for the Hellenic building stock. Energy Build. 2011, 43, 3400–3409. [Google Scholar] [CrossRef]
- Patiño-Cambeiro, F.; Armesto, J.; Patiño-Barbeito, F.; Bastos, G. Perspectives on the near ZEB renovation projects for residential buildings: The Spanish case. Energies 2016, 9, 628. [Google Scholar] [CrossRef]
- Wyrwa, A.; Chen, Y. Mapping urban heat demand with the use of GIS-based tools. Energies 2017, 10, 720. [Google Scholar] [CrossRef]
- Brandão de Vasconcelos, A.; Duarte Pinheiro, M.; Manso, A.; Cabaço, A. A Portuguese approach to define reference buildings for cost-optimal methodologies. Appl. Energy 2015, 140, 316–328. [Google Scholar] [CrossRef]
- Filogamo, L.; Peri, G.; Rizzo, G.; Giaccone, A. On the classification of large residential buildings stocks by sample typologies for energy planning purposes. Appl. Energy 2014, 135, 825–835. [Google Scholar] [CrossRef]
- Dascalaki, E.; Balaras, C.A.; Droutsa, K.; Kontoyiannidis, S.; Zavrl, M.Š.; Rakušček, A.; Corrado, V.; Corgnati, S.; Ballarini, I.; Roarty, C.; et al. Typology Approach for Building Stock Energy Assessment. Main Results of the TABULA Project. Final Project Report; Institut Wohnen und Umwelt GmbH: Darmstadt, Germany, 2012. [Google Scholar]
- Corgnati, S.P.; Corrado, V.; Filippi, M. A method for heating consumption assessment in existing buildings: A field survey concerning 120 Italian schools. Energy Build. 2008, 40, 801–809. [Google Scholar] [CrossRef]
- Tronchin, L.; Fabbri, K. A round Robin test for buildings energy performance in Italy. Energy Build. 2010, 42, 1862–1877. [Google Scholar] [CrossRef]
- Tuominen, P.; Holopainen, R.; Eskola, L.; Jokisalo, J.; Airaksinen, M. Calculation method and tool for assessing energy consumption in the building stock. Build. Environ. 2014, 75, 153–160. [Google Scholar] [CrossRef]
- Sunikka-Blank, M.; Galvin, R. Introducing the prebound effect: The gap between performance and actual energy consumption. Build. Res. Inf. 2012, 40, 260–273. [Google Scholar] [CrossRef]
- Firth, S.K.; Lomas, K.J.; Wright, A.J. Targeting household energy efficiency measures using sensitivity analysis. Build. Res. Inf. 2010, 38, 25–41. [Google Scholar] [CrossRef] [Green Version]
- Di Turi, S.; Stefanizzi, P. Energy analysis and refurbishment proposals for public housing in the city of Bari, Italy. Energy Policy 2015, 79, 58–71. [Google Scholar] [CrossRef]
- Caputo, P.; Costa, G.; Ferrari, S. A supporting method for defining energy strategies in the building sector at urban scale. Energy Policy 2013, 55, 261–270. [Google Scholar] [CrossRef]
- IEE-EPISCOPE Project. Available online: http://episcope.eu/ (accessed on 15 June 2017).
- Arcipowska, A.; Rakušček, A.; Šijanec Zavrl, M.; Wittchen, K.B.; Kragh, J.; Altmann-Mavaddat, N.; Hulme, J.; Riley, J.; Dascalaki, E.; Balaras, C.; et al. Energy Performance Indicators for Building Stocks. First Version/Starting Point of the EPISCOPE Indicator Scheme; Institut Wohnen und Umwelt GmbH: Darmstadt, Germany, 2014. [Google Scholar]
- Corrado, V.; Ballarini, I.; Corgnati, S.P. Building Typology Brochure—Italy. Fascicolo Sulla Tipologia Edilizia Italiana. Nuova Edizione; Politecnico di Torino: Torino, Italy, 2014. (In Italian) [Google Scholar]
- ISO 52000-1. Energy Performance of Buildings—Overarching EPB Assessment—Part 1: General Framework and Procedures; International Organisation for Standardisation: Geneva, Switzerland, 2017.
- UNI/TS 11300 (Series). Energy Performance of Buildings; Ente Nazionale Italiano di Unificazione: Milano, Italy, 2016. (In Italian)
- EN ISO 13790. Energy Performance of Buildings—Calculation of Energy Use for Space Heating and Cooling; European Committee for Standardization: Brussels, Belgium, 2008.
- EN 15316 (Series). Energy Performance of Buildings—Method for Calculation of System Energy Requirements and System Efficiencies; European Committee for Standardization: Brussels, Belgium, 2017.
- Italian Republic. Decree of the Italian Ministry of Economic Development 26 June 2015—Applicazione Delle Metodologie di Calcolo Delle Prestazioni Energetiche e Definizione Delle Prescrizioni e dei Requisiti Minimi Degli Edifici. Available online: http://www.sviluppoeconomico.gov.it/images/stories/normativa/DM_requisiti_minimi.pdf (accessed on 26 July 2017). (In Italian)
- EN 15378-3. Energy Performance of Buildings—Heating and DHW Systems in Buildings—Part 3: Measured Energy Performance; European Committee for Standardization: Brussels, Belgium, 2017.
- National Institute of Statistics (ISTAT). Available online: http://www.istat.it/ (accessed on 15 June 2017).
- Piedmont Region. Observatory of the Real Estate Market (OMI). Available online: http://www.regione.piemonte.it/edilizia/osservatorio.htm (accessed on 15 June 2017).
- National Agency for New Technologies, Energy and Sustainable Economic Development (ENEA). Available online: http://www.enea.it/it/pubblicazioni (accessed on 15 June 2017).
- Ballarini, I.; Corrado, V.; Pichierri, S. Tracking the energy refurbishment processes in residential building stocks. The pilot case of Piedmont region. Energy Procedia 2015, 78, 1051–1056. [Google Scholar] [CrossRef]
- National Agency for New Technologies, Energy and Sustainable Economic Development (ENEA). Statistiche energetiche regionali 1988–2008. Piemonte; National Agency for New Technologies, Energy and Sustainable Economic Development (ENEA): Rome, Italy, 2011. (In Italian)
- Piedmont Region. Piano Energetico Ambientale Regionale. Allegato 1: I Valori di Riferimento per la Costruzione del Nuovo Piano Energetico Ambientale Regionale. Available online: http://www.regione.piemonte.it/energia/dwd/pianoEnergReg/Allegato1_doc_preliminare_def.pdf (accessed on 26 July 2017). (In Italian).
- EN 15927-6. Hygrothermal Performance of Buildings–Calculation and Presentation of Climatic Data—Part 6: Accumulated Temperature Differences (Degree-Days); European Committee for Standardization: Brussels, Belgium, 2007.
- Regional Agency for Environmental Protection (ARPA Piemonte). Climatic Data. Available online: https://www.arpa.piemonte.gov.it/rischinaturali/accesso-ai-dati/annali_meteoidrologici/annali-meteo-idro/banca-dati-meteorologica.html (accessed on 15 June 2017).
- Corrado, V.; Ballarini, I.; Paduos, S.; Primo, E.; Madonna, F. Application of dynamic numerical simulation to investigate the effects of occupant behaviour changes in retrofitted buildings. In Proceedings of the Building Simulation 2017, San Francisco, CA, USA, 7–9 August 2017. [Google Scholar]
- EN 15251. Indoor Environmental Input Parameters for Design and Assessment of Energy Performance of Buildings Addressing Indoor Air Quality, Thermal Environment, Lighting and Acoustics; European Committee for Standardization: Brussels, Belgium, 2007.
- Corrado, V.; Mechri, H.E.; Fabrizio, E. Building energy performance assessment through simplified models: Application of the ISO 13790 quasi-steady state method. In Proceedings of the Building Simulation 2007, Beijing, China, 3–6 September 2007; pp. 79–86. [Google Scholar]
- Nocera, M. Le Detrazioni Fiscali Del 55–65% Per La Riqualificazione Energetica Del Patrimonio Edilizio Esistente Nel 2013; National Agency for New Technologies, Energy and Sustainable Economic Development (ENEA): Rome, Italy, 2015. (In Italian) [Google Scholar]
Figure 1.
The Italian residential building typology developed in the IEE-TABULA Project.
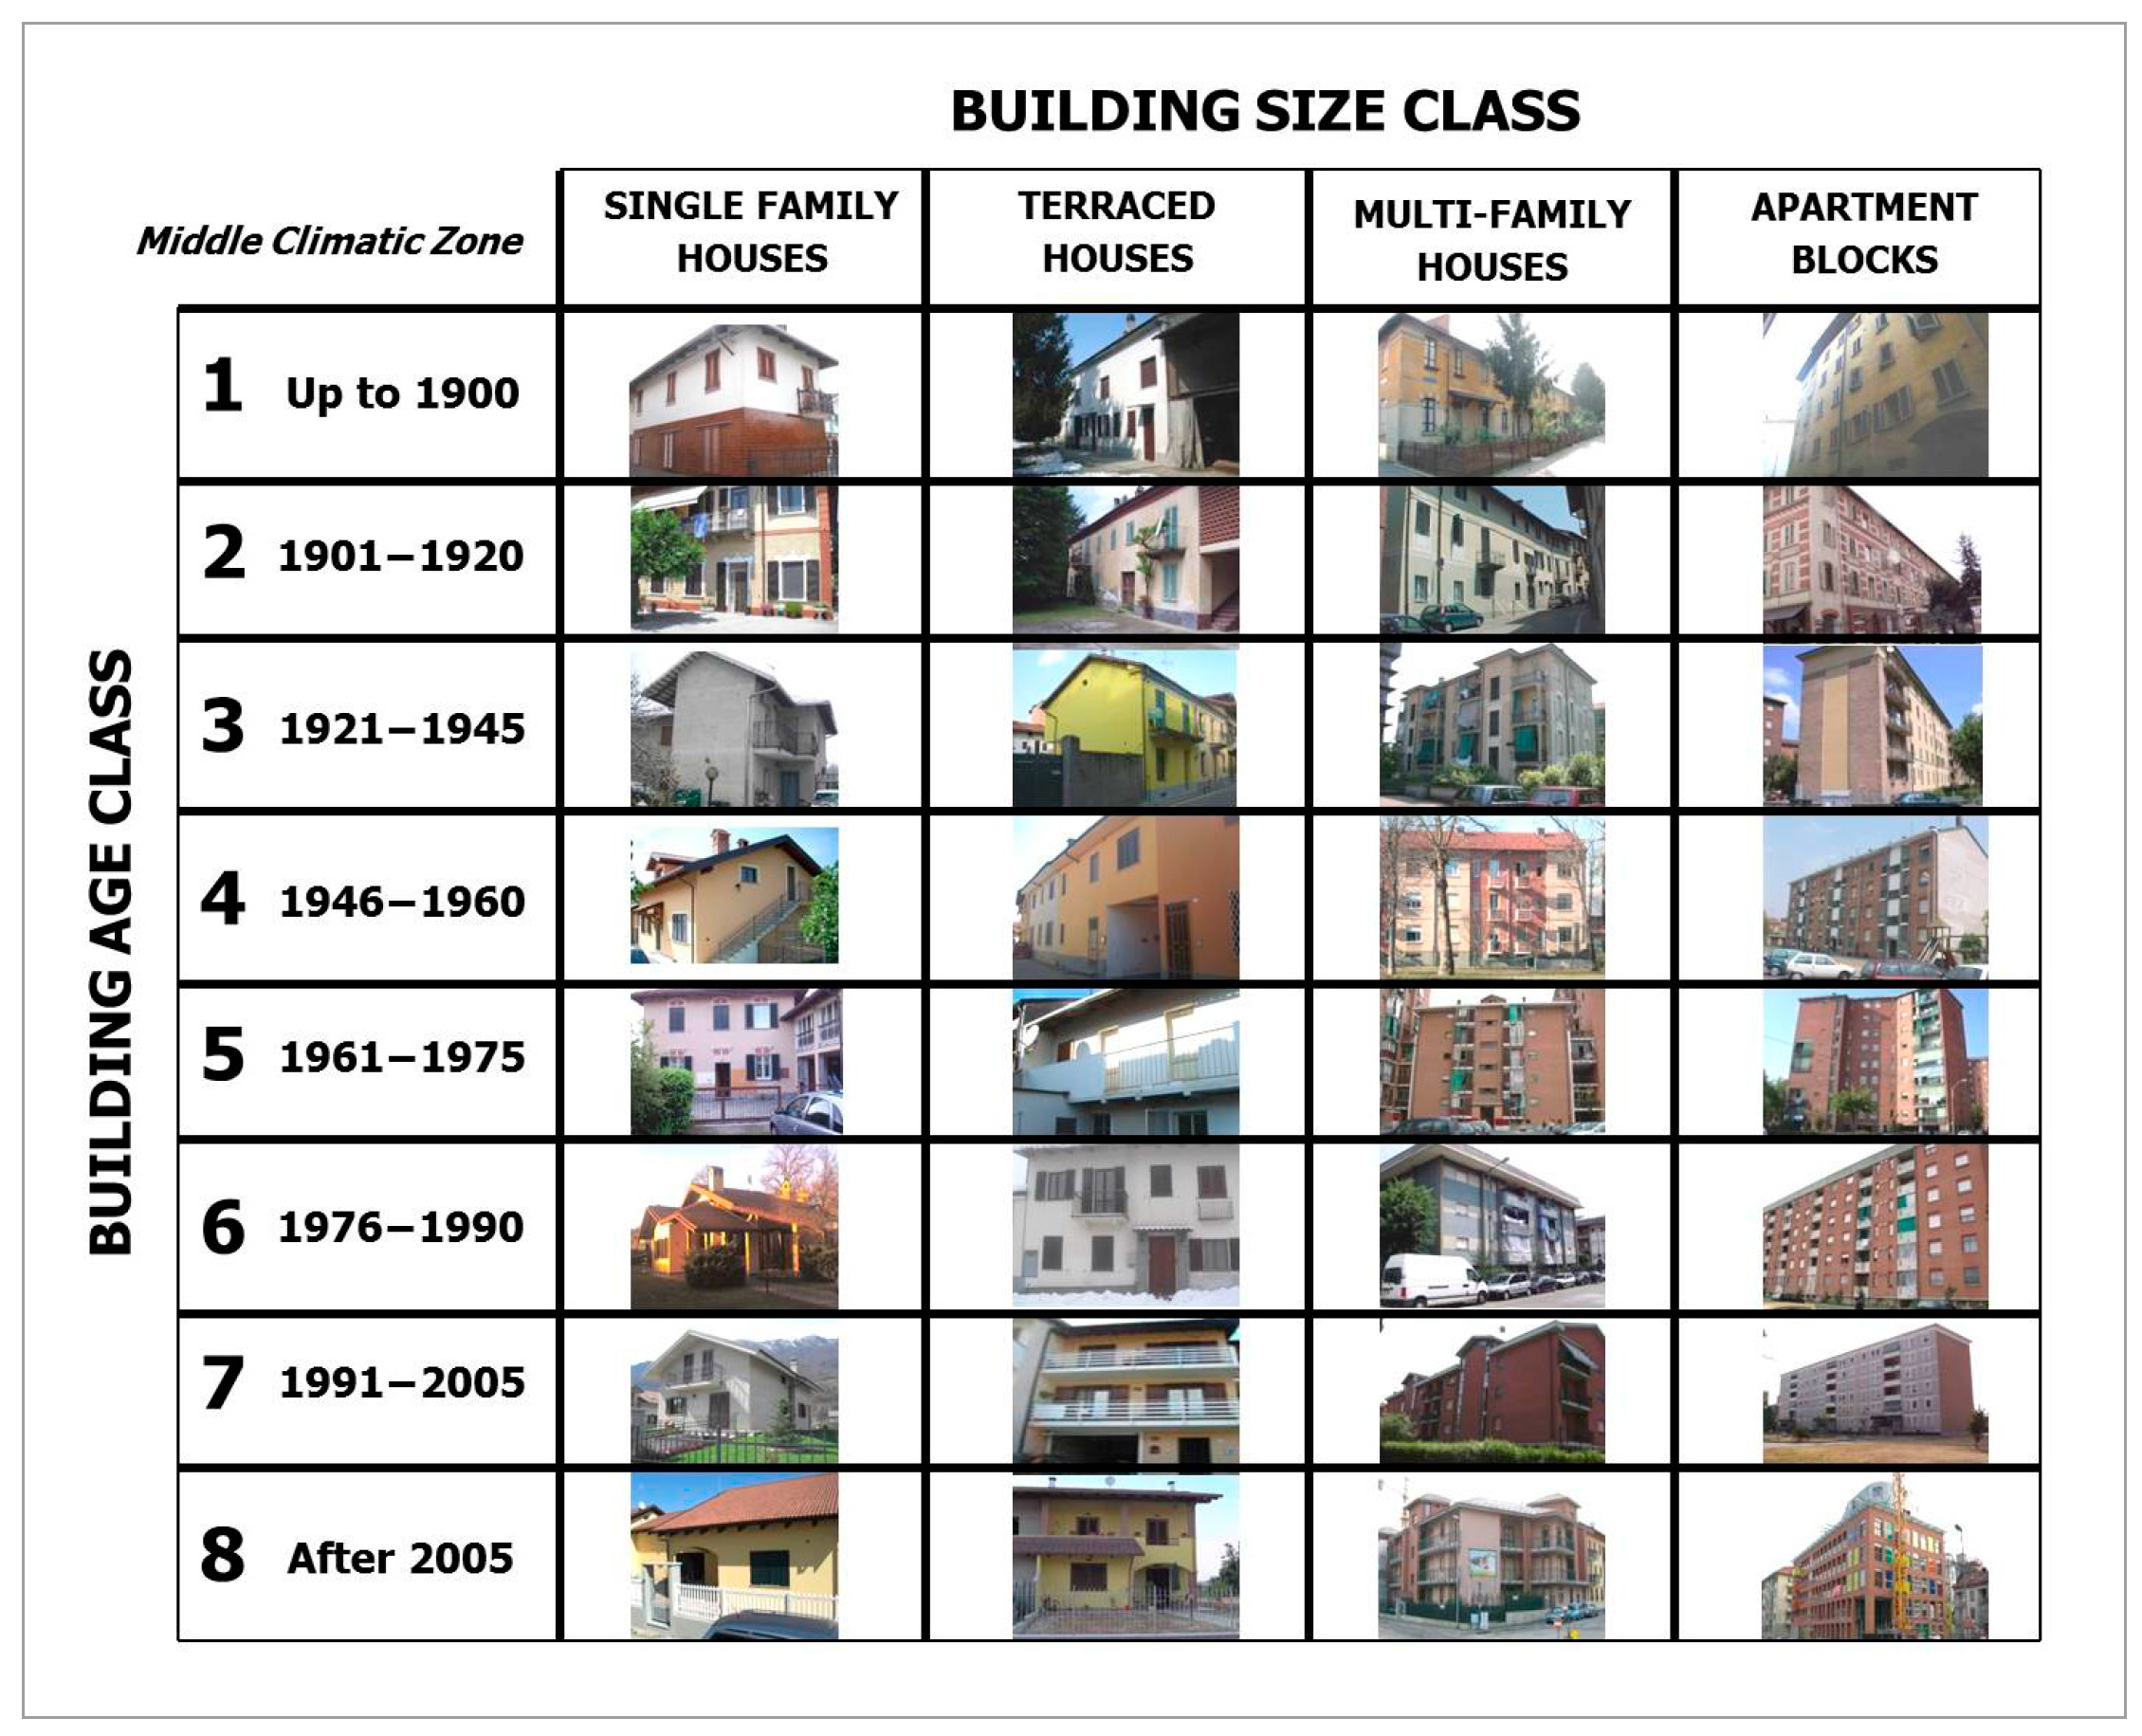
Figure 2.
Apartments in Piedmont by construction period and by number of apartments in the building (data from ISTAT, census 2011).
Figure 2.
Apartments in Piedmont by construction period and by number of apartments in the building (data from ISTAT, census 2011).

Figure 3.
Model of the Piedmont residential building stock.

Figure 4.
Share of the RBS floor area of Piedmont by performance level (number in red circle) and building size class, i.e., single-family house (SFH), multi-family house (MFH), and apartment block (AB).
Figure 4.
Share of the RBS floor area of Piedmont by performance level (number in red circle) and building size class, i.e., single-family house (SFH), multi-family house (MFH), and apartment block (AB).

Figure 5.
Normalized annual primary energy use for space heating and DHW of each reference building vs. heated net floor area (year 2012).
Figure 5.
Normalized annual primary energy use for space heating and DHW of each reference building vs. heated net floor area (year 2012).
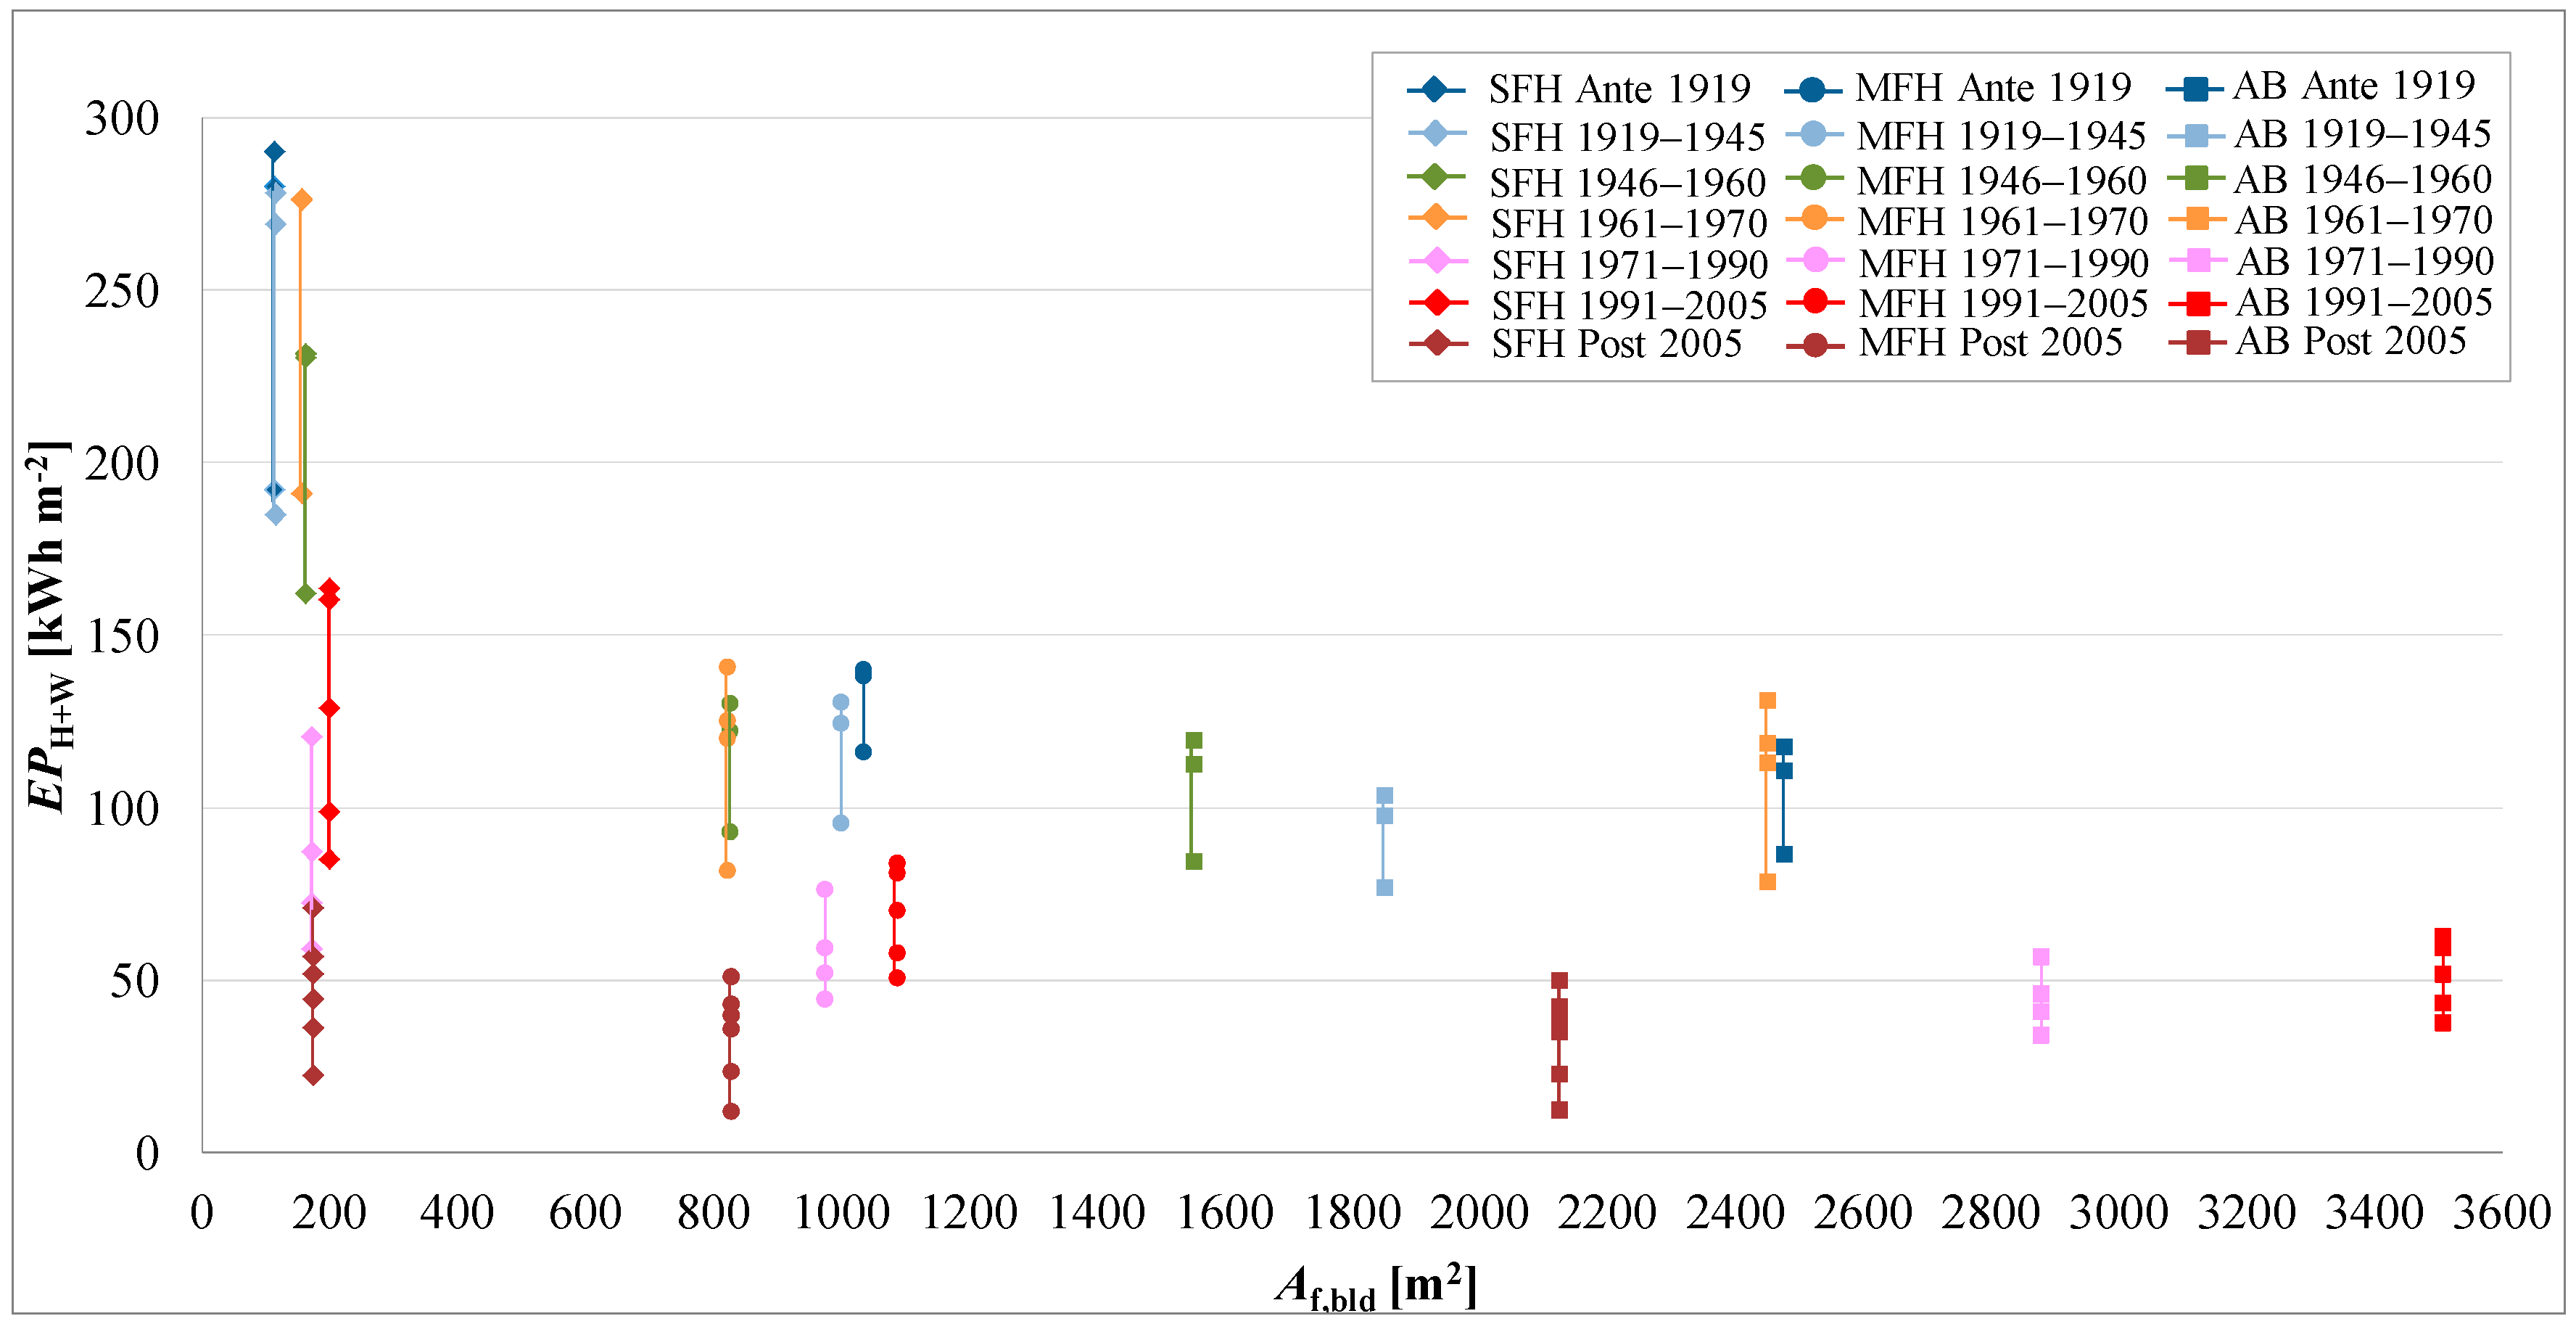
Figure 6.
Normalized annual primary energy use for space heating and DHW of each reference building vs. total heated net floor area of the RBS represented by each reference building (year 2012).
Figure 6.
Normalized annual primary energy use for space heating and DHW of each reference building vs. total heated net floor area of the RBS represented by each reference building (year 2012).

Figure 7.
Annual primary energy for space heating and DHW of the entire housing stock of Piedmont (year 2012), by building size class, construction period and performance level.
Figure 7.
Annual primary energy for space heating and DHW of the entire housing stock of Piedmont (year 2012), by building size class, construction period and performance level.

Figure 8.
Residential building stock of Piedmont: (a) comparison between the estimated and the real energy consumption through the energy signature method; and (b) correlation between the estimated and the real energy consumption of the analyzed model.
Figure 8.
Residential building stock of Piedmont: (a) comparison between the estimated and the real energy consumption through the energy signature method; and (b) correlation between the estimated and the real energy consumption of the analyzed model.


Table 1.
Monitoring indicators (MI) and model assumptions (MA) of the Piedmont housing stock.
| Parameter | Type 1 | Remark |
|---|---|---|
| Number of residential buildings by construction period | MI | Source: ISTAT, census 2011 [34] |
| Number of apartments by construction period | ||
| Residential building stock floor area by construction period and by building size | MA | Determined as described in Section 3.3 |
| Trend of new buildings | MI | Source: observatory of the real estate market (OMI) [35] |
| U-value of external walls | MI 2 | Source: Piedmont EPCs database |
| Types of windows | ||
| Types of thermal system (i.e., individual or centralized) | ||
| Types of heat generators for space heating and DHW (domestic hot water) | ||
| Energy carriers for space heating and DHW | ||
| Technologies using renewable energy sources | ||
| U-value of bottom and upper floors | MA | Source: IEE-TABULA Project [27] |
| Efficiencies of the subsystems of the technical building systems |
1 MI = monitoring indicator, MA = model assumption. 2 In each EPC, the current parameter is provided by construction period of the building unit and by built floor area.
Table 2.
Main data of the building types characterizing the RBS model of Piedmont.
| Building Type 1 | Af,bld [m2] | Af,dwl [m2] | Aenv/Vg [m−1] | Uop [W·m−2·K−1] | Uw [W·m−2·K−1] | Heat Generator Type/Heating System Type 2 | DHW System Type 3 | ηgn,H [-] | ηgn,W 4 [-] | |
|---|---|---|---|---|---|---|---|---|---|---|
| Ante 1919 | SFH.① | 115 | 115 | 0.82 | 1.520 | 5.00 | GSB/CE | CB | 0.85 | 0.83 |
| SFH.② | 1.396 | 3.00 | ||||||||
| SFH.③ | 0.979 | GCB/CE | 0.97 | 0.98 | ||||||
| MFH.① | 1035 | 65 | 0.54 | 1.520 | 5.00 | GSB/IN | CB | 0.88 | 0.84 | |
| MFH.② | 1.396 | 3.00 | ||||||||
| MFH.③ | 0.979 | GCB/IN | 0.97 | 0.98 | ||||||
| AB.① | 2477 | 62 | 0.47 | 1.520 | 5.00 | GSB/IN | CB | 0.88 | 0.84 | |
| AB.② | 1.396 | 3.00 | ||||||||
| AB.③ | 0.979 | GCB/IN | 0.97 | 0.98 | ||||||
| 1919–1945 | SFH.① | 116 | 116 | 0.81 | 1.494 | 5.00 | GSB/CE | CB | 0.85 | 0.83 |
| SFH.② | 1.377 | 3.00 | ||||||||
| SFH.③ | 0.976 | GCB/CE | 0.97 | 0.98 | ||||||
| MFH.① | 1001 | 50 | 0.51 | 1.494 | 5.00 | GSB/IN | CB | 0.88 | 0.84 | |
| MFH.② | 1.377 | 3.00 | ||||||||
| MFH.③ | 0.976 | GCB/IN | 0.97 | 0.98 | ||||||
| AB.① | 1852 | 62 | 0.46 | 1.494 | 5.00 | GSB/IN | CB | 0.88 | 0.84 | |
| AB.② | 1.377 | 3.00 | ||||||||
| AB.③ | 0.976 | GCB/IN | 0.97 | 0.98 | ||||||
| 1946–1960 | SFH.① | 162 | 162 | 0.75 | 1.364 | 5.00 | GSB/CE | CB | 0.85 | 0.83 |
| SFH.② | 1.309 | 3.00 | ||||||||
| SFH.③ | 0.950 | GCB/CE | 0.97 | 0.98 | ||||||
| MFH.① | 827 | 69 | 0.51 | 1.364 | 5.00 | GSB/CE | SPI | 0.85 | 0.80 (0.75) | |
| MFH.② | 1.309 | 3.00 | ||||||||
| MFH.③ | 0.950 | GCB/CE | 0.97 | 0.90 (0.75) | ||||||
| AB.① | 1552 | 65 | 0.46 | 1.364 | 5.00 | GSB/CE | SPI | 0.85 | 0.80 (0.75) | |
| AB.② | 1.309 | 3.00 | ||||||||
| AB.③ | 0.950 | GCB/CE | 0.97 | 0.90 (0.75) | ||||||
| 1961–1970 | SFH.① | 156 | 156 | 0.73 | 1.325 | 5.00 | GSB/CE | CB | 0.85 | 0.83 |
| SFH.② | 1.285 | 3.00 | ||||||||
| SFH.③ | DH/CE | 0.99 | 0.88 | |||||||
| SFH.④ | 0.878 | GCB/CE | 0.97 | 0.98 | ||||||
| MFH.① | 822 | 82 | 0.54 | 1.325 | 5.00 | GSB/CE | SPI | 0.85 | 0.80 (0.75) | |
| MFH.② | 1.285 | 3.00 | ||||||||
| MFH.③ | DH/CE | 0.99 | ||||||||
| MFH.④ | 0.878 | GCB/CE | 0.97 | 0.90 (0.75) | ||||||
| AB.① | 2450 | 61 | 0.46 | 1.325 | 5.00 | GSB/CE | SPI | 0.85 | 0.80 (0.75) | |
| AB.② | 1.285 | 3.00 | ||||||||
| AB.③ | DH/CE | 0.99 | ||||||||
| AB.④ | 0.878 | GCB/CE | 0.97 | 0.90 (0.75) | ||||||
| 1971–1990 | SFH.① | 199 | 199 | 0.72 | 1.337 | 5.00 | GSB/CE | CB | 0.85 | 0.83 |
| SFH.② | 1.275 | 3.00 | ||||||||
| SFH.③ | 0.931 | |||||||||
| SFH.④ | 0.727 | GCB/CE | 0.97 | 0.98 | ||||||
| SFH.⑤ | 0.534 | 2.00 | 0.98 | 0.985 | ||||||
| MFH.① | 1088 | 91 | 0.48 | 1.337 | 5.00 | GSB/IN | CB | 0.88 | 0.84 | |
| MFH.② | 1.275 | 3.00 | ||||||||
| MFH.③ | 0.931 | |||||||||
| MFH.④ | 0.727 | GCB/IN | 0.97 | 0.98 | ||||||
| MFH.⑤ | 0.534 | 2.00 | 0.98 | 0.985 | ||||||
| AB.① | 3506 | 73 | 0.37 | 1.337 | 5.00 | GSB/IN | CB | 0.88 | 0.84 | |
| AB.② | 1.275 | 3.00 | ||||||||
| AB.③ | 0.931 | |||||||||
| AB.④ | 0.727 | GCB/IN | 0.97 | 0.98 | ||||||
| AB.⑤ | 0.534 | 2.00 | 0.98 | 0.985 | ||||||
| 1991–2005 | SFH.① | 172 | 172 | 0.73 | 1.274 | 3.00 | GSB/CE | CB | 0.89 | 0.85 |
| SFH.② | 0.784 | |||||||||
| SFH.③ | 0.533 | |||||||||
| SFH.④ | 0.467 | 2.00 | GCB/CE | 0.98 | 0.985 | |||||
| MFH.① | 975 | 65 | 0.54 | 1.274 | 3.00 | GSB/IN | CB | 0.88 | 0.84 | |
| MFH.② | 0.784 | |||||||||
| MFH.③ | 0.533 | |||||||||
| MFH.④ | 0.467 | 2.00 | GCB/IN | 0.98 | 0.985 | |||||
| AB.① | 2879 | 80 | 0.43 | 1.274 | 3.00 | GSB/IN | CB | 0.88 | 0.84 | |
| AB.② | 0.784 | |||||||||
| AB.③ | 0.533 | |||||||||
| AB.④ | 0.467 | 2.00 | GCB/IN | 0.98 | 0.985 | |||||
| Post 2005 | SFH.① | 174 | 174 | 0.72 | 0.762 | 3.00 | GSB/CE | CB | 0.92 | 0.91 |
| SFH.② | 0.495 | |||||||||
| SFH.③ | 0.445 | 2.00 | ||||||||
| SFH.④ | 0.348 | GCB/CE | 0.98 | 0.985 | ||||||
| SFH.⑤ | 0.290 | 1.50 | 0.99 | 0.99 | ||||||
| SFH.⑥ | 0.212 | EHP/CE | 2.04 (COP) | 2.46 (COP) | ||||||
| MFH.① | 829 | 64 | 0.54 | 0.762 | 3.00 | GSB/CE | CB | 0.94 | 0.91 | |
| MFH.② | 0.495 | |||||||||
| MFH.③ | 0.445 | 2.00 | ||||||||
| MFH.④ | 0.348 | GCB/CE | 0.98 | 0.985 | ||||||
| MFH.⑤ | 0.290 | 1.50 | 0.99 | 0.99 | ||||||
| MFH.⑥ | 0.212 | EHP/CE | 2.14 (COP) | 2.55 (COP) | ||||||
| AB.① | 2125 | 69 | 0.40 | 0.762 | 3.00 | GSB/CE | CB | 0.94 | 0.91 | |
| AB.② | 0.495 | |||||||||
| AB.③ | 0.445 | 2.00 | ||||||||
| AB.④ | 0.348 | GCB/CE | 0.98 | 0.985 | ||||||
| AB.⑤ | 0.290 | 1.50 | 0.99 | 0.99 | ||||||
| AB.⑥ | 0.212 | EHP/CE | 2.14 (COP) | 2.55 (COP) | ||||||
1 The number in the circle represents the performance level. 2 GSB = gas standard boiler; GCB = gas condensing boiler; DH = district heating; EHP = electric heat pump/CE = centralized; IN = individual (per apartment). 3 CB = combined for heating and DHW; SPI = separated and individual for DHW. 4 In the case of separated and individual system for DHW, the efficiency values (ηgn,W) refer both to gas water heaters and to electric water heaters. The latter is in parentheses; COP = coefficient of performance.
Table 3.
Annual energy consumption of fossil fuels for heating and DHW of the Piedmont RBS.
| Year | HDD [°Cd] | Edel,H+W,ff,R [TWh] |
|---|---|---|
| 1990 | 2374 | 23.60 |
| 1995 | 2367 | 23.28 |
| 2000 | 2316 | 22.62 |
| 2001 | 2361 | 23.48 |
| 2002 | 2274 | 21.90 |
| 2004 | 2317 | 22.73 |
| 2005 | 2414 | 24.29 |
| 2006 | 2239 | 22.49 |
| 2008 | 2155 | 20.91 |
| 2009 | 2456 | 24.56 |
| 2010 | 2508 | 25.65 |
| 2011 | 2373 | 23.72 |
© 2017 by the authors. Licensee MDPI, Basel, Switzerland. This article is an open access article distributed under the terms and conditions of the Creative Commons Attribution (CC BY) license (http://creativecommons.org/licenses/by/4.0/).
Share and Cite
MDPI and ACS Style
Ballarini, I.; Corrado, V. A New Methodology for Assessing the Energy Consumption of Building Stocks. Energies 2017, 10, 1102. https://doi.org/10.3390/en10081102
AMA Style
Ballarini I, Corrado V. A New Methodology for Assessing the Energy Consumption of Building Stocks. Energies. 2017; 10(8):1102. https://doi.org/10.3390/en10081102
Chicago/Turabian StyleBallarini, Ilaria, and Vincenzo Corrado. 2017. "A New Methodology for Assessing the Energy Consumption of Building Stocks" Energies 10, no. 8: 1102. https://doi.org/10.3390/en10081102
Note that from the first issue of 2016, this journal uses article numbers instead of page numbers. See further details here.