The Coupled Effect of Fines Mobilization and Salt Precipitation on CO2 Injectivity

Department of Petroleum Engineering, University of Stavanger, 4036 Stavanger, Norway
*
Author to whom correspondence should be addressed.
Energies 2017, 10(8), 1125; https://doi.org/10.3390/en10081125
Submission received: 6 June 2017
/
Revised: 20 July 2017
/
Accepted: 26 July 2017
/
Published: 1 August 2017
Abstract
:In terms of storage capacity and containment efficiency, deep saline aquifers are among the best candidates for CO2 storage. However, salt precipitation in the wellbore vicinity and fines mobilization ensued from in situ mineral dissolution could impair CO2 injectivity and reduce the quality and capacity of deep saline reservoirs for CO2 storage. The mechanisms of salt precipitation and its impact on CO2 injectivity have been studied, but the effects of fines mobilization have not been properly investigated. We conducted core-flood experiments and theoretical studies to investigate the impact of fines mobilization on CO2 injectivity, the relative contribution of fines mobilization and salt precipitation to injectivity impairment, and the coupled effect of salt precipitation and fines mobilization. We found that, mineral dissolution and transport effects could induce up to about 26% injectivity impairment. The findings also suggest that about 0.3 wt % particle concentration in the pore fluid could induce over twofold injectivity impairment compared to about 10 wt % of total dissolved salt in the formation water. Salt precipitation was also found to compound injectivity impairment induced by fines mobilization. The present study provides important insight, and could serve as a foundation to inspire further experimental and theoretical investigation into the effects of mineral dissolution and fines mobilization in the context of CO2 injectivity.
1. Introduction
CO2 Capture, Utilization, and Storage (CCUS) has potential to reduce the concentration of CO2 in the atmosphere and prevent climate change. The storage potential of a geological CCUS candidate is defined by its storage capacity and well injectivity [1]. Lombard et al. [2] classified CO2 injectivity impairment mechanisms into three main groups: transport effects such as fines mobilization, geochemical effects such as mineral dissolution, and salt precipitation and geomechanical processes. Among these injectivity impairment challenges, salt precipitation effects have attracted the highest attention over the past years [3,4,5,6,7]. The effect of fines mobilization on CO2 injectivity has not been given its deserved attention, probably because of available evidence of massive injectivity impairment induced by salt precipitation.
Salt precipitation was already known to impair well injectivity in natural gas production. Kleinitz et al. [8] reported field experience of severe halite scaling in the injection region during natural gas production in Northern German gas reservoirs. A dramatic reduction in the production rate due to complete plugging of the flow path by precipitated salts caused the well to be shut down. Similar field experiences have been reported during gas production, injection, and storage [9,10,11]. In the context of field CO2 injection experience, Baumann et al. [12] and Grude at al. [13] have reported convincing evidence of salt precipitation effects in the Ketzin pilot reservoir and the Snøhvit field, respectively. Permeability impairment between 13% and 83% and porosity reduction ranging from 2% to 15% have been reported from laboratory core-flood experiments [5,14,15,16,17,18]. These experimental findings have also been confirmed by theoretical and numerical simulations [19,20,21,22].
Miri and Hellevang [3] identified the processes leading to salt precipitation as: (1) immiscible two-phase CO2-brine displacement; (2) vaporization of brine into the flowing CO2 stream; (3) capillary back-flow of brine toward the inlet; (4) diffusion of dissolved salt in the porewater; (5) gravity override of CO2; and (6) salt self-enhancing. While numerical experiments by Roels et al. [23] suggested that precipitated salt accumulates far from the wellbore, several research works [6,14,24,25] show that precipitated salt accumulates near the wellbore.
Pruess et al. [25] suggested that a preflush of the injection region with freshwater could reduce salt precipitation. However, Kleinitz et al. [8] have shown that freshwater injection could not mitigate salt precipitation if the flow area is completely plugged by solid salt. Sokama-Neuyam and Ursin [18] reported that freshwater injection could induce other injectivity impairment challenges such as clay swelling and the release of fine particles in sandstone rocks if the brine salinity is below a certain critical value. They proposed alternate injection of CO2 and diluent low salinity brine.
Under typical storage conditions, CO2 could dissolve in formation brine at the CO2–brine interface to form carbonic acid and then bicarbonates according to the following equations:
The bicarbonates could react with cations in the rock and formation water to form stable carbonates, as shown in the following equations [26,27,28]:
The carbonates in solution (, , etc.) could aggregate into tiny particles in the bulk liquid or form a scale on the pore walls. If these mineral grains are mobilized along the flow stream, CO2 injectivity could be severely impaired through plugging of the reservoir rock.
The mechanisms of in situ fines migration and the impact of particle transport on the petrophysical properties of reservoir rocks have been well-researched. Khilar and Fogler [29] presented the mechanisms of colloidal and hydrodynamic induced release of fine particles in porous media. Muecke [30] investigated parameters controlling the movement of fines particles within the pore spaces. They identified the pH and salinity of the formation brine, flow rate, and temperature as some of the underlying parameters. Khilar and Fogler [31] reported that there exists a critical salt concentration below which the pore fluid could weaken the Van der Waal’s forces holding fine particles to the pore wall. Gruesbeck and Collins [32] investigated the effect of hydrodynamic forces on the release and transport of fines. They identified a minimum interstitial velocity for fines entrainment. The effect of two-phase flow and rock wettability on fines entrainment has been experimentally investigated by Sarkar and Sharma [33]. They found that the wettability of the core could affect the extent and rate of permeability impairment induced by migratory fines. Analytical models have been developed by Sharma and Yortsos [34] to investigate the mechanisms of size exclusion and quantify the effect of particle entrapment on rock permeability. A thorough analysis of formation damage induced by migratory fines can be found in Civan [35].
During particle transport in natural porous media, the entrapment or piping of fines depends on the jamming ratio (particle size/pore size) [29]. According to Aji Kaiser [36], only particles with a jamming ratio greater than 1.0 could be entrapped through size exclusion. Depending on the particle size, the suspending medium, hydrodynamic properties, and petrophysical properties of the reservoir rock, the pores could also be plugged through pore bridging, surface deposition, and multi-particle blocking.
We conducted laboratory core-flood experiments with sandstone core samples to investigate the effect of salt precipitation and fines mobilization on CO2 injectivity. We then attempted to model the coupled effects of salt precipitation and fines mobilization using a tractable bundle-of-tubes model. The objective is to study the underlying fundamental mechanisms of fines migration and salt precipitation in sandstone rocks in the context of CO2 injection.
2. Materials and Methods
The experimental work is in two parts. First, preliminary experiments were conducted to investigate the effect of mineral dissolution on injectivity impairment. Bentheimer core, containing high amounts of clay minerals (2.68%) and feldspars (4.86%), was flooded with carbonated water at 80 bar and 65 °C. Under these conditions, bicarbonates generated from carbonated water could attack and wear out clay and feldspar minerals into the pore fluid. The suspended particles could then be lifted by the flowing fluid into the pore channels, where they could plug the rock and affect injectivity.
Second, the quantitative effect of fines mobilization on CO2 injectivity was investigated. To control the concentration of particles in the pore fluid, the core was saturated with mono-disperse colloid solution prior to CO2 injection. By optimizing the contents of the pore fluid, we attempted to compare the effects of fines mobilization to the impact of salt precipitation under linear flow conditions. A theoretical model was also developed to study the coupled effect of salt precipitation and fines mobilization.
2.1. Materials
2.1.1. Rocks
Outcrop cylindrical sandstone core samples were used in the experiments. The characteristics of the rock samples are shown in Table 1. Each type of core sample was drilled from the same block, and with the exception of the Bandera cores, all of the samples can be considered homogeneous with respect to permeability. The cores were 20 cm long with a diameter of 3.81 cm.
According to measurements conducted by Peksa et al. [37], Bentheimer sandstone rock is composed mainly of quartz (91.70 wt %), feldspars (4.86 wt %), clay minerals (2.68 wt %), and pyrite and iron oxides (0.17 wt %). The rock has an average pore body diameter of 0.014 mm and pore throat diameter of 0.012 mm [37]. With such open pore channels, dissolved rock particles could pipe through the rock to provide evidence of mineral dissolution. That was another reason for selecting this core for the mineral dissolution tests, apart from its clay-rich contents.
The Kipton Berea sandstone rock used in this study is composed mainly of Silica (86.47 wt %), Alumina (7.31 wt %), and Oxides (Iron Oxide, Titanium Oxide, Calcium Oxide, and Magnesium oxide) [38]. The Berea rock has pore throat sizes between 0.5 and 5.0 µm, and pore body sizes ranging from 5.0 to 50 µm [39]. Berea cores were used for the particle injection experiments because of their smaller range of pore sizes, which makes them capable of trapping released minerals during the displacement of the pore fluid. The Bandera core was mainly used to investigate the sensitivity of initial rock permeability.
2.1.2. Formation Water
We used synthetic formation water (FW) with salinity of about 105.5 g/L (NaCl, 77.4 g/L; CaCl2·2H2O, 21.75 g/L; MgCl2·6H2O, 3.56g/L; SrCl2·6H2O, 2.25 g/L; Na2SO4, 0.13 g/L; KCl 0.42 g/L) [40]. This FW is representative of typical North Sea reservoir brine. The FW was used in salt precipitation investigations as the initial saturating fluid. In the fines mobilization experiments, FW was used to prepare carbonated water and to measure the permeability of the core, before and after mineral dissolution and fines mobilization. NaCl brines (HS (High Salinity), 150 g/L and LS (Low Salinity), 75 g/L) were used in the modelling experiments to investigate the coupled effects of fines mobilization and salt precipitation.
2.1.3. Carbonated Water
Carbonated water was used to generate fine particles in the rock. Figure 1 shows a schematic of the setup used to prepare carbonated water. CO2 is soluble in brine, with solubility strongly dependent on temperature, pressure, and brine salinity. A tight piston cell was filled with about 1000 mL of FW. CO2 was then injected into the brine at a constant pressure of 80 bar and 20 °C for about 48 h. The injection pressure was kept at 80 bar until the pump delivered insignificant volume of CO2 (<0.0001 mL/min) into the brine, signifying complete saturation. Experimental data reported by Portier and Rochelle [41] suggests CO2 solubility in Utsira formation brine with similar composition as the FW used in the current experiment, under the current working conditions is in the range of 1.26–1.36 mol Kg−1 H2O. The connected pressure gauge was used to monitor fluid pressure in the piston cell.
2.1.4. CO2
Liquefied CO2 with purity percentage of about 99.7 was used as the injected gas. Liquid CO2 was injected to measure injectivity impairments associated with salt precipitation and fines migration because the precipitated salts are insoluble in this fluid. To obtain liquid CO2, the gas was injected at 80 bar and 26 °C. Supercritical CO2, which was used as the displacing and drying fluid, was injected at 80 bar and 50 °C.
2.1.5. Colloid Suspension
Mono-disperse colloid suspensions prepared from concentrated, fumed alumina latex particles stock solution were used to investigate the effect of fines migration on CO2 injectivity. Alumina was selected for this study because of its high resistance to wear and its stability in CO2, and because they are oil wet particles with minimized attachment to the pore walls.
The particles were stabilized in low salinity brine at near-neutral pH conditions to prevent particle aggregation. A 5 g/L (0.086 mol/L) NaCl brine was used to dilute the concentrated colloid stock solution into mono-disperse colloidal suspensions. Below a critical salt concentration (CSC) of about 0.071 mol/L, NaCl brine could detach formation fine particles from the pore walls into the flowing stream [42]. A brine concentration of 0.086 mol/L was used, because it is adequately above the CSC for fines detachment and low enough to prevent salt precipitation through brine vaporization. The characteristics of the colloid stock solution are presented in Table 2. Specific concentrations of mono-disperse suspensions, prepared from the stock solution were used in various experiments.
2.2. Experimental Setup
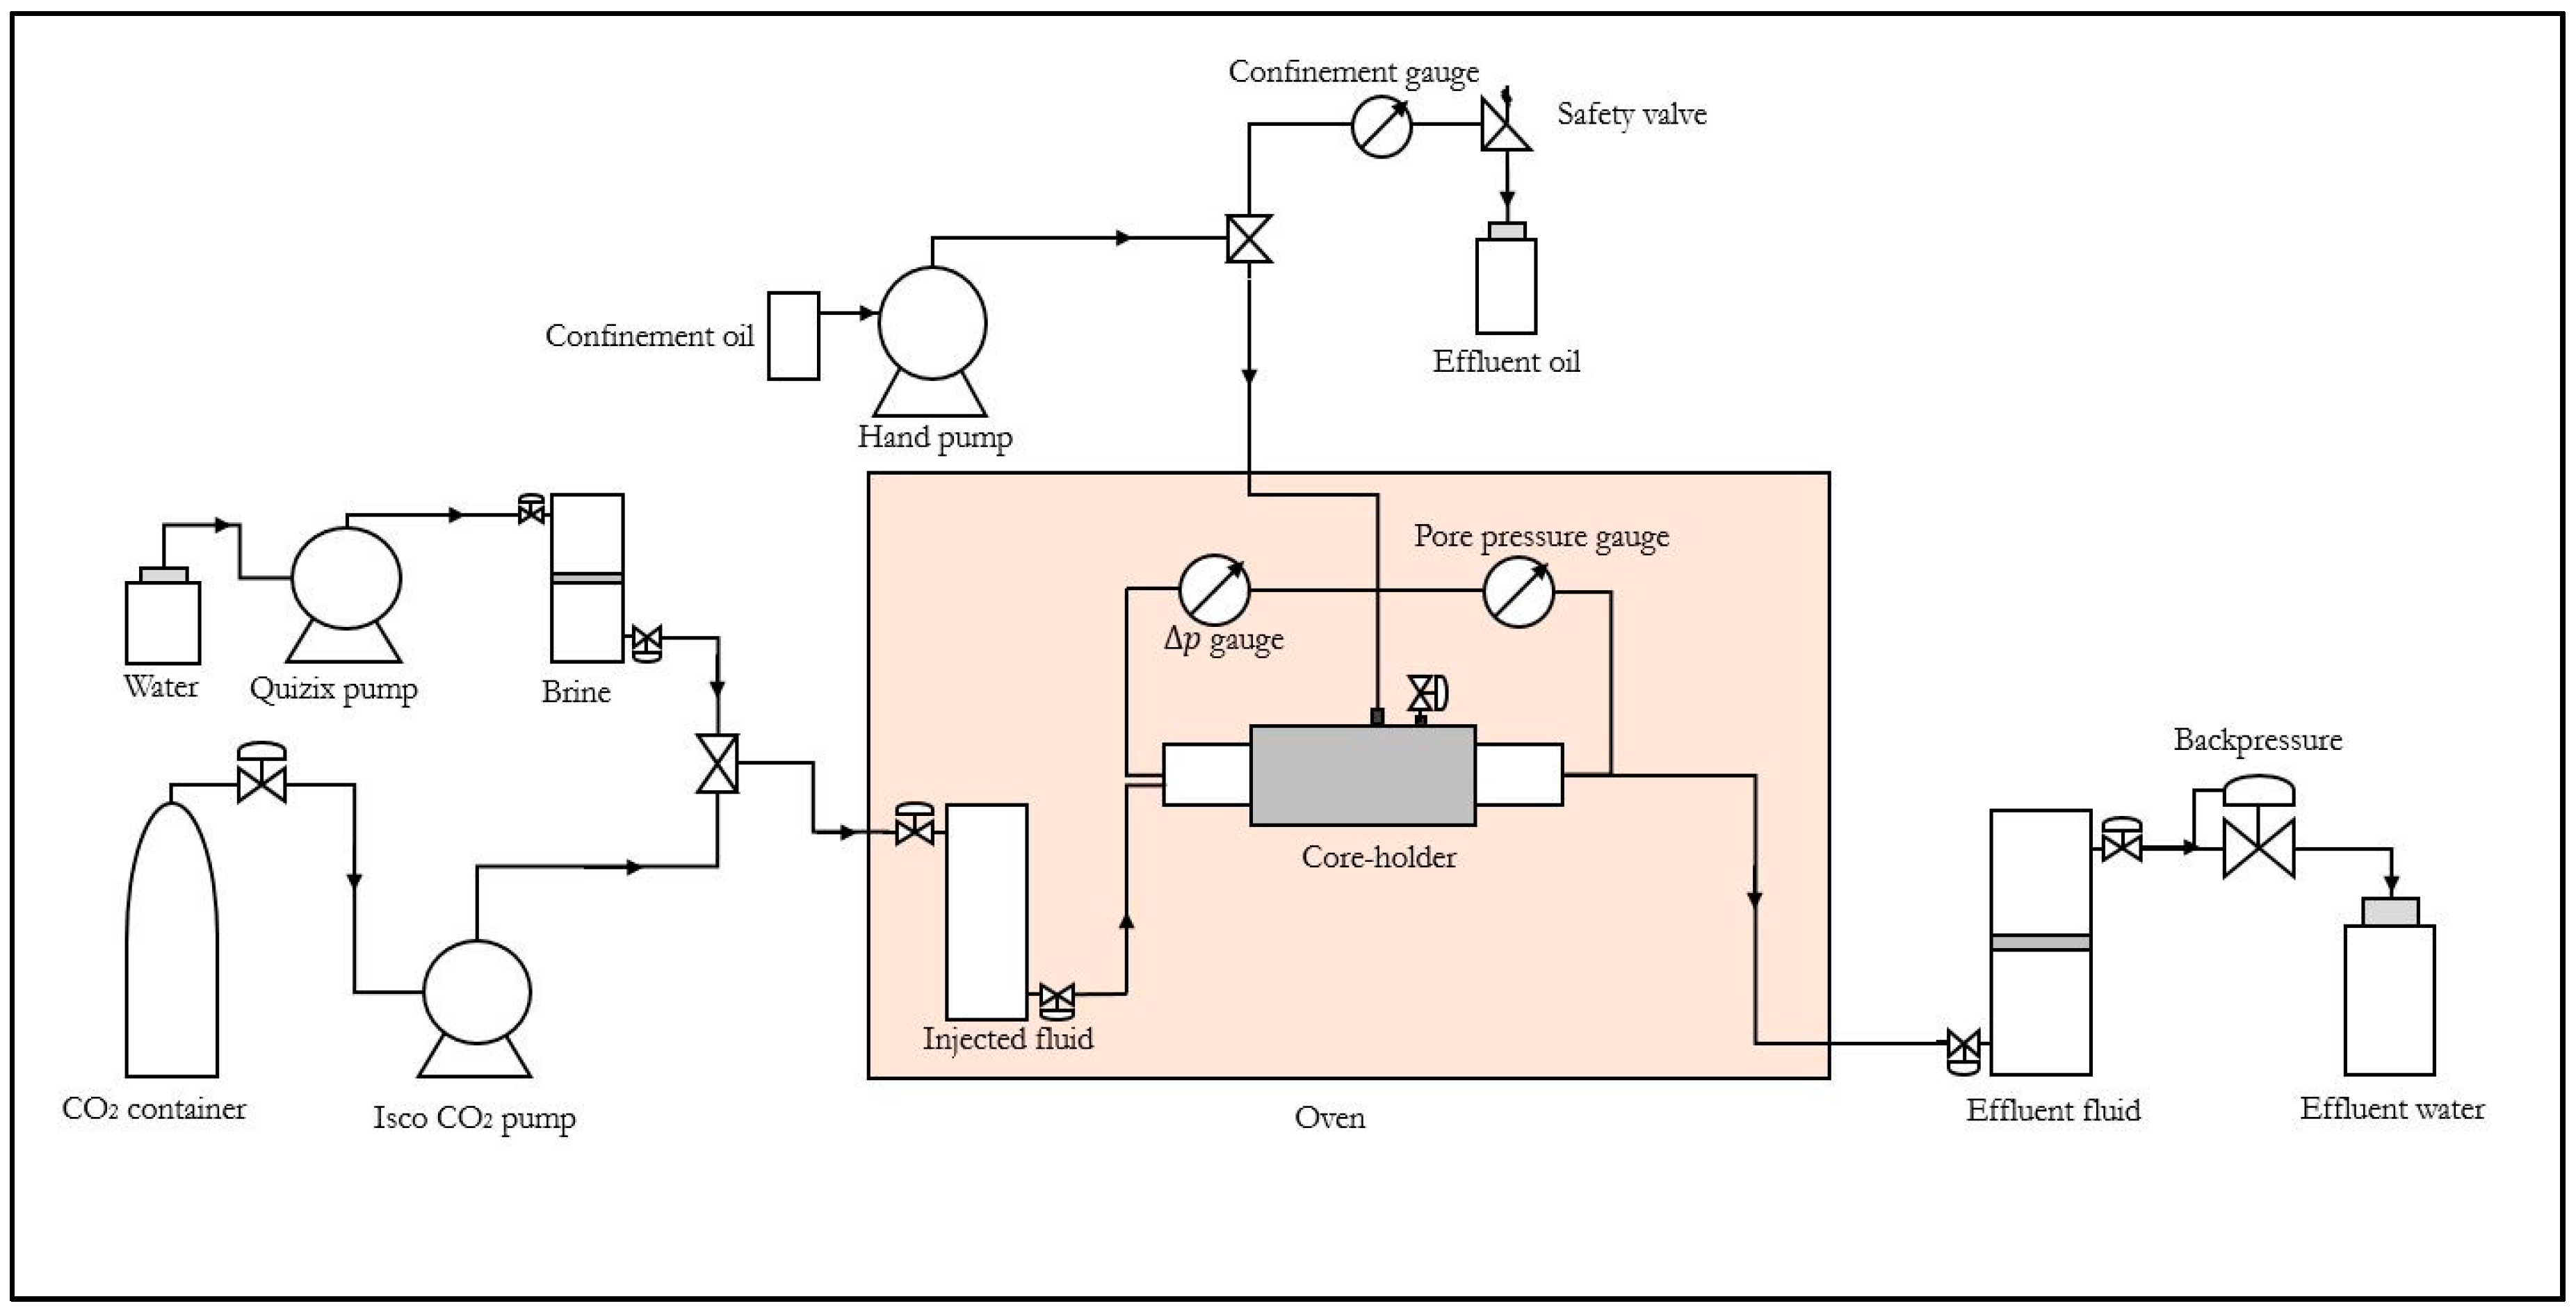
A schematic of the core flooding apparatus used in the tests is shown in Figure 2. Prior to the test, the core was loaded in a horizontal hassler core-holder. The Quizix pump was used to deliver fluid through the connected piston cell into the core inlet. Either brine or carbonated water was injected. The Isco CO2 pump was used to deliver CO2. The injected fluid was positioned in the oven to secure a preset temperature. A differential pressure gauge and a pressure transducer were used to monitor the pressure drop across the core and record the absolute pore pressure, respectively. A backpressure of 80 bar was set at the outlet during Carbonated water and CO2 injection, and the effluent fluid was safely collected in a piston cell for analysis and safe disposal.
2.3. Methods
2.3.1. Experimental Procedure
The clean core sample was first dried at 65 °C for about 24 h. The core was then wrapped in shrinking Teflon sleeve to prevent leakage, before it was inserted into the rubber sleeve and horizontally mounted in the core holder. A confining pressure of about 150 bar was applied in the annular space between the core and the core holder during the supercritical CO2 injection. The confining pressure was reduced to 20 bar during the injection of FW. The experimental procedure consists of the following general steps:
- The initial permeability () of the core was measured.
- The core was saturated with brine and flooded with either carbonated water or supercritical CO2 to generate fines or dry the core, respectively.
- The experiment was stopped and the core was cooled for all trapped CO2 to boil out.
- The permeability of the core after mineral impairment was measured.
In Step 1 and Step 4, either liquid CO2 or FW was used to measure the permeability depending on the solubility of the precipitated minerals in the fluid. Details of each experimental process are presented with the results.
2.3.2. Injectivity Impairment Quantification
Fluid injectivity, , is defined as the ratio of volumetric injection flow rate, , to the pressure drop, . Assuming the core has constant absolute permeability, and before and after it has been exposed to impairment, respectively, and that the viscosity of the fluid used in the measurement is constant, the injectivity before and after permeability impairment can be expressed from Darcy’s law as:
In Equations (1) and (2), . is a constant defined as , for constants and . If the measuring fluid is injected at a constant rate during injectivity measurements (), we can define a Relative Injectivity Change (RIC) index, , as:
Substituting Equations (1) and (2) into (3) yields:
The plugging of the pores by precipitated minerals would reduce the flow area and increase the pressure drop across the core, . Thus, in Equation (4), and after permeability impairment. Consequently, a positive value indicates injectivity impairment. In the present work, was expressed as a percentage. Although is a rather linear injectivity measurement technique, it provides an indirect method for estimating injectivity impairment independently of the chemical properties of the pore-plugging material.
2.3.3 Uncertainty in Experimental Data
Particle transport in natural porous media is a highly uncertain process. The particles are displaced in a highly random flow path into a very tortuous pore network distribution. Therefore, the repeatability of particle flow experiments in even homogeneous natural rocks is expected to be low. However, an attempt was made to quantify and minimize the uncertainty in the measurements.
The measured injectivity data , was reported as:
In Equation (5), is calculated from the mean value of the stabilized liquid CO2 or brine across the core before and after supercritical CO2 injection, mineral precipitation, and particle entrapment, and is the estimated uncertainty in . Initial and final pressure drop measurements are recorded when the liquid CO2 or brine pressure drop across the core stabilizes. and are calculated as:
In Equations (6) and (7), is the total number of recorded data points, and and are the maximum and minimum values, respectively.
The uncertainty in injectivity was dependent upon the differential pressure gauge, injection flow rate, and the type of mineral plugging. A very sensitive differential pressure gauge, which measures to an accuracy of about 0.009%, was used. We found that a low injection flow rate also minimized the uncertainty. Similarly, colloidal entrapment induced higher uncertainty compared to salt precipitation. An injection flow rate of about 5 mL/min was found to be the optimal liquid CO2 injection rate. A maximum uncertainty of about 5% was then applied across the board.
3. Theoretical Modelling
In this section, we present a tractable bundle-of-tubes model in an attempt to model the coupled effect of fines mobilization and salt precipitation on CO2 injectivity. The objective is to develop a model capable of capturing the main fundamental physical mechanisms of fines mobilization and salt precipitation without complicating the process with details.
3.1. Background and Assumptions
The cylindrical core, with radius and length , was reconstructed into a bundle of parallel cylindrical capillary tubes with varying radii () interspersed between non-porous mass (grey regions) representing the rock matrix (Figure 3). The model is sectioned into a dry-out zone (), where salt has been precipitated into the tubes and the uncontaminated zone (), representing the part of the core which has not been dried by supercritical CO2.
In the dry-out zone, we assume that solid salt accumulates on the walls of the pore constriction (black shades in Figure 3). We also assume that the accumulated salt in the dry-out region would reduce the cross-flow area by , for total number of capillary tubes in the porous medium.
A dimensionless dry-out length, , defined as the ratio of the length of the dry-out region to the total length of the core, was introduced to track the development of the dry-out zone and characterize the distribution of precipitated salt.
In the present study, we investigate fines entrapment induced by size exclusion of particles. Fines plugging caused by pore bridging, multiparticle blocking, and surface deposition have not been included in the model.
3.2. Model Formulation
For a bundle of parallel non-communicating capillary tubes with varying tube radii, and thickness of deposited salts, , the total fluid flow rate can be modelled with the Hagen–Poiseuille equation as:
In Equation (8), is the fluid viscosity, and is the overall pressure gradient across the bundle of capillary tubes. For linear flow through a core of radius and length , the fluid flow rate is also defined by Darcy’s Law:
In Equation (9), is the absolute permeability of the core, and is the cross-sectional flow area. Combining Equation (8) and Equation (9), the permeability of the core can be expressed as:
In Equation (10), the permeability depends strongly on the number of open capillary tubes, , and the thickness of precipitated salts deposited in the tubes, . Salt precipitation will impair the permeability by reducing . On the other hand, the entrapment of fine particles will plug the capillary tubes with jamming ratio greater than 1.0, consequently impairing permeability by reducing the number of open capillary tubes, . Thus, by controlling these factors, the coupled effect of fines mobilization and salt precipitation could be investigated.
The initial permeability of the core can be estimated by setting . The permeability ratio, , can therefore be calculated and the relative injectivity change index, , computed from Equation (4).
3.3. Number of Capillary Tubes and Distribution of Precipitated Salt
The pore volume of the core, , is assumed to be approximately equal to the internal volume of all the capillary tubes.
In Equation (11), is the average of the square of the tube radii. From the definition of porosity and Equation (11), the total number of capillary tubes can be derived as:
In Equation (12), we have used the relation . Equation (12) shows that the total number of capillary tubes depends on the porosity of the core, average pore radius, , and the radius of the core, .
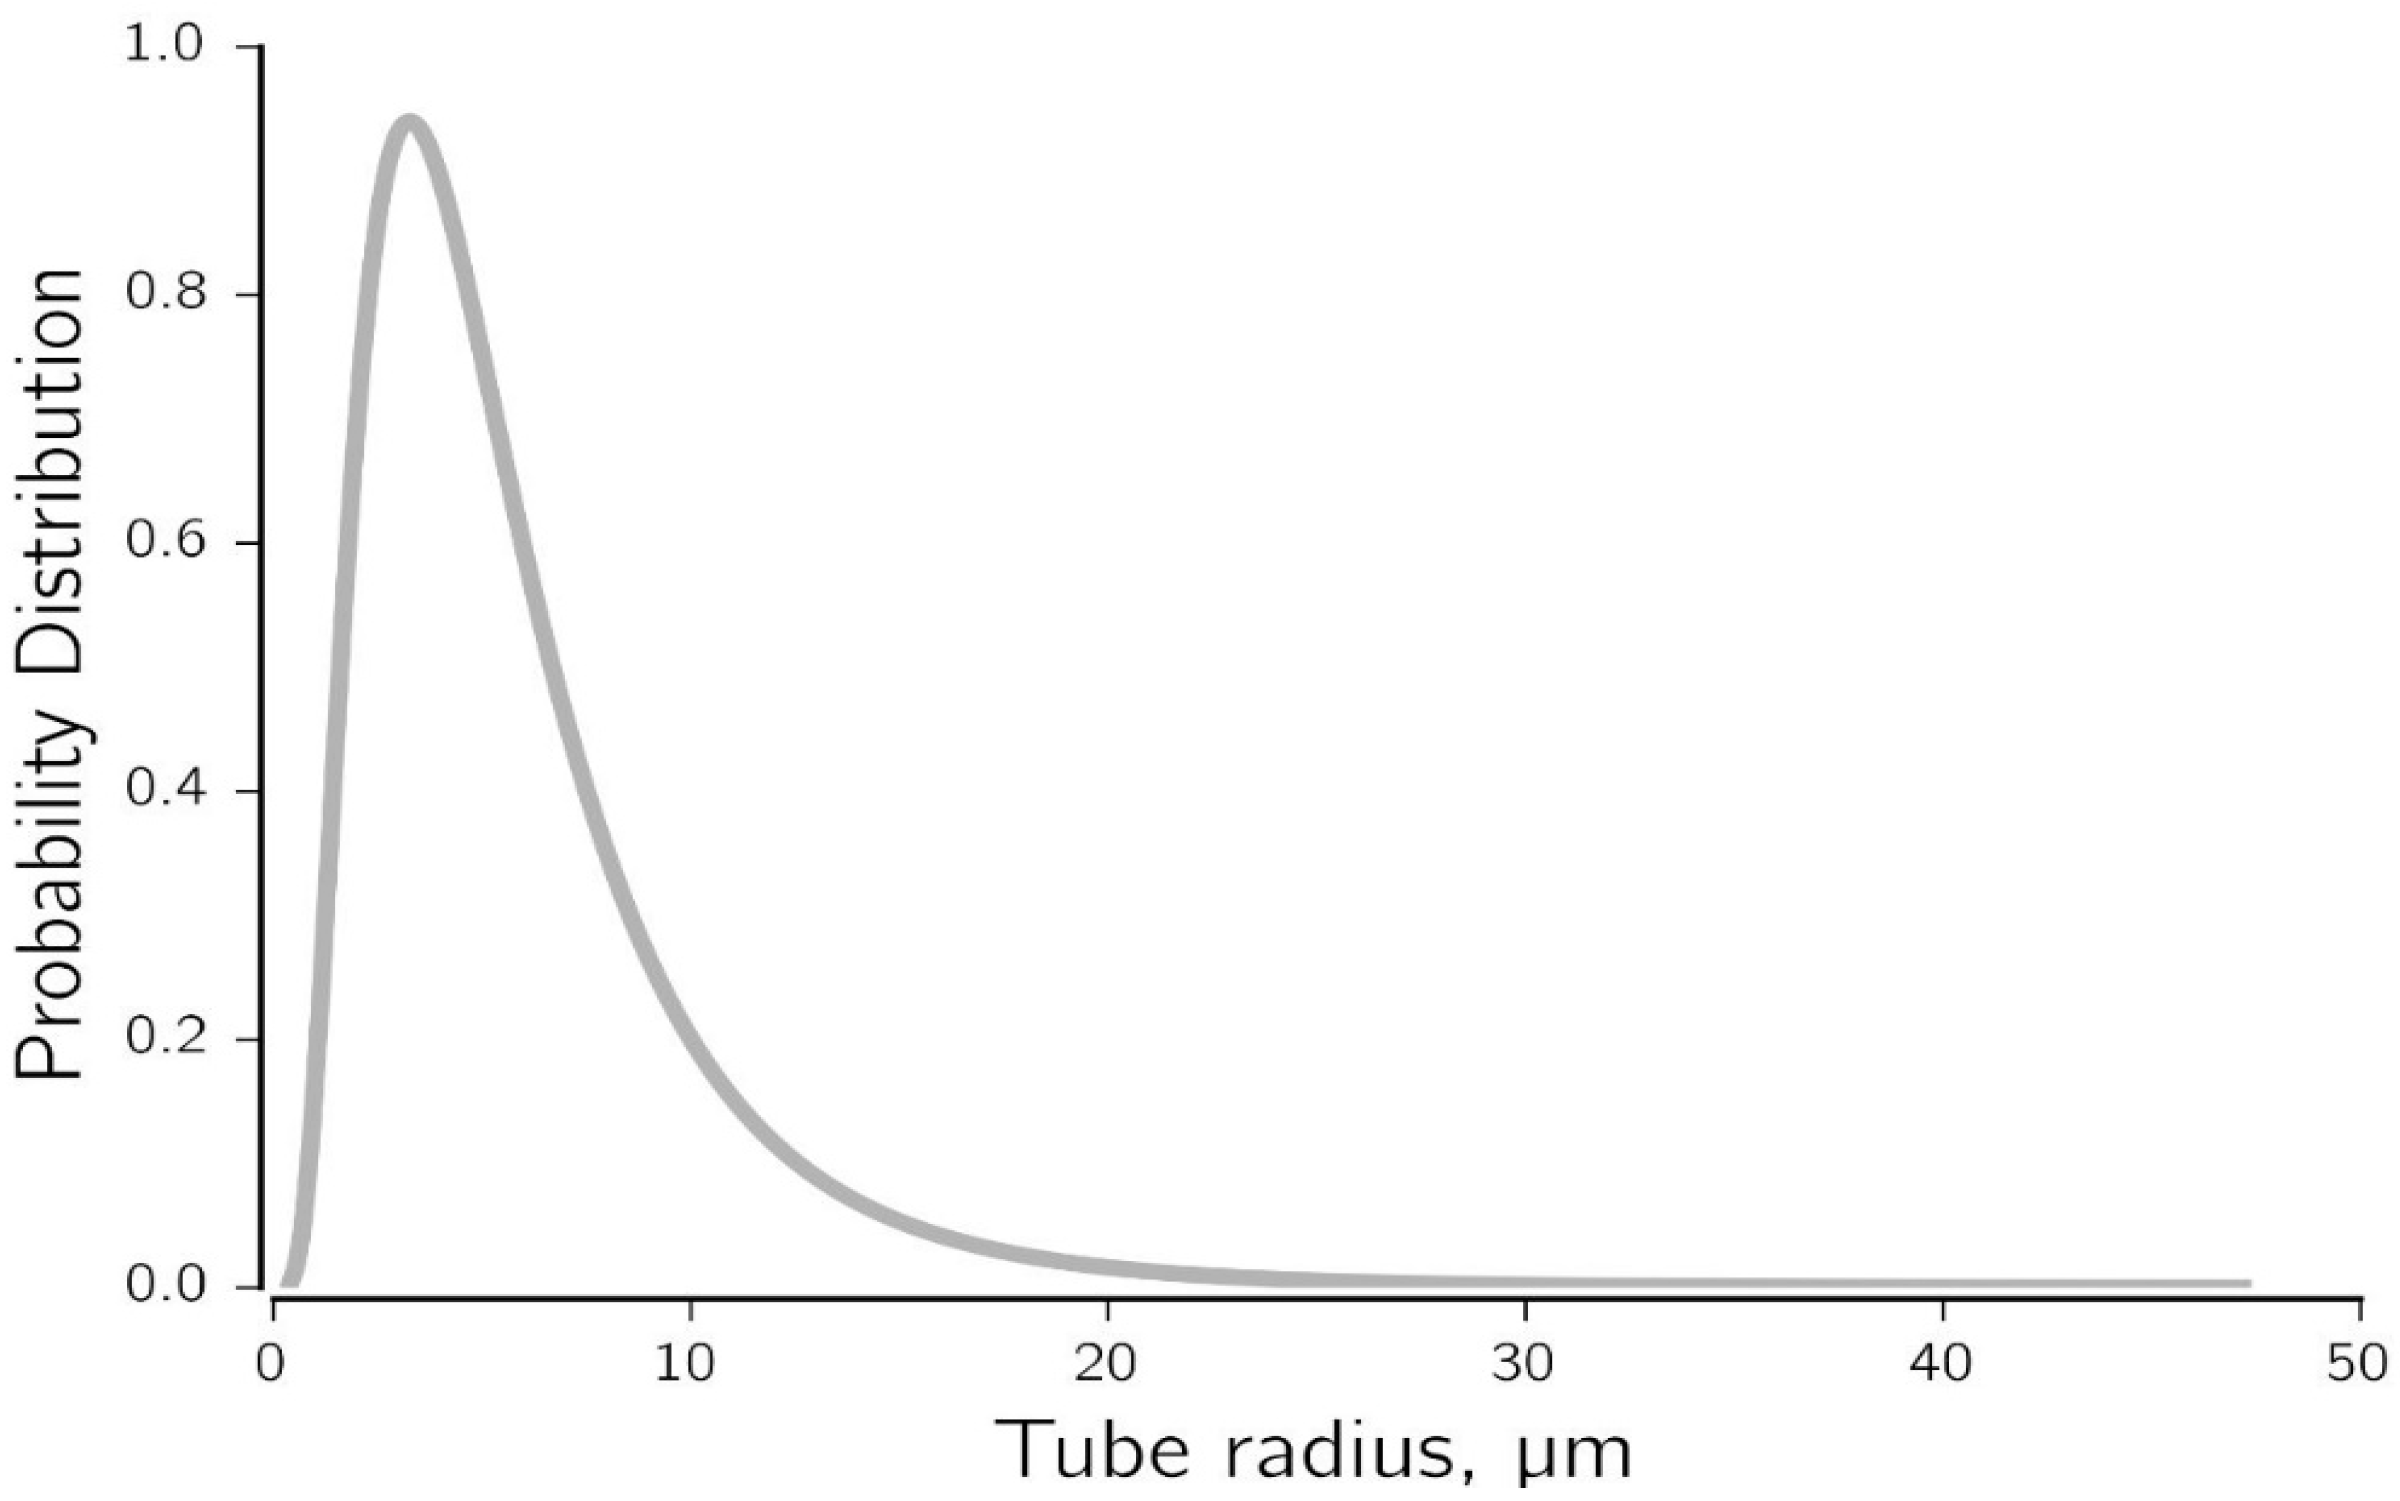
Based on a pore size distribution analysis using mercury injection in sandstone cores, Shi et al. [43] have found an average pore radius of about 6.7 µm. From this data, we calibrated our model to an average tube size of 6 µm using a lognormal distribution of tube radii, as shown in Figure 4.
Natural reservoir rocks consist of pore bodies connected by two or more pore throats depending on the coordination number. In this work, the pore chambers and throats were represented as individual non-interacting tubes. The average coordination number in sandstones is between 4 and 8 [44,45]. The pore size distribution in Figure 4 compares favorably with this range of coordination numbers.
Under linear flow, solid salt distribution will depend on the linear interconnection of pores. The bundle-of-tubes model could adequately characterize the principal mechanisms of salt deposition under linear flow conditions, where the horizontal interconnection of pores can be represented as capillary tubes.
By fitting experimental data, we derived a correlation for the deposited solid salt saturation by modifying the mass balance equation previously derived by Karsten Pruess [21], as:
In Equation (13), and are constants. By fitting initial experimental data, and were found to be the optimum correlation constants for the current studies.
From mass balance, it can be shown that the thickness of solid salt in each capillary tube can be estimated from:
Equation (14) shows that the thickness of solid salt, , in each capillary tube, , is dependent on the total precipitated solid salt saturation, , and the distribution of salt in the pores, which is determined by the dry-out length, .
3.4. Implementation of the Model
To estimate injectivity impairment induced by the coupled effect of fines mobilization and salt precipitation, the following steps were followed:
- The number and distribution of capillary tubes for given properties of the core was calculated from Equation (12) by specifying the average pore radius.
- The initial permeability of the core was calculated from Equation (10) by setting . The calculated permeability was then compared to the measured permeability of the core. If the agreement is not favourable, Step 1 is optimized until the agreement is acceptable.
- base case is established by exposing the tubes to fine particles with average particle size . For simplicity, we assumed that the flowing fluid contains particles of the same size and that each capillary tube has equal chance of being exposed to the particles. Tubes with a jamming ratio greater than 1.0 are isolated and the permeability of the core is recalculated from Equation (10).
- The relative injectivity change, , induced by fines entrapment is calculated from Equation (4).
- For given properties of the saturating formation brine, the thickness of precipitated salt in each capillary tube is computed from Equations (13) and (14).
- Steps 3 and 4 are then repeated to calculate the combined effect of salt precipitation and fines mobilization.
The model does not handle particles of varying sizes as occurs in typical mineral dissolution and particle transport in natural porous media. In addition, fines entrapment through pore bridging and multiparticle blocking have not been included. However, the fundamental mechanisms of salt precipitation and fines migration have been captured in the model. Salt precipitation reduces the flow area by coating the pore walls. The reduced flow area then makes the pore constrictions even more susceptible to fines entrapment through the jamming ratio.
4. Results and Discussion
4.1. Injectivity Impairment Induced by Fines Mobilization
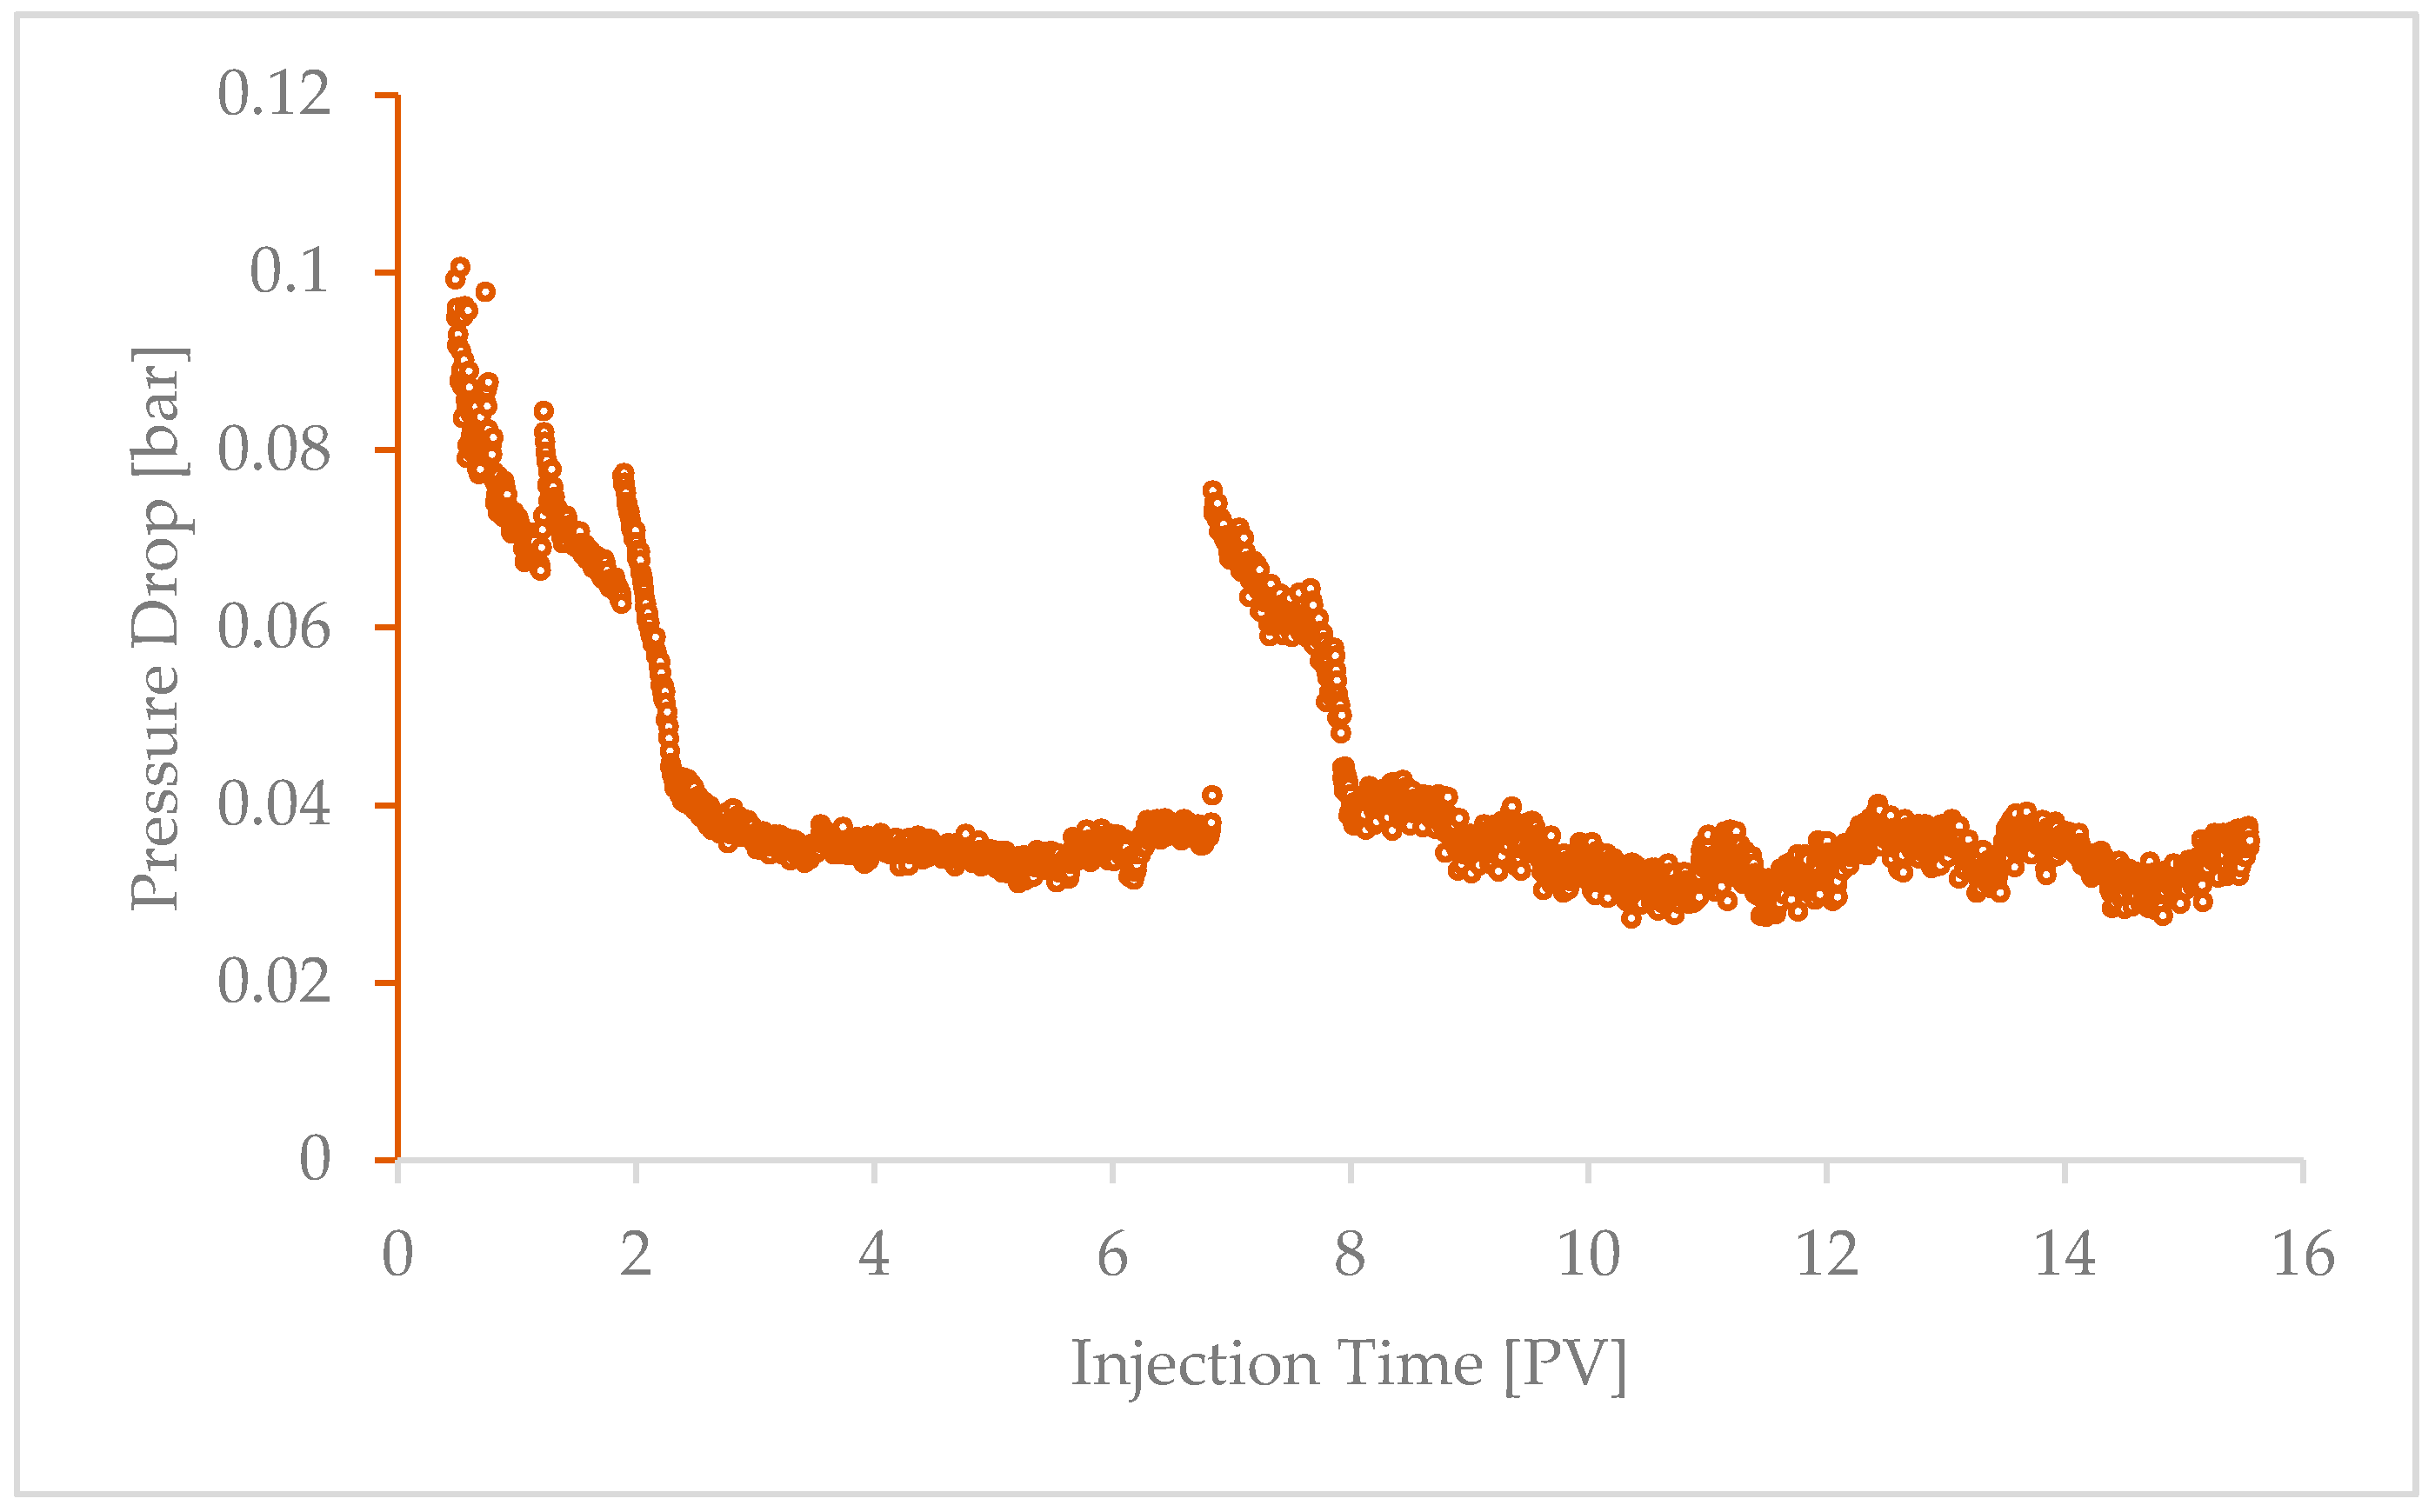
To investigate the effect of mineral dissolution and fines migration on CO2 injectivity, sandstone core samples were flooded with carbonated water at 80 bar and 60 °C. A Bentheimer core, which was initially fully saturated with FW, was flooded with about 25 pore volumes (PV) of carbonated water at 0.25 mL/min. Figure 5 shows part of the pressure drop profiles recorded during carbonated water flooding. Effluent was collected and filtered with a 0.22 µm filter to collect any solid particles that might have been washed out of the core. The sample was then dried and analyzed with a Scanning Electron Microscope (SEM) process. Energy Dispersive Spectroscopy (EDS) elemental analysis of the sample is provided in Table 3.
In Figure 5, the pressure drop decreased sharply from about 0.1 bar to about 0.04 bar after the core was flooded with about 3 PV of carbonated water. This is the period of immiscible displacement of the saturating pore water (FW) by carbonated water. As the displaced FW is replaced by the less dense carbonated water, the pressure drop is seen to fall sharply until carbonated water breakthrough at the effluent end of the core. The pressure drop remained practically stable from 3 PV to about 7 PV. In this period, the core is fully saturated with carbonated water, leading to stable flow. However, the pressure drop became unstable from about 7 PV to the end of the test. In this period, the pressure drop is seen to rise sharply and fall to a rather haphazard behavior towards the end of the test. We suspect that this is the period in which the resident carbonated water begins to interact chemically with the rock minerals. The dissolution of the rock momentarily decreases the pressure drop. As the dissolved minerals are produced out of the core, some of the particles could plug the smaller pores and temporarily increase the pressure drop. However, due to the large pore channels of the Bentheimer core, few particles are likely to plug the pores, as seen in the magnitude of the momentary changes in pressure drop.
The EDS results in Table 3 reveal that the sample is composed predominantly of Na (17.53%) and Cl (29.79%), probably because the filtered effluent sample, which is composed mainly of FW, contains about 73.4% NaCl (Section 2.1.2). The injected carbonated water could not have precipitated halite within the rock, since CO2 was dissolved in FW. Salt could have been precipitated in the pores only if high amounts of free CO2 came into direct contact with the FW during the flooding. The present experimental conditions eliminate the possibility of brine vaporization and salt precipitation. Therefore, the Na and Cl elements are probably components of the effluent FW. Table 3 also indicates the presence of minerals such as Fe, Si, Al, Ni, and Co which were not present in the saturating FW and the injected carbonated water. Therefore, Fe, Si, Al, Ni, and Co were most likely dissolved from the Bentheimer core through the interaction of the carbonated water and the rock minerals. The EDS analysis show low amounts of Fe, Si, Al, Ni, and Co, because only few particles were probably washed out of the core.
Quantitative experiments were then conducted to measure the effect of dissolution on injectivity. The quantification process described in Section 2.3.2 was used to estimate the injectivity effects. An attempt was also made to investigate the effect of carbonated water injection flow rate and initial rock permeability.
4.1.1. Effect of Injection Flow Rate
A Berea sandstone core sample with known permeability was initially saturated with FW, and then flooded with about 25 PV of carbonated water at 80 bar and 60 °C at constant injection rate of 0.25 mL/min to release and mobilize fine particles in the rock. The permeability of the core after carbonated water flooding was measured, and the injectivity impairment index, , was calculated. The experiment was then repeated at injection flow rates of 0.5 mL/min and 1.0 mL/min.
Figure 6 shows that the injectivity impairment decreased with increasing carbonated water injection flow rate. As injection flow rate is increased, the injected fluid stays in contact with the rock minerals for a short period of time, since the volume of injected fluid was kept constant in the three experiments. The number of fines generated will then decrease as the injection flow rate is increased. In addition, at a high injection flow rate, hydrodynamic forces could lift the smaller particles out of the core with the effluent fluid. The number of fines available to plug the rock, and therefore the chances of injectivity impairment, will reduce as the carbonated water injection flow rate is increased.
4.1.2. Effect of Initial Core Permeability
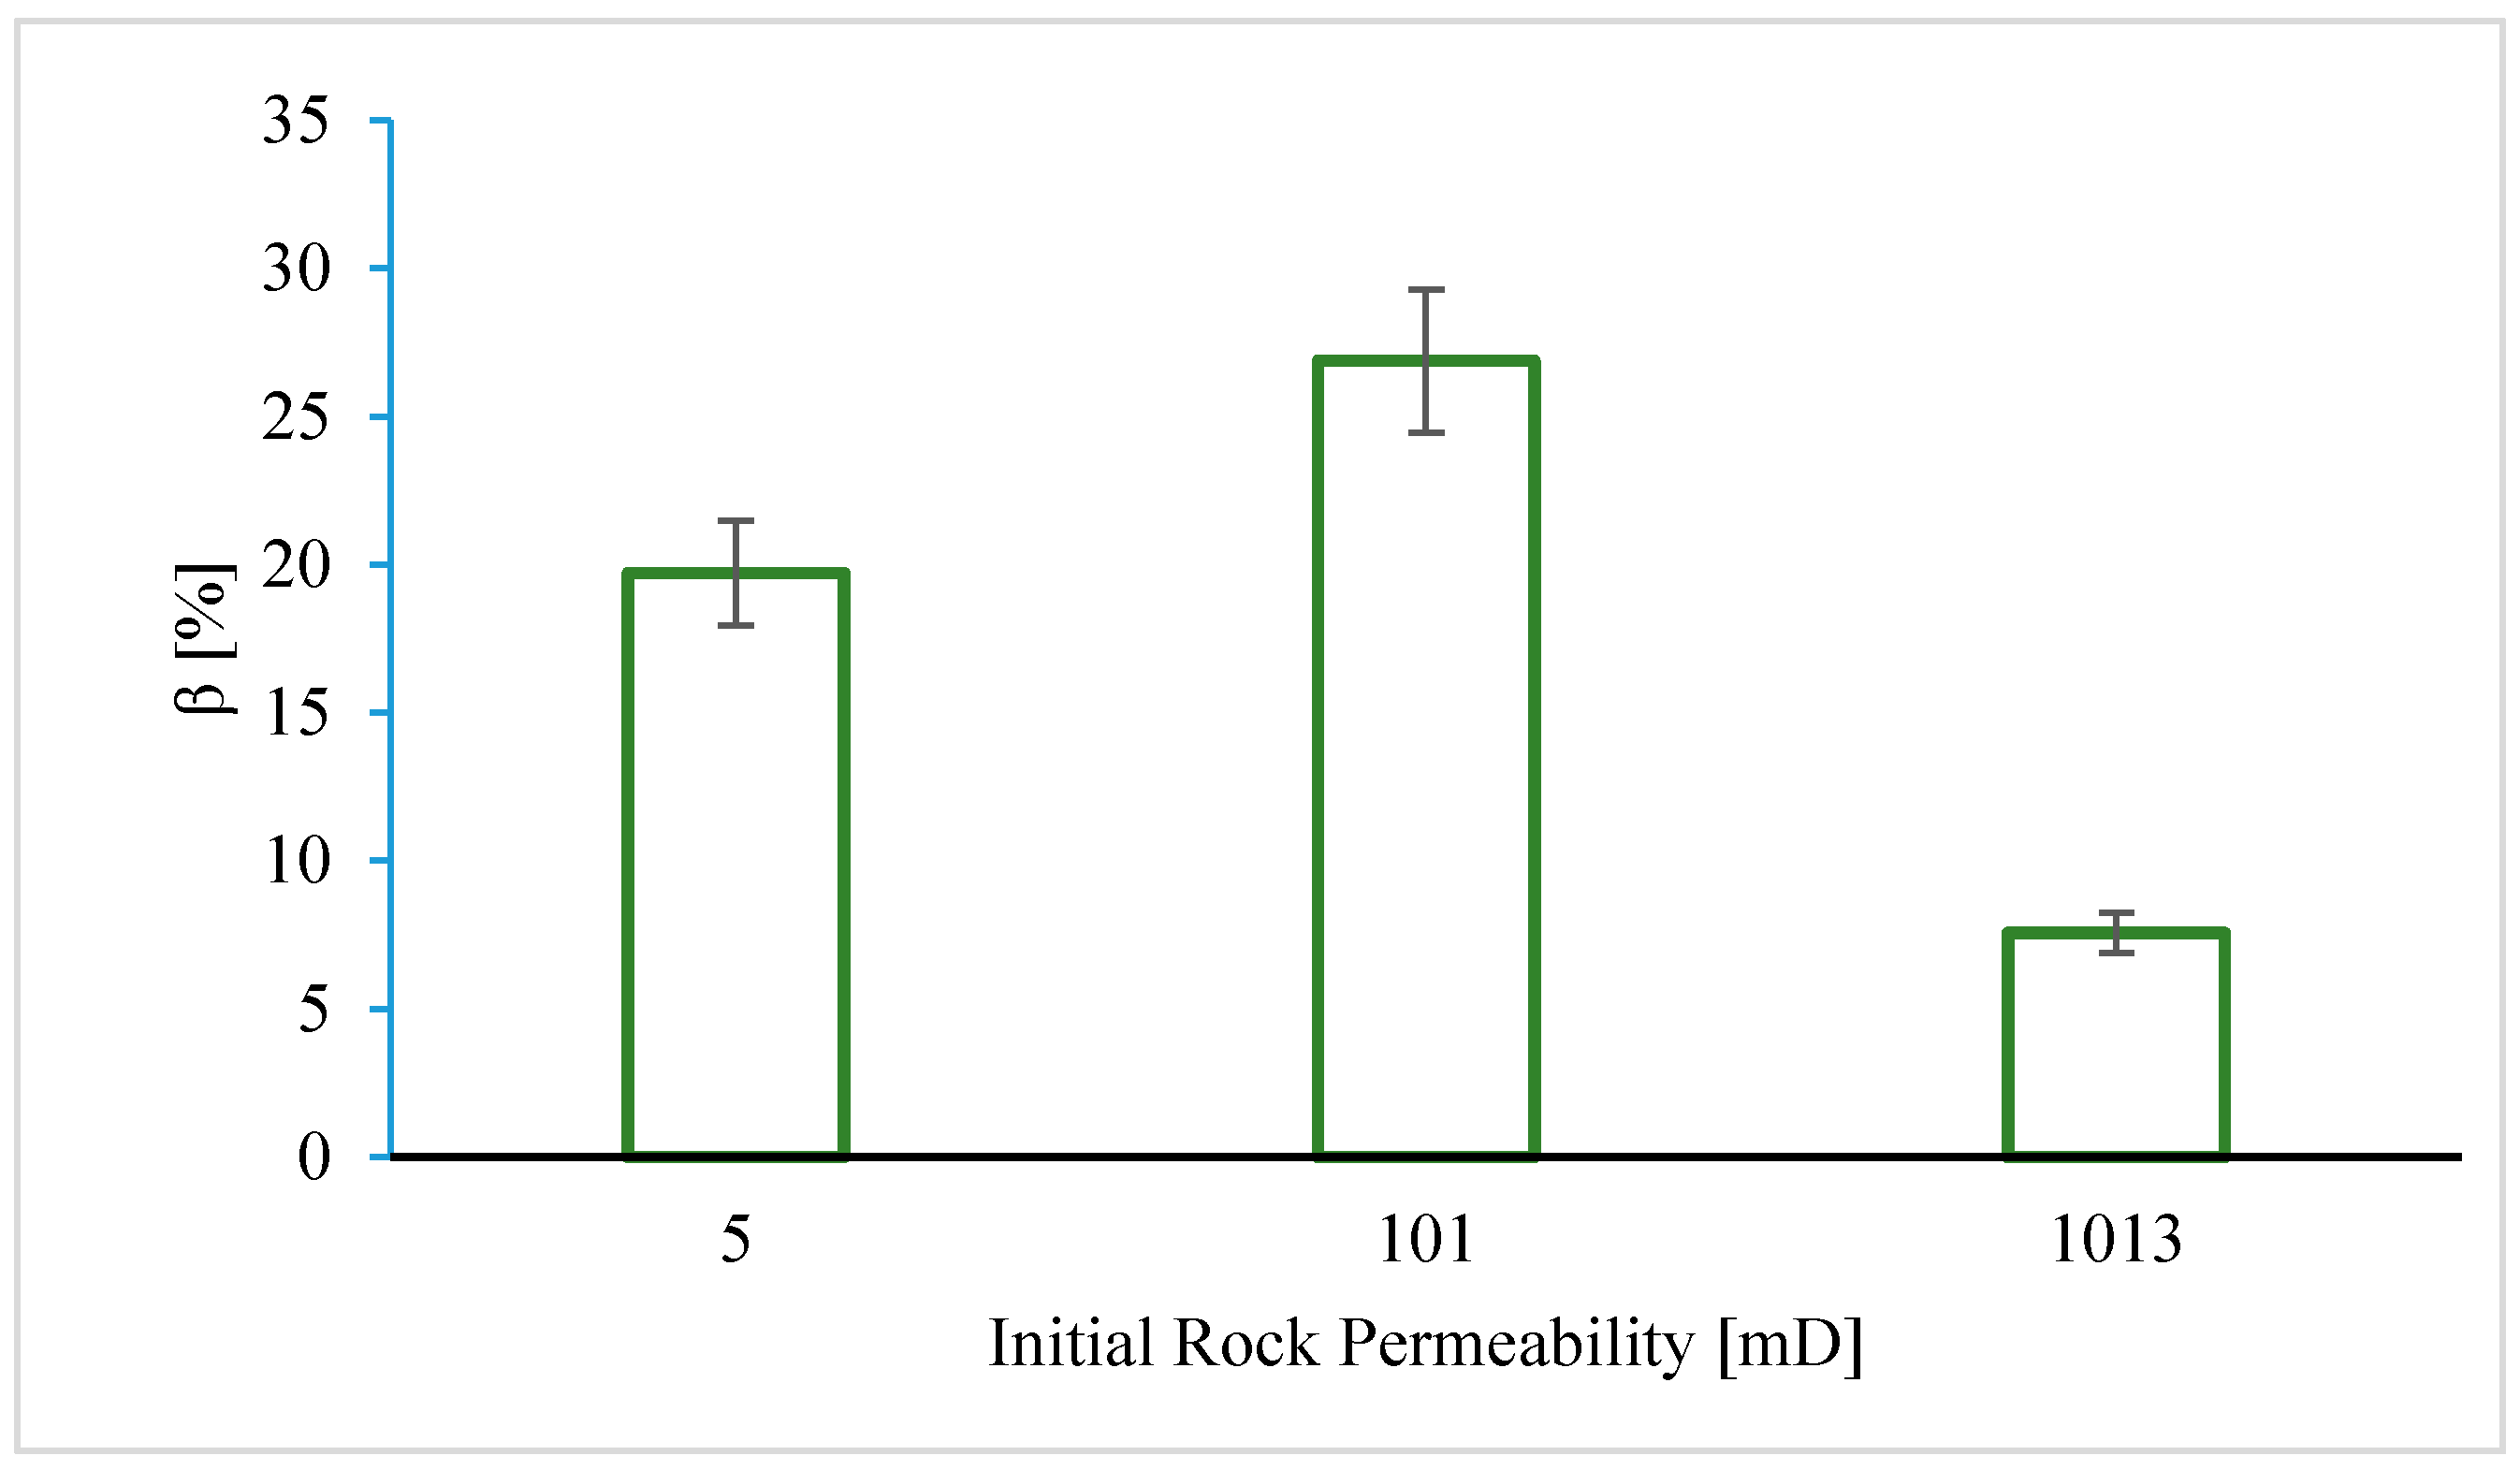
To investigate the effect of initial rock permeability, the experiment was repeated with three sandstone rocks with varying initial permeability (Bentheimer: 1013 mD, Berea: 101 mD, Bandera 5 mD). It was assumed that the effect of variations in chemical properties of the sandstone cores on injectivity impairment is negligible compared to the flow properties of the cores. Carbonated water was injected into each rock at a constant flow rate of 0.25 mL/min. Figure 7 shows the impact of initial rock properties on injectivity impairment induced by mineral dissolution.
Figure 7 shows that there was no obvious correlation between initial rock permeability and effect of dissolution on CO2 injectivity. The impact of mineral dissolution on CO2 injectivity will depend on the number of particles generated and the fraction of particles entrapped. The pore throats in low permeability rocks are very narrow, and have poor interconnections. The contact between injected carbonated water and the rock minerals will be low in this case, generating fewer particles as a result. However, due to the narrow pore channels, most of the generated particles have high chances of plugging the pores. Conversely, sandstone rocks with very high permeability will have more open and interconnected pore channels, which leads to improved contact between injected carbonated water and the rock minerals. More particles will be generated as a result. However, because most of the pores are open and connected, the released particles will have high chances of piping through the rock with the effluent and a low chance of plugging the pores. In sandstone rocks with medium permeability, fines generation and entrapment could both be enhanced to favor injectivity impairment.
4.2. Comparing the Effects of Salt Precipitation and Fines Mobilization
After establishing that mineral dissolution could impair CO2 injectivity, we attempted to compare the contribution of each mechanism to CO2 injectivity impairment. In order to optimize the properties of the fine particles, we used colloid suspensions as the formation fluid.
A Berea sandstone core sample was initially saturated with mono-disperse colloid solution with an average particle size of 0.08 µm and a particle concentration of 0.3 wt %. The composition of the mono-disperse colloid suspension used in this study has been described in Table 2. The core was then mounted and flooded with about 40 PV of supercritical CO2 at 5 ml/min to complete dryness. The relative injectivity change, , was calculated from the permeability of the core measured before and after it was exposed to mineral impairment. The experiment was repeated for particle concentrations of 0.5 wt % and 1.0 wt %. We then conducted a salt precipitation experiment by saturating the core with brine containing 10 wt % of total dissolved salts (FW) prior to supercritical CO2 drying. Figure 8 shows the experimental results.
Pore size distribution analysis of similar Berea sandstone cores suggests an average pore throat size of about 2 µm [46]. The colloid with average particle size of 0.08 µm will yield an average jamming ratio of about 0.04. Natural formation fine particles have average particle sizes in the region of 1 µm [29,47]. However, the dissolution of sandstone under typical CO2 storage conditions may yield particles of varying sizes over a wide range, depending on the reaction conditions and composition of the rock.
Particles with a jamming ratio of about 0.04 could plug the rock through surface deposition, pore bridging, and multi-particle blocking [29]. During saturation, if the particles are stabilized in the suspending fluid, the surface deposition would be greatly reduced. At very low particle concentration, the chances of pore bridging and multi-particle blocking could be greatly minimized. Therefore, the particles would stay mono-dispersed within the pore spaces after saturation and prior to CO2 injection. When CO2 invades the fluid-filled pores, the stability of the particles in the colloid will be disturbed, thereby releasing the particles for plugging during CO2 flooding. This is comparable to CO2 injection into a reservoir where the formation brine contains fine particles released from the dissolved rock.
In Figure 8, CO2 injectivity impairment increased by about 20 percentage points when the concentration of mono-disperse particles in the saturating pore fluid was increased from 0.3 wt % to 1.0 wt %. While salt precipitation due to the drying of the FW reduced injectivity by about 26.8%, the particle concentration of 0.3 wt % reduced the injectivity by 74.9% through fines mobilization. When CO2 invades the pores, the mono-disperse particles may plug the narrow pore channels through bridging, surface deposition, or multi-particle blocking. As the particle concentration increases, the distance between suspended particles shortens, enhancing the multi-particle blocking of the invaded pores.
After salt precipitation, the deposited salts will form a coating on the pore walls to reduce the flow area. However, during fines entrapment, several particles could accumulate in the pore throat and completely plug the pore. While salt precipitation reduces the flow area, fines entrapment could plug and isolate the flow path, making it inaccessible to fluid flow. This could be the reason why about 0.3 wt % particle concentration in the pore fluid induced over twofold injectivity impairment compared to about 10 wt % of total dissolved salt in the formation water. The results suggest that, under linear flow conditions, fines mobilization could induce severe CO2 injectivity impairment comparable to the impact of salt precipitation.
4.3. Coupled Effect of Fines Mobilization and Salt Precipitation
The coupled effect of salt precipitation and fines mobilization was modelled with the bundle-of-tubes model described in Section 3. The results and conclusions drawn from this section are based only on theoretical modelling. We did not verify or compare the data obtained from the model with laboratory core-flood data. Although very preliminary, we believe the results presented here are intuitive and adequately explain the coupled impact of fines and salt effect on CO2 injectivity.
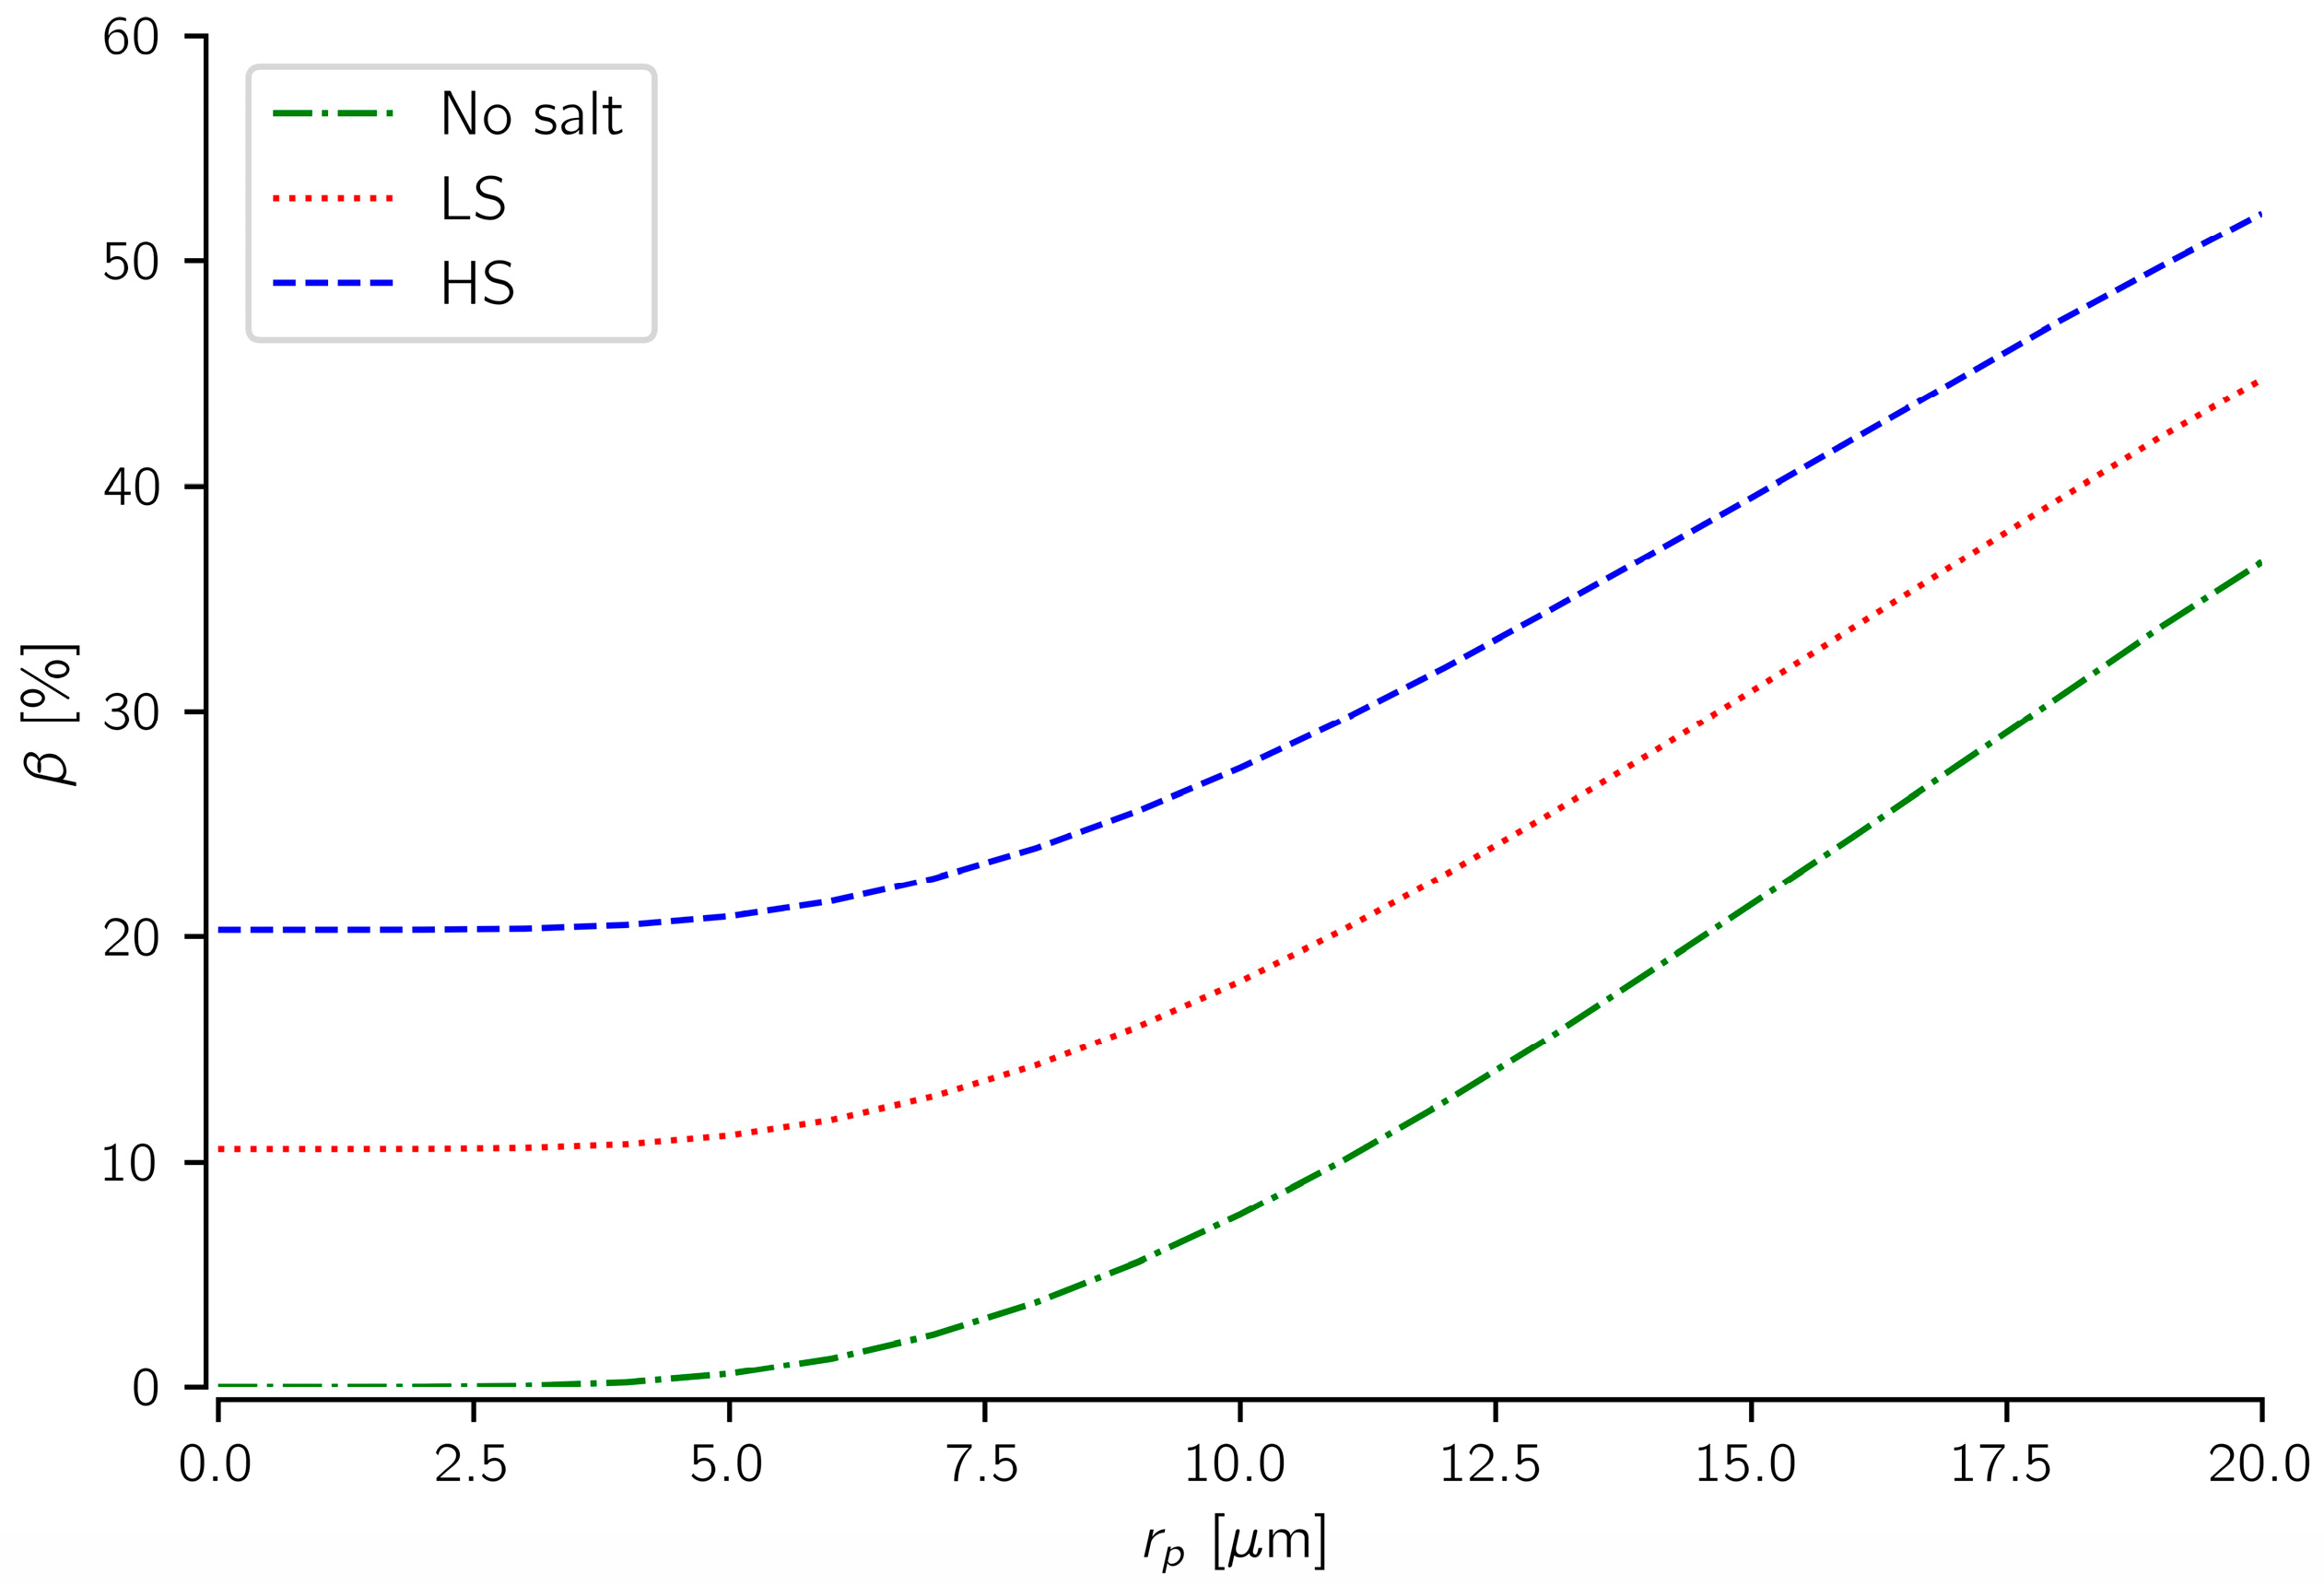
In the first theoretical experiment, the clean bundle of tubes was exposed to particles of the same size. Each capillary tube had an equal chance of being exposed to the particles. Capillary tubes with a jamming ratio greater than 1.0 would be plugged through size exclusion. The effect of particle size on injectivity impairment was computed. The experiment was then repeated by first exposing the core to salt precipitation before subjecting them to particle entrapment. It was assumed that the precipitated salts would reduce the flow area, and render the capillary tubes more susceptible to fines entrapment. Particle sizes up to 20 µm were simulated.
Figure 9 shows the injectivity impairment induced (β) as a function of average particle size () for the three cases. For pure fines mobilization (no salt), particle sizes below 5 µm did not induce injectivity impairment. Since an average pore radius of 6 µm was used in the simulation, particles smaller than the average pore size will pipe through most of the pores. For particle sizes greater than 5 µm, injectivity impairment increases with particle size. As the particle size is increased, the number of capillary tubes likely to attain jamming ratios greater than 1.0 increases, and injectivity decreases as more tubes are plugged and isolated.
Figure 9 also shows that injectivity impairment induced by fines mobilization was further compounded by increase in the saturating brine salinity. As brine salinity is increased, more salts are precipitated in the tubes. The precipitated salts reduce the flow area, increasing the jamming ratio of the tubes for each average particle size. The jamming ratio of the pores increases with increasing brine salinity as more salts are precipitated into the pores. Thus, more tubes will attain jamming ratios greater than 1.0 and eventually get plugged, inducing massive injectivity impairment.
The results suggest that salt precipitation could compound the injectivity impairment induced by fines mobilization. The precipitated salts could reduce the pore radii and increase the jamming ratio of the pores. This effect will in turn increase with saturating brine salinity, as more salts are precipitated into the pore spaces.
5. Conclusions
CO2 injectivity impairment affects both the technical and economic planning and implementation of CCUS projects. Salt precipitation near the wellbore vicinity and in situ fines mobilization during CO2 injection into deep saline reservoirs have been identified as potential CO2 injectivity impairment mechanisms. The effect of salt precipitation on CO2 injectivity has been researched, but the impact of fines mobilization is yet to receive its deserved attention. During CO2 reinjection into deep saline reservoirs, salt precipitation and fines mobilization could simultaneously impair CO2 injectivity.
We conducted preliminary core-flood experiments to investigate the impact of fines mobilization on CO2 injectivity. The relative contribution of fines mobilization and salt precipitation to injectivity impairment was also investigated. A tractable bundle-of-tubes model was then used to study the coupled effect of salt precipitation and fines mobilization on injectivity. Some of the highlights of this work include:
- Fines mobilization could induce severe CO2 injectivity impairment. The experimental results suggest up to about a 26% injectivity impairment could be induced by fines migration.
- Under linear flow conditions, CO2 injectivity impairment induced by fines mobilization could be comparable to injectivity impairment caused by salt precipitation. About a 0.3 wt % particle concentration in the pore fluid induced over twofold injectivity impairment compared to about 10 wt % of total dissolved salt in the formation water.
- The findings also suggest that salt precipitation could compound the impact of fines mobilization on CO2 injectivity. The precipitated salts reduce the pore spaces, making them more susceptible to particle plugging and injectivity reduction.
Although the methods adopted in this study were simple and rather linear, the findings will make a relevant contribution to the fundamental mechanisms of fines mobilization within the context of CO2 injectivity. The results also provide important insight and could serve as a foundation to inspire further experimental and theoretical investigation into the effects of fines mobilization on CO2 injectivity.
Acknowledgments
The authors would like to thank PGNiG Upstream International, Norway, and the Institute of Petroleum Technology (IPT) of the University of Stavanger for funding this project.
Author Contributions
Yen Adams Sokama-Neuyam established the research direction, designed the methods, and wrote the paper; Sindre Langås Forsetløkken and Jhon-eirik Lien conducted the experiments and collected data; Jann Rune Ursin contributed to data analysis and edited the paper.
Conflicts of Interest
The authors declare no conflict of interest.
Abbreviations
| CCUS | CO2 Capture, Utilization and Storage |
| FW | Formation Water |
| I | Injectivity |
| HS | High Salinity brine |
| LS | Low Salinity brine |
References
- Miri, R. Effects of CO2-Brine-Rock Interactions on CO2 Injectivity—Implications for CCS. Ph.D. Thesis, Uniersity of Oslo, Oslo, Norway, July 2015. [Google Scholar]
- Lombard, J.M.; Azaroual, M.; Pironon, J.; Broseta, D.; Egermann, P.; Munier, G.; Mouronval, G. CO2 injectivity in geological storages: An overview of program and results of the GeoCarbone-Injectivity project. Oil Gas Sci. Technol. 2010, 65, 533–539. [Google Scholar] [CrossRef]
- Miri, R.; Hellevang, H. Salt precipitation during CO2 storage—A review. Int. J. Greenh. Gas Control 2016, 51, 136–147. [Google Scholar] [CrossRef]
- Bacci, G.; Durucan, S.; Korre, A. Experimental and Numerical Study of the Effects of Halite Scaling on Injectivity and Seal Performance During CO2 Injection in Saline Aquifers. Energy Procedia 2013, 37, 3275–3282. [Google Scholar] [CrossRef]
- Muller, N.; Qi, R.; Mackie, E.; Pruess, K.; Blunt, M.J. CO2 injection impairment due to halite precipitation. Energy Procedia 2009, 1, 3507–3514. [Google Scholar] [CrossRef]
- Peysson, Y.; André, L.; Azaroual, M. Well injectivity during CO2 storage operations in deep saline aquifers-Part 1: Experimental investigation of drying effects, salt precipitation and capillary forces. Int. J. Greenh. Gas Control 2014, 22, 291–300. [Google Scholar] [CrossRef]
- Zuluaga, E.; Muñoz, N.I.; Obando, G. An Experimental Study to Evaluate Water Vaporisation and Formation Damage Caused by Dry Gas Flow Through Porous Media. In Proceedings of the International Symposium on Oilfield Scale, Aberdeen, UK, 30–31 January 2001. [Google Scholar]
- Kleinitz, W.; Dietzsch, G.; Köhler, M. Halite scale formation in gas-producing wells. Chem. Eng. Res. Des. 2003, 81, 352–358. [Google Scholar] [CrossRef]
- Jasinski, R.; Sablerolle, W.; Amory, M. ETAP: Scale Prediction and Contol for the Heron Cluster. In Proceedings of the SPE Annual Technical Conference and Exhibition, San Antonio, TX, USA, 5–8 October 1997. [Google Scholar]
- Golghanddashti, H.; Saadat, M.; Abbasi, S.; Shahrabadi, A. Experimental investigation of water vaporization and its induced formation damage associated with underground gas storage. J. Porous Media 2013, 16. [Google Scholar] [CrossRef]
- Place, M.C., Jr.; Smith, J.T. An Unusual Case of Salt Plugging in a High-Pressure Sour Gas Well. In Proceedings of the 59th Annual Technical Conference and Exhibition, Houston, TX, USA, 16–19 September 1984; p. 13. [Google Scholar]
- Baumann, G.; Henninges, J.; De Lucia, M. Monitoring of saturation changes and salt precipitation during CO2 injection using pulsed neutron-gamma logging at the Ketzin pilot site. Int. J. Greenh. Gas Control 2014, 28, 134–146. [Google Scholar] [CrossRef]
- Grude, S.; Landrø, M.; Dvorkin, J. Pressure effects caused by CO2 injection in the Tubåen Fm., the Snøhvit field. Int. J. Greenh. Gas Control 2014, 27, 178–187. [Google Scholar] [CrossRef]
- Bacci, G.; Korre, A.; Durucan, S. Experimental investigation into salt precipitation during CO2 injection in saline aquifers. Energy Procedia 2011, 4, 4450–4456. [Google Scholar] [CrossRef]
- Kim, M.; Sell, A.; Sinton, D. Aquifer-on-a-Chip: Understanding pore-scale salt precipitation dynamics during CO2 sequestration. Lab Chip 2013, 13, 2508–2518. [Google Scholar] [CrossRef] [PubMed]
- André, L.; Peysson, Y.; Azaroual, M. Well injectivity during CO2 storage operations in deep saline aquifers—Part 2: Numerical simulations of drying, salt deposit mechanisms and role of capillary forces. Int. J. Greenh. Gas Control 2014, 22, 301–312. [Google Scholar] [CrossRef]
- Tang, Y.; Yang, R.; Du, Z.; Zeng, F. Experimental study of formation damage caused by complete water vaporization and salt precipitation in sandstone reservoirs. Transp. Porous Media 2015, 107, 205–218. [Google Scholar] [CrossRef]
- Sokama-Neuyam, Y.A.; Ursin, J. Experimental and Theoretical Investigations of CO2 injectivity. AGH Drilling Oil Gas 2016, 33, 245–257. [Google Scholar] [CrossRef]
- Giorgis, T.; Carpita, M.; Battistelli, A. 2D modeling of salt precipitation during the injection of dry CO2 in a depleted gas reservoir. Energy Convers. Manag. 2007, 48, 1816–1826. [Google Scholar] [CrossRef]
- Hurter, S.; Berge, J.; Labregere, D. Simulations for CO2 injection projects with Compositional Simulator. In Proceedings of the Offshore Europe, Aberdeen, UK, 4–7 September 2007. [Google Scholar]
- Pruess, K. Formation dry-out from CO2 injection into saline aquifers: 2. analytical model for salt precipitation. Water Resour. Res. 2009, 45, 1–6. [Google Scholar] [CrossRef]
- Zeidouni, M.; Pooladi-Darvish, M.; Keith, D. Analytical solution to evaluate salt precipitation during CO2 injection in saline aquifers. Int. J. Greenh. Gas Control 2009, 3, 600–611. [Google Scholar] [CrossRef]
- Roels, S.M.; Ott, H.; Zitha, P.L.J. μ-CT analysis and numerical simulation of drying effects of CO2 injection into brine-saturated porous media. Int. J. Greenh. Gas Control 2014, 27, 146–154. [Google Scholar] [CrossRef]
- Kleinitz, W.; Koehler, M.; Dietzsch, G.; Gmbh, P.E. The precipitation of salt in gas producing wells. In Proceedings of the SPE European Formation Damage Conference, The Hague, The Netherlands, 21–22 May 2001; pp. 1–7. [Google Scholar]
- Pruess, K.; Muller, N. Formation dry-out from CO2 injection into saline aquifers: 1. Effects of solids precipitation and their mitigation. Water Resour. Res. 2009, 45, 1–11. [Google Scholar] [CrossRef]
- Patton, J.T.; Phelan, P.; Holbrook, S. CO2 Formation Damage Study—First Annual Report; U.S. Department of Energy: Las Cruces, NM, USA, 1981.
- Sayegh, S.G.; Krause, F.F.; Girard, M.; DeBree, C. Rock/Fluid interactions of carbonated brines in a sandstone reservoir: Pembina Cardium, Alberta, Canada. SPE Form. Eval. 1990, 5, 399–405. [Google Scholar] [CrossRef]
- Tobergte, D.R.; Curtis, S. Experimental perspectives of mineral dissolution and precipitation due to carbon dioxide-water-rock interactions. J. Chem. Inf. Model. 2013, 53, 1689–1699. [Google Scholar]
- Khilar, K.C.; Fogler, H.S. Migrations of Fines in Porous Media; Kluwer Academic Publisher: Dordrecht, The Netherlands, 1998; Volume 12. [Google Scholar]
- Muecke, T.W. Formation fines and factors controlling their movement in porous media. J. Pet. Technol. 1979, 31, 144–150. [Google Scholar] [CrossRef]
- Khilar, K.C.; Fogler, H.S. Water Sensitivity of Sandstone. Soc. Pet. Eng. J. 1983, 23, 55–64. [Google Scholar] [CrossRef]
- Gruesbeck, C.; Collins, R.E. Entrainment and Deposition of Fine Particles in Porous Media. Soc. Pet. Eng. J. 1982, 22, 847–856. [Google Scholar] [CrossRef]
- Sarkar, A.; Sharma, M. Fines Migration in Two-Phase Flow. J. Pet. Technol. 1990, 42, 646–652. [Google Scholar] [CrossRef]
- Sharma, M.M.; Yortsos, Y.C. Fines migration in porous media. AIChE J. 1987, 33, 1654–1662. [Google Scholar] [CrossRef]
- Civan, F. Reservoir Formation Damage: Fundamentals, Modelling, Assessment, and Mitigation; Gulf Professional Publishing: Waltham, MA, USA, 2007. [Google Scholar]
- Aji, K. The Experimental and Theoretical Study of Fines Migration in Porous Media under Particle-rock Repulsion and Attraction. Ph.D. Thesis, University of Adelaide, Adelaide, Australia, October 2014. [Google Scholar]
- Peksa, A.E.; Wolf, K.H.A.A.; Zitha, P.L.J. Bentheimer sandstone revisited for experimental purposes. Mar. Pet. Geol. 2015, 67, 701–719. [Google Scholar] [CrossRef]
- Mohammed, A.S.; Ayoub, A.; Massoud, M. Effects of Low Salinity Water Ion Composition on Wettability Alteration in Sandstone Reservoir Rock: A Laboratory Investigation. J. Nat. Sci. Res. 2014, 4, 34–41. [Google Scholar]
- Dullien, F.A.L.; Dhawan, G.K. Characterization of pore structure by a combination of quantitative photomicrography and mercury porosimetry. J. Colloid Interface Sci. 1974, 47, 337–349. [Google Scholar] [CrossRef]
- Fjelde, I.; Omekeh, A.V.; Sokama-Neuyam, Y.A. Low Salinity Water Flooding: Effect Of Crude Oil Composition. In Proceedings of the SPE Improved Oil Recovery Symposium, Tulsa, OK, USA, 12–16 April 2014. [Google Scholar]
- Portier, S.; Rochelle, C. Modelling CO2 solubility in pure water and NaCl-type waters from 0 to 300 C and from 1 to 300 bar Application to the Utsira Formation at Sleipner. Chem. Geol. 2005, 217, 187–199. [Google Scholar] [CrossRef]
- Fogler, H.S. The Existence of a Critical Salt Concentration for Particle Release. J. Colloid Interface Sci. 1984, 101, 214–224. [Google Scholar]
- Shi, J.Q.; Xue, Z.; Durucan, S. Supercritical CO2 core flooding and imbibition in Berea sandstone—CT imaging and numerical simulation. Energy Procedia 2011, 4, 5001–5008. [Google Scholar] [CrossRef]
- Lin, C.; Slattery, J.C. Three-dimensional, randomized, network model for two-phase flow through porous media. AIChE J. 1982, 28, 311–324. [Google Scholar] [CrossRef]
- Yanuka, M.; Dullien, F.A.L.; Elrick, D.E. Serial sectioning and digitization of porous media for two-and three-dimensional analysis and reconstruction. J. Microsc. 1984, 135, 159–168. [Google Scholar] [CrossRef]
- Nelson, P.H. Pore-throat sizes in sandstones, tight sandstones, and shales. Am. Assoc. Pet. Geol. Bull. 2009, 93, 329–340. [Google Scholar] [CrossRef]
- Sen, T.K.; Khilar, K.C. Review on subsurface colloids and colloid-associated contaminant transport in saturated porous media. Adv. Colloid Interface Sci. 2006, 119, 71–96. [Google Scholar]
Figure 1.
Schematic of the carbonated water preparation apparatus.
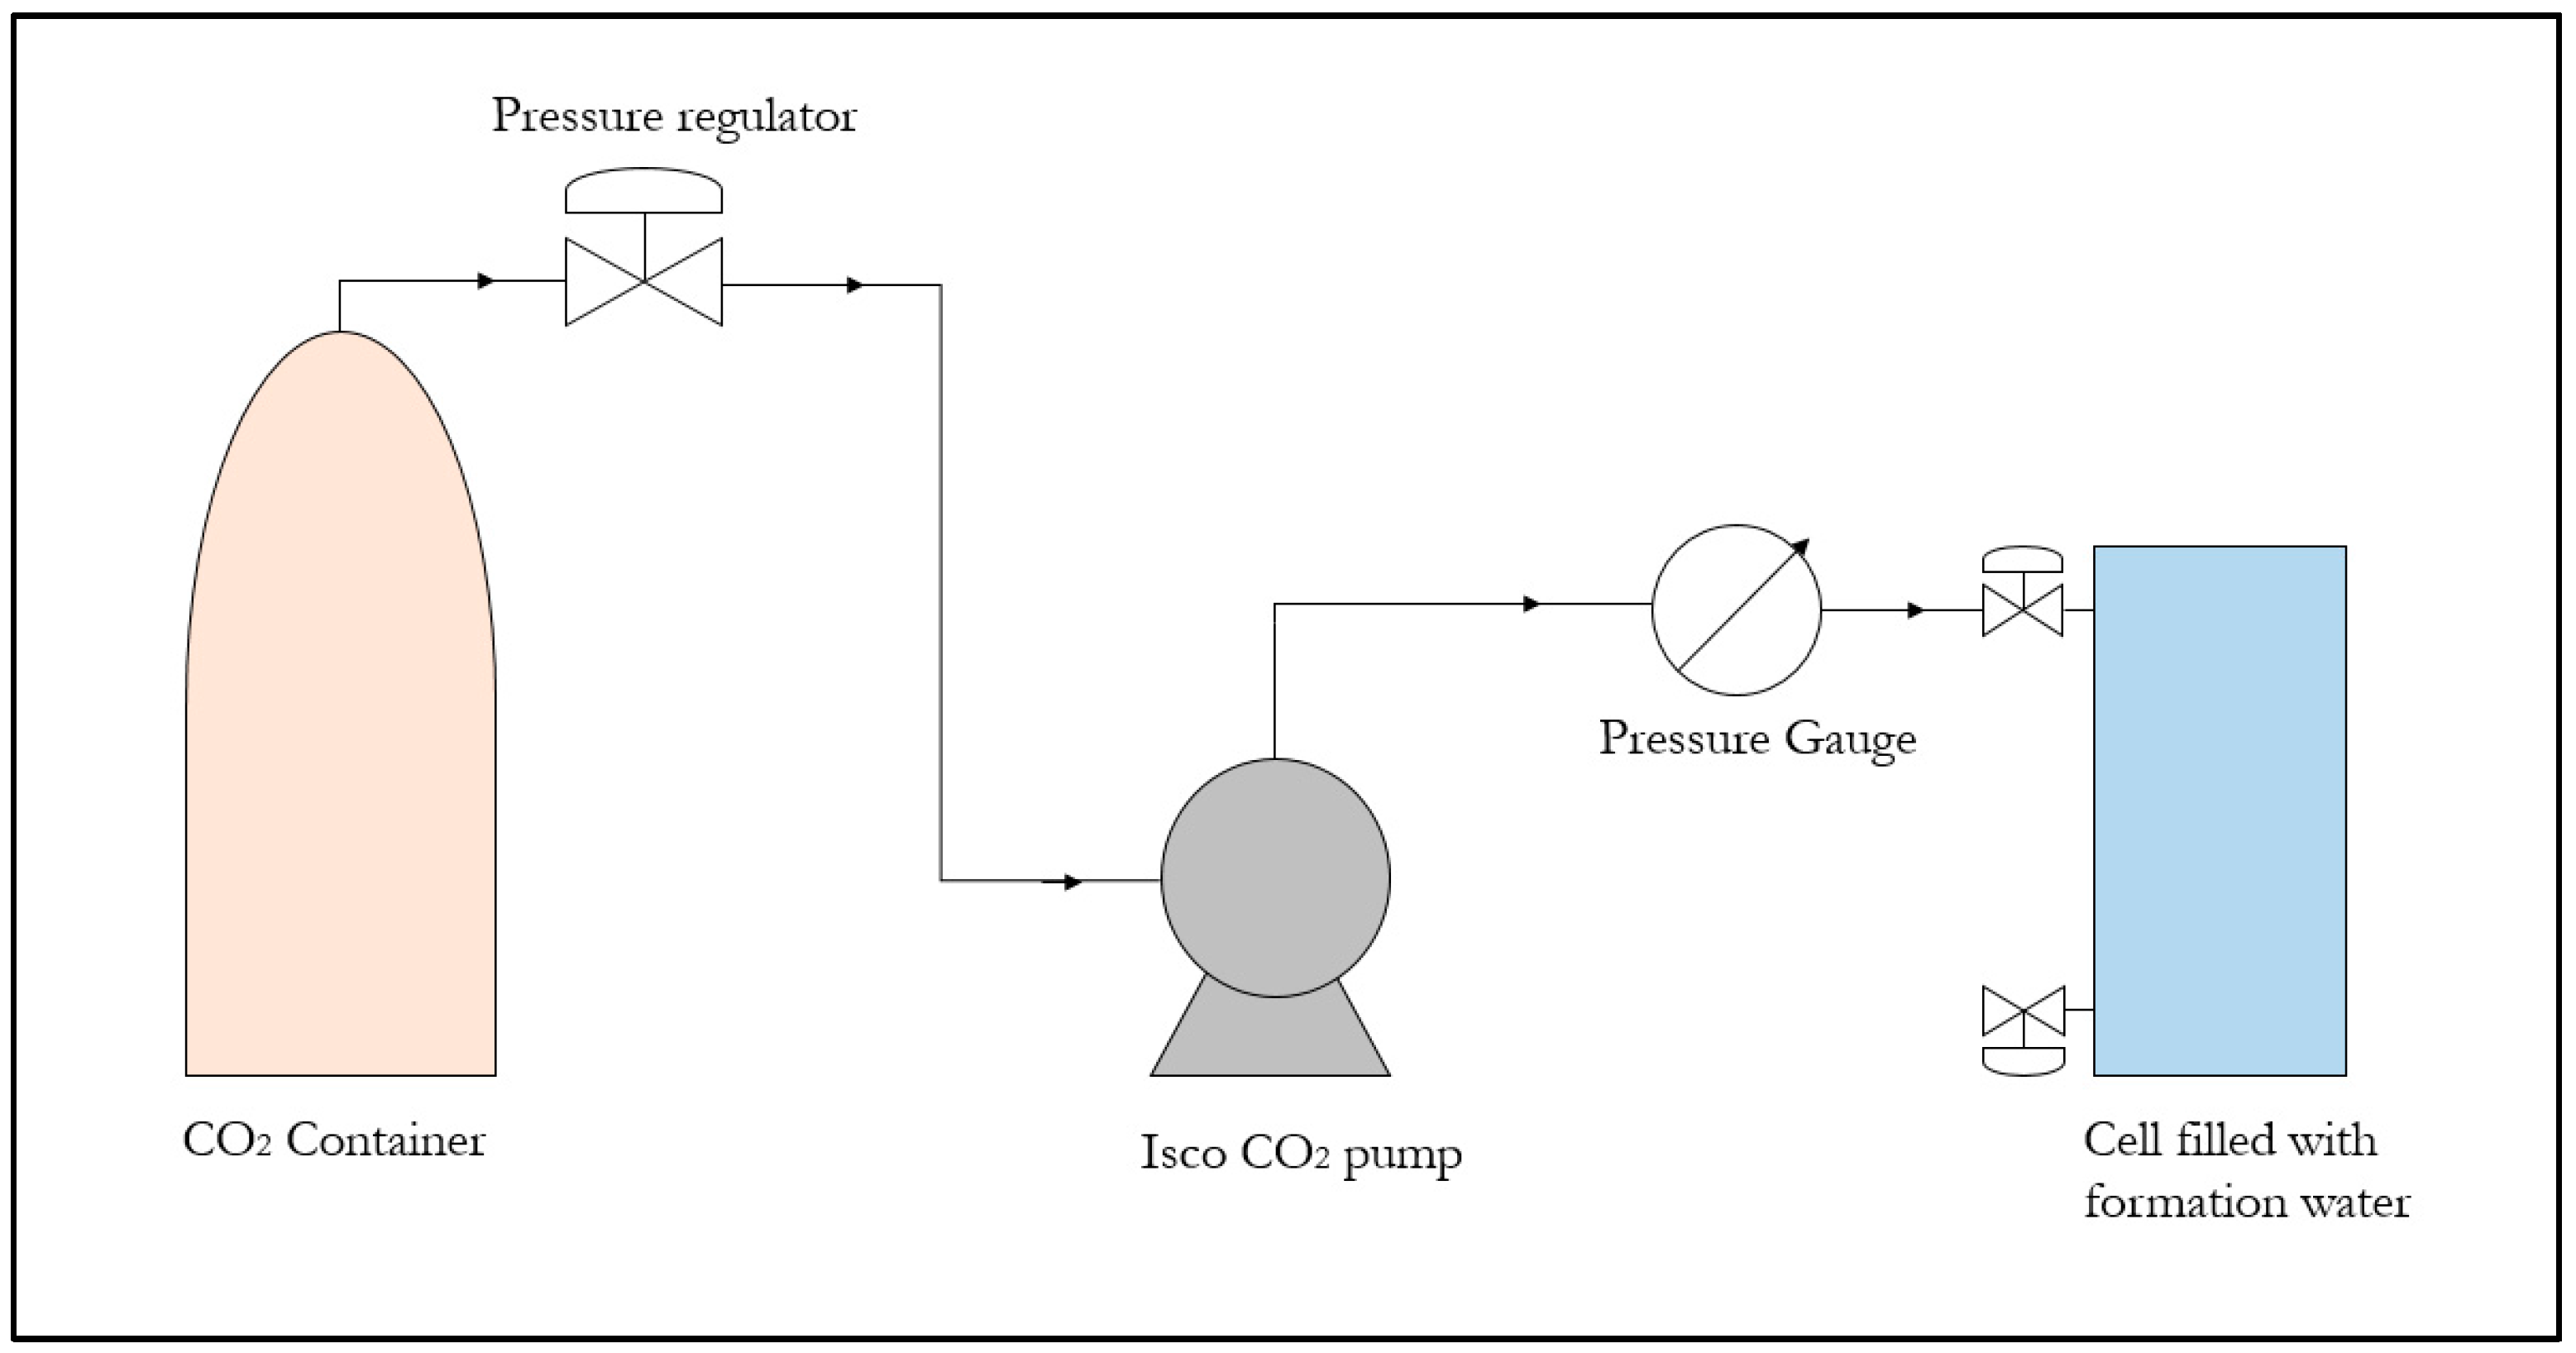
Figure 2.
Schematic of the experimental setup used in the core-flood experiments: the CO2 flow rig.

Figure 3.
A schematic of the bundle-of-tubes model. The core of length and radius was reconstructed into a bundle of parallel cylindrical capillary tubes with varying radii interspersed between non-porous mass.
Figure 3.
A schematic of the bundle-of-tubes model. The core of length and radius was reconstructed into a bundle of parallel cylindrical capillary tubes with varying radii interspersed between non-porous mass.
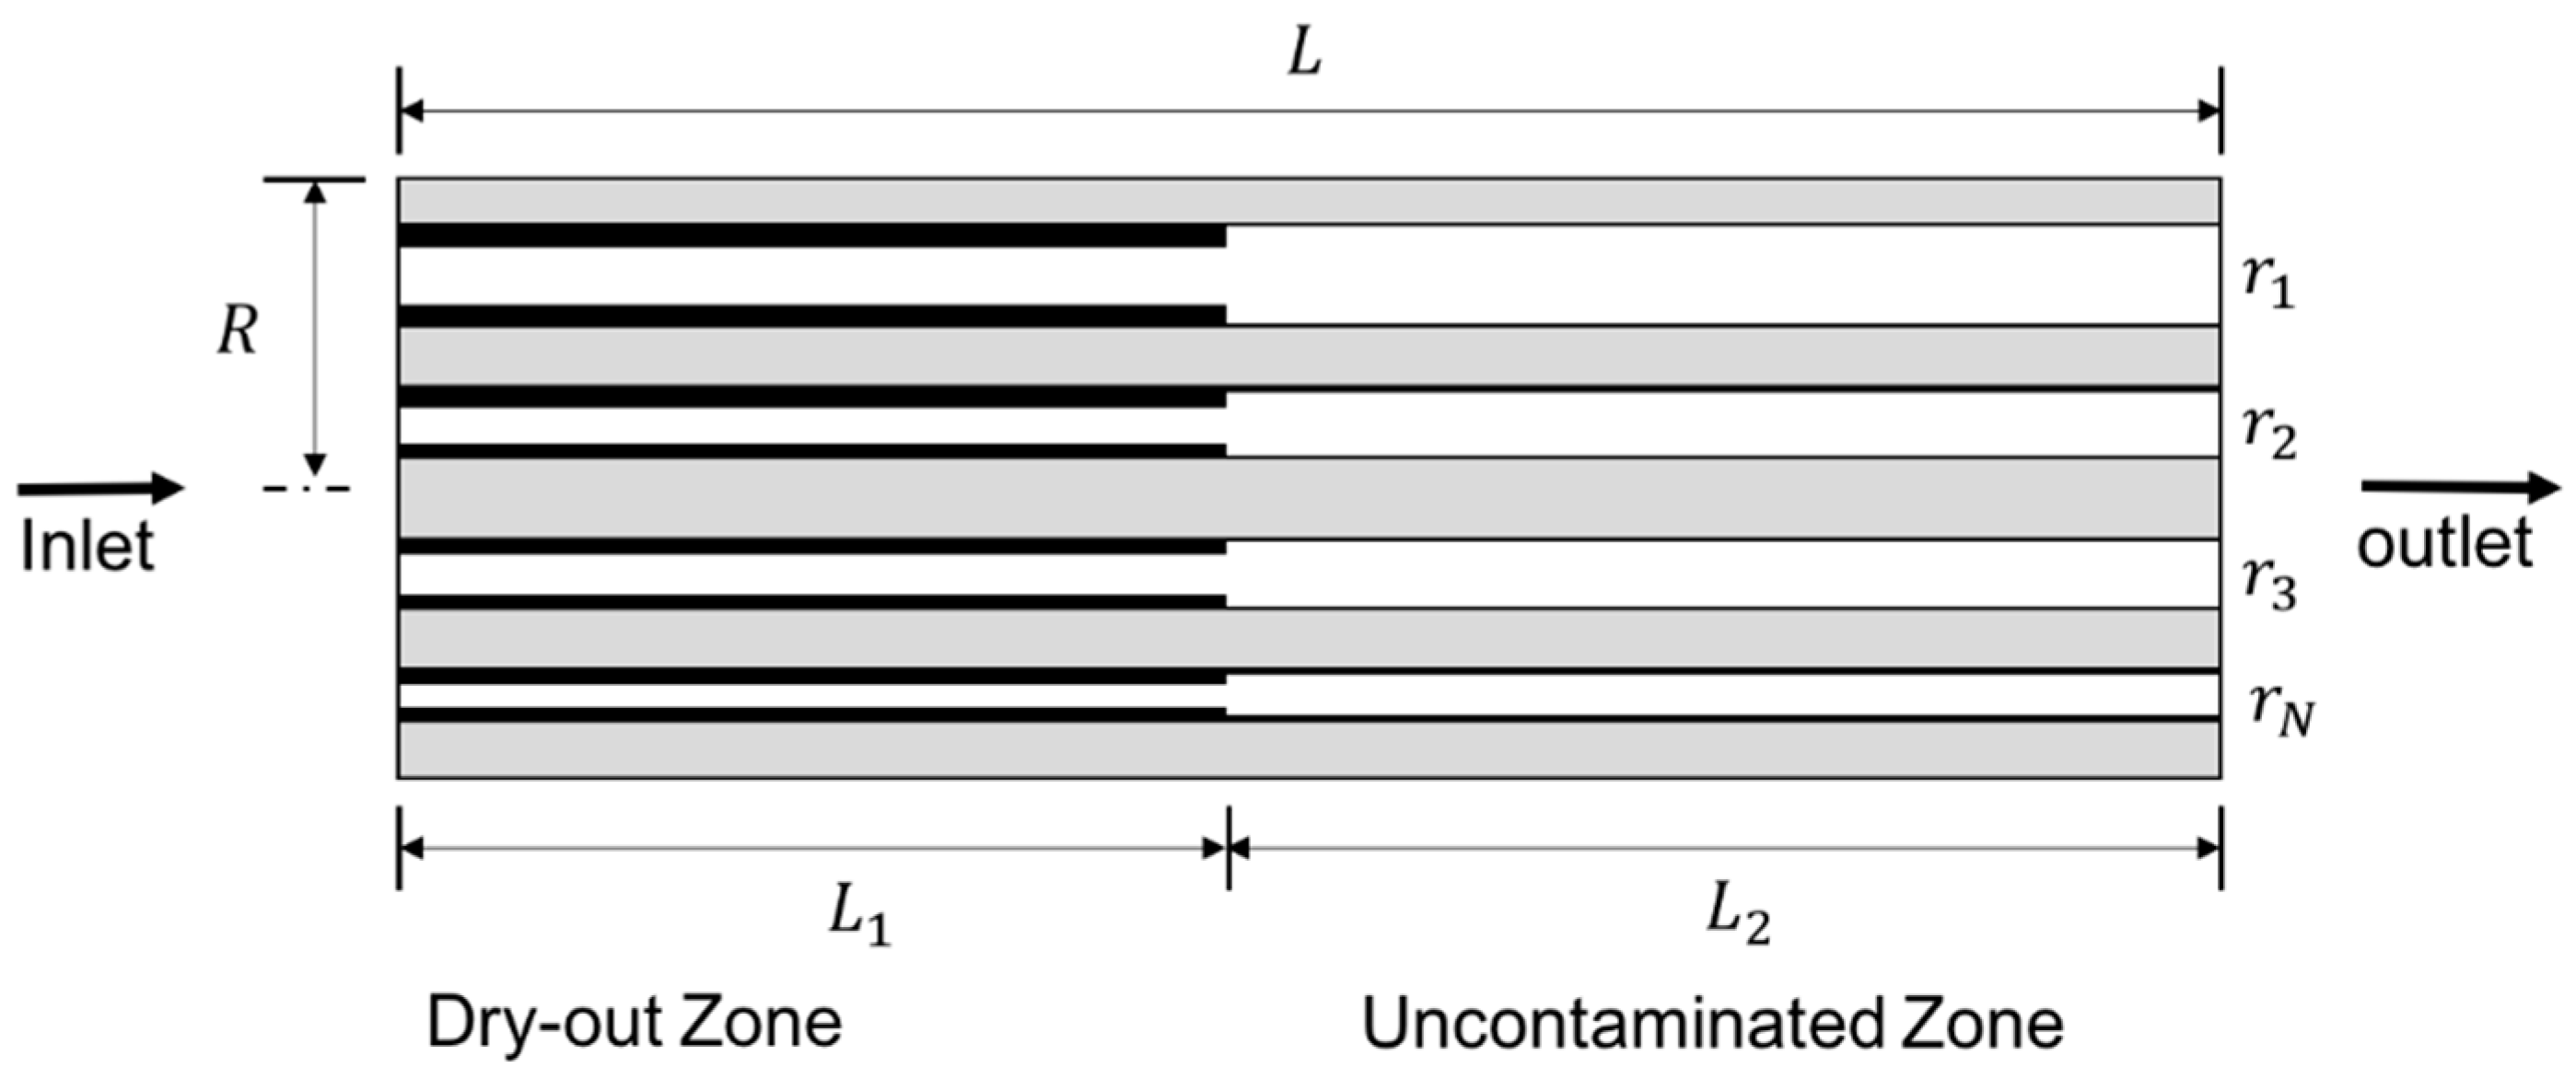
Figure 4.
Distribution of capillary tube radii used in the attempt to reconstruct the characteristics of sandstone core.
Figure 4.
Distribution of capillary tube radii used in the attempt to reconstruct the characteristics of sandstone core.

Figure 5.
Pressure drop profile recorded during injection of carbonated water into a Bentheimer core at a flow rate of 0.25 mL/min at 80 bar and 60 °C. The pressure drop is seen to fall sharply until about 3 pore volumes (PV), stabilizes between 3 PV and about 7 PV, and become very unstable afterwards.

Figure 6.
Effect of injection flow rate on injectivity impairment induced by fines migration. Injectivity impairment decreased with increasing rate of carbonated water injection flow rate.
Figure 6.
Effect of injection flow rate on injectivity impairment induced by fines migration. Injectivity impairment decreased with increasing rate of carbonated water injection flow rate.
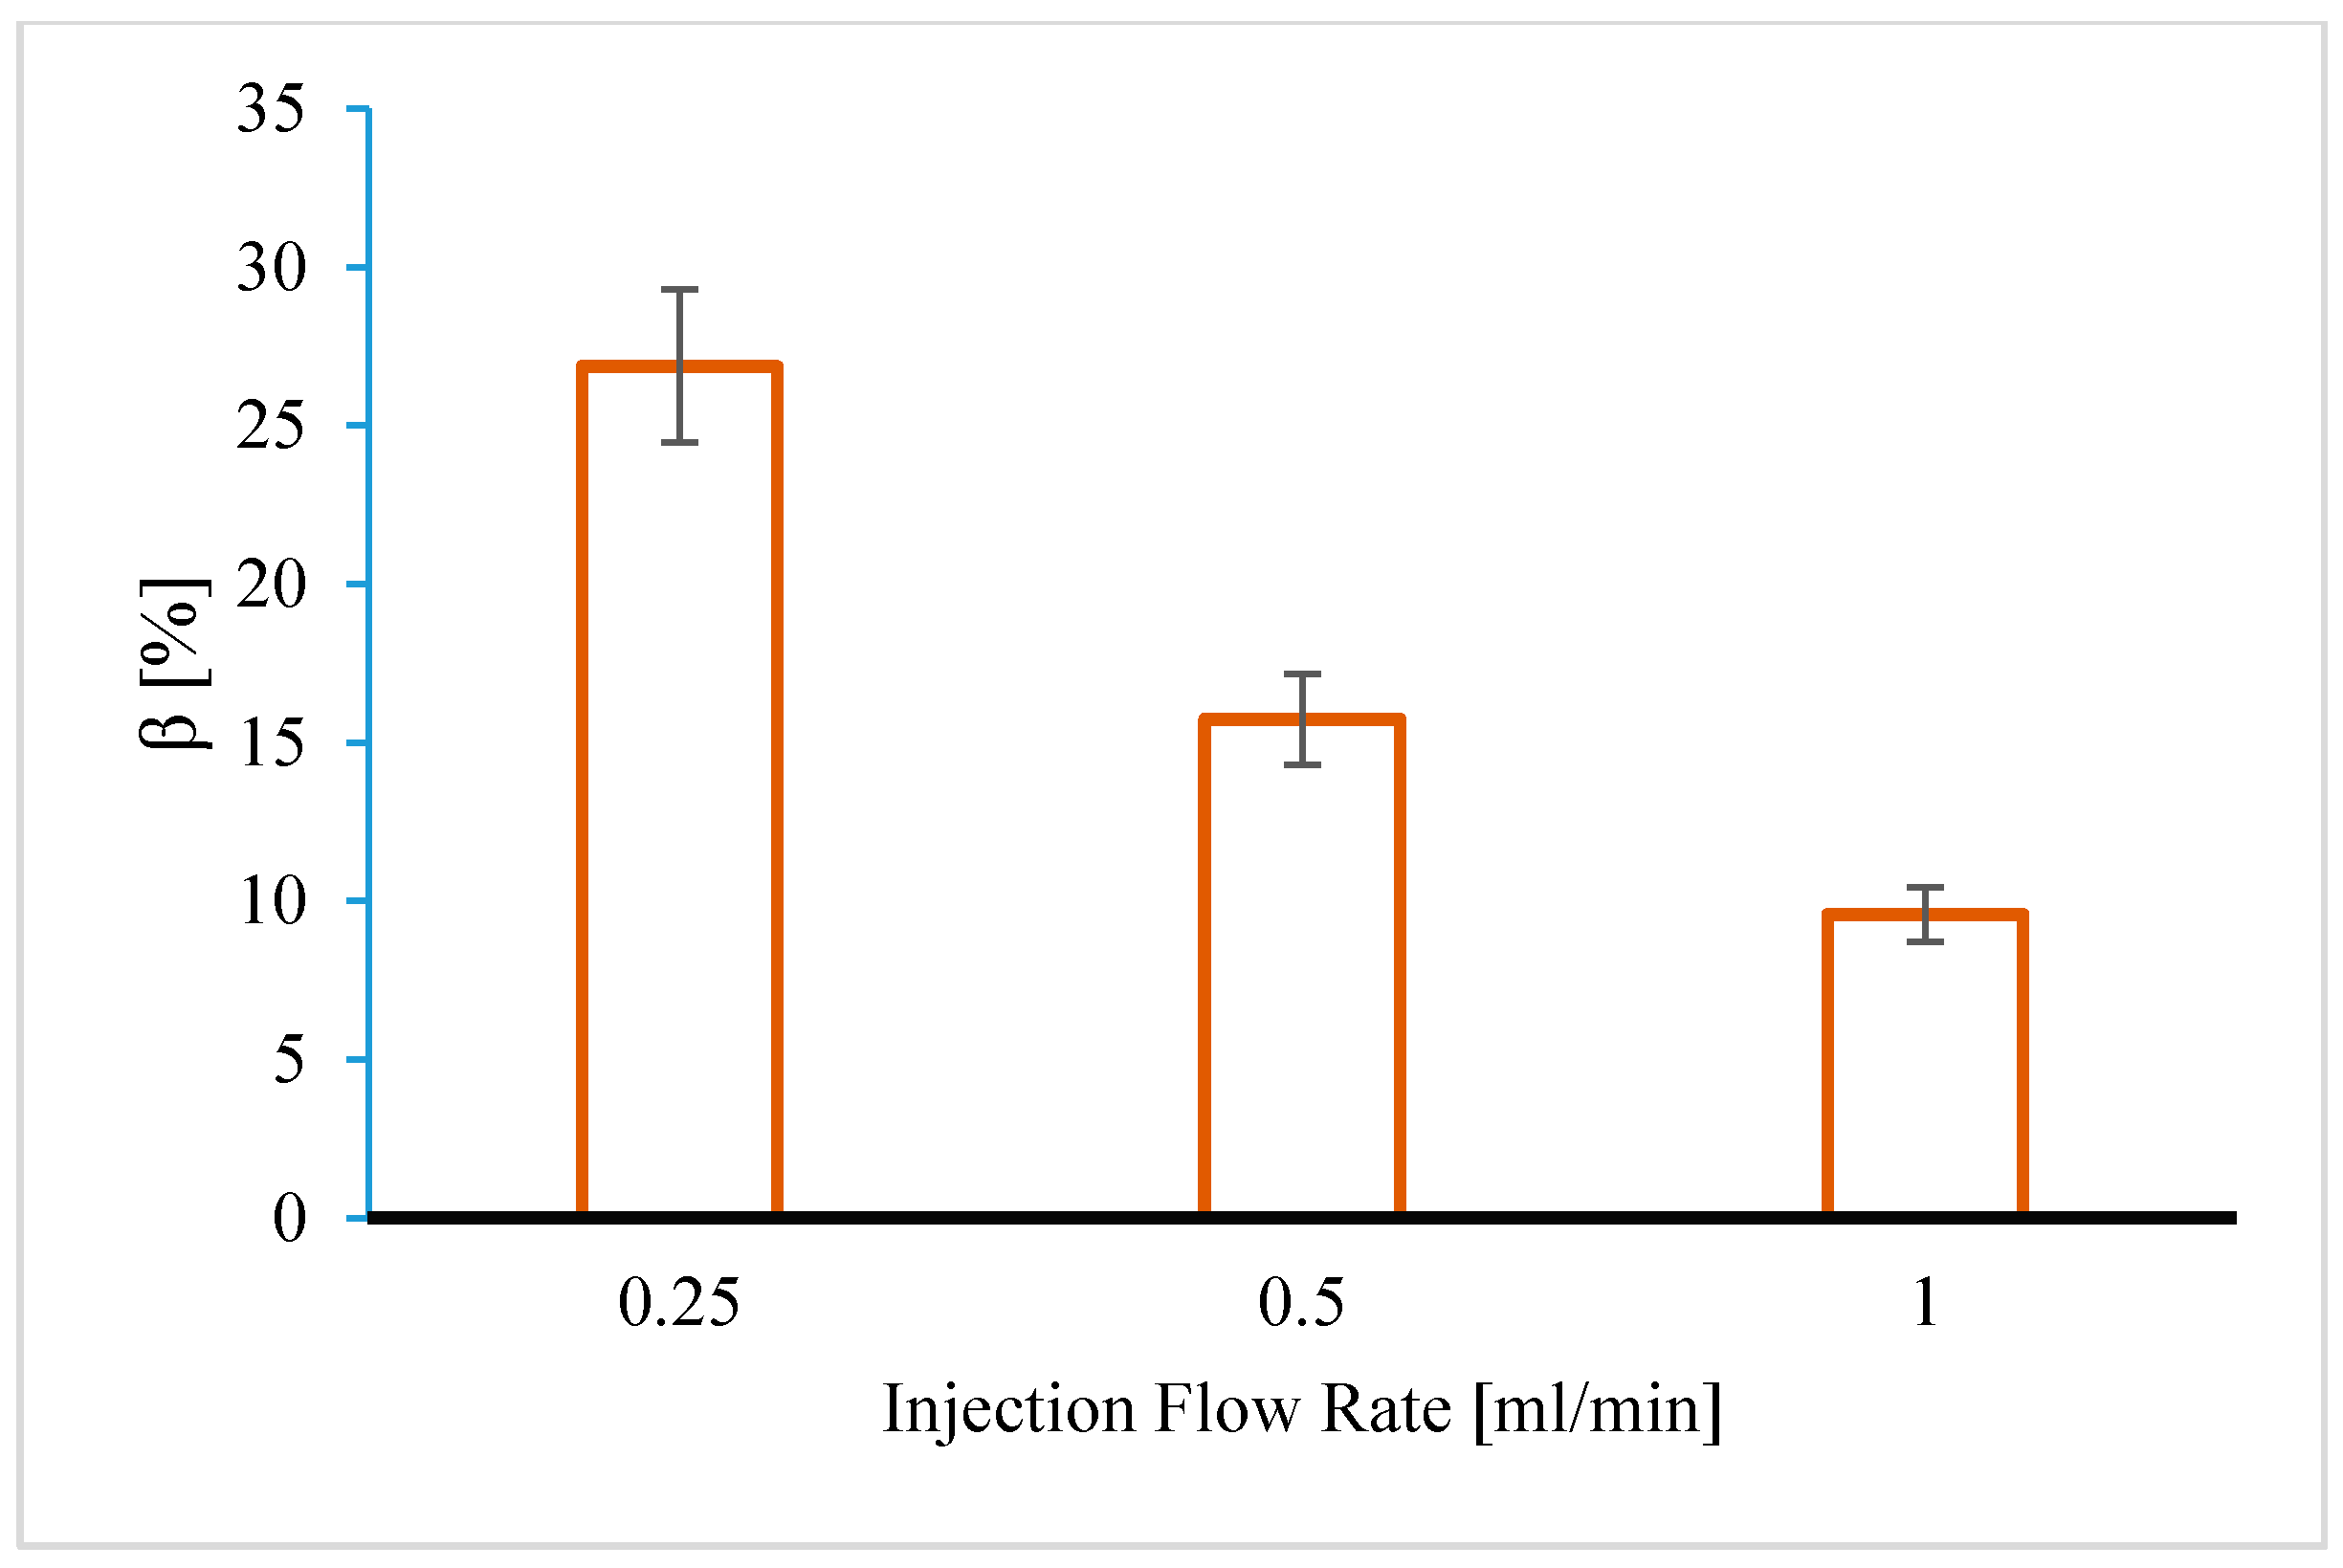
Figure 7.
The influence of initial rock permeability on injectivity impairment induced by mineral dissolution. There was no obvious correlation between injectivity impairment and initial rock permeability.
Figure 7.
The influence of initial rock permeability on injectivity impairment induced by mineral dissolution. There was no obvious correlation between injectivity impairment and initial rock permeability.

Figure 8.
The relative impact of fines mobilization and salt precipitation on CO2 injectivity. Fines migration had a more severe impact on injectivity compared to salt precipitation.
Figure 8.
The relative impact of fines mobilization and salt precipitation on CO2 injectivity. Fines migration had a more severe impact on injectivity compared to salt precipitation.
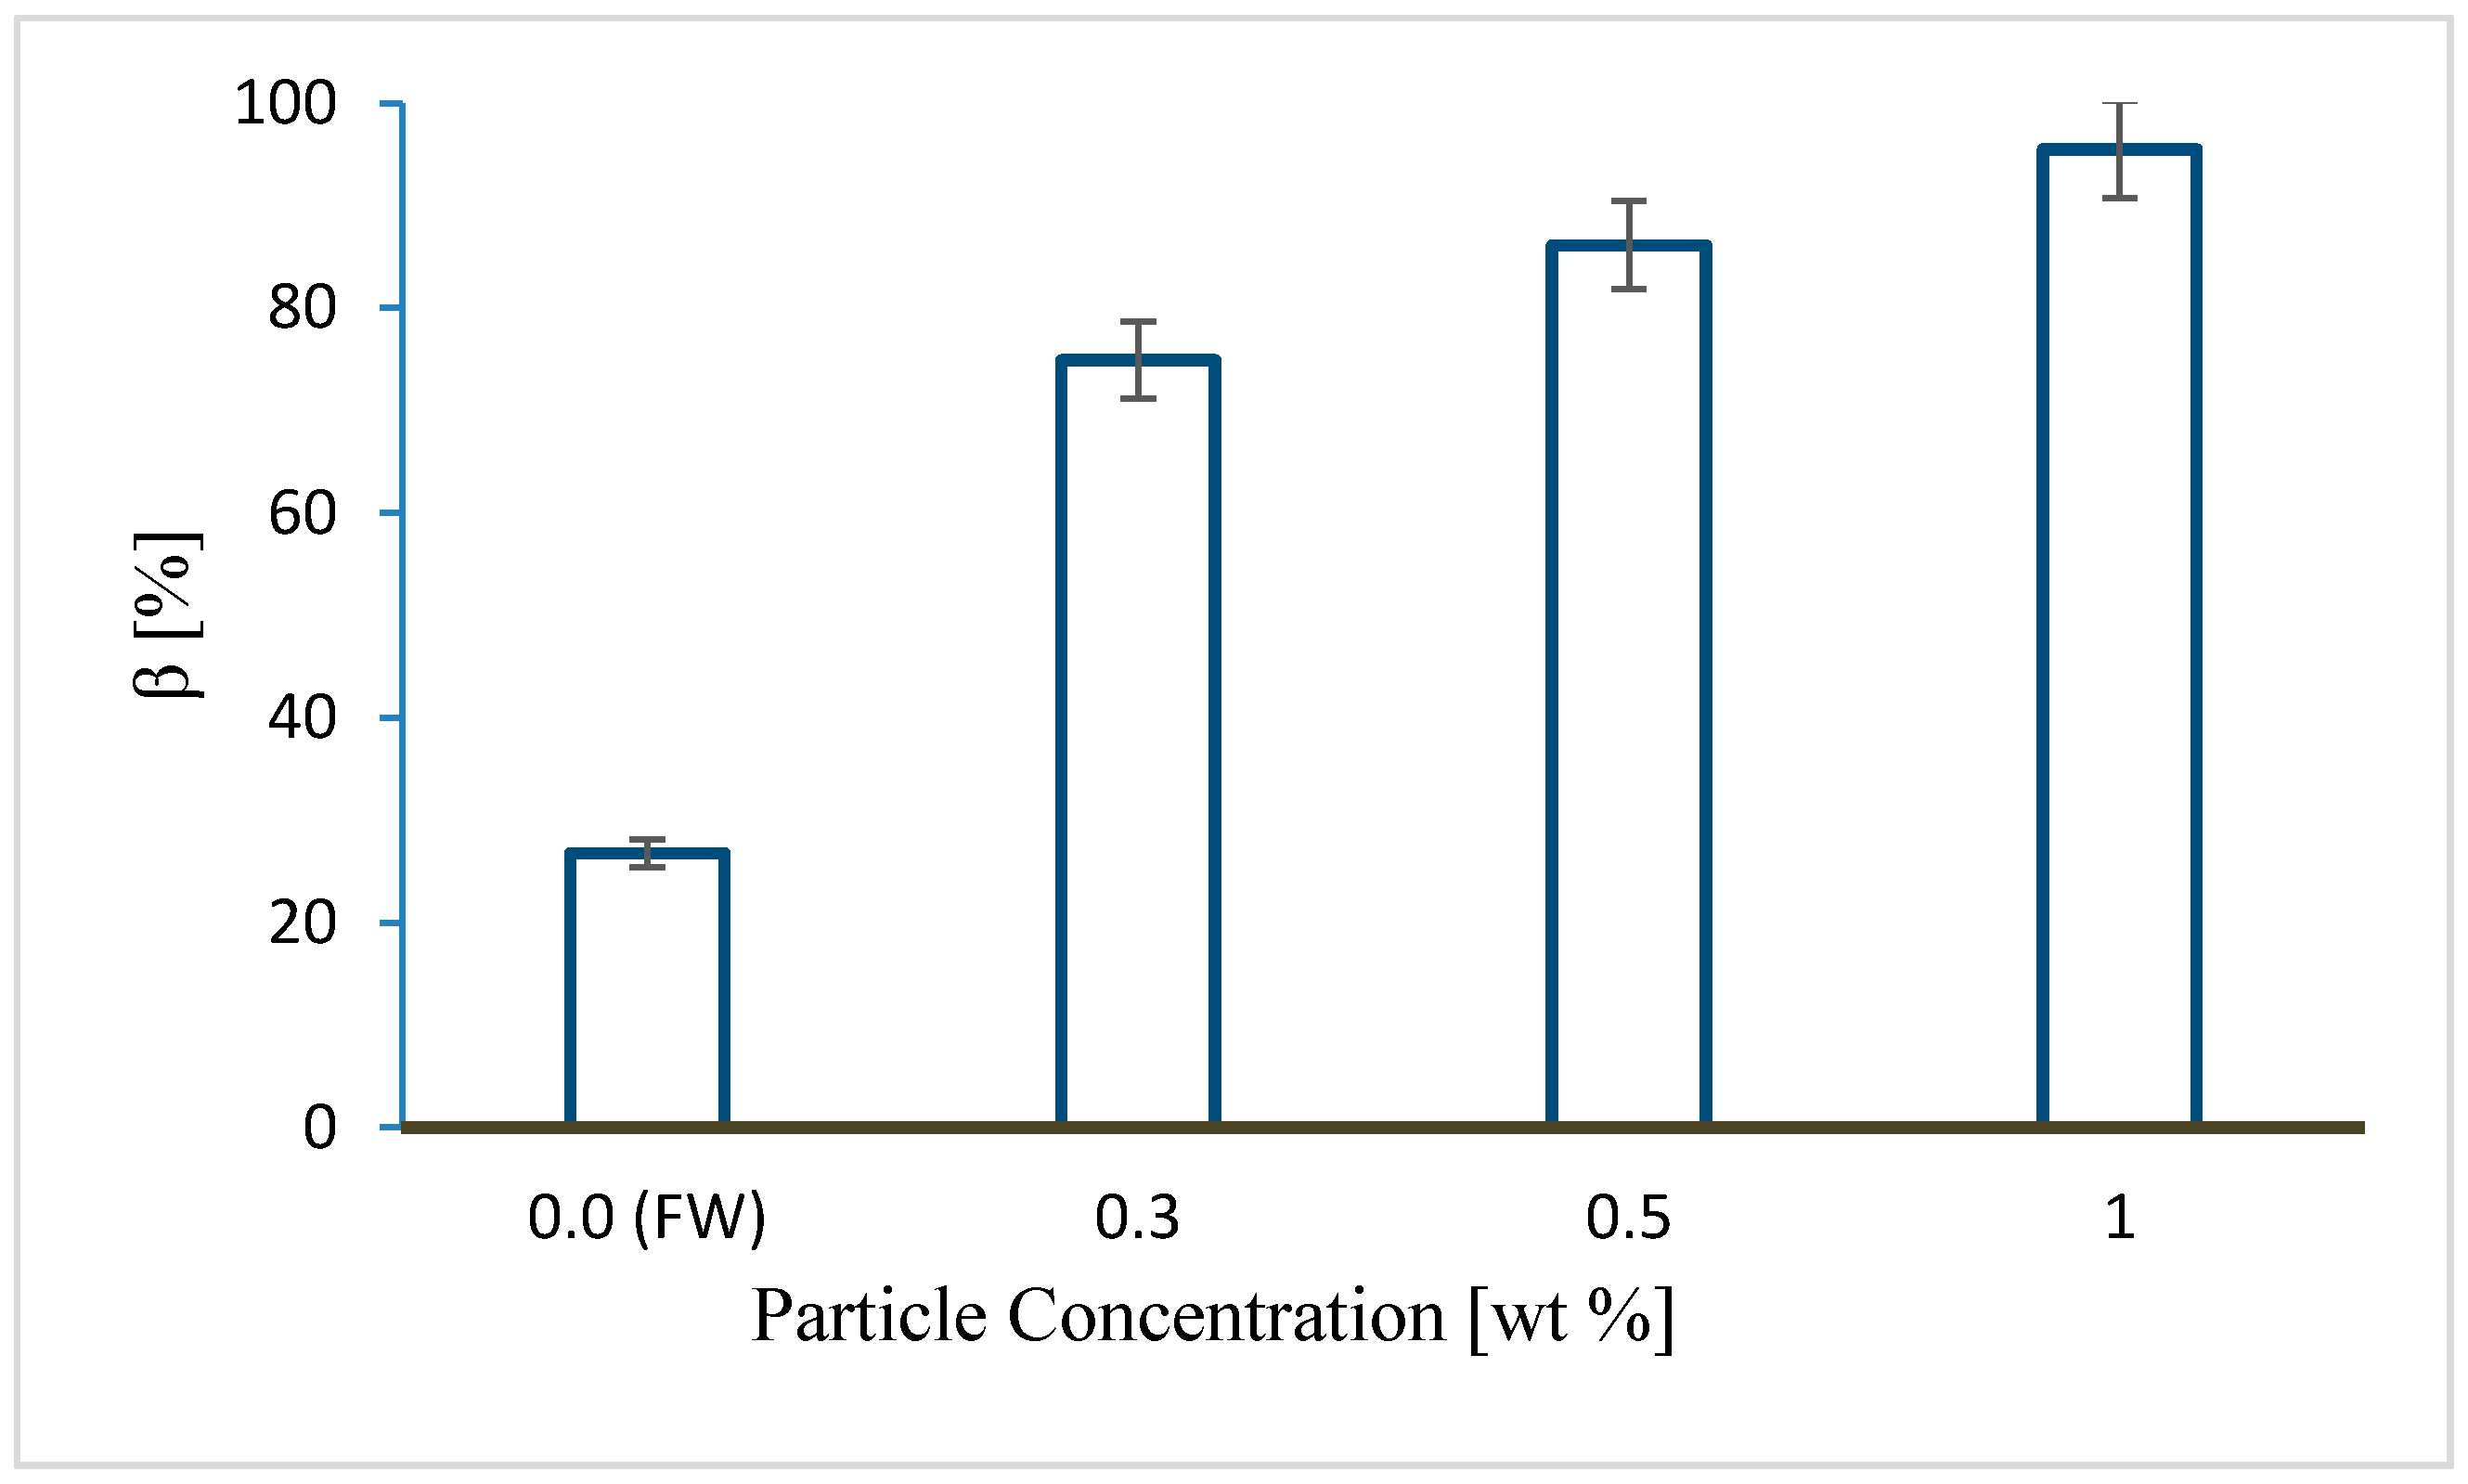
Figure 9.
The coupled effect of fines mobilization and salt precipitation on CO2 injectivity. Salt precipitation seems to compound injectivity impairment induced by fines migration. HS, high salinity brine; LS, low salinity brine.
Figure 9.
The coupled effect of fines mobilization and salt precipitation on CO2 injectivity. Salt precipitation seems to compound injectivity impairment induced by fines migration. HS, high salinity brine; LS, low salinity brine.


Table 1.
Characteristics of sandstone core samples used in the experiments.
| Rock | Permeability (mD) | Porosity (%) |
|---|---|---|
| Berea | 90–120 | 17–19 |
| Bentheimer | 1200–2000 | 22–24 |
| Bandera | 4–10 | 19–21 |
Table 2.
Characteristics of fumed alumina stock solution used to prepare the colloid suspensions.
| Properties | Data |
|---|---|
| Particle size (µm) | 0.08 |
| Al2O3 content (%) | 39–41 |
| Viscosity (mPa/s) | <90 |
| pH | 6.0–9.0 |
| Density (g/cc) | 1.39 |
Table 3.
Energy Dispersive Spectroscopy (EDS) analysis of effluent samples collected during carbonated water flooding into Bentheimer core.
Table 3.
Energy Dispersive Spectroscopy (EDS) analysis of effluent samples collected during carbonated water flooding into Bentheimer core.
| Element | wt % |
|---|---|
| O | 33.56 |
| Fe | 7.78 |
| Ni | 5.02 |
| Na | 17.53 |
| Mg | 0.74 |
| Al | 2.53 |
| Si | 0.35 |
| Cl | 29.79 |
| Ca | 2.52 |
| Co | 0.17 |
| Total | 100.00 |
© 2017 by the authors. Licensee MDPI, Basel, Switzerland. This article is an open access article distributed under the terms and conditions of the Creative Commons Attribution (CC BY) license (http://creativecommons.org/licenses/by/4.0/).
Share and Cite
MDPI and ACS Style
Sokama-Neuyam, Y.A.; Forsetløkken, S.L.; Lien, J.-e.; Ursin, J.R. The Coupled Effect of Fines Mobilization and Salt Precipitation on CO2 Injectivity. Energies 2017, 10, 1125. https://doi.org/10.3390/en10081125
AMA Style
Sokama-Neuyam YA, Forsetløkken SL, Lien J-e, Ursin JR. The Coupled Effect of Fines Mobilization and Salt Precipitation on CO2 Injectivity. Energies. 2017; 10(8):1125. https://doi.org/10.3390/en10081125
Chicago/Turabian StyleSokama-Neuyam, Yen Adams, Sindre Langås Forsetløkken, Jhon-eirik Lien, and Jann Rune Ursin. 2017. "The Coupled Effect of Fines Mobilization and Salt Precipitation on CO2 Injectivity" Energies 10, no. 8: 1125. https://doi.org/10.3390/en10081125
Note that from the first issue of 2016, this journal uses article numbers instead of page numbers. See further details here.