Transformer Paper Expected Life Estimation Using ANFIS Based on Oil Characteristics and Dissolved Gases (Case Study: Indonesian Transformers)


Abstract
:1. Introduction
2. Methodology
2.1. Transformer Paper Deterioration Indicator
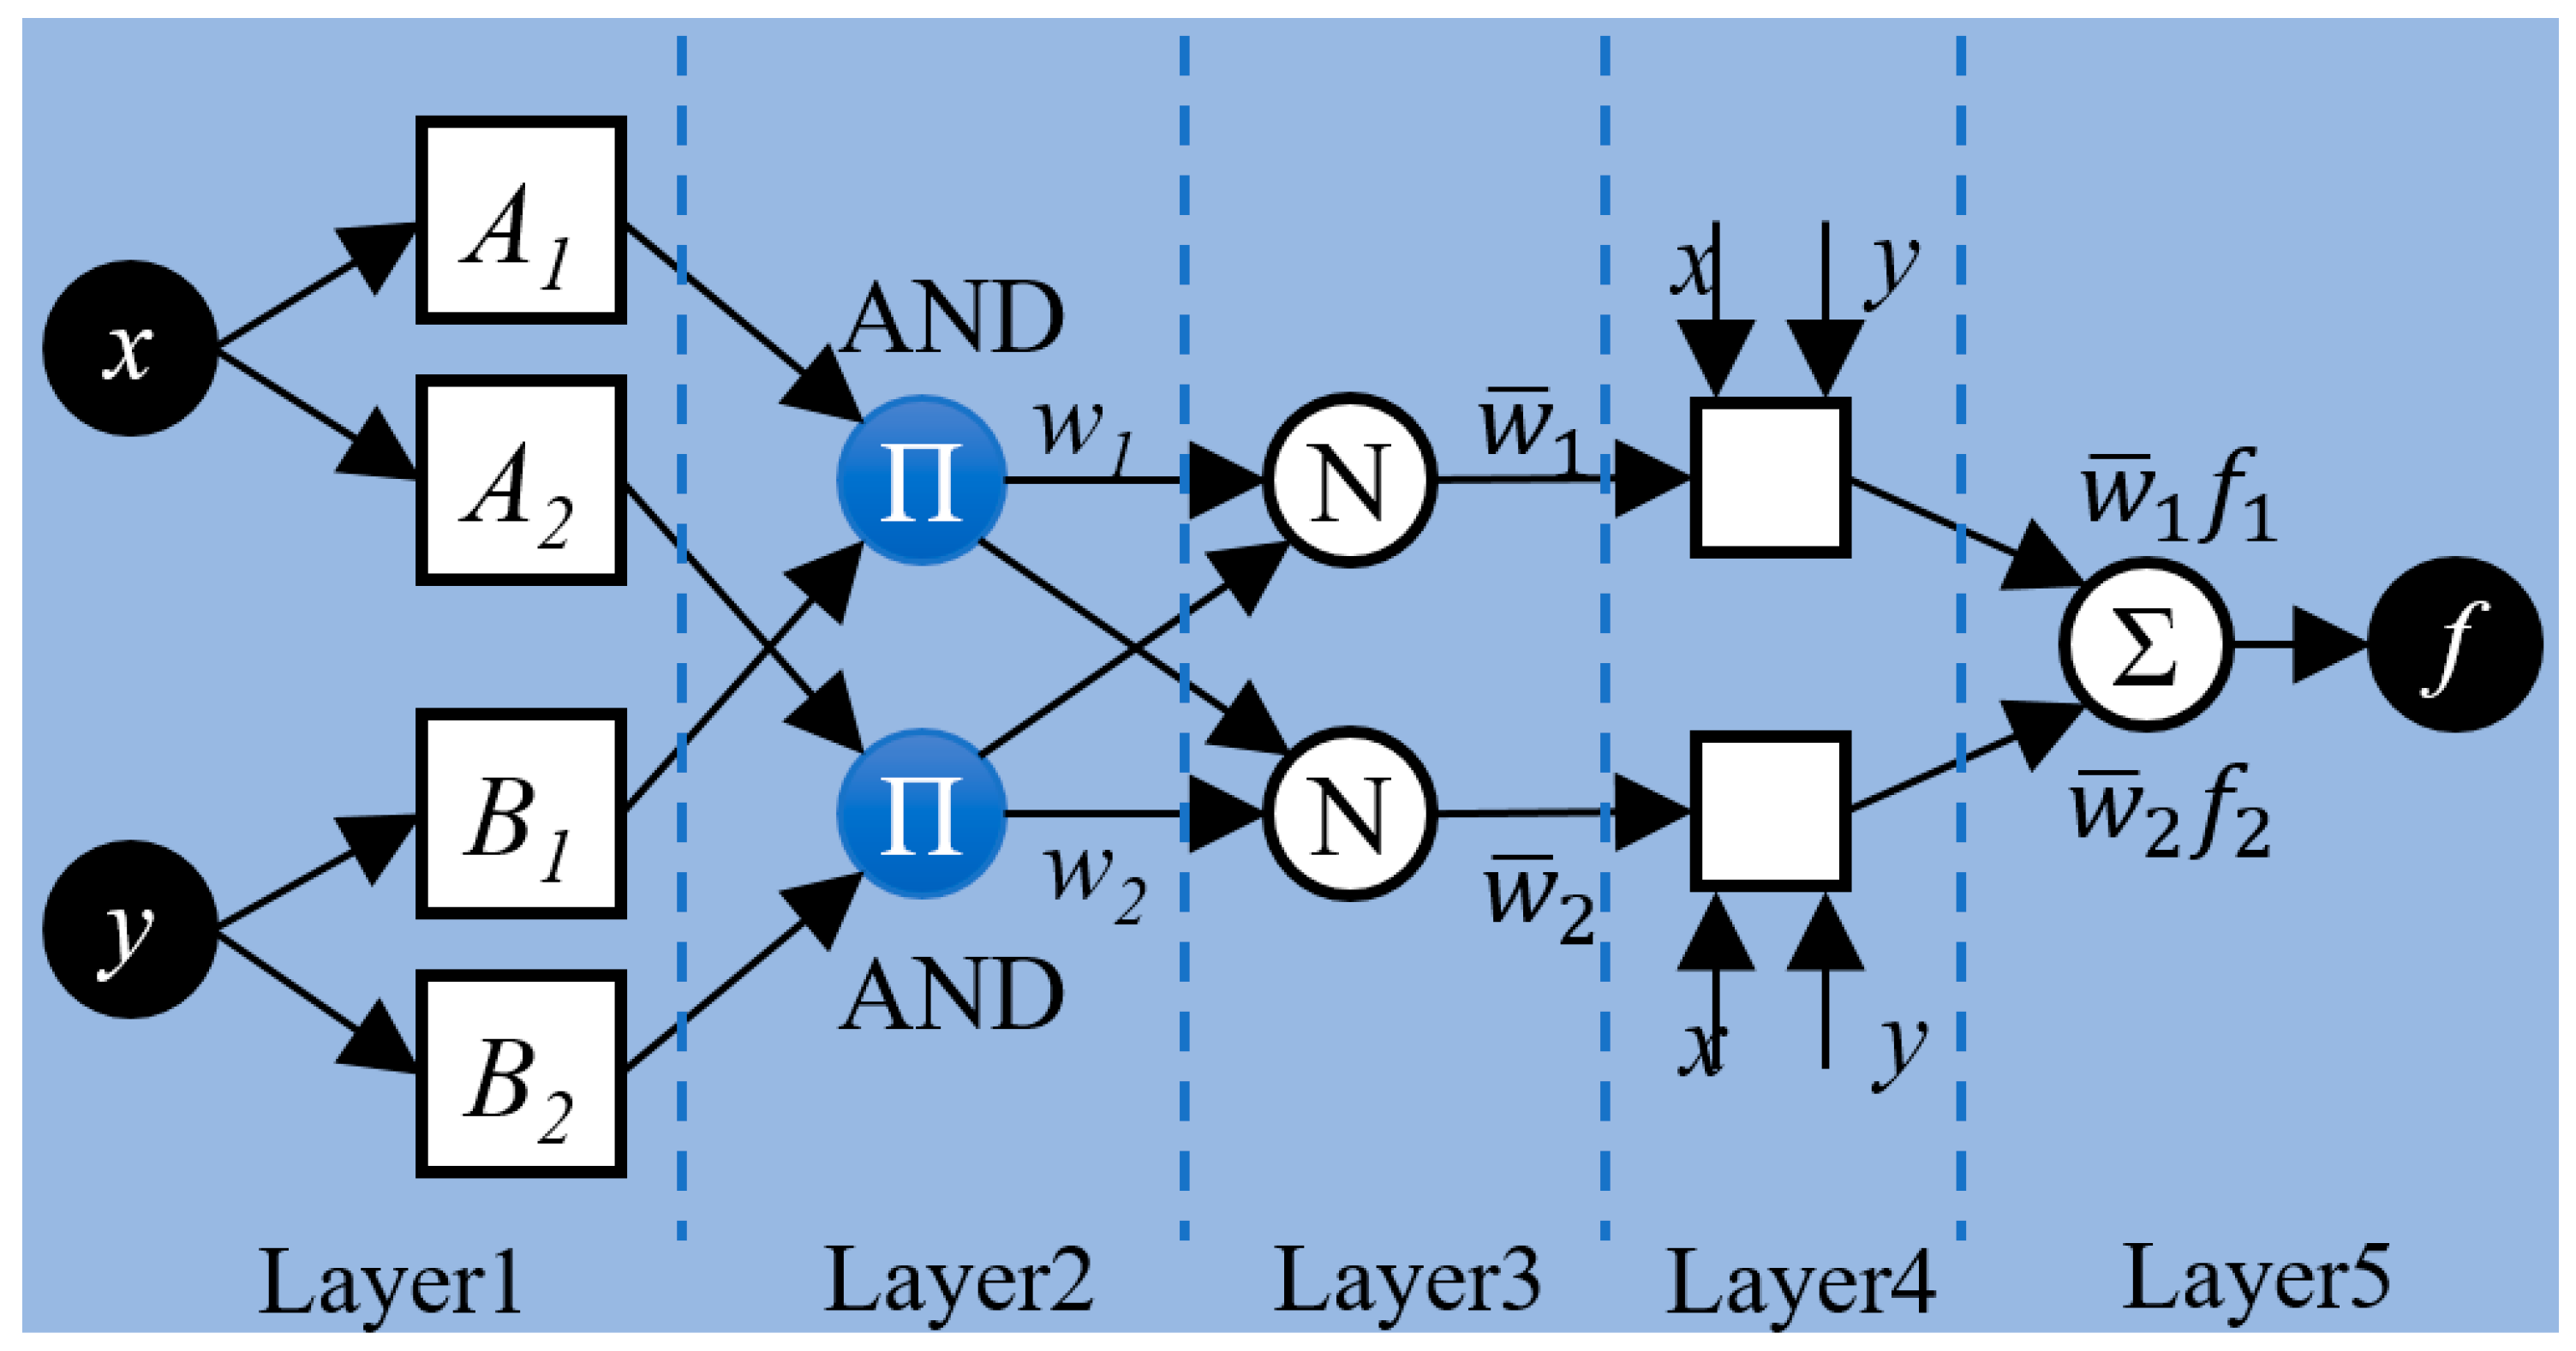
2.2. Adaptive Neuro-Fuzzy Inference System
| Rule 1: IF x is A1 AND y is B1 THEN f1 = 1 |
| Rule 2: IF x is A2 AND y is B1 THEN f2 = 2 |
| Rule 3: IF x is A1 AND y is B2 THEN f3 = 3 |
| Rule 4: IF x is A2 AND y is B2 THEN f4 = 4 |
| …. and so on |
2.3. Potential Input Variables
2.3.1. Dielectric Characteristics
- Breakdown voltage in kV (IEC 60156-02)
- Water content in ppm (IEC 60814)
- Acidity in mg KOH/g (IEC 62021-1)
- Interfacial tension in dyne/cm (ASTM D 971-99a)
- Color (ISO 2049)
2.3.2. Dissolved Gas Analysis
- H2 (hydrogen)
- CH4 (methane)
- N2 (nitrogen)
- O2 (oxygen)
- CO (carbon monoxide)
- CO2 (carbon dioxide)
- C2H6 (ethane)
- C2H4 (ethylene)
- C2H2 (acetylene)
- Tdcg (Total Dissolved Combustible Gas)
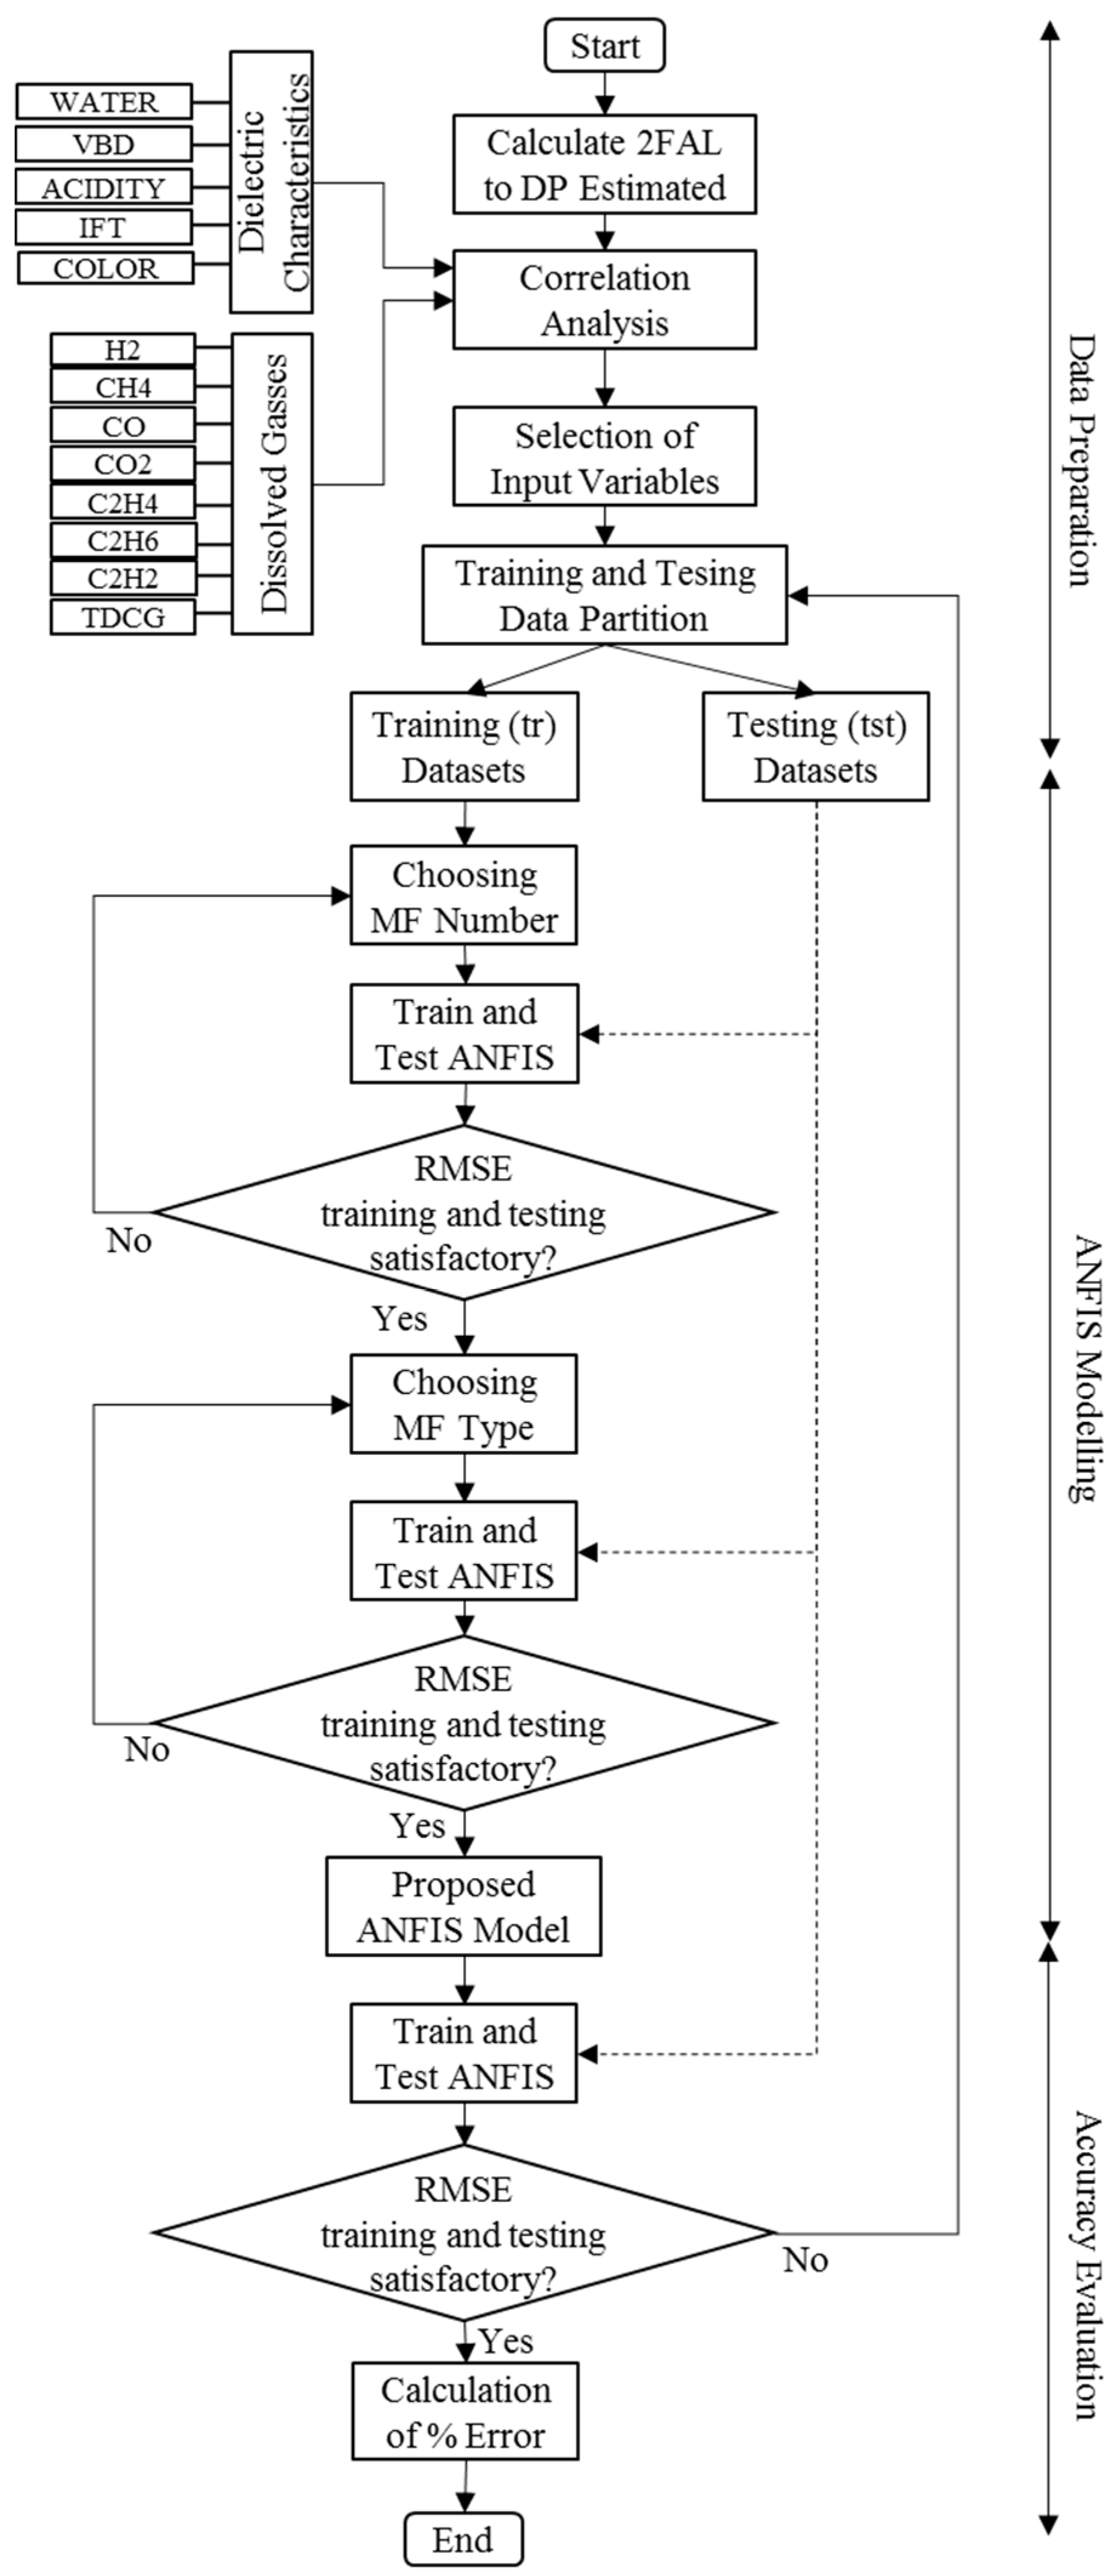
2.4. Modelling ANFIS for Transformer Paper Condition
- (1)
- Data Preparation: In the first stage, DP is estimated from 2FAL using Equations (1) and (2). The correlation of estimated DP and potential variables consists of dielectric characteristics, and the dissolved gases of transformer oil are analysed. The best combination of input variables for predicting DP is selected. The data from 108 transformers are then divided into training and testing datasets. 76 datasets will be used for training, and 32 datasets will be used to evaluate the proposed model.
- (2)
- ANFIS Modelling: The training dataset is used for building the ANFIS model. The next step is to find the optimal combination of the Membership Function (MF). The number and type of MF for each input variable is selected, the model of each combination is trained using the training dataset, and each model is tested to find the satisfactory combination.
- (3)
- Accuracy Evaluation: The proposed model is tested using the testing datasets, and then the error is calculated both from training and testing.
2.5. Prediction Accuracy and Evaluation
2.5.1. Mean Absolute Error (MAE)
2.5.2. Symmetric Mean Absolute Percentage Error (SMAPE)
2.5.3. Root Mean Squared Error (RMSE)
2.6. Transformer Paper Expected Life Estimation
2.7. Transformer Dielectric Characteristics and Dissolved Gases Data
3. Results and Discussion
3.1. Input Selection
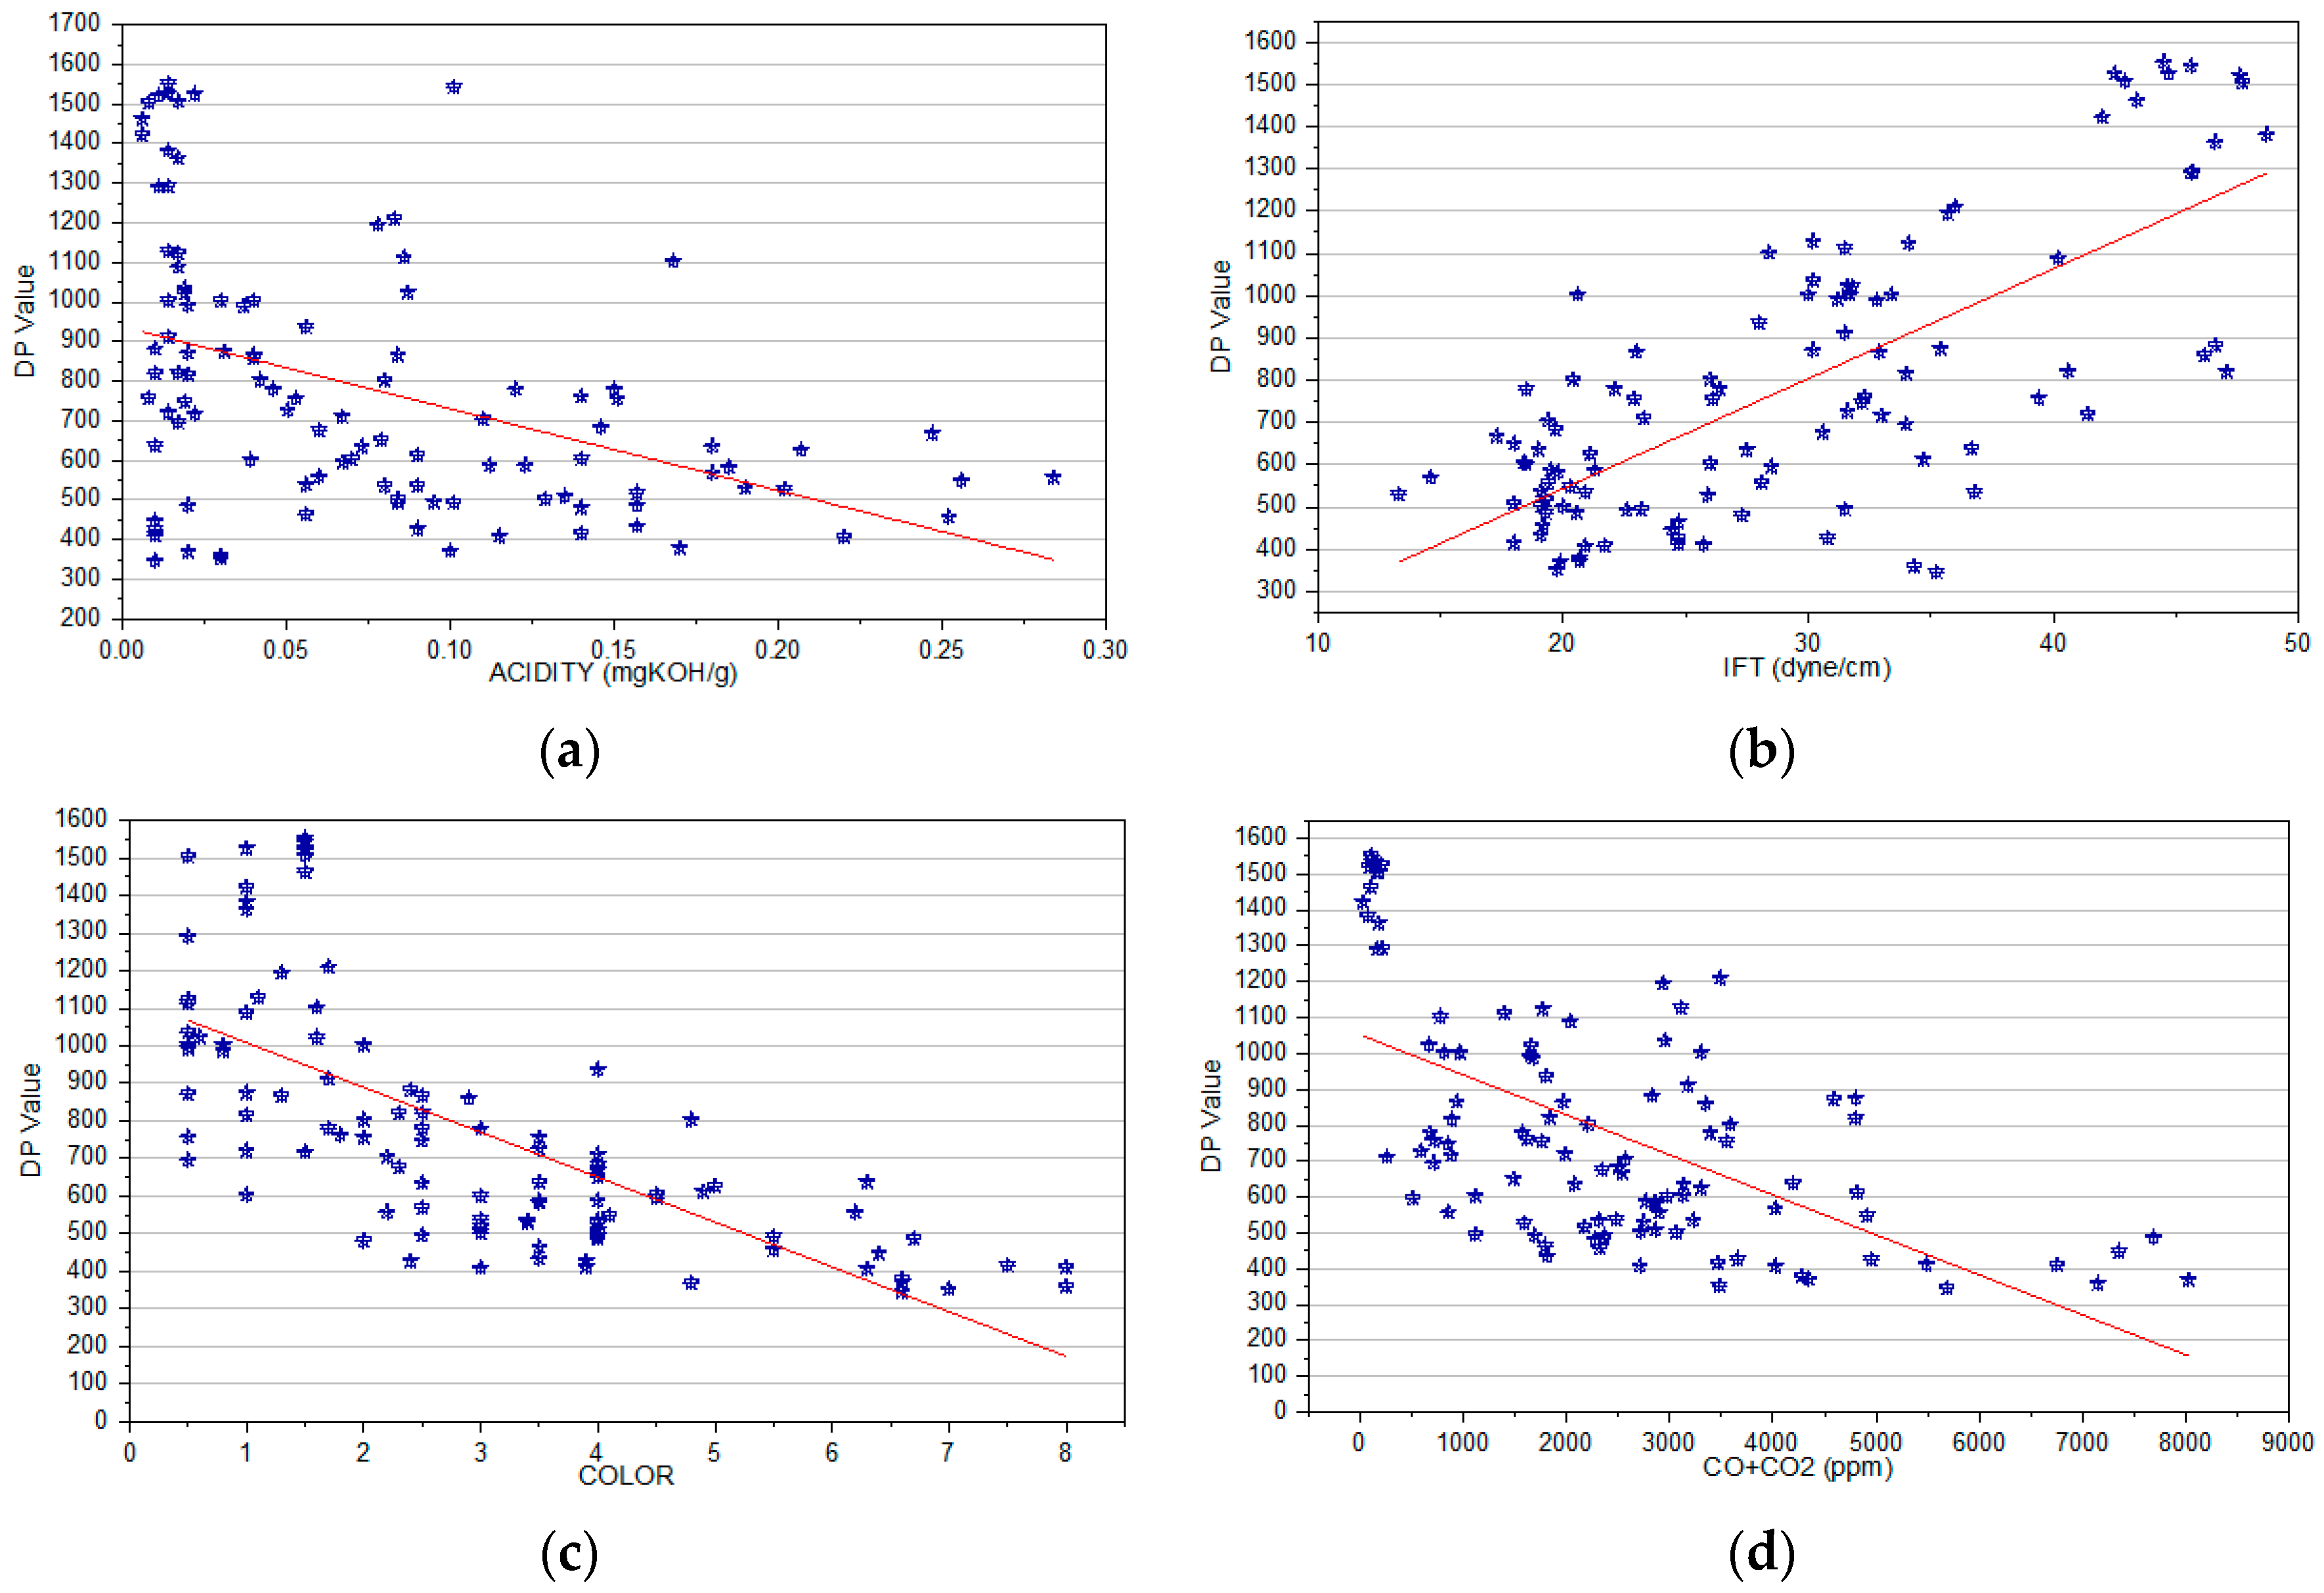
3.1.1. Correlation Analysis
3.1.2. Various Combination of Input Variables
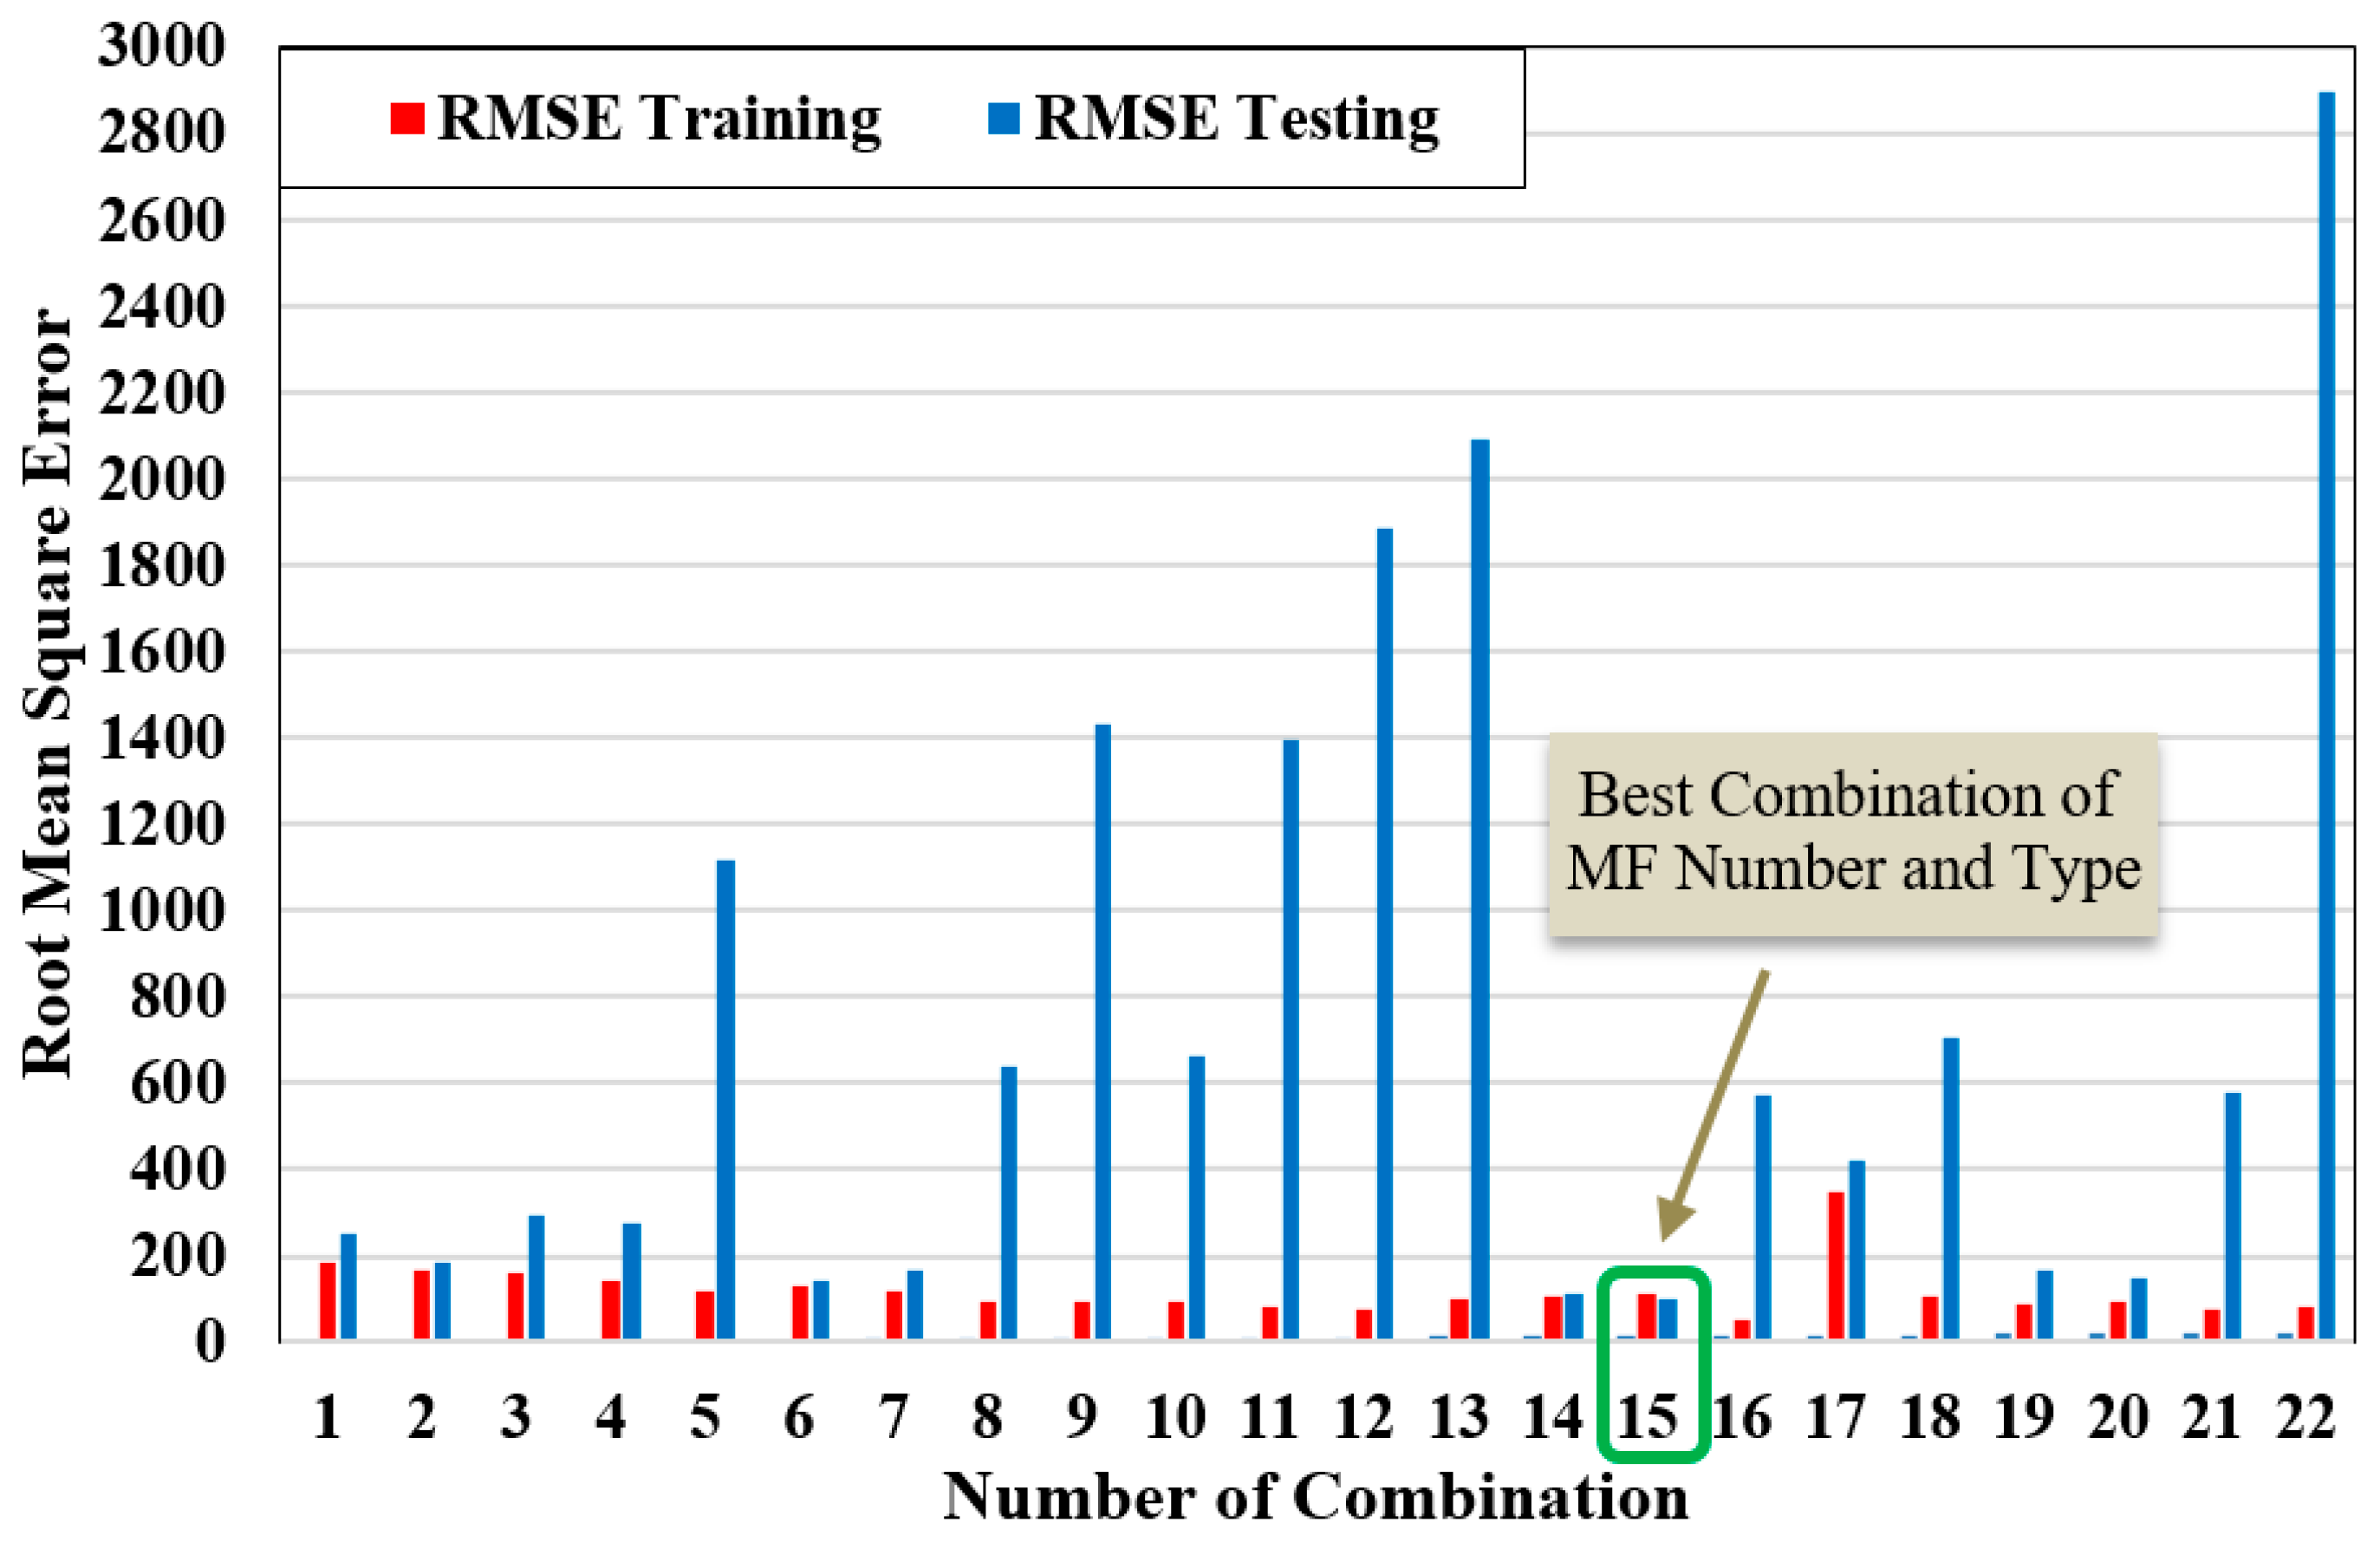
3.2. Membership Functions Selection
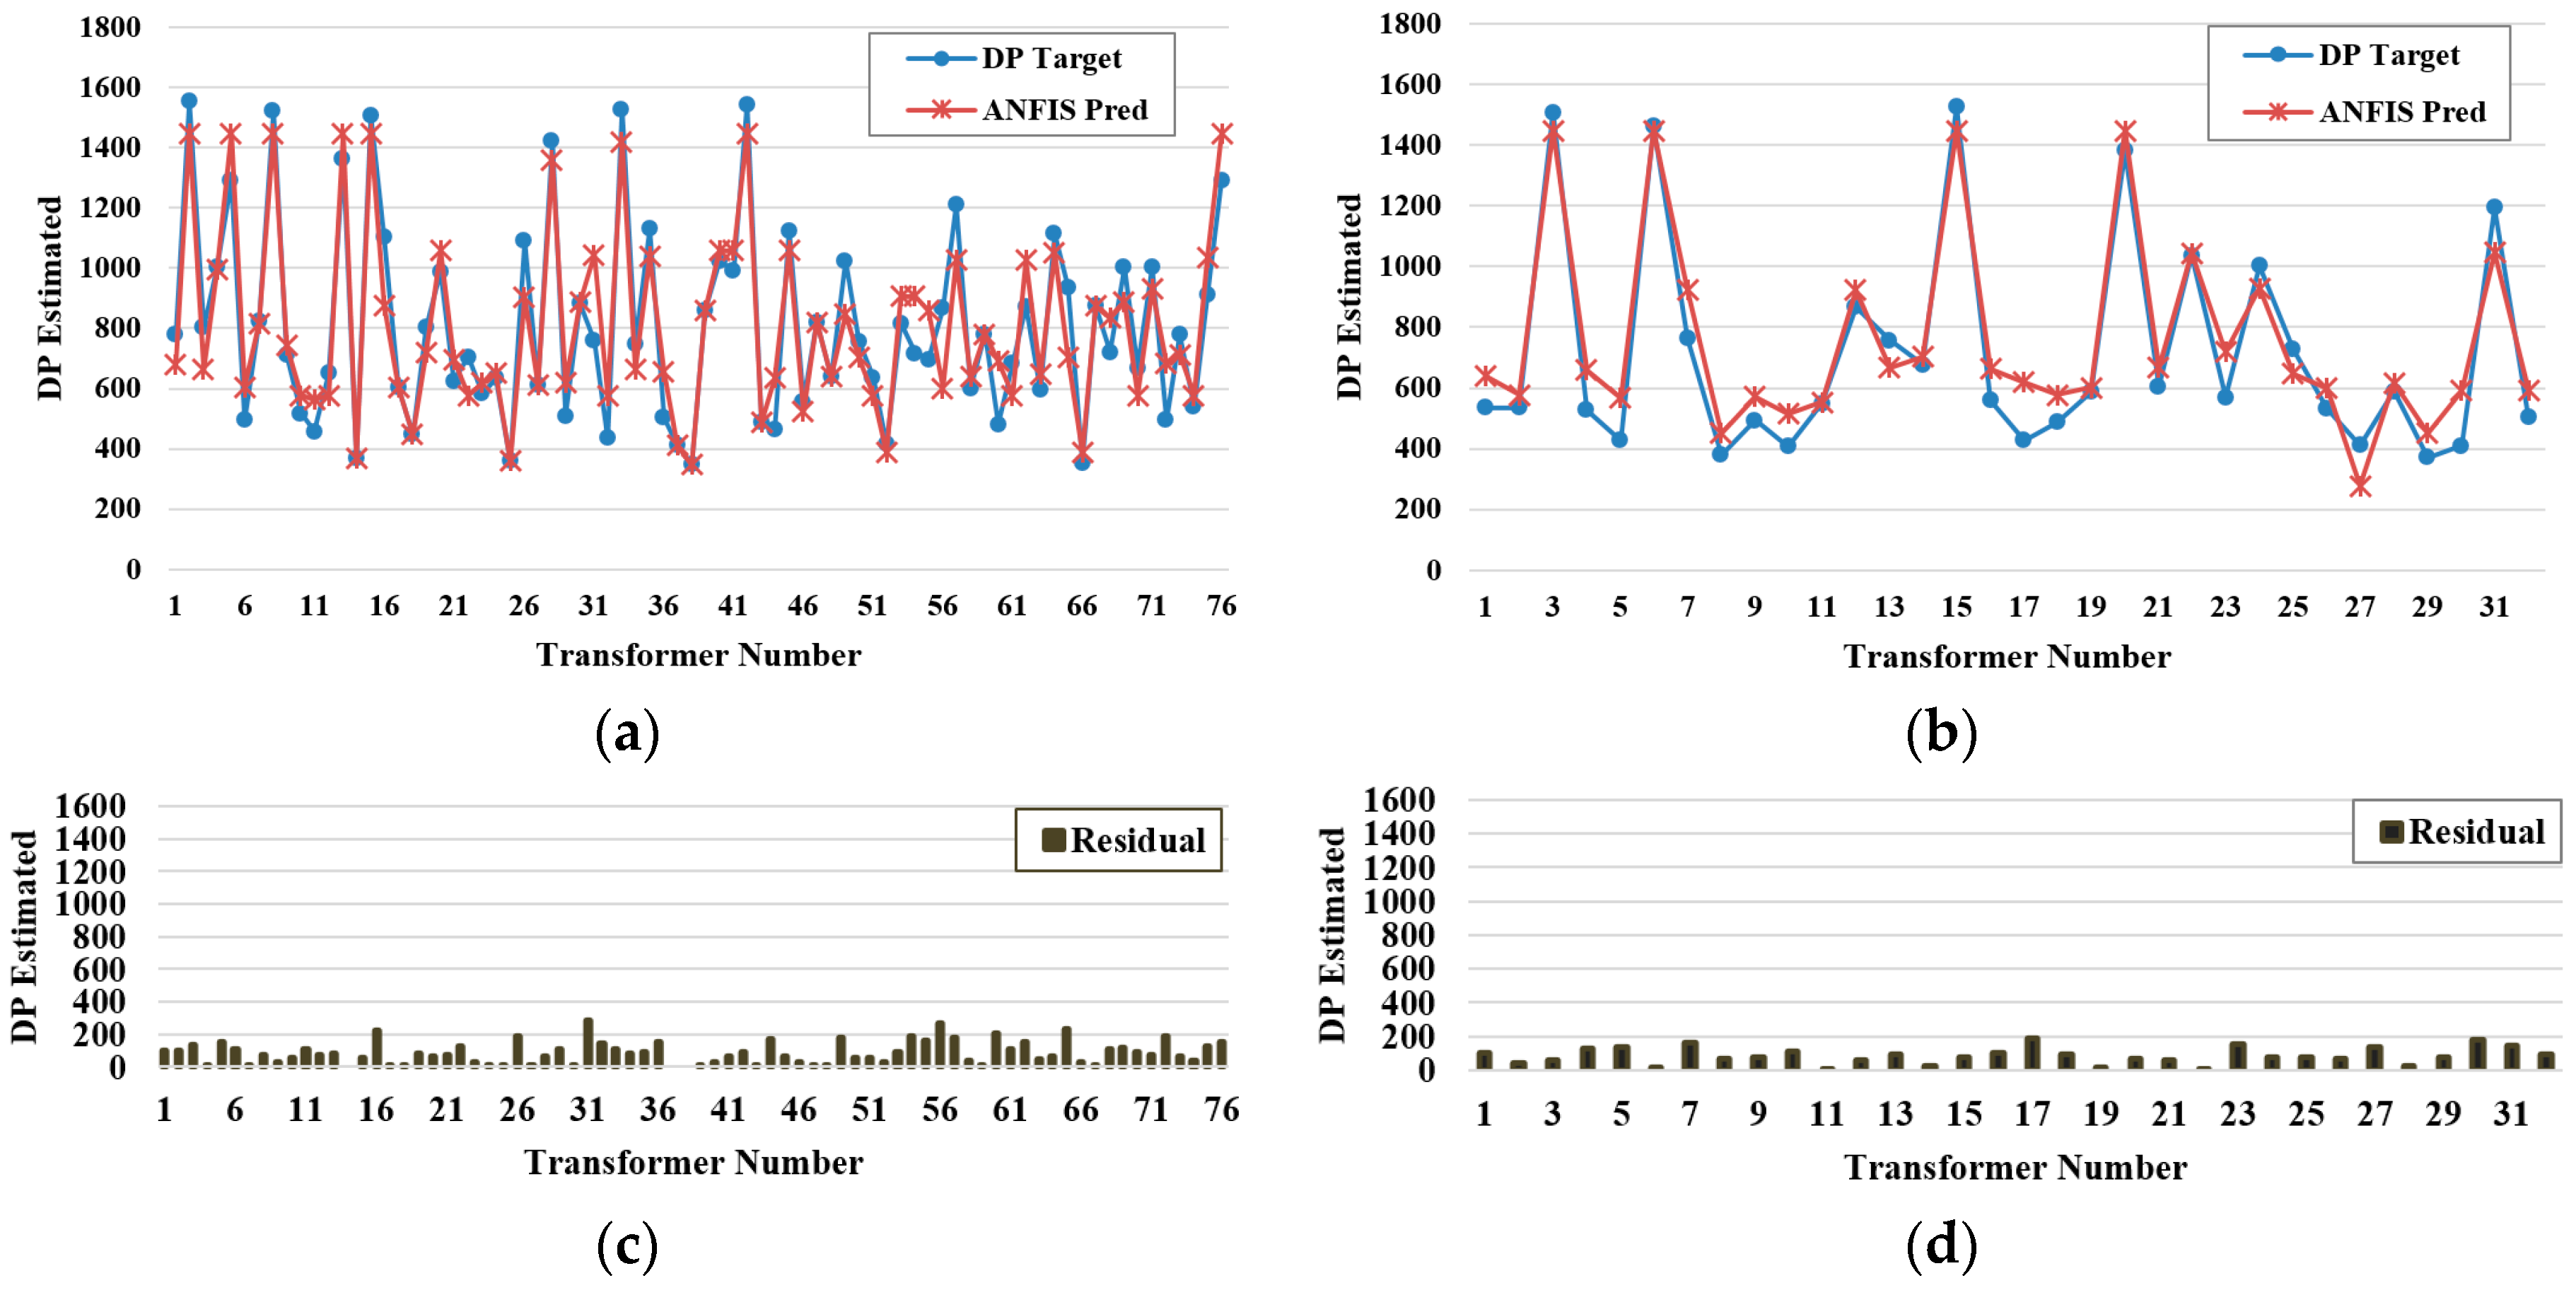
3.3. ANFIS Model Result and Evaluation
3.4. Expected Life Estimation of Transformer Paper Insulation
4. Conclusions
Author Contributions
Conflicts of Interest
References
- CIGRE 227. Life Management Techniques for Power Transformer; CIGRE: Paris, France, 2003. [Google Scholar]
- CIGRE 323. Ageing of Cellulose in Mineral-Oil Insulated Transformers; CIGRE: Paris, France, 2007. [Google Scholar]
- Myers, S.; Kelly, J.; Parrish, R. A Guide to Transformer Maintenance; Transformer Maintenance Institute: Akron, OH, USA, 1981. [Google Scholar]
- Cheim, L.; Platts, D.; Prevost, T.; Xu, S. Furan Analysis for Liquid Power Transformers. IEEE Electr. Insul. Mag. 2012, 28, 14. [Google Scholar] [CrossRef]
- Forouhari, S.; Abu-Siada, A. Remnant Life Estimation of Power Transformer Based on IFT and Acidity Number of Transformer Oil. In Proceedings of the International Conference on the Properties and Application of Dielectric Materials, Sydney, Australia, 19–22 July 2015. [Google Scholar]
- Malik, H.; Kushwaha, N.; Suryakant; Yadav, A.K. Paper Insulation Deterioration Estimation of Power Transformer Using Fuzzy-Logic. In Proceedings of the 2011 Annual IEEE India Conference (INDICON), Hyderabad, India, 16–18 December 2011. [Google Scholar]
- Shaban, K.B.; El-Hag, A.H.; Benhmed, K. Prediction of Transformer Furan Levels. IEEE Trans. Power Deliv. 2016, 31, 1778–1779. [Google Scholar] [CrossRef]
- Ghunem, R.A.; Assaleh, K.; El-Hag, A.H. Artificial Neural Networks with Stepwise Regression for Predicting Transformer Oil Furan Content. IEEE Trans. Dielectr. Electr. Insul. 2012, 19, 414–420. [Google Scholar] [CrossRef]
- Khan, S.A.; Equbal, M.D.; Islam, T. ANFIS Based Identification and Location of Paper Insulation Faults of an Oil Immersed Transformer. In Proceedings of the 2014 6th IEEE Power India International Conference (PIICON), Delhi, India, 5–7 December 2014. [Google Scholar]
- Hanung, N.S.; Nanang, H.; Mizutani, Y.; Takahashi, T.; Okamoto, T. Degree of Polymerization Estimation of Insulation Papers in Power Transformers Based on Load and Temperature Histories in Java-Bali Region of Indonesia National Electric Company. In Proceedings of the 2012 International Conference on Condition Monitoring and Diagnosis (CMD), Bali, Indonesia, 23–27 September 2012. [Google Scholar]
- Hu, W.P.; Wang, X.W.; Yin, X.G. Study on Fault Diagnosis for Transformer Based on Adaptive Fuzzy Inference System. In Proceedings of the China International Conference on Electricity Distribution, Guangzhou, China, 10–13 December 2008. [Google Scholar]
- Vani, A. An Adaptive Neuro Fuzzy Inference System for Fault Detection in Transformers by ANalyzing Dissolved Gases. In Proceedings of the 2014 1st International Conference on Information Technology, Computer and Electrical Engineering (ICITACEE), Semarang, Indonesia, 8 November 2014. [Google Scholar]
- Jang, J.S.R.; Sun, C. Neuro-fuzzy modeling and control. Proc. IEEE 1995, 83, 378–406. [Google Scholar] [CrossRef]
- Jang, J.S.R.; Sun, C.T.; Mizutani, E. Neuro-Fuzzy and Soft Computing; Pearson: Hongkong, China, 1997. [Google Scholar]
- Hohlein, I.; Kachler, A.J. Aging of Cellulose at Transformer Service Temperatures. Part 2. Influence of Moisture and Temperature on Degree of Polymerization and Formation of Furanic Compounds in Free Breathing Systems. IEEE Electr. Insul. Mag. 2005, 21, 20–24. [Google Scholar] [CrossRef]
- Wang, Z.D.; Liu, Q.; Tee, S.J.; Matharage, S.Y.; Jarman, P.; Wilson, G.; Hooton, R.; Dyer, P.; WalNer, D.; Krause, C.; et al. Ageing Assessment of Transformers through Oil Test Database Analyses and Alternative Diagnostic Techniques. In Proceedings of the 2015 CIGRE SC A2 Colloquium, Shanghai, China, 20–25 September 2015. [Google Scholar]
- Chendong, X. Monitoring paper insulation ageing by measuring furfural contents in oil. In Proceedings of the Seventh International Symposium on High Voltage Engineering, Dresden, Germany, 26–30 August 1991. [Google Scholar]
- Jang, J.-S.R. ANFIS: Adaptive-Network-Based Fuzzy Inference System. IEEE Trans. Syst. Man Cybern. 1993, 23, 665–685. [Google Scholar] [CrossRef]
- Gumilang, H. Hydrolysis Process in PLN P3BJB Transformers as an Effect of Oil Insulation Oxidation. In Proceedings of the 2012 International Conference on Condition Monitoring and Diagnosis (CMD), Bali, Indonesia, 23–27 September 2012. [Google Scholar]
- Suwarno, S.; Pasaribu, R.A. Thermal Aging of Mineral Oil-Paper Composite Insulation for High Voltage Transformer. Int. J. Electr. Eng. Inform. 2016, 8, 820–835. [Google Scholar] [CrossRef]
- IEEE Std. C57.104: IEEE Guide for the Interpretation of Gasses Generated in Oil-Immersed Transformers; IEEE: New York, NY, USA, 2009. [Google Scholar]
- Yoshida, H.; Ishioka, Y.; Suzuki, T.; Yanari, T.; Teranishi, T. Degradation of Insulating materials of Transformers. IEEE Trans. Electr. Insul. 1987, EI-22, 795–800. [Google Scholar] [CrossRef]
- Willmott, C.J.; Matsuura, K. Advantages of the mean absolute error (MAE) over the root mean square error (RMSE) in assessing average model performance. Clim. Res. 2005, 30, 79–82. [Google Scholar] [CrossRef]
- Amstrong, J.S. Long-Range Forecasting: From Crystall Ball to Computer; Wiley: Hoboken, NJ, USA, 1985. [Google Scholar]
- Flores, B.E. A Pragmatic View of Accuracy Measurement in Forecasting. Omega 1986, 14, 93–98. [Google Scholar] [CrossRef]
- Tofallis, C. A Better Measure of Relative Prediction Accuracy for Model Selection and Model Estimation. J. Oper. Res. Soc. 2015, 66, 1352–1362. [Google Scholar] [CrossRef]
- Hyndman, R.J.; Koehler, A.B. Another Look at Measures of Forecast Accuracy. Int. J. Forecast. 2006, 22, 679–688. [Google Scholar] [CrossRef]
- Emsley, A.; Stevens, G. Review of Chemical Indicators of Degradation of Cellulosic Electrical Paper Insulation in Oil-Filled Transformers. IEE Proc. Sci. Meas. Technol. 1994, 141, 324–334. [Google Scholar] [CrossRef]
- Lundgaard, L.E.; Hansen, W.; Linhjell, D.; Painter, T.J. Aging of Oil-Impregnated Paper in Power Transformers. IEEE Trans. Power Deliv. 2004, 19, 230–239. [Google Scholar] [CrossRef]
- IEC 60076–2. Power Transformers—Temperature Rise for Liquid Immersed Transformers; IEC: Geneva, Switzerland, 2011. [Google Scholar]
- Wouters, P.A.; van Schijndel, A.; Wetzer, J.M. Remaining lifetime modeling of power transformers: Individual assets and fleets. IEEE Electr. Insul. Mag. 2011, 27, 45–51. [Google Scholar] [CrossRef]
- Cohen, J.; Cohen, P.; West, S.G.; Aiken, L.S. Applied Multiple Regression/Correlation Analysis for the Behavioral Sciences; Taylor & Francis Inc: Oxford, NY, USA, 1975. [Google Scholar]
- Prasojo, R.A.; Diwyacitta, K.; Suwarno. Transformer Paper Condition Assessment using Adaptive Neuro-Fuzzy Inference System. In Proceedings of the International Conference on Electrical Engineering and Computer Science, Palembang, Indonesia, 22–23 August 2017. [Google Scholar]


| Voltage (kV) | Rated Power (MVA) | Phase | Running Time (Years) |
| 150/20 | 20 | 3 | 25 |
| Dielectric Characteristic | Value | DGA | Value (ppm) |
| Water (ppm) | 5.64 | H2 | 0 |
| VBD (kV) | 92.10 | CH4 | 25 |
| Acidity (mg KOH/g) | 0.19 | C2H4 | 0 |
| IFT (dyne/cm) | 13.30 | C2H6 | 0 |
| Color (0–10) | 3.40 | C2H2 | 19 |
| - | - | CO | 1628 |
| - | - | CO2 | 1119 |
| - | - | TDCG | 1673 |
| Voltage (kV) | Rated Power (MVA) | Phase | Running Time (Years) |
| 150/70 | 100 | 3 | 21 |
| Dielectric Characteristic | Value | DGA | Value (ppm) |
| Water (ppm) | 3.93 | H2 | 40 |
| VBD (kV) | 66 | CH4 | 0 |
| Acidity | 0.06 | C2H4 | 0 |
| IFT (dyne/cm) | 30.60 | C2H6 | 0 |
| Color (0–10) | 2.30 | C2H2 | 0 |
| - | - | CO | 96.05 |
| - | - | CO2 | 2250.10 |
| - | - | TDCG | 96.05 |
| Voltage (kV) | Rated Power (MVA) | Phase | Running Time (Years) |
| 150/20 | 60 | 3 | 4 |
| Dielectric Characteristic | Value | DGA | Value (ppm) |
| Water | 2.86 | H2 | 0 |
| VBD | 65.90 | CH4 | 30.37 |
| Acidity | 0.019 | C2H4 | 0 |
| IFT | 30.20 | C2H6 | 57.67 |
| Color | 0.50 | C2H2 | 0 |
| - | - | CO | 167.84 |
| - | - | CO2 | 2787.33 |
| - | - | TDCG | 249.90 |
| Voltage (kV) | Rated Power (MVA) | Phase | Running Time (Years) |
| 150/20 | 60 | 3 | 20 |
| Dielectric Characteristic | Value | DGA | Value (ppm) |
| Water | 2.80 | H2 | 23 |
| VBD | 80 | CH4 | 0 |
| Acidity | 0.02 | C2H4 | 0 |
| IFT | 19.89 | C2H6 | 0 |
| Color | 4.80 | C2H2 | 0 |
| - | - | CO | 910.62 |
| - | - | CO2 | 7115.37 |
| - | - | TDCG | 910.62 |
| Dielectric Characteristic | r | p-Value |
|---|---|---|
| Water Content (ppm) | −0.244 | 0.007 |
| Voltage Breakdown (kV) | 0.199 | 0.029 |
| Acidity (mg KOH/g) | −0.432 | 0.000 |
| Interfacial Tension (dyne/cm) | 0.732 | 0.000 |
| Color (Scale 0–10) | −0.686 | 0.000 |
| DGA | r | p-Value |
|---|---|---|
| H2 (ppm) | −0.069 | 0.452 |
| CH4 (ppm) | −0.087 | 0.343 |
| C2H4 (ppm) | −0.242 | 0.008 |
| C2H6 (ppm) | −0.044 | 0.631 |
| C2H2 (ppm) | −0.196 | 0.033 |
| TDCG (ppm) | −0.471 | 0.000 |
| CO (ppm) | −0.511 | 0.000 |
| CO2 (ppm) | −0.536 | 0.000 |
| CO + CO2 (ppm) | −0.578 | 0.000 |
| Number of Combination | R-Sq | R-Sq (Adj) | R-Sq (Pred) | Mallows Cp | CO + CO2 | Acidity | IFT | Color |
|---|---|---|---|---|---|---|---|---|
| 1 | 33.6 | 33.0 | 31.3 | 33.2 | x | |||
| 2 | 18.6 | 17.9 | 16.2 | 66.8 | x | |||
| 3 | 53.6 | 53.3 | 51.9 | 50.7 | x | |||
| 4 | 46.9 | 46.4 | 45.3 | 75.0 | x | |||
| 5 | 61.7 | 60.7 | 58.7 | 7.8 | x | x | ||
| 6 | 53.9 | 53.1 | 51.6 | 3.0 | x | x | ||
| 7 | 47.9 | 47.0 | 45.5 | 3.0 | x | x | ||
| 8 | 60.4 | 59.4 | 57.4 | 10.6 | x | x | ||
| 9 | 51.2 | 50.4 | 48.9 | 3.0 | x | x | ||
| 10 | 50.0 | 49.1 | 47.9 | 3.0 | x | x | ||
| 11 | 64.6 | 63.2 | 61.3 | 3.6 | x | x | x | |
| 12 | 63.0 | 61.5 | 59.4 | 7.1 | x | x | x | |
| 13 | 68.0 | 66.9 | 65.6 | 5.0 | x | x | x | x |
| No. | CO + CO2 | Acidity | IFT | Color | MF Type | RMSE Training | RMSE Testing |
|---|---|---|---|---|---|---|---|
| 1 | 2 | 2 | 2 | 2 | TrapMF | 183.81 | 254.30 |
| 2 | 3 | 2 | 2 | 2 | TrapMF | 168.81 | 183.02 |
| 3 | 3 | 3 | 2 | 2 | TrapMF | 161.06 | 296.70 |
| 4 | 3 | 3 | 3 | 2 | TrapMF | 143.8 | 274.81 |
| 5 | 3 | 2 | 3 | 3 | TrapMF | 116.25 | 1114.95 |
| 6 | 3 | 3 | 2 | 3 | TrapMF | 131.53 | 141.31 |
| 7 | 3 | 3 | 3 | 3 | TrapMF | 117.58 | 169.15 |
| 8 | 4 | 3 | 3 | 3 | TrapMF | 94.08 | 639.51 |
| 9 | 4 | 4 | 3 | 3 | TrapMF | 93.71 | 1431.84 |
| 10 | 4 | 4 | 4 | 3 | TrapMF | 94.06 | 662.59 |
| 11 | 4 | 3 | 4 | 4 | TrapMF | 83.31 | 1395.16 |
| 12 | 4 | 4 | 4 | 4 | TrapMF | 77.43 | 1886.97 |
| 13 | 4 | 2 | 3 | 3 | TrapMF | 98.25 | 2089.57 |
| 14 | 4 | 2 | 3 | 3 | TrapMF | 107.09 | 110.55 |
| 15 | 5 | 2 | 3 | 3 | TrapMF | 110.60 | 98.77 |
| 16 | 5 | 5 | 5 | 5 | TrapMF | 53.17 | 569.61 |
| MF Type | MF Shape | MF Type | MF Shape |
|---|---|---|---|
| TriMF |  | Gauss2MF |  |
| TrapMF |  | DsigMF |  |
| GbellMF |  | PsigMF |  |
| GaussMF |  | - | - |
| No. | CO + CO2 | Acidity | IFT | Color | MF Type | RMSE Training | RMSE Testing |
|---|---|---|---|---|---|---|---|
| 15 | 5 | 2 | 3 | 3 | TrapMF | 110.60 | 98.77 |
| 17 | 5 | 2 | 3 | 3 | TriMF | 346.71 | 418.75 |
| 18 | 5 | 5 | 5 | 5 | GbellMF | 106.90 | 704.50 |
| 19 | 5 | 2 | 3 | 3 | GaussMF | 90.43 | 168.33 |
| 20 | 5 | 2 | 3 | 3 | Gauss2MF | 91.59 | 149.70 |
| 21 | 5 | 2 | 3 | 3 | DsigMF | 77.57 | 580.43 |
| 22 | 5 | 2 | 3 | 3 | PsigMF | 80.72 | 2893.2 |
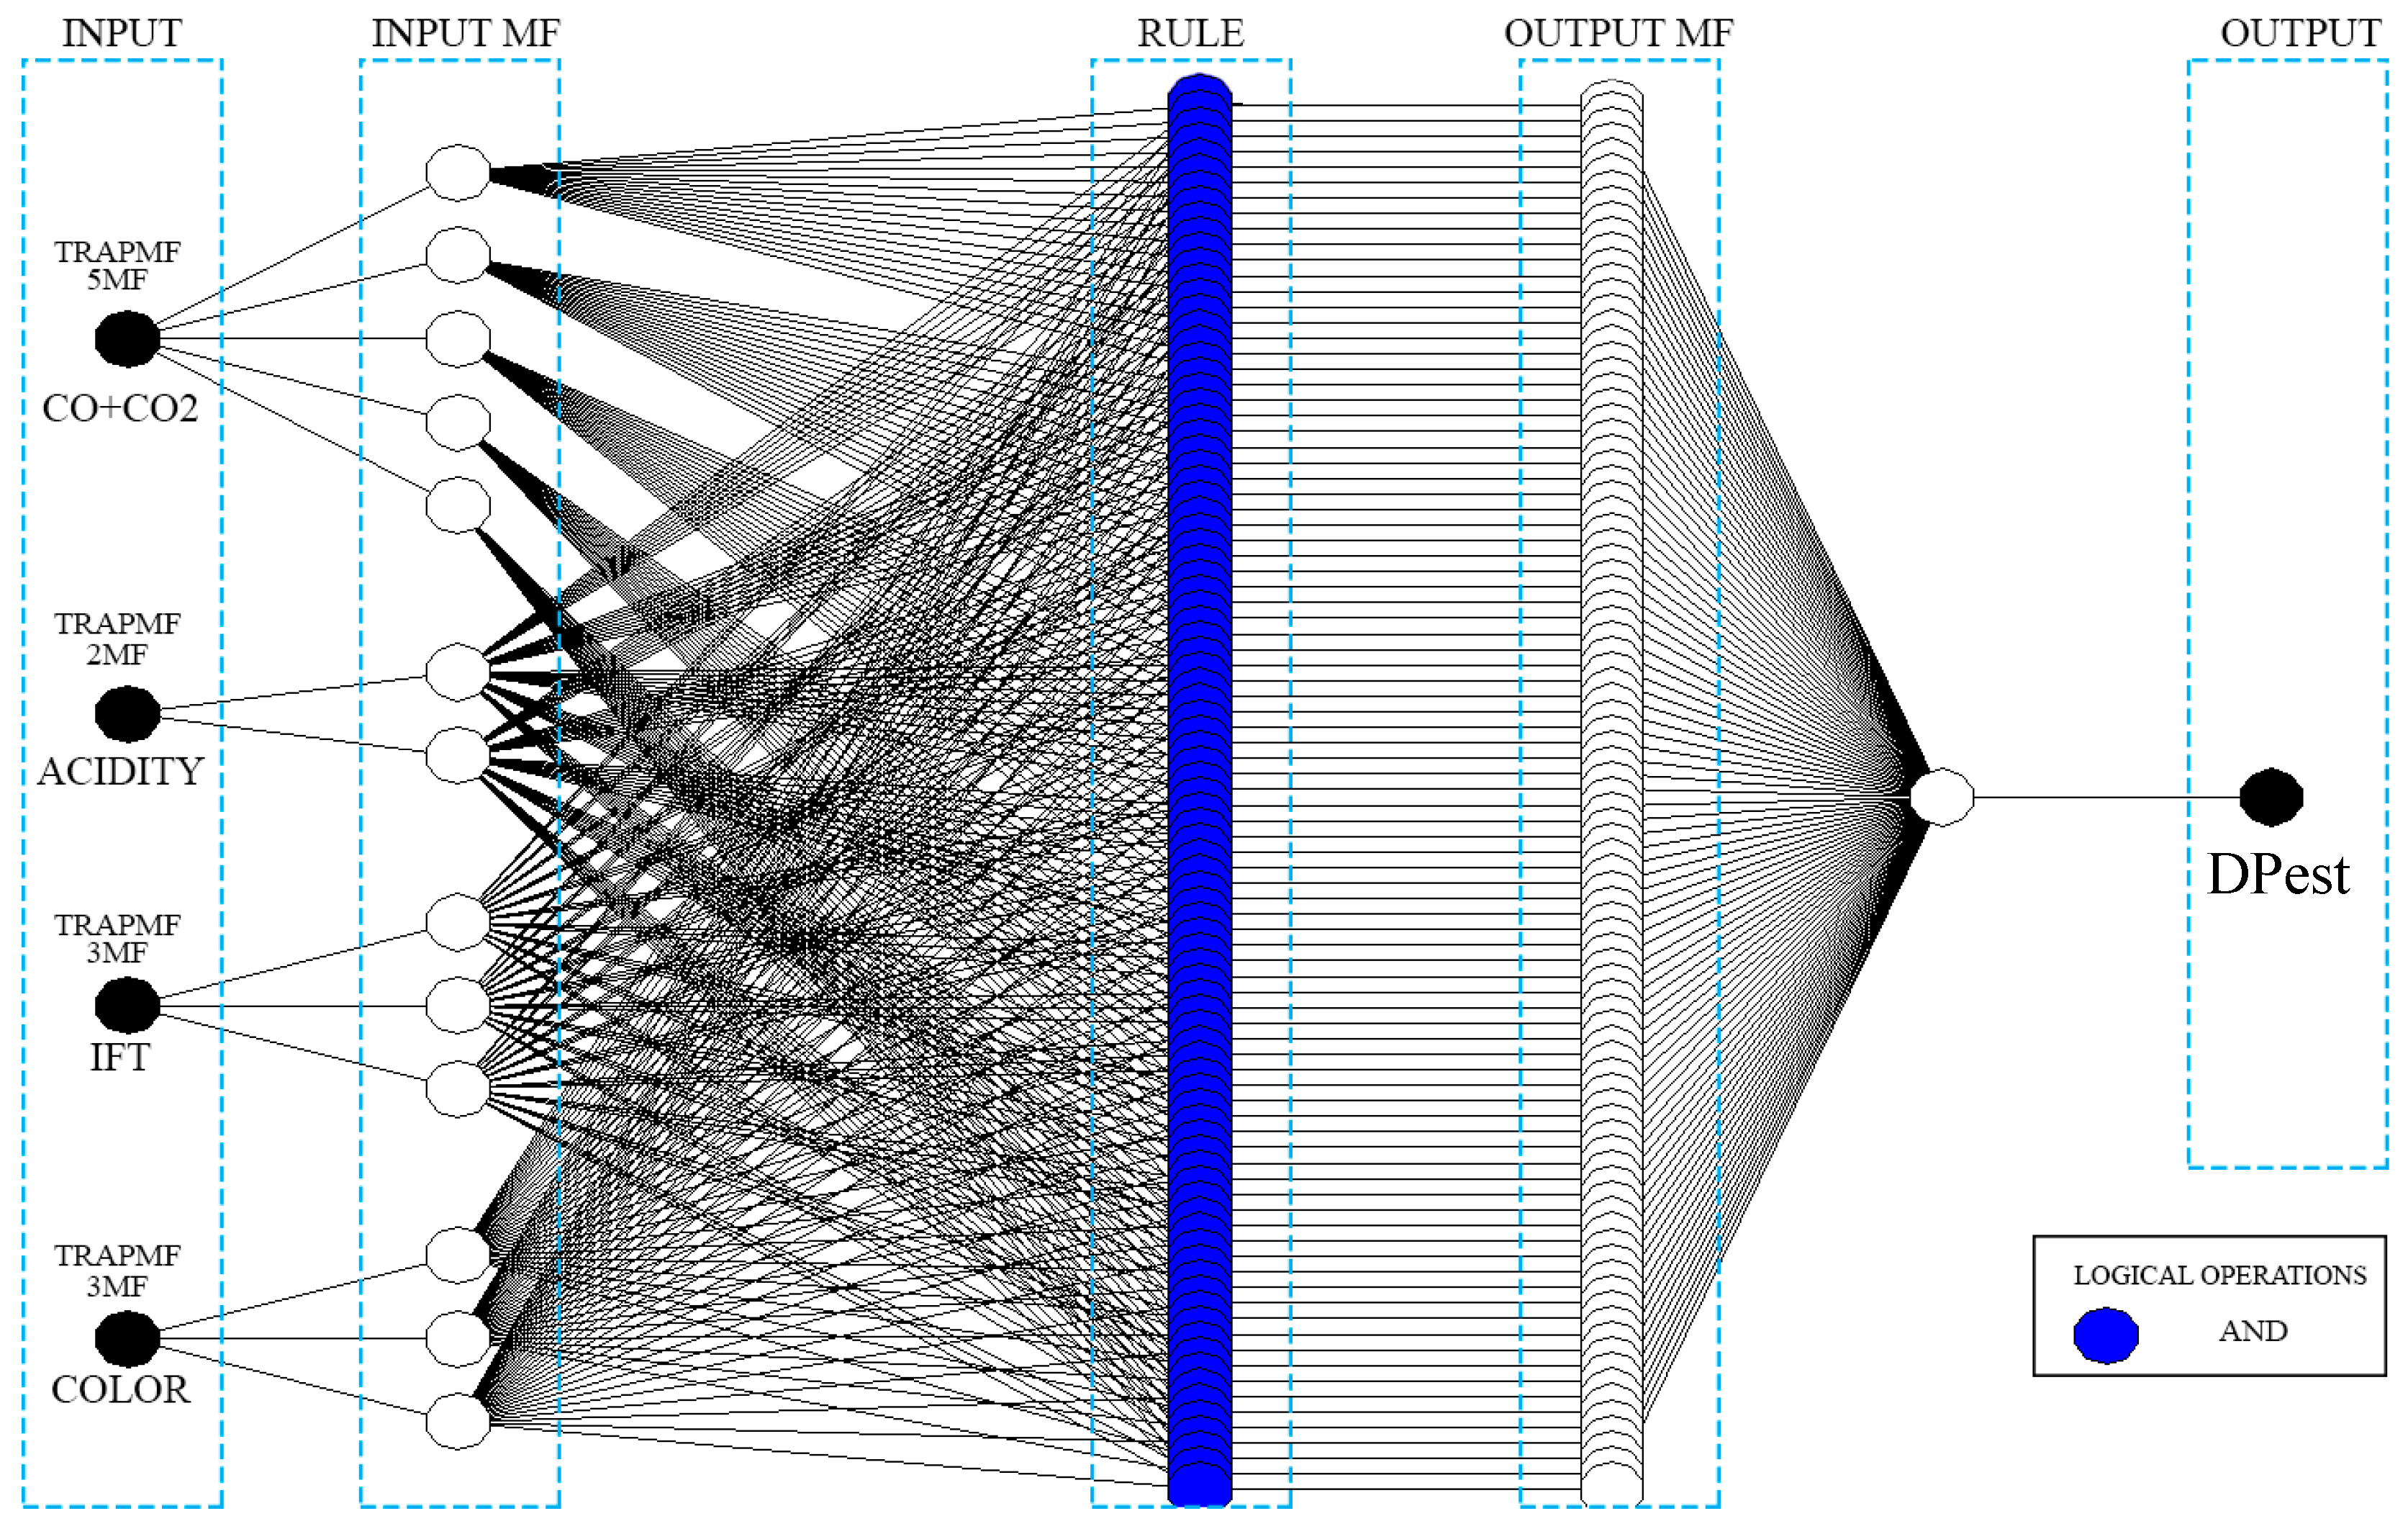
| Input Variable | MF Number | MF Type |
|---|---|---|
| CO + CO2 | 5 | TrapMF |
| Acidity | 2 | TrapMF |
| Interfacial Tension | 3 | TrapMF |
| Color | 3 | TrapMF |
| Criteria | Training | Testing |
|---|---|---|
| Mean Absolute Error (MAE) | 85.57 | 85.52 |
| Root Mean Square Error (RMSE) | 110.60 | 98.77 |
| Symmetrical Mean Absolute Percentage Error (SMAPE) | 10.93% | 14.25% |
| Accuracy (100–% error) | 89.07% | 85.75% |
| Transformer | Running Time | DP Predicted (ANFIS) | Interpretation | %Eprl | Expected Life Estimated (Years) |
|---|---|---|---|---|---|
| #1 | 25 years | 597.88 | Accelerated Aging Rate | 79.06% | 8.05 |
| #2 | 21 years | 676.87 | Normal Aging Rate | 90.79% | 8.67 |
| #3 | 4 years | 1044.46 | Normal Aging Rate | 119.25% | 29.2 |
| #4 | 20 years | 369 | Accelerated Aging Rate | 44.25% | 5.55 |
© 2017 by the authors. Licensee MDPI, Basel, Switzerland. This article is an open access article distributed under the terms and conditions of the Creative Commons Attribution (CC BY) license (http://creativecommons.org/licenses/by/4.0/).
Share and Cite
Prasojo, R.A.; Diwyacitta, K.; Suwarno; Gumilang, H. Transformer Paper Expected Life Estimation Using ANFIS Based on Oil Characteristics and Dissolved Gases (Case Study: Indonesian Transformers). Energies 2017, 10, 1135. https://doi.org/10.3390/en10081135
Prasojo RA, Diwyacitta K, Suwarno, Gumilang H. Transformer Paper Expected Life Estimation Using ANFIS Based on Oil Characteristics and Dissolved Gases (Case Study: Indonesian Transformers). Energies. 2017; 10(8):1135. https://doi.org/10.3390/en10081135
Chicago/Turabian StylePrasojo, Rahman A., Karunika Diwyacitta, Suwarno, and Harry Gumilang. 2017. "Transformer Paper Expected Life Estimation Using ANFIS Based on Oil Characteristics and Dissolved Gases (Case Study: Indonesian Transformers)" Energies 10, no. 8: 1135. https://doi.org/10.3390/en10081135