
Analysis of Cooling Effectiveness and Temperature Uniformity in a Battery Pack for Cylindrical Batteries

Faculty of Engineering and Applied Science, University of Ontario Institute of Technology, Oshawa, ON L1H 7K4, Canada
*
Author to whom correspondence should be addressed.
Energies 2017, 10(8), 1157; https://doi.org/10.3390/en10081157
Submission received: 28 June 2017
/
Revised: 2 August 2017
/
Accepted: 3 August 2017
/
Published: 7 August 2017
(This article belongs to the Collection Electric and Hybrid Vehicles Collection)
Abstract
:In this paper, techniques to improve cooling and temperature uniformity in a simple battery pack are examined. Four battery pack configurations are developed. In the first configuration, an inlet plenum is added to a simple battery pack. In the second configuration, jet inlets are incorporated along with the inlet plenum, and in the third configuration, multiple vortex generators are added in addition to the inlet plenum. Finally, in the fourth configuration, an inlet plenum, jet inlets, and multiple vortex generators are incorporated into the battery pack. The results conclude that by adding inlet plenum, multiple vortex generators, and jet inlets in the same configuration, significant improvements are observed. The results also show that the maximum temperature of the battery pack is reduced by ~5%, and the temperature difference between the maximum temperature and the minimum temperature exhibited by the battery pack is reduced by 21.5%. Moreover, there is a ~16% improvement in the temperature uniformity of a single cell.
1. Introduction
Climate change is the most vital environmental issue in today’s world, and several nations are adopting different methods to promote sustainability. The transportation industry is the biggest contributor to greenhouse gases and global warming, as it contributed up to 27% of the greenhouse gas (GHG) emissions in the U.S. in 2015 [1]. As a result, there is pressure on the automotive industry from governments around the world to decrease GHG emissions by producing more energy efficient cars. Therefore, transportation electrification, which is the most innovative change in the transport industry, was born. Hybrid electric vehicles (HEV) and electric vehicles (EV) are considered environmental-friendly and sustainable options. Recently, there has been a significant increase in the market share of these vehicles, driven largely by Tesla Motors, and is expected to increase further in the years to come. Reports suggest that HEVs and EVs reduce GHG emissions by almost 20%, which can be further reduced by 40% if the electricity used by these vehicles is obtained from renewable sources [2].
Like any other new technology, there are some difficulties with the advancement of EVs. One of the major hurdles is the development of high power and energy density battery cells. Currently, the market holds several potential candidate batteries for EVs, such as nickel metal hydride (NiMH), lithium-ion (Li-ion), and lithium-ion polymer (LiPo) batteries. However, Li-ion batteries have attracted all the attention due to their high capacity, high efficiency, long-life and slow self-discharge rate [2]. Li-ion batteries are most effective when they work within certain temperature and thermal specifications. For the batteries to perform without rapid degeneration, the ideal range of working temperatures is between 0 °C and 40 °C [3]. A poorly designed thermal management system (TMS) of a battery pack can result in heat accumulation, which may overheat the battery pack. This can become a serious safety issue, and in some extreme cases may lead to the explosion of the battery pack. In addition to that, once the temperature of the cells exceeds the ideal range of operating temperature, the degradation of the cells accelerates, which results in reduced efficiency of the battery pack, a reduction of the life of the batteries, and thermal runaway in extreme cases [4].
Moreover, the temperature uniformity within the battery pack affects its charging and discharging power. At low temperatures, the cell with the lowest temperature limits the power capability, but at high temperatures the cell with the highest temperature defines the rate of power limiting [5]. A high temperature uniformity within the battery pack causes different charging/discharging of the individual cells, resulting in the electrical imbalance of the cells, thereby reducing the performance of the battery pack. A temperature variation of about 10 to 15 °C in the battery pack can lead to a 30% to 50% degradation [6]. Therefore, uniformity in the temperature of the battery pack is required for optimum performance.
The TMS of a battery pack is divided into three separate categories, namely, air cooling, liquid cooling, and cooling by phase change materials. Air cooling is further divided into two categories, natural air cooling and forced air cooling. Li et al. [3] conducted both numerical and experimental studies to investigate and compare natural air cooling and forced air cooling using the LiMn2O4 cylindrical cells. The results concluded that by using forced air cooling, the maximum temperature of the cell reduced by 3.5 °C when compared to natural air convection. Therefore, forced air cooling is considered more effective. Zhao et al. [7] conducted a parametric study numerically, using the LiFePO4 cylindrical cells to investigate the effects of different ventilation types and the optimum forced air velocities. The authors also investigated the effects of environmental and inlet air temperatures, and the optimum spacing between the adjacent cells. It was concluded from their results that by increasing the velocity of the air flow, the local temperatures decreased. In addition, the authors conducted simulations to investigate the effects of the cooling of the battery pack by introducing a counter-flow of air between the adjacent rows of the cells. It was concluded that this method of counter-flow of air is not an effective cooling method. Wang et al. [8] conducted numerical and experimental studies to examine different types of arrangements of LiNiMnCoO2 cylindrical cells. The results concluded that the optimum thermal performance was exhibited by the 5 × 5 cubic cell structure, in which the inlet fan was placed at the top of the battery pack and the exhaust placed at the bottom. Developing on this research and using the same 5 × 5 cubic cell structure, Wang et al. [9] numerically explored the effects of inlet air temperature on the cooling of the cells. It was reported by the authors that the temperature of the inlet air should lie within the range of 20 °C and 35 °C in order to effectively cool the cells. However, the velocity of the air should be increased if the ambient temperatures are higher than the range provided, in order to achieve effective cooling. Cho et al. [10] numerically studied the effects of ambient temperature on the temperature uniformity of the battery pack and the cells, and the results of their study concluded that at low ambient temperatures the temperature uniformity between the cells decreased, and at high ambient temperatures the temperature uniformity between the cells increased. It was also reported by the authors that irrespective of the ambient temperature, the maximum temperatures of the cells near the inlet exhibited lower temperatures compared to the cells near the outlet. Moreover, aligned and staggered cell configurations were numerically studied by Yang et al. [11] using the LiFePO4 cylindrical cells. The cell spacing between the adjacent cells in the longitudinal and transverse directions was investigated, and it was concluded that the optimum spacing distances should be 34 mm and 32 mm in the longitudinal and transverse directions, respectively. The results also concluded that the aligned configuration is better when compared to a staggered configuration in terms of the uniform cooling of the cells. Saw et al. [6] conducted numerical and experimental studies to investigate the effects of the flow circuit by developing a battery pack based on the concept of air entering from the top and exhausting from the bottom of the battery pack. In their study, cylindrical Lithium Iron Phosphate (LFP) cells were used. Based on their results, the authors concluded that the highest temperatures were exhibited by the cells at the center of the battery pack due to the accumulation of the heat. Additionally, because of the lack of air flow, the cells at the front end of the battery pack also exhibited the highest temperatures. In another study, the reciprocating air flow inside the battery pack was investigated numerically by Mahamud and Park [12] using the LiMn2O4 cylindrical cells. The results of their study showed that the temperature uniformity within the battery pack greatly improves using this technique, as the temperature difference between the cells was reduced by about 4 °C. Furthermore, based on the reciprocating period of 120 s, the maximum cell temperature was also reduced by 1.5 °C. Liu et al. [13] also numerically investigated the reciprocating air flow system by conducting a parametric optimization study using Sony US-18650 cylindrical cells. Based on the range of values of the maximum temperature, minimum temperature, and the temperature difference, it was concluded that 6 m/s of air velocity, 283.15 K inlet temperature, and a reciprocation period of 67.5 s were the most optimal factors. However, reciprocating air flow systems are considered active systems, as they require timing valves to change the direction and the flow of the air, thereby increasing the power requirement and complexity of the system. Therefore, a forced air cooling system is required that is simple, eliminates the power requirement of reciprocating valves, and simultaneously reduces the non-uniformity of temperature within the battery pack. There have been very limited reported studies on the Li-ion 18650 cells examining temperature uniformity in the battery packs, especially for non-active systems. There is a need to examine the temperatures at different locations of a battery pack and cell surfaces in order to develop techniques to improve temperature uniformity at the pack and cell levels.
In this paper, an attempt is made to reduce the maximum temperature of the battery pack and to increase the temperature uniformity across the cell and the battery pack. This is implemented by incorporating new techniques in the battery pack without changing its dimensions. The objective of the study is to achieve an effective cooling without increasing the power requirement, and to obtain a desired temperature uniformity within the entire battery pack (not greater than 5 °C).
This paper is divided into five sections including the current section. Section 2 describes the different configurations and techniques developed, and Section 3 provides the details on the experimental and numerical studies conducted on them. In Section 4, the results are provided and are discussed in detail. Finally, the summary and conclusions of the study are stated in Section 5.
2. Proposed Battery Pack Configurations
The battery pack consists of a cell holder onto which 32 commercial Li-ion 18650 cells (Samsung INR18650-25R) are placed. The specifications of the cell are summarized in Table 1 [14].
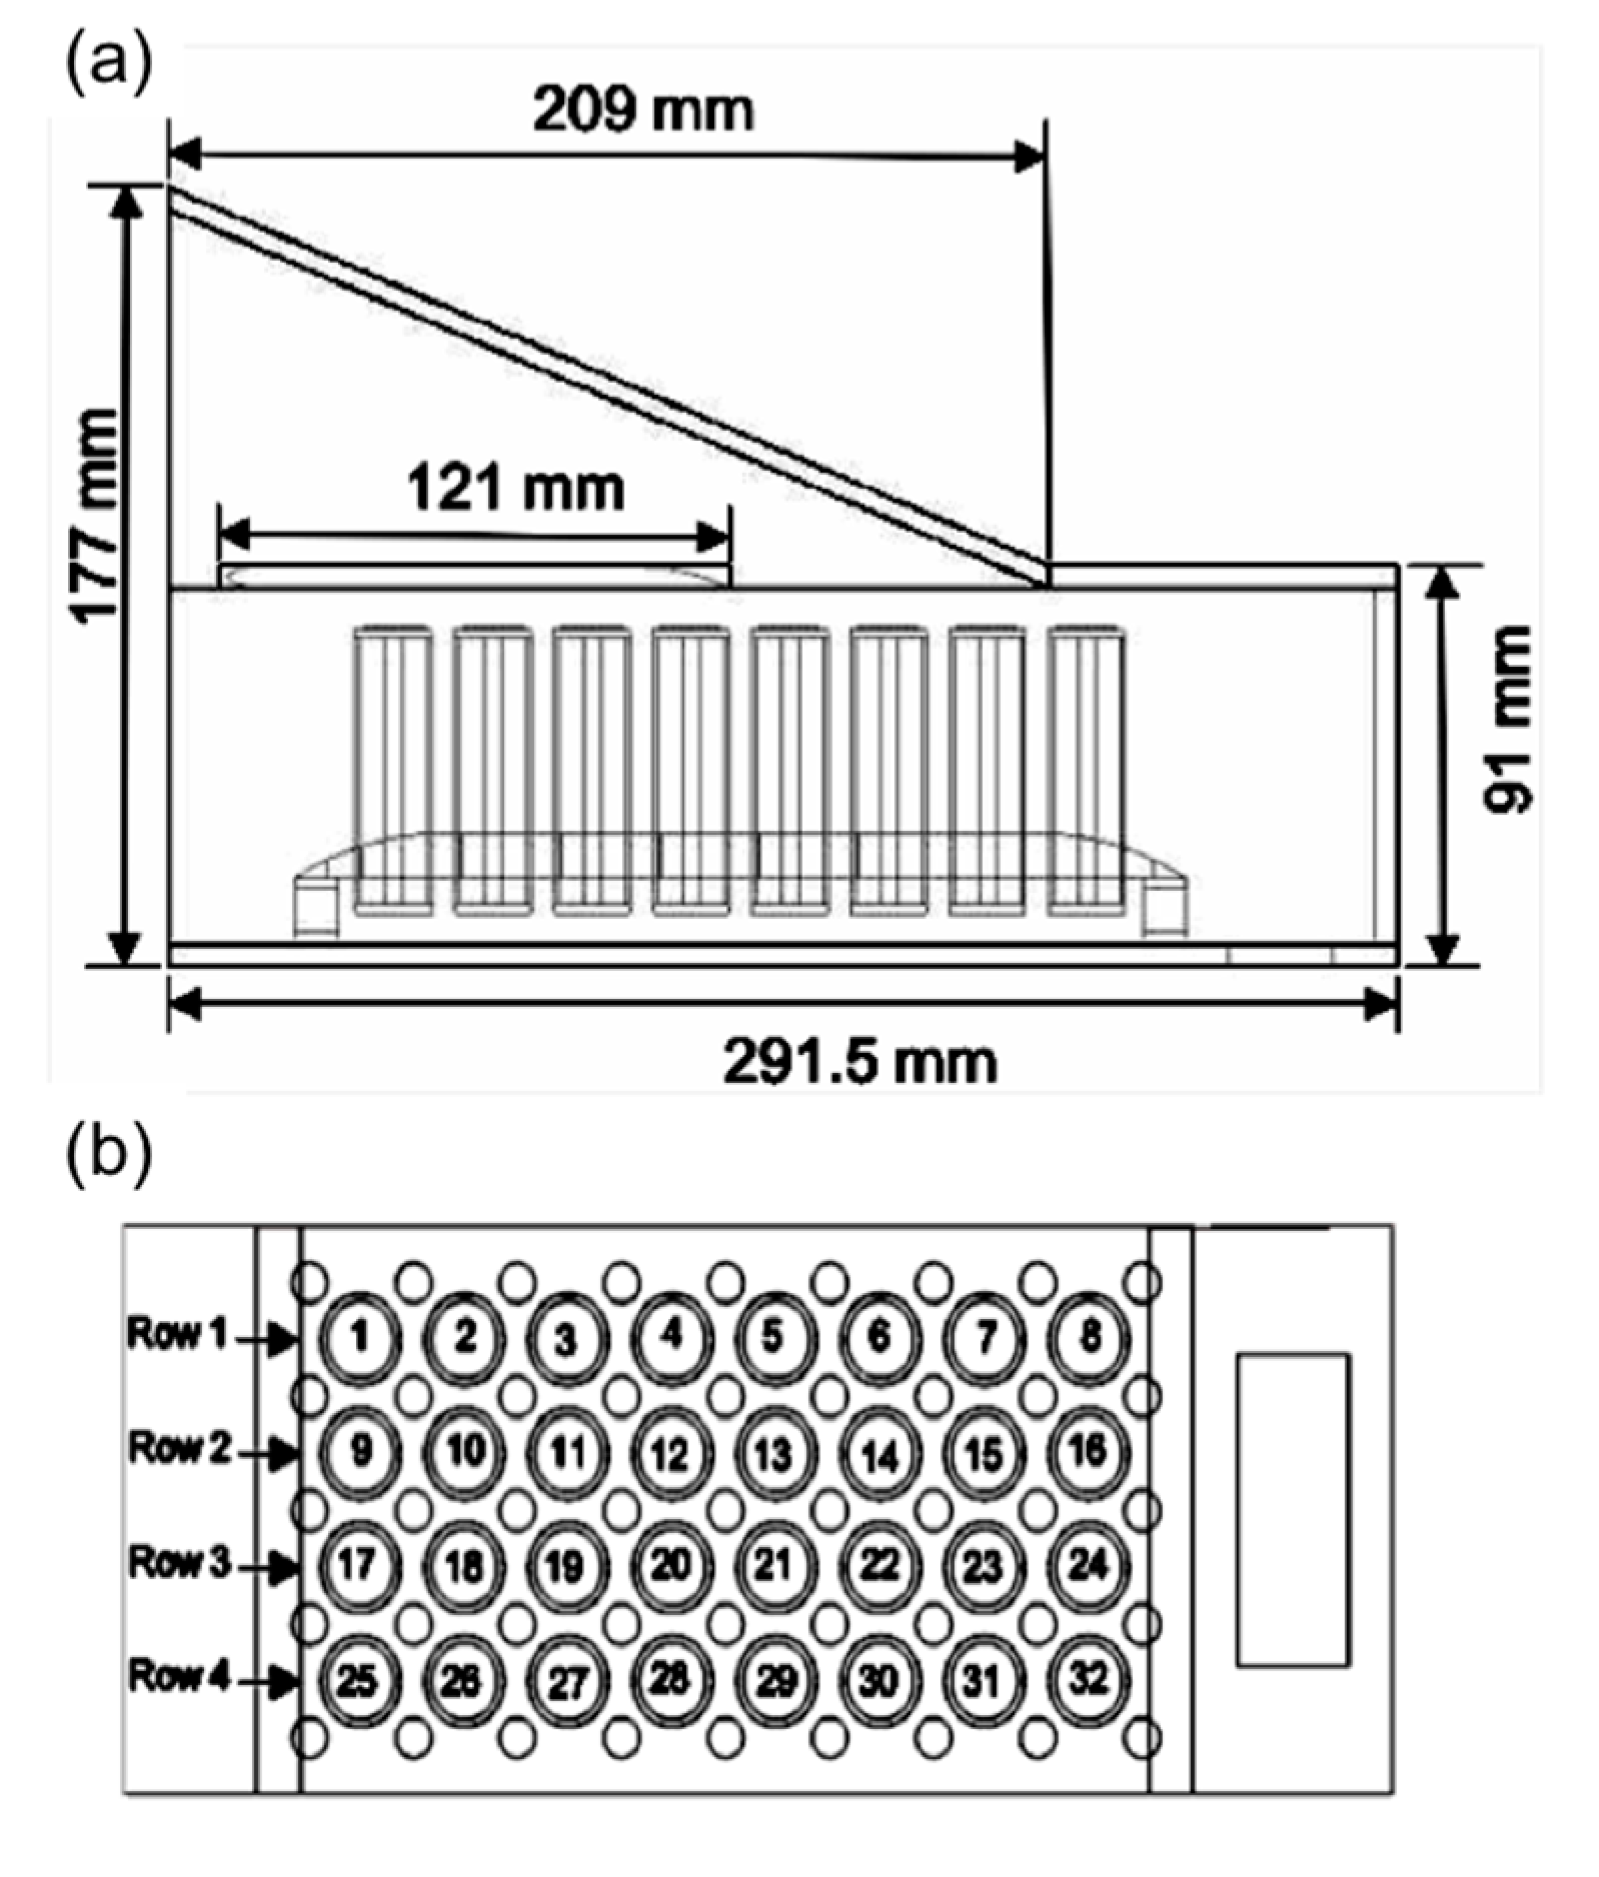
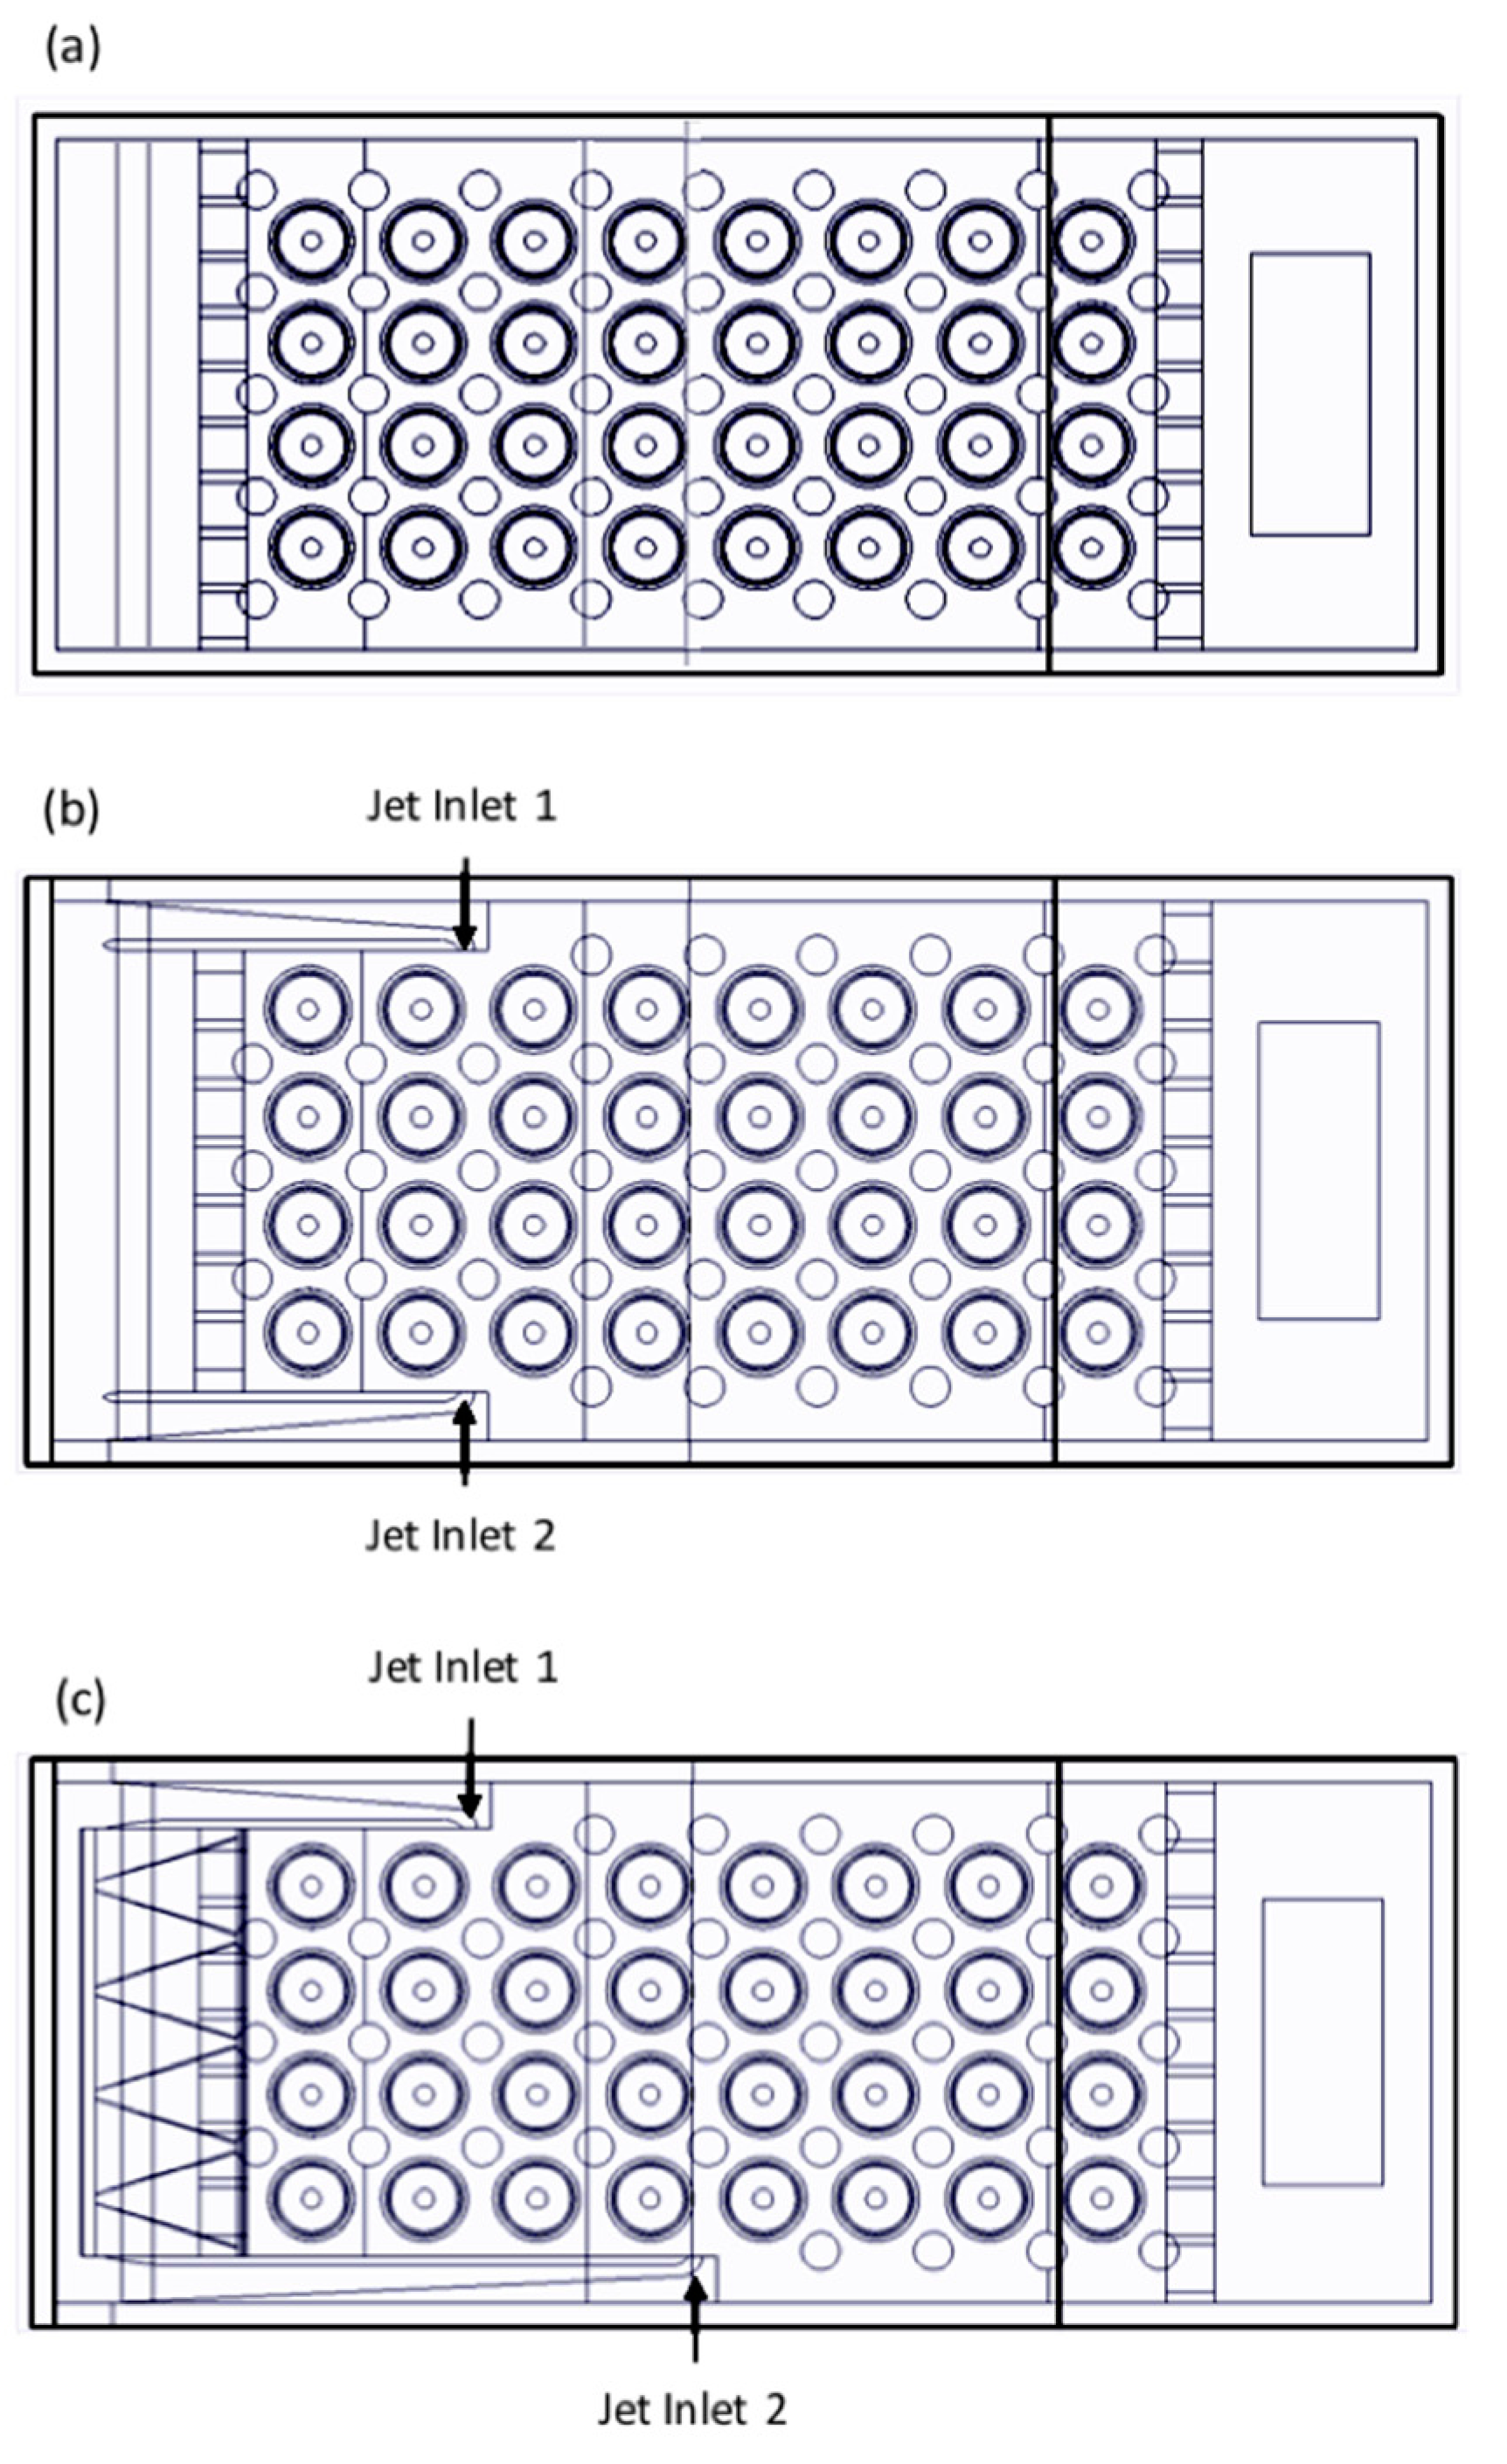
The dimensions of all the battery pack configurations are kept the same as shown in Figure 1a, and the schematic of the arrangement of the cells is shown in Figure 1b. In Case 1 (baseline configuration), an inlet plenum was placed at the top of the battery pack and the outlet is positioned at the bottom of the pack (see Figure 2a). A thin separating plate is used to separate the airflow between the inlet plenum and the cells’ compartment. In addition, the volume of the inlet plenum reduces along the length of the battery pack, which acts as a nozzle and accelerates the airflow into the main compartment as shown in Figure 1a.
In addition to the inlet plenum, jet inlets were added to the sides of the battery pack (Case 2), presented in Figure 2b. As shown in Figure 1a, the air enters from the inlet plenum after the fourth column of cells. As a result, the air from the jet inlet was introduced into the space between the second and the third column of cells (see Figure 2b). The jet changes the airflow dynamics, and significantly minimizes the problem of recirculation and dead air regions between the adjacent cells.
In order to increase mixing within the battery pack, a vortex generator was developed. Multiple delta winglet vortex generators were placed onto a thin plate. To increase the number of vortices generated, the delta winglet vortex generators were mirrored to the bottom of the plate as well. This developed vortex generator is known as the multiple vortex generator (MVG), and is shown in Figure 3. For this study, a configuration was developed in which two MVGs were placed at the front of the cells near the inlet as shown in Figure 3e,f. This is called Case 3.
A combination of MVGs and jet inlets were also investigated. Another configuration was developed in which the jet inlets and MVGs were added to the same configuration, and is presented in Figure 2c as Case 4. However, in this configuration, the air from jet inlet 1 enters between the second and third column of cells and the air from the jet inlet 2 enters between the fourth and the fifth columns in order to enhance the turbulence across the whole battery pack. A summary of all the battery pack configurations is provided in Table 2.
3. Experimental and Numerical Studies
Numerical simulations were performed initially for all of the configurations stated and described in Section 2, as it is an effective and efficient method. However, almost all numerical simulations require experimental data for validation. Therefore, the numerical studies were validated with the experimental data. The methodology employed for the experimental and numerical studies is outlined in detail in the following subsections.
3.1. Experimental Setup
The actual experimental setup is shown in Figure 4a, while Figure 4b shows the schematic. The battery pack was made up of wood except for the top part of the pack, which was made up of acrylic to aid for the visual access. Table 1 gives the specifications for the commercial Li-ion 18650 cells (Samsung INR18650-25R) which were used in the experiments. Two T-type thermocouples (0.51 mm diameter) were used to measure the surface temperatures at the locations shown in Figure 5a. To record the measurements from the thermocouples, a National Instruments (NI) data acquisition device (NI-9211) combined with an NI cDAQ-9178 chassis was used. The NI-9211 module has a built-in cold junction compensation for T-type and K-type thermocouples. Turnigy Reaktor QuadKore (4 × 300 W 20 A) direct current Synchronous Balance Charger/Discharger was used to charge and discharge the battery. An axial fan (203.2 mm diameter, 42 W and 420 cubic feet per minute), supplied by iPower, was used to force air through the battery pack. An anemometer (Proster TL017) with a velocity range of 0 to 30 m/s and a temperature range of −10 °C to 45 °C was used to measure the velocity of the air at the inlet of the battery pack.
3.2. Experimental Procedure
The arrangement for the thermal testing of the cells in the battery pack is shown in Figure 4b. Positive and negative terminals were connected using alligator clip wires to the Reaktor QuadKore charger/discharger. Figure 5a shows the locations (L1 and L2) of the two T-type thermocouples that were placed on the surface of the cell to measure temperature variations, 52 mm from the bottom of the battery pack, using adhesive tapes. The cell surface temperature at location L1 is expected to be higher since it is a dead air region, whereas, at location L2, the temperature is expected to be lower due to the extra cooling provided by the air entering from the inlet plenum. Due to this, temperature measurements were made in these specific locations.
The velocity of the fan was measured at multiple points across the inlet, as shown in Figure 5c. These measured velocities were averaged to obtain an average inlet velocity. The cell was charged at 1 A and 4.2 V. To report the temperature difference between the two locations, it was important to keep similar initial conditions for both of the thermocouples. As soon as the cell temperature was maintained at 23 °C, the discharge process was started and the cell was discharged at a 2C (5 A) discharge rate until it reached the cut-off voltage of 2.7 V. The charging and discharging rates of the cells were carefully selected to be consistent with those provided by the supplier of the cells [14]. LabVIEW was used to record the data from the thermocouples.
Heat flux at the surface of the cell was determined using a second experiment, in which a thin film heat flux sensor (Omega HFS-3) was attached to the surface of the cell as illustrated in Figure 5b. The cell was then insulated so that there was negligible heat transfer from the cell surface, and the voltage from the heat flux sensor was recorded. The heat flux values were obtained by converting the voltage acquired from the heat flux sensor using Equation (1) [15]. The heat flux sensor also employed a K-type thermocouple, and the temperature of the cell surface corresponding to the heat flux was also recorded:
where V is the voltage from the heat flux sensor, and is the heat flux (W/m2).
Using the method suggested by Moffat [16], an uncertainty analysis was performed to estimate the accuracy of the experimental results. The average percentage uncertainty for the temperature measurements is estimated as ±5.2%, and the uncertainty for the heat flux measurements is ±6.2%.
3.3. Numerical Modeling
ANSYS Fluent, a commercial computational fluid dynamics (CFD) software, was used for the numerical modeling. The governing equations relating to the continuity, momentum, and energy are given in Equations (2)–(4), respectively [9].
Continuity Equation:
Momentum Conservation Equation:
Energy Conservation Equation:
In order to simulate the flow of the air, the Shear Stress Transport (SST) k-ω model was employed because of its robustness and stability [6]. The details of the SST model can be found in Menter et al. [17], Sparrow et al. [18], and Lee et al. [19]. The transport equations for the SST model are as follows [6,17]:
where the function F1 is defined by the following equation:
where y is the nearest wall distance, and CDkω is defined as follows:
3.4. Mesh Generation
The ANSYS meshing software was used to generate an unstructured mesh. Inflation layers were applied on the walls of the cells and the battery pack, and mesh refinement was done in order to capture the boundary layers at the walls. The growth ratio of the inflation layers was kept at 1.2 and the thickness of the first layer was set to 0.1 mm. This was selected based on the y+ value of 1 [3,20]. In addition to this, to ensure that the numerical results are independent of the size of the mesh, a mesh independence study was carried out. Between the coarse, medium, and fine mesh, the number of elements was increased by 25%. The selected mesh was comprised of 8.2 million elements based on the mesh independence study.
3.5. Boundary Conditions
In order to make a comparison between all of the configurations described in Section 2, all the boundary conditions were kept the same. It was determined, through a Reynolds number study, that by increasing the Reynolds number (based on the cell diameter as the characteristic length) to 7440, the maximum temperature of the battery pack was reduced by 18.3% and the temperature uniformity was improved by 54.6%. However, beyond a Reynolds number of 7440, there was no significant change in the maximum temperature of the battery pack and the temperature uniformity. The parameters of this study are provided in Table 3, and the results given in Table 4.
By reducing the Reynolds number from 7440 to 4252, there is a reduction of 42.9% in the mass flow rate, as given in Table 3. Based on this, the velocity inlet boundary condition of the air was set at 3.45 m/s for all of the configurations. The inlet flow is also considered turbulent.
Moreover, the temperature of the inlet air was set at 23 °C. For the thermal boundary condition at the surface of the cells, the average value of 2.75 W of the heat generation rate was used. The average value for the heat generation rate was calculated using the heat flux obtained from the experiments conducted, as described in Section 3.1 and Section 3.2. The pressure-outlet boundary condition was selected as the outlet boundary condition, and the flow was considered incompressible, steady-state, and turbulent. At the walls, a no-slip boundary condition was selected. The convergence criteria were set to 1 × 10⁻⁴ of the residuals of the computational variables including continuity, velocity, turbulence, specific dissipation rate, and the energy equations. The semi-implicit method for pressure-linked equations (SIMPLE) was used for pressure-velocity coupling, and a second order upwind spatial discretization method was used for the momentum, turbulent kinetic energy, specific dissipation rate, and energy equations [20].
4. Results and Discussion
4.1. Heat Generation Rate of Cell
The results of the heat generation rate and the corresponding temperatures at the surface of the cells are shown in Figure 6. The profiles of the heat generation rate and the temperature (without cooling) are consistent with the profiles reported in the study by Saw et al. [6]. The maximum heat generation rate measured is 3.77 W, and its corresponding temperature increases up to 55.7 °C. The profiles in Figure 6 provide a perspective of how the heat generation rate and temperature changed with time during the experiments.
4.2. Model Validation
Model validations are required and deemed necessary in order to confirm that the generated mesh, model parameters, and boundary conditions used are appropriate. Therefore, the numerical study employed for this research was validated with the results of the experimental studies.
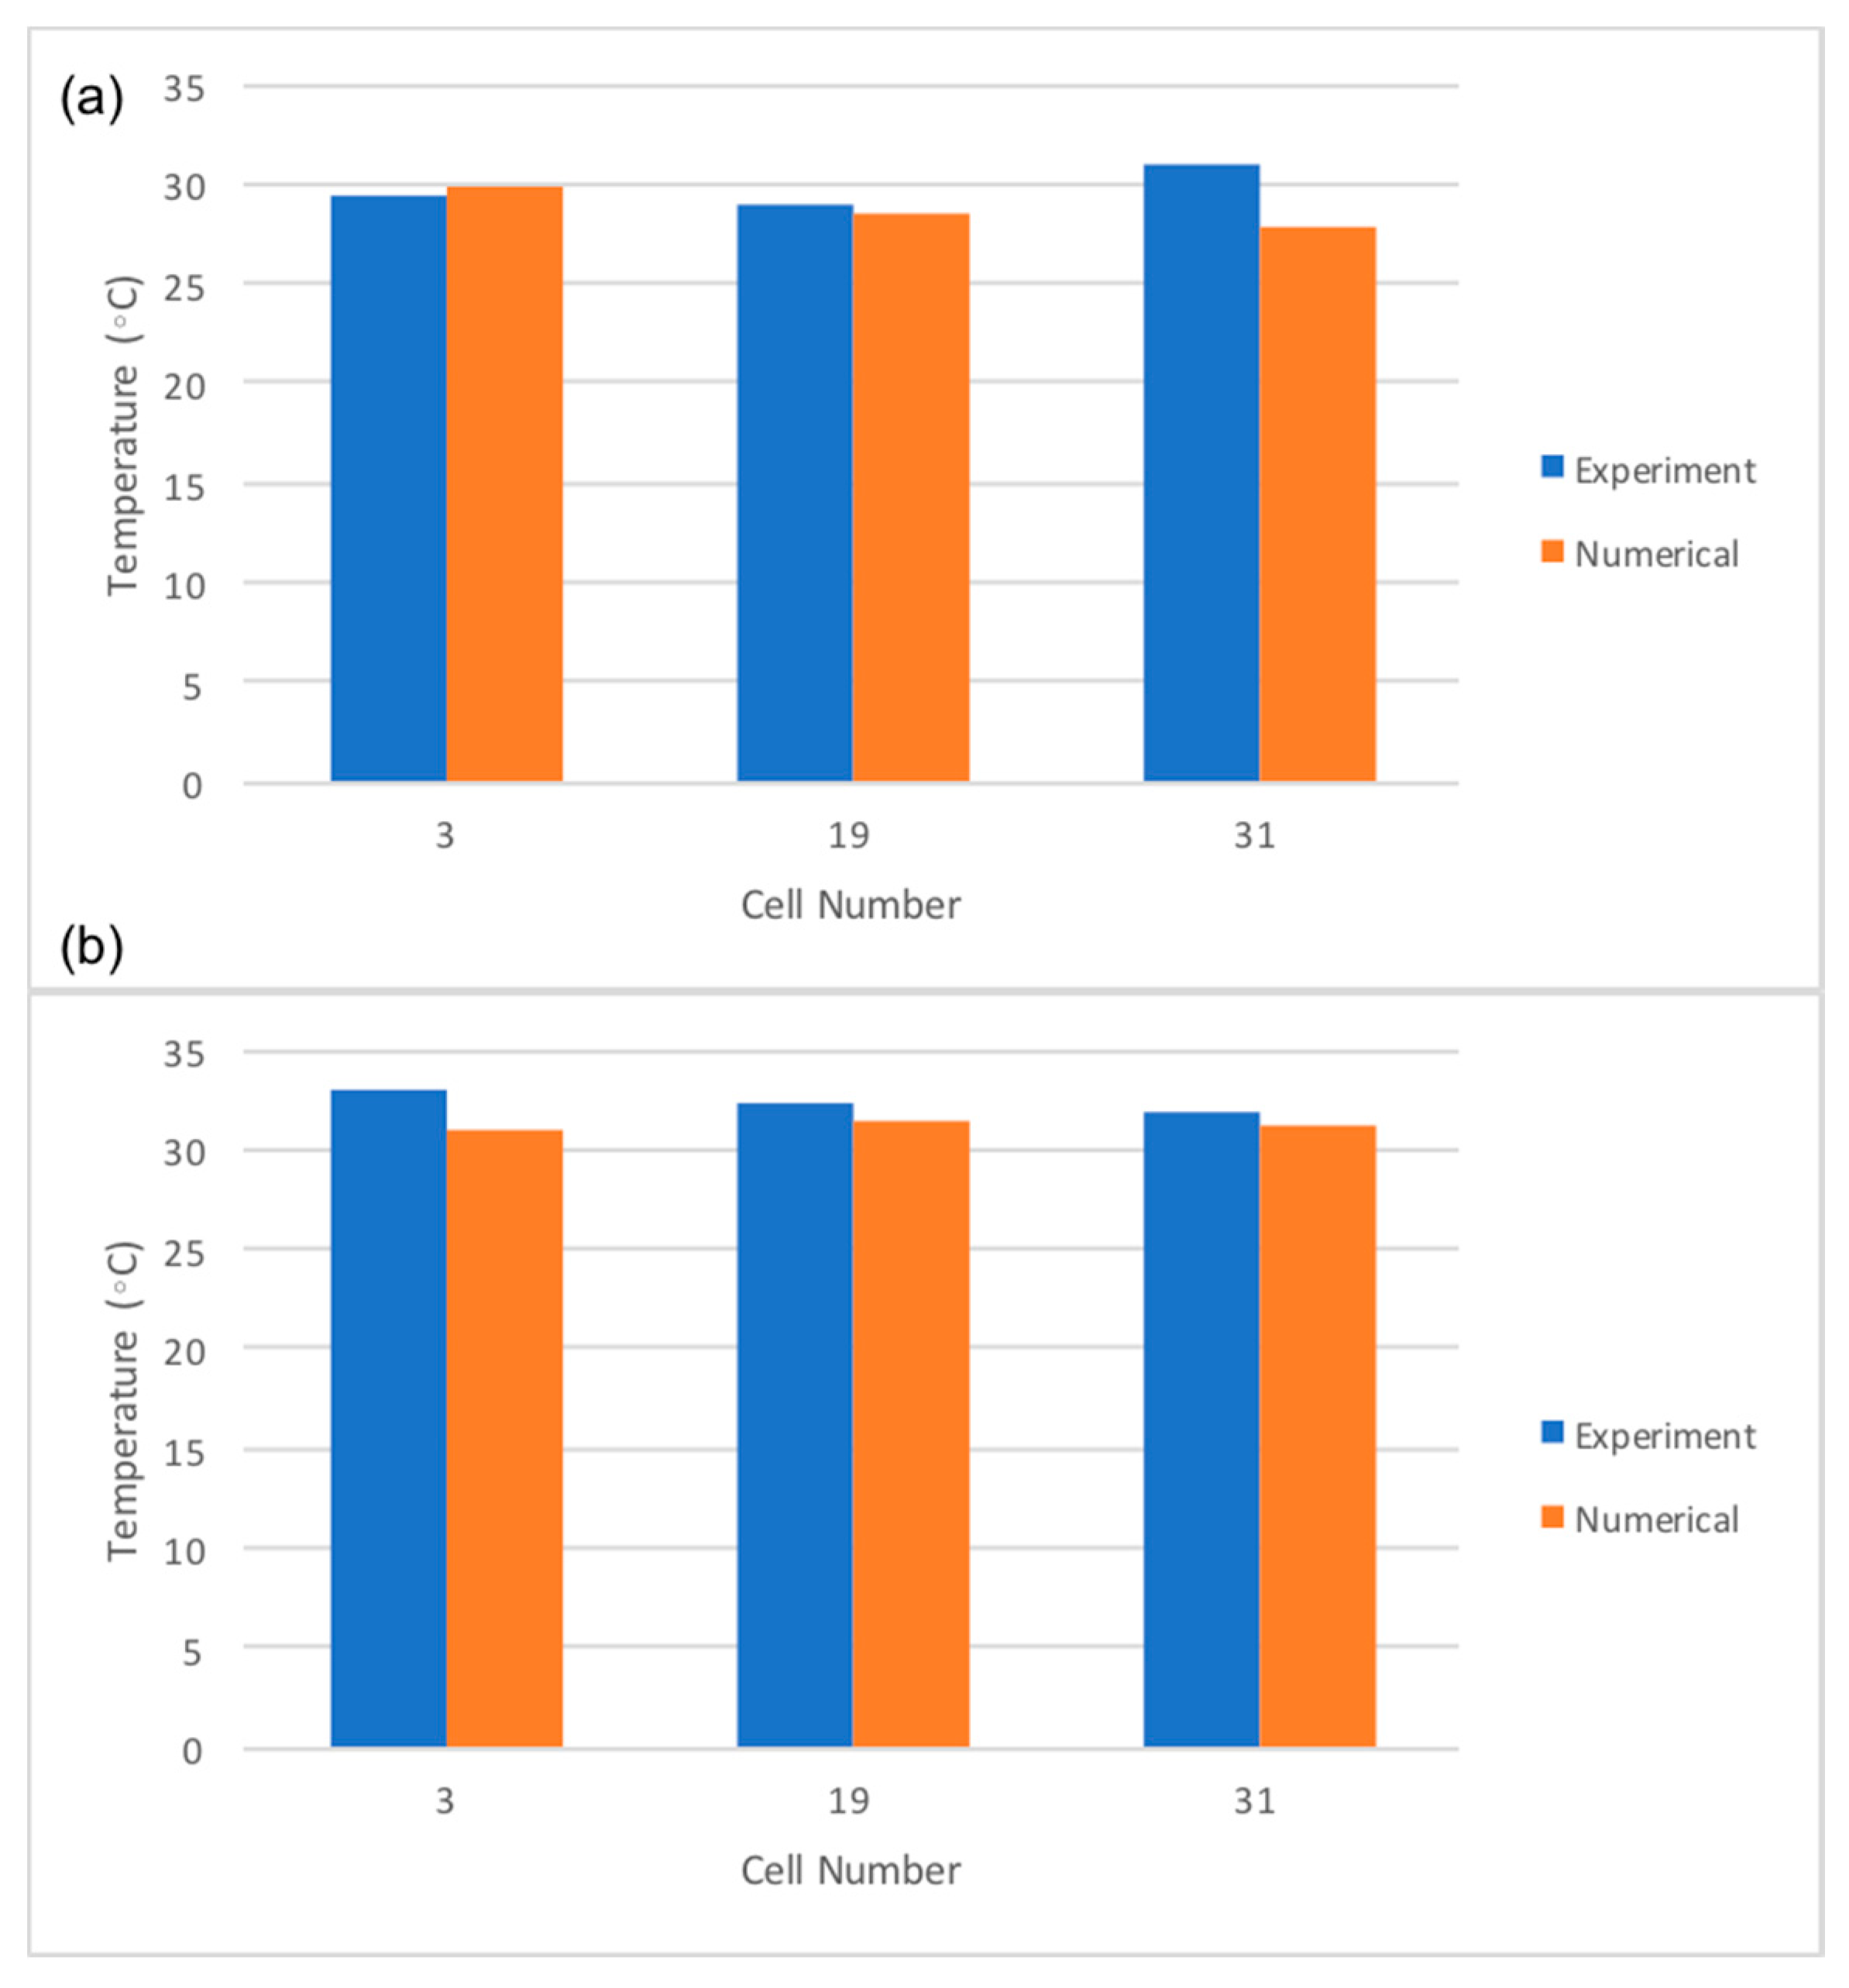
Due to the limited capacity of the charger/discharger, only one cell at a time was tested. As a result, three cells were selected randomly for the experiments, which include the cells numbered 3, 9, and 31 as indicated in Figure 1b. The temperature measurements obtained for these cells at locations L1 and L2 from the experiments (Figure 5a) were compared with the temperature results attained from the simulations at the same locations. The validations are shown in Figure 7, and the temperature differences between the compared results are provided in Table 5. There is an average temperature difference of 1.1 °C between the experiments and simulations, which agrees with the temperature validations in the open literature [21]. Therefore, it can be concluded that the numerical results are consistent with the experimental results.
4.3. Jet Inlet Analysis
A summary of the comparison of results from Case 2 and Case 1 (baseline configuration) is given in Table 6. The maximum temperature in the table represents the maximum temperature of the whole battery pack, and not of a particular cell. Similarly, the temperature difference represents the difference between the maximum temperature of the battery pack and the minimum temperature of the battery pack. The temperature difference per cell in the tables represents the cell with the highest temperature difference in the battery pack. The average maximum temperature provides the averages of the maximum temperatures of each cell, and similarly, the average temperature difference gives the averages of the temperature differences between the maximum and minimum temperatures of each cell. Note that a higher temperature difference equates to lower temperature uniformity in the battery pack, and a lower temperature difference equates to a higher temperature uniformity. A negative value of the percentage difference means that the maximum temperature or the temperature difference is higher, whereas a positive value shows that the maximum temperature or temperature difference is lower.
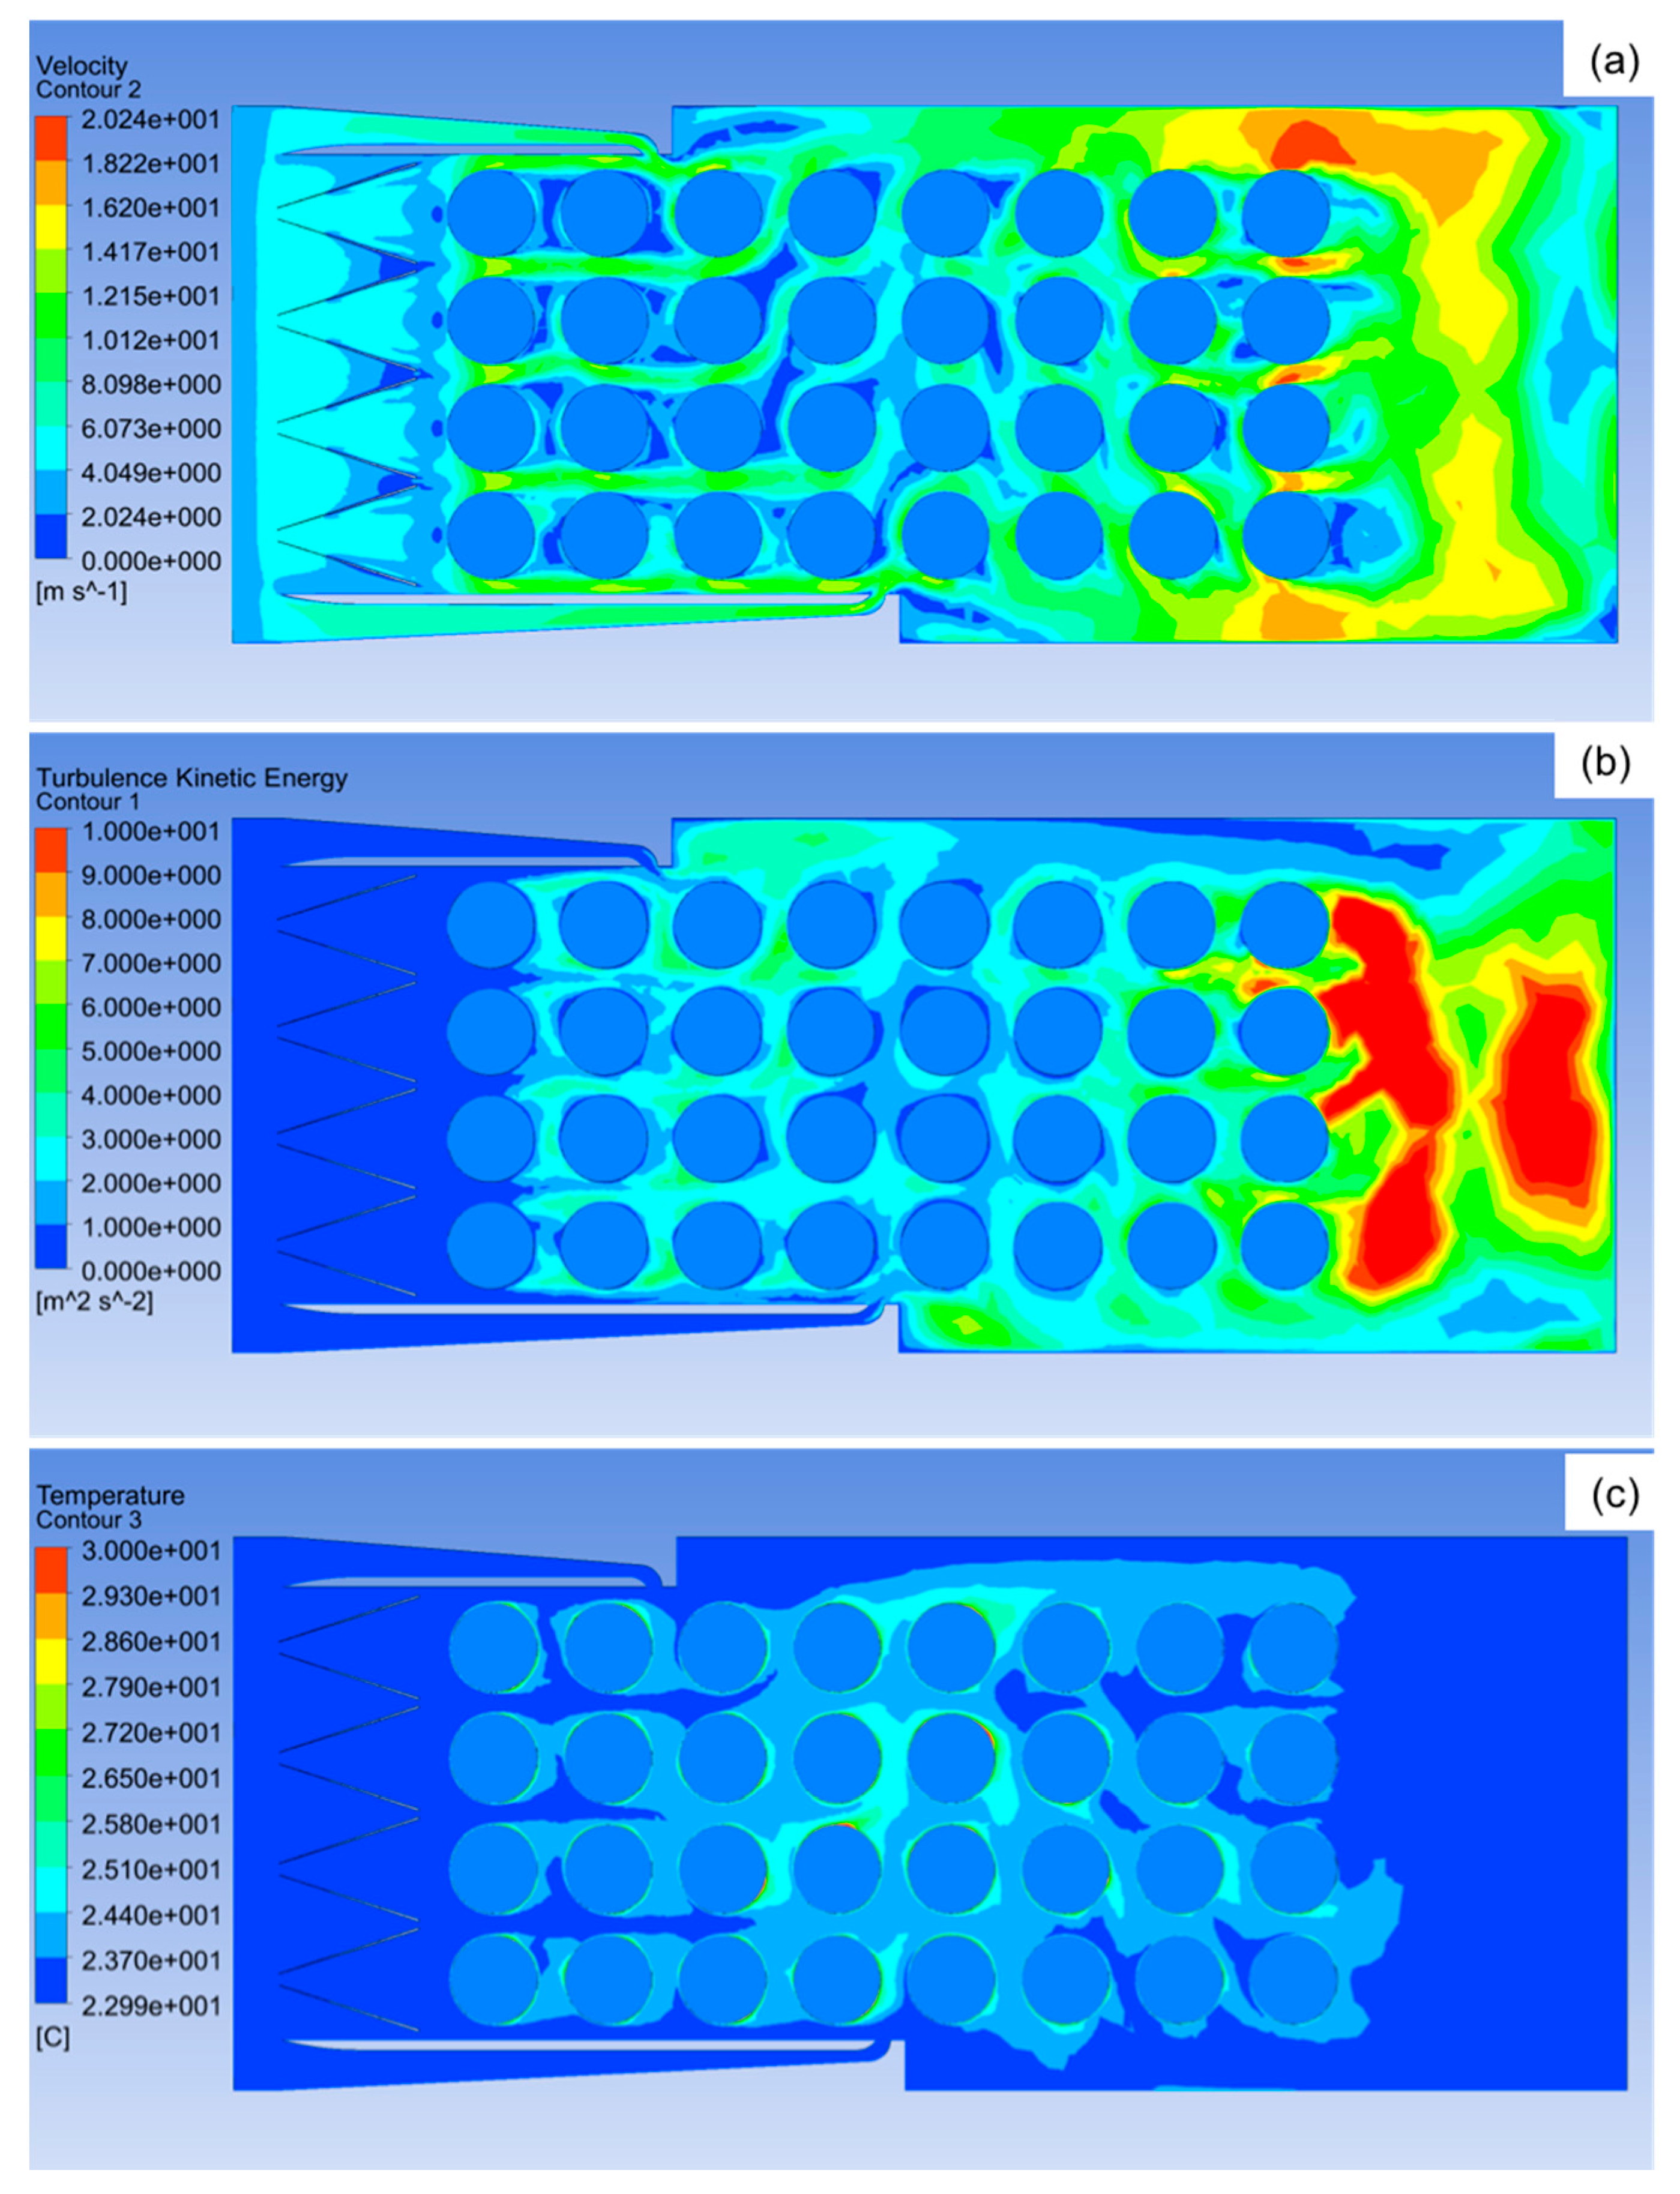
It can be noted from Table 6 that there are minute differences in the maximum temperatures and average maximum temperatures of Case 2 compared to Case 1. The temperature difference of Case 2’s configuration increased by only 2.66%, and the average temperature difference of all the cells increased by 3.13%. The contours of velocity, turbulence kinetic energy, and temperature are also shown in Figure 8.
It can be seen from Figure 8a that the air entering from the jet inlet forces its way into the empty spaces between the adjacent cells. This suggests that there is an increase in turbulence and mixing near the second and the third columns of cells. To investigate the flow turbulence, the turbulence kinetic energy was obtained and contours shown in Figure 8b. The figure shows that the turbulence kinetic energy reduces near the fourth and fifth columns of the cells. The rest of the columns experienced high turbulence kinetic energy due to the inlet plenum placed at the top of the battery pack. It can be seen from Figure 8c that the locations with relatively high turbulence kinetic energy have low temperatures due to the incoming air (at low temperature) from the inlet plenum. This can be attributed to the intense mixing of the fluid flow, which enhances heat and momentum transfer. This, in turn, increases the convection heat transfer coefficient, resulting in a higher rate of heat transfer.
4.4. Multiple Vortex Generator Analysis
Table 6 provides a summary of the results of Case 3 compared to those of Case 1. Similar to Case 2, the results of Case 3 show insignificant differences between the maximum temperatures of the battery pack and the average maximum temperatures for all of the cells. The temperature uniformity of Case 3’s configuration is approximately the same as that of Case 1, and the average temperature uniformity decreases by 7.4% in Case 3’s configuration. The results of Case 3 are similar to those of Case 1. Figure 9 provides the contours of velocity, turbulence kinetic energy, and temperature for Case 3. It can be seen from Figure 9b that due to the turbulence created by the multiple vortex generators, the cells in the first two columns experience high turbulence. However, the turbulence dissipates quickly as the flow moves to the fourth and fifth columns of cells. From Figure 9c, it can be seen that temperature starts to increase after the second column as the turbulence kinetic energy reduces, and the cells in the fourth and fifth columns experience the highest temperatures. This is also because a higher turbulence and mixing near the cells in the first and second columns causes a greater amount of fresh air to convect heat away from the cells in these columns, and as a result the temperature of the air increases. Therefore, less amount of low temperature air is available to convect heat away from the cells in the fourth and fifth columns. This reduces the convection of heat, thereby increasing the maximum temperatures of the cells. So, even though the cells near the vortex generators have lower temperature and high temperature uniformity, the overall impact of this is very low because the cells in the middle of the battery pack have minimal temperature uniformity and high temperature.
By comparing Case 2 (Figure 8b) and Case 3 (Figure 9b), it can be seen that Case 2 displays higher turbulence kinetic energy across the entire battery pack compared to Case 3, which is why Case 2 exhibits an overall lower average maximum temperature. Additionally, comparing Figure 8b and Figure 9b, it can be seen that the higher temperature air is forced out towards the sides of the battery pack, rather than traveling axially (as in Figure 9b), which also lowers the average maximum temperature and the average temperature difference of the battery pack.
4.5. Jet Inlet and Multiple Vortex Generator Analysis
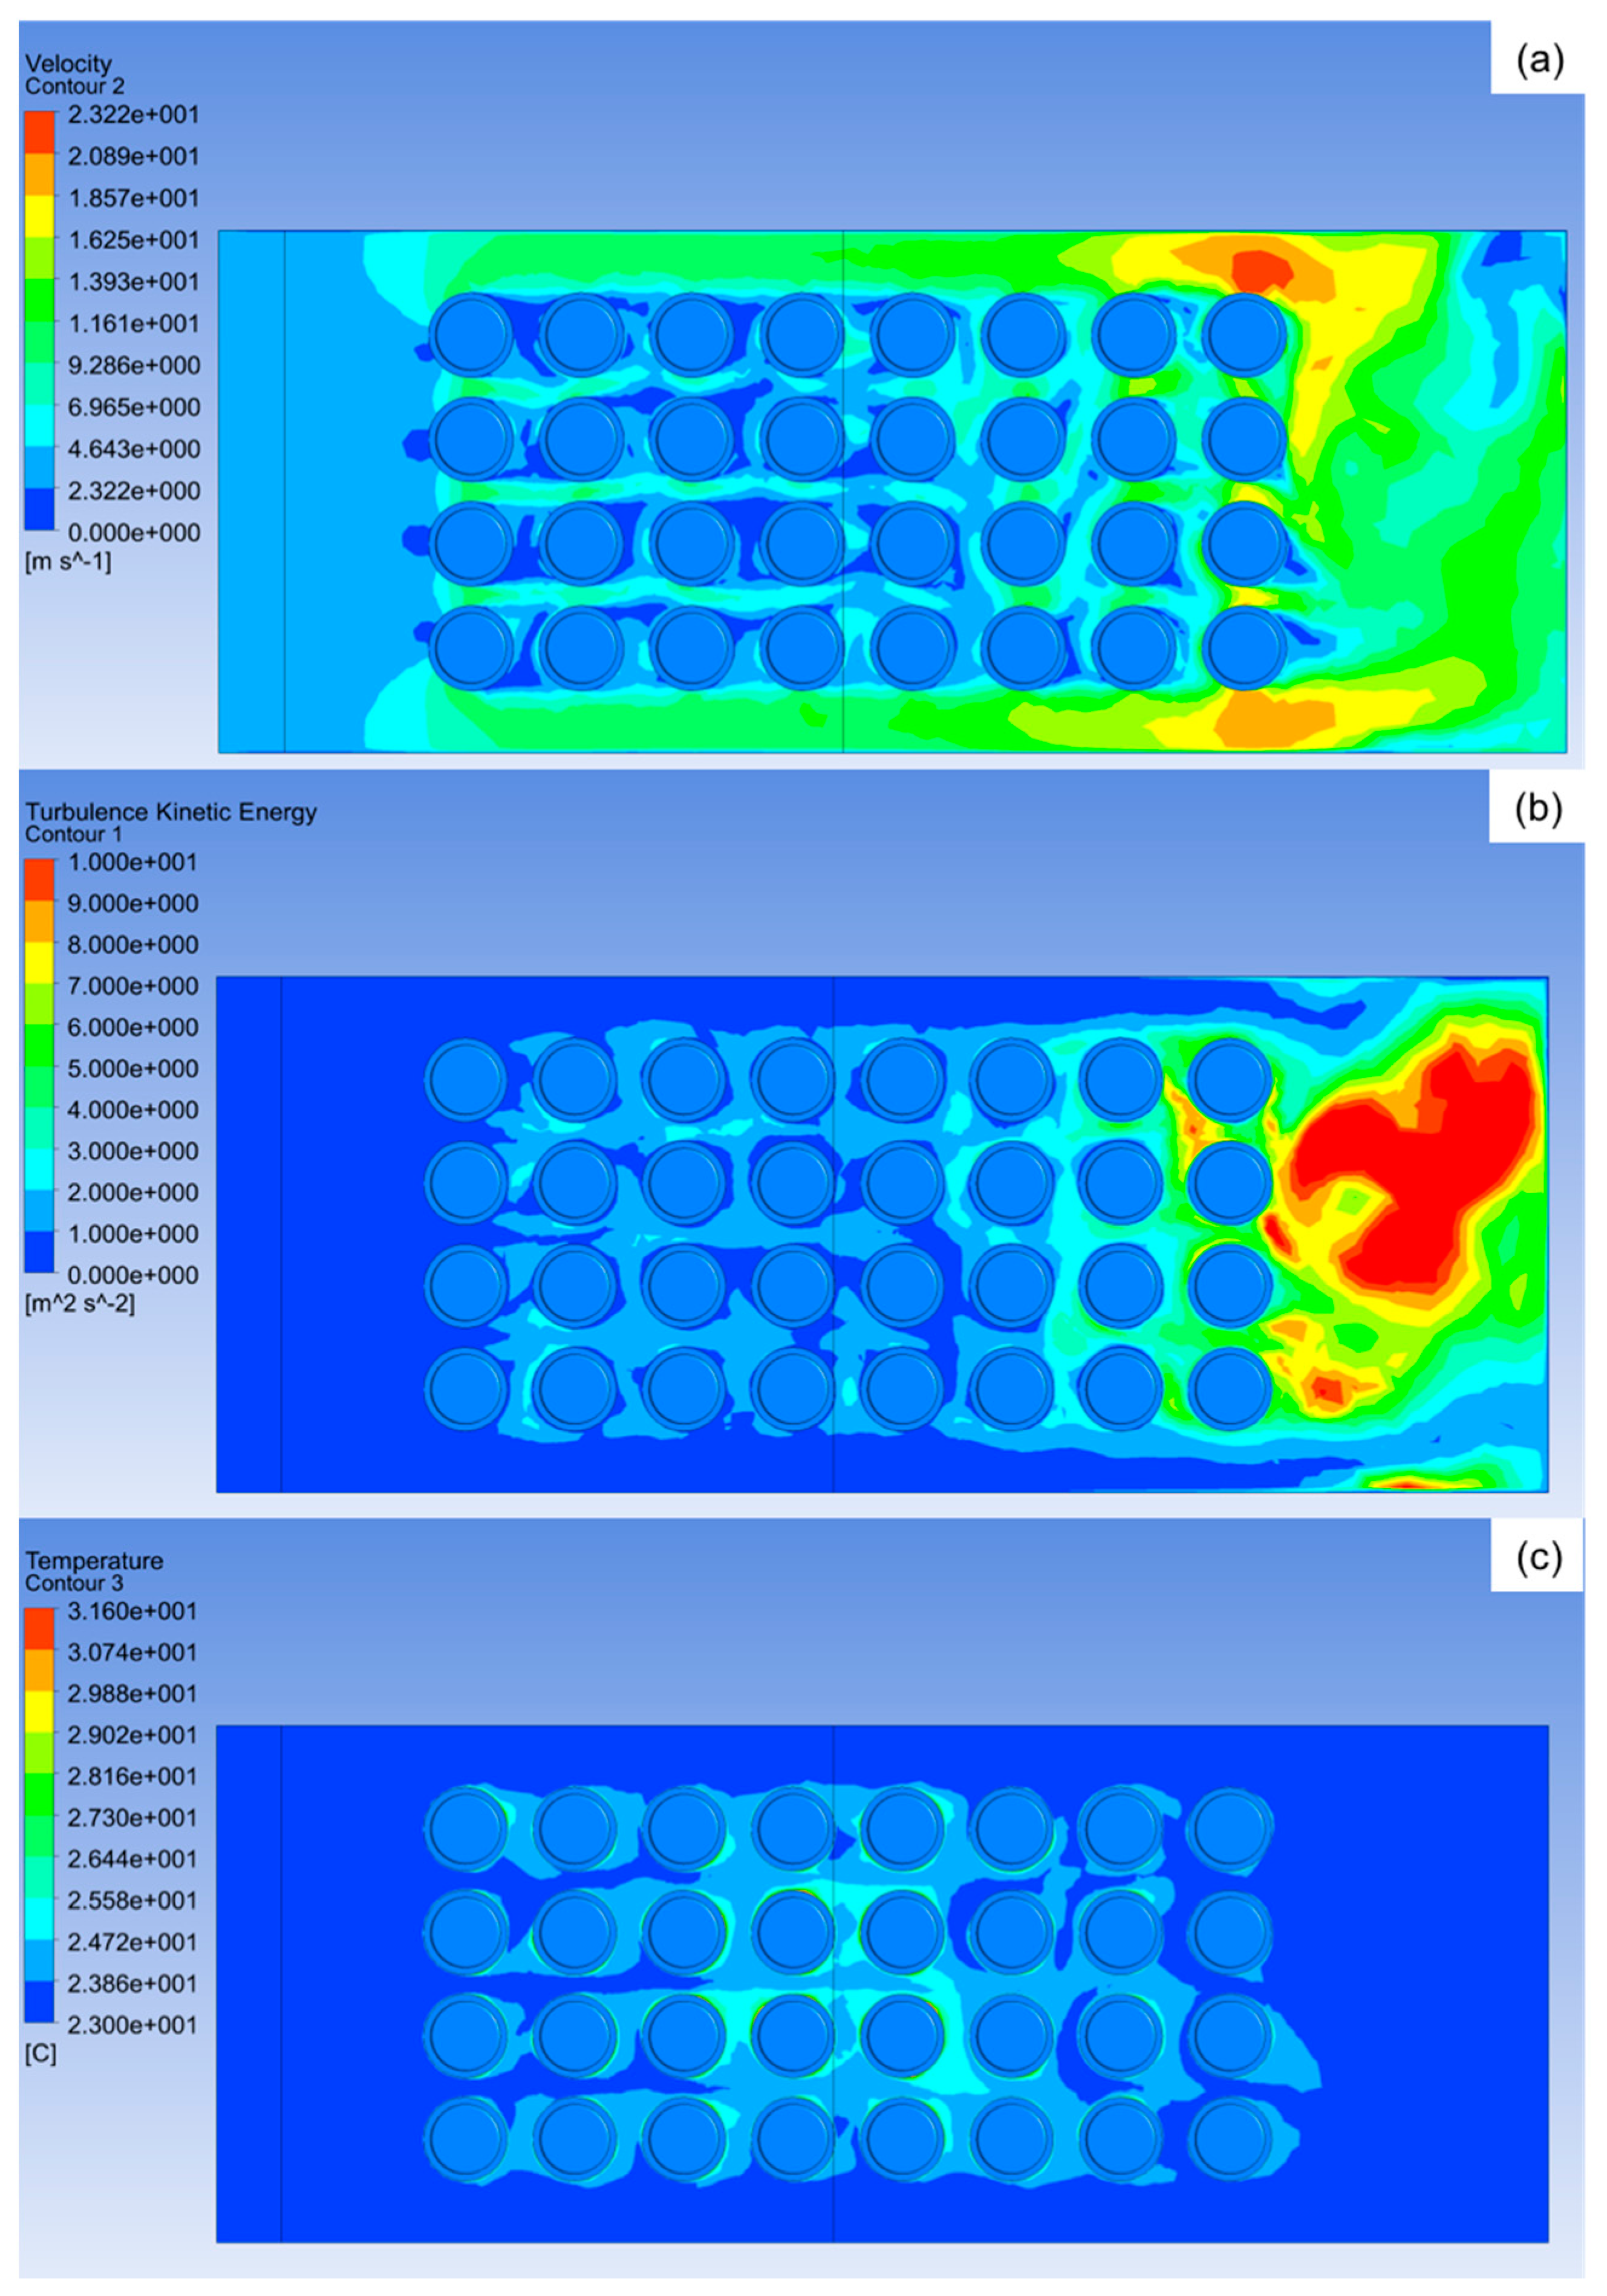
Table 6 provides the summary of the results of Case 4 compared with the baseline configuration, Case 1. It can be seen that by adding jet inlets in combination with the MVGs, the results have improved significantly. The maximum temperature of the battery pack is decreased by 4.96% to 30 °C, and the temperature difference within the battery pack is decreased by 21.5%. Additionally, the cell with highest temperature difference exhibits a temperature difference of 4.13 °C, whereas the cell in Case 1 shows a temperature difference of 4.94 °C, which is an improvement of 16.3%. Detailed contours of the velocity, turbulence kinetic energy, and temperature for Case 4 are provided in Figure 10, whereas those of Case 1 are provided in Figure 11, for comparison purposes.
By comparing Case 3 (Figure 9b) and Case 4 (Figure 10b), it can be observed that in Case 4’s configuration the whole battery pack experiences increased turbulence kinetic energy instead of just the first two columns of Case 3. In addition to this, the temperature distribution is more uniform in Case 4 (Figure 10c) across the battery pack, when compared to Case 3 (Figure 9c), resulting in an increased temperature uniformity. This is because, in Case 4 (Figure 10a), it can be seen that the jet inlets change the direction of the flow. This allows the air to pass through the gaps between adjacent cells and increases the mixing of air, rather than having the air flow in a straight direction as in Case 3 (Figure 9a).
It can be found from the comparison of Case 4 (Figure 10b) and Case 1 (Figure 11b) that by incorporating jet inlets and vortex generators into the battery pack, the turbulence kinetic energy across the battery has significantly increased. At the same mass flow rate, the maximum temperature reduced while the temperature uniformity improved significantly. This increase in turbulence in the battery pack results in an increase in the amount of heat convected away from the cells. The jet inlets also provide low temperature air to the cells at the middle of the battery pack, which, as shown in Figure 10c, results in reduced temperature at the hotspots observed in the previous configurations and the baseline configuration (Figure 11c). It can be seen by comparing Figure 10a and Figure 11a that due to the MVGs and jet inlets, there is a higher amount of air mixing that allows the air to pass between the spaces of adjacent cells; thereby convecting the heat away from these locations.
5. Conclusions
In this paper, techniques to improve cooling and temperature uniformity in a simple battery pack were developed and examined. Four battery pack configurations were developed. In the first configuration (considered as the baseline configuration), an inlet plenum was added to a simple battery pack. It was designed such that the air from the inlet plenum enters after the fourth column of cells and improves cooling and temperature uniformity relative to the original, simple pack. In the second configuration, jet inlets were added to the first configuration, and in the third configuration, multiple vortex generators were added to the first configuration. Finally, in the fourth configuration, both the jet inlets and multiple vortex generators were incorporated into the first configuration. The results concluded that by adding jet inlets only, there was negligible reduction in the maximum temperatures and improvement in temperature uniformity. Similar observations were made for the third configuration, in which a set of multiple vortex generators were added. However, when incorporating both the multiple vortex generators and jet inlets in the same configuration (the fourth configuration), significant improvements were observed. The maximum temperature of the battery pack was reduced by ~5%, and the temperature difference between the maximum temperature and the minimum temperature exhibited by the battery pack was reduced by 21.5%. Additionally, the cell with the highest temperature difference between the maximum temperature and the minimum temperature exhibited a temperature difference of 4.13 °C, whereas in the first configuration, the temperature difference recorded was 4.94 °C. This results in a ~16% improvement in the temperature uniformity of a single cell. Moreover, the new technique developed in this study achieved the desired temperature uniformity within the entire battery pack and within each cell to ~5 °C. It is also important to note that the stated cooling effectiveness and temperature uniformity were achieved with less mass flow rate and power requirement compared to the baseline configuration.
Acknowledgments
Financial support of this work by the Natural Sciences and Engineering Research Council of Canada is gratefully acknowledged by the second author.
Author Contributions
The work was conceived by Martin Agelin-Chaab and Seham Shahid developed and analyzed the concepts under his guidance.
Conflicts of Interest
The authors declare no conflict of interest.
Nomenclature
| Specific heat capacity (J kg−1 K−1) | |
| E | Total energy (J) |
| F1 | Blending function in SST model |
| k | Turbulence kinetic energy (J kg−1) |
| Thermal conductivity (W m−1 K−1) | |
| Scale factor | |
| p | Pressure (Pa) |
| Heat flux (W m−2) | |
| S | Absolute value of shear strain rate |
| t | Time (s) |
| V | Heat flux sensor voltage (V) |
| v | Velocity (m s−1) |
| Velocity vector (m s−1) | |
| Tensor coordinate | |
| y | Nearest wall distance (m) |
| Symbols | |
| SST model constant | |
| SST model constant | |
| Viscosity (Pa s) | |
| Density (kg m−3) | |
| Diffusion parameters | |
| Specific rate of turbulence dissipation (s−1) | |
| Subscripts | |
| i | Tensor indices |
| x | x-direction |
| y | y-direction |
| z | z-direction |
References
- Sources of Greenhouse Gas Emissions. Available online: https://www.epa.gov/ghgemissions/sources-greenhouse-gas-emissions (accessed on 16 October 2016).
- Omar, N.; Abdel, M.; Firouz, Y.; Salminen, J.; Smekens, J.; Hegazy, O.; Gaulous, H.; Mulder, G.; Van Den Bossche, P.; Coosemans, T. Lithium iron phosphate based battery—Assessment of the aging parameters and development of cycle life model. Appl. Energy 2014, 113, 1575–1585. [Google Scholar] [CrossRef]
- Li, X.; He, F.; Ma, L. Thermal management of cylindrical batteries investigated using wind tunnel testing and computational fluid dynamics simulation. J. Power Sources 2013, 238, 395–402. [Google Scholar] [CrossRef]
- Yang, T.; Yang, N.; Zhang, X.; Li, G. Investigation of the thermal performance of axial-flow air cooling for the lithium-ion battery pack. Int. J. Therm. Sci. 2016, 108, 132–144. [Google Scholar] [CrossRef]
- Kuper, C.; Hoh, M.; Houchin-Miller, G.; Fuhr, J. Thermal Management of Hybrid Vehicle Battery Systems. In Proceedings of the International Battery, Hybrid and Fuel Cell Electric Vehicle Symposium (EVS24), Stavanger, Norway, 13–16 May 2009; pp. 1–10. [Google Scholar]
- Saw, L.H.; Ye, Y.; Tay, A.A.O.; Chong, W.T.; Kuan, S.H.; Yew, M.C. Computational fluid dynamic and thermal analysis of Lithium-ion battery pack with air cooling. Appl. Energy 2016, 177, 783–792. [Google Scholar] [CrossRef]
- Zhao, J.; Rao, Z.; Huo, Y.; Liu, X.; Li, Y. Thermal management of cylindrical power battery module for extending the life of new energy electric vehicles. Appl. Therm. Eng. 2015, 85, 33–43. [Google Scholar] [CrossRef]
- Wang, T.; Tseng, K.J.; Zhao, J.; Wei, Z. Thermal investigation of lithium-ion battery module with different cell arrangement structures and forced air-cooling strategies. Appl. Energy 2014, 134, 229–238. [Google Scholar] [CrossRef]
- Wang, T.; Tseng, K.J.; Zhao, J. Development of efficient air-cooling strategies for lithium-ion battery module based on empirical heat source model. Appl. Therm. Eng. 2015, 90, 521–529. [Google Scholar] [CrossRef]
- Cho, G.Y.; Choi, J.W.; Park, J.H.; Cha, S.W. Transient modeling and validation of lithium ion battery pack with air cooled thermal management system for electric vehicles. Int. J. Automot. Technol. 2014, 803, 795–803. [Google Scholar] [CrossRef]
- Yang, N.; Zhang, X.; Li, G.; Hua, D. Assessment of the forced air-cooling performance for cylindrical lithium-ion battery packs: A comparative analysis between aligned and staggered cell arrangements. Appl. Therm. Eng. 2015, 80, 55–65. [Google Scholar] [CrossRef]
- Mahamud, R.; Park, C. Reciprocating air flow for Li-ion battery thermal management to improve temperature uniformity. J. Power Sources 2011, 196, 5685–5696. [Google Scholar] [CrossRef]
- Liu, Y.P.; Ouyang, C.Z.; Jiang, Q.B.; Liang, B. Design and parametric optimization of thermal management of lithium-ion battery module with reciprocating air-flow. J. Cent. South Univ. 2015, 22, 3970–3976. [Google Scholar] [CrossRef]
- Specification of Product. Available online: http://dalincom.ru/datasheet/SAMSUNG INR18650-25R.pdf (accessed on 27 March 2017).
- User’s Guide (HFS-3, HFS-4 Thin Film Flux Sensors). Available online: http://www.omega.com/manuals/manualpdf/m1844.pdf (accessed on 27 March 2017).
- Moffat, R.J. Describing the uncertainties in experimental results. Exp. Therm. Fluid Sci. 1988, 1, 3–17. [Google Scholar] [CrossRef]
- Menter, F.R.; Kuntz, M.; Langtry, R. Ten years of industrial experience with the SST turbulence model. Turbul. Heat Mass Transf. 2003, 4, 625–632. [Google Scholar] [CrossRef]
- Sparrow, E.M.; Abraham, J.P.; Minkowycz, W.J. Flow separation in a diverging conical duct: Effect of Reynolds number and divergence angle. Int. J. Heat Mass Transf. 2009, 52, 3079–3083. [Google Scholar] [CrossRef]
- Lee, G.G.; Allan, W.D.E.; Boulama, K.G. Flow and performance characteristics of an Allison 250 gas turbine S-shaped diffuser: Effects of geometry variations. Int. J. Heat Fluid Flow. 2013, 42, 151–163. [Google Scholar] [CrossRef]
- He, F.; Wang, H.; Ma, L. Experimental demonstration of active thermal control of a battery module consisting of multiple Li-ion cells. Int. J. Heat Mass Transf. 2015, 91, 630–639. [Google Scholar] [CrossRef]
- Ling, Z.; Wang, F.; Fang, X.; Gao, X.; Zhang, Z. A hybrid thermal management system for lithium ion batteries combining phase change materials with forced-air cooling. Appl. Energy 2015, 148, 403–409. [Google Scholar] [CrossRef]
Figure 1.
Schematics of the (a) battery pack and (b) arrangement of cells.

Figure 2.
Top view of schematics of (a) Case 1; (b) Case 2; and (c) Case 4.

Figure 3.
(a) Side view of multiple vortex generator (MVG); (b) front view of MVG; (c) top view of MVG; (d) computer aided design (CAD) model of MVG; (e) side view of Case 3, and (f) top view of Case 3.
Figure 3.
(a) Side view of multiple vortex generator (MVG); (b) front view of MVG; (c) top view of MVG; (d) computer aided design (CAD) model of MVG; (e) side view of Case 3, and (f) top view of Case 3.
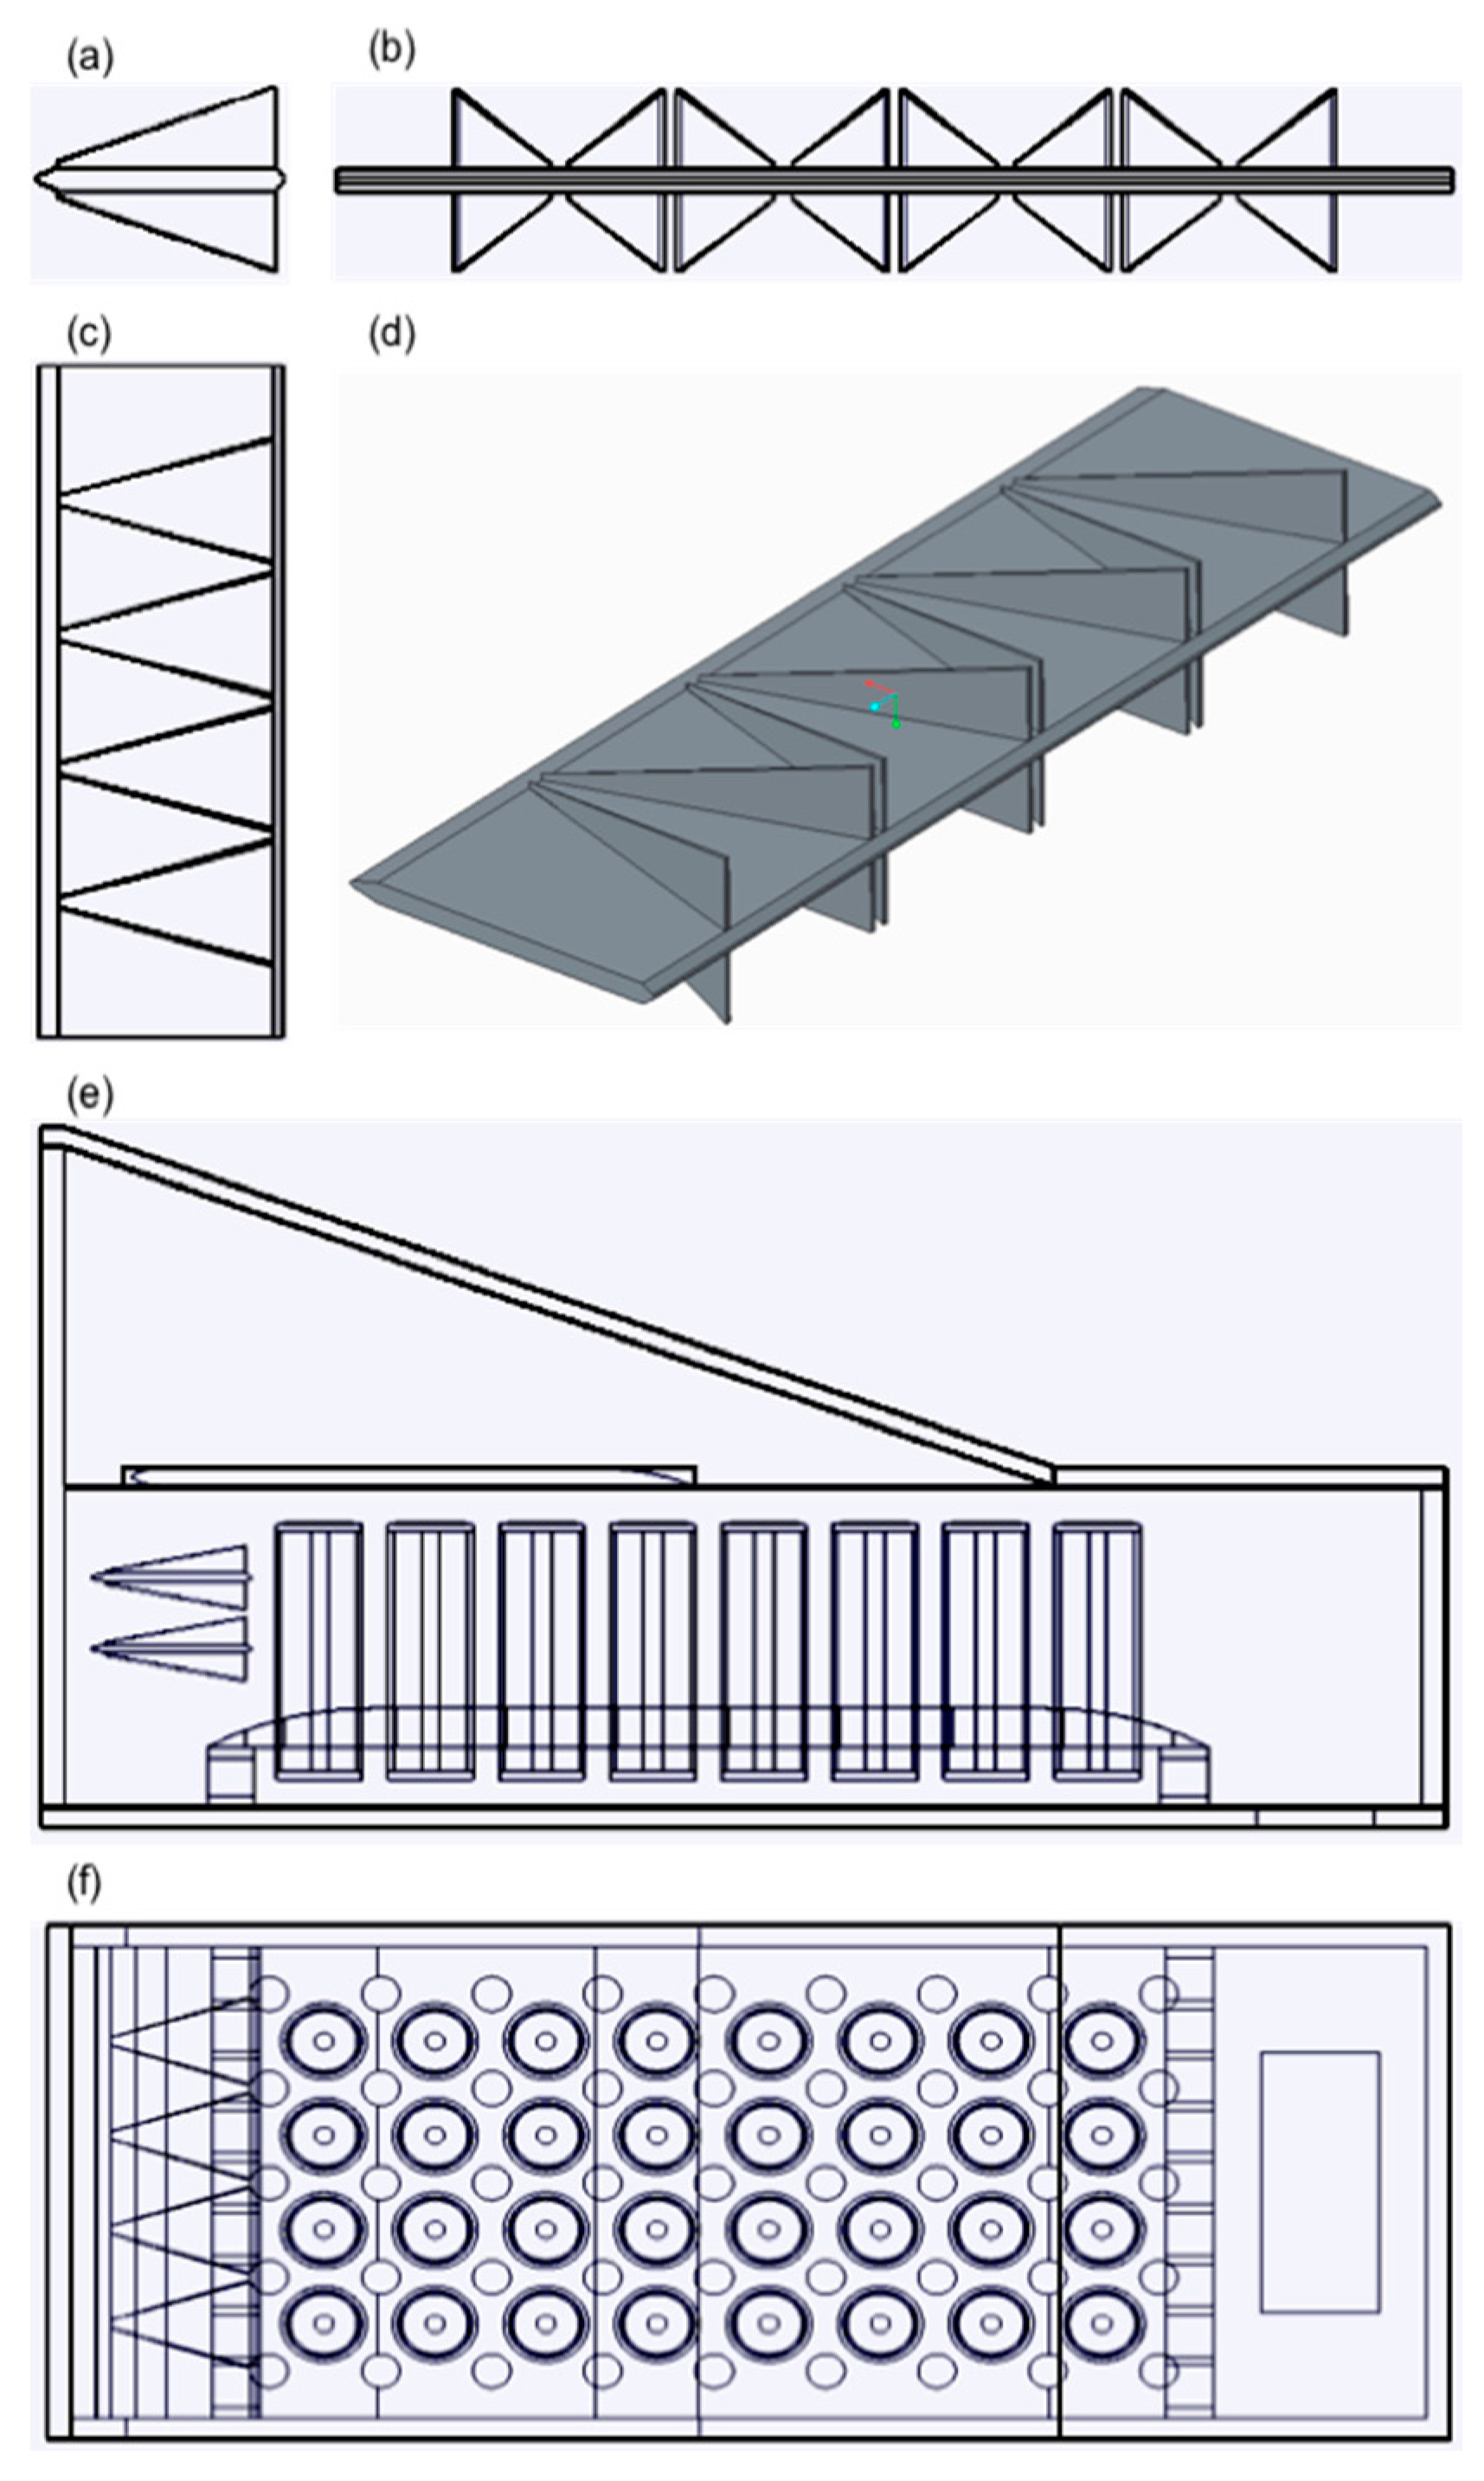
Figure 4.
(a) Top view of the experimental setup and (b) schematic of the experimental setup. NI DAQ, National Instruments cDAQ-9178.
Figure 4.
(a) Top view of the experimental setup and (b) schematic of the experimental setup. NI DAQ, National Instruments cDAQ-9178.
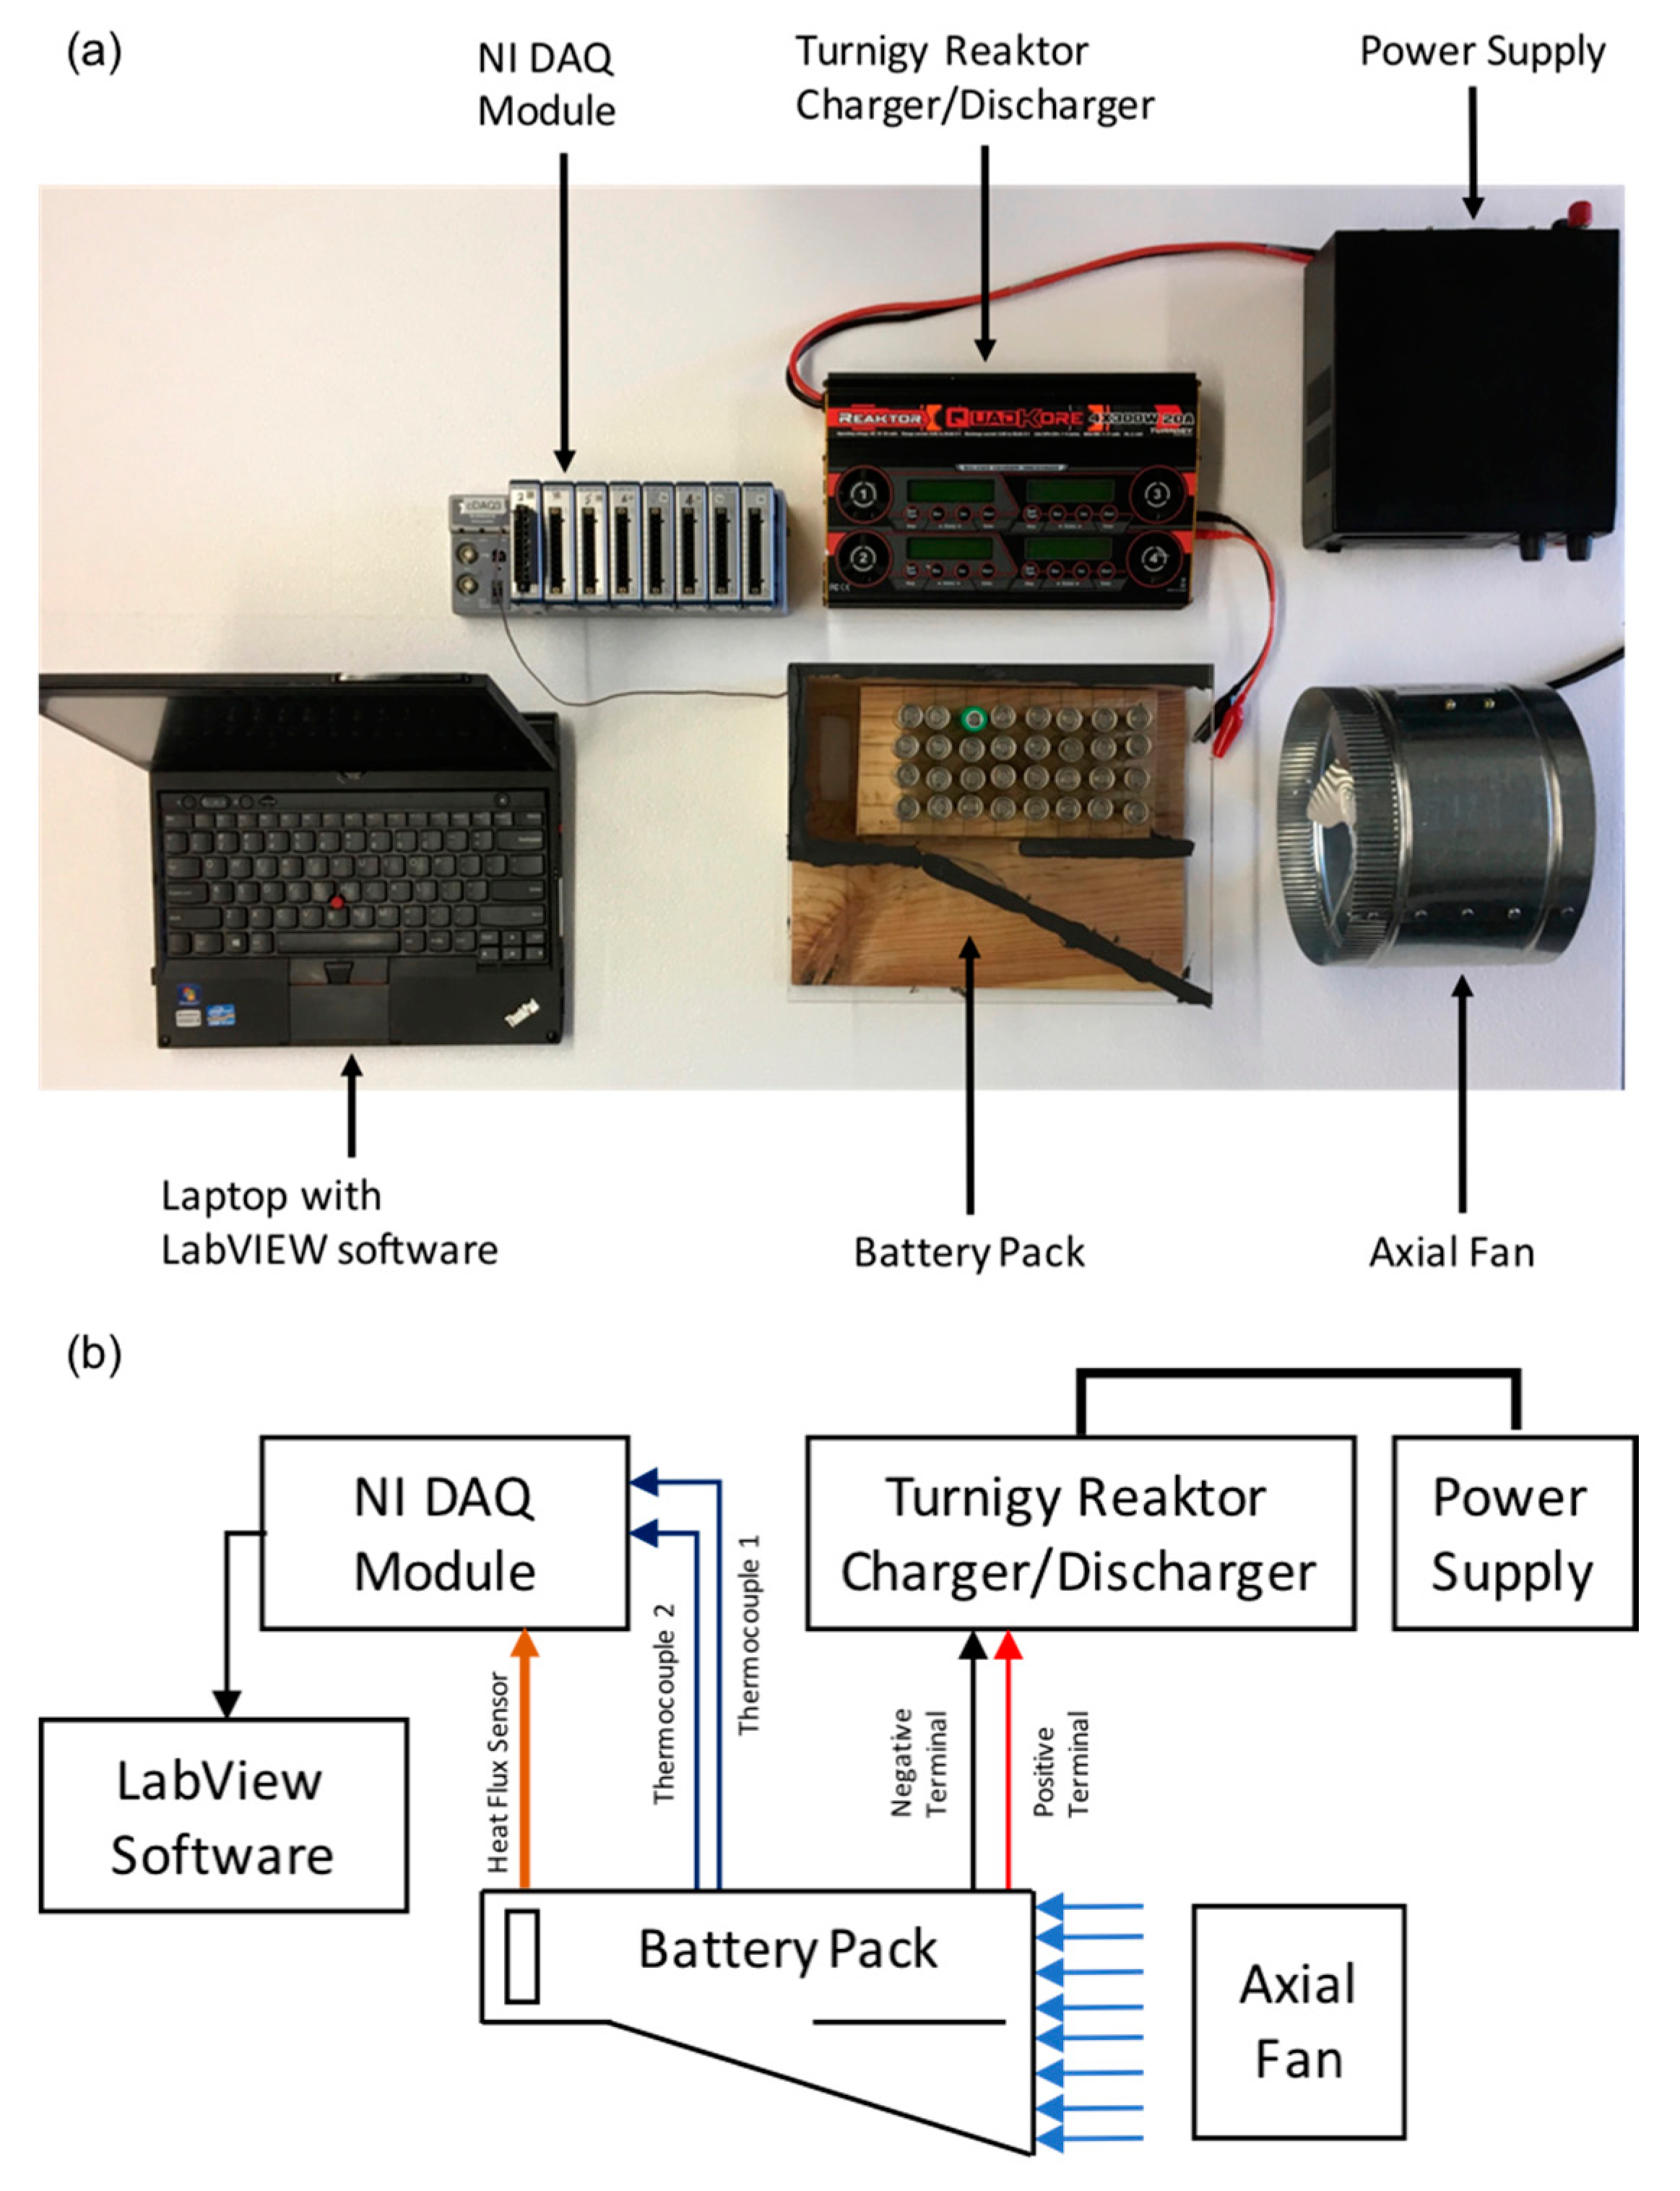
Figure 5.
(a) Thermocouple placement locations at the leeward side of the battery; (b) front view of heat flux sensor placement location; and (c) front view of velocity measurement locations at the inlet.
Figure 5.
(a) Thermocouple placement locations at the leeward side of the battery; (b) front view of heat flux sensor placement location; and (c) front view of velocity measurement locations at the inlet.
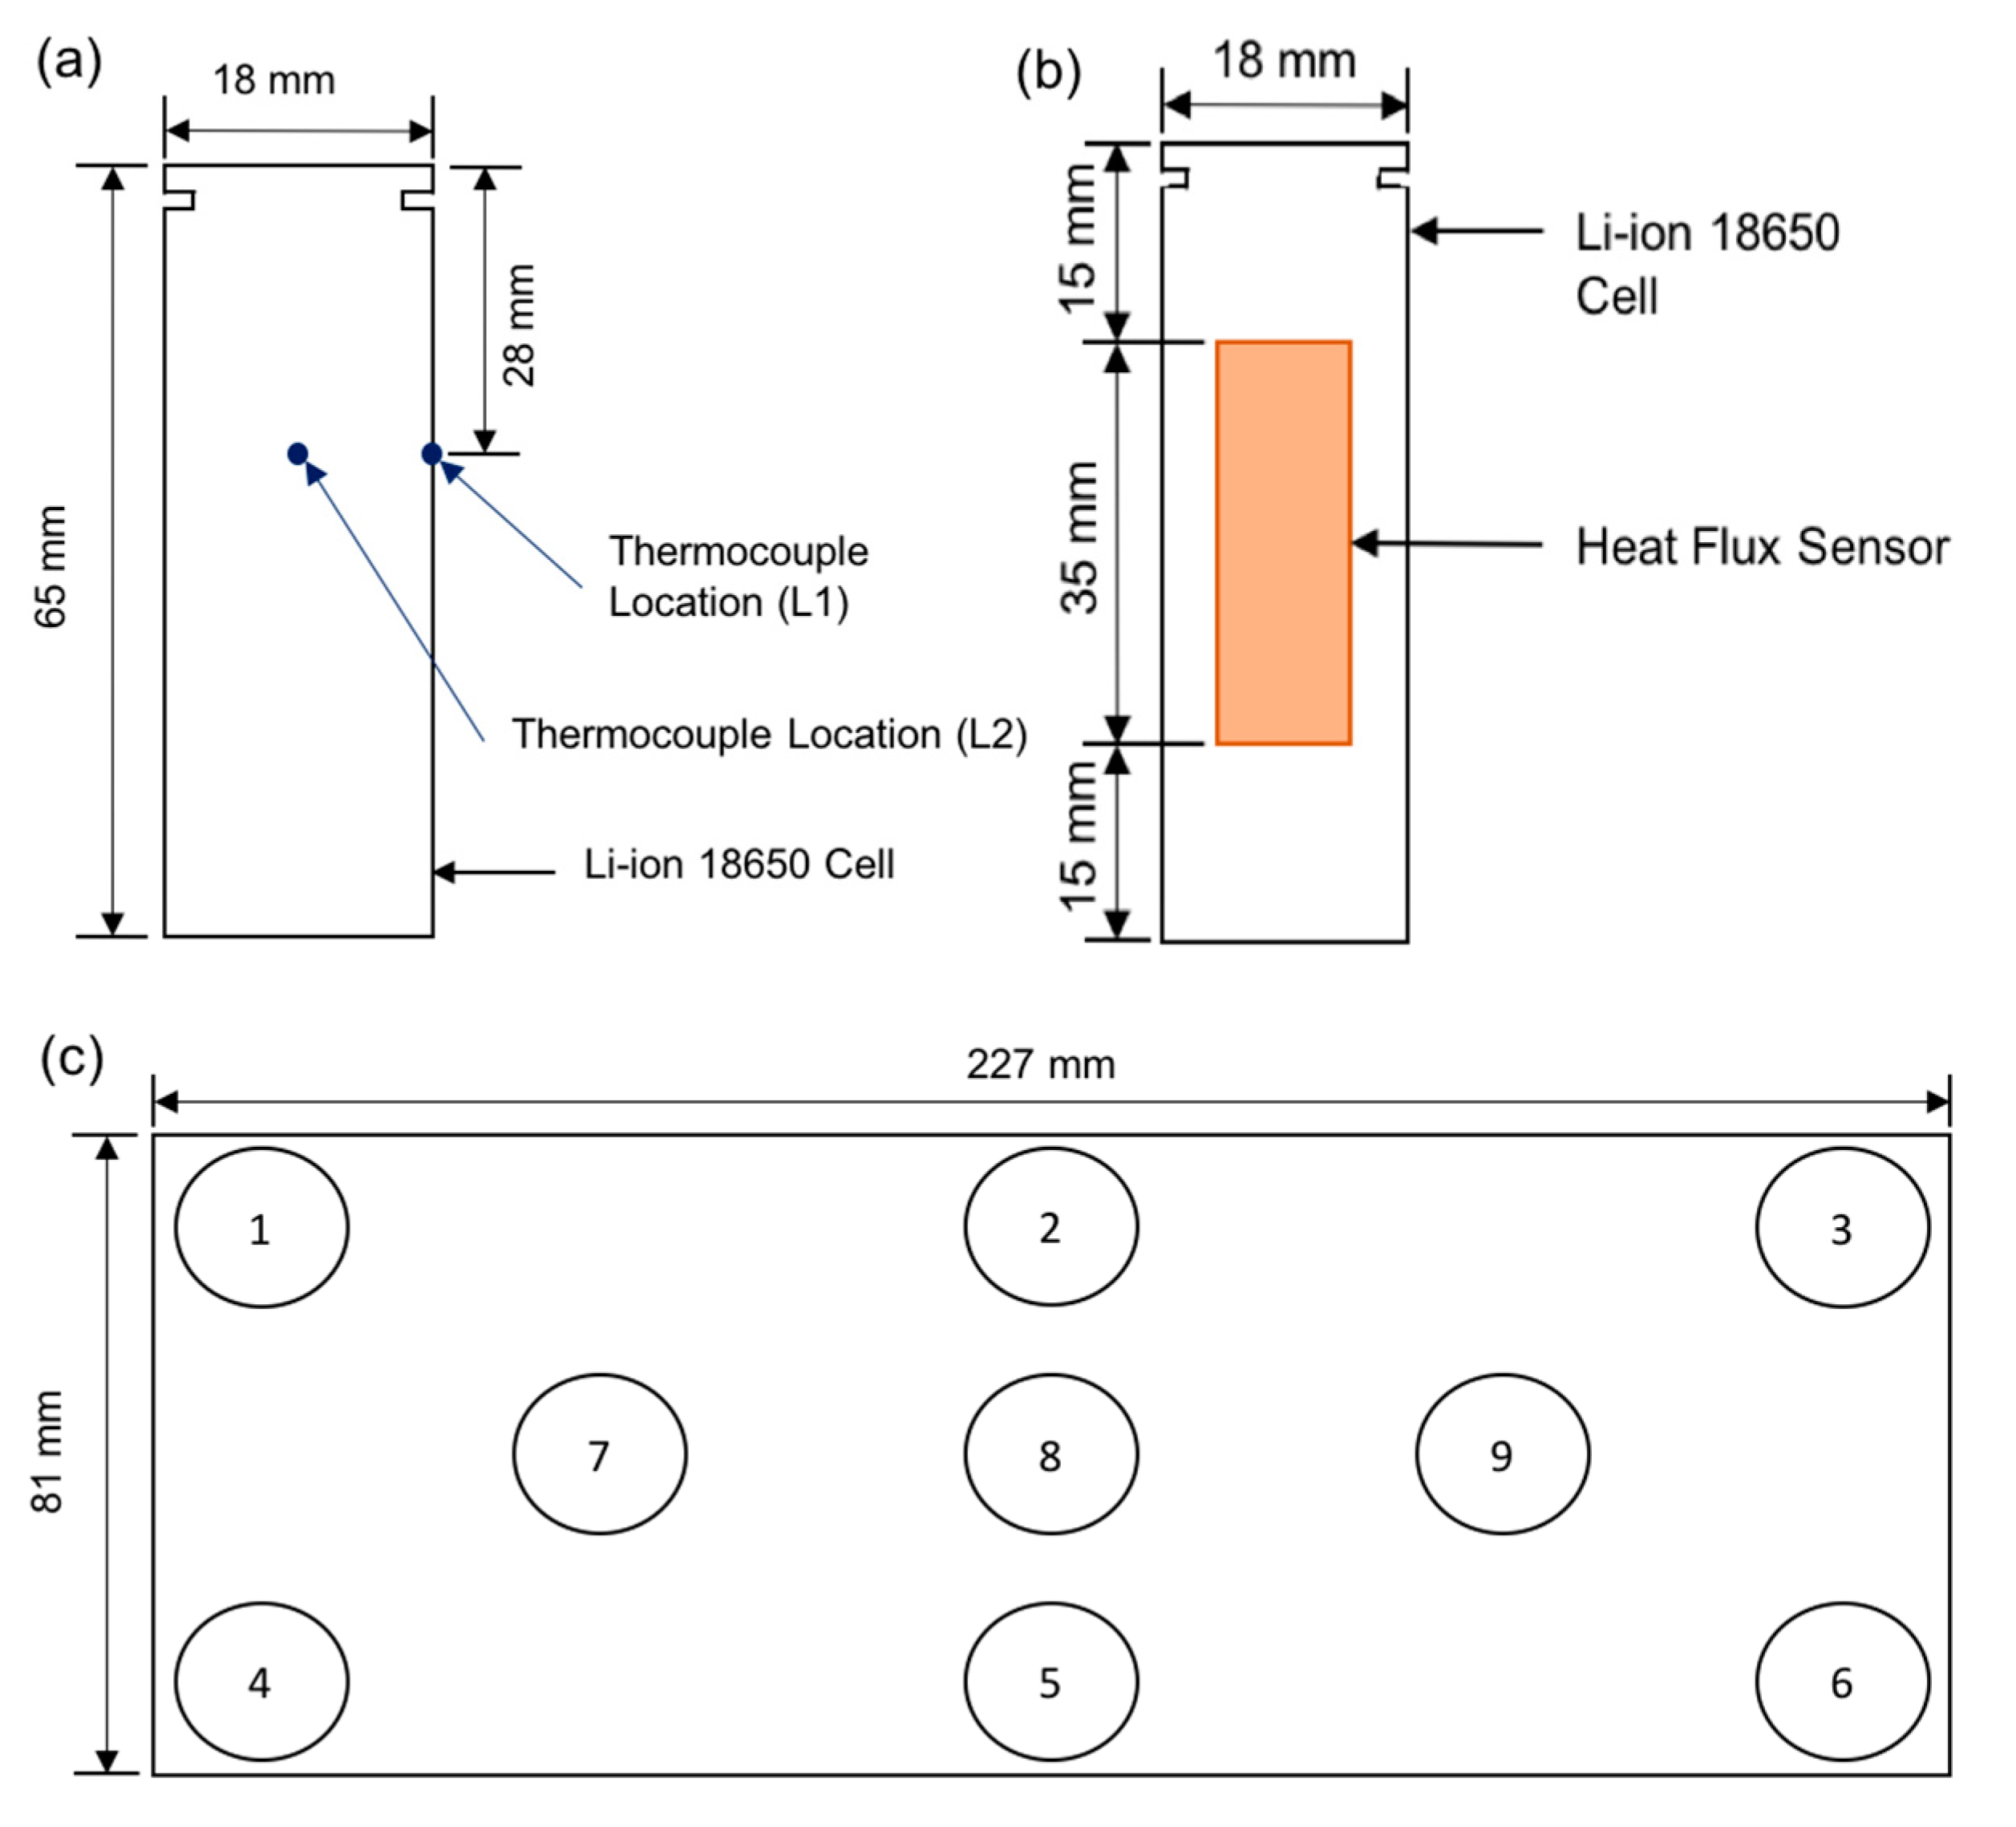
Figure 6.
Heat generation rate and the corresponding temperature increase at 2C discharge rate.
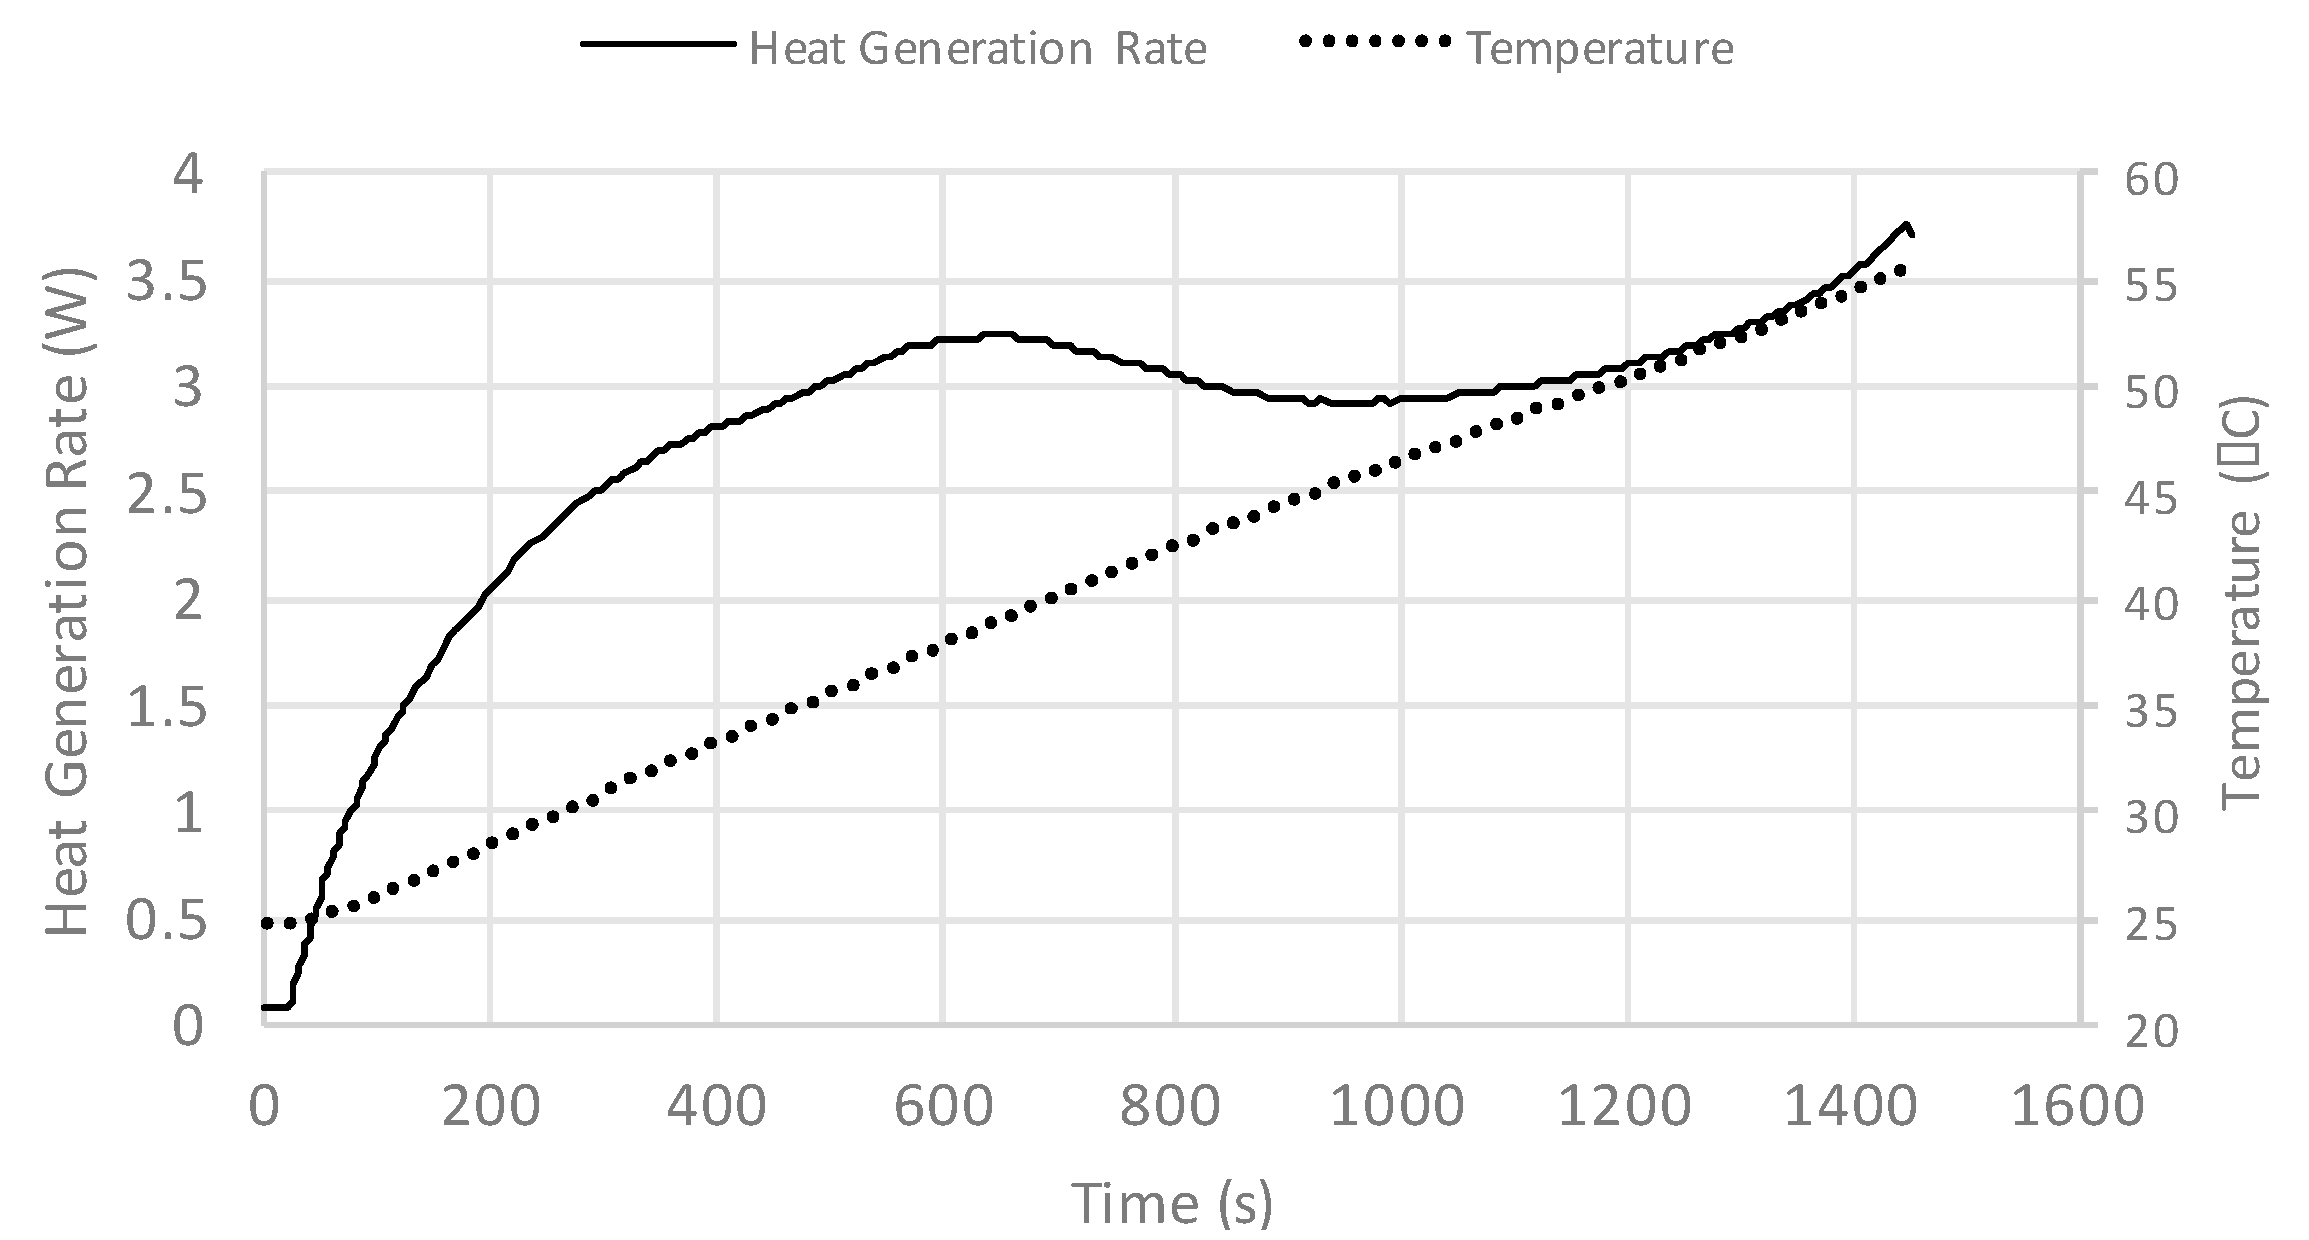
Figure 7.
Model validation: (a) temperatures at location L1 and (b) temperatures at location L2 in Figure 5a.
Figure 7.
Model validation: (a) temperatures at location L1 and (b) temperatures at location L2 in Figure 5a.

Figure 8.
Contours of (a) velocity, (b) turbulence kinetic energy, and (c) temperature in the horizontal plane at 52 mm from the bottom of the battery pack for Case 2.
Figure 8.
Contours of (a) velocity, (b) turbulence kinetic energy, and (c) temperature in the horizontal plane at 52 mm from the bottom of the battery pack for Case 2.
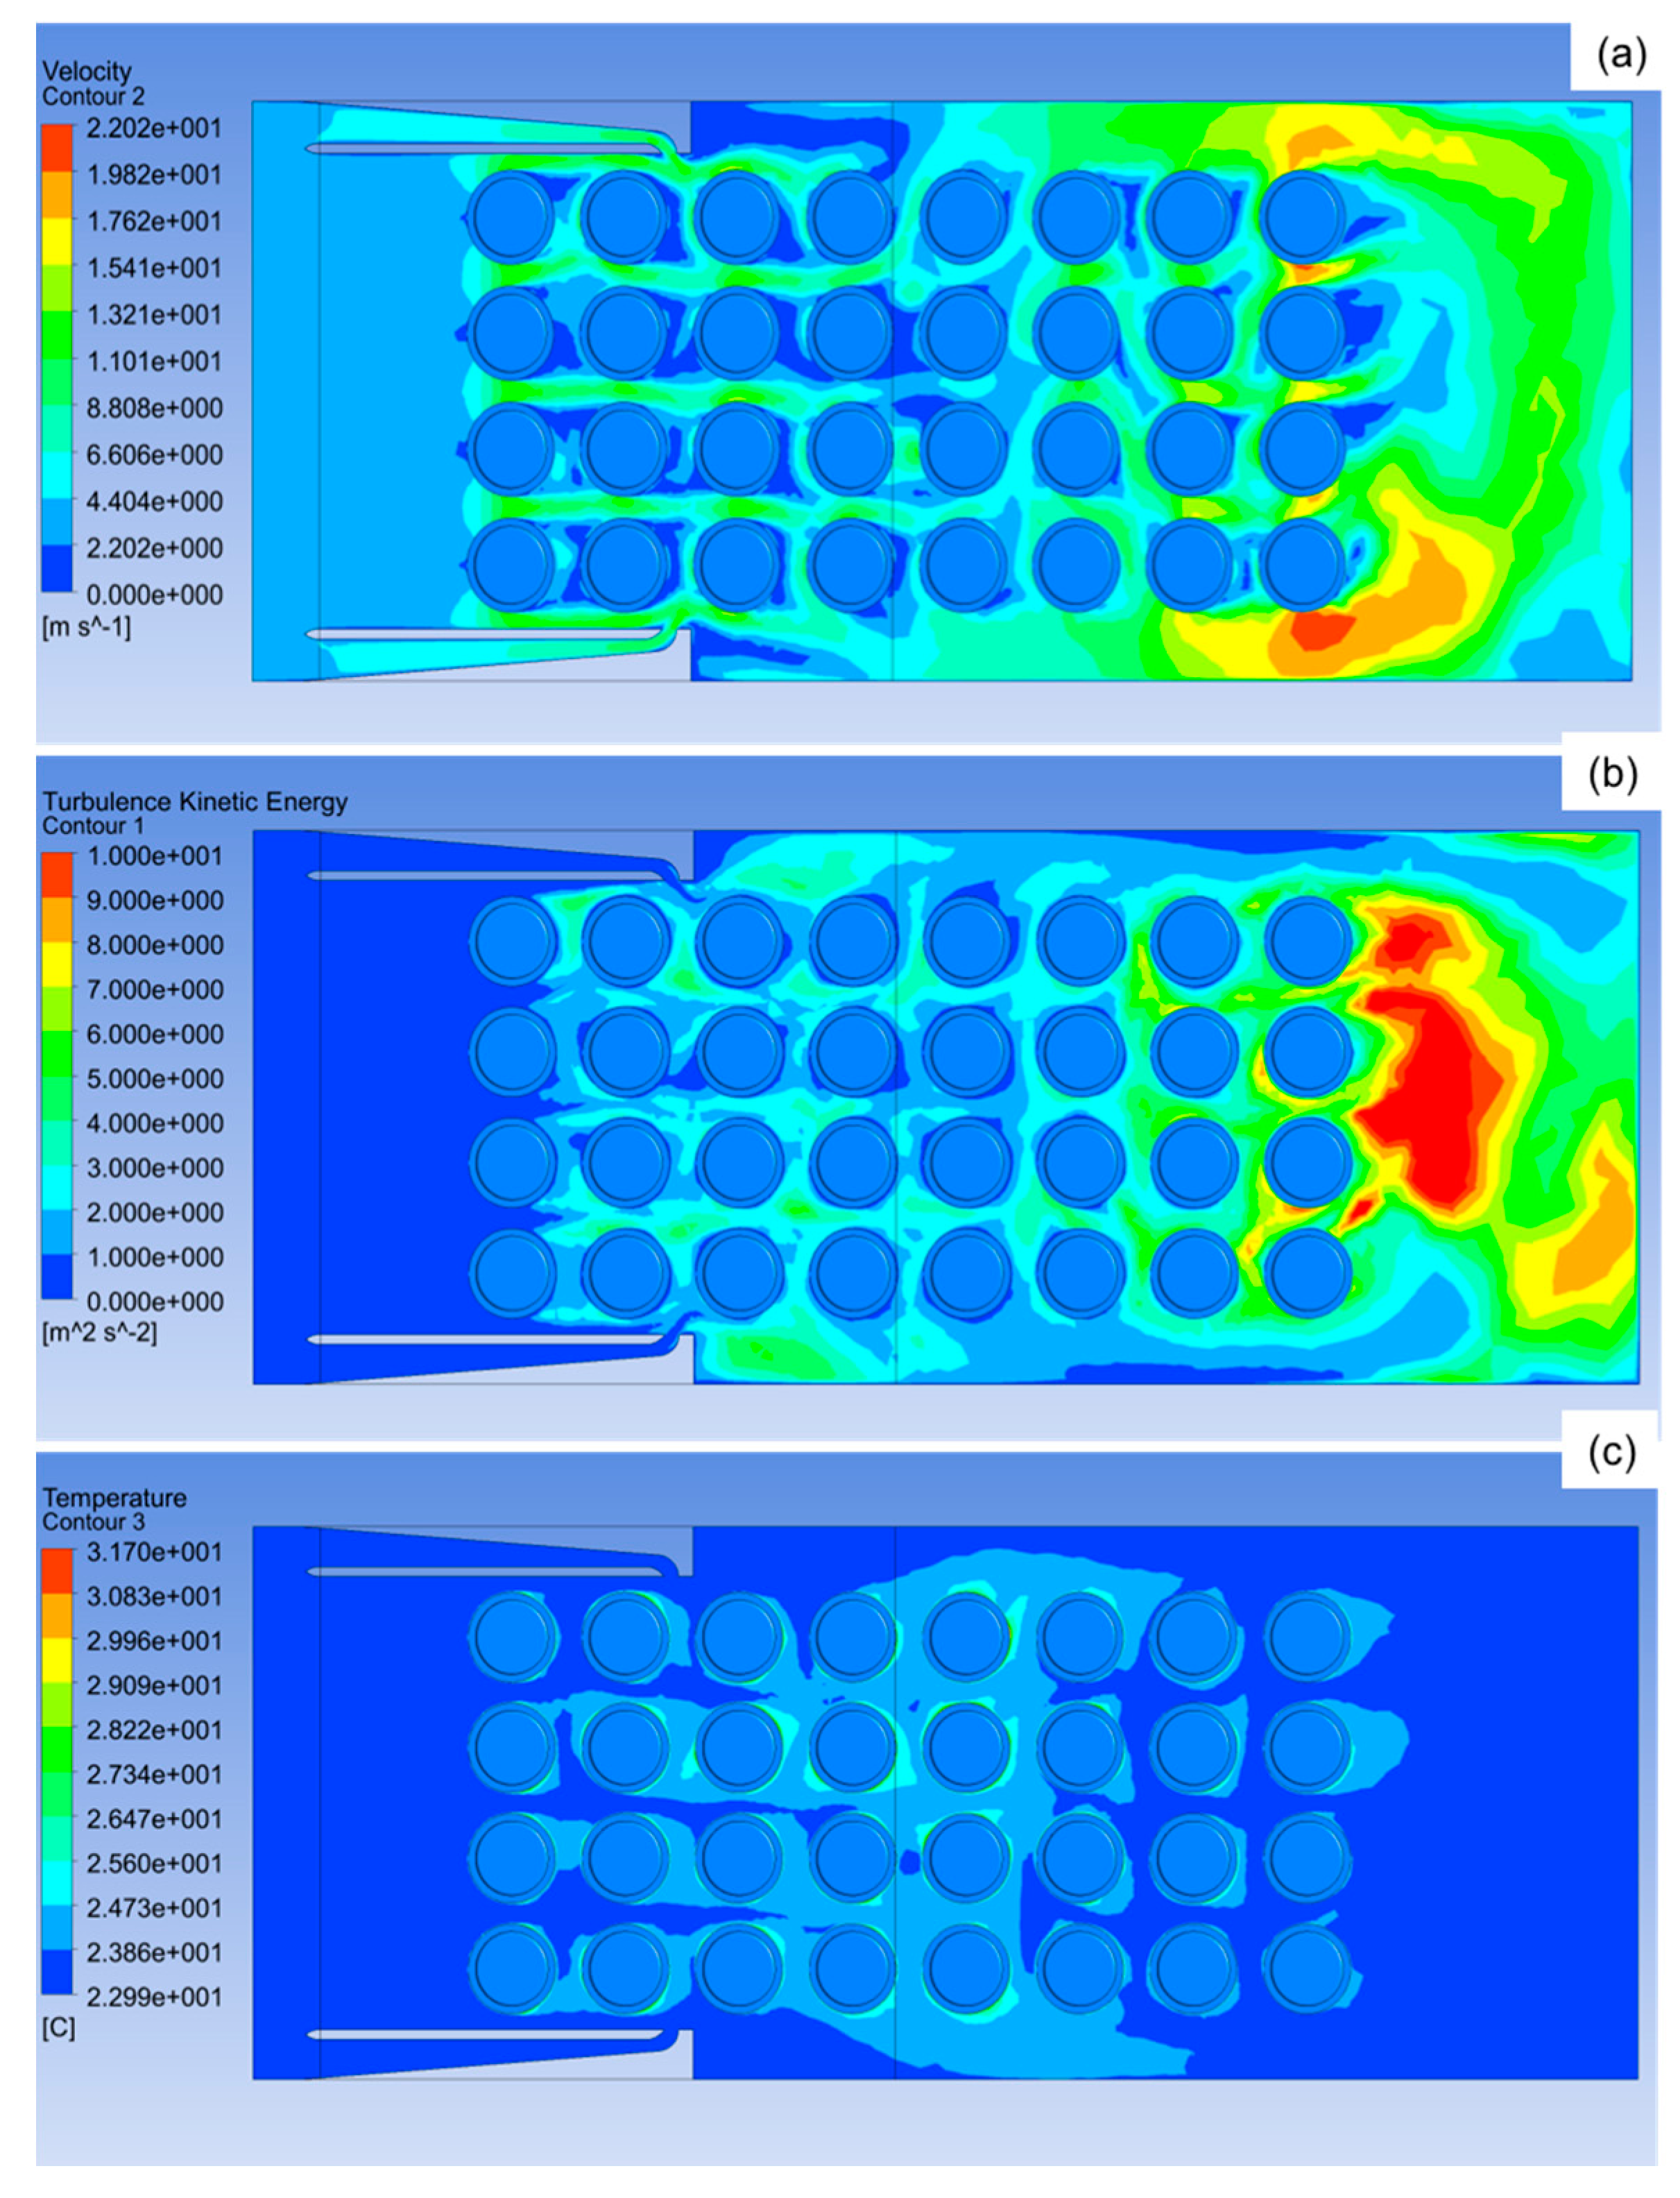
Figure 9.
Contours of (a) velocity; (b) turbulence kinetic energy; and (c) temperature in the horizontal plane at 52 mm from the bottom of the battery pack for Case 3.
Figure 9.
Contours of (a) velocity; (b) turbulence kinetic energy; and (c) temperature in the horizontal plane at 52 mm from the bottom of the battery pack for Case 3.
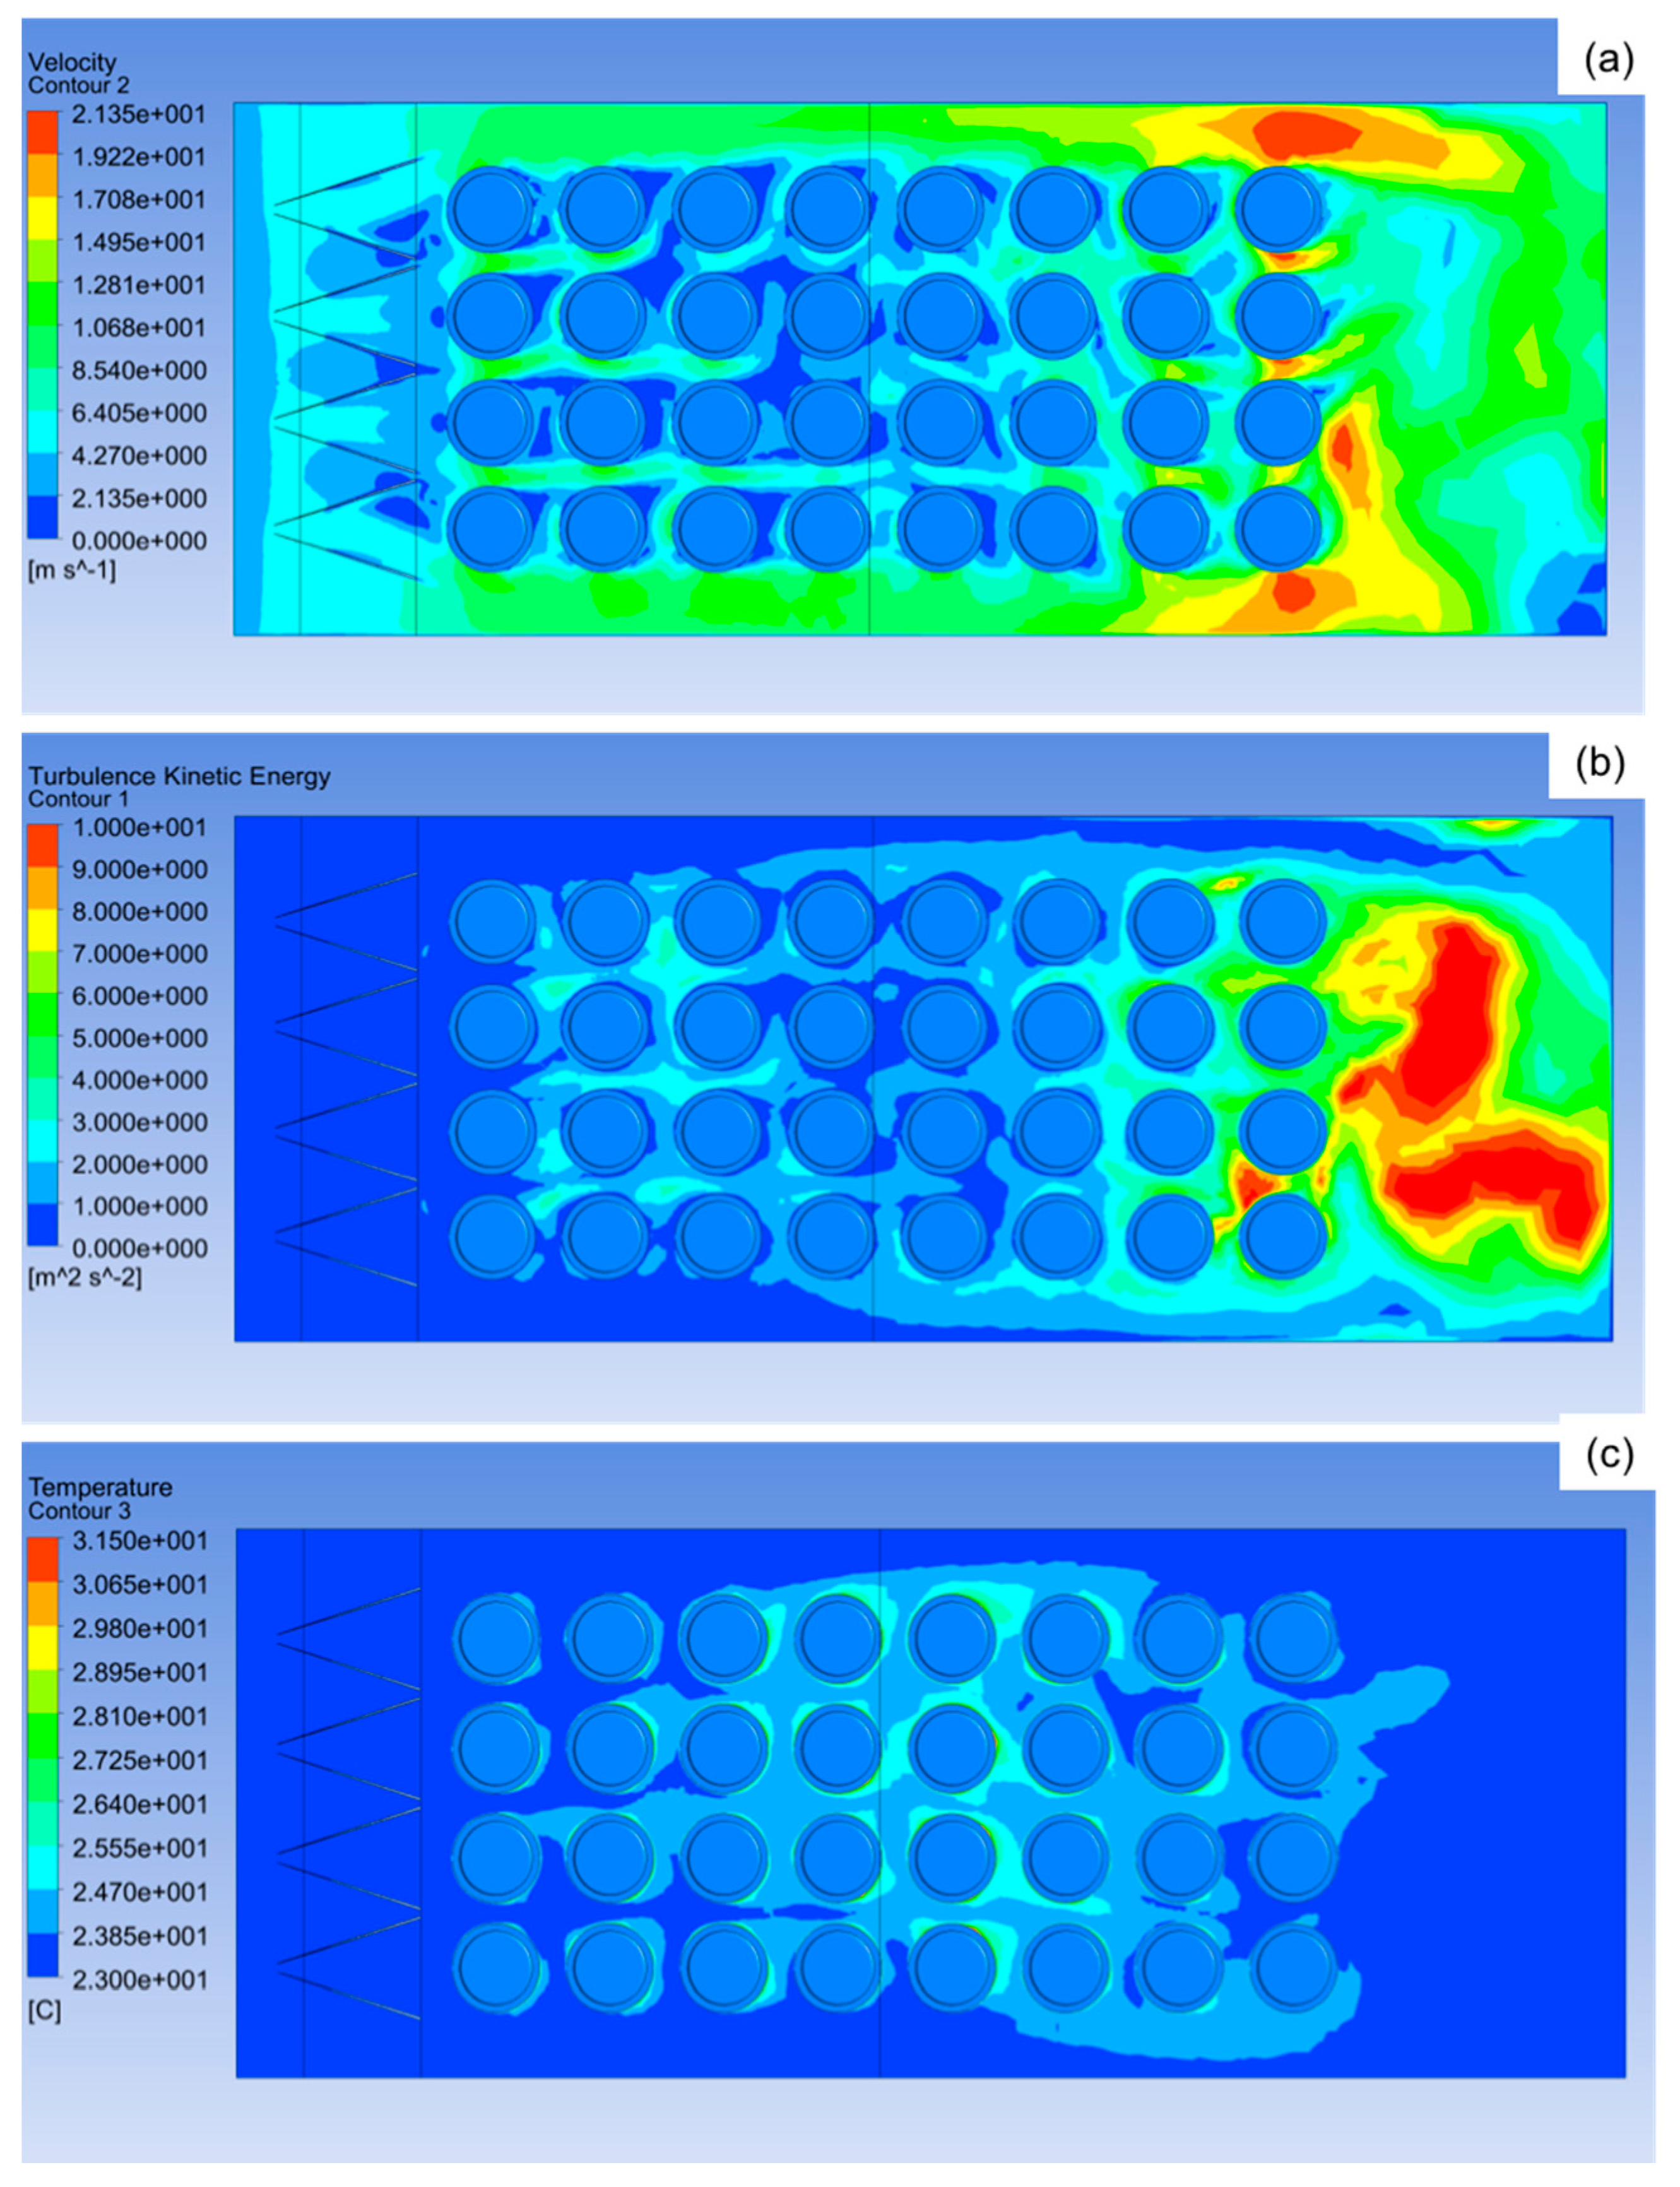
Figure 10.
Contours of (a) velocity, (b) turbulence kinetic energy, and (c) temperature in the horizontal plane at 52 mm from the bottom of the battery pack for Case 4.
Figure 10.
Contours of (a) velocity, (b) turbulence kinetic energy, and (c) temperature in the horizontal plane at 52 mm from the bottom of the battery pack for Case 4.

Figure 11.
Contours of (a) velocity, (b) turbulence kinetic energy, and (c) temperature in the horizontal plane at 52 mm from the bottom of the battery pack for Case 1 (baseline configuration).
Figure 11.
Contours of (a) velocity, (b) turbulence kinetic energy, and (c) temperature in the horizontal plane at 52 mm from the bottom of the battery pack for Case 1 (baseline configuration).


Table 1.
Specifications of the test cell (Samsung INR 18650-25R) [14].
Table 1.
Specifications of the test cell (Samsung INR 18650-25R) [14].
| Item | Specification |
|---|---|
| Nominal discharge capacity (mAh) | 2500 |
| Nominal voltage (V) | 3.6 |
| Standard charge (A) | 1.25 A, (0.125 A cut-off) |
| Maximum continuous discharge (A) | 20 |
| Discharge cut-off voltage (V) | 2.5 |
| Cell weight (g) | 45 |
| Cell height (mm) | 65 |
| Cell diameter (mm) | 18 |
| Cathode material | LiNiMnCoO2 |
| Anode material | Graphite |
Table 2.
Summary of all the battery pack configurations.
| Techniques | Case 1 | Case 2 | Case 3 | Case 4 |
|---|---|---|---|---|
| Inlet Plenum | Yes | Yes | Yes | Yes |
| MVG | No | No | Yes | Yes |
| Jet Inlet 1 Location | Not Applicable | Between second and third Column | Not Applicable | Between second and third Column |
| Jet Inlet 2 Location | Not Applicable | Between second and third Column | Not Applicable | Between fourth and fifth Column |
MVG, multiple vortext generator.
Table 3.
Parameters for the Reynolds number study.
| Reynolds Number | 2430 | 4252 | 7440 | 13,021 | 22,786 | 39,876 |
|---|---|---|---|---|---|---|
| Inlet Velocity (m/s) | 2.0 | 3.5 | 6.0 | 10.6 | 18.5 | 32.4 |
| Mass Flow Rate (g/s) | 44.8 | 78.3 | 137.1 | 239.9 | 419.9 | 734.8 |
Table 4.
Variation of different parameters with increasing Reynolds number.
| Reynolds Number | 2430 | 4252 | 7440 |
|---|---|---|---|
| Maximum Temperature (°C) | 34.4 | 31.6 | 28.1 |
| Temperature Difference (°C) | 9.01 | 7.25 | 4.09 |
| Average Maximum Temperature (°C) | 30.4 | 28.1 | 26.3 |
| Average Temperature Difference (°C) | 3.07 | 2.28 | 1.59 |
| Temperature Difference per Cell (°C) | 7.57 | 4.94 | 3.27 |
Table 5.
Temperature differences between the experimental and numerical results.
| Location | L1 | L2 | ||||
|---|---|---|---|---|---|---|
| Cell Number | 3 | 19 | 31 | 3 | 19 | 31 |
| Temperature Difference (°C) | 0.4 | 0.5 | 3.1 | 2 | 0.8 | 0.5 |
Table 6.
Comparison of Cases 2, 3, and 4 with Case 1 (the baseline configuration).
| Parameters | Case 1 | Case 2 (Percentage Difference) | Case 3 (Percentage Difference) | Case 4 (Percentage Difference) |
|---|---|---|---|---|
| Maximum Temperature (°C) | 31.6 | 31.7 (−0.489%) | 31.5 (0.250%) | 30.0 (4.96%) |
| Temperature Difference (°C) | 7.25 | 7.45 (−2.66%) | 7.29 (−0.448%) | 5.69 (21.5%) |
| Average Maximum Temperature (°C) | 28.1 | 27.9 (0.941%) | 28.1 (−0.0869%) | 27.7 (1.58%) |
| Average Temperature Difference (°C) | 2.28 | 2.35 (−3.13%) | 2.45 (−7.44%) | 2.34 (−2.33%) |
| Temperature Difference per Cell (°C) | 4.94 | 5.76 (−16.7%) | 5.38 (−8.93%) | 4.13 (16.3%) |
© 2017 by the authors. Licensee MDPI, Basel, Switzerland. This article is an open access article distributed under the terms and conditions of the Creative Commons Attribution (CC BY) license (http://creativecommons.org/licenses/by/4.0/).
Share and Cite
MDPI and ACS Style
Shahid, S.; Agelin-Chaab, M. Analysis of Cooling Effectiveness and Temperature Uniformity in a Battery Pack for Cylindrical Batteries. Energies 2017, 10, 1157. https://doi.org/10.3390/en10081157
AMA Style
Shahid S, Agelin-Chaab M. Analysis of Cooling Effectiveness and Temperature Uniformity in a Battery Pack for Cylindrical Batteries. Energies. 2017; 10(8):1157. https://doi.org/10.3390/en10081157
Chicago/Turabian StyleShahid, Seham, and Martin Agelin-Chaab. 2017. "Analysis of Cooling Effectiveness and Temperature Uniformity in a Battery Pack for Cylindrical Batteries" Energies 10, no. 8: 1157. https://doi.org/10.3390/en10081157
Note that from the first issue of 2016, this journal uses article numbers instead of page numbers. See further details here.