Parametric Design of an Ultrahigh-Head Pump-Turbine Runner Based on Multiobjective Optimization


1
Department of Thermal Engineering, State Key Laboratory of Hydro Science and Engineering, Tsinghua University, Beijing 100084, China
2
School of Energy and Power Engineering, Xihua University, Chengdu 610039, China
3
Harbin Institute of Large Electrical Machinery, Harbin 150040, China
*
Author to whom correspondence should be addressed.
Energies 2017, 10(8), 1169; https://doi.org/10.3390/en10081169
Submission received: 19 April 2017
/
Revised: 29 July 2017
/
Accepted: 4 August 2017
/
Published: 8 August 2017
(This article belongs to the Special Issue Advanced Energy Storage Technologies and Their Applications (AESA))
Abstract
:Pumped hydro energy storage (PHES) is currently the only proven large-scale energy storage technology. Frequent changes between pump and turbine operations pose significant challenges in the design of a pump-turbine runner with high efficiency and stability, especially for ultrahigh-head reversible pump-turbine runners. In the present paper, a multiobjective optimization design system is used to develop an ultrahigh-head runner with good overall performance. An optimum configuration was selected from the optimization results. The effects of key design parameters—namely blade loading and blade lean—were then investigated in order to determine their effects on runner efficiency and cavitation characteristics. The paper highlights the guidelines for application of inverse design method to high-head reversible pump-turbine runners. Middle-loaded blade loading distribution on the hub, back-loaded distribution on the shroud, and large positive blade lean angle on the high pressure side are good for the improvement of runner power performance. The cavitation characteristic is mainly influenced by the blade loading distribution near the low pressure side, and large blade lean angles have a negative impact on runner cavitation characteristics.
1. Introduction
Benefits of pumped hydro energy storage (PHES) on electrical system operations are prominent. The flexible generation of PHES can provide upregulation and downregulation in power systems. Furthermore, PHES enable quick start and the provision of spinning and standing reserves. Interest in this technology has been renewed because of the increase in variable renewable energy, such as wind power [1,2]. In recent years, higher head and larger capacity PHES stations have been developed in order to reduce the construction costs [3].
The pump-turbine is a key component in PHES stations. It usually takes only one runner functioning as pump or turbine. Therefore, pump and turbine efficiencies should be guaranteed for the runners during water pumping and electricity generation. Furthermore, the cavitation performance and operation stability have to be improved for both operating conditions. It is difficult to develop a pump-turbine runner with high overall performance because the targets affect each other and sometimes conflict in its two operations [4,5].
The pump-turbine runners are usually designed from pump mode, and then verified with turbine mode [1,5], given that the requirements for pump operation are difficult to meet, and the relatively good performance can be maintained when pumps operate as turbines [6,7]. The runners are more like centrifugal pump impellers in shape, rather than Francis turbine runners. Furthermore, pump-turbine runners with higher working heads possess more prolonged flow channels. Low efficiency and bad cavitation characteristics are the main challenges in the development of ultrahigh-head pump turbines, especially the runners.
Computational fluid dynamics (CFD) has been widely used in the development of the pump-turbine runner [8,9]. The profile of the runner can be modified by changing the design parameters on the basis of internal flow analysis [10,11]. However, this CFD flow analysis cannot directly propose a blade configuration with favorable flow pattern. Moreover, the direct CFD-based modification technique is considerably time consuming and requires intensive experience. With the development of design theory and computer technology, three-dimensional (3D) inverse design methods have been increasing in popularity for turbomachinery in the past 30 years [12,13,14]. In the so-called inverse design methods, the geometry of the blades is unknown and it can be directly calculated according to the design specifications. The main advantage of the inverse design methods is the closer relationship between the design parameters and the hydrodynamic flow field. However, no direct relationship can be given between geometric parameters and runner performances. Accordingly, trial and error in flow analyses and model tests is still necessary.
More systematic approaches, such as optimization techniques, have been applied in the design of turbomachinery [9,15]. Optimal design associated to turbomachinery is a multiobjective and difficult problem by its nature. Gradient-based optimization methods have been successfully applied in the foil design [16,17]. It is known that gradient techniques are efficient in terms of convergence rate, but do not guarantee production of the global optimum. On the other hand, multiobjective evolutionary algorithms (MOEAs) have gained increasing popularity over the past two or three decades [18,19,20]. These population-based methods mimic the evolution of species and the survival of the fittest, and comparted to the gradient-based optimization techniques, they offer advantages, such as good approximations to optimal sets of solutions, generating multiple trade-off solutions in a single iteration [18,21]. Recently, a multiobjective optimization design strategy has been used to develop pump-turbine runners [22,23]. The strategy has been built by combining 3D design method, CFD analysis, design of experiment (DoE), response surface methodology (RSM), and multiobjective genetic algorithm (MOGA). A middle-high-head turbine runner with high efficiency and stability has been designed by using this strategy [23]. Because of its simplicity, its ease of use and its suitability to be coupled with specialized numerical tools, for instance CFD techniques, the strategy can be widely used in the development of fluid machines.
In this study, a parametric design study of an ultra-head pump-turbine runner is carried out based on multiobjective optimization. First, the multiobjective optimization design system was introduced and an ultrahigh-head pump-turbine runner was designed. The runner with high overall performance was obtained. Then, the impact of blade loading and stacking conditions on the runner performance was assessed, where the runners are optimally described using the inverse design method and their performance was estimated with CFD analyses. The main aim is to offer a guideline for the design ultrahigh-head pump-turbine runners by means of comparisons and analyses of design parameters on the runners’ performances.
2. Optimization Design System
Figure 1 shows the flow chart of the design strategy used in this study. The design approach was based on the coupling of the parameterization of the blade shape with a 3D inverse design method to produce the blade geometry, DoE to reduce the number of calculation times, CFD analysis to estimate the objective functions, RSM to correlate the design parameters with the objectives, and MOGA to search the Pareto front for the trade-off design [22,23].
2.1. 3D Inverse Design
The 3D design software TURBODesign 5.2 was used to parametrically describe the runner shape [12,15]. The flow through the runner is considered as water at normal temperature. When TURBODesign 5.2 is used for design, the flow is simplified to steady and inviscid, and the blades are represented by sheets of vorticity. Strength of the vorticity is determined by a circumferentially averaged velocity torque , defined as
It is referred to as the “blade loading”, here is the blade number.
For the incompressible potential flow, blade pressure distribution can be expressed as follows [12,15].
where subscripts + and – represent either side of the blades, is the water density, is the relative velocity on the blade surface, and is in the direction of streamlines in the meridional plane.
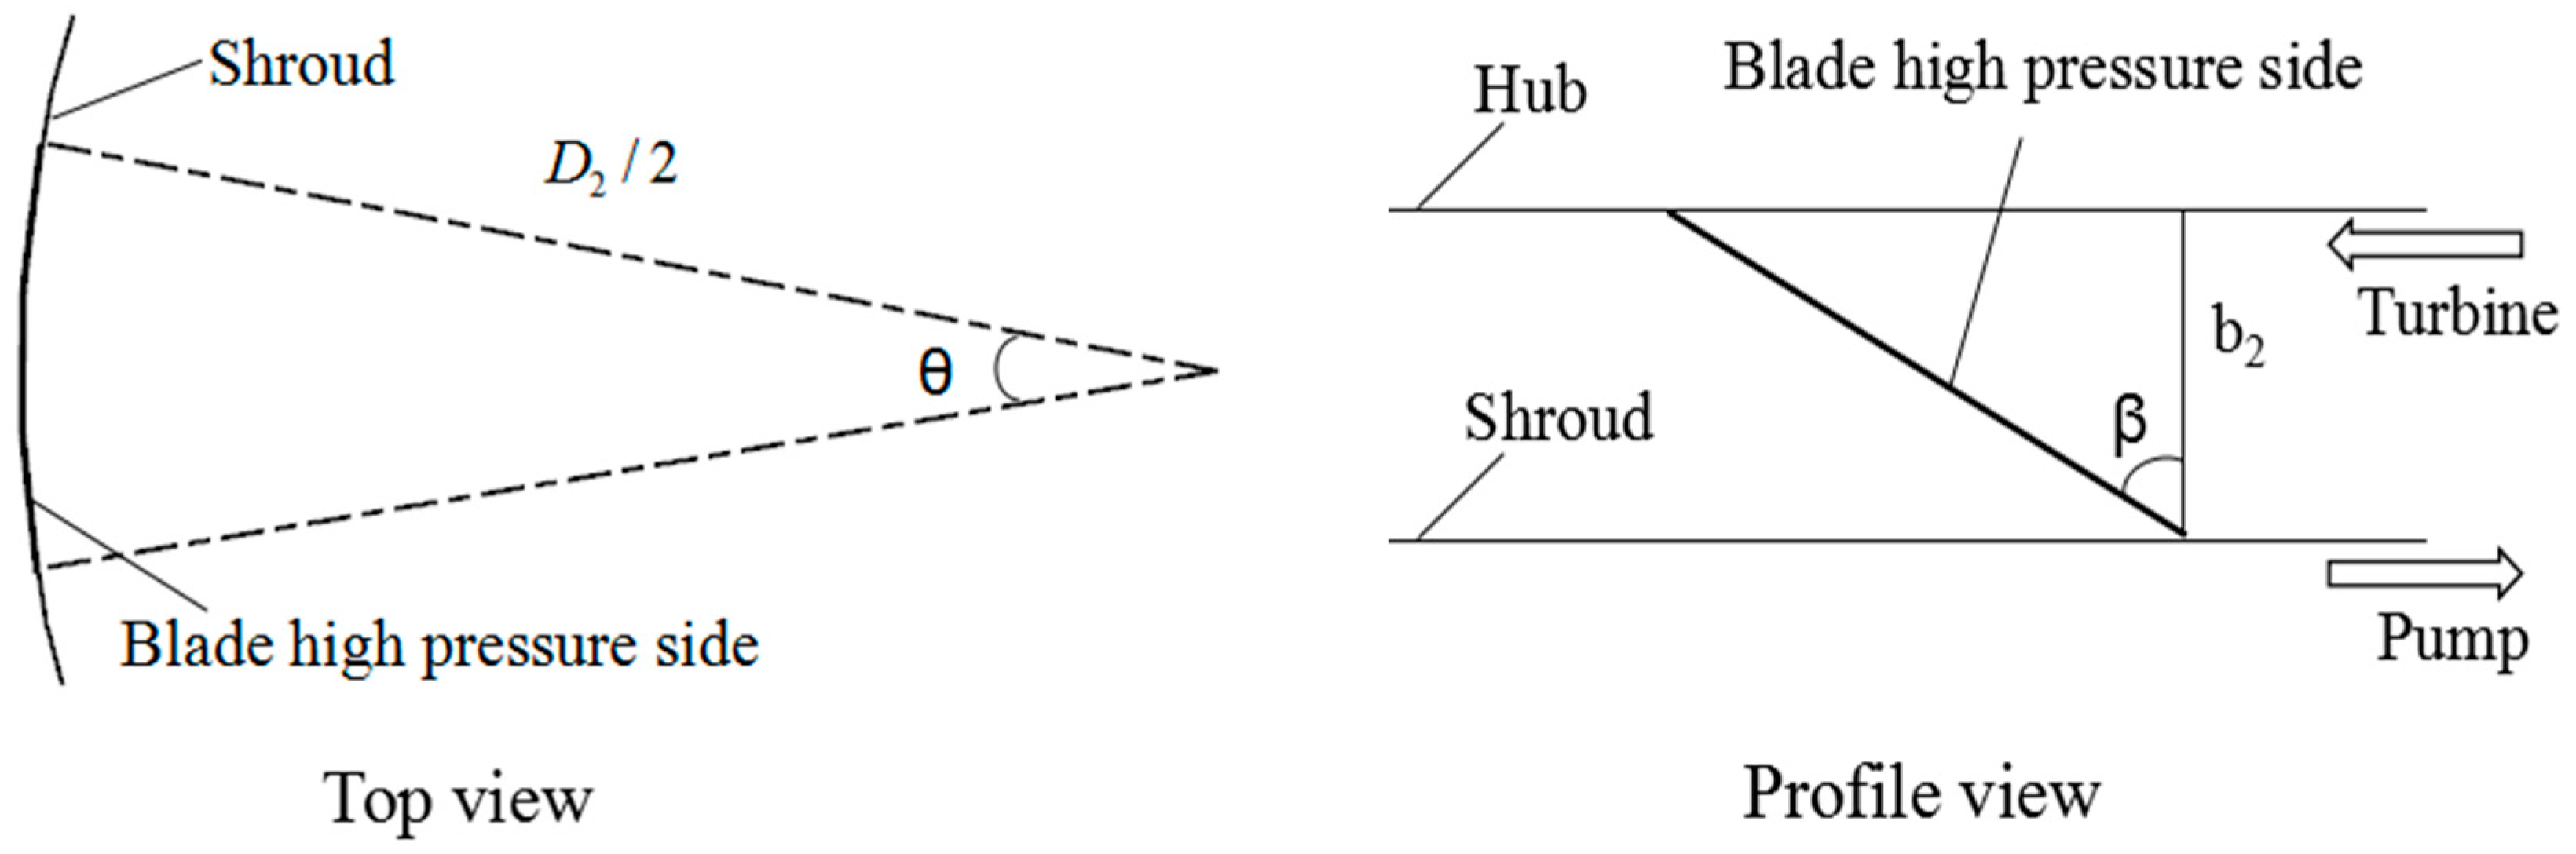
Equation (2) shows the direct relationship of with the difference between pressure on the upper and lower surfaces of the blade. The other important input specification is the stacking condition. This condition specifies the blade lean at the high pressure side (HPS) of the pump-turbine runner blades as shown in Figure 2, which affects the wrap angle of the blades [12,15,24].
2.2. CFD Analyses
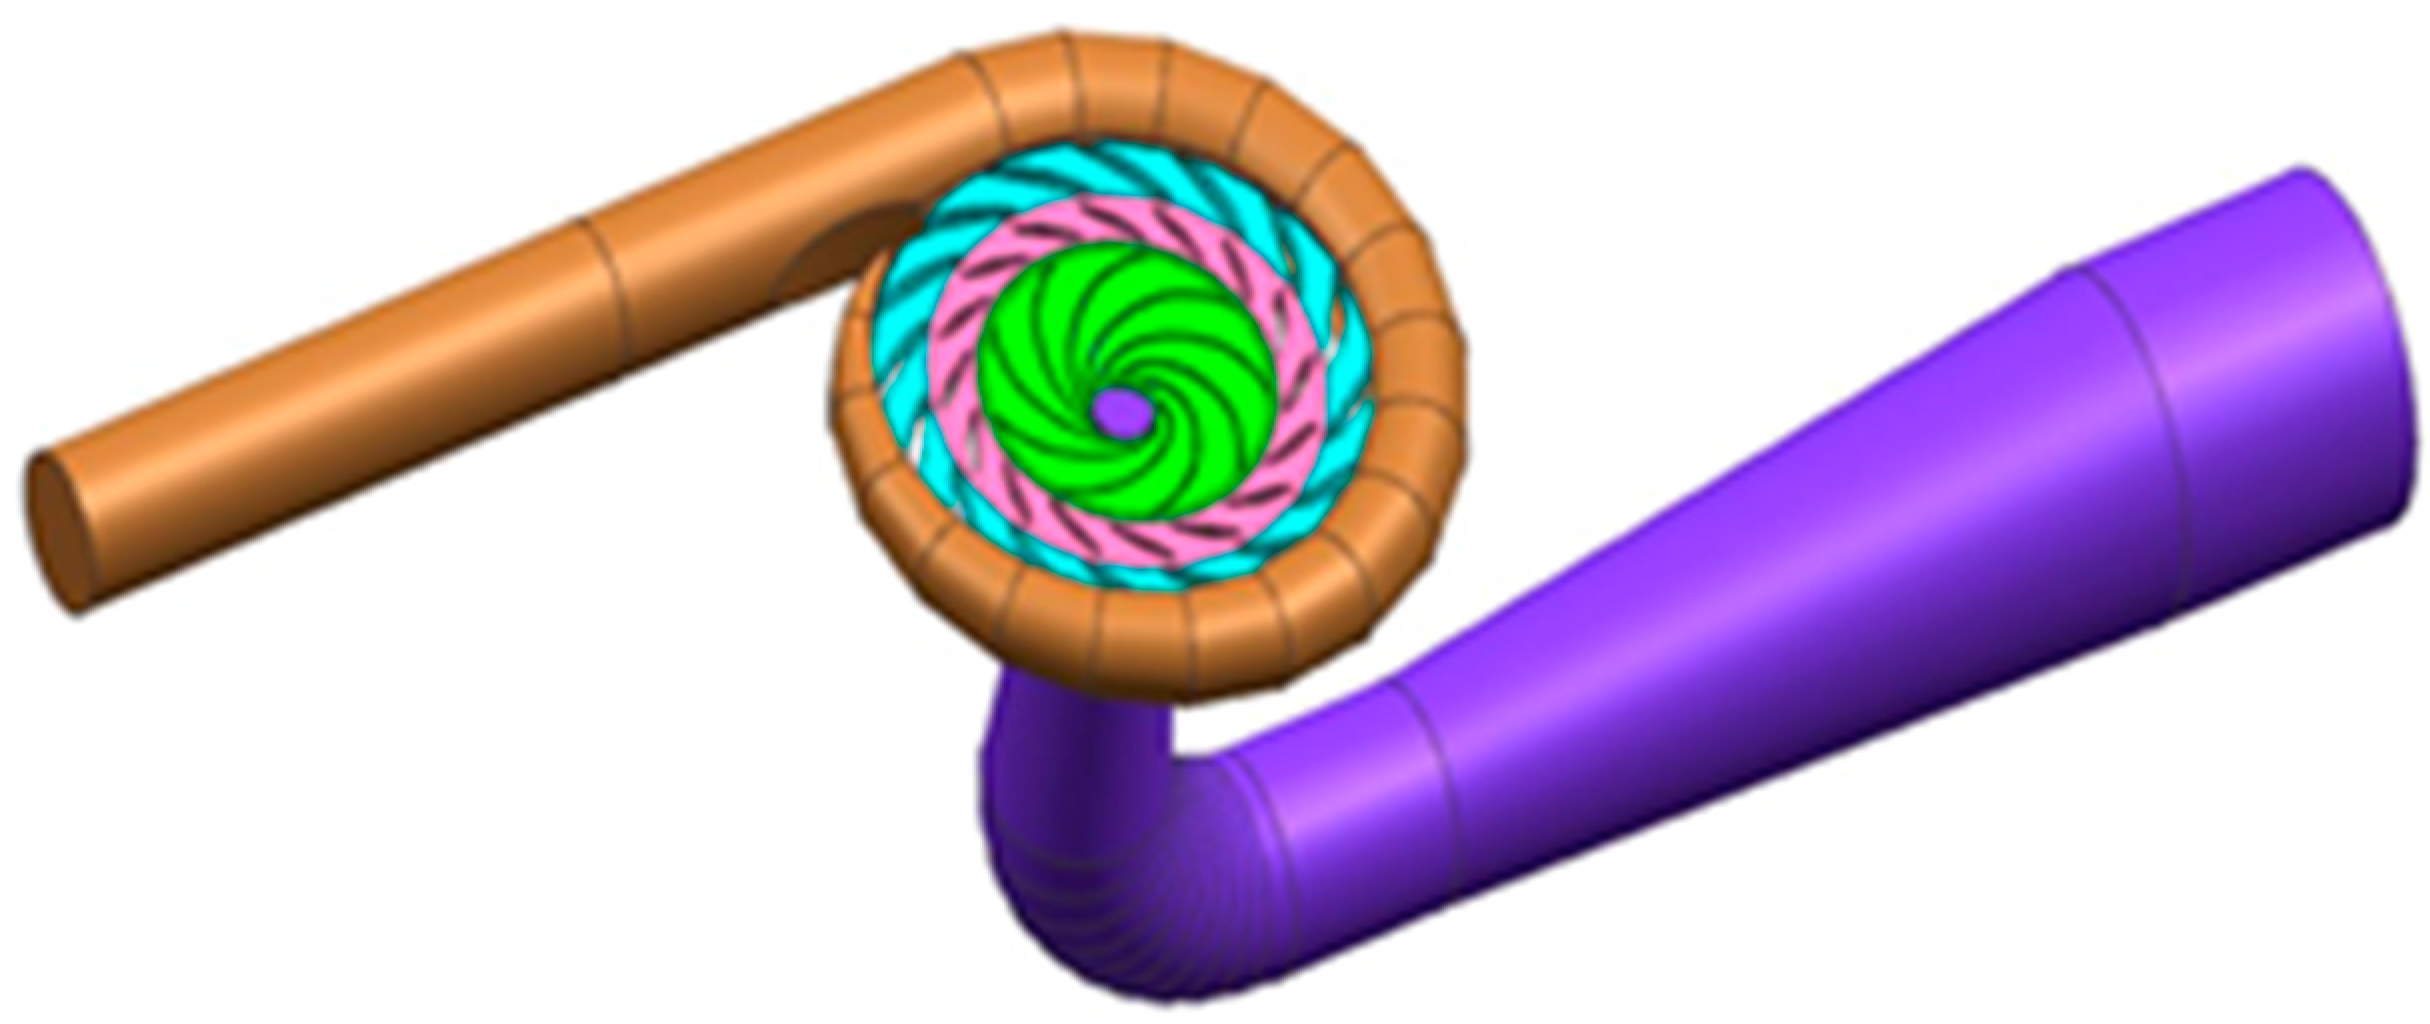
The widely used commercial code ANSYS CFX 15.0 was used to conduct the CFD analyses. CFD analyses were conducted for two purposes: one was the estimation of objective functions and the other was validation and analyses of optimization results. The accuracy of the objective functions is important for the optimization process. Thus, as shown in Figure 3, 3D, turbulent, and steady flow simulations were performed for the full passage pump-turbine using the Reynolds-Averaged Navier–Stokes (RANS) equations [22,23]. For steady flow simulations, the RANS equations can be expressed as
where is the velocity, is the pressure, is the density, and is the kinematic viscosity, respectively. The Reynolds stresses are modeled according to the turbulent viscosity hypothesis as , here is the turbulent kinematic energy, and is the Dirac Delta function. The turbulence model is an important factor for CFD. For turbomachinery, performance parameters like efficiency and cavitation can be predicted with reasonable accuracy by solving the RANS equations with advanced turbulence models, such as standard , and renormalization group (RNG) [10,22,23,25]. In this study, RNG turbulence model was used for the closure of the RANS equations with the standard wall function method since it is economical and robust for predicting steady calculation with acceptable accuracy [25].
The computational domain includes spiral casing, stay vanes, guide vanes, runner, and draft tube as shown in Figure 3. The frozen rotor model was used at interfaces between the stationary and rotating components. No-slip wall conditions were set for stationary and rotating parts. Inlet and outlet boundaries were set as follows: static pressure zero was set at the inlet and the flow discharge (, listed in Table 1) was set at the outlet under pump mode; the flow discharge (, listed in Table 2) was set at the inlet and the static pressure was set at the outlet under turbine mode. Stochastic fluctuations of the velocities with a 5.0% free stream turbulent intensity were adopted as the mass flow rate was specified. ANSYS ICEM and TurboGrid were used for mesh generation. Hexahedral meshes were mainly used except in the volute tongue with tetrahedral meshes because of its complicated structure.
2.3. Optimization Strategy
The RSM model was used to describe the approximate relationships between the optimization targets and input design parameters. The second-order polynomial function was used in this study.
where is the target, and are input parameters, β0, βi, βii, and βik can be determined by following the principle of least square regression with the help of a set of sample points in the design space.
The distribution of sample points in design space has significant influence on the accuracy of RSM model. The Latin hypercube sampling method was used in DoE, wherein the sample points are equiprobable, random, and orthogonally distributed in the design space. As the quadratic approximation model Equation (5) is used, the least number S of sample points should be
where N is the number of input variables selected.
When the RSM between the optimization targets and inputs was generated, the multiobjective optimization was then implemented with modified non-dominated sorted genetic algorithm (NSGA-II). In NSGA-II, the fast non-dominated sorting and crowding technique is adopted. NSGA-II is suitable for the optimization design of the pump-turbine runners with a reduction in computation complexity and an improvement in elitist strategy.
All the utilized software was integrated into the iSIGHT platform as shown in Figure 1. The optimization design process began with the selection of input parameters. After the variation ranges on the input parameters were determined, different combinations of the input parameters were used to generate a number of runner configurations with TURBODesign5.2. Then, runner performances were estimated under different operating conditions by using ANSYS CFX 15.0 and the RSM model between the optimization targets was generated. The CFD calculations were time consuming. Finally, NSGA-II was implemented on the RSM model and the optimal solutions were determined. It was unnecessary to regenerate the runners and estimate their performance in this optimization process. The optimal solutions could be obtained in a short time.
3. Design of the Ultrahigh-Head Pump Turbine Runner
3.1. Design Specifications
The specific design parameters were based on Yangjiang PHES station located in the Guangdong Province of China [26]. In turbine mode, the rated head was , and the maximum and minimum net head were and , respectively. In pump mode, the maximum and minimum heads were and , respectively. The rated capacity of the reversible synchronous motor was and its rotational speed was .
In order to conduct the model tests on a standard test rig [27], scaled pump-turbine runners were designed. The design parameters are shown in Table 1, where , , and are the design head, design flow discharge, and rotational speed of the model runners, respectively. The number of the blades is B = 9. Figure 4 shows the meridional shape of the blades, which were derived on the basis of the centrifugal pump and one-dimensional flow calculation. The main geometrical parameters of the runner are high-pressure side (HPS) diameter , HPS width , low-pressure side (LPS) shroud diameter , and LPS hub diameter . The value of these main parameters is given in Table 2.
3.2. Optimization Settings
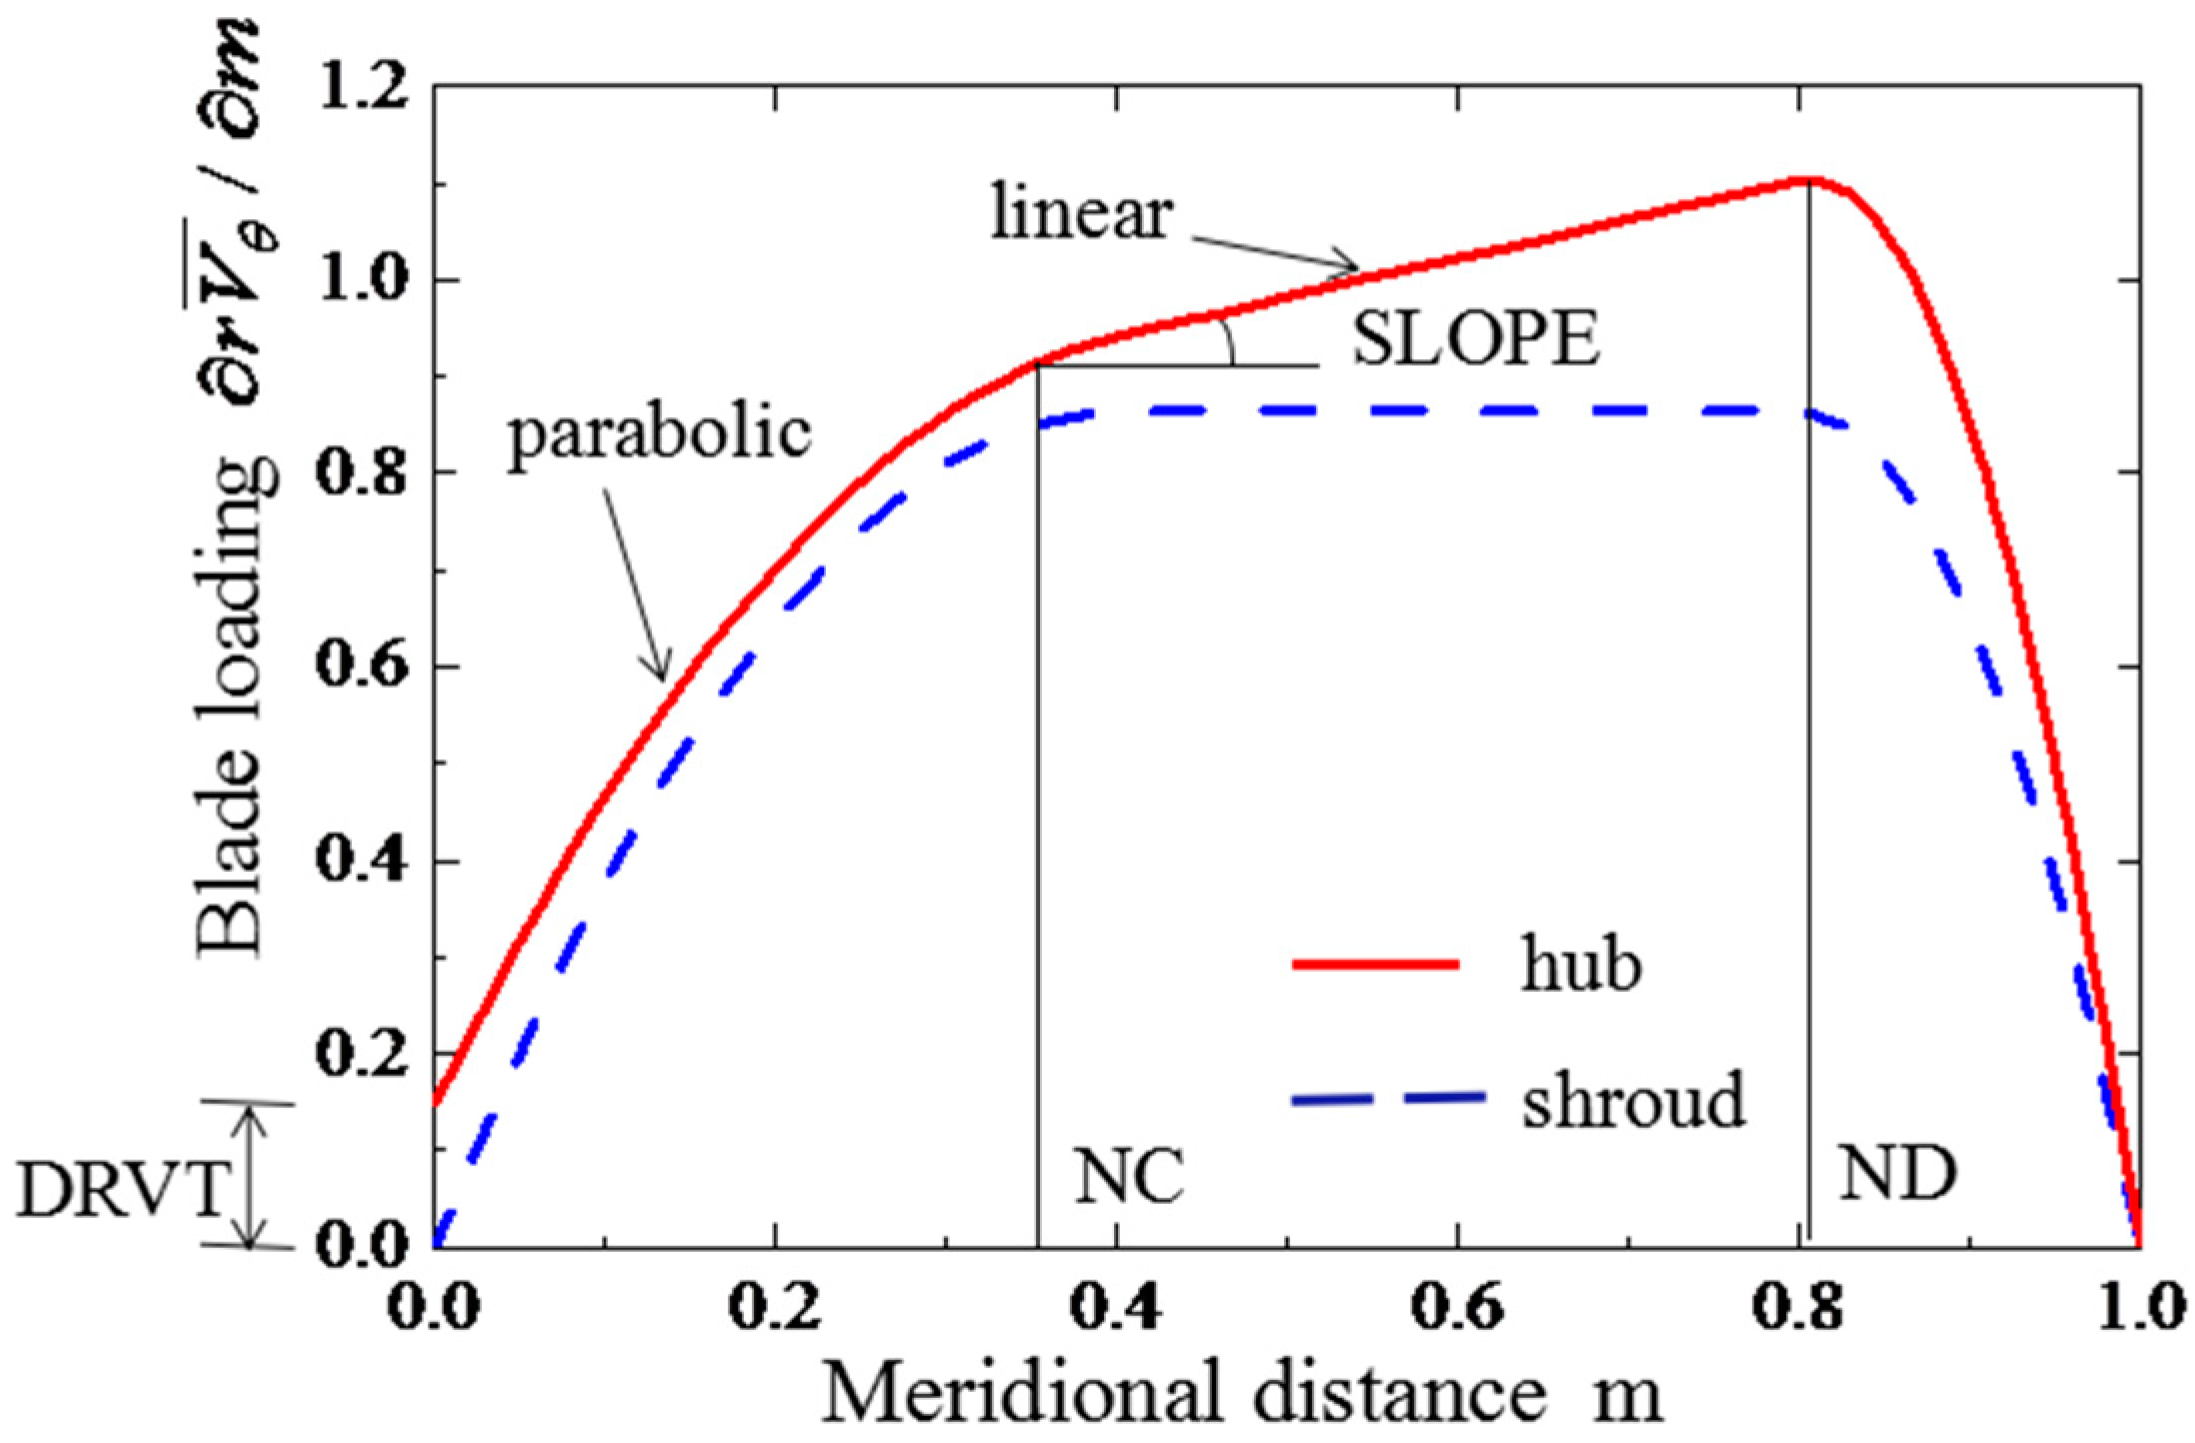
As the description in Section 2.1, blade loading and blade stacking are the most important parameters in determining the blade shape [12,15,24]. Blade loading distributions are usually given along the hub and shroud streamlines. The blade loading between the hub and shroud is determined by using linear interpolation. As shown in Figure 5, along each streamline, three-segment distribution was adopted. Four parameters—namely, connection point locations NC and ND, slope of the linear line SLOPE, and loading at the low pressure edge DVRT—were used to control the distribution curve.
Blade stacking specifies the blade lean angle θ at the HPS of the blade as shown in Figure 2. The rake angle β in Figure 2 is given as
The stacking condition was imposed linearly along the HPS of the blade in this study.
As shown in Figure 5, a total of eight variables are necessary for the control of the blade loading distribution. When the blade loading and blade lean angle are identified as optimization parameters, there are nine variables. The sensitivity on the runners’ shape and the range of these variables are tested by the trial designs of the runners [22,23]. In this study, extensive trial designs were made by using the design software TURBODesign 5.2 to check whether blades with a reasonable shape could be obtained. With these trial designs, three variables were fixed at , , and , and the variation range of the other input variables were determined as shown in Table 3.
The optimization targets were set as the runner efficiencies and at the pump design point and turbine rated point. In pump-turbines, the cavitation performance in pump mode is usually worse than that in turbine mode. During the design, as the cavitation requirement is satisfied in pump mode, it can be satisfied in turbine mode. Therefore, the lowest pressure on the blade at the pump design point was also set as an optimization target. The optimization was made to maximize the runner efficiencies, and , and to increase pressure . Considering these three objective functions were likely conflicting, MOGA was employed to find a number of trade-off solutions.
The efficiencies and are defined in Equations (8) and (9), respectively.
where and are the discharge and head given in Table 1, is the angular velocity. Momentum acting on the runner was calculated through CFD analyses introduced in Section 2.2.
In order to generate the quadratic RSM model as shown by Equation (5), 40 different runner geometries were provided by using TURBODesign 5.2. Therefore, 80 CFD calculations were conducted. The parameters setting for NSGA-II is shown in Table 4.
3.3. Optimization Results
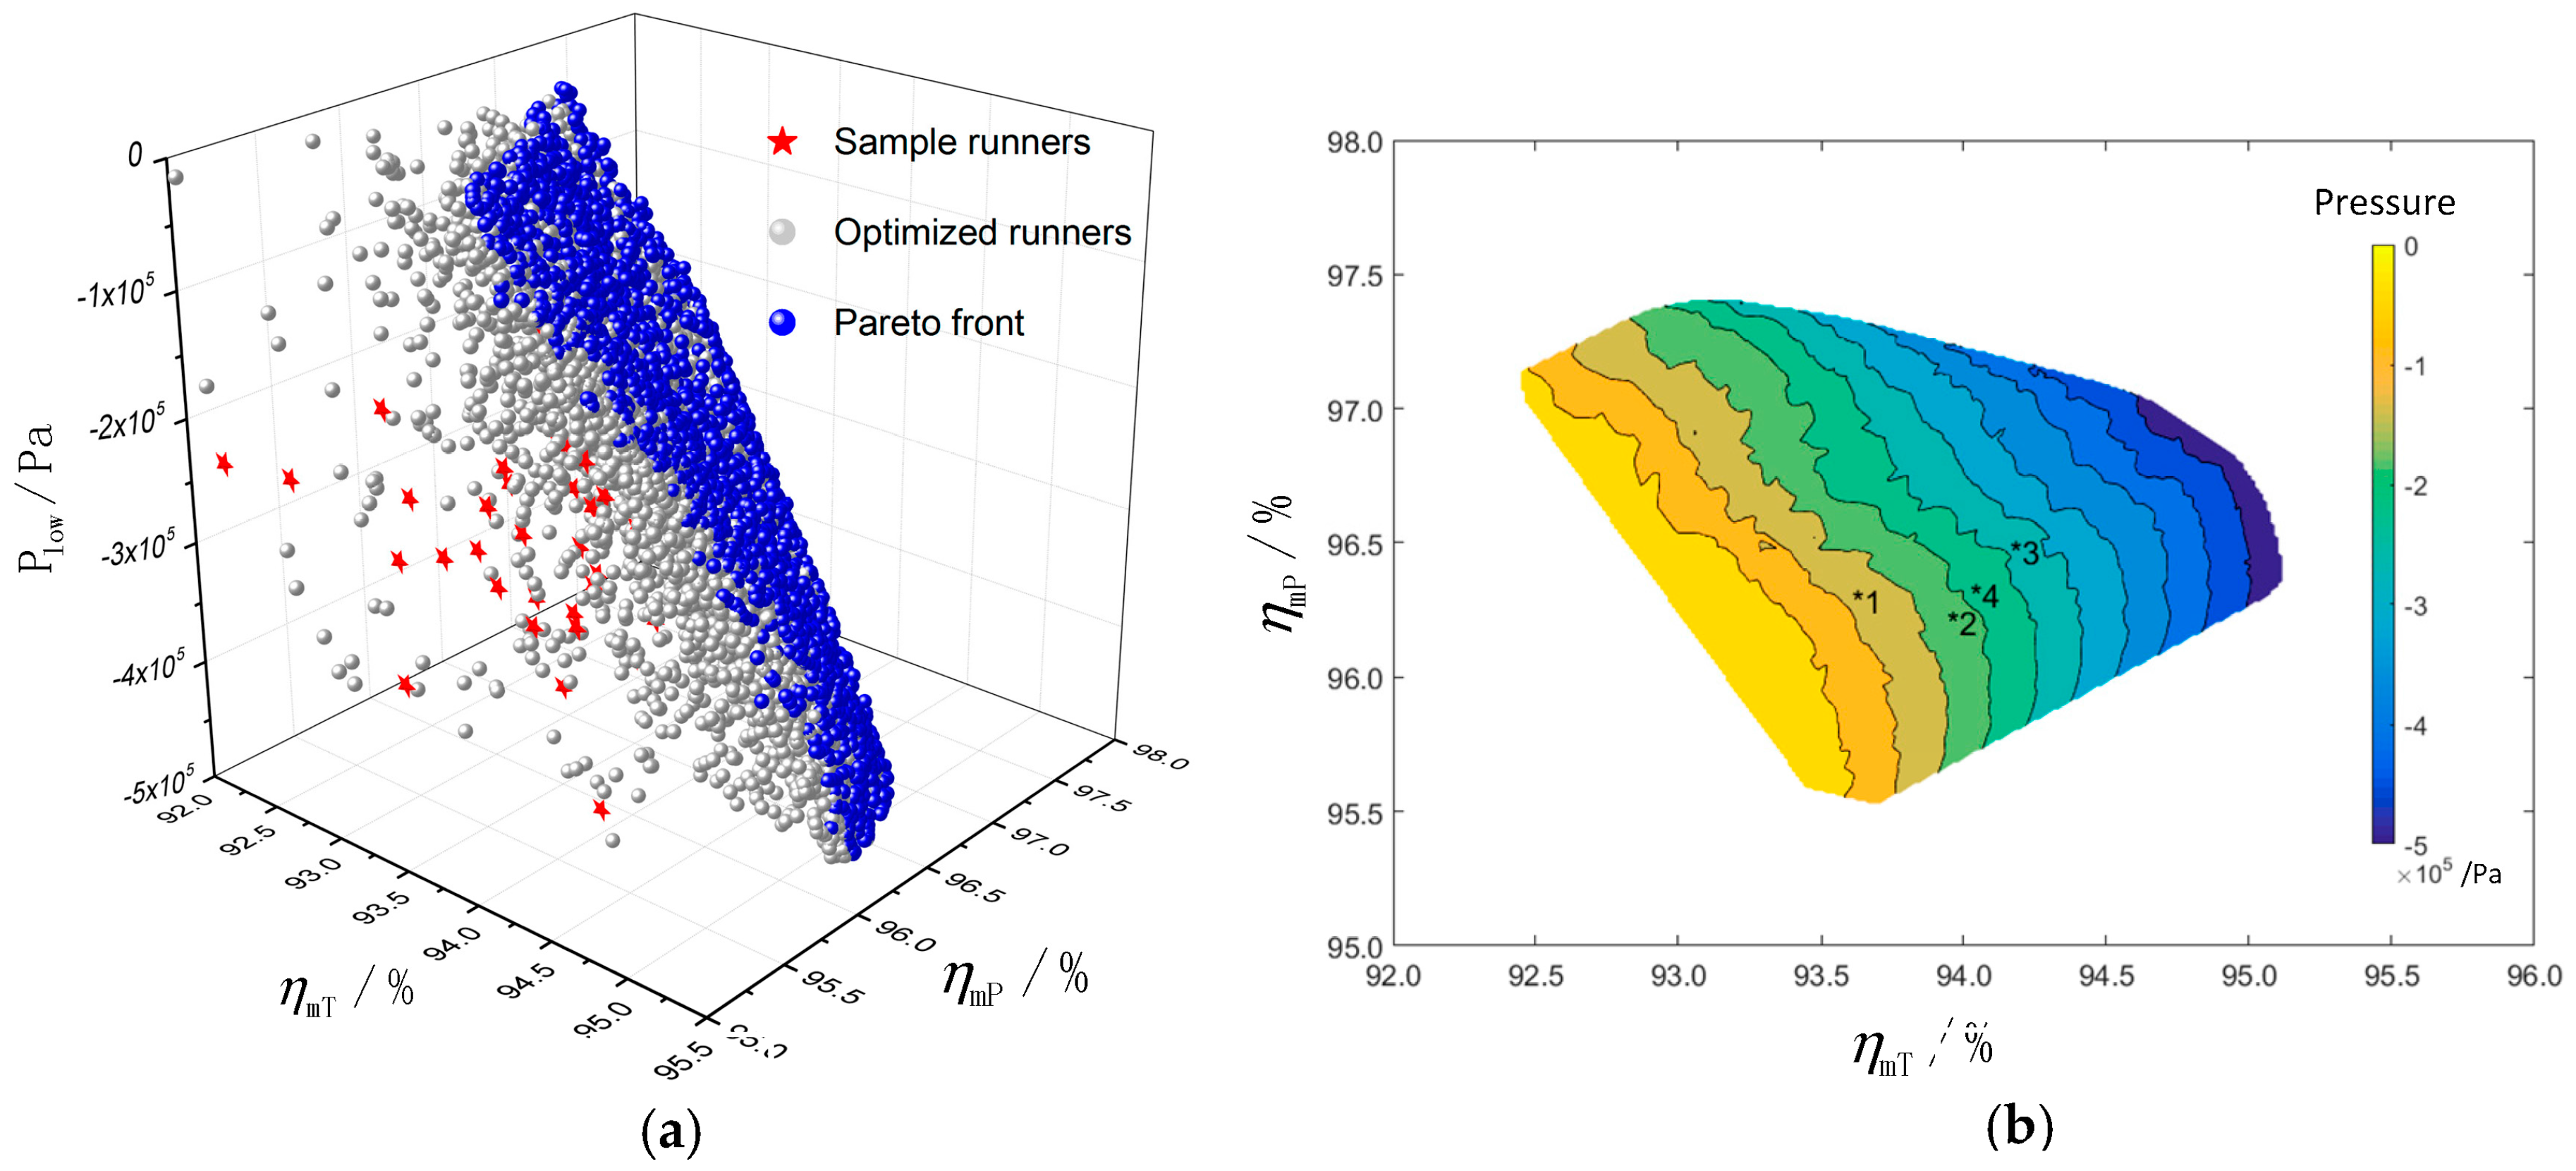
Figure 6 shows the optimization results. There are a total of 10,000 different optimized runners as shown in Figure 6a. The original 40 sample runners produced in DoE are also shown in Figure 6a. These samples were random, equiprobable, and orthogonally distributed. So that a high accuracy could be obtained as the RSM model shown in Equation (5) was used. The trade-off relationship between pump efficiency, turbine efficiency, and minimum pressure at the blade surface is indicated in the Pareto front surface in Figure 6b.
Four runner configurations on the Pareto front in Figure 6b—denoted by 1, 2, 3, and 4—are selected for further detailed study. These runners were selected with an artificial screening method, in which a limited range was set to each optimization target, and the runners satisfying the target conditions were selected. Table 5 shows the performance comparisons calculated by CFD and estimated by RSM. The initial baseline runner was also reported. The CFD results shown in Table 5 were obtained from the redesigned runners by using optimized blade loading and blade lean. As shown in Table 5, there are some differences in the objective functions between the RSM estimation and CFD calculation. When the RSM model approach expressed in Equation (5) is used in the optimization procedure, the response surface is an approximation of runner performance predicted by CFD analyses. Simulation-based objective functions are inherently noisy, which is the typical problem in the numerical optimization process [18,21]. Therefore, it is necessary to develop robust and efficient optimization methodologies that can afford satisfactory designs even for limited computational resources.
Runner 4 is recommended as the preferred runner through comprehensive consideration of runner efficiencies and minimum pressure on blade surface. As shown in Figure 7, the blade loading distributions of the initial runner on the hub and shroud are both back-loaded, while the optimized blade loading distributions are middle-loaded on the hub and back-loaded on the shroud for preferred runner 4. The blade lean is for the initial runner, and for the preferred runner 4 at the HPS, respectively.
Compared the preferred runner 4 with the initial runner, the runner’s efficiencies are increased about 0.6% and 0.7% under pump mode and turbine mode, respectively. At the same time, the runner cavitation performance is greatly increased by raising the minimum pressure on the blade surface. Figure 8 shows the comparison of the shapes among the preferred and initial runners. The preferred runner has a negative blade lean angle , and rake angle , whereas the initial runner has no lean on the HPS. Near the low pressure side (LPS), the blade cross-sections are in distorted shape in the preferred runner.
4. Parametric Effects on the Runner Performance
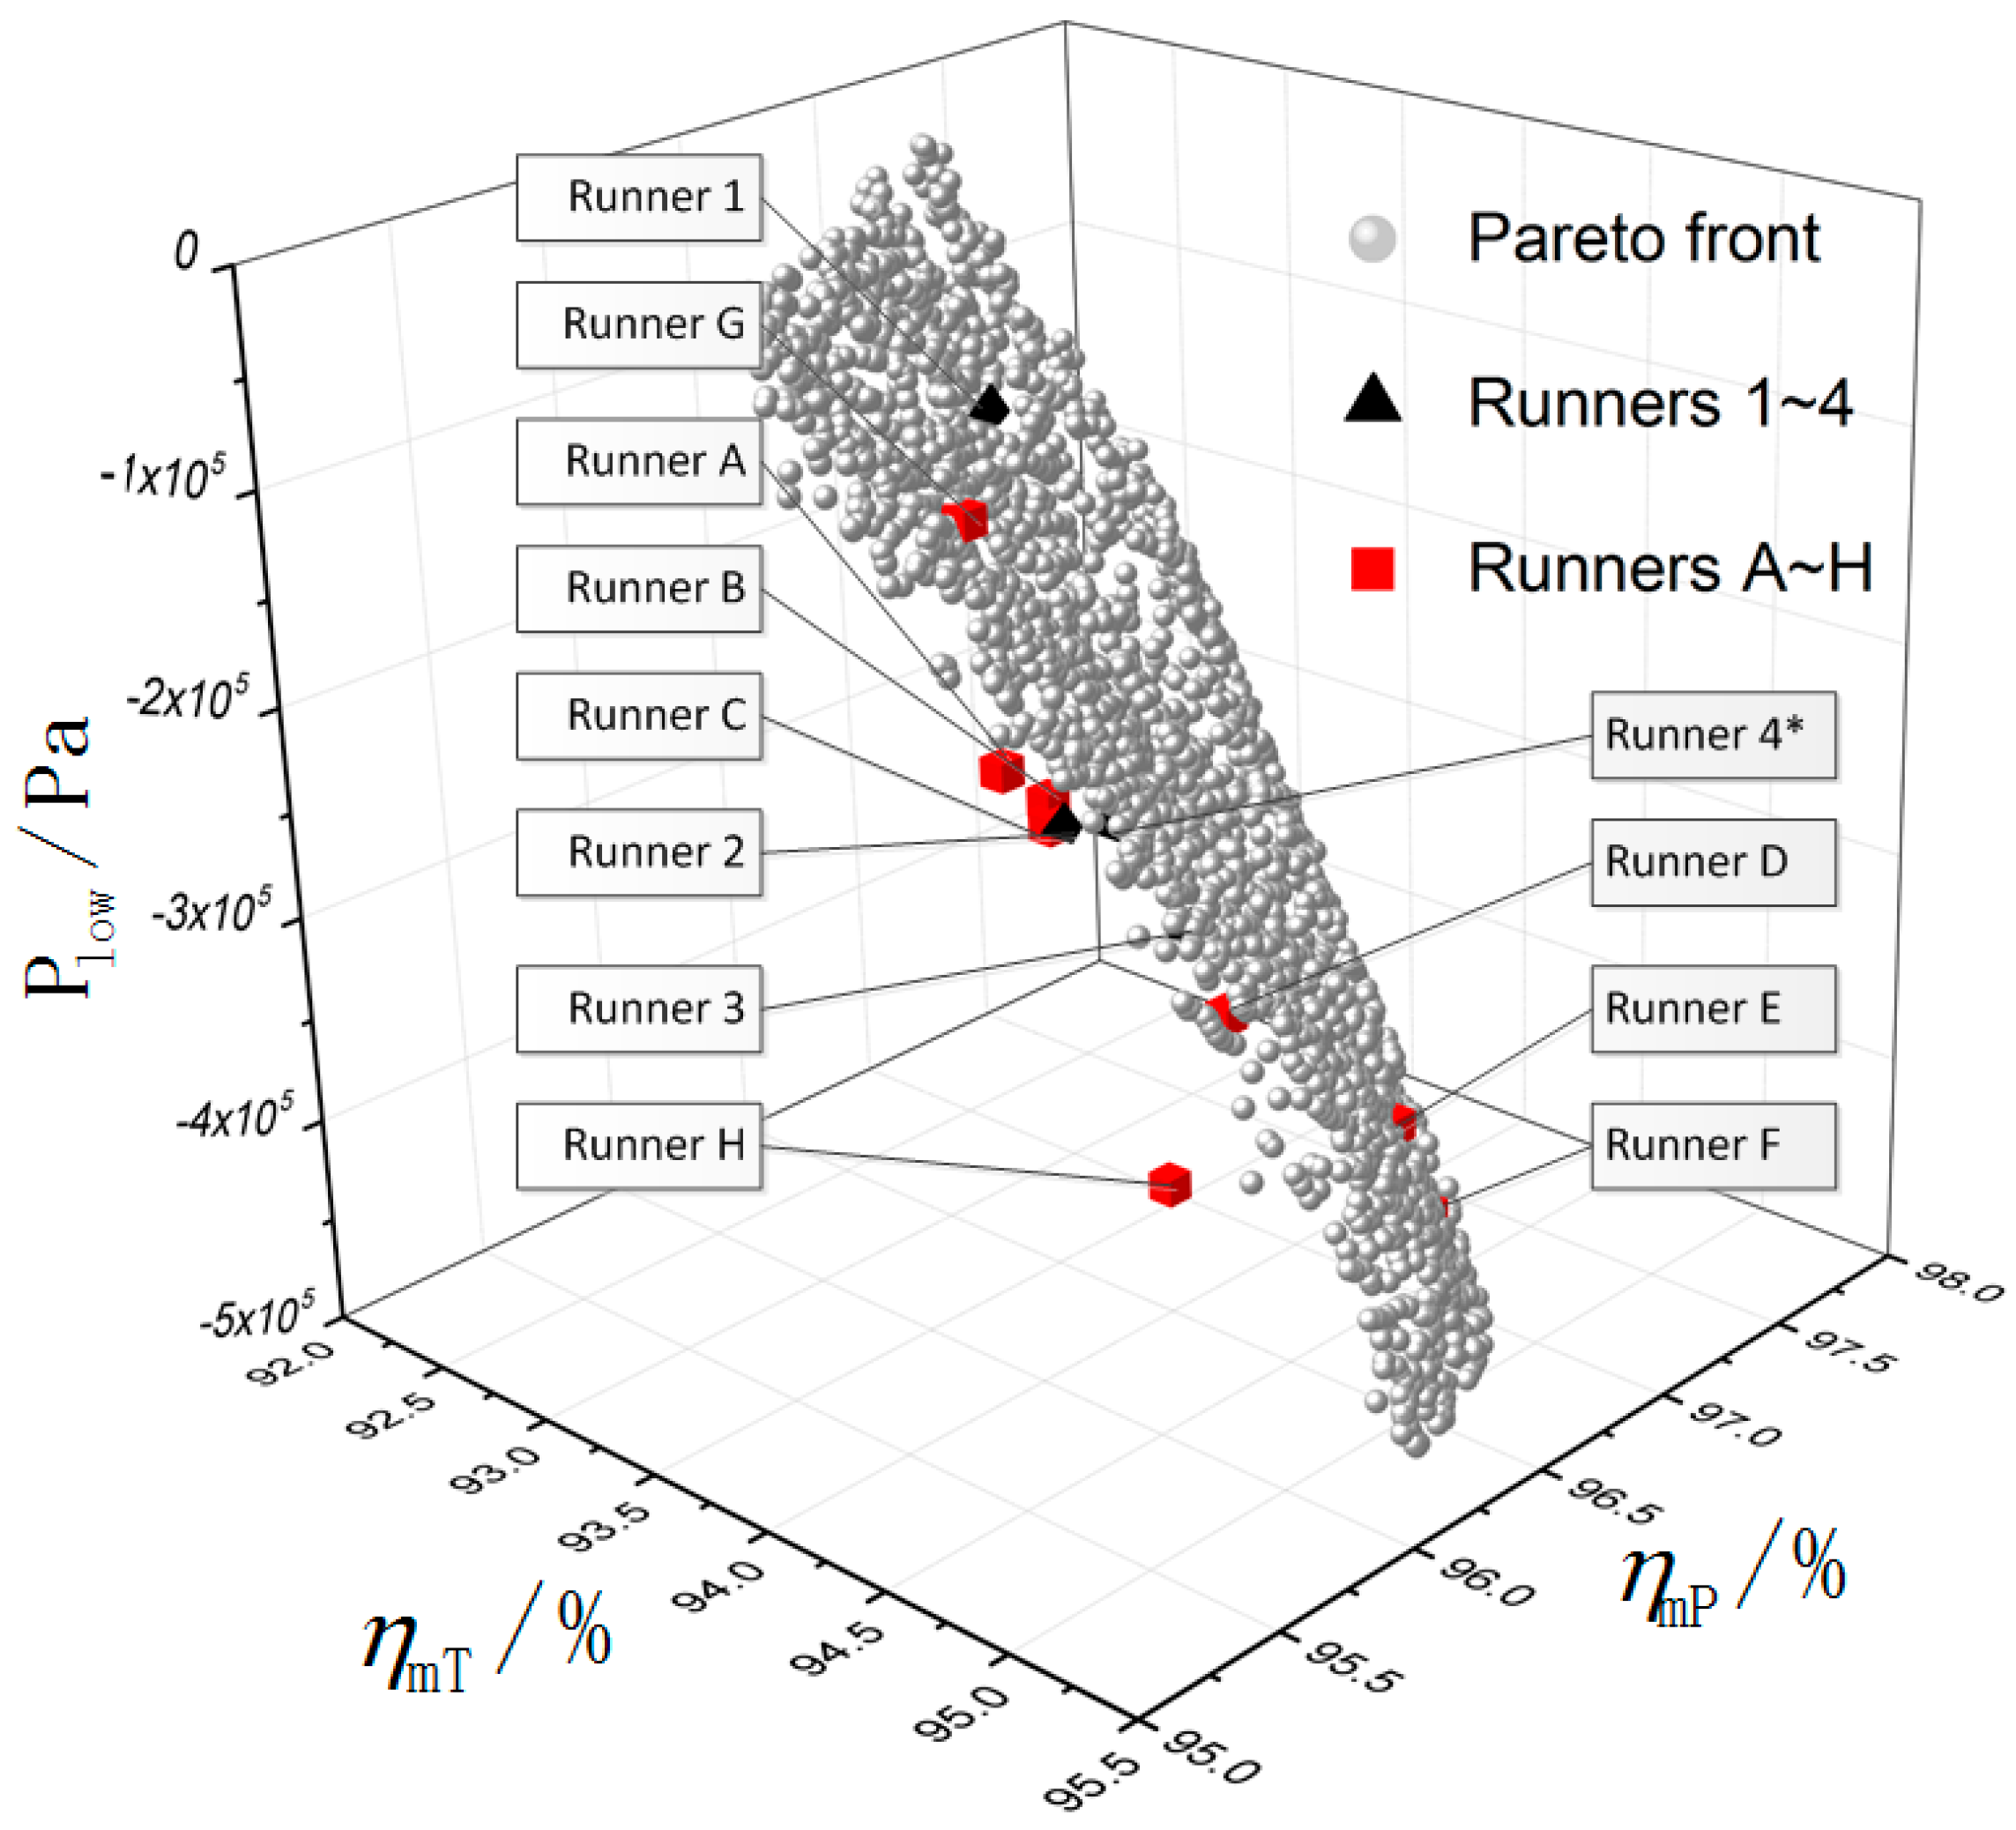
With the optimization, the runner with good overall performance could be developed as shown in Table 5. As discussed in Section 3.3, there were some differences in the performance estimated by RSM model and CFD prediction. In order to assess the impact of the main design parameters on the runner performances and increase the quantitative credibility of the optimized results, besides runners 1–4, more runners (A–H) were selected from the optimized results as shown in Figure 9. These runners were redesigned using the optimized design parameters and numerically simulated with CFD. Table 6 shows main design parameters and the CFD calculated performances for runners A–H, as well as the initial runner and the preferred runner.
4.1. Effects of Blade Loading
The blade lean angles for runners A–D are , , and , while the blade lean angles for the initial runner and the preferred runner are and , respectively. Figure 10 shows the comparisons of the shapes among runners A–D and the preferred runner. For runners A, B, and the preferred runner, their blade shapes are similar near HPS. As shown in Figure 10b, the blade shapes are a little different near HPS for runners C, D, and the preferred runner because of a slightly different blade lean. Near LPS, the blade shapes of runner D and the preferred runner are similar, and the blades tilt more to the turbine rotation direction than the other runners.
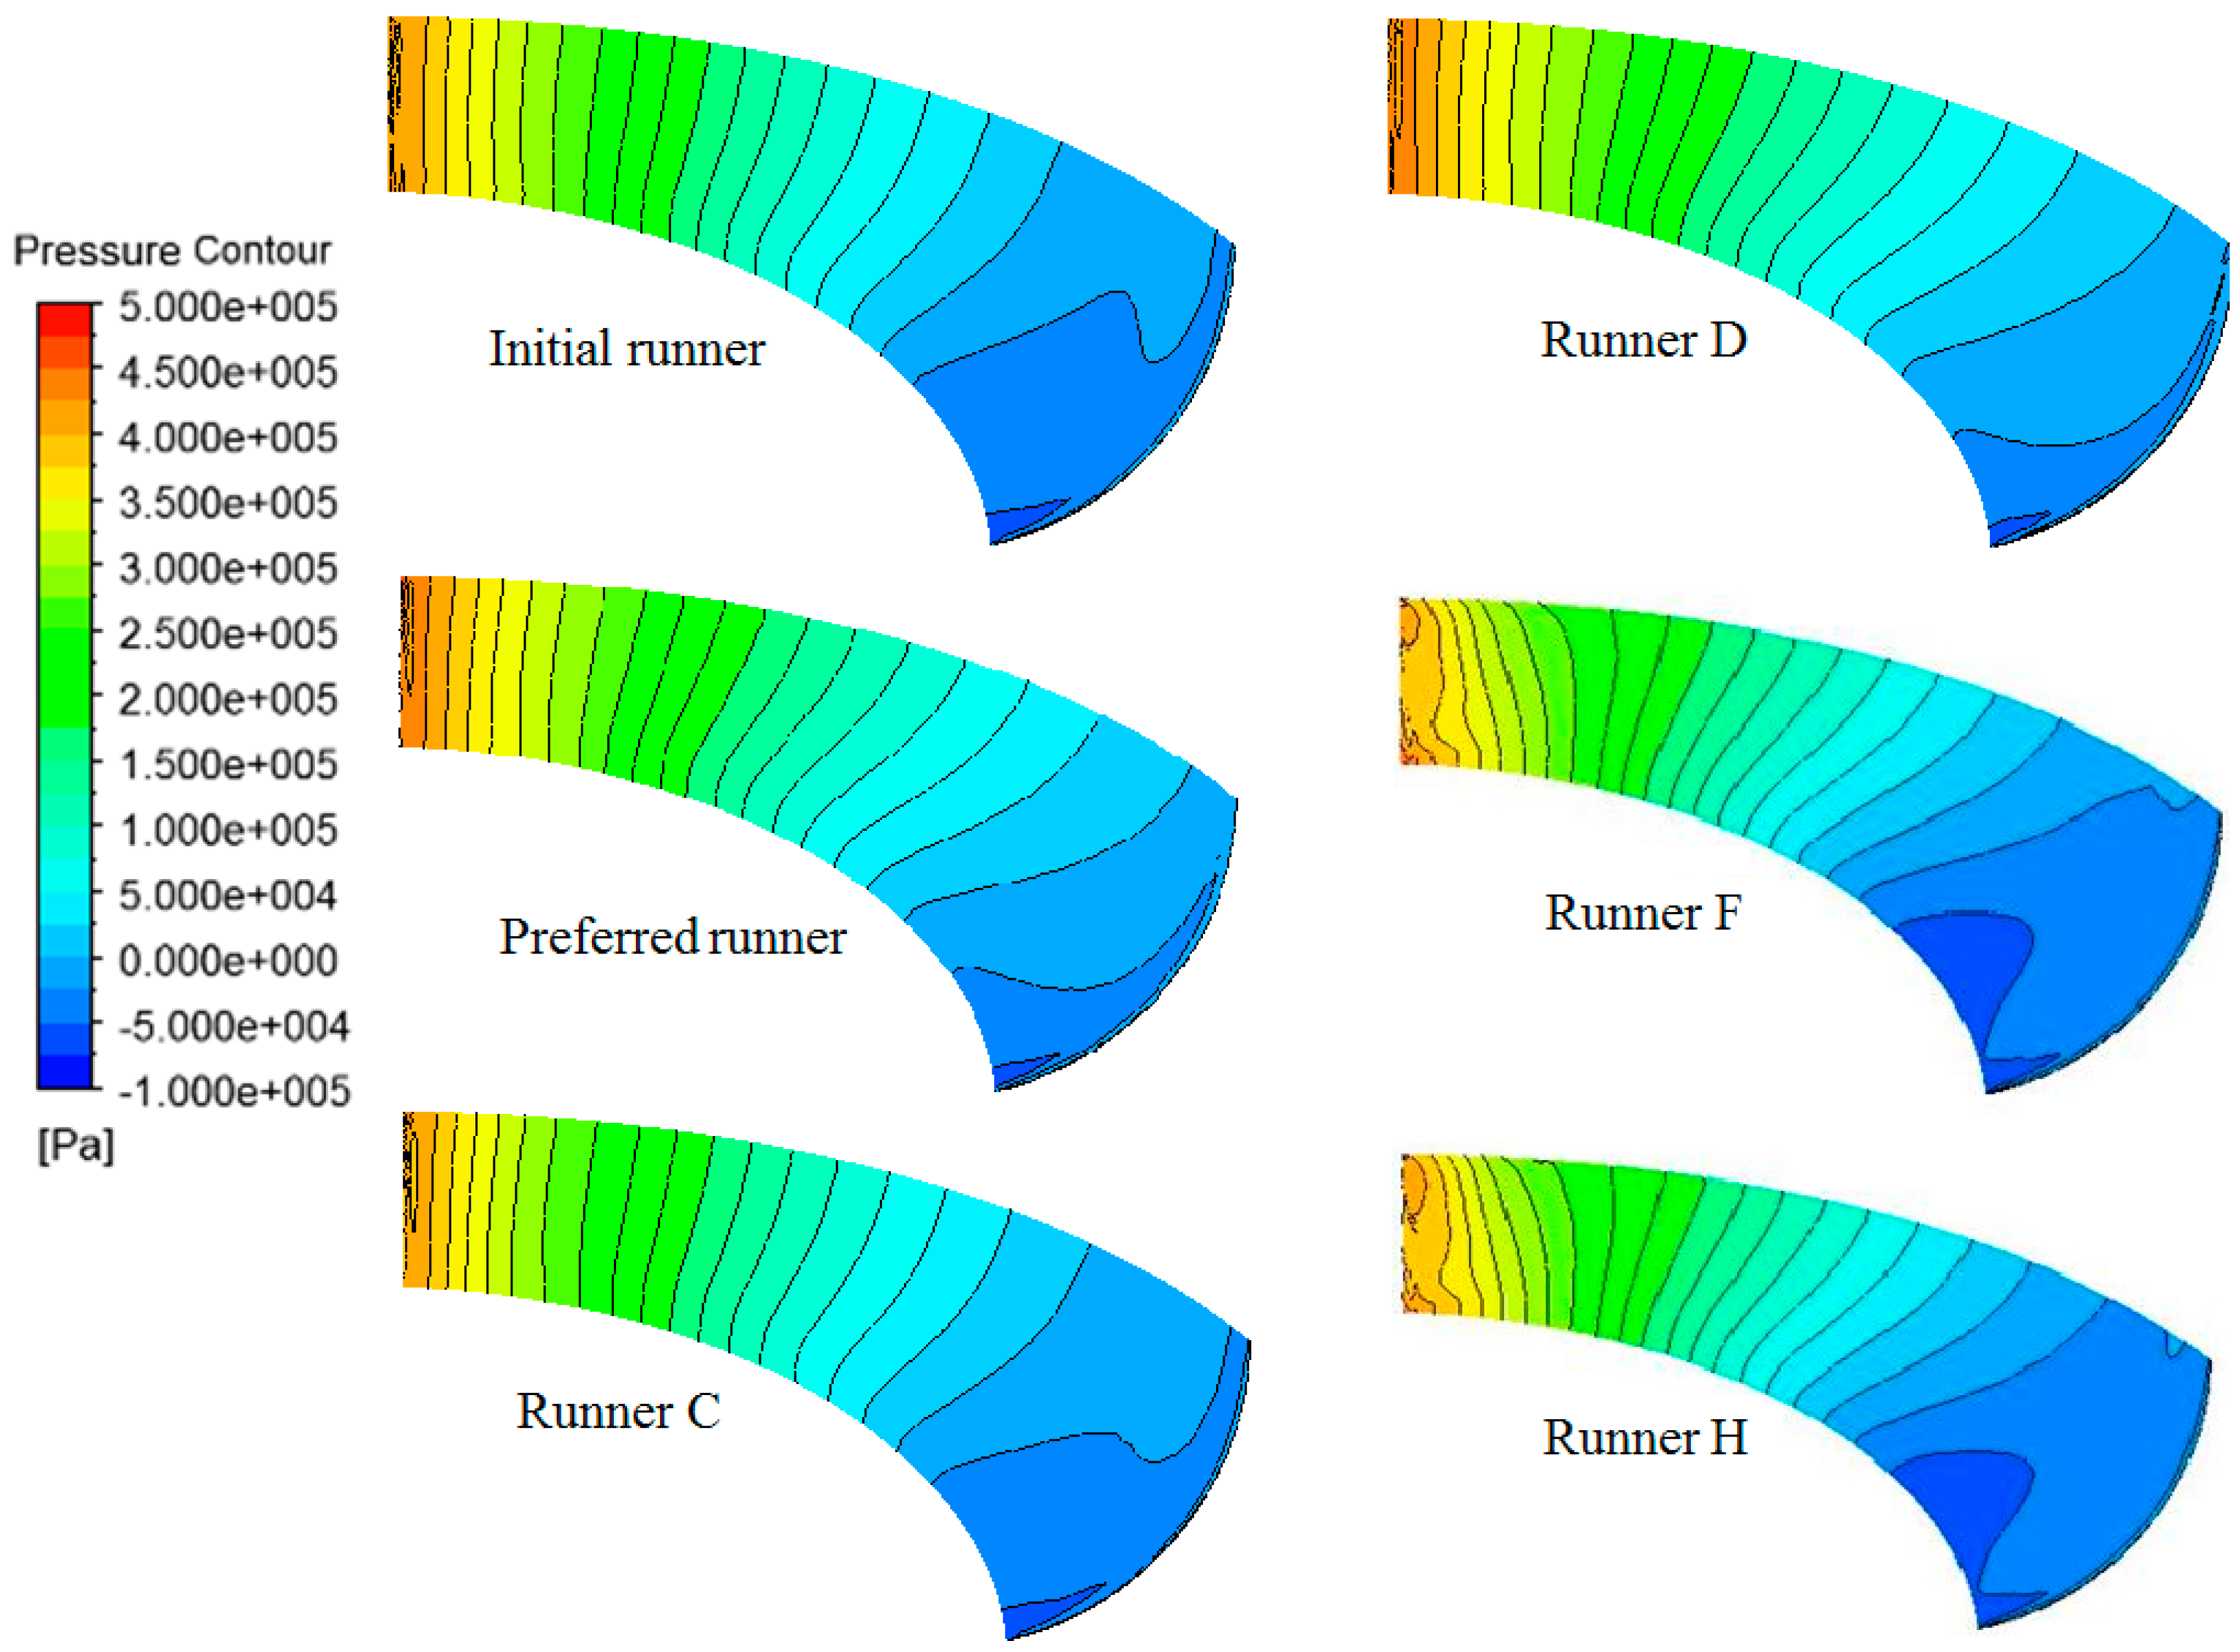
According to Table 6, the preferred runner and runner D have a higher efficiency in both turbine and pump mode. Furthermore, the minimum pressure at the blade surface is lower for these two runners. Figure 11 shows the pressure distributions on the blade suction surface under pump mode for different runners. Smaller low pressure zones on the blade suction side in pump mode show that the preferred runner and runner D have better cavitation characteristics.
Figure 12 shows the blade loading for runners A–D. Blade loading distributions are aft-loaded on the hub and shroud for runners A, B, and C, similar to the initial runner in Figure 7a. For runner D, blade loading distributions are middle-loaded on the hub and aft-loaded on the shroud, similar with the preferred runner shown in Figure 7b. The preferred runner has same blade lean angle with runners A and B, meanwhile runner D has the same blade lean angle as the initial runner. Therefore, the performance improvement for the preferred runner and runner D is mainly provided by the blade loading distribution. Synthetically considering the effects on efficiency and cavitation, it is recommended to design the runner to be middle-loaded on hub and back-loaded on shroud for blade loading distributions.
4.2. Effects of the Blade Lean
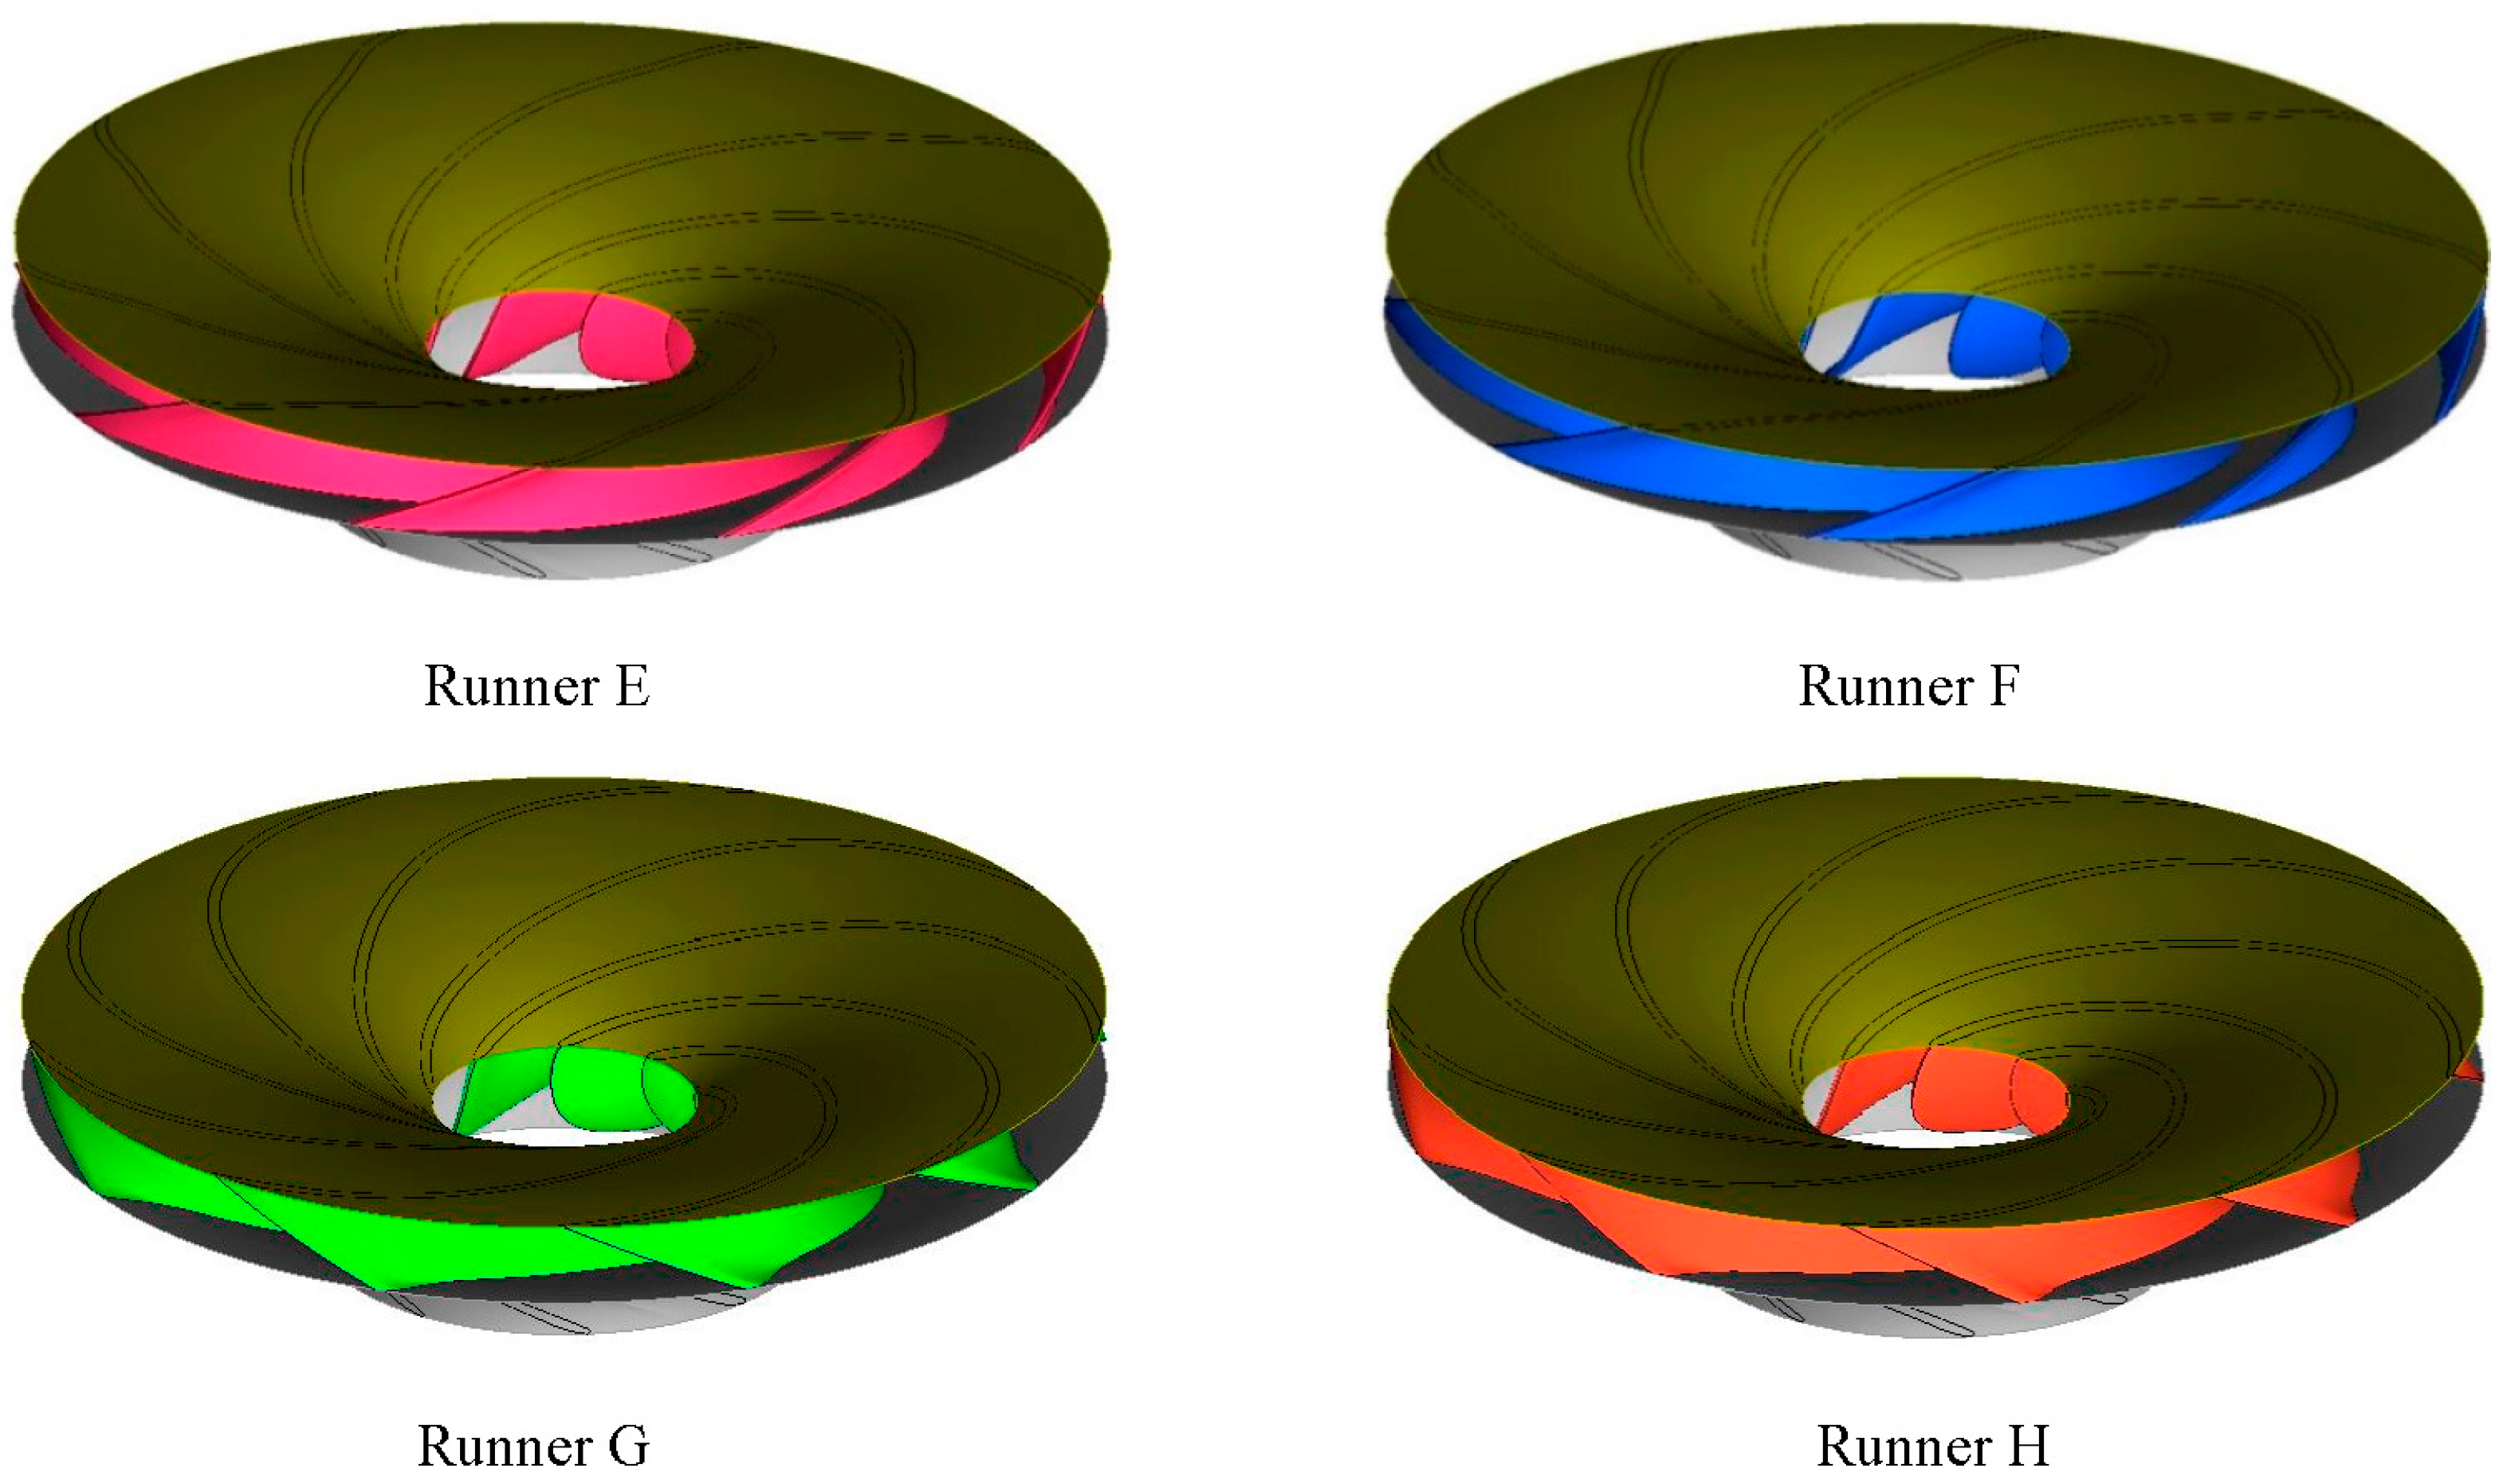
More runners marked by E–H were investigated. For these four runners, the blade loading distributions were almost the same with the preferred runner and runner D, while the blade lean angles changed greatly, , , , and , respectively. Figure 13 shows the shapes of these four runners. It can found that large positive or negative blade lean angles significantly change the spatial shape of the blades from shroud to hub.
Table 6 shows that runners E and F with large positive blade lean angle have a higher efficiency than the preferred runner and the initial runner in both turbine mode and pump mode. Runners G and H with large negative blade lean angles retain a relative high efficiency in pump mode, but the efficiency in turbine mode decreases. For all these four runners, the minimum pressure at the blade surface is lower than that of the initial runner and the preferred runner. It is clearly shown in Figure 11 that low pressure zones on the blade suction surface for runners F and H are larger than those for the initial and preferred runner.
The cavitation characteristics of the runner mainly depend on the blade shape near the runner’s LPS. The blade loading for the preferred runner and runners D–H are almost the same, so that the large blade lean on the HPS induces the blade shape change near the runner’s LPS, and deteriorates the runner’s cavitation characteristics. Therefore, the large blade lean on the HPS is not recommended to be used for the ultra-head reversible pump-turbine runner considering cavitation characteristics.
5. Conclusions
In the present paper, a multiobjective optimization design strategy is briefly presented. The design approach is a combination of 3D inverse design to parameterize the blade geometry, CFD for flow analysis, DoE to reduce the number of calculation times, RSM to correlate the design parameters with the objectives, and MOGA to search the trade-off design. The strategy is used to develop an ultrahigh-head pump-turbine runner. Based on the trade-offs among the optimized targets, a runner is recommended from the optimized runners. Compared to the initial runner, the preferred runner’s efficiency under turbine mode is increased by about 0.7% and the pump efficiency by about 0.6%, while the runner’s cavitation is greatly promoted.
The hydrodynamic performance characteristics of the pump-turbine correlate strongly with the design parameters. Based on the optimization, the effects of blade loading and blade lean on the runners’ geometry and performance are studied. It is suggested that middle-loaded blade loading distribution on the hub, and back-loaded distribution on the shroud—as shown in Figure 7b—are good for the improvement for the runner efficiencies under two operating modes. On the shroud, the blade loading should be reduced near the LPS because the cavitation is most likely to occur in this zone. The large positive blade lean angle on the high pressure side can increase the runner efficiency under turbine mode. However, large blade lean angles may induce drop on the lowest pressure, and deteriorate the cavitation characteristics.
For the large capacity pump-turbine unit, besides the efficiency and cavitation performances, the operation stability for both operating conditions should be guaranteed [3,28]. Under pump mode, instabilities with cavitation in the hump region limit the normal operating range of the unit. Under turbine mode, pressure fluctuations mainly determine smooth operations for the unit. The flow field is converted into a fully separated unsteady state in these cases. Therefore, enlarging the present strategy to consider the unsteady characteristics of the pump-turbine would be valuable.
Acknowledgments
The present work was partially supported by the National Natural Science Foundation of China (Grant No. 51679122).
Author Contributions
Linhai Liu made the computational simulations and prepared the first draft of the paper. Baoshan Zhu planned the study project and revised the paper. Li Bai and Xiaobin Liu made some simulations and checked the calculation data. Yue Zhao and Baoshan Zhu conceived and directed this study.
Conflicts of Interest
The authors declare no conflict of interest.
Nomenclature
| High pressure side width | |
| Number of blades | |
| Hub diameter for low pressure side | |
| Shroud diameter for low pressure side | |
| High pressure side diameter | |
| Blade loading at leading edge | |
| Head height | |
| Maximum head height | |
| Minimum head height | |
| Rated head height | |
| Turbulence kinetic energy | |
| Percentage meridional distance | |
| Torque acting on runner | |
| Revolution speed | |
| Fore connection point on blade loading distribution curve | |
| Aft connection point on blade loading distribution curve | |
| Rated output power | |
| Discharge | |
| Radius or radial direction | |
| Slope of the middle line on blade loading distribution curve | |
| Tangentially velocity | |
| Relative velocity on blade surface | |
| Input parameter or Cartesian coordinate | |
| Optimization targets | |
| Blade rake angle or coefficients in polynomial for RSM | |
| Unit efficiency | |
| Blade lean angle | |
| Fluid density | |
| Angular velocity | |
| Turbulent kinematic viscosity | |
| Superscripts | |
| Circumferential average | |
| + | Upper side of blade |
| - | Lower side of blade |
| Fluctuation | |
| Subscripts | |
| Blade surface | |
| Hub | |
| Model unit or meridional direction | |
| Pump mode | |
| Shroud | |
| Turbine mode | |
| Tangential component |
References
- Mei, Z.Y. Power Generation Technology of Pumped Storage Power Station; China Machine Press: Beijing, China, 2000; p. 47. (In Chinese) [Google Scholar]
- Hino, T.; Lejeune, A. Pumped storage hydropower developments. Compr. Renew. Energy 2012, 6, 405–434. [Google Scholar]
- Zuo, Z.G.; Liu, S.H.; Sun, Y.K.; Wu, Y.L. Pressure fluctuations in the vaneless space of high-head pump-turbines—A review. Renew. Sustain. Energy Rev. 2015, 41, 965–974. [Google Scholar] [CrossRef]
- Pugliese, F.; De Paola, F.; Fontana, N.; Giugni, M.; Marini, G. Experimental characterization of two pumps as turbines for hydropower generation. Renew. Energy 2016, 99, 180–187. [Google Scholar] [CrossRef]
- Chen, C.; Zhu, B.; Singh, P.M.; Choi, Y.D. Design of a pump-turbine based on the 3D inverse design method. KSFM J. Fluid Mach. 2015, 18, 5–10. [Google Scholar] [CrossRef]
- Derakhshan, S.; Nourbakhsh, A. Theoretical, numerical and experimental investigation of centrifugal pumps in reverse operation. Exp. Therm. Fluid Sci. 2008, 32, 1620–1627. [Google Scholar] [CrossRef]
- Frosina, E.; Buono, D.; Senatore, A. A Performance prediction method for pumps as turbines (PAT) using a computational fluid dynamics (CFD) modeling Approach. Energies 2017, 10, 103. [Google Scholar] [CrossRef]
- Kerschberger, P.; Gehrer, A. Hydraulic development of high specific-speed pump-turbines by means of an inverse design method, numerical flow-simulation (CFD) and model testing. IOP Conf. Ser. Earth Environ. Sci. 2010, 12, 012039. [Google Scholar] [CrossRef]
- Schleicher, W.C.; Oztekin, A. Hydraulic design and optimization of a modular pump-turbine runner. Energy Convers. Manag. 2015, 93, 388–398. [Google Scholar] [CrossRef]
- Olimstad, G.; Nielson, T.; Borresen, B. Dependency on runner geometry for reversible-pump turbine characteristics in turbine mode of operation. J. Fluids Eng. 2012, 134, 1428–1435. [Google Scholar] [CrossRef]
- Yin, J.L.; Wang, D.Z.; Wei, X.Z.; Wang, L.Q. Hydraulic improvement to eliminate S-shaped curve in pump turbine. J. Fluids Eng. 2013, 135, 071105. [Google Scholar] [CrossRef]
- Zangeneh, M. A compressible three-dimensional design method for radial and mixed flow turbomachinery blades. Int. J. Numer. Meth. Fluids 1991, 13, 599–624. [Google Scholar] [CrossRef]
- Peng, G. A practical combined computation method of mean through-flow for 3D inverse design of hydraulic turbomachinery blades. J. Fluids Eng. 2005, 127, 1183–1190. [Google Scholar] [CrossRef]
- Tan, L.; Cao, S.; Wang, Y.; Zhu, B. Direct and inverse iterative design method for centrifugal pump impellers. Proc. Inst. Mech. Eng. Part A 2012, 226, 764–775. [Google Scholar] [CrossRef]
- Bonaiuti, D.; Zangeneh, M. On the coupling of inverse design and optimization techniques for the multiobjective, multipoint design of turbomachinery blades. J. Turbomach. 2009, 131, 21014–21029. [Google Scholar] [CrossRef]
- Hua, J.; Kong, F.; Liu, P.Y.; Zingg, D. Optimization of long-endurance airfoils. In Proceedings of the AIAA-2003-3500, 21st AIAA Applied Aerodynamics Conference, Orlando, FL, USA, 23–26 June 2003. [Google Scholar]
- Secanell, M.; Suleman, A. Numerical evaluation of optimization algorithms for low-Reynolds number aerodynamics shape optimization. AIAA J. 2005, 10, 2262–2267. [Google Scholar] [CrossRef]
- Zitler, E.; Thiele, L. Multiobjective evolution algorithm: A comparative case study and the strength Pareto approach. IEEE Trans. Evolut. Comput. 1999, 3, 257–271. [Google Scholar] [CrossRef]
- Lee, D.S.; Gonzalez, L.F.; Periaus, J.; Srinivas, K. Robust design optimization using multi-objective evolution algorithms. Comput. Fluids 2008, 37, 565–583. [Google Scholar] [CrossRef]
- Oyama, A.; Okabe, Y.; Shimoyama, K.; Fujii, K. Aerodynamics multiobjective design exploration of a flapping airfoil using a Navier-Stokes solver. J. Aeros. Comp. Inf. Com. 2009, 6, 256–270. [Google Scholar] [CrossRef]
- Koziel, S.; Yang, X.S. Computational optimization, methods and algorithm. In Studies in Computational Intelligence; Springer: Berlin, Germany, 2011; Volume 356. [Google Scholar]
- Wang, X.H.; Zhu, B.S.; Tan, L.; Zhai, J.; Cao, S.L. Development of a pump-turbine runner based on multiobjective optimization. IOP Conf. Ser. Earth Environ. Sci. 2014, 22. [Google Scholar] [CrossRef]
- Zhu, B.; Wang, X.; Tan, L.; Zhou, D.; Zhao, Y.; Cao, S. Optimization design of a reversible pump–turbine runner with high efficiency and stability. Renew. Energy 2015, 81, 366–376. [Google Scholar] [CrossRef]
- Zangeneh, M.; Goto, A.; Harada, H. On the design criteria for suppression of secondary flows in centrifugal and mixed flow impellers. J. Turbomach. 1998, 120, 723–735. [Google Scholar] [CrossRef]
- Ding, H.; Visser, F.C.; Jiang, Y.; Furmanczyk, M. Demonstration and validation of a 3D CFD simulation tool predicting pump performance and cavitation for industrial applications. J. Fluids Eng. 2011, 133, 011101. [Google Scholar] [CrossRef]
- Huang, L.C. The introduction of Yangjiang pumped storage power plant. In The Collected Works for the Pumped Storage Power Plants Construction in 2005; China Electric Power Press: Beijing, China, 2005; pp. 414–417. (In Chinese) [Google Scholar]
- International Electrotechnical Commission (IEC). Hydraulic Turbines, Storage Pumps and Pump-Turbines—Model Acceptance Tests; IEC Standard 60193; International Electrotechnical Commission (IEC): Geneva, Switzerland, 1999. [Google Scholar]
- Wang, Z.; Zhu, B.; Wang, X.; Qin, D. Pressure fluctuations in the S-shaped region of a reversible pump-turbine. Energies 2017, 10, 96. [Google Scholar] [CrossRef]
Figure 1.
Procedures for multiobjective optimization.
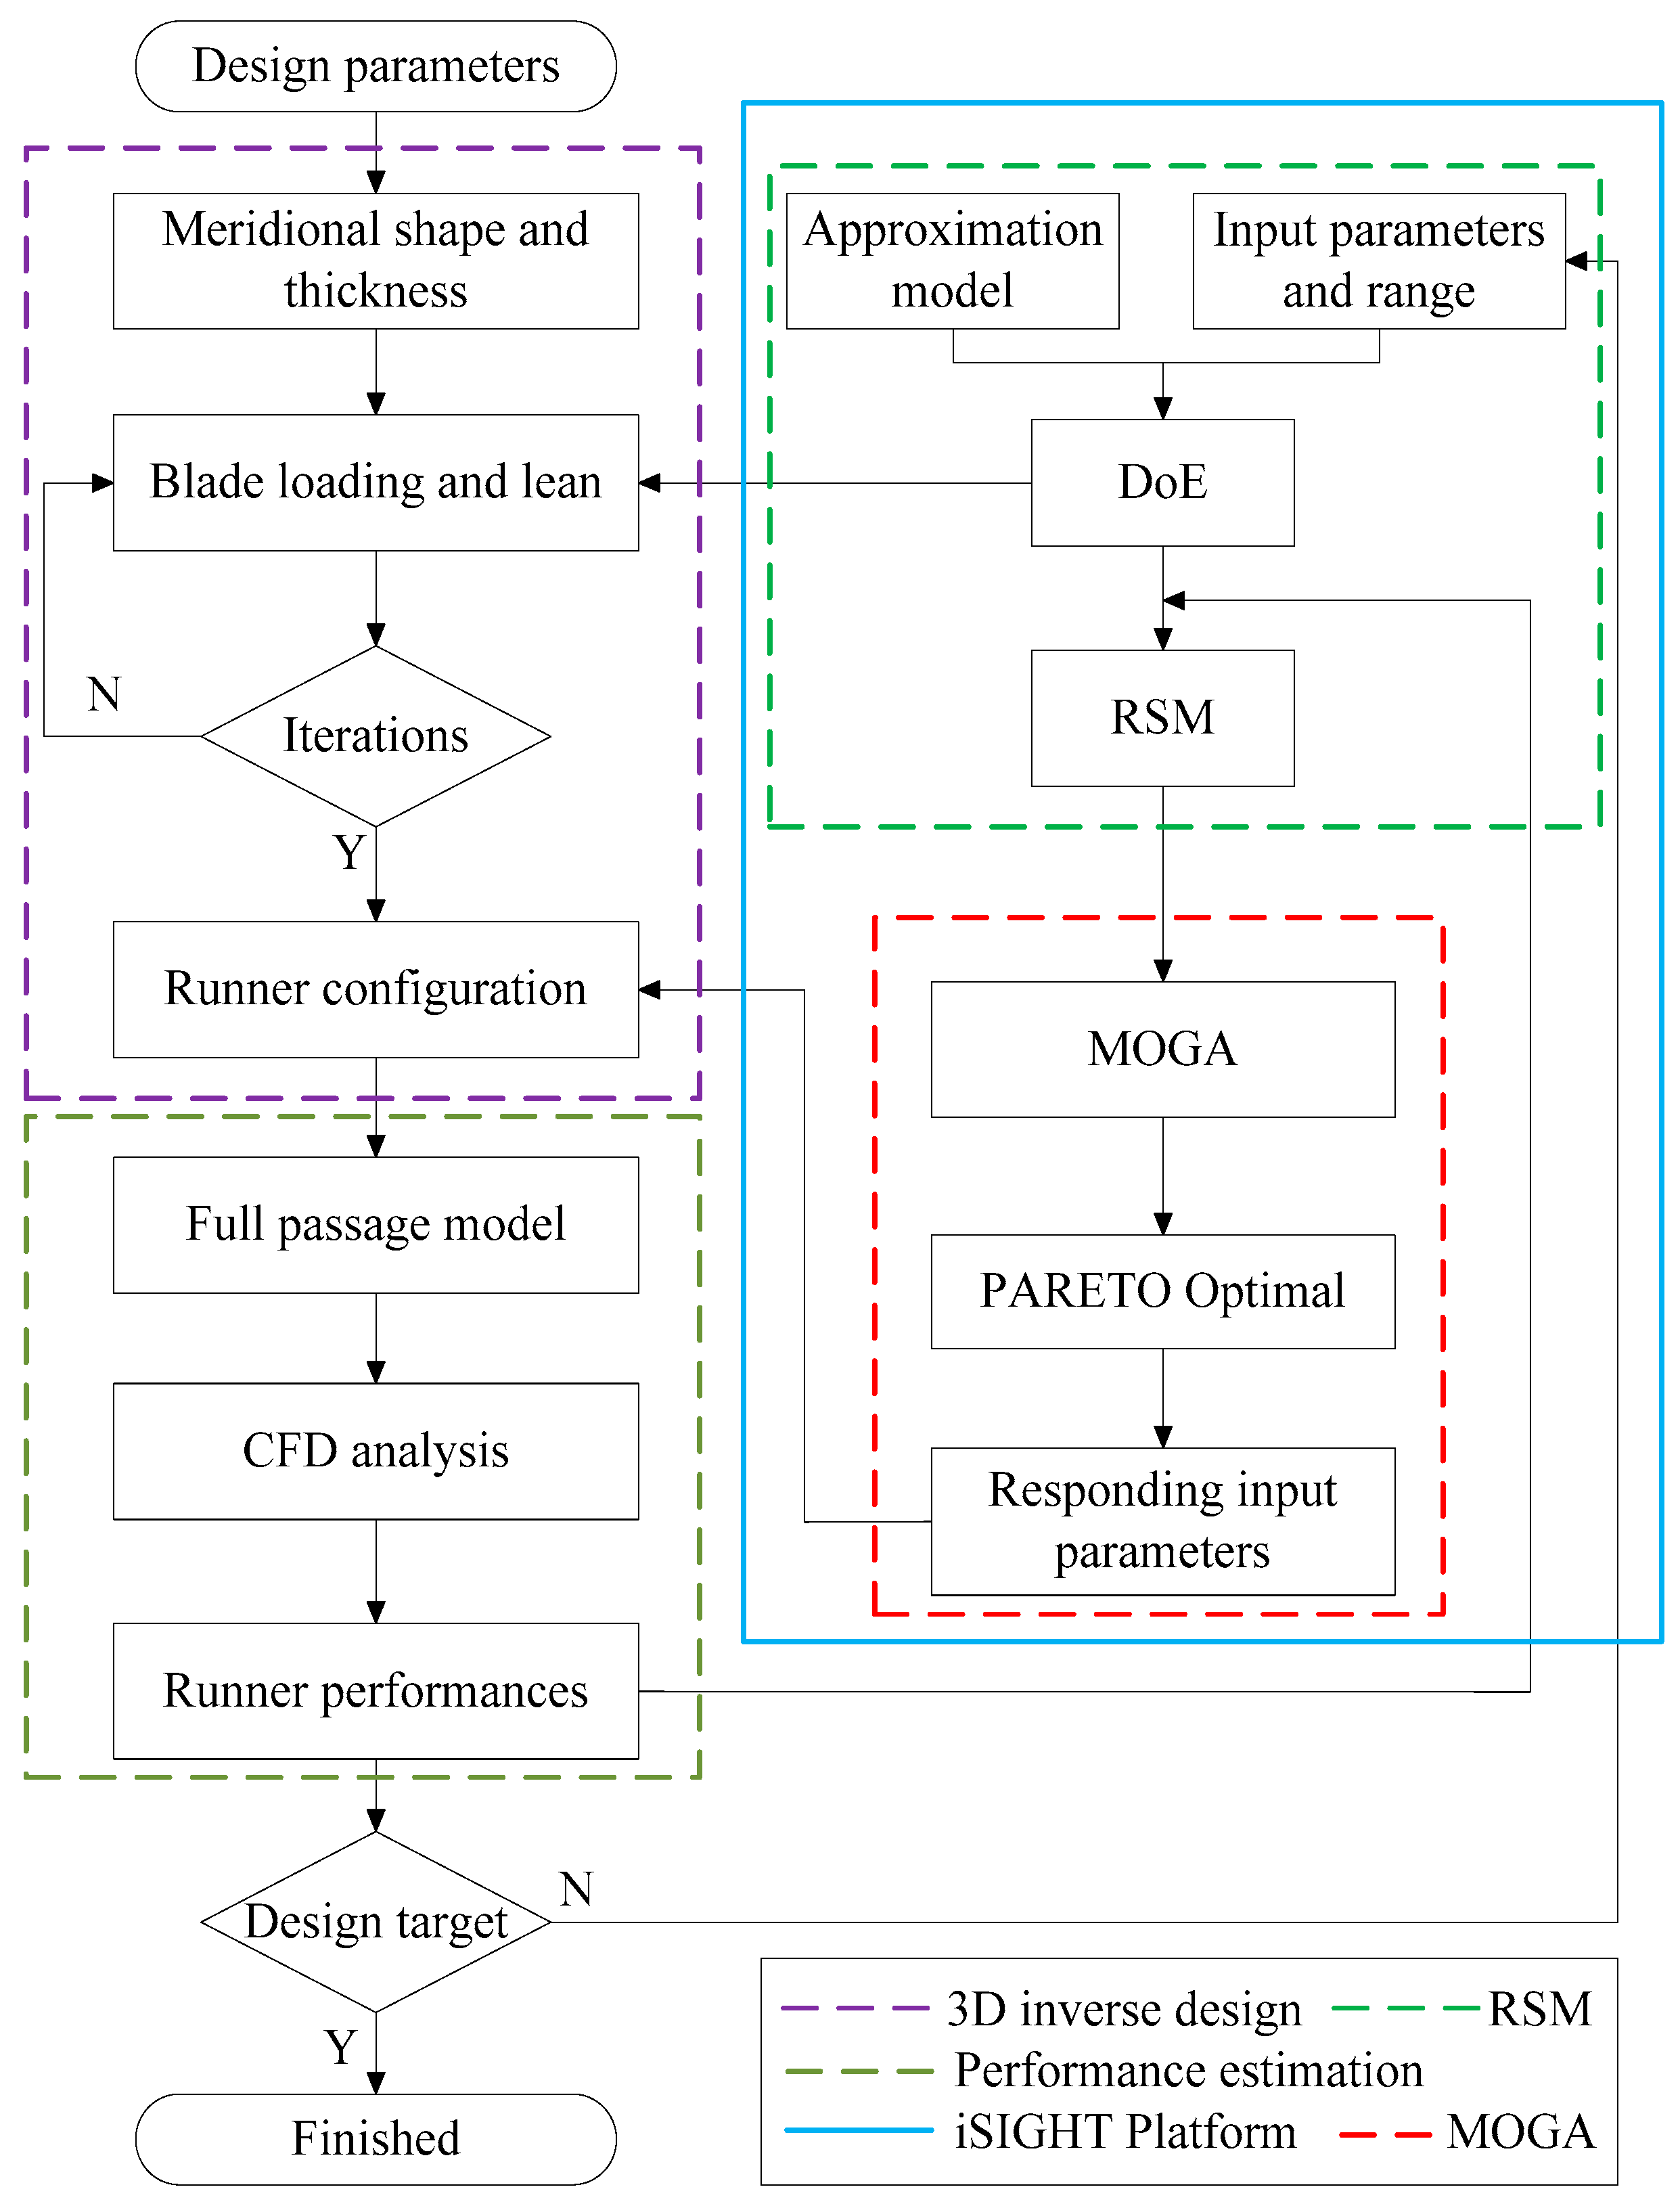
Figure 2.
Blade lean at high pressure side.

Figure 3.
Whole flow passage model.

Figure 4.
Meridional blade shape.
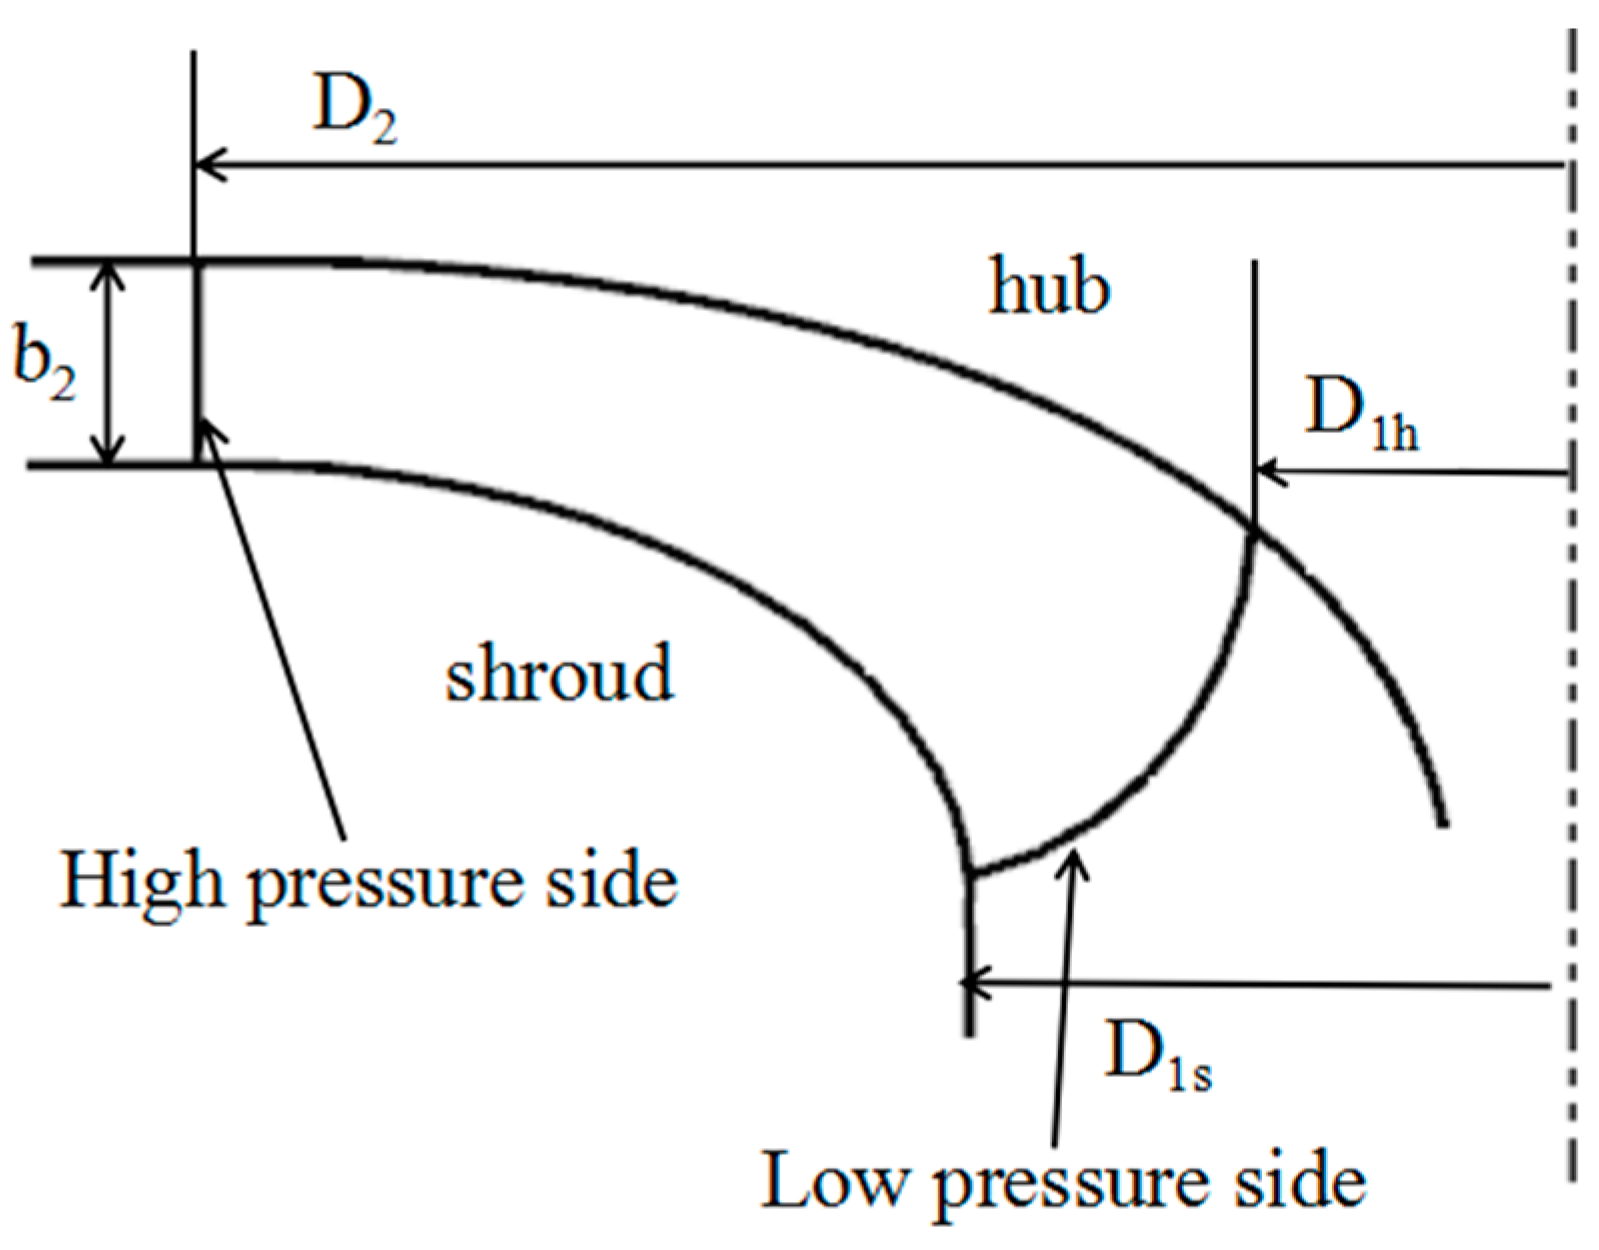
Figure 5.
Blade loading distributions.

Figure 6.
Optimization results. (a) Optimized runners; and (b) Pareto front surface.

Figure 7.
Blade loading distributions of the initial runner and the preferred runner.
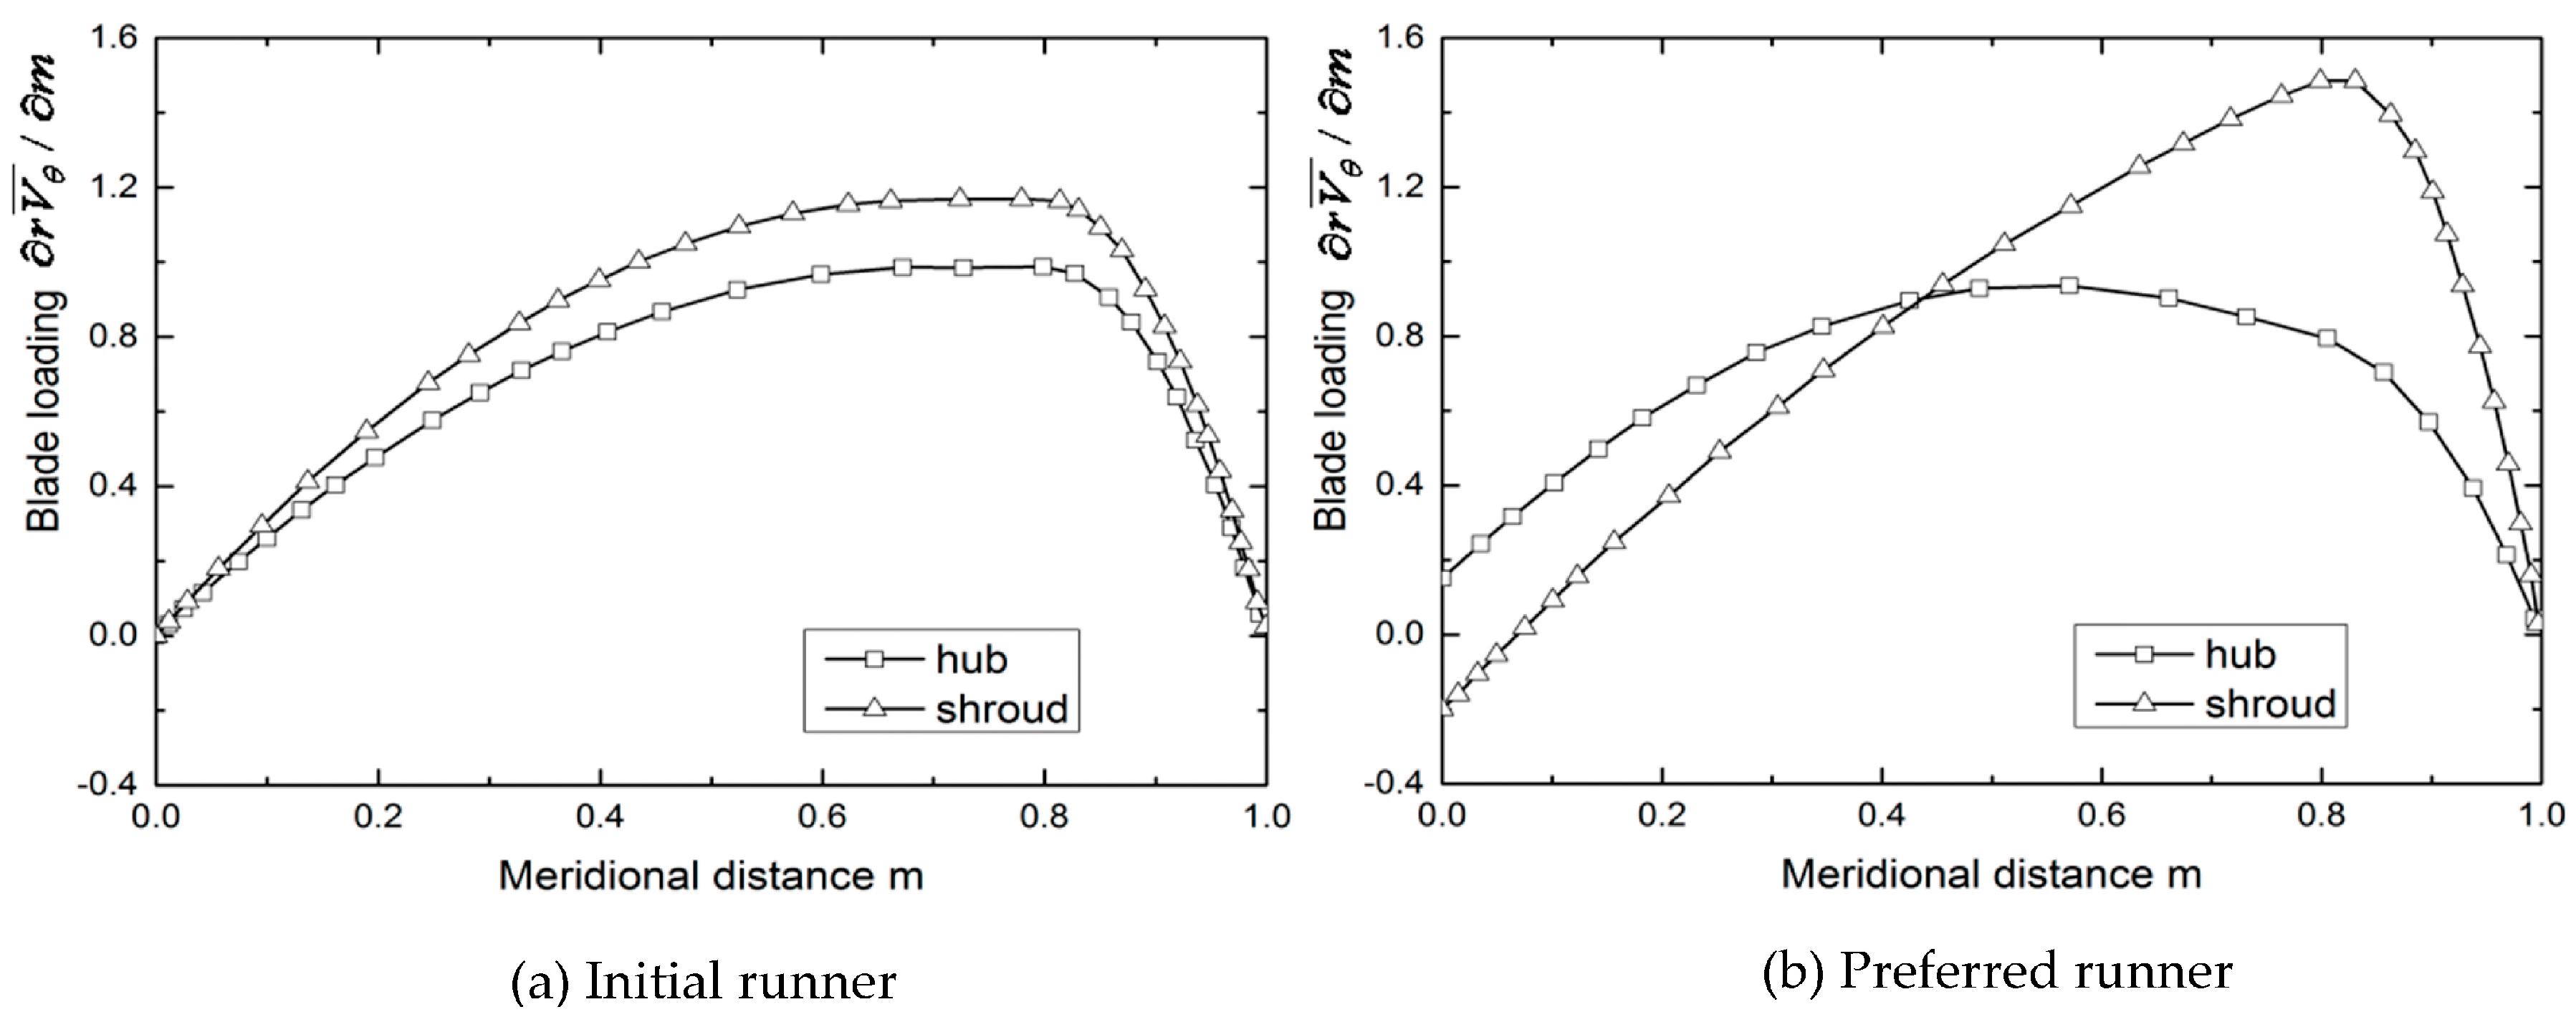
Figure 8.
Comparison of the blades for two runners.
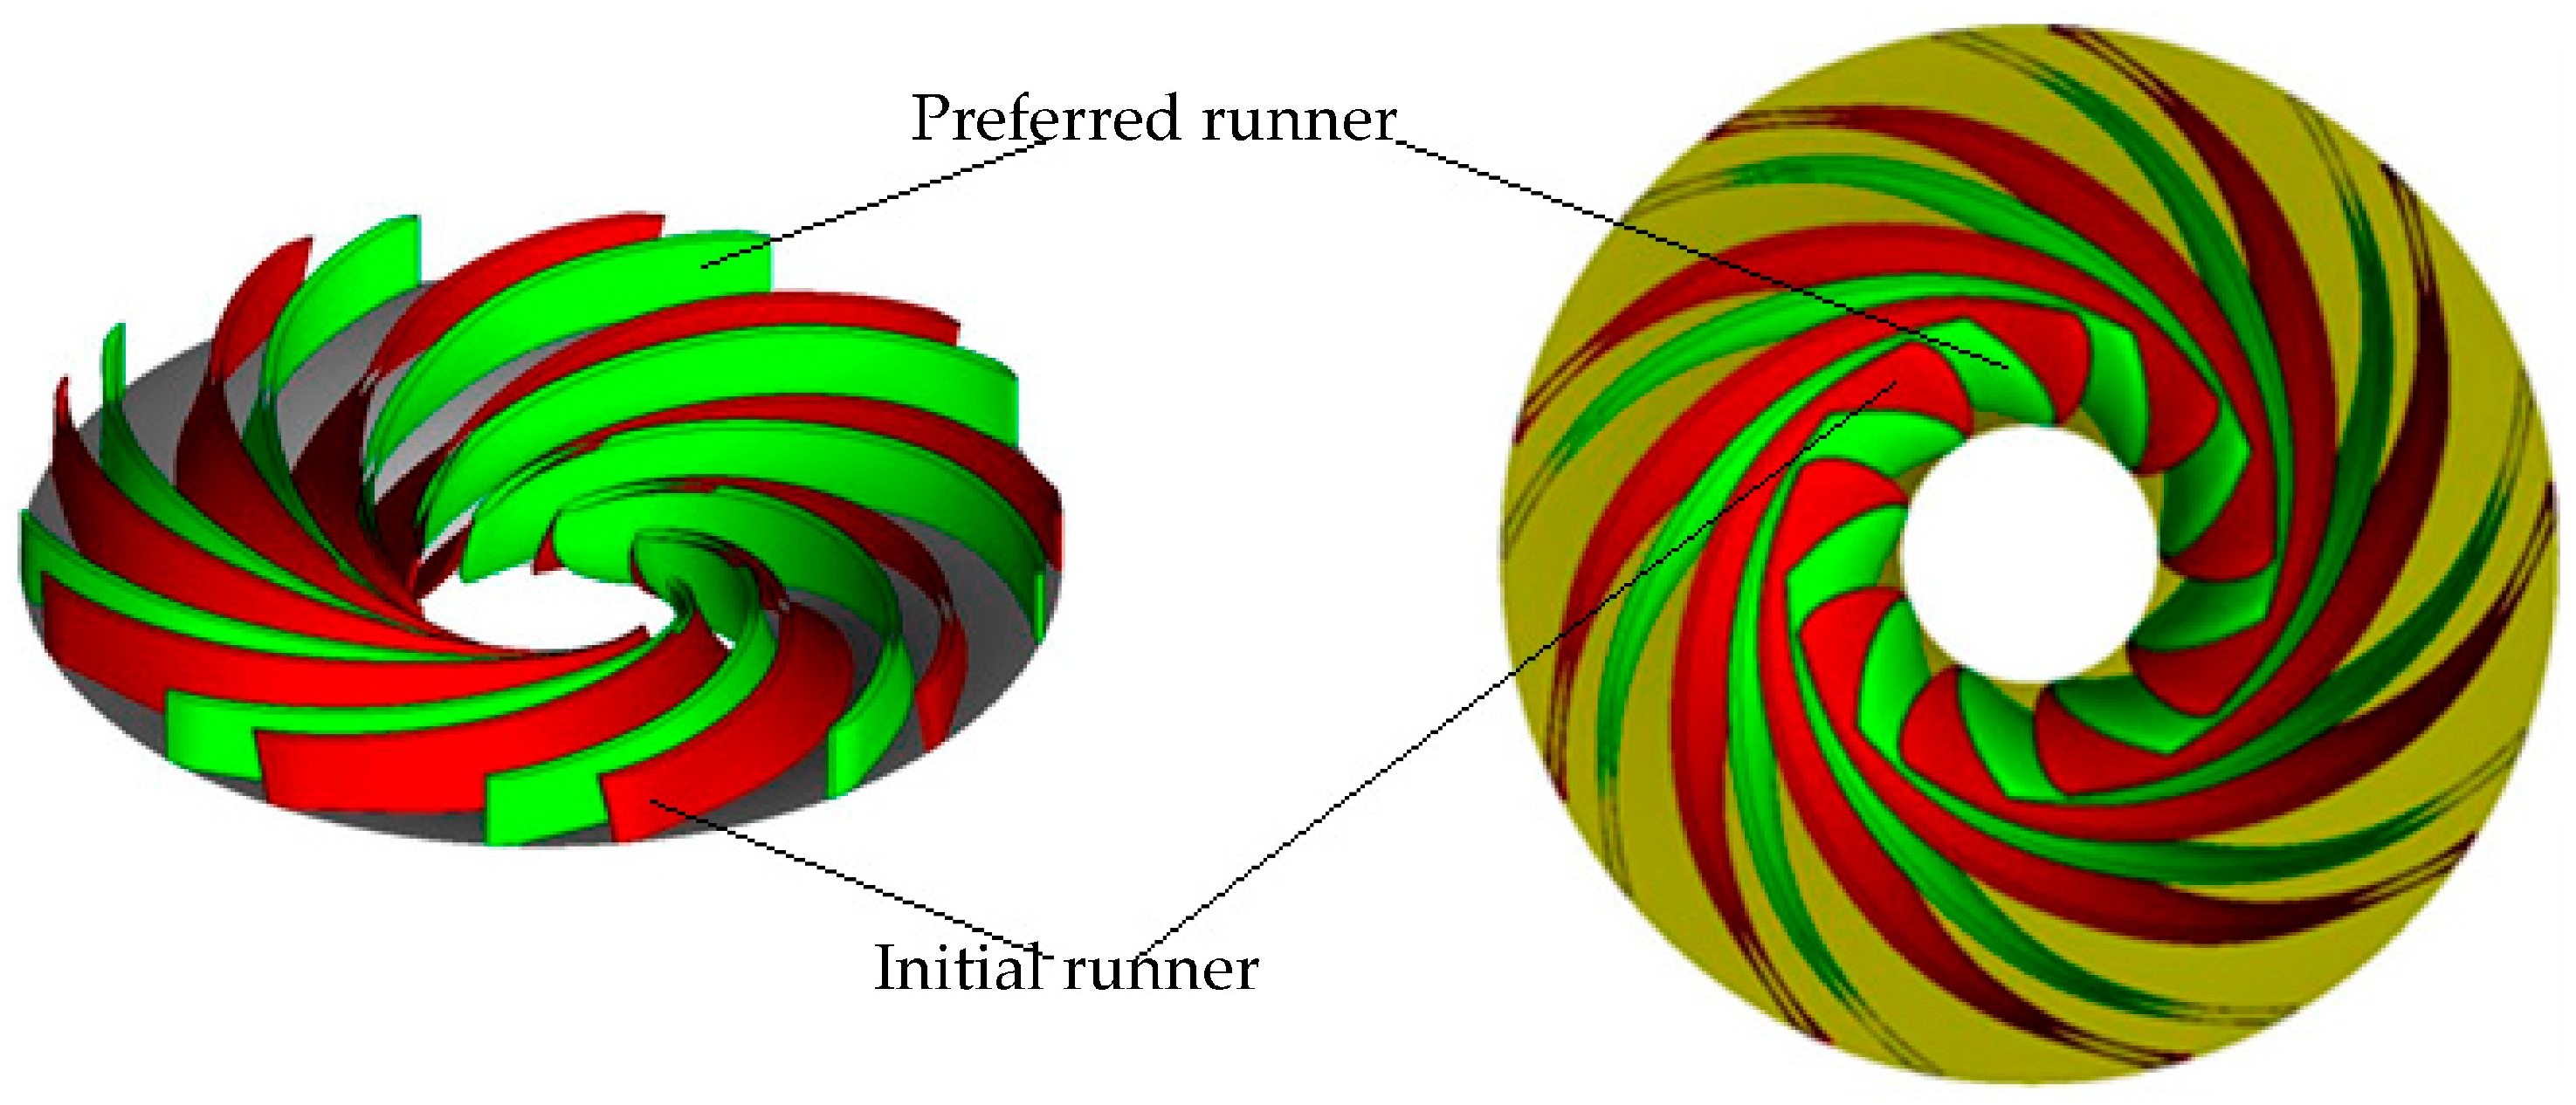
Figure 9.
Selected runners and Pareto front surface.

Figure 10.
Blade configuration comparisons.
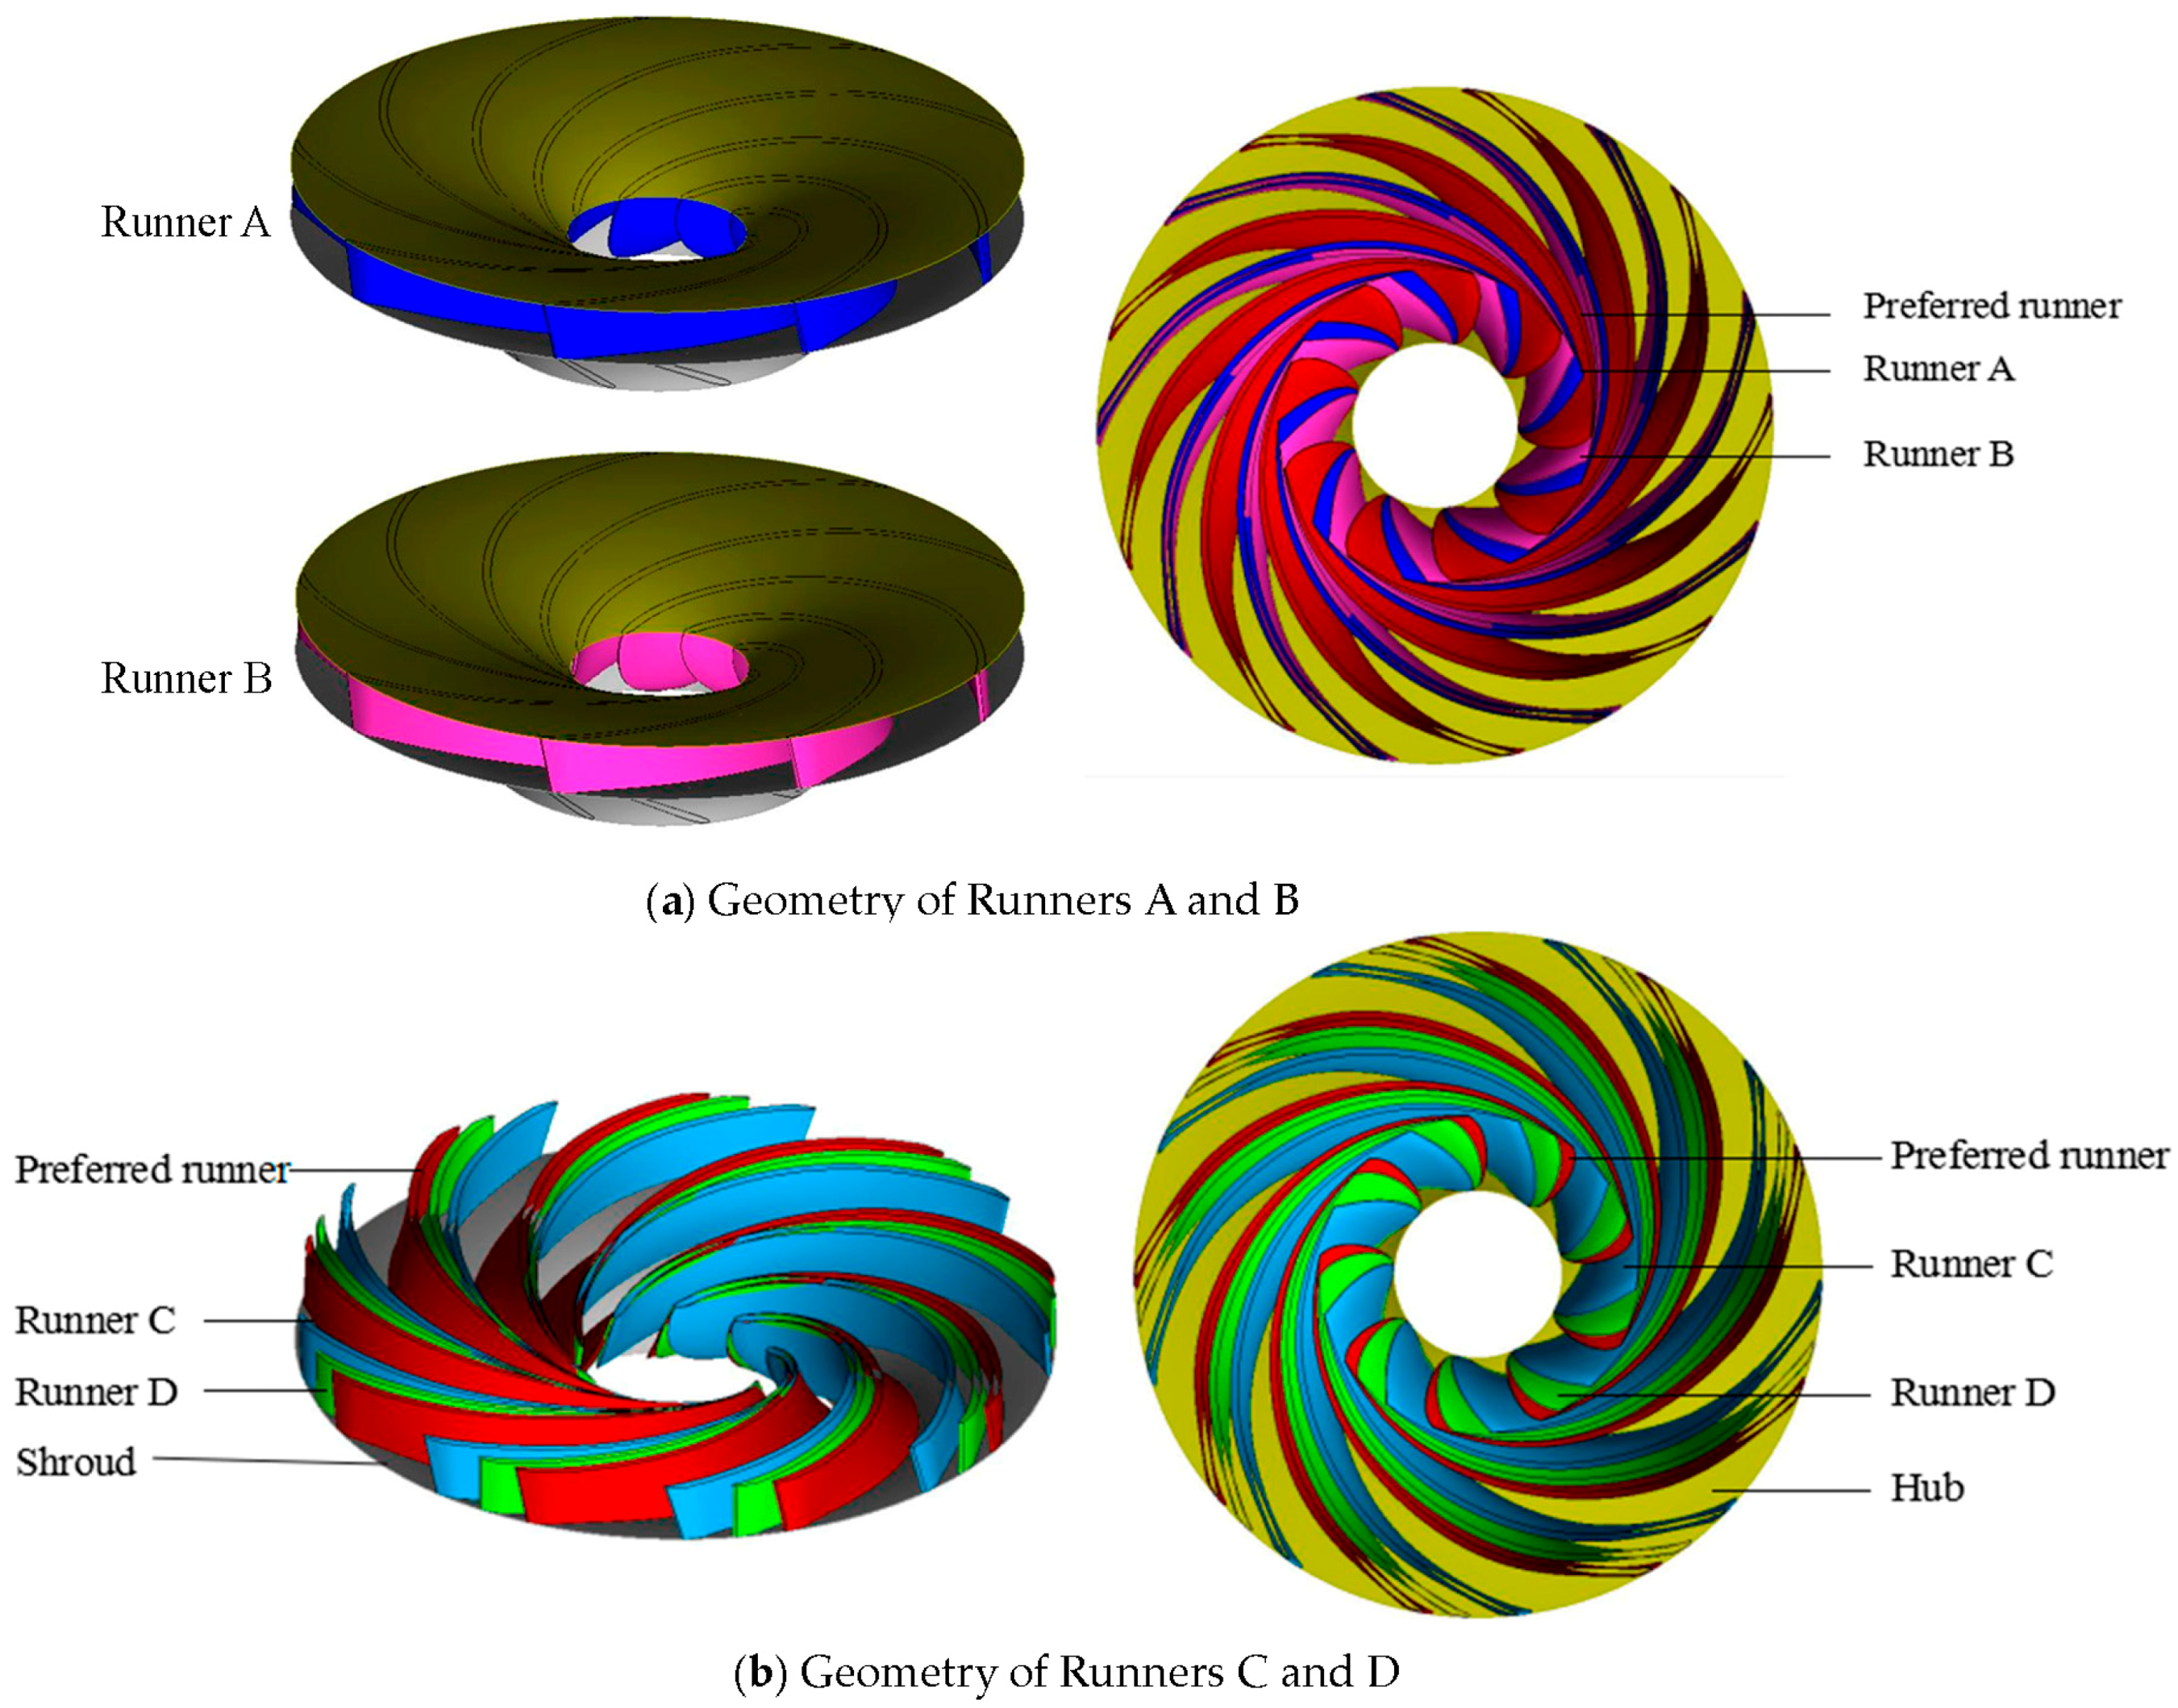
Figure 11.
Pressure distribution on suction surface for different runners.

Figure 12.
Blade loading distributions for runners A–D.
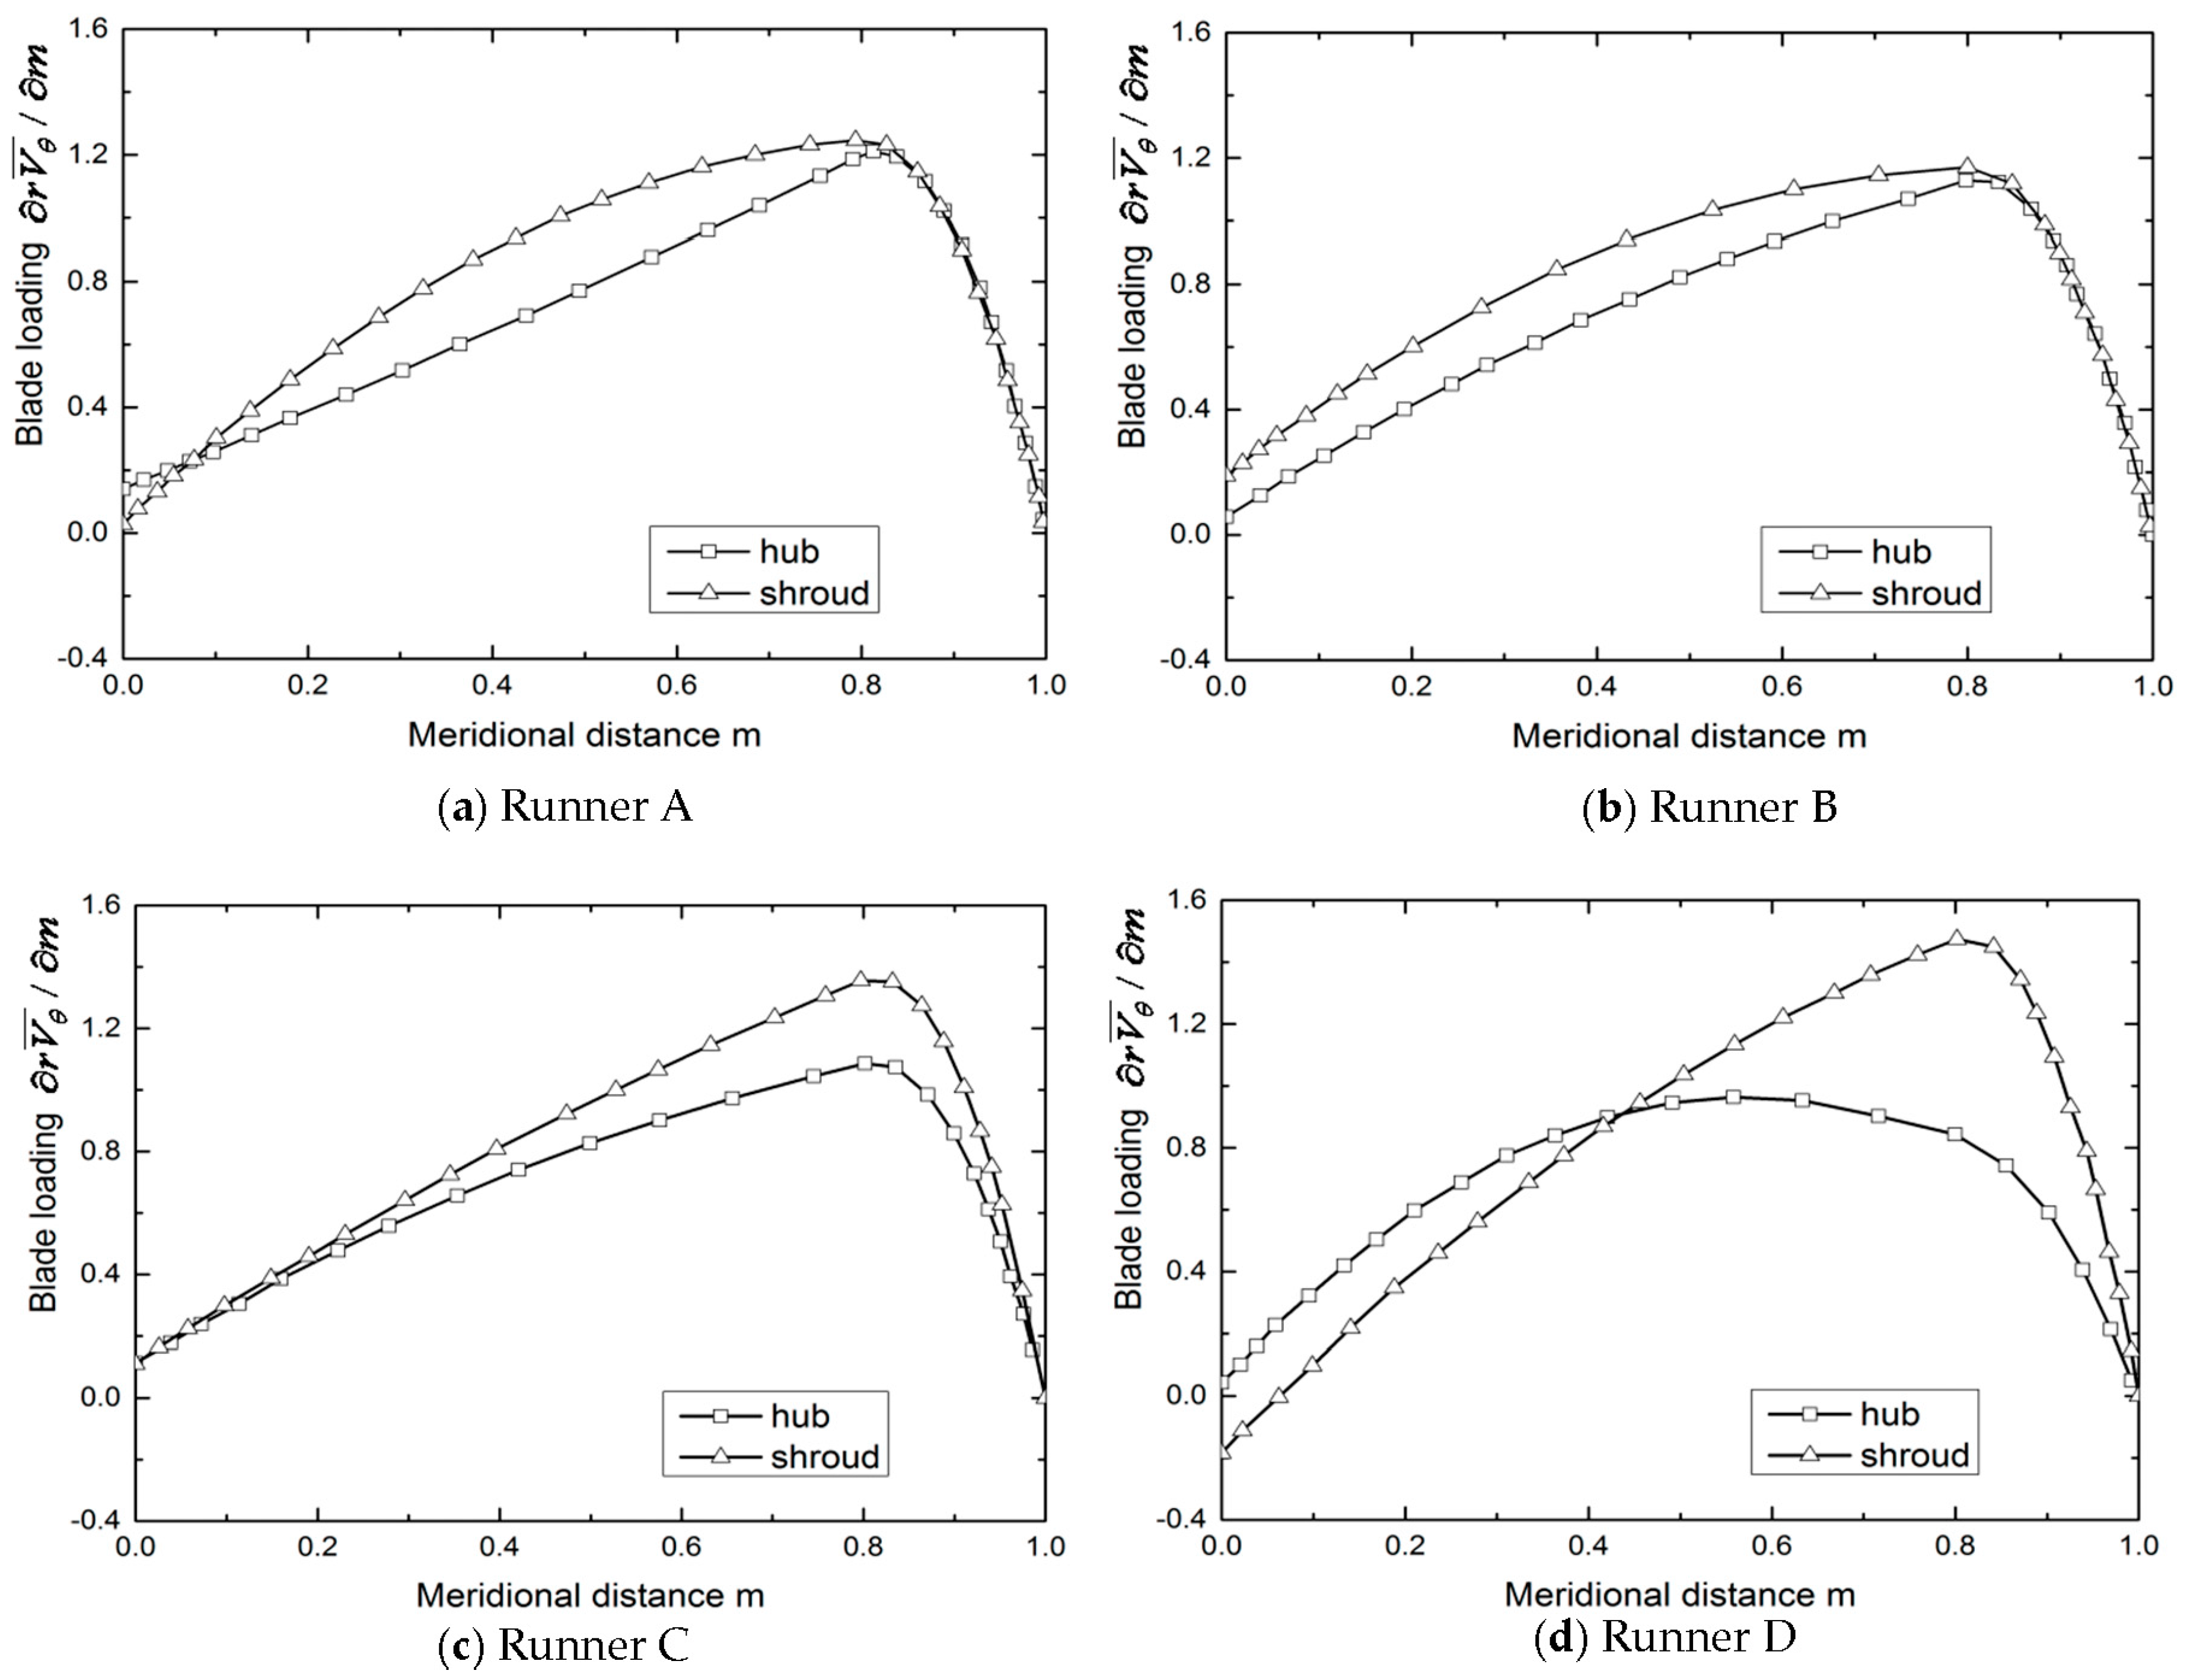
Figure 13.
Geometry comparison for runners E–H.


Table 1.
Design parameters of a model pump-turbine.
| Mode | /m | /m3 | /rpm |
|---|---|---|---|
| Pump | 59.40 | 0.284 | 1200 |
| Turbine | 59.31 | 0.305 | 1200 |
Table 2.
Geometric parameters for meridional blade shape
| Parameter | /m | /m | /m | /m |
|---|---|---|---|---|
| Value | 0.042 | 0.132 | 0.250 | 0.540 |
Table 3.
Variation range of input parameters.
| Optimized Inputs | Parameters | Range |
|---|---|---|
| Blade loading | ||
| Blade lean angle |
Table 4.
Parameter settings for NSGA-II.
| Parameters | Value |
|---|---|
| Population size | 100 |
| Number of generations | 100 |
| Crossover probability | 0.9 |
| Crossover distribution index | 10 |
| Mutation distribution index | 20 |
| Initialization mode | Random |
Table 5.
Comparison of the selected runners and the initial runner.
| Runner | Mode | Runner Efficiency /% | Low Pressure on Blade Surface /Pa | ||
|---|---|---|---|---|---|
| RSM | CFD | RSM | CFD | ||
| 1 | pump | 96.29 | 95.28 | −72,461.6 | −178,610 |
| turbine | 93.61 | 93.25 | - | - | |
| 2 | pump | 96.21 | 95.91 | −247,114.3 | −282,009 |
| turbine | 93.94 | 93.04 | - | - | |
| 3 | pump | 96.47 | 95.66 | −302,416.2 | −276,037 |
| turbine | 94.16 | 93.42 | - | - | |
| 4 (Preferred runner) | pump | 96.31 | 96.43 | −248,645.4 | −263,678 |
| turbine | 94.02 | 93.14 | - | - | |
| Initial runner | pump | - | 95.86 | - | −326,890 |
| turbine | - | 92.45 | - | - | |
Table 6.
Design parameters and performances of the runners.
| Runner | Design Parameters | Performance | |||
|---|---|---|---|---|---|
| /o | /% | /% | /Pa | ||
| Initial runner | Figure 7a | 92.45 | 95.86 | −326,890 | |
| Preferred runner | Figure 7b | 93.14 | 96.43 | −263,678 | |
| A | Figure 12a | 93.09 | 95.53 | −286,616 | |
| B | Figure 12b | 92.82 | 95.89 | −282,646 | |
| C | Figure 12c | 93.15 | 95.88 | −388,540 | |
| D | Figure 12d | 93.34 | 96.10 | −230,361 | |
| E | Figure 7b | 93.96 | 95.96 | −336,242 | |
| F | Figure 7b | 94.08 | 96.45 | −341,955 | |
| G | Figure 7b | 92.97 | 96.03 | −360,081 | |
| H | Figure 7b | 93.14 | 95.41 | −405,167 | |
© 2017 by the authors. Licensee MDPI, Basel, Switzerland. This article is an open access article distributed under the terms and conditions of the Creative Commons Attribution (CC BY) license (http://creativecommons.org/licenses/by/4.0/).
Share and Cite
MDPI and ACS Style
Liu, L.; Zhu, B.; Bai, L.; Liu, X.; Zhao, Y. Parametric Design of an Ultrahigh-Head Pump-Turbine Runner Based on Multiobjective Optimization. Energies 2017, 10, 1169. https://doi.org/10.3390/en10081169
AMA Style
Liu L, Zhu B, Bai L, Liu X, Zhao Y. Parametric Design of an Ultrahigh-Head Pump-Turbine Runner Based on Multiobjective Optimization. Energies. 2017; 10(8):1169. https://doi.org/10.3390/en10081169
Chicago/Turabian StyleLiu, Linhai, Baoshan Zhu, Li Bai, Xiaobing Liu, and Yue Zhao. 2017. "Parametric Design of an Ultrahigh-Head Pump-Turbine Runner Based on Multiobjective Optimization" Energies 10, no. 8: 1169. https://doi.org/10.3390/en10081169
Note that from the first issue of 2016, this journal uses article numbers instead of page numbers. See further details here.