Pyrolysis Characteristics and Kinetics of Food Wastes


1
Division of Environmental and Plant Engineering, Korea Institute of Civil Engineering and Building Technology, 283 Goyangdae-ro, Ilsanseo-gu, Goyang-si-Gyeonggi-do 10223, Korea
2
Department of Chemical Engineering, Kangwon National University, 346 Joongang-ro, Samcheok, Gangwon-do 25913, Korea
*
Author to whom correspondence should be addressed.
Energies 2017, 10(8), 1191; https://doi.org/10.3390/en10081191
Submission received: 7 July 2017
/
Revised: 4 August 2017
/
Accepted: 8 August 2017
/
Published: 11 August 2017
Abstract
:Pyrolysis is an environmental friendly alternative method compared with incineration, and the least time-consuming and smallest infrastructure footprint method compared with bio-chemical and thermo-chemical conversion. Baseline data for the pyrolysis of food waste was obtained in a kinetic study of the thermal decompositions by thermogravimetric analysis. To simulate the difference in the types of food waste, the study was done using model compounds, such as cereals, meat, vegetable, and mixed food waste; the pyrolysis commenced at 150 °C for most food waste and the process terminated at 450 °C to 500 °C. Between one and three peaks were observed on a differential thermogravimetry (DTG) graph, depending on the type of waste being pyrolyzed, reflecting the difference in the time required for pyrolysis of different components of food waste to take place. Depending on the composition of each food, one or four peaks were found, and the pyrolysis patterns of carbohydrate, protein, fat, and cellulose were found. Activation energies and frequency factors were calculated from the rates of conversion, using differential equation analyses. The activation energy increased from 10 kJ/mol to 50 kJ/mol as conversions increased from the 10% to 90%, regardless of the food waste type. The activation energy was measured as 50 kJ/mol, with a slight variation among the type of the food waste. Due to the activation energy being low, food waste consists of carbohydrates and other substances rather than cellulose, hemicellulose, and lignin.
1. Introduction
Food waste refers to the waste produced by the agricultural, fishery, and livestock industries, during production, transportation, processing, and cooking. Worldwide, about 1.3 billion tons of food are lost annually during harvesting, storage, and transportation, or disposed of as waste, and richer countries tend to discard more food than they eat. In developed countries, about 100 kg of food waste per person is discarded annually [1,2].
In Korea, food waste, which is discarded indiscriminately due to the increase of wasteful factors, such as rich table settings, Korean stock culture, increase in population, improvement of living conditions, and the high quality of food, has been recognized as a new environmental problem [3,4,5].
Food waste is mainly composed of organic materials. Many disposal methods for organic wastes have been developed, including composting, conversion into feeds, anaerobic digestion, combustion, incineration, and landfilling. However, all of methods result in environmental pollution. For example, landfill requires many treatment sites and generates leachate. Composting can cause secondary contamination by heavy metals or organic matter. Heat treatments cause air pollution and generate ash [6,7]. Recently, various methods have been studied for food waste utilization. Sakuragi et al. investigated the bio-oil yield from coffee grounds and soybean by liquefied dimethyl ether [8], and Hao et al. studied the bio-refining method to produce biofuels from carbohydrate-rich food waste [9]. These methods are environmentally friendly, but the biological reaction is a time-consuming task.
Accordingly, new methods for the disposal of food waste are urgently required. Pyrolysis is one of these conversion methods. It can decompose the polymeric hydrocarbon materials into small hydrocarbons, concentrate heavy metals (except mercury and cadmium), and convert and store energy. It can also be used to recycle energy by converting organic materials, and the processing time is relatively short [10,11].
Pyrolysis is influenced by temperature, environment, and the nature of the biomass [12]. Kabir, et al. investigated pyrolysis characteristics’ numerical prediction [13]. The result is quite reasonable compared with experiments, but still had a variation of about 5–15%. Therefore, each specific biomass requires compatible research. Some preliminary studies into the pyrolysis of organic waste have already been conducted [14,15,16]. Vamvuka et al. investigated pyrolysis characteristics and kinetics in terms of particle size and heating rate for biomass residues in mixtures with lignite [17], and Zambon et al. studied physicochemical characteristics with olive- and hazelnut-derived biochar produced by pyrolysis [18]. Kim and Agblevor compared heating rates in the pyrolysis of chicken litter and analyzed the decomposition process [19]. Sorum et al. investigated the thermal decomposition properties and kinetics of composite materials, such as cellulose, plastics, and juice cartons [20], and many researchers have reported the kinetics of pyrolysis reactions on sewage sludge. Conesa et al. studied the kinetics of the pyrolysis of sewage sludge [21], and Othman et al. investigated the thermogravimetric characteristics and pyrolysis kinetics of sewage sludge [22]. Nowicki et al. studied the kinetics of gasification of char derived from sewage sludge [23], and several researchers examined the characteristics of pyrolysis and kinetics under various conditions [24,25,26].
However, because of the large variation in experimental equipment and conditions, research data or basic data on its properties are insufficient and no research on pyrolysis has been conducted despite its high energy content and favorable conditions for pyrolysis and gasification.
Therefore, in this study, the research has been carried out to convert food waste into biofuel through pyrolysis and the thermal properties and kinetic parameters of pyrolysis of food waste were investigated. Thermogravimetry was used to investigate the reaction mechanism through the acquisition of a relative kinetic response. Based on this, we will provide basic data for the design and operation of the pyrolysis process of food waste.
2. Experimental
2.1. Sample Preparation
The food wastes used in this study were classified as cereals, meats, and vegetables. The samples used were dried and then pulverized. It should be recognized that actual garbage composition varies widely, depending on the area and type of residence.
2.1.1. Cereals
Various grains of cereal are cultivated in Korea. According to the Food Consumption Behavior Survey (2015), 40.1% of multigrain rice and 30.5% of white rice are consumed depending on the household, and various kinds of grains are consumed such as rice, barley, brown rice, black rice, etc. [23]. In this experiment, instant rice was chosen as the representative cereal.
2.1.2. Meat
Meat consumption is increasing in Korea. It was estimated that in 2016, more than 40 kg per person was consumed, on average. As more pork was consumed than any other type of meat, it was selected for the experiments.
2.1.3. Fruits and Vegetables
Consumption of fruits and vegetables in Korea is steadily declining, but consumption of the five most consumed vegetables (cabbage, radish, garlic, red pepper, and onion) was 123.5 kg per person in 2015, and consumption of the six most consumed fruits (apples, pears, tangerines, persimmons, grapes, and peaches) was 43.7 kg [27]. In this study, Chinese cabbage was chosen as the representative vegetable.
2.1.4. Mixed Food
2.2. Characterization Analysis of Model Compounds
The percentage moisture of the food wastes samples was determined by weighing 100 g of the sample into a pan which its weight was known before using it. The sample was then dried at the temperature of 100 °C and according to ASTM (American Society for Testing and Materials) D3173 standards. The percentage moisture content was calculated according to the Equation (1):
The samples prepared to find the moisture content of the wastes above was also used to determine the volatile matter content. This was done by igniting the sample at 950 °C. The samples were weighed and placed in a furnace for about 6 min at a temperature of 950 °C according to ASTM D3175. After combustion, the samples were weighed to determine the ash dry weight. At this stage the volatile matters were calculated according to the Equation (2):
Ash content of the wastes is the non-combustible residue left after the waste is burnt. Fixed carbon is the residue or char remaining after evolves of volatile matters. The sample was dried at a temperature of 700 °C. In this, fixed carbon was determined by removing the mass of volatiles from the original mass of the sample according to the Equation (3):
Elemental content of food wastes were measured by elemental analysis (2400 Series II CHNS/O, PerkinElmer, Boston, MA, USA), and the higher heating value (HHV) was measured by a calorimeter (6400 Automatic Isoperibol Calorimeter, Parr, Moline, IL, USA).
2.3. Thermogravimetic Analysis
The pyrolysis of the food waste was undertaken in a thermogravimetric analyzer (TGA, Q50, TA Instrument, New Castle, DE, USA), under a nitrogen atmosphere. Before each run, nitrogen was introduced into the thermogravimetric analyzer to ensure an inert atmosphere, and its flow rate was kept at 100 mL/min. Then, about 10 mg dried food waste samples were heated from 30 to 800 °C at the heating rates of 5 °C/min, 10 °C/min, 15 °C/min, and 20 °C/min. All samples were used dry to obtain reliable data for TGA analyses.
2.4. Pyrolysis Activation Energy Calculation
TGA devices continuously measure mass change as a function of temperature, and are widely used in reaction rate studies when analysis of reaction products is difficult. Although many methods of kinetic models, such as Friedman, Kissinger–Akahira–Sunose method, Coasta Redfern, and Flyn-Ozawa, were used, this study chose the Friedman method as the most commonly used model the for non-isothermal TGA analysis method. The Friedman method can rule out the potential of an activation energy value error based on the assumptions of the reaction model, and can obtain kinetic variables from the TGA result of the multi-heating rate. From the shape of the curve obtained from thermogravimetric analysis, activation energy, order of reaction, and the specific reaction rate can be calculated [11,12].
The conversion of the pyrolysis (Conversion, X) is based on the increase in the temperature in TGA and is defined in Equation (4):
where W0, W, and W∞ are the weight of the sample used in the experiment; the weight of the pyrolyzed sample at a certain temperature; and the weight of the sample after termination of the reaction in thermogravimetric analysis, respectively.
In the pyrolysis reaction, the conversion rate dX/dt is expressed by the following Equation (5):
The reaction rate constant k can be represented as Equation (6) by the Arrhenius equation, showing the temperature dependence:
The temperature independent conversion function f(X), can be expressed as Equations (5) and (7):
Equations (6) and (7) are substituted into Equation (2) and can be expressed as Equation (8):
Using logarithms, (8) can be expressed as Equation (9):
From here, A represents the frequency factor (min−1); n represents the reaction order; E represents the activation energy (kJ/mol); T represents the temperature (K); t represents the time (min); and X represents the conversion rate.
The activation energy (E) can be obtained at a fixed conversion rate using the relationship between ln(dX/dt) and 1/T from Equation (9). The intercept value of Equation (9) can be expressed as Equation (10), and it is possible to obtain the frequency factor by fixing the order of reaction at a fixed conversion rate using this equation:
3. Result and Discussion
Thermogravimetric analysis has been widely used to evaluate the thermal stability of polymeric materials for decades. Depending on the shape of the TG curve, activation energies, Arrhenius frequency factors, reaction sequences, and kinetic pyrolysis parameters can be calculated.
In this study, we attempted to calculate the independent parallel first-order reaction model for each food waste in mixed food waste by Korean experiment standards.
3.1. Characterization of Model Compounds
The physical and chemical properties of the food wastes used in the experiment are shown in Table 2. Most of the mass of the food waste is moisture, but when this is removed by drying, 65~80% of the waste is composed of organic material and 8.7~16.9% of fixed carbon is contained. This means that it can be utilized for the conversion into solid fuel and energy recycling through pyrolysis treatment.
3.2. Thermal Decomposition Characteristics
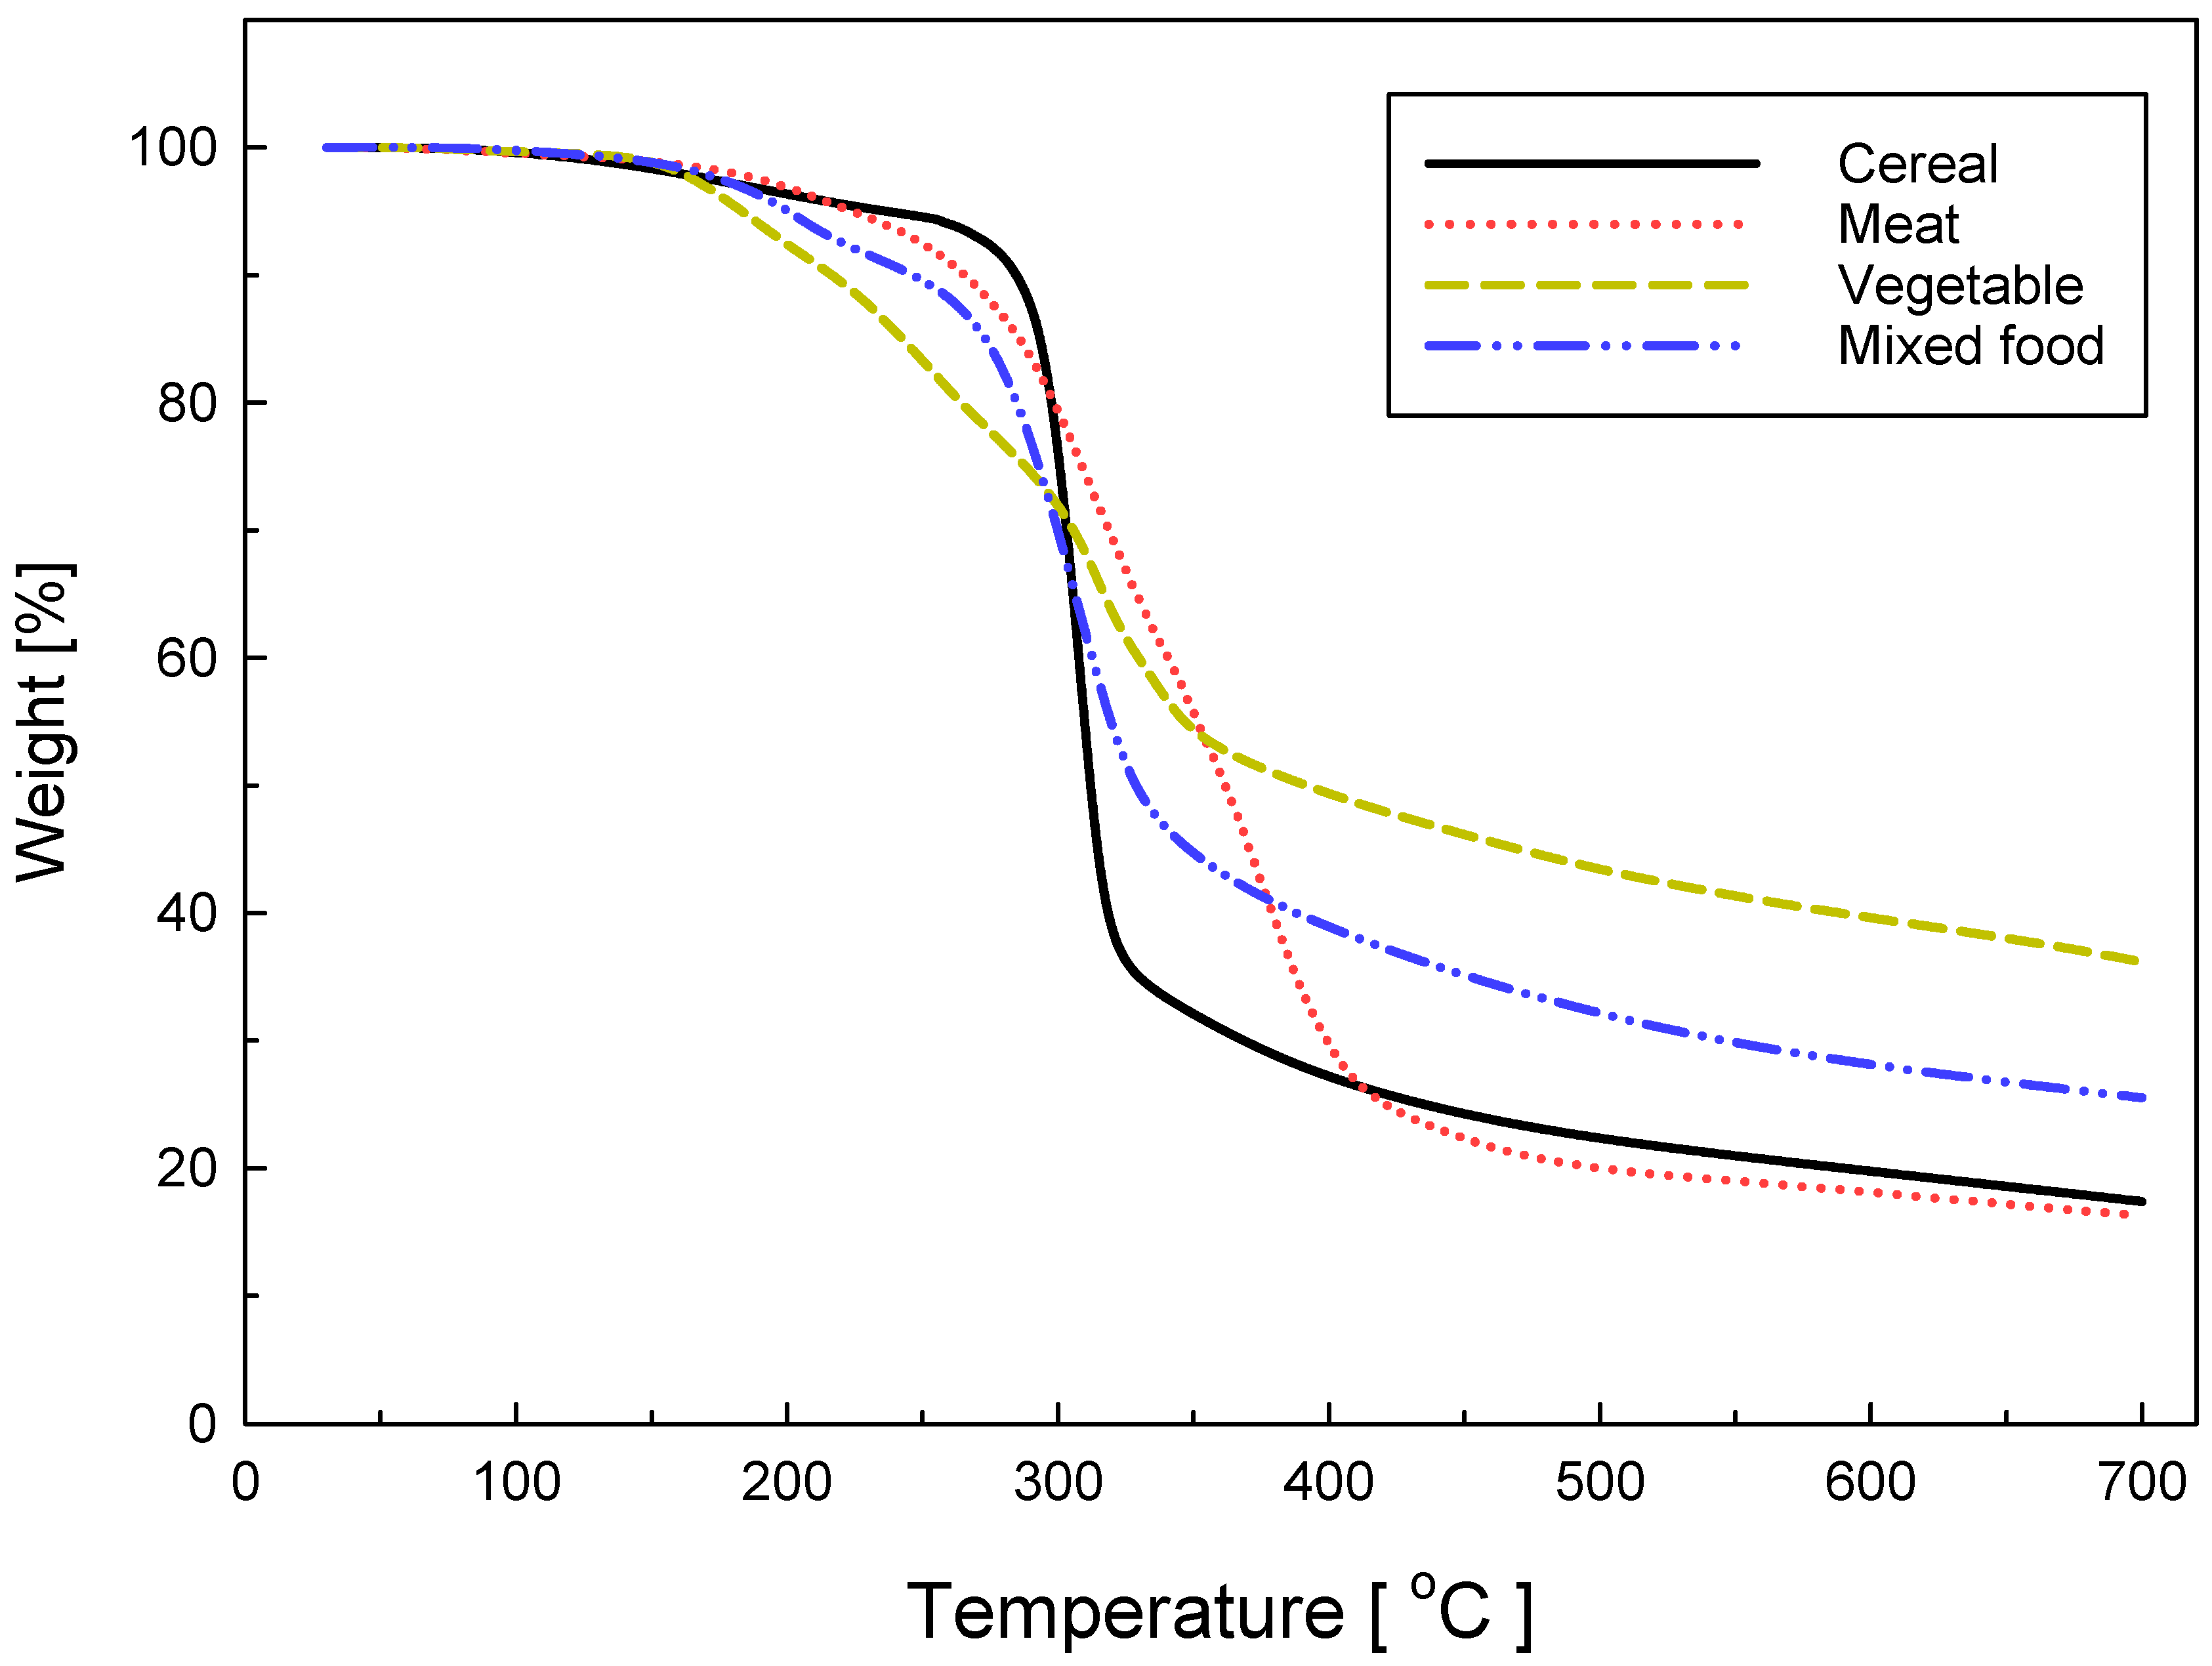
Figure 1 shows the TGA curves of cereal, meat, vegetables, and mixed food with heating rate 5 °C/min. Each sample is represented by different patterns of decomposition. The TG and DTG curves of rice are plotted in Figure 2 with heating rates of 5 °C/min, 10 °C/min, 15 °C/min, and 20 °C/min, respectively. Pyrolysis started at about 250 °C; the bulk of the pyrolysis process took place at 308, 325, 345, and 366 °C with an increasing heating rate, and the main reaction was terminated at about 400 °C. One peak appears in the DTG, which is caused by the decomposition of the carbohydrate, which forms more than 90% of the original material.
In the case of meat, pyrolysis began at about 200 °C; the bulk of the pyrolysis occurred at 311, 336, 362, and 376 °C with a variation of the heating rate from 5 °C to 20 °C, respectively, and once again at 375, 399, 427, and 446 °C as represented in Figure 3. Most of the reaction had concluded by 500 °C. Two peaks appear in the DTG curve presumably because meat consists of protein (about 65%) and fat (about 35%); the two peaks reflect the different pyrolysis rates of these two components.
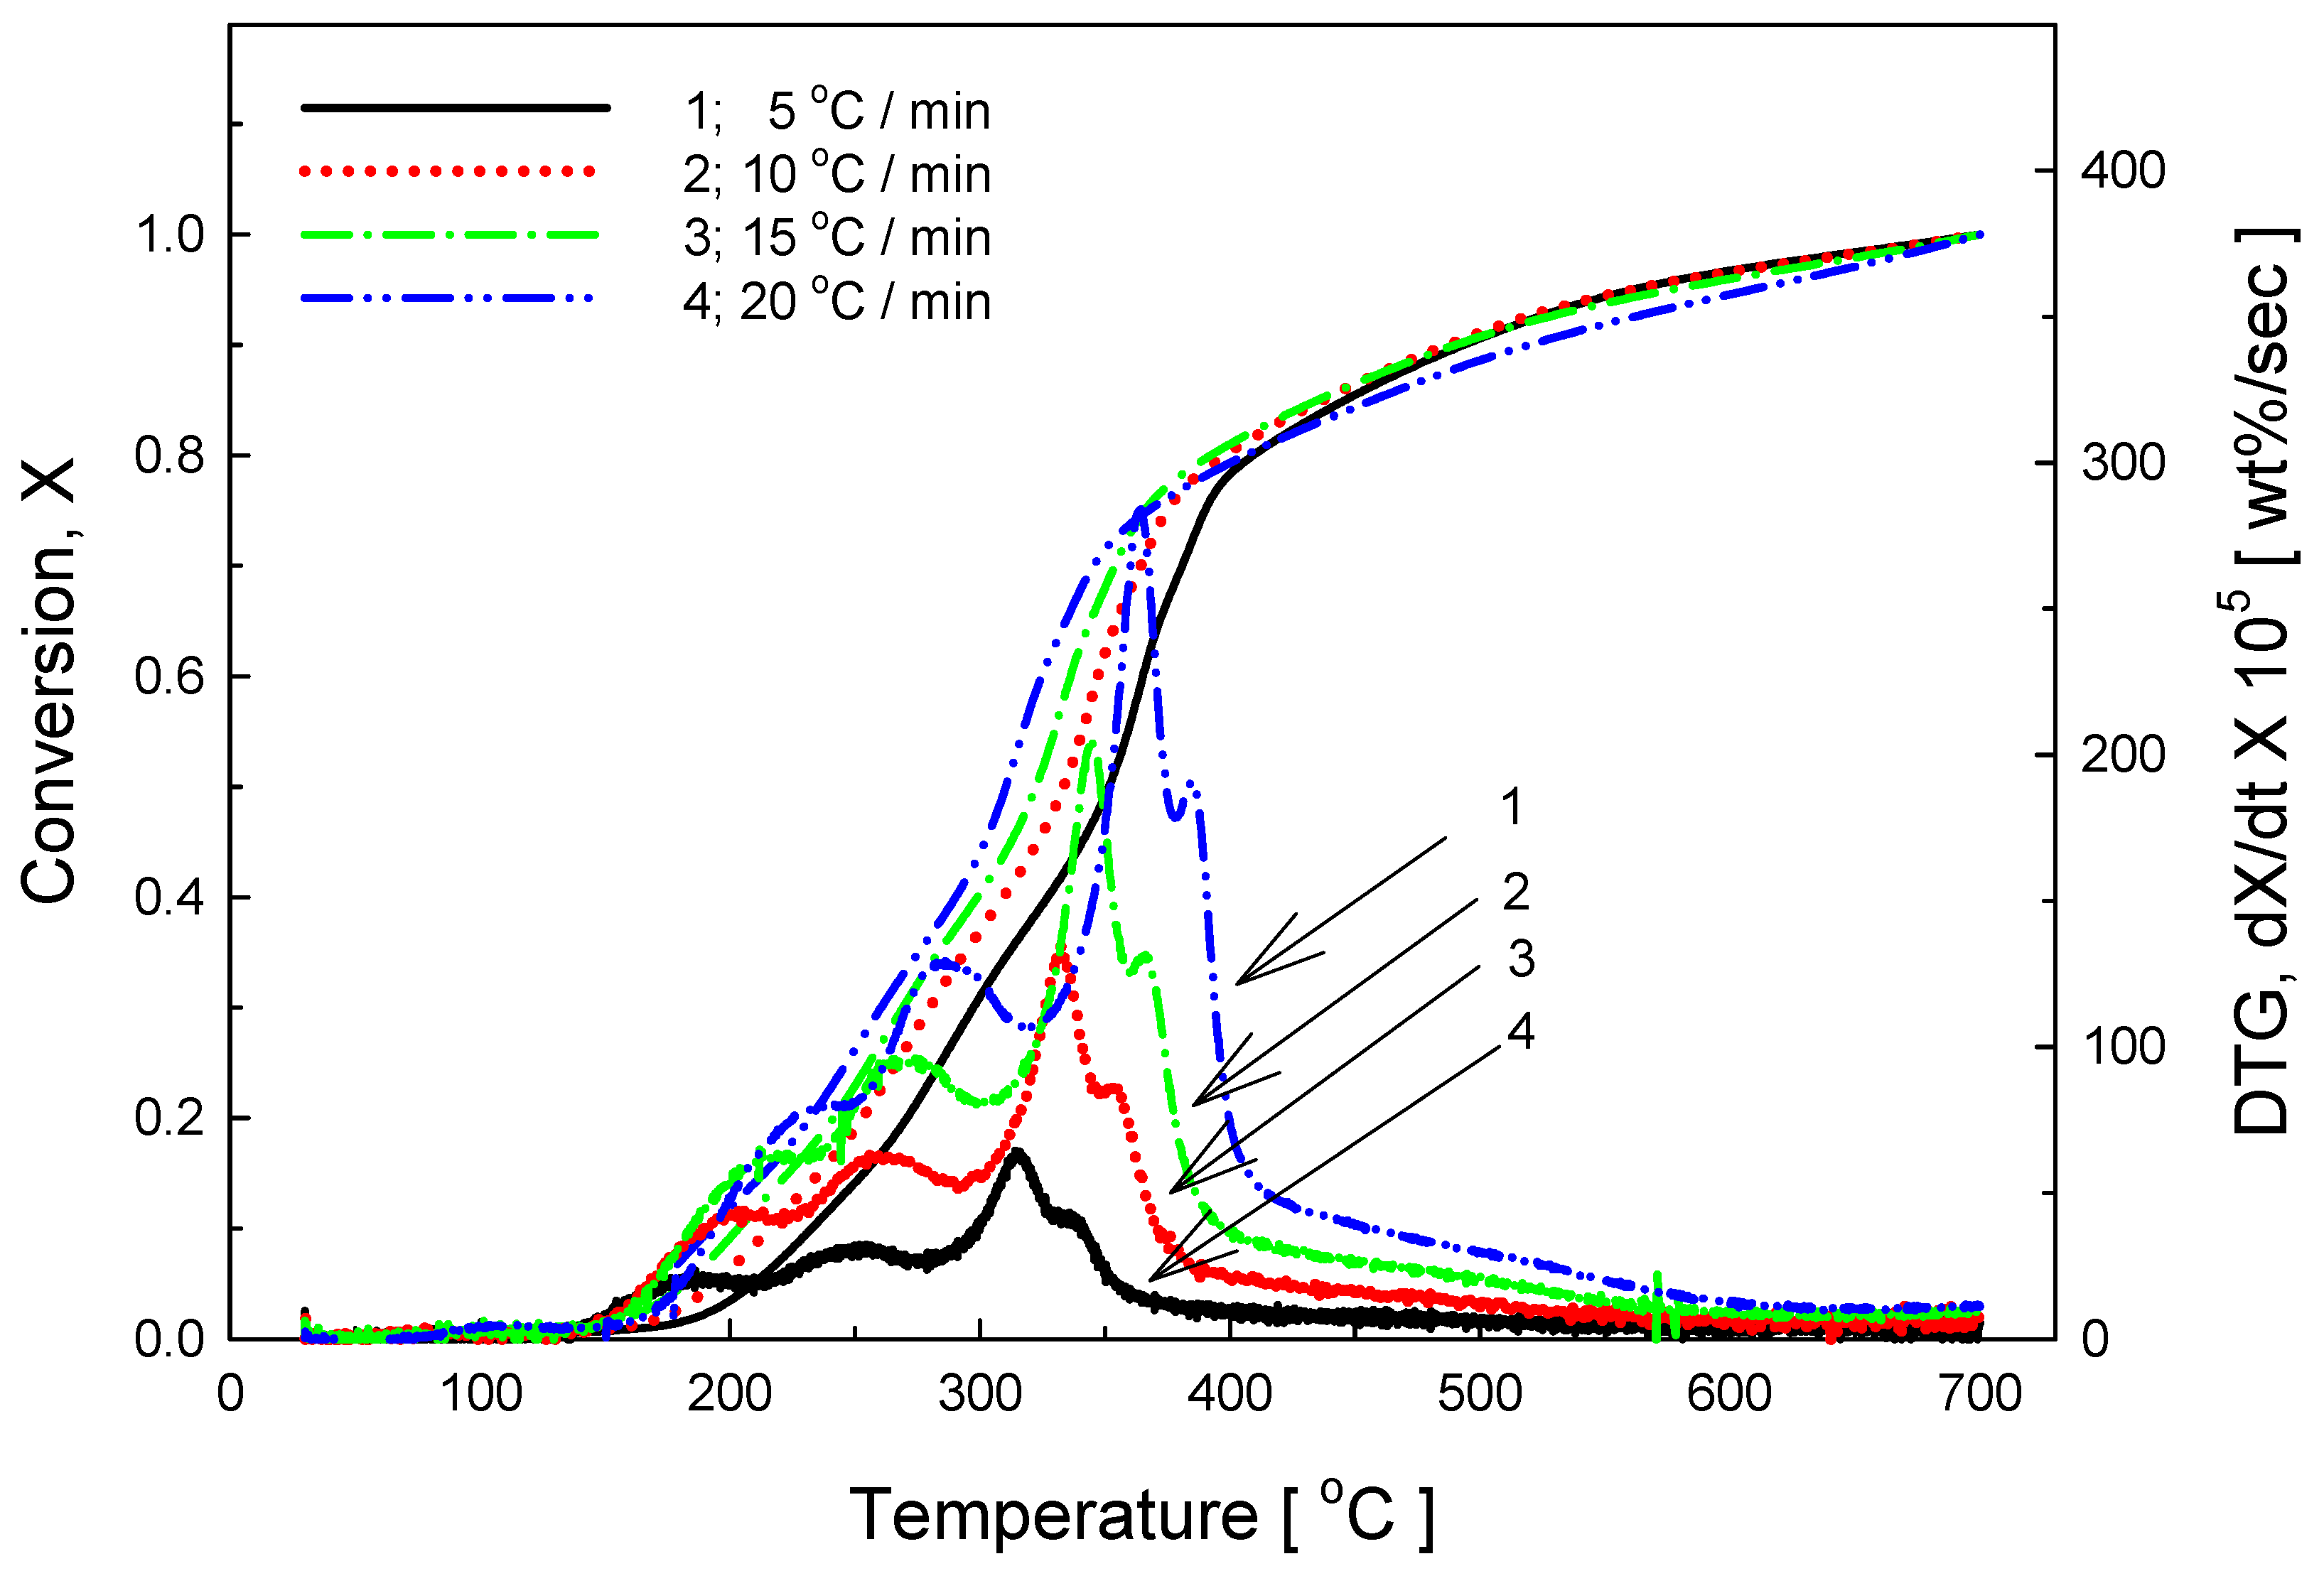
In the case of vegetables (Figure 4), pyrolysis started at a relatively low temperature (about 160 °C) compared to other materials. The most active pyrolysis occurred at 320 °C to 360 °C, after which it diminished. DTG curves show several peaks, in contrast to those for the other items tested, perhaps due to the differences in pyrolysis rate of the different fibers in vegetables, such as hemicellulose (about 300 °C), cellulose (320–380 °C), and lignin (200–500 °C) [17].
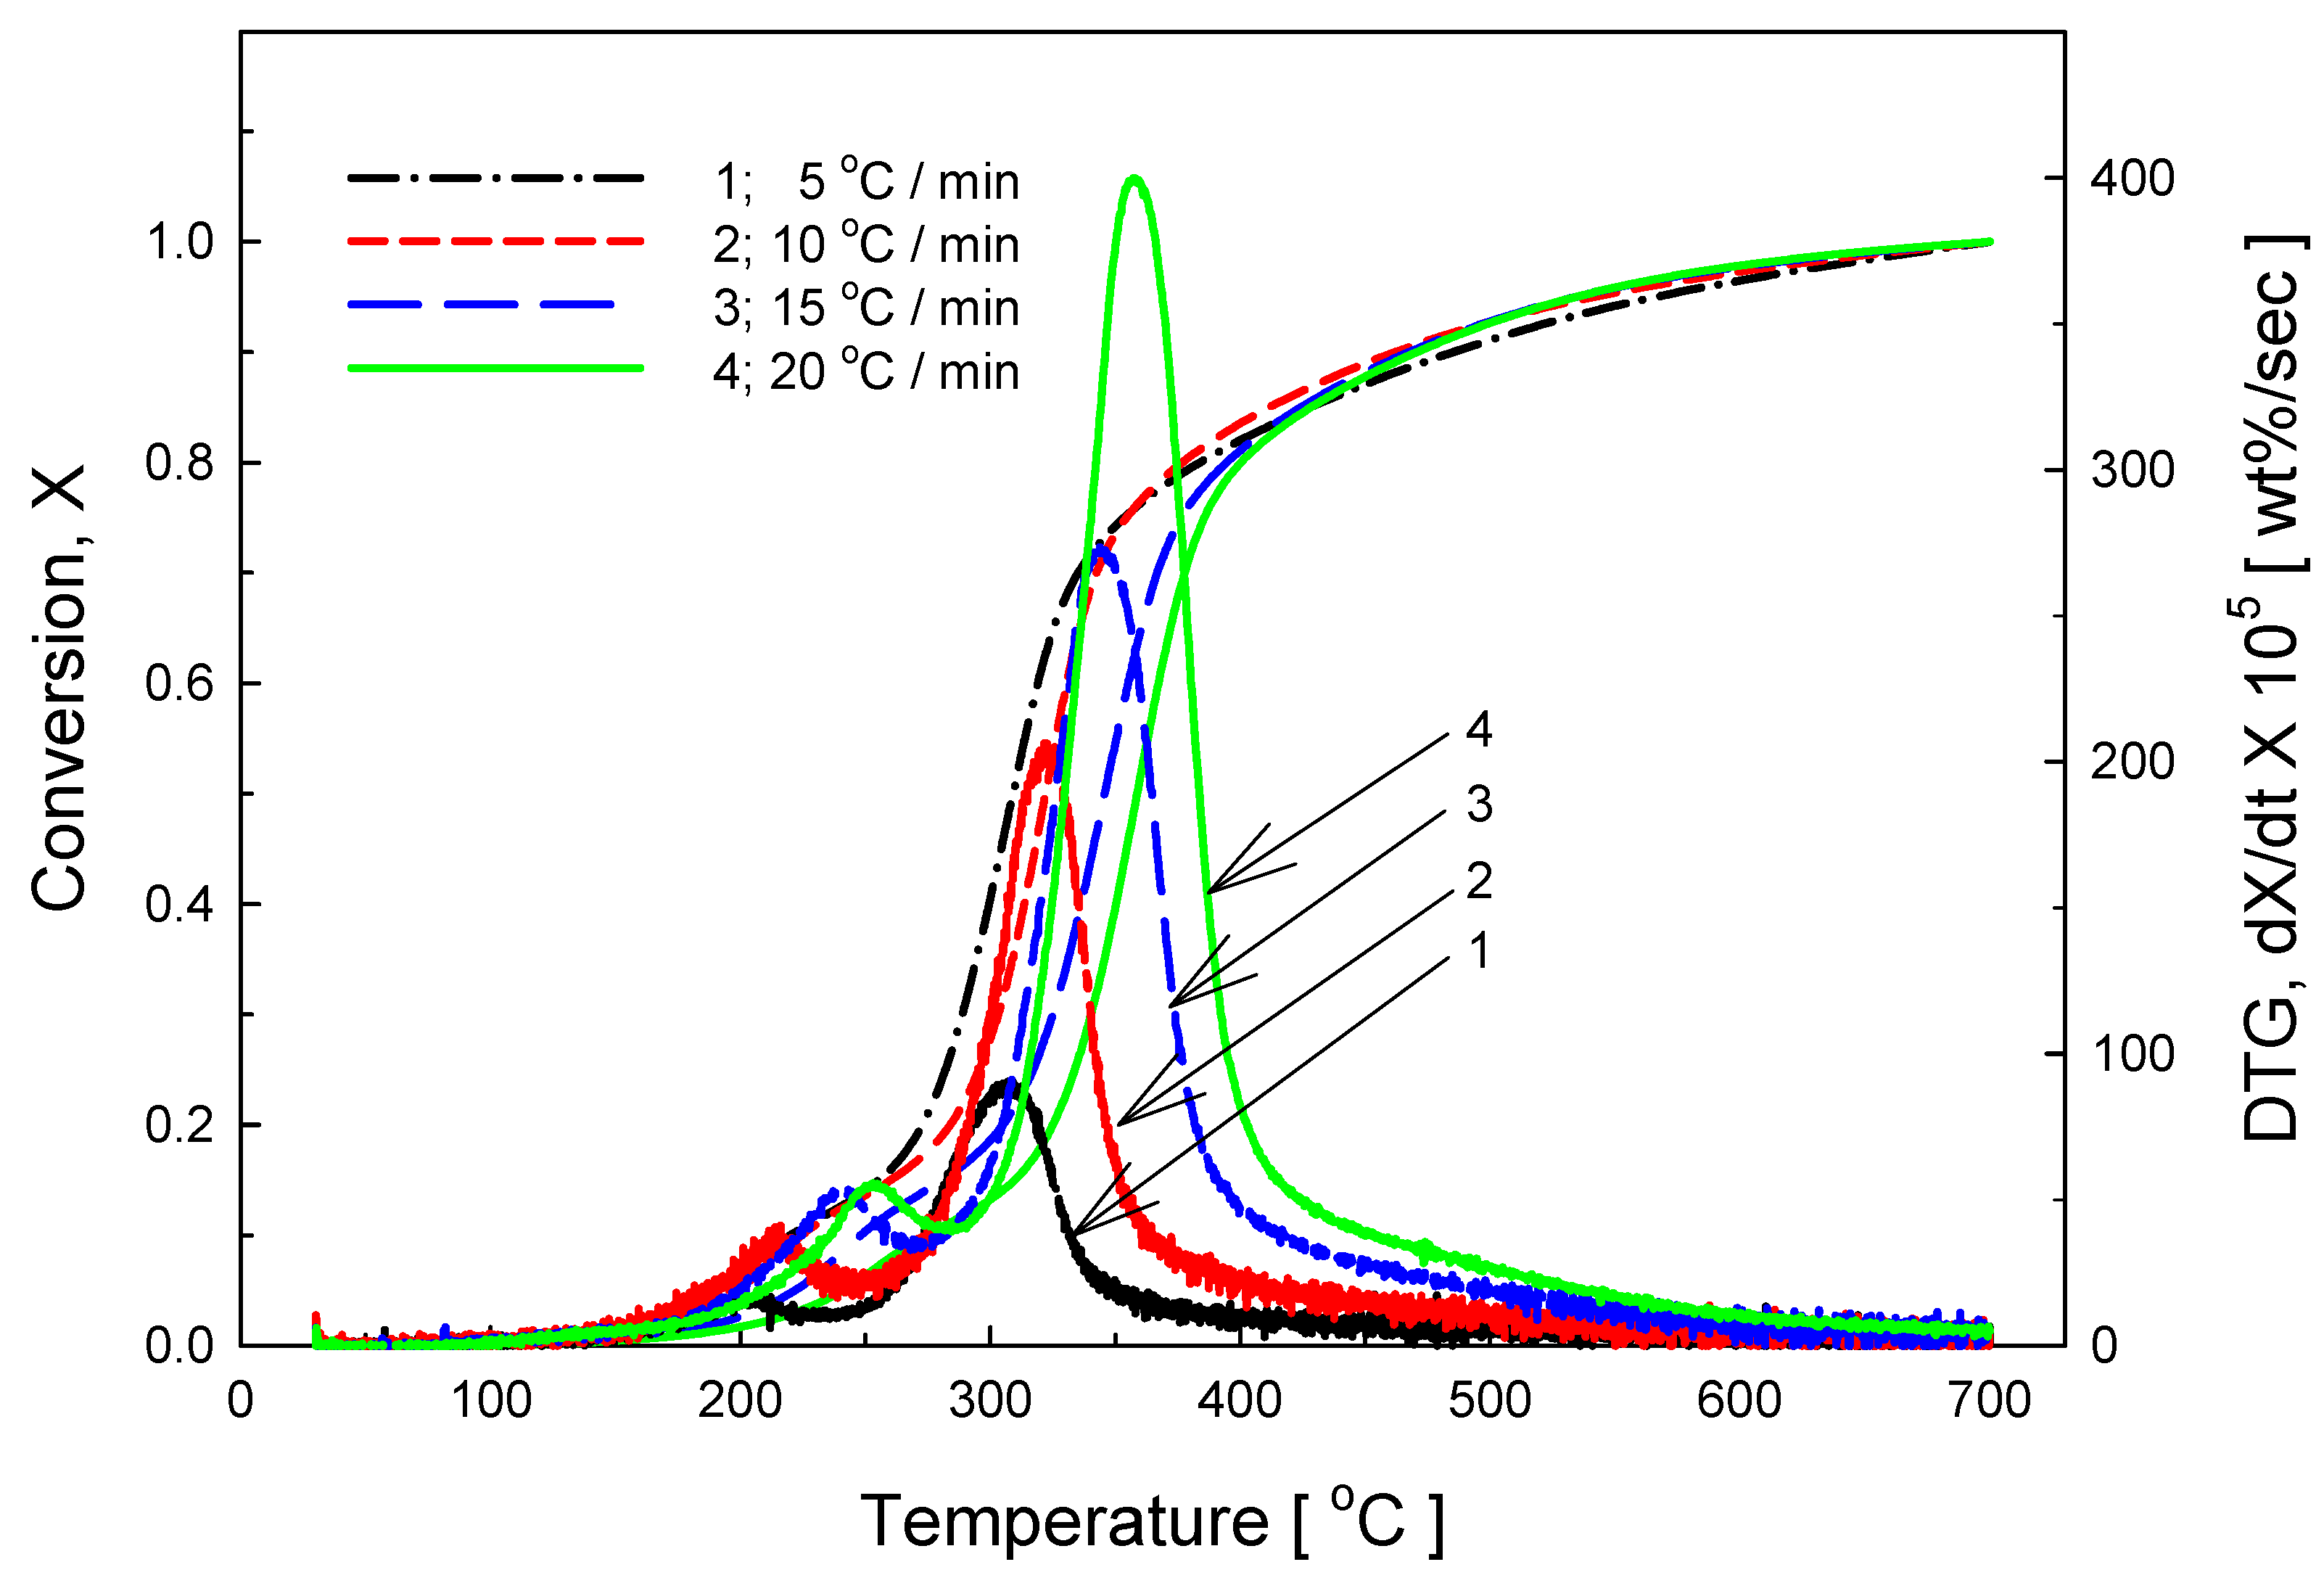
In the case of mixed food (Figure 5), pyrolysis started at about 150 °C and the most active pyrolysis occurs at 300–360 °C because various materials are mixed together. In the case of mixed foods, two peaks appear in the DTG curve, reflecting the fact that vegetable pyrolysis takes place at a lower temperature than pyrolysis of cereal and meat.
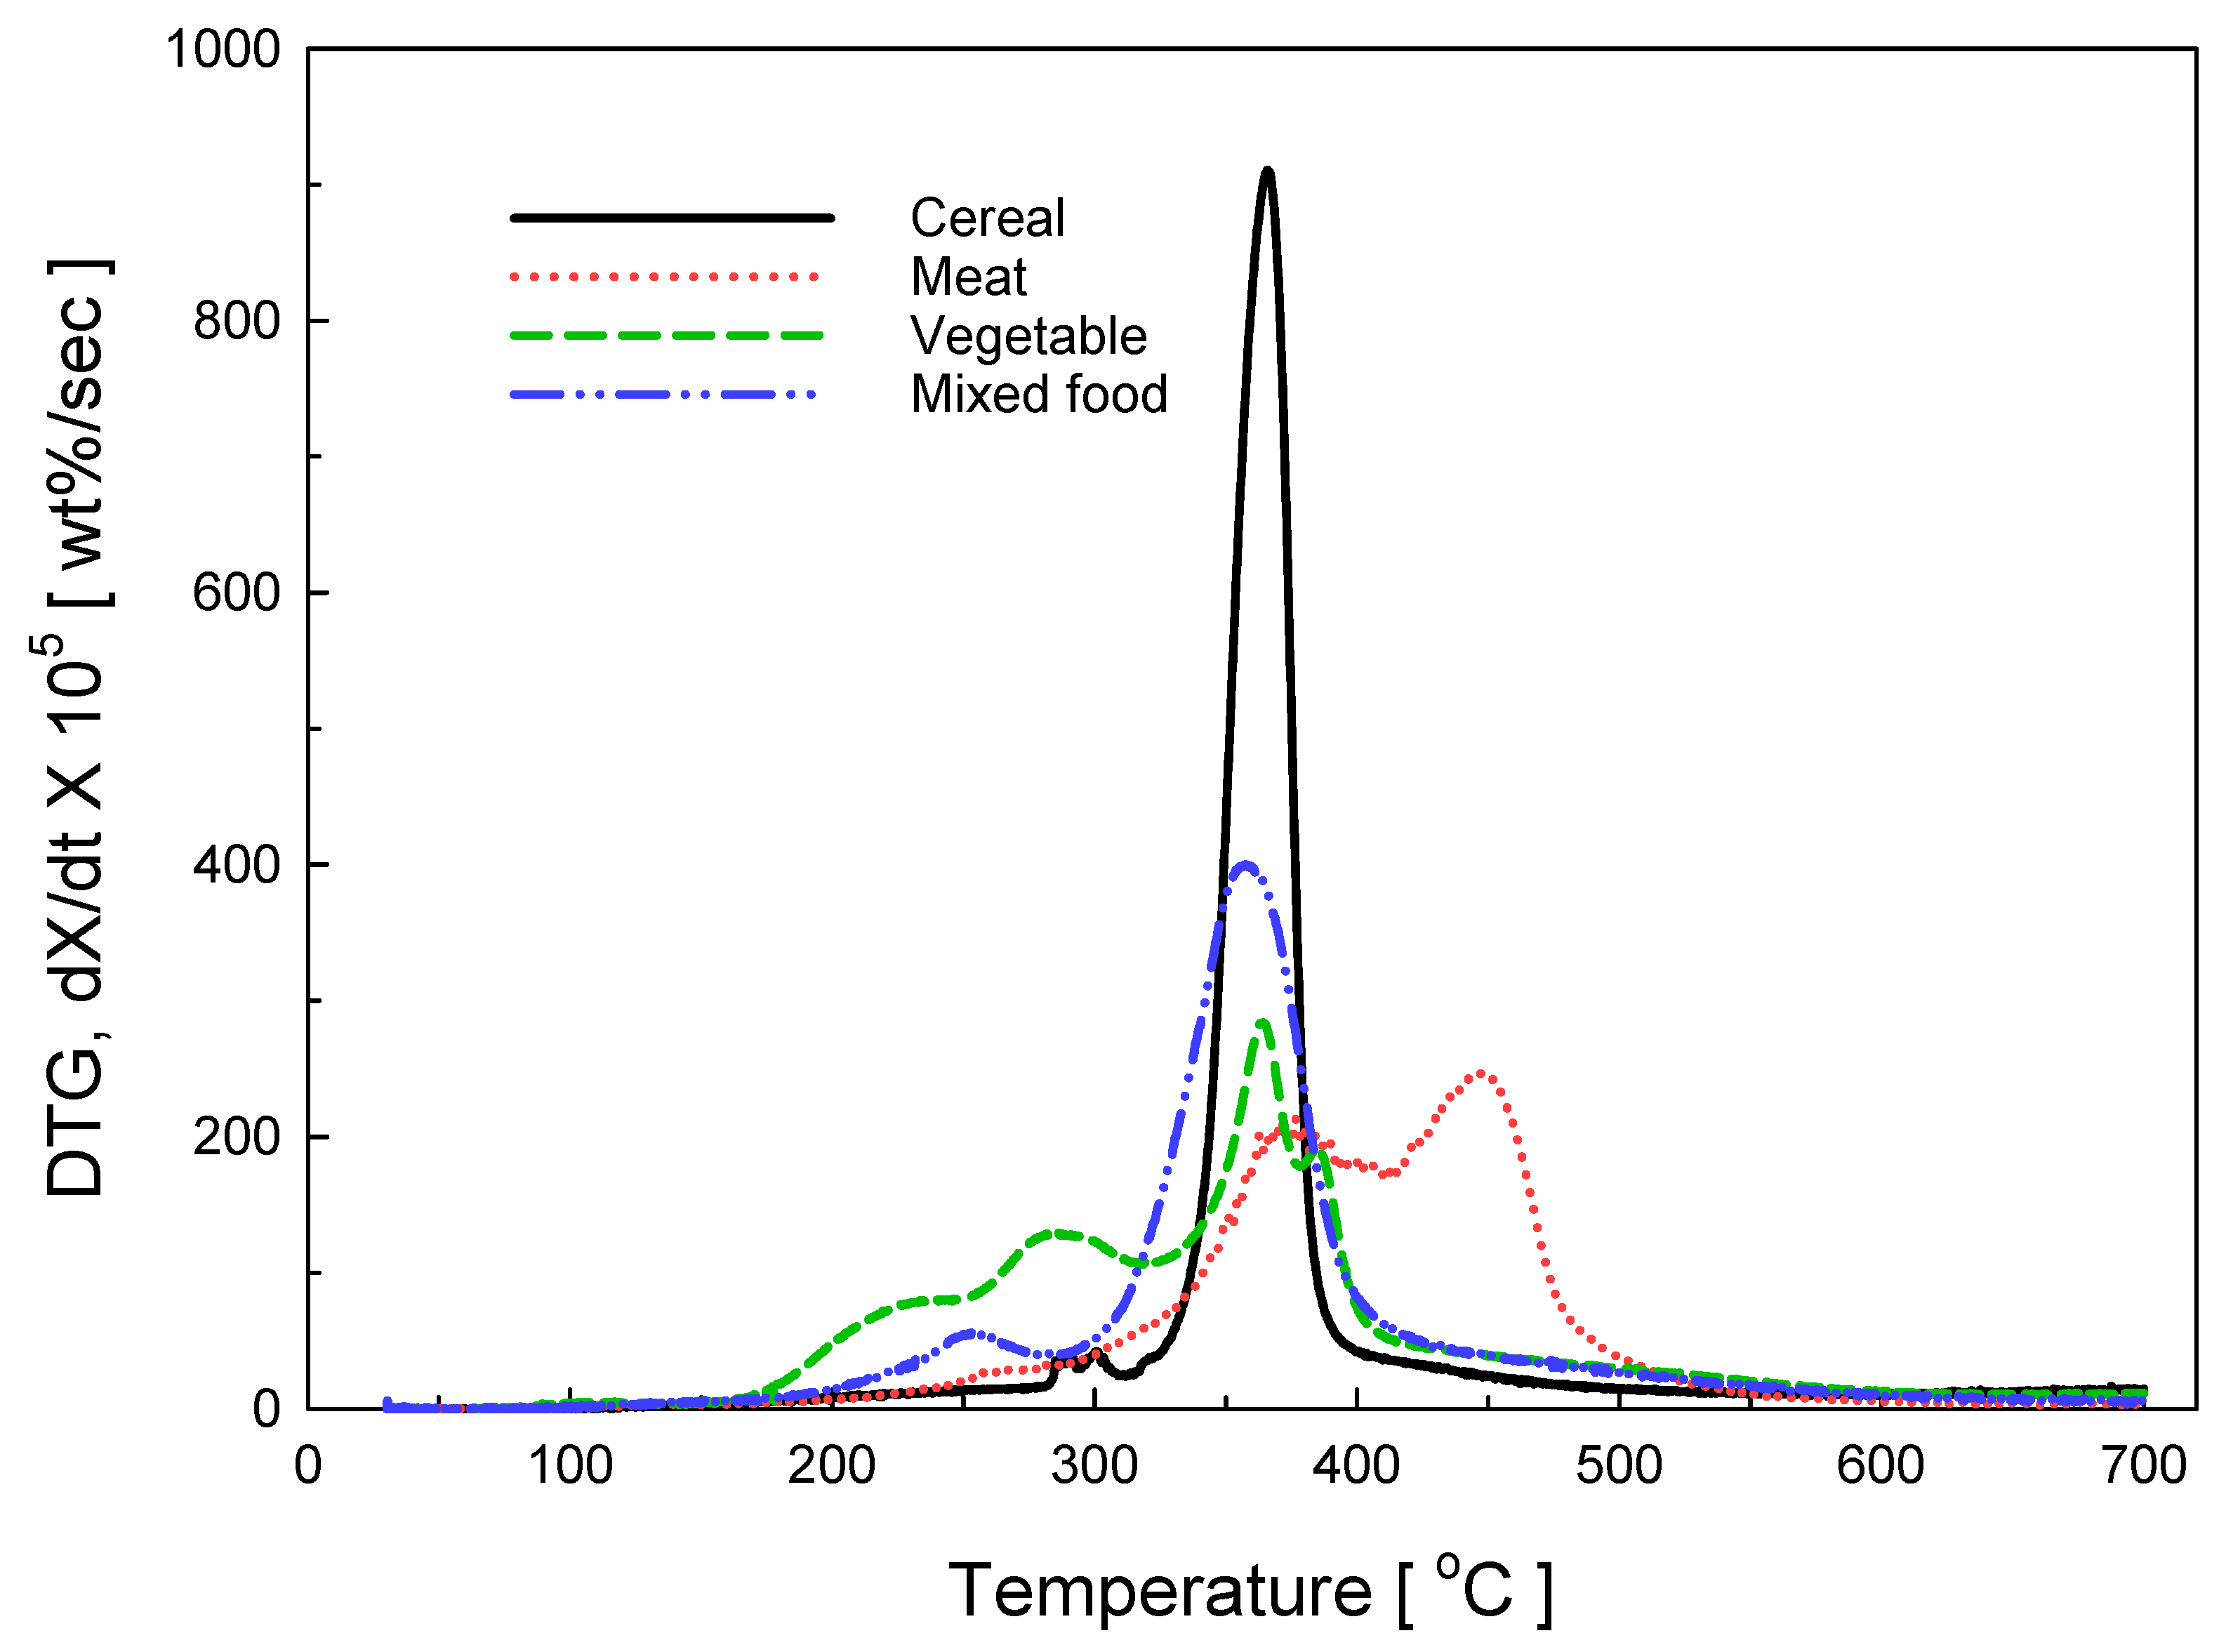
The DTG graph was shown in Figure 6 according to the food waste characteristics. Although each material is represented by different peaks, most peaks contained a carbohydrate peak, which means the main composition of food waste is carbohydrate. Additionally, the activation energy shows a lower value than other papers, because food waste consists of carbohydrates and other substances rather than cellulose, hemicellulose, and lignin.
Table 3 shows the compared result of T peak and DTG peak between the analysis of food waste from the experiment and the analysis of organic material from the literature. Granada et al. analyzed Spanish biomass fuels (pellets, olive stone, almond shell and pine shavings), and the result indicating the high level of T peak and DTG peak because the resource contains cellulose component mostly. In addition, there was a relatively low value of the Low stability organic components analysis performed by Heikkinen et al., and the T1 peak value of the analyzed food waste ranged from 307 to 378 °C, confirming that it is similar to the literature. The value of the DTG peak was the highest in Cereal consist of a single substance (mostly carbohydrate), and the rest of the samples showed the same value as the Almond shell or the RDF pellet [29,30].
3.3. Kinetics
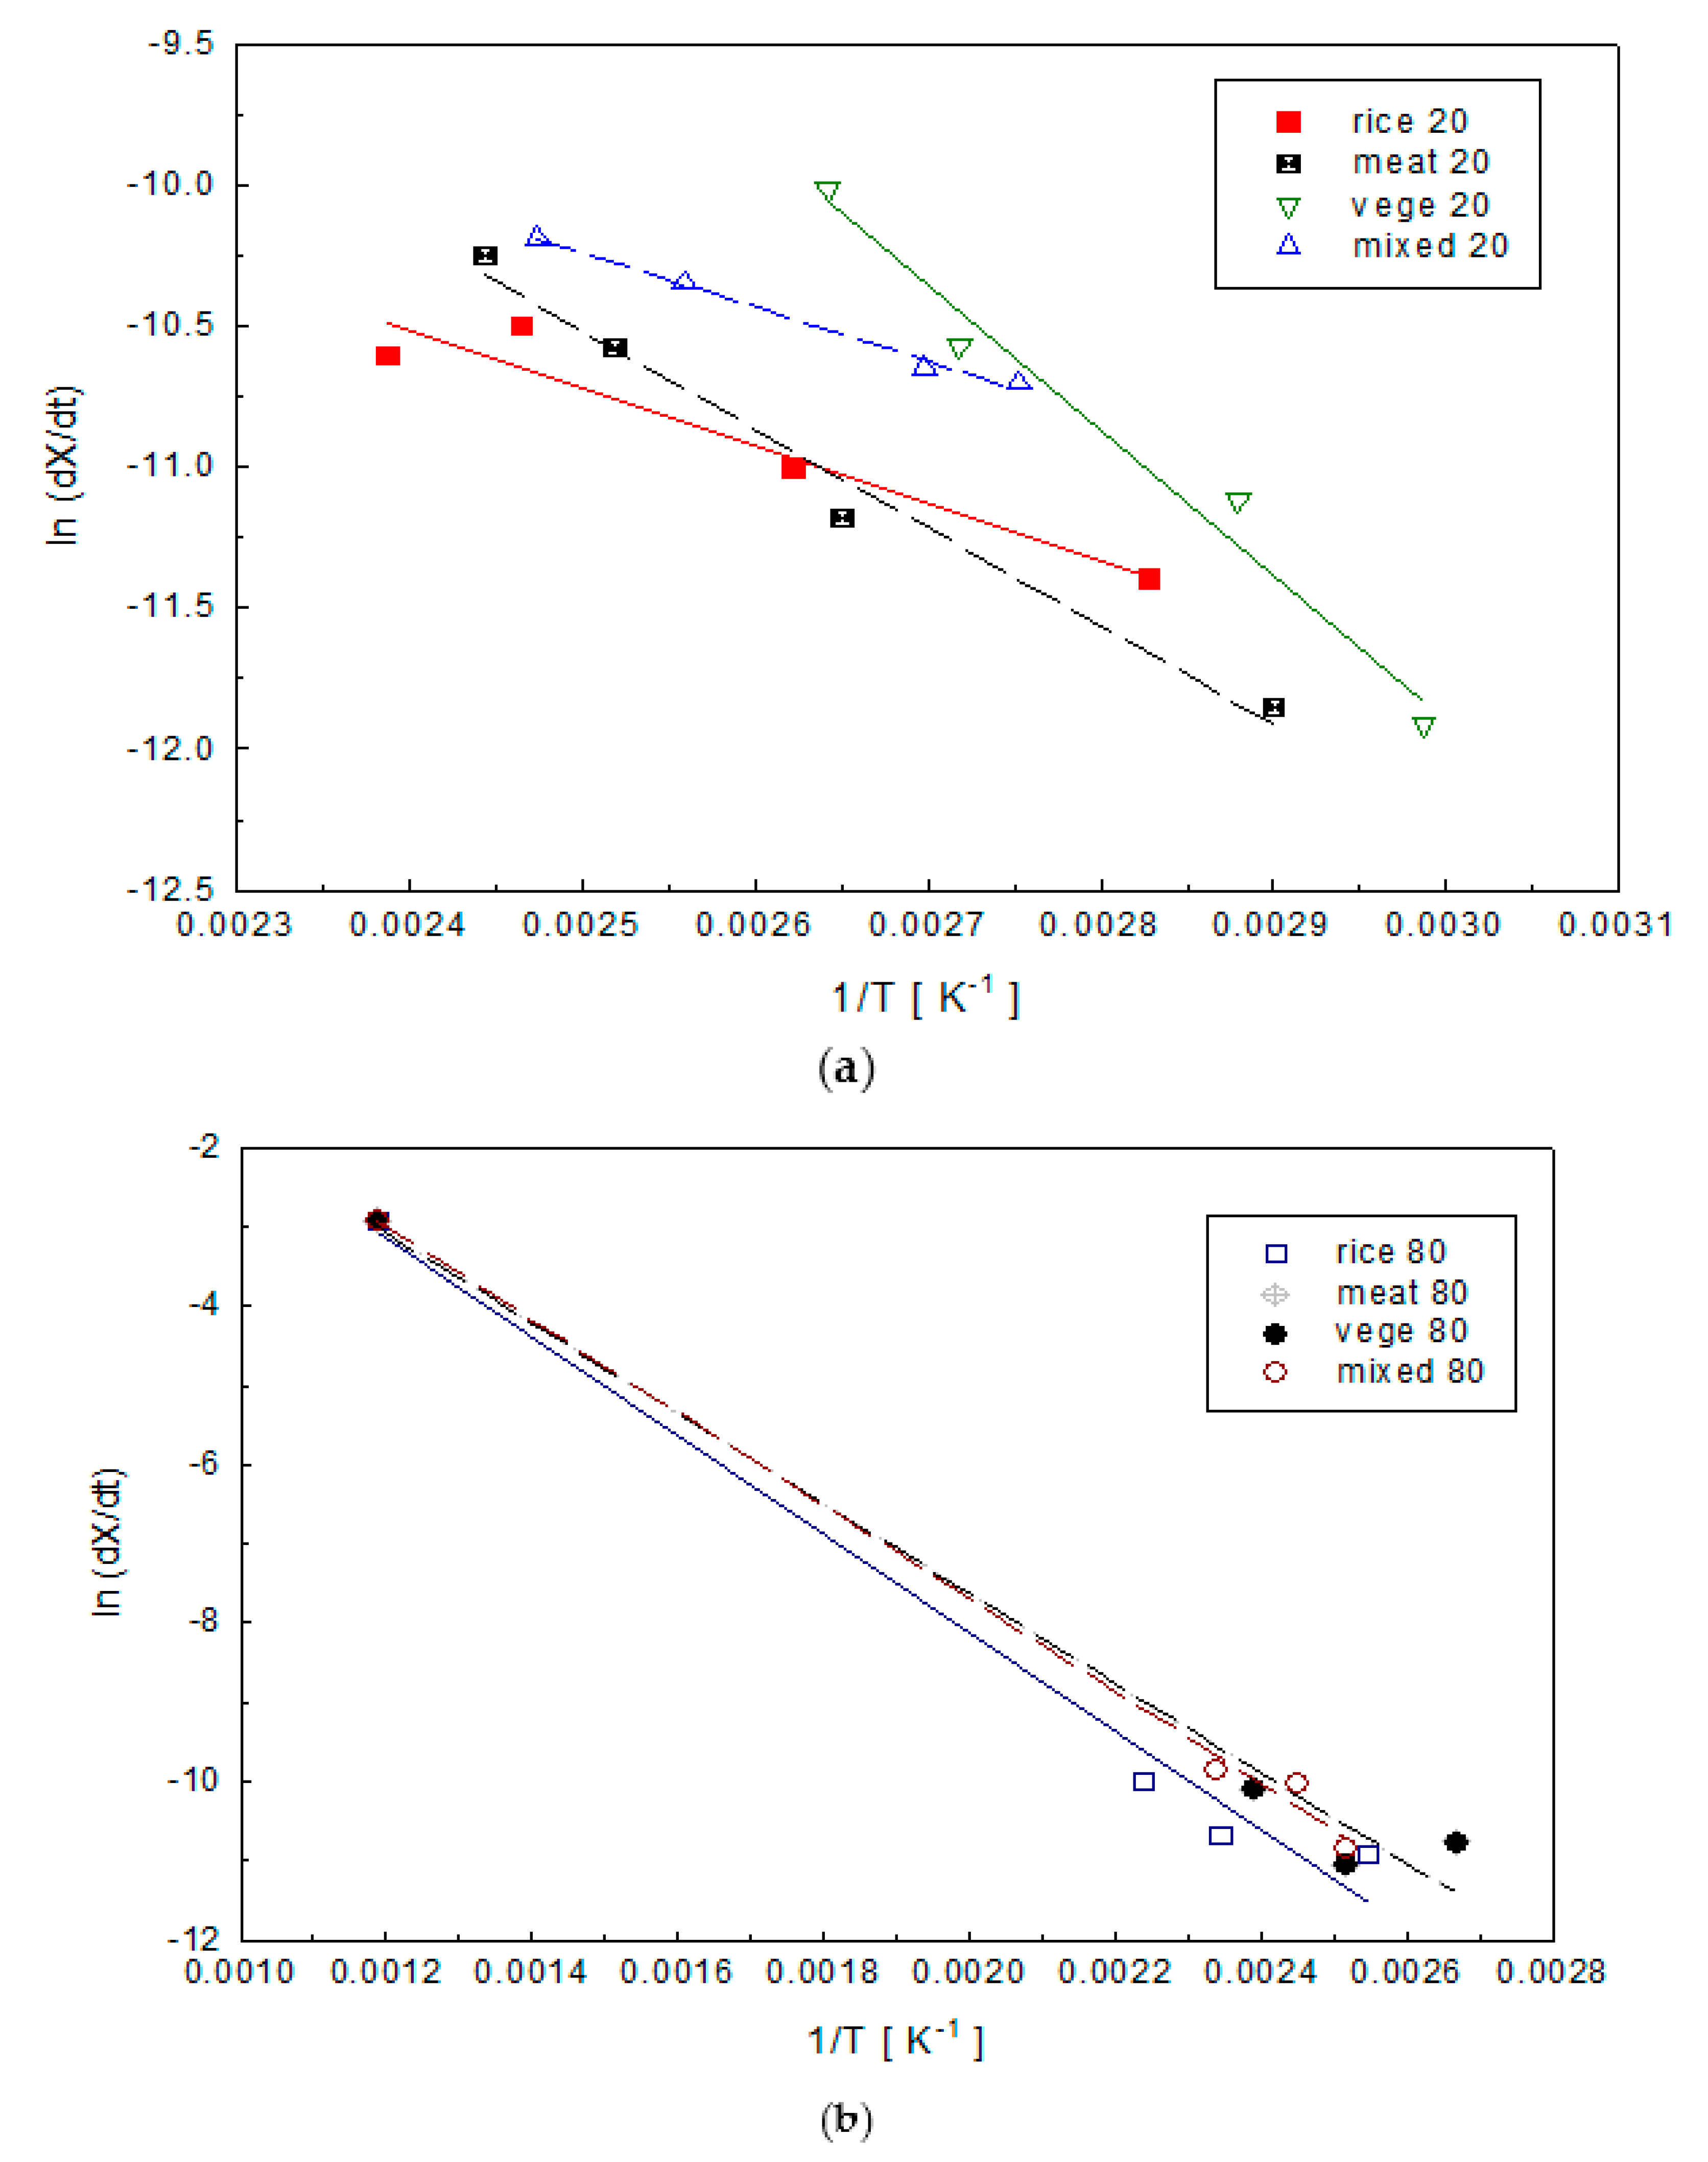
In this study, the Friedman method was used to determine the activation energy (E) and the frequency factor (A) in the pyrolysis of food wastes. Figure 7 shows how the activation energy can be calculated from the conversion rate ln(dX/dt) and 1/T in Equation (6).
When the conversion rate was 20% for pyrolysis of meat, the values of 1/T at the heating rates of 5, 10, 15 and 20 °C/min were 2.9001 × 10⁻³, 2.6503 × 10⁻³, 2.5195 × 10⁻³ and 2.4441 × 10⁻³. The change of conversion rate {ln(dX/dt)} was −11.85, −11.1837, −10.5795, and −10.2504, respectively.
ln(dX/dt) was plotted against 1/T, Figure 5. When the conversion was 20%, the activation energy calculated from the slope in Figure 7 was 28.99 kJ/mol. The intercept value corresponds to ln[A · Xn] in Equation (9) and was 1.7993 using the Equation (10), the frequency factor was obtained by fixing the order of the reaction at a fixed conversion rate. The order of reaction can be assumed to be 0, 1, or 2, and the frequency factor can be calculated up to the conversion rate of 80%.
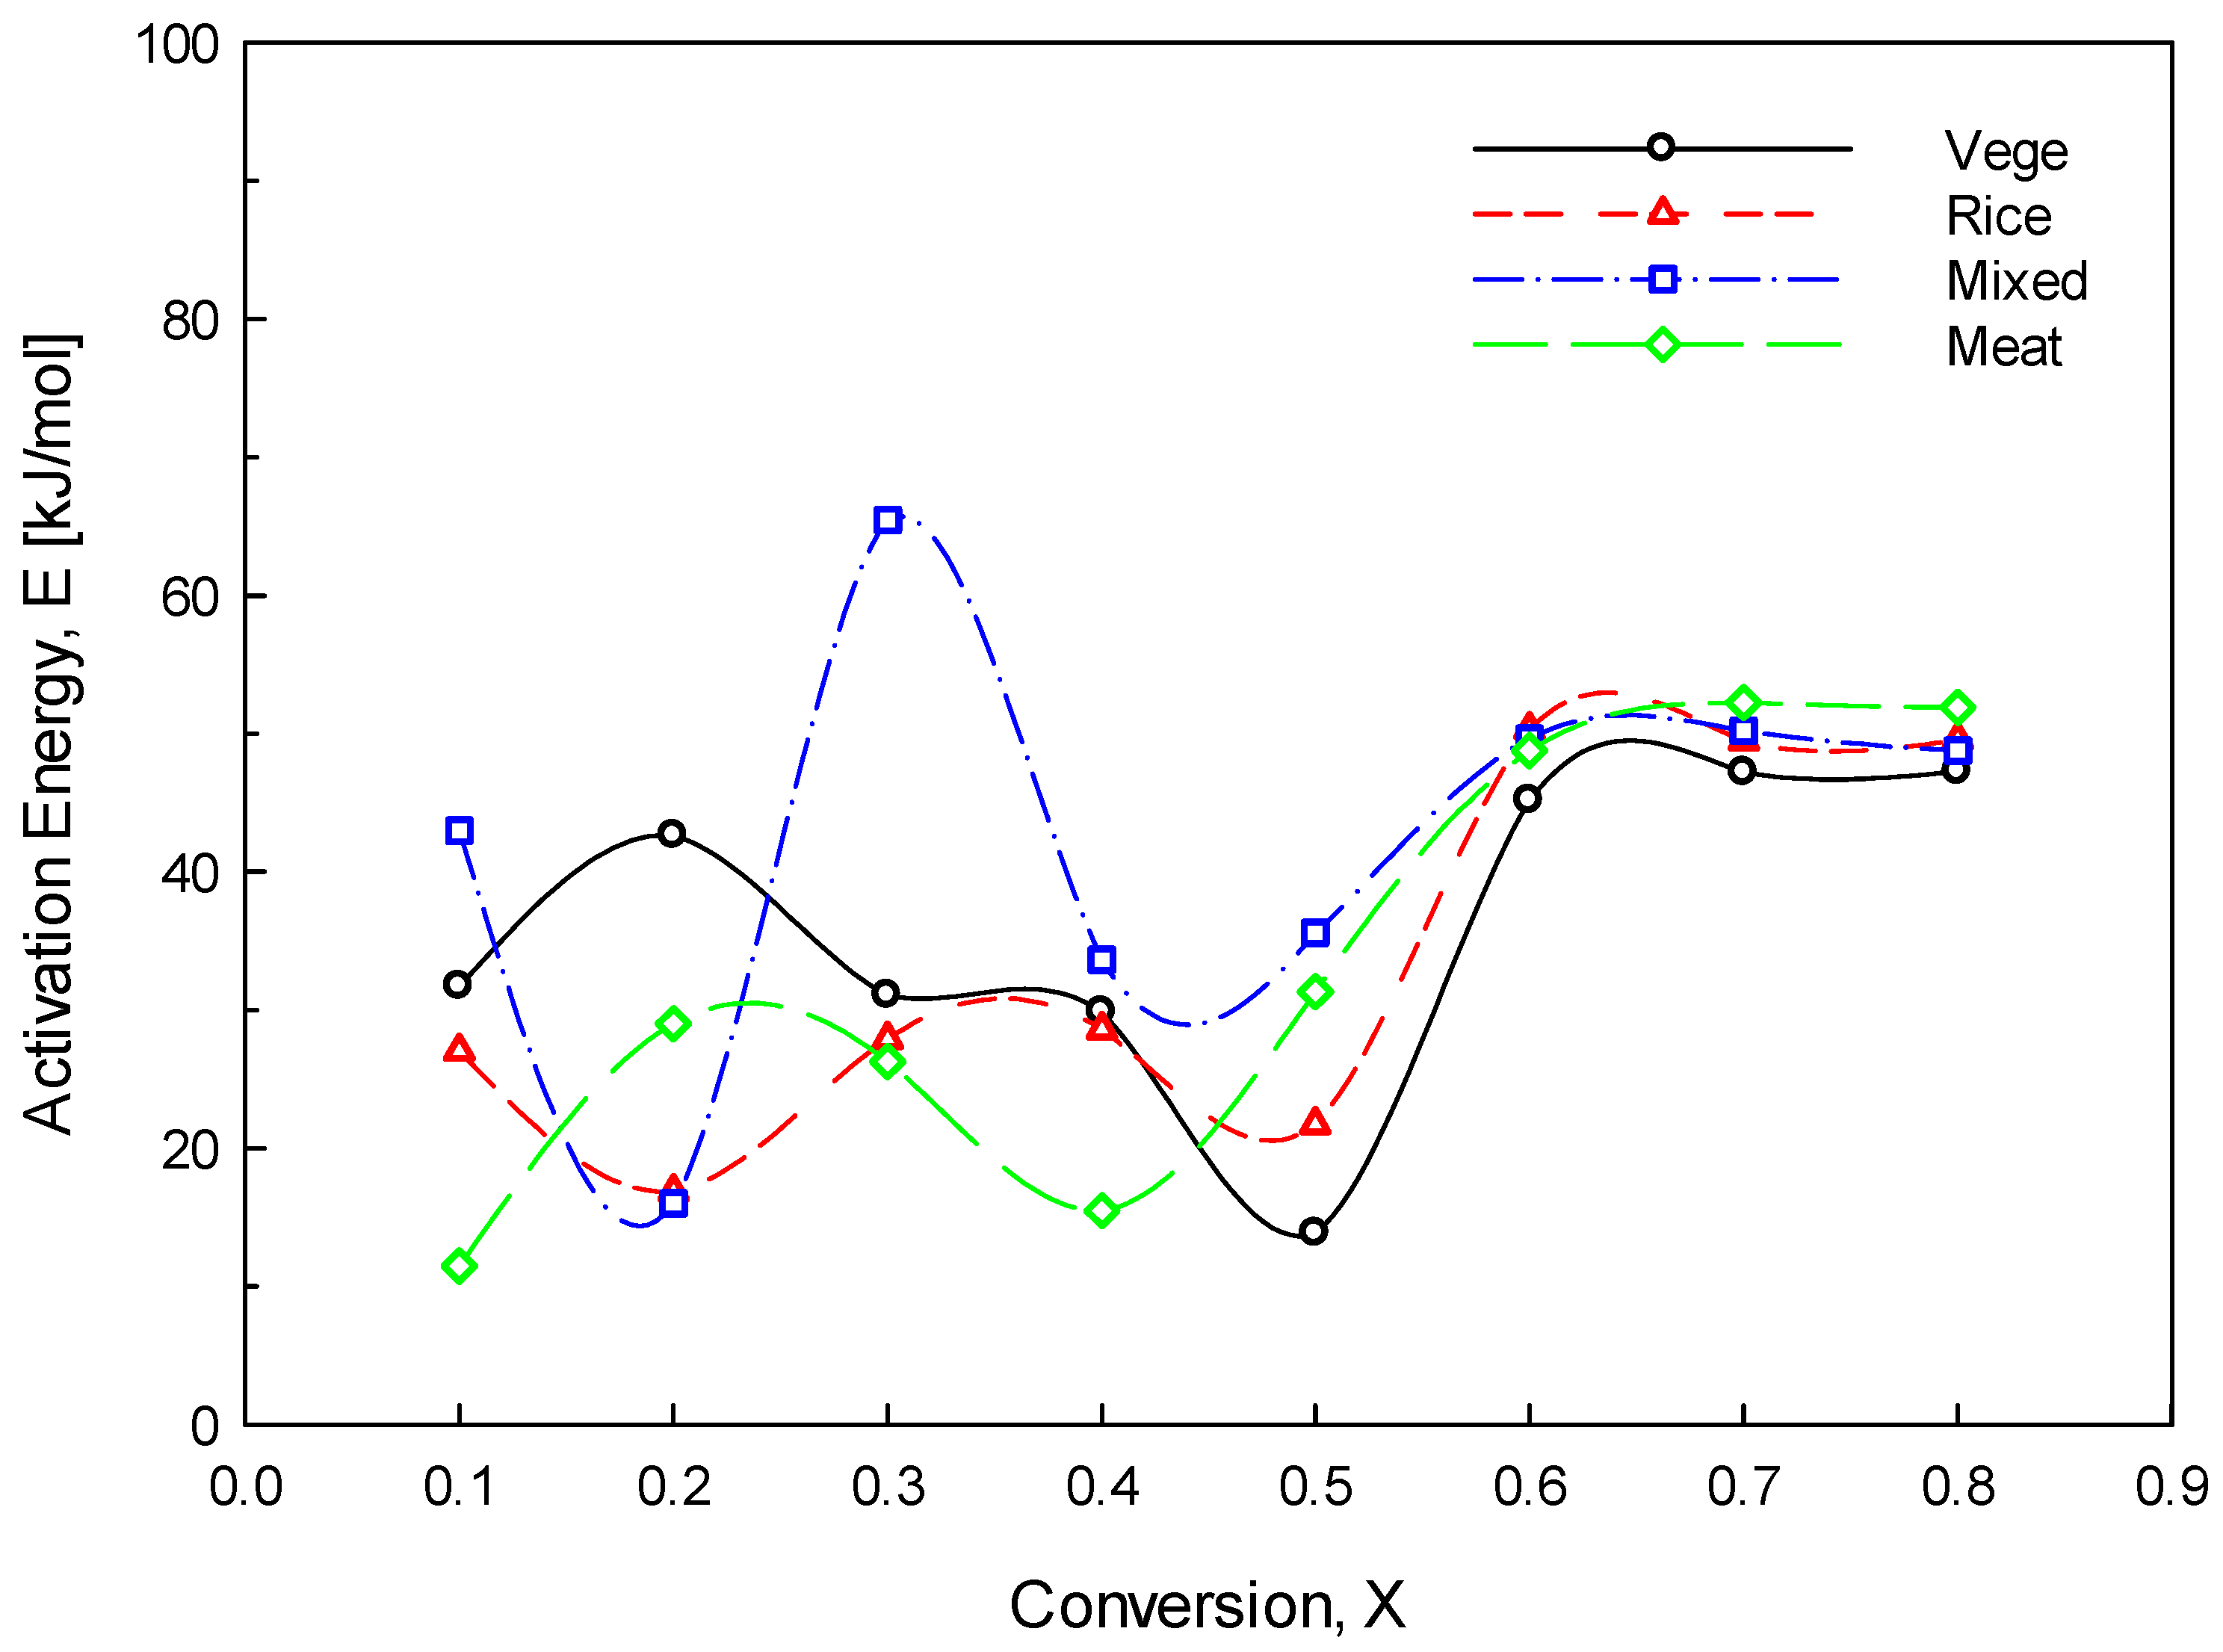
Figure 8 shows the activation energy distribution when the conversion in the pyrolysis reaction of foods was 10–80%, using the method previously described. Pyrolysis is an endothermic reaction, the activation energy of which increases with increasing conversion of foods. This relationship is due to the pyrolysis of the polymeric compound from the main chain in the region where the binding energy is relatively weak at the initial stage of the pyrolysis reaction followed by gradual pyrolysis of the main chain with time for pyrolysis of the biomass. The activation energy of the compound showed a greater variability than a single substance. It is interpreted as a result of synergy between different substances [31,32]. However, as the conversion rate increased to over 60%, the activation energy increased to 50 kJ/mol. Generally, the activation energy range of biomass is 30–200 kJ/mol and in case of laminarin, which is the main component of carbohydrate, has 53 kJ/mol by using the Friedman method. The DTG graph was shown in Figure 6 according to the food waste characteristics. Although each material is represented by different peaks, most materials contained a carbohydrate peak. This means the main composition of food waste is carbohydrate. Additionally, the activation energy shows a lower value than other papers, because food waste consists of carbohydrates and other substances rather than cellulose, hemicellulose, and lignin [33,34].
The frequency factor (A) was calculated using Equation (7), assuming that the order of the reaction in each section changes from zero, to first, to second, as the conversion rate changes (see Table 4). The thermogravimetric curve (Figure 2) shows that the frequency factor is a function of temperature and the conversion rate increases with increasing temperature. For the pyrolysis of meats, the frequency factor increased from 10−4 to 103 in the 0th, 1st, and 2nd order. The frequency factor can be calculated from Equation (7), and the intercept value of this equation is the frequency factor. A high frequency value indicates a greater sensitivity of the reaction to temperature change.
4. Conclusions
Food waste was categorized into cereals, meats, vegetables, and mixed foods, and representative samples of each were dried, pulverized, and pyrolyzed.
Upon drying, food waste is predominantly organic material. Pyrolysis initiation and termination temperatures were measured using a TGA and found to be 250 °C and 400 °C for the cereal sample; 200 °C and 500 °C for the meat; 160 °C and 450 °C for vegetables; and 150 °C and 450 °C for the mixed foods.
Between one and three peaks were found in the DTG graph, depending on the type of food being pyrolyzed. This is due to the constituents of each sample pyrolyzing at different rates. There was no change in the slope of the thermogravimetric curve in the region of vigorous pyrolysis reaction.
The activation energy distribution of each sample was calculated at the conversion rate of 10–80%, during the pyrolysis process. The activation energy was increased from 10 kJ/mol to 50 kJ/mol, and the activation energy of about 50 kJ/mol, with very slight differences at different conversion rates and the type of food.
The result from this experiment could be used to find out the effective management of food waste pyrolysis research in the future.
Acknowledgments
This research was supported by a grant (17AUDP-B083704-04) from Architecture and Urban Development Research Program funded by Ministry of Land, Infrastructure and Transport of Korean government.
Author Contributions
Jun-Ho Jo, Yeong-Seok Yoo and Seung-Soo Kim conceived and designed the experiments; Jae-Wook Shim performed the experiments; Jun-Ho Jo and Ye-Eun Lee analyzed the data; Yeong-Seok Yoo contributed reagents/materials/analysis tools; Jun-Ho Jo wrote the paper.
Conflicts of Interest
The authors declare no conflict of interest.
References
- Gustavsson, J.; Cederberg, C.; Sonesson, U. Global Food Losses and Food Waste; Food and Agriculture Organization of the United Nations: Rome, Italy, 2001; ISBN 978-92-5-107205-9. [Google Scholar]
- Food and Agriculture Organization of the United Nations. Food Wastage Footprint Impacts on Natural Resources, Summary Report; Food and Agriculture Organization of the United Nations: Rome, Italy, 2013; ISBN 978-92-5-107752-8. [Google Scholar]
- Kim, D.W. A study on the Odor Reduction of Food Waste and by Microorganisms. Master’s Thesis, Hoseo University, Chungnam, Korea, 2005. [Google Scholar]
- Kwon, B.; Na, S.; Lim, H.; Lim, C.; Chung, S. Slurry phace decomposition of food waste by using various microorganisms. J. Korean Soc. Environ. Eng. 2014, 36, 303–310. [Google Scholar] [CrossRef]
- Hong, K.H.; Cha, J.D.; Ko, Y.H.; Lee, J.H.; Lim, E.J.; Kim, K.S. Evaluation of odor concentration for food waste compost facility. Korean J. Odor Res. Eng. 2006, 5, 151–155. [Google Scholar]
- Chiang, L.; Chang, J.; Wen, T. Indirect oxidation effect in electrochemical oxidation treatment of landfill leachate. Water Res. 1995, 29, 671–678. [Google Scholar] [CrossRef]
- Jakob, A.; Stucki, S.; Kuhn, P. Evaporation of Heavy Metals during the Heat Treatment of Municipal Solid Waste Incinerator Fly Ash. Environ. Sci. Technol. 1995, 29, 2429–2436. [Google Scholar] [CrossRef] [PubMed]
- Sakuragi, K.; Li, P.; Otaka, M.; Makino, H. Recovery of Bio-Oil from Industrial Food Waste by Liquefied Dimethyl Ether for Biodiesel Production. Energies 2016, 9, 106. [Google Scholar] [CrossRef]
- Hao, H.-T.N.; Karthikeyan, O.P.; Heimann, K. Bio-Refining of Carbohydrate-Rich Food Waste for Biofuels. Energies 2015, 8, 6350–6364. [Google Scholar] [CrossRef]
- Luo, Z.; Wang, S.; Liao, Y.; Zhou, J.; Gu, Y.; Cen, K. Research on biomass fast pyrolysis for liquid fuel. Biomass Bioenergy 2004, 29, 455–462. [Google Scholar] [CrossRef]
- Alvarez, V.A.; Va´zquez, A. Thermal degradation of cellulose derivatives/starch blends and sisal fibre biocomposites. Polym. Degrad. Stab. 2004, 84, 13–21. [Google Scholar] [CrossRef]
- Guizani, C.; Jeguirim, M.; Valin, S.; Limousy, L.; Salvador, S. Biomass Chars: The Effects of Pyrolysis Conditions on Their Morphology, Structure, Chemical Properties and Reactivity. Energies 2017, 10, 796. [Google Scholar] [CrossRef]
- Kabir, M.J.; Chowdhury, A.A.; Rasul, M.G. Pyrolysis of Municipal Green Waste: A Modelling, Simulation and Experimental Analysis. Energies 2015, 8, 7522–7541. [Google Scholar] [CrossRef]
- Ninan, K.N.; Krishnan, K.; Krishnamurthy, V.N. Kinetics and mechanism of thermal decomposition of insitu generated calcium carbonate. J. Therm. Anal. Calorim. 1991, 37, 1533–1543. [Google Scholar] [CrossRef]
- Campanella, L.; Tomassetti, M.; Tomellini, R. Thermoanalysis of ancient, fresh and waterlogged woods. J. Therm. Anal. Calorim. 1991, 37, 923–932. [Google Scholar] [CrossRef]
- Jaber, J.O.; Probert, S.D. Pyrolysis and gasification kinetics of Jordanian oil-shales. Appl. Energy 1999, 63, 269–286. [Google Scholar] [CrossRef]
- Vamvuka, D.; Kakaras, E.; Kastanakia, E.; Grammelis, P. Pyrolysis characteristics and kinetics of biomass residuals mixtures with lignite. Fuel 2003, 82, 1949–1960. [Google Scholar] [CrossRef]
- Zambon, I.; Colosimo, F.; Monarca, D.; Cecchini, M.; Gallucci, F.; Proto, A.R.; Lord, R.; Colantoni, A. An Innovative Agro-Forestry Supply Chain for Residual Biomass: Physicochemical Characterisation of Biochar from Olive and Hazelnut Pellets. Energies 2016, 9, 526. [Google Scholar] [CrossRef] [Green Version]
- Kim, S.; Agblevor, F.A. Pyrolysis characteristics and kinetics of chicken litter. Waste Manag. 2007, 27, 135–140. [Google Scholar] [CrossRef] [PubMed]
- Sorum, L.; Grønli, M.G.; Hustad, J.E. Pyrolysis characteristics and kinetics of municipal solid wastes. Fuel 2001, 80, 1217–1227. [Google Scholar] [CrossRef]
- Conesa, J.A.; Marcilla, A.; Prats, D.; Rodriguez, M. Kinetic study of the pyrolysis of sewage sludge. Waste Manag. Res. 1997, 15, 293–305. [Google Scholar] [CrossRef]
- Othman, M.R.; Park, Y.H. Thermogravimetric characteristics and pyrolysis kinetics of Giheung Respia sewage sludge. Korean J. Chem. Eng. 2010, 27, 163–167. [Google Scholar] [CrossRef]
- Nowicki, L.; Antecka, A.; Bedyk, T. The kinetics of gasification of char derived from sewage sludge. J. Therm. Anal. Calorim. 2010, 12, 1032–1041. [Google Scholar] [CrossRef]
- He, P.; Shao, L.; Gu, G.; Li, G. Mechanism and kinetics of low temperature thermo-chemical conversion process of sewage sludge. Water Sci. Technol. 2001, 44, 341–347. [Google Scholar] [PubMed]
- Calvo, L.F.; Otero, M.; Jenkins, B.M. Heating process characteristics and kinetics of sewage sludge in different atmospheres. Thermochim. Acta 2004, 409, 127–135. [Google Scholar] [CrossRef]
- Shao, J.G.; Yan, R.; Chen, H.P. Pyrolysis characteristics and kinetics of sewage sludge by thermogravimetry Fourier transform infrared analysis. Energy Fuels 2008, 22, 38–45. [Google Scholar] [CrossRef]
- Lee, K.I.; Choi, J.W.; Heo, S.Y.; Ban, H.J.; Lim, S.G.; Park, I.H.; Kim, T.H. The Consumption Behaviour Survey for Food 2015; Korea Rural Economic Institute: JeolLaNam-Do, Korea, 2015; Volume 1, ISBN 978-89-6013-880-393520. [Google Scholar]
- Ministry of Environment (MOE). Product Category Rules for Carbon Labeling; Ministry of Environment: Sejong City, Korea, 2009.
- Granada, E.; Eguía, P.; Comesaña, J.A.; Patiño, D.; Porteiro, J.; Miguez, J.L. Devolatilization behaviour and pyrolysis kinetic modelling of Spanish biomass fuels. J. Therm. Anal. Calorim. 2013, 113, 569–578. [Google Scholar] [CrossRef]
- Heikkinen, J.M.; Hordijk, J.C.; de Jong, W.; Spliethoff, H. Thermogravimetry as a tool to classify waste components to be used for energy generation. J. Anal. Appl. Pyrolysis 2004, 71, 883–900. [Google Scholar] [CrossRef]
- Jeguirim, M.; Elmay, Y.; Limousy, L.; Lajili, M.; Said, R. Devolatilization behavior and pyrolysis kinetics of potential Tunisian biomass fuels. Environ. Prog. Sustain. Energy 2014, 33, 1452–1458. [Google Scholar] [CrossRef]
- Guizani, C.; Haddad, K.; Jeguirim, M.; Colin, B.; Limousy, L. Combustion characteristics and kinetics of torrefied olive pomace. Energy 2016, 107, 453–463. [Google Scholar] [CrossRef]
- Weber, R. Extracting mathematically exact kinetic parameters from experimental data on combustion and pyrolysis of solid fuels. J. Energy Inst. 2008, 81, 226–233. [Google Scholar] [CrossRef]
- Anastasakis, K.; Ross, A.B.; Jones, J.M. Pyrolysis behaviour of the main carbohydrates of brown macro-algae. Fuel 2011, 90, 598–607. [Google Scholar] [CrossRef]
Figure 1.
TGA curves of cereal, meat, vegetables, and mixed food pyrolysis at heating rates of 5 °C/min.
Figure 1.
TGA curves of cereal, meat, vegetables, and mixed food pyrolysis at heating rates of 5 °C/min.

Figure 2.
TG and DTG curves of cereal pyrolysis at heating rates of 5, 10, 15, and 20 °C/min.
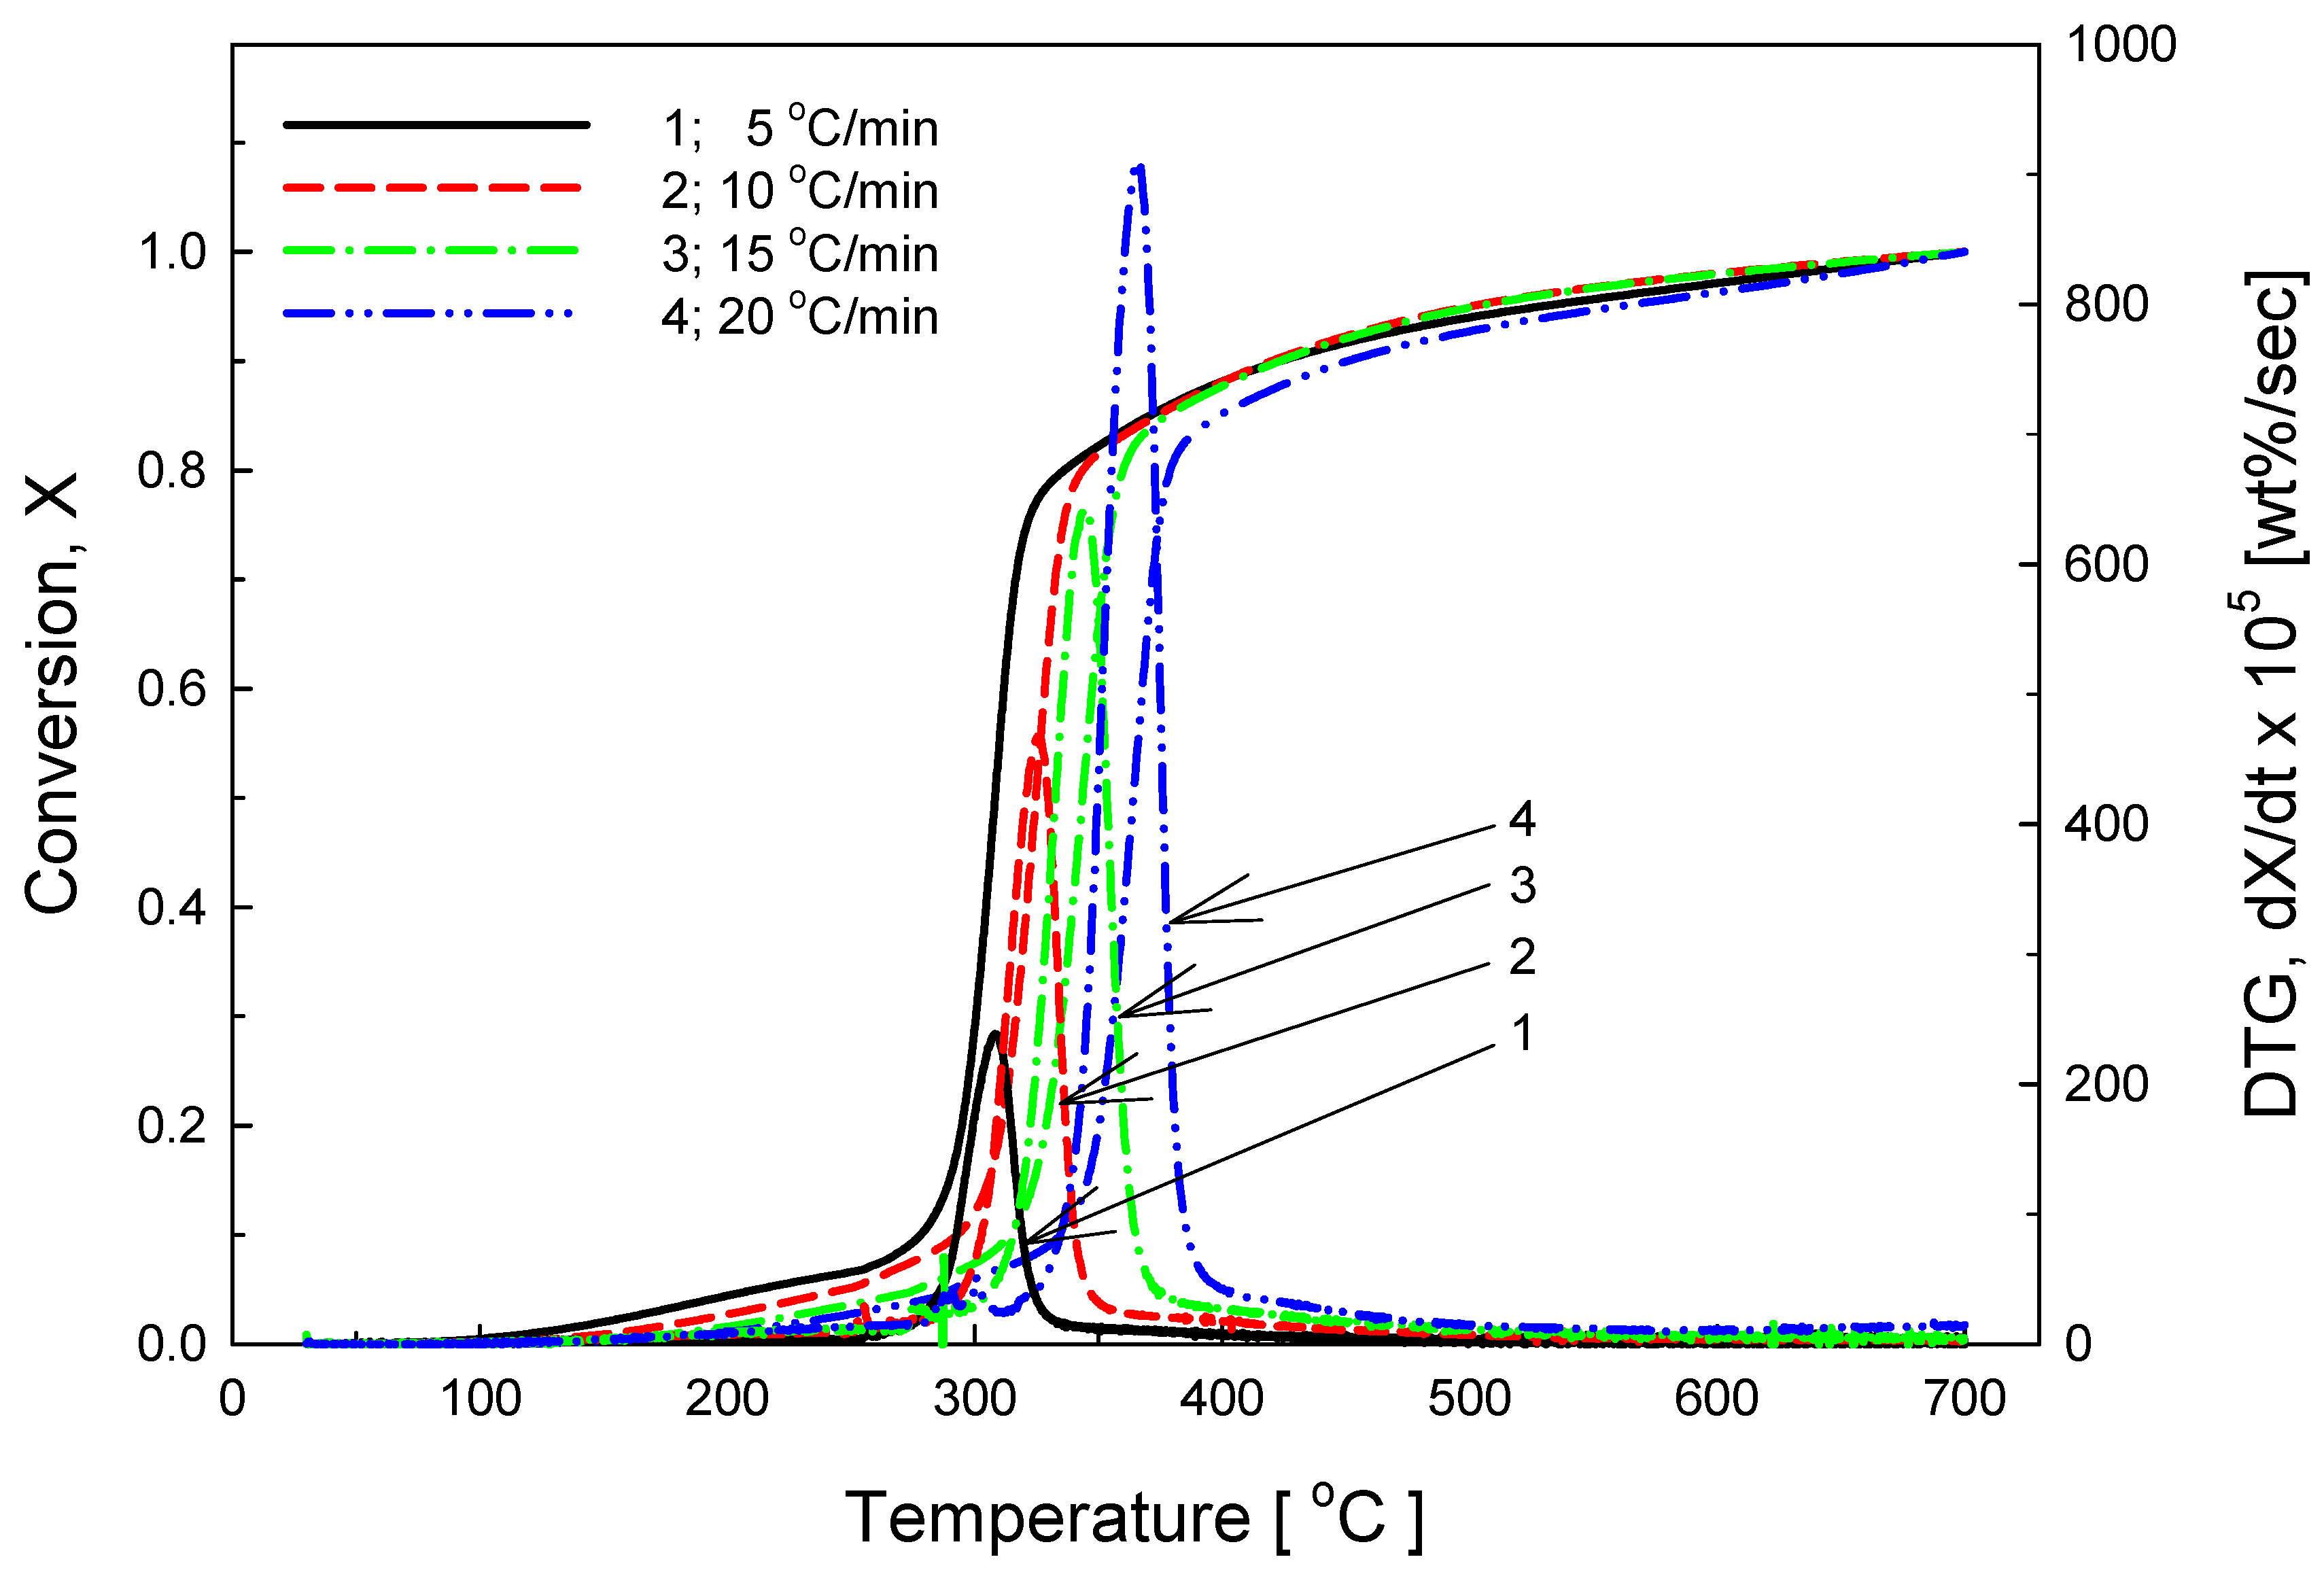
Figure 3.
TG and DTG curves of meat pyrolysis at heating rates of 5, 10, 15, and 20 °C/min.

Figure 4.
TG and DTG curves of vegetable pyrolysis at heating rates of 5, 10, 15, and 20 °C/min.

Figure 5.
TG and DTG curves of mixed food pyrolysis at heating rates of 5, 10, 15, and 20 °C/min.

Figure 6.
DTG curves of cereal, meat, vegetables, and mixed food pyrolysis at heating rates of 20 °C/min.
Figure 6.
DTG curves of cereal, meat, vegetables, and mixed food pyrolysis at heating rates of 20 °C/min.

Figure 7.
Application of Equation (5) with a heating rate 5, 10, and 20 °C/min. The conversion values are (a) 20% and (b) 80%: 1, Rice: 20%; 2, Meat: 20%; 3, Vegetable: 20%; 4, Mixed: 20%; 5, Rice: 80%; 6, Meat: 80%; 7, Vegetable: 80%; and 8, Mixed: 80%.
Figure 7.
Application of Equation (5) with a heating rate 5, 10, and 20 °C/min. The conversion values are (a) 20% and (b) 80%: 1, Rice: 20%; 2, Meat: 20%; 3, Vegetable: 20%; 4, Mixed: 20%; 5, Rice: 80%; 6, Meat: 80%; 7, Vegetable: 80%; and 8, Mixed: 80%.

Figure 8.
Calculated activation energies at different conversions for the pyrolysis of foods.


Table 1.
The contents of mixed food.
| Contents | Materials | Composition Ratio (%) |
|---|---|---|
| Cereals (16) | Rice/Ramen | 16 |
| Fish & meat (19) | Meat | 4 |
| Fish | 12 | |
| Egg | 3 | |
| Vegetables (51) | Napa cabbage | 9 |
| Potato | 20 | |
| Onion | 20 | |
| Daikon | 2 | |
| Fruits (14) | Apple | 7 |
| Orange/Mandarin | 7 |
Table 2.
Chemical characteristics of the food wastes.
| Sample | Moisture (%) | (Dry Basis) | ||||
| Volatile Matter (%) | Fixed Carbon (%) | Ash (%) | ||||
| Cereals | 65.74 ± 2.17 | 88.95 ± 0.03 | 10.82 | 0.23 ± 0.03 | ||
| Meat | 71.27 ± 4.83 | 86.67 ± 3.54 | 8.84 | 4.49 ± 1.50 | ||
| Vegetables | 95.28 ± 3.52 | 72.84 ± 2.10 | 9.40 | 17.76 ± 0.42 | ||
| Mixed food | 85.71 ± 2.94 | 79.00 ± 2.74 | 17.25 | 3.75 ± 0.07 | ||
| Sample | Element (%) | HHV (kcal/kg) | ||||
| C | H | N | O | |||
| Cereals | 41.4 | 8.3 | 1.1 | 47.6 | 3930.6 | |
| Meat | 54.5 | 11.3 | 10.5 | 22.4 | 6019.9 | |
| Vegetables | 38.4 | 6.8 | 4.9 | 36.3 | 3565.9 | |
| Mixed food | 47.5 | 12.2 | 2.9 | 29.7 | 4657.6 | |
Table 3.
Analyzed food waste and organic materials and DTG peak temperatures
| T peak (°C) | DTG peak dX/dt × 102 (wt %/min) | |
|---|---|---|
| Cereal | 308 | 14.32 |
| Meat | 378 | 3.63 |
| Vegetable | 314 | 3.86 |
| Mixed food | 307 | 5.43 |
| Wood pellet1 a | 334 | 5.61 |
| Wood pellet2 a | 328 | 4.61 |
| Brassica pellet a | 296 | 4.25 |
| Poplar pellet a | 322 | 4.46 |
| RDF pellet a | 445 | 3.79 |
| Olive stone a | 315 | 4.96 |
| Almond shell a | 323 | 2.91 |
| Pine shavings a | 305 | 5.43 |
| Starch b | 313 | - |
| Banana(dry) b | 312 | - |
| Bread(dry) b | 292 | - |
| Cacao residue b | 209; 280; 328 | - |
| Lemon pellet b | 216; 261; 346 | - |
| Palm pit b | 296 | - |
Table 4.
Application of Equation (7) to calculate the pre-exponential factor with heating rate of 5, 10, 15 and 20 °C/min for the pyrolysis of food wastes.
Table 4.
Application of Equation (7) to calculate the pre-exponential factor with heating rate of 5, 10, 15 and 20 °C/min for the pyrolysis of food wastes.
| Reaction Order | Conversion (wt %) | ||||||||||
|---|---|---|---|---|---|---|---|---|---|---|---|
| 10 | 20 | 30 | 40 | 50 | 60 | 70 | 80 | 85 | 90 | ||
| rice | 0th | 7.33 × 10⁻² | 3.52 × 10⁻³ | 1.10 × 10⁻¹ | 1.20 × 10⁻¹ | 1.91 × 10⁻² | 8.30 × 101 | 7.27 × 101 | 5.99 × 101 | 1.81 × 101 | 3.41 × 10⁻⁴ |
| 1st | 7.33 × 10⁻¹ | 1.76 × 10⁻² | 3.67 × 10⁻¹ | 3.00 × 10⁻¹ | 3.82 × 10⁻² | 1.38 × 10² | 1.04 × 10² | 7.49 × 101 | 2.13 × 101 | 3.79 × 10⁻⁴ | |
| 2nd | 7.33 × 10 | 8.80 × 10⁻² | 1.23 × 100 | 7.49 × 10⁻¹ | 7.64 × 10⁻² | 2.31 × 10² | 1.48 × 10² | 9.36 × 101 | 2.51 × 101 | 4.21 × 10⁻⁴ | |
| meat | 0th | 8.76 × 10⁻⁴ | 1.65 × 10⁻¹ | 7.10 × 10⁻² | 2.69 × 10⁻³ | 1.84 × 10⁻¹ | 5.78 × 101 | 1.03 × 10² | 7.77 × 101 | 2.84 × 101 | 2.72 × 10³ |
| 1st | 8.76 × 10⁻³ | 8.27 × 10⁻¹ | 2.37 × 10⁻¹ | 6.71 × 10⁻³ | 3.68 × 10⁻¹ | 9.63 × 101 | 1.48 × 10² | 9.71 × 101 | 3.34 × 101 | 3.02 × 10³ | |
| 2nd | 8.76 × 10⁻² | 4.14 × 100 | 7.89 × 10⁻¹ | 1.68 × 10⁻² | 7.36 × 10⁻¹ | 1.60 × 10² | 2.11 × 10² | 1.21 × 101 | 3.93 × 101 | 3.36 × 10³ | |
| vegetable | 0th | 9.64 × 10⁻¹ | 3.24 × 101 | 7.15 × 10⁻¹ | 4.16 × 10⁻¹ | 2.10 × 10⁻³ | 3.55 × 101 | 5.01 × 101 | 4.18 × 101 | 2.39 × 101 | 2.42 × 10⁻⁴ |
| 1st | 9.64 × 100 | 1.62 × 10² | 2.38 × 100 | 1.04 × 100 | 4.21 × 10⁻³ | 5.91 × 101 | 7.16 × 101 | 5.23 × 101 | 2.81 × 101 | 2.68 × 10⁻⁴ | |
| 2nd | 9.64 × 101 | 8.09 × 10² | 7.94 × 100 | 2.60 × 100 | 8.41 × 10⁻³ | 9.86 × 101 | 1.02 × 10² | 6.54 × 101 | 3.31 × 101 | 2.98 × 10⁻⁴ | |
| mixed | 0th | 1.76 × 101 | 4.39 × 10⁻³ | 1.01 × 10⁴ | 8.74 × 10⁻¹ | 1.25 × 100 | 8.62 × 101 | 9.28 × 101 | 5.71 × 101 | 2.27 × 101 | 3.50 × 10⁻⁴ |
| 1st | 1.76 × 10² | 2.20 × 10⁻² | 3.36 × 10⁴ | 2.18 × 100 | 2.51 × 100 | 1.44 × 10² | 1.33 × 10² | 7.14 × 101 | 2.68 × 101 | 3.89 × 10⁻⁴ | |
| 2nd | 1.76 × 10³ | 1.10 × 10⁻¹ | 1.12 × 10⁵ | 5.46 × 100 | 5.02 × 100 | 2.39 × 10² | 1.89 × 10² | 8.93 × 101 | 3.15 × 101 | 4.32 × 10⁻⁴ | |
© 2017 by the authors. Licensee MDPI, Basel, Switzerland. This article is an open access article distributed under the terms and conditions of the Creative Commons Attribution (CC BY) license (http://creativecommons.org/licenses/by/4.0/).
Share and Cite
MDPI and ACS Style
Jo, J.-H.; Kim, S.-S.; Shim, J.-W.; Lee, Y.-E.; Yoo, Y.-S. Pyrolysis Characteristics and Kinetics of Food Wastes. Energies 2017, 10, 1191. https://doi.org/10.3390/en10081191
AMA Style
Jo J-H, Kim S-S, Shim J-W, Lee Y-E, Yoo Y-S. Pyrolysis Characteristics and Kinetics of Food Wastes. Energies. 2017; 10(8):1191. https://doi.org/10.3390/en10081191
Chicago/Turabian StyleJo, Jun-Ho, Seung-Soo Kim, Jae-Wook Shim, Ye-Eun Lee, and Yeong-Seok Yoo. 2017. "Pyrolysis Characteristics and Kinetics of Food Wastes" Energies 10, no. 8: 1191. https://doi.org/10.3390/en10081191
Note that from the first issue of 2016, this journal uses article numbers instead of page numbers. See further details here.