
Exploring Marine Energy Potential in the UK Using a Whole Systems Modelling Approach


1
Energy Technologies Institute, Loughborough LE11 3UZ, UK
2
Institute of Energy Systems, University of Edinburgh, Edinburgh EH9 3DW, UK
3
College of Engineering, Mathematics and Physical Sciences, University of Exeter, Penryn TR10 9EZ, UK
*
Author to whom correspondence should be addressed.
Energies 2017, 10(9), 1251; https://doi.org/10.3390/en10091251
Submission received: 5 July 2017
/
Revised: 11 August 2017
/
Accepted: 16 August 2017
/
Published: 23 August 2017
(This article belongs to the Special Issue Marine Energy)
Abstract
:The key market drivers for marine energy are to reduce carbon emissions, and improve the security and sustainability of supply. There are other technologies that also meet these requirements, and therefore the marine energy market is dependent on the technology being cost effective, and competitive. The potential UK wave and tidal stream energy market is assessed using ETI’s energy systems modelling environment (ESME) which uses a multi-vector approach including energy generation, demand, heat, transport, and infrastructure. This is used to identify scenarios where wave and tidal energy form part of the least-cost energy system for the UK by 2050, and will assess what Levelised Cost of Energy (LCOE) reductions are required to improve the commercialization rate. The results indicate that an installed capacity of 4.9 GW of wave and 2.5 GW of tidal stream could be deployed by 2050 if the LCOE is within 4.5 and 7 p/kWh for each respective technology. If there is a step reduction to the LCOE of wave energy, however, a similar capacity of 5 GW could be deployed by 2050 at a LCOE of 11 p/kWh.
1. Introduction
If exploited, the marine energy resource has great potential to help meet the policy targets for renewable energy and to reduce carbon emissions in the UK [1]. Wave and tidal energy has been an area of interest to the UK for several decades, initially as a means to improve the security of energy supply in the 1970s after the oil crisis, and secondly from the 1990s as a response to climate change awareness, and the need to reduce carbon emissions [2].
The practical wave resource, taking shipping, fishing and environmental restrictions into account, in the UK is estimated as 70 TWh/year in offshore regions, and 5.7 TWh/year in nearshore [3]. The practical tidal stream resource is estimated as 20.6–29 TWh/year [4] and therefore if both resources are utilised, and compared with the UK’s annual demand of 360 TWh/year, could supply over 10% of the expected 2050 electricity demand [5]. This potential has inspired many developers, with over 250 wave energy companies and close to 100 tidal developers [6], as well as policy makers, who have set ambitious targets for marine energy. For example, in 2011 the Department of Energy and Climate Change (DECC) stated that a wave and tidal stream capacity of 27 GW could be deployed in the UK by 2050 assuming a high deployment scenario [7].
According to the 2015 Ocean Energy Systems (OES) Annual Report, however, there was 960 kW of installed wave power and 2100 kW installed tidal stream in the UK indicating that DECC forecasts will not be met [8]. This slower than anticipated growth in the UK has meant several developers have had to cease operating as the full challenges of marine energy are realised [9,10,11].
To fully exploit renewable energy sources, it is essential to have a varied portfolio of complementary sources to reduce variation, and the impact of intermittency [12]. Several studies have highlighted the benefit of co-locating wind and wave power offshore, and locations with the greatest potential are along the west coast of the UK and Ireland [13,14]. This potential to share infrastructure and operations and maintenance, thereby reducing overall levelised cost of energy (LCOE), indicates the value in continuing to research wave energy to complement the wind industry to enable the UK to meet the policy targets. Tidal stream has the advantage of being predictable decades into the future, and therefore variation can be planned and complemented by other generation technologies on the grid well in advance.
To encourage the development of renewable energy there needs to be high level market drivers and current policy targets with this aim include:
- the European commission renewable directive that states 15% of all energy consumption met from renewables by 2020, and 27% renewable as final energy consumption by 2030 [15],
- the 2008 Climate Change Act with the UK aiming to reduce greenhouse gas emissions by at least 80% (from the 1990 baseline) by 2050 [16],
- Scotland’s green strategy outlining 2030 target for 50% of Scotland’s heat, transport and electricity consumption to be from renewable sources [17].
It is clear that electricity generation is just one facet of the system that needs to improve if these targets are to be possible. The whole energy system, including transport, infrastructure, heat, and demand management, needs to be progressed with these policies in mind. The potential of wave energy has been assessed by Hayward [18] using the global and local learning model (GALLM) and the energy sector model (ESM) for the Australian energy system. GALLM applies learning curves based on the global deployment of technologies, and the ESM has state resolved detail of the electricity generation and transport. The analysis showed that wave energy could form up to 9% of the 2050 Australia grid if capacity factors were high (0.50–0.58) and if 25% of the installed power was assumed to be constant. Nuclear power was not included in the analysis due to Australian policy. In this case the capital expenditure (CAPEX) was fixed across scenarios and the capacity factors were varied for high, medium and low scenarios and the effect of carbon price was assessed.
Studies relating to the UK’s system include the marine energy roadmap, [19], developed by the Energies Technologies Institute (ETI) and the UK Energy Research Centre (UKERC). The purpose of the roadmap was to provide long term goals for wave and tidal energy, and stated that by 2050 a LCOE of 5–8 p/kWh is required for a deployment between 10 to 20 GW. Previous publications, such as Future Marine Energy [20] by Carbon Trust assessed the cost curves in different learning rate scenarios with deployment of wave and tidal. This concluded that wave energy required a step change or fast learning to make the technology competitive with reasonable amounts of investment. For the analysis an initial 22–24 p/kWh was used with competitive targets of 8.5, 6, 5 and 2.5 p/kWh. The tidal stream analysis concluded that it could become competitive with 2.8 GW installed capacity across different tidal velocity sites.
Since the publication of the aforementioned reports, surveys to wave and tidal developers have provided more detailed data for the technology cost forecasts [21]. The Ocean Energy Systems (OES) levelised cost of energy report gives the range of values received from 11 wave and 8 tidal developers, as well as historical cost data, for first, second, and commercial arrays and assess the long term LCOE predictions with cumulative deployment. The findings of this report will be discussed in greater detail in Section 2.
The aim of this paper is to link the recent estimates from the developer survey, to the top down targets from roadmaps, and assess if these latest estimates enable wave and tidal stream energy to be competitive to other renewables in the long term. This will be achieved using the Energy Technologies Institute’s (ETI’s) energy system modelling environment (ESME), which allows the user to input stipulated carbon reduction targets, and technology data, to model the time period 2010 to 2050. The whole system approach enables electricity generation, demand, transport, heat and infrastructure to be considered, and the least cost optimisation is calculated. Scenarios excluding carbon capture storage (CCS) will also be explored to see the effect on the overall system and sensitivities of marine technology.
This paper is organised in five sections. Section 2 presents background information and previous studies for assessing the levelised cost of energy for marine energy. Section 3 describes the ESME model and input parameters that were used in the analysis including resource data. Section 4 and Section 5 discuss the results from the analysis, and Section 6 summarises the conclusions and recommendations for further work.
2. Background
2.1. Levelised Cost of Energy (LCOE)
LCOE is a standard metric used to compare the economic feasibility of energy generation technologies. It includes parameters; capital expenditure (CAPEX), annual operation and maintenance (OPEX), and annual electricity production (AEP), which takes capacity factor and availability over the lifetime of the technology into account as shown by Equation (1) [21]. A discount rate is included to calculate the present value of future costs, similar to Net Present Value (NPV) analysis.
Current estimations of LCOE for marine renewables [7,8,19] indicate a range of 15–55 p/kWh for the second arrays, decreasing to 5–15 p/kWh with a cumulative deployment of 10 GW for grid level deployment. The results of a developer survey are summarised in Table 1 which are used as an initial case for this analysis [21].
The report states that the grid connection is assumed to be less than 5 km for the early deployment stages, and that the majority of developers assumed transmission accounted for 10% of the CAPEX cost for commercial scale array, or 6–8% of LCOE for both wave and tidal cases. As wave and tidal energy are at the early stages of development, there is a large amount of uncertainty associated with these values; however, the report does discount extreme values and includes developers with a device rated at a technology readiness level (TRL) greater than 5.
2.2. LCOE Comparisons
To be able to assess how marine energy can form part of the whole system, it needs to be compared with other electricity generation technologies. This is of particular relevance since the details of round 2 contracts for difference (CFD) allocation show wave and tidal energy will be competing against offshore wind, and biomass. Despite a strike price of £300–310/MWh for wave, and £295–£300 for tidal, offshore wind is £100–105/MWh and therefore to be competitive, it is likely marine will have to decrease further [23]. Table 2 shows the LCOE for a selection of energy generation technologies that are used by the ESME model. These figures have been calculated using information from ETI projects, industry knowledge, and published reports. The table summarises the 2010 and 2050 LCOE values for comparison but it is worth noting, each technology will have a different shaped profile based on historical data between 2010 and 2017 as ESME is updated when data becomes available. For example, the LCOE for a solar farm has seen a close to exponential cost decrease and this is accounted for in the CAPEX input profile [24]. References are given in the table and further details are available in the ESME data book [25].
3. Method
3.1. Model Overview
To aid the transition pathway and develop strategies that achieve a high penetration of renewable energy sources, modelling tools can provide a method to assess the technical and economic impacts of investing in such technologies [29]. Such models have been developed since the second half of the 20th century for aiding long-term strategic planning [30], however including renewable energy sources presents a more complex problem due to the variability and spatial distribution [31]. Models are typically defined by the scale, for example whole energy system or electricity system, and if they are to be used for scenario or forecasts. A full review of energy models and a comparison and discussion of challenges can be found in [30,31].
ETI’s energy system modelling environment (ESME) is described as an energy system optimisation model (ESOM) which are primarily used to provide scenarios describing how the whole system could evolve [30]. These comprise a technology rich, bottom up approach, and include all aspects of the energy system. One of the key challenges associated with ESOMs are defining an adequate resolution time and space which has been addressed in ESME by dividing the UK into 12 onshore, and 12 offshore regions. It was developed by the Energy Technologies Institute to aid investment decisions for technologies that have the greatest potential to meet carbon reduction targets.
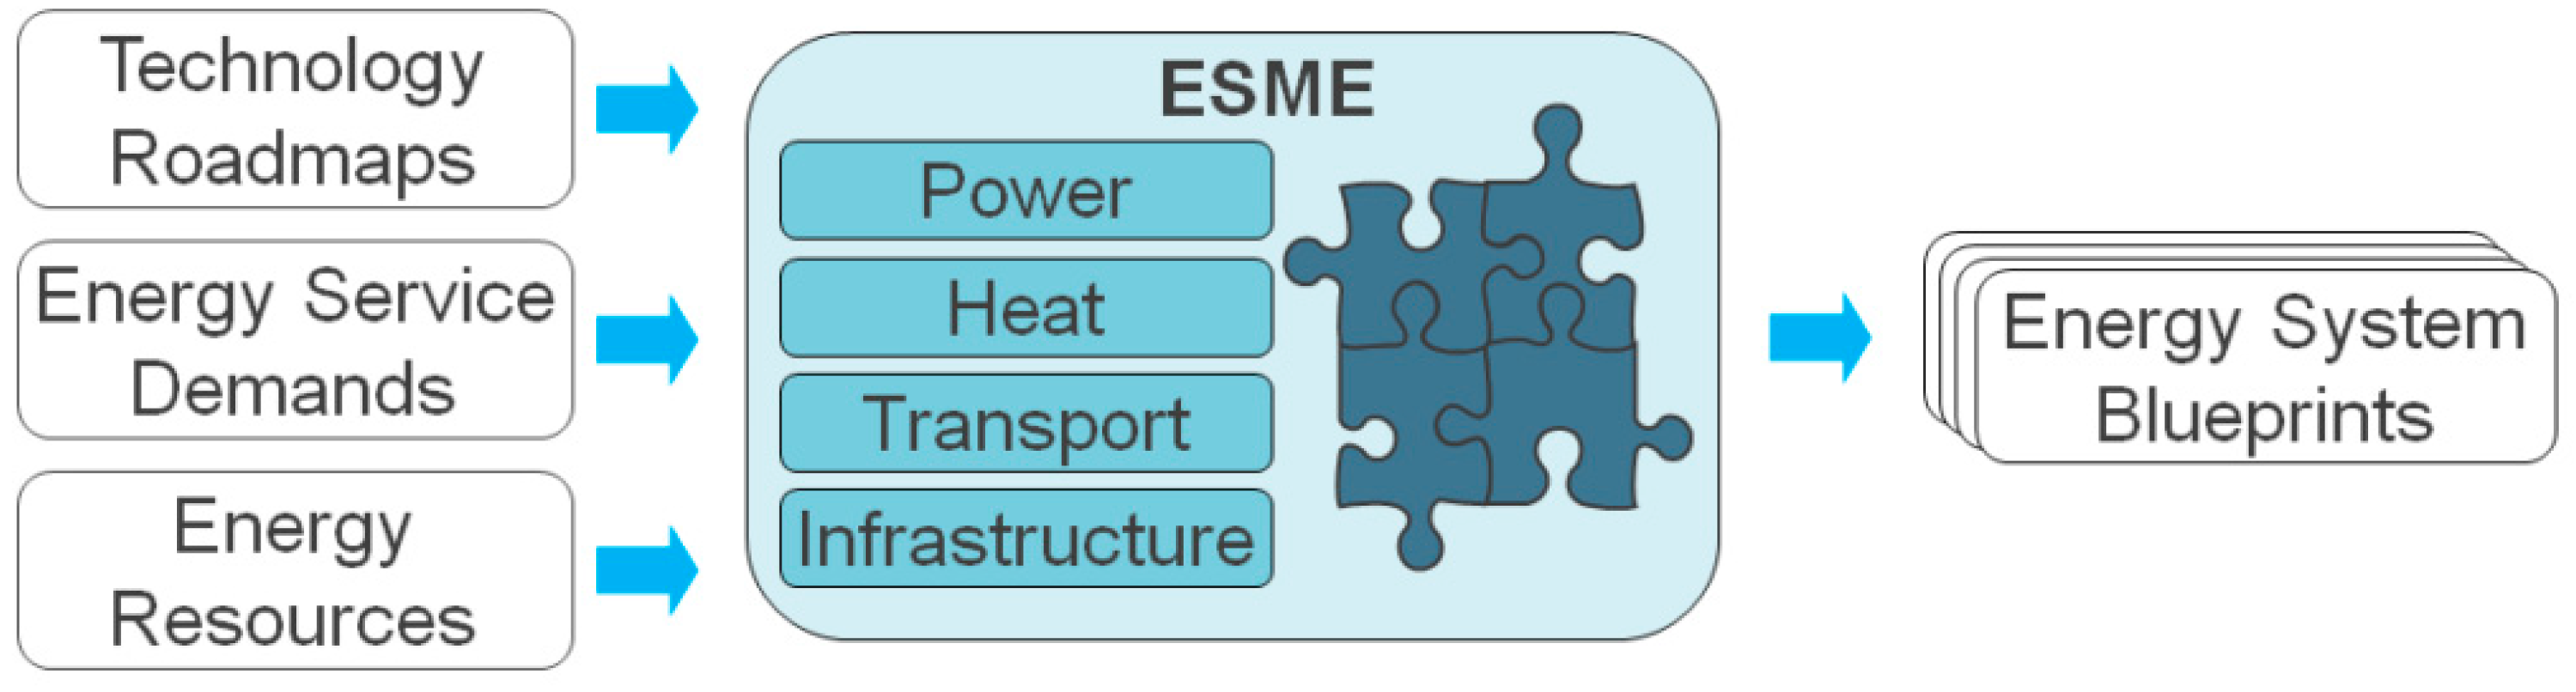
ESME is based on the time scale 2010–2050 and is a multi-vector model including electricity generation, transport, storage, demand, and transmission. As the detail of the model has been improved and peer reviewed, the use of its outputs and insights has expanded into more strategic policy contexts by not only its member organisations, but also third parties and academia. A schematic diagram of ESME is shown in Figure 1.
Technology roadmaps, developed as part of ETI projects, or externally published reports, are used by the model to predict the parameters such as CAPEX, OPEX and capacity factors for various technologies across the power, heat, transport and infrastructure areas. Where historical information is available from 2010 to 2017, this is used, and then extrapolated to 2050. Where there is limited historical data, such as for wave and tidal, there is a higher level of uncertainty associated with the inputs, and a greater number of assumptions, which adds to the monte carlo anaylsis.
The Energy Service Demands section models the overall demands on the system from 2010 to 2050, and provides a link between, for example, the uptake of electric vehicles increasing the demand to the grid and hence generation capacity required. This section also includes a level of uncertainty regarding the future cost and energy prices. There is an element of spatial distribution included in the demand, and it includes all energy vectors: power, heat, and transport.
The Energy Resources are assigned to applicable nodes where the resource is available. The total resource values are also defined from ETI projects, or externally completed reports such as the Carbon Trust for the wave and tidal resource. Resource studies are generally at a higher resolution than ESME, and therefore they are combined over a given area for the nearest applicable node. This section also includes information regarding fuel cost forecasts for industrial processes, electricity generation, and transport.
The model then takes the information across each vector and generates energy system blue prints, which are possible up to 2050, that meet the stipulated carbon reduction targets for the least cost, while satisfying the demand in each time step. These are not meant to be forecasts, but show potential whole system designs that could meet the stipulated emission targets, for the least cost.
The central approach taken in ESME is a policy-neutral cost optimisation that find the least cost energy system, while meeting stipulated sustainability and security targets. The model takes account of technology operation, peaks in energy demand, and UK geography. The aim of the model is to examine the underlying cost and engineering challenges of designing energy systems, and therefore taxes, subsidies and other policies which affect the price of technologies or fuels are absent.
The model includes:
- Uncertainty analysis, different to other optimisation models such as MARKAL-TIMES [32], and therefore is able to complete many runs based on different combinations of parameters and ranges of values;
- Temporal variations are included in two scales; seasonal (summer and winter) and diurnal (each day is split into 6 time periods) this enables an element of demand and resource variation to be captured;
- Spatial factors are also included in the model as the layout shows in Figure 2. These include 12 onshore, 10 offshore, and 3 offshore carbon sequestration nodes which also distinguishes it from other optimisation models.
The constraints applied to the model include:
- Electricity, heat and transport demands are met within each time slice;
- Carbon dioxide emissions meet the targets stipulated by the user annually;
- Resources are not used greater than the maximum available;
- Rate of deployment is within the limits of the technology;
- The security of the system is tested and it is ensured that all anticipatedpeak demands are met.
3.2. Model Parameters
In this analysis the variable parameters are the capital expenditure (CAPEX) for wave and tidal technologies (£/kW), and the capacity factor (%). The fixed parameters include the resource values and locations, transmission costs and distances, operational and maintenance expenditure (OPEX), electricity demand, discount rate, and the parameters for other generation technologies.
- Wave and Tidal Resource: The resource data has been summarised from previous ETI projects, and available reports including Carbon Trust and Black and Veatch wave and tidal resource [3,4]. The practical resource was chosen as this would capture some likely restrictions, however does not include the cost modelling assumptions. The references take spatial constraints such as fishing, shipping and environmental restrictions into account but states that the total resource extracted depends ultimately on how much we are prepared to pay. The two studies take into account the resource characteristics around the UK, where the tidal report has assessed 30 key tidal sites, and the wave study is limited by the UK’s Exclusive Economic Zone. The quality of the resource is not considered in this analysis and there is no assumption of the device size or capture width that would be required to absorb the energy at each node. Figure 2 shows the total resource values (TWh/year) and locations with the majority of wave resource being applied to the west coast of England, Wales, and Scotland, and tidal to coastal locations in the north, south and west. The resource values are consistent over the models time scale.
- Transmission: The transmission grid is taken into account using a high level, and large scale layout with costs included for High Voltage Alternating Current (HVAC) onshore, HVAC offshore, and High Voltage Direct Current (HVDC) offshore. The offshore transmission distances were determined from the resource location to the coast, and an onshore cable transmission distance from the coast to nearest onshore node, Table 3. The costs, shown in Table 4, include installation and additional plants such as substations and power conversion. It is assumed that, where the resource is greater than 70 km from the coast, an HVDC cable will be used, and an HVAC for distances less than 70 km [34]. While the export cable was included in the LCOE calculations in the developer survey, details of site location and distance from shore was not clear. It was generally found that the transmission accounted for 6–8% of the total LCOE, however it is considered separately in this analysis.
- CAPEX: The CAPEX input profiles are shown in Figure 3a,b for wave and tidal energy generation technology respecitvely. For wave, the 2015 values were fixed to £3250/kW as the minimum value given for a first array from the developer survey [21]. Straight line profiles are assumed with a range of 2050 costs, with the exception of one wave run to model a steep reduction in cost in 2020. In this case the 2020 CAPEX is the first commercial scale project minimum cost from developer estimates. This scenario assumes there is a step change to the current technology as the sector is very much at the early stage of development with several areas for innovation potential [35].
The tidal input values are based on a fixed 2015 value of £2700/kW which is approximately the first commercial array minimum estimate from the developer survey. This value was chosen as the first commercial array of tidal turbines is currently being installed [36], and the minimum was chosen to ensure capacity is deployed in the model. As the technology is more developed and converged, no step change scenario was included. Wave and tidal are assessed separately and the black line indicates the profile that was fixed during the analysis of the other technology. The 2015 values were extrapolated back to 2010.
- OPEX: As no commercial scale wave or tidal technologies have been deployed for a prolonged period of time, initial OPEX costs have been chosen based on developers estimates, using the minimum first array value for wave, and minimum commercial array for tidal [21]. A decrease by 1.5% annually to 2050 was used, resulting to a similar value to offshore wind, approximately £40/kW per year, with tidal being slightly less, £38/kW per year, to account for the closeness to shore [27].
- Capacity Factor: The capacity factor is a measurement of the average production of a plant over a period of time. It is calculated by comparing the amount of actual energy production during a given period to its theoretical output if it were possible for the plant to operate at full rate power over this same time period. In this analysis the capacity factor will be varied from 15% to 40% at 5% intervals for each CAPEX profile. These were chosen for wave based on the average capture width ratios discussed in [37], and tidal based on the maximum extractable power [38]. Capacity factors are kept constant from 2010 to 2050 for each model run.
- Financial assumptions: A cost of capital discount rate of 8% (real) is assumed for all technologies. This rate is used when annualising capital costs over the lifetime of a technology and when calculating the cost of interest during construction. A discount rate of 3.5% is used for all net present value (NPV) calculations in ESME, as recommended by the HM Treasury’s Green Book [39]. Both these rates are used when calculating LCOE and are assumed for all technologies across the system. The model assumes the technology would be at a mature level when deployment occurs at grid scale and therefore the combination of the two rates is considered appropriate for comparing many technology options.
- Build rate and period: There is a limit applied in the model for the maximum capacity that can be installed each year. This is set as 0.01 GW for 2015 to 2020 to take into account the development time for wave and tidal technology. From 2020 to 2050 the maximum installation rate for wave is 2 GW per year, and 5 GW per year for tidal. This is based on the rate applied to offshore wind in the ODIS ‘Sustainable Growth’ scenario wind [40]. The construction period is set at 2 years, and lifetime of both technologies is 20 years.
3.3. Modelling Scenarios
Least cost optimisation: The first stage of the analysis is a least cost optimisation which was completed using ESME with stipulated carbon reduction targets based on current policies. This method chooses the optimum system that is able to meet these targets with the lowest overall cost.
Scenario analysis: The second stage of the analysis involves modelling scenarios to understand how the system may change if limits are set on certain technologies. In previous ETI studies, carbon capture storage (CCS) has been identified as a technology with potential to reduce carbon emissions with relatively low cost [41]. Due to uncertainty around this technology [42], limits were applied in ESME where no CCS is constructed to assess the effect on marine energy and the overall system.
4. Results
4.1. Wave Energy
4.1.1. Least Cost Optimization and No CCS
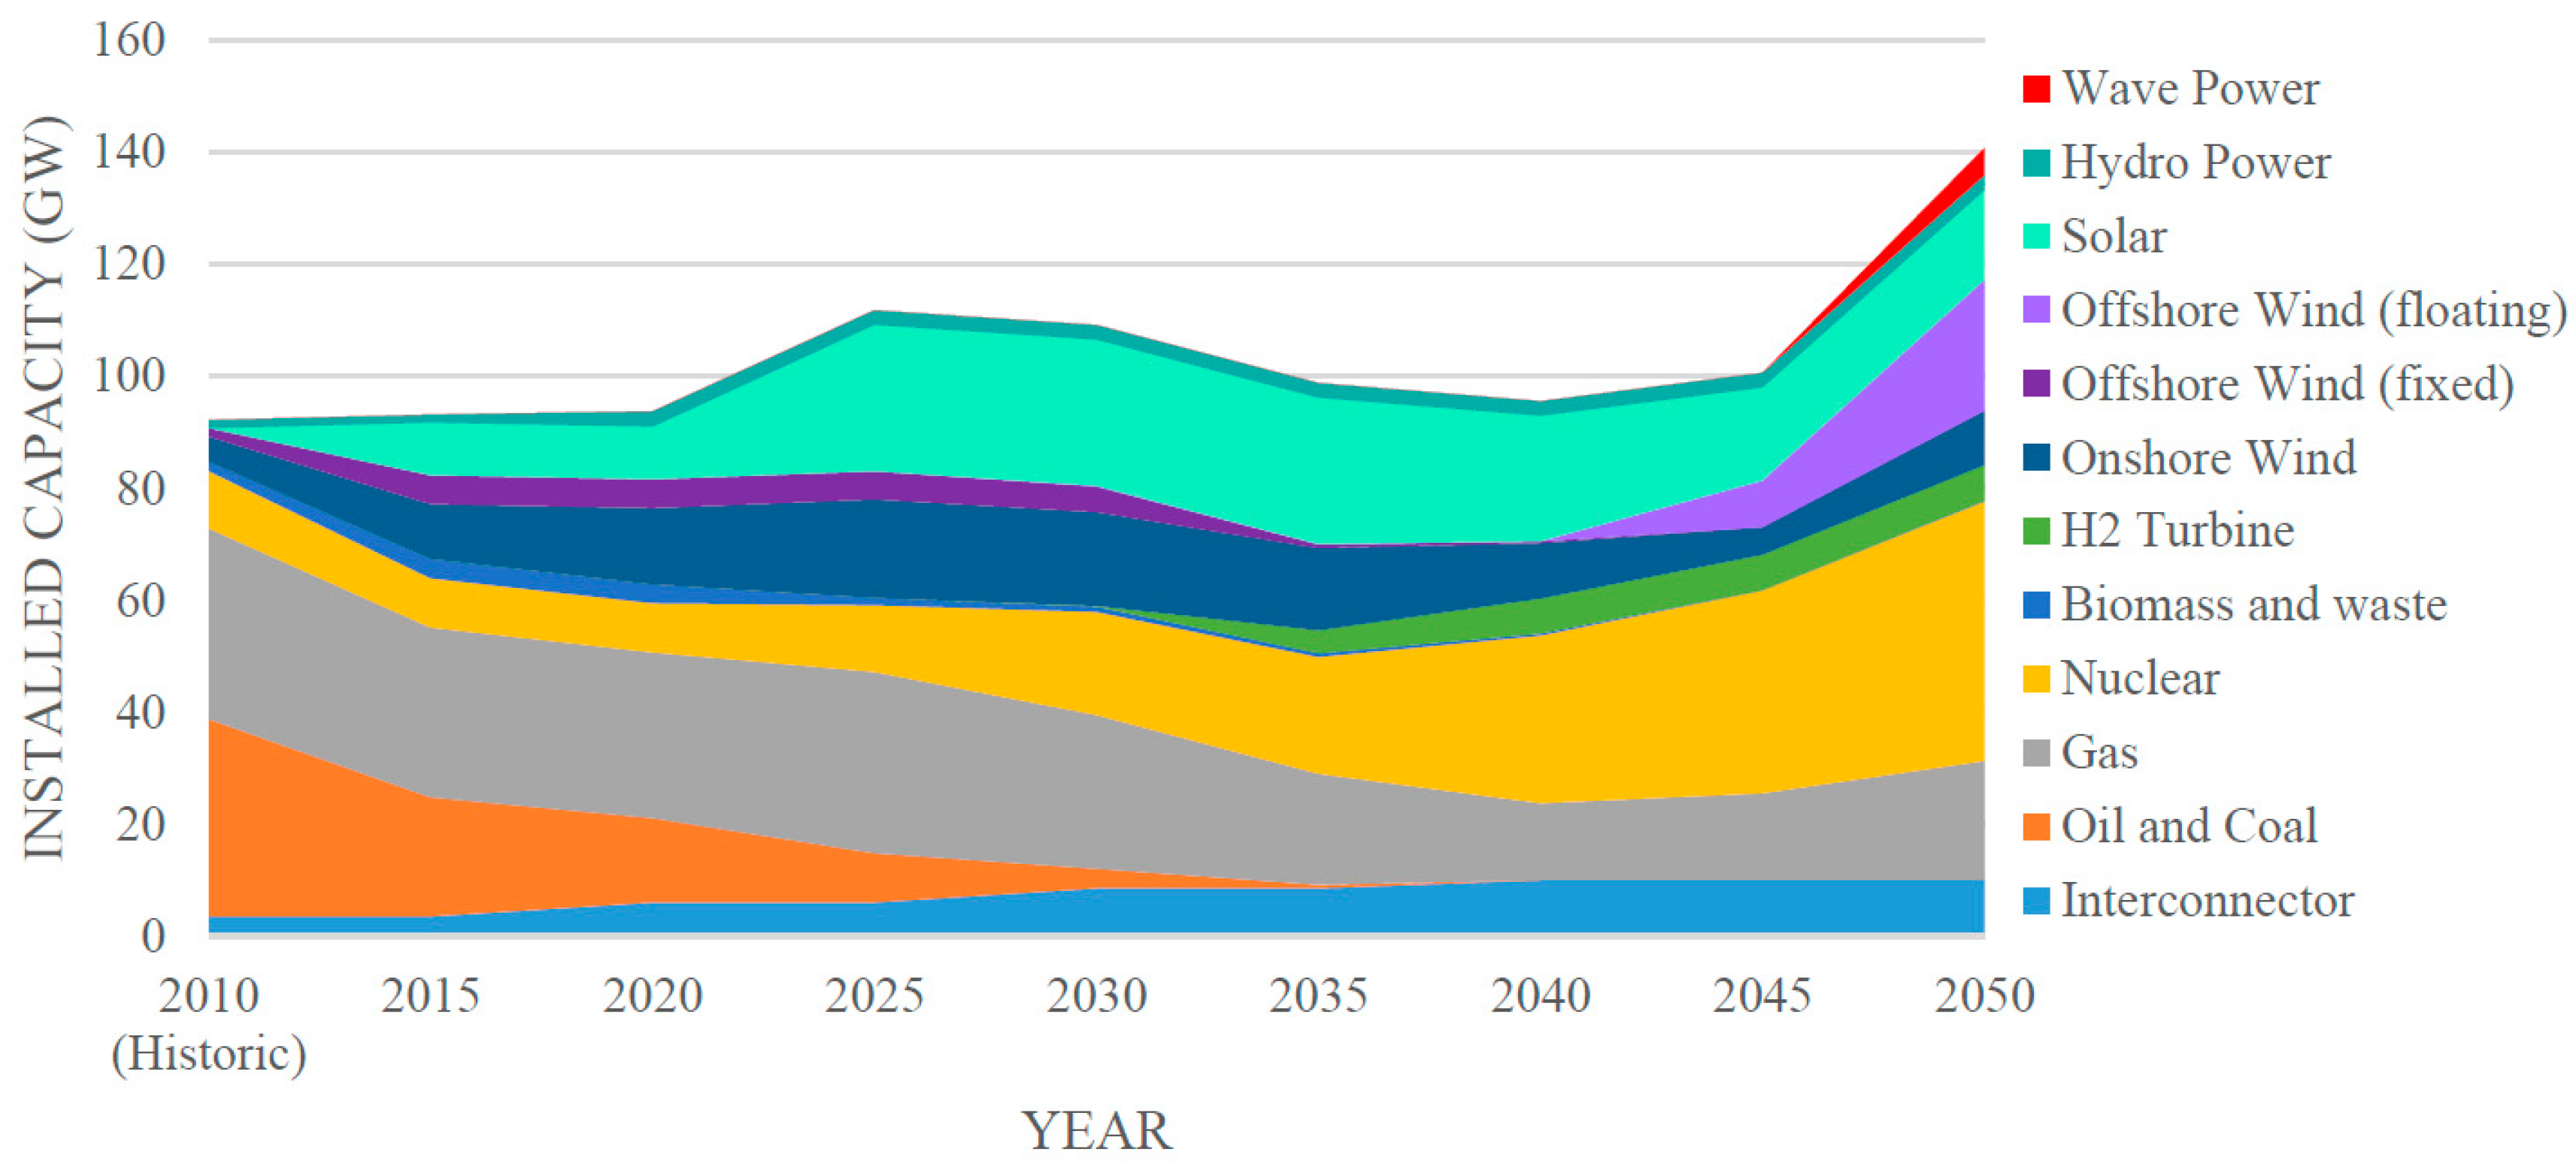
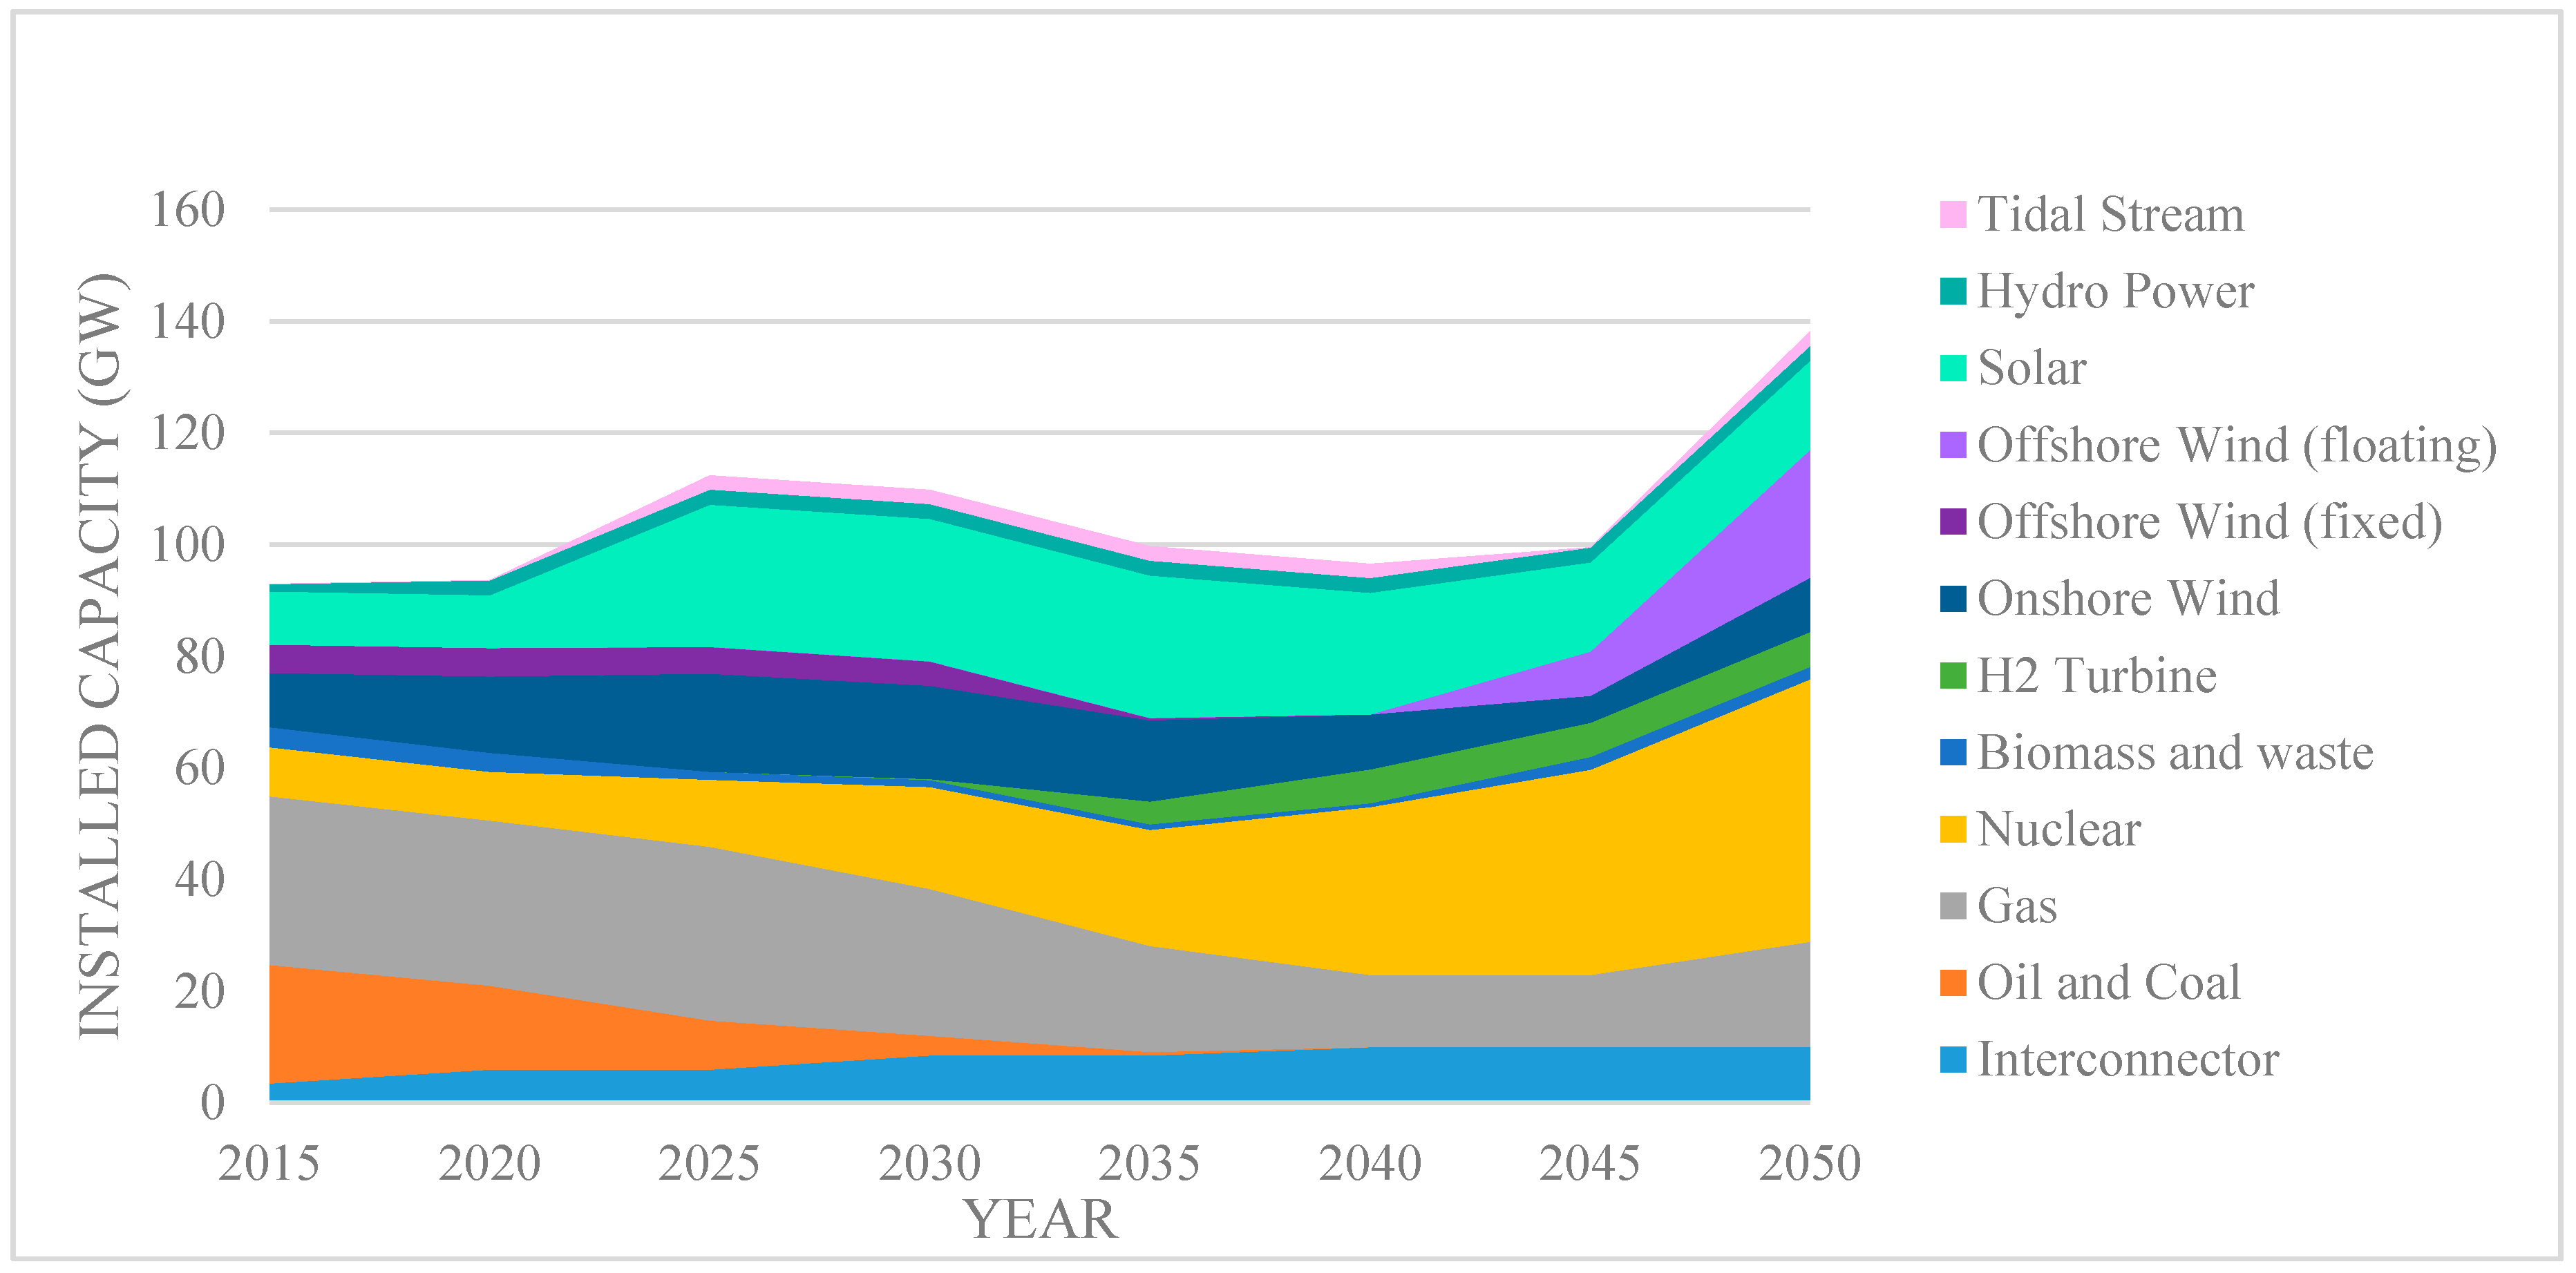
Figure 4 shows a breakdown of the electricity generation capacity where all stipulated carbon reductions and renewable energy targets are met, for the overall least cost. In this scenario, wave has a 2050 LCOE of 4.37 p/kWh (CAPEX of £1000/kW and capacity factor of 40%), and the model shows 4.9 GW of installed capacity between 2045 and 2050. The majority of the capacity is installed on the Lundy node, at the south west, with a small amount at Wales, and Pentland offshore nodes.
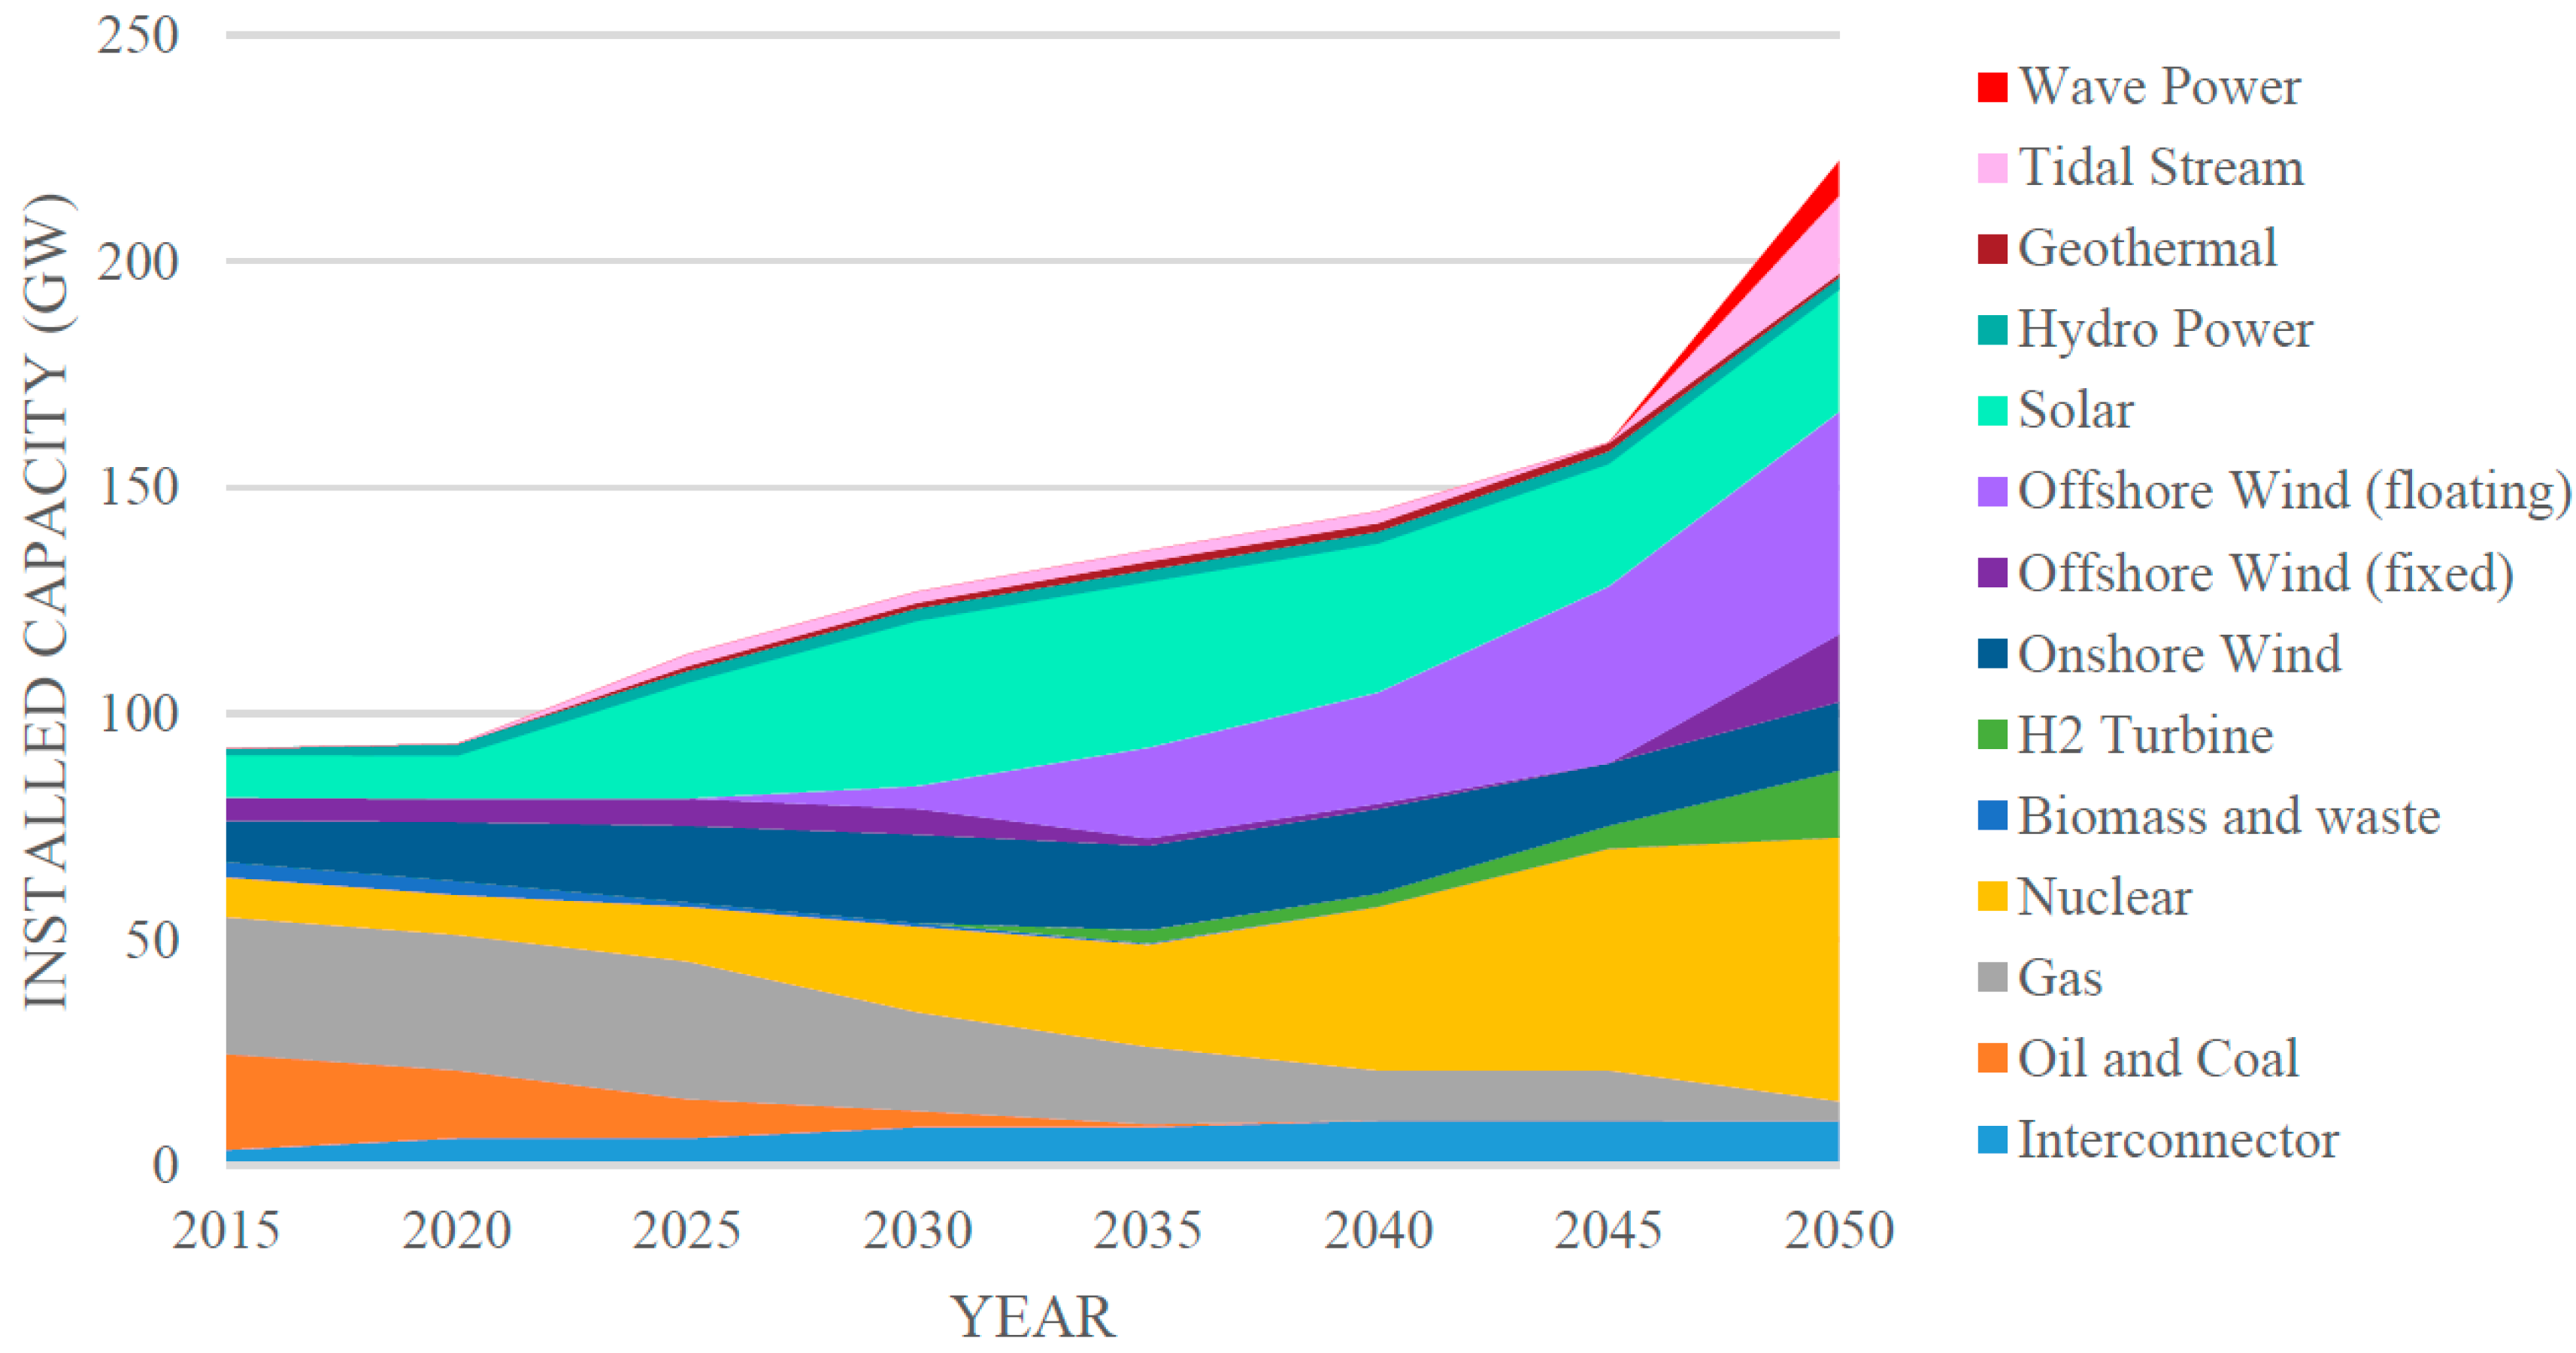
When there is no CCS included in the system (included in the gas data subset), a greater capacity of renewables is required to meet the carbon reduction targets, Figure 5. Due to the variability and lower capacity factors of renewables, a greater overall capacity is required, from 140 GW in the least cost optimisation, to 220 GW with no CCS. This increases the total cost of the 2050 system, including transport, buildings and heat, infrastructure and power generation from £300 to £350 billion. The overall increase in demand is due to the increase in electrification of vehicles and transport to reduce the carbon emissions from these sectors, and other industries.
Offshore floating wind is deployed at an earlier stage and at a greater capacity, as well as fixed offshore wind compared to the base scenario. Using the same parameter for wave energy, 2050 CAPEX of £1000/kW and 40% capacity, 0.7 GW is deployed in 2025 and an additional 10 GW (limited by maximum build rate) in the period 2045 to 2050. Tidal stream is also part of the 2050 system in this case with 8 GW installed, with a 2050 LCOE of 5.6 p/kWh. Deployment only occurs in the period 2045–2050 with the exception of 1 simulation where the 2050 LCOE is 2.8 p/kWh.
From the large spatial scale used in ESME, it is possible to broadly assess the location where wave energy is installed in the different scenarios. The location with the greatest installed capacity is Lundy in the south west, and a small percentage at the Wales and Pentland nodes as shown by Figure 6 for the least cost optimisation.
The locations show similar results in the no CCS case, although there is a greater number of scenarios where it is deployed. When the 2050 LCOE is less than 4.4 p/kWh, it is deployed before 2045; however, no capacity is deployed at the Shetland node in any scenario, most likely due to the long offshore transmission distance to the main grid (200 km offshore and 320 km onshore), increasing the cost of deployment.
4.1.2. Step Change
The step change CAPEX profile is shown by the red line in Figure 3a and represents the possibility of an innovative change in technology. The profile uses the same 2015 value as before; however, it reduces steeply to 2020—to £2194/kW—which was given as a minimum for a commercial array in the developer survey [21]. It then continues to 2050 with a gradual reduction of 1.5% per year and has a 2050 LCOE of 5.6–14.8 p/kW depending on the capacity factor.
The location of the installed capacity is shown in Figure 7, with zero deployed at the Shetland node in any simulation. This indicates that, for significant installation in Scotland, a 2050 LCOE of less than 7.4 p/kWh is required, whereas for the England and Wales, less than 11.1 p/kWh would encourage deployment.
The step reduction also means that capacity is deployed between 2040 and 2045, 5 years earlier than the majority of previous scenarios. In the case where the 2050 LCOE is 5.6 p/kWh there is approximately 0.8 GW installed at the Wales node in 2020–2025 and this occurs just after the step reduction in CAPEX at an LCOE of approximately 9.8 p/kWh.
The overall installed capacity is summarized in Table 5 and although a lower LCOE is required for deployment to occur in Scotland, there is greater exploitation potential due to the amount of resource. The total capacity decreases in England and Wales as the capacity factor increases indicating the resource applied to that node is being fully exploited and thereby less installed capacity is required.
4.2. Tidal Energy
Using the simulation where tidal stream has a 2050 LCOE 4.9 p/kWh (CAPEX of £1000/kW and a capacity factor of 35%) Figure 8 shows that 2.5 GW of capacity is installed in the 2020–2025 period which continues to be part of the system until 2040 in the least cost optimization. By 2045, the tidal capacity is replaced, predominately by the uptake of offshore floating wind and an increase in nuclear energy; however, it is part of the system again in 2050, at the same capacity level. In reality, it is unlikely that this would occur; however, the model may be taking construction and installation times into account. The installed capacity is distributed on the onshore nodes with tidal resources: Wales, Norther Ireland, and Scotland. Wave is not chosen in any of the tidal least cost simulations.
When CCS is excluded from the system, Figure 9 shows that, with the same parameters, 17 GW of tidal stream is deployed in 2050, and 8 GW of wave (at a CAPEX of £1500/kW and capacity factor 35%). The whole electricity generation system breakdown is similar to the wave results, where the 2050 generation capacity is increased from approximately 140 GW to 220 GW to account for the increased amount of variable renewables required to ensure the carbon reduction targets are met. Floating offshore wind capacity increases from 2030 with no CCS, in comparison to 2045 in the base case, and onshore wind and solar remain relatively constant in both cases.
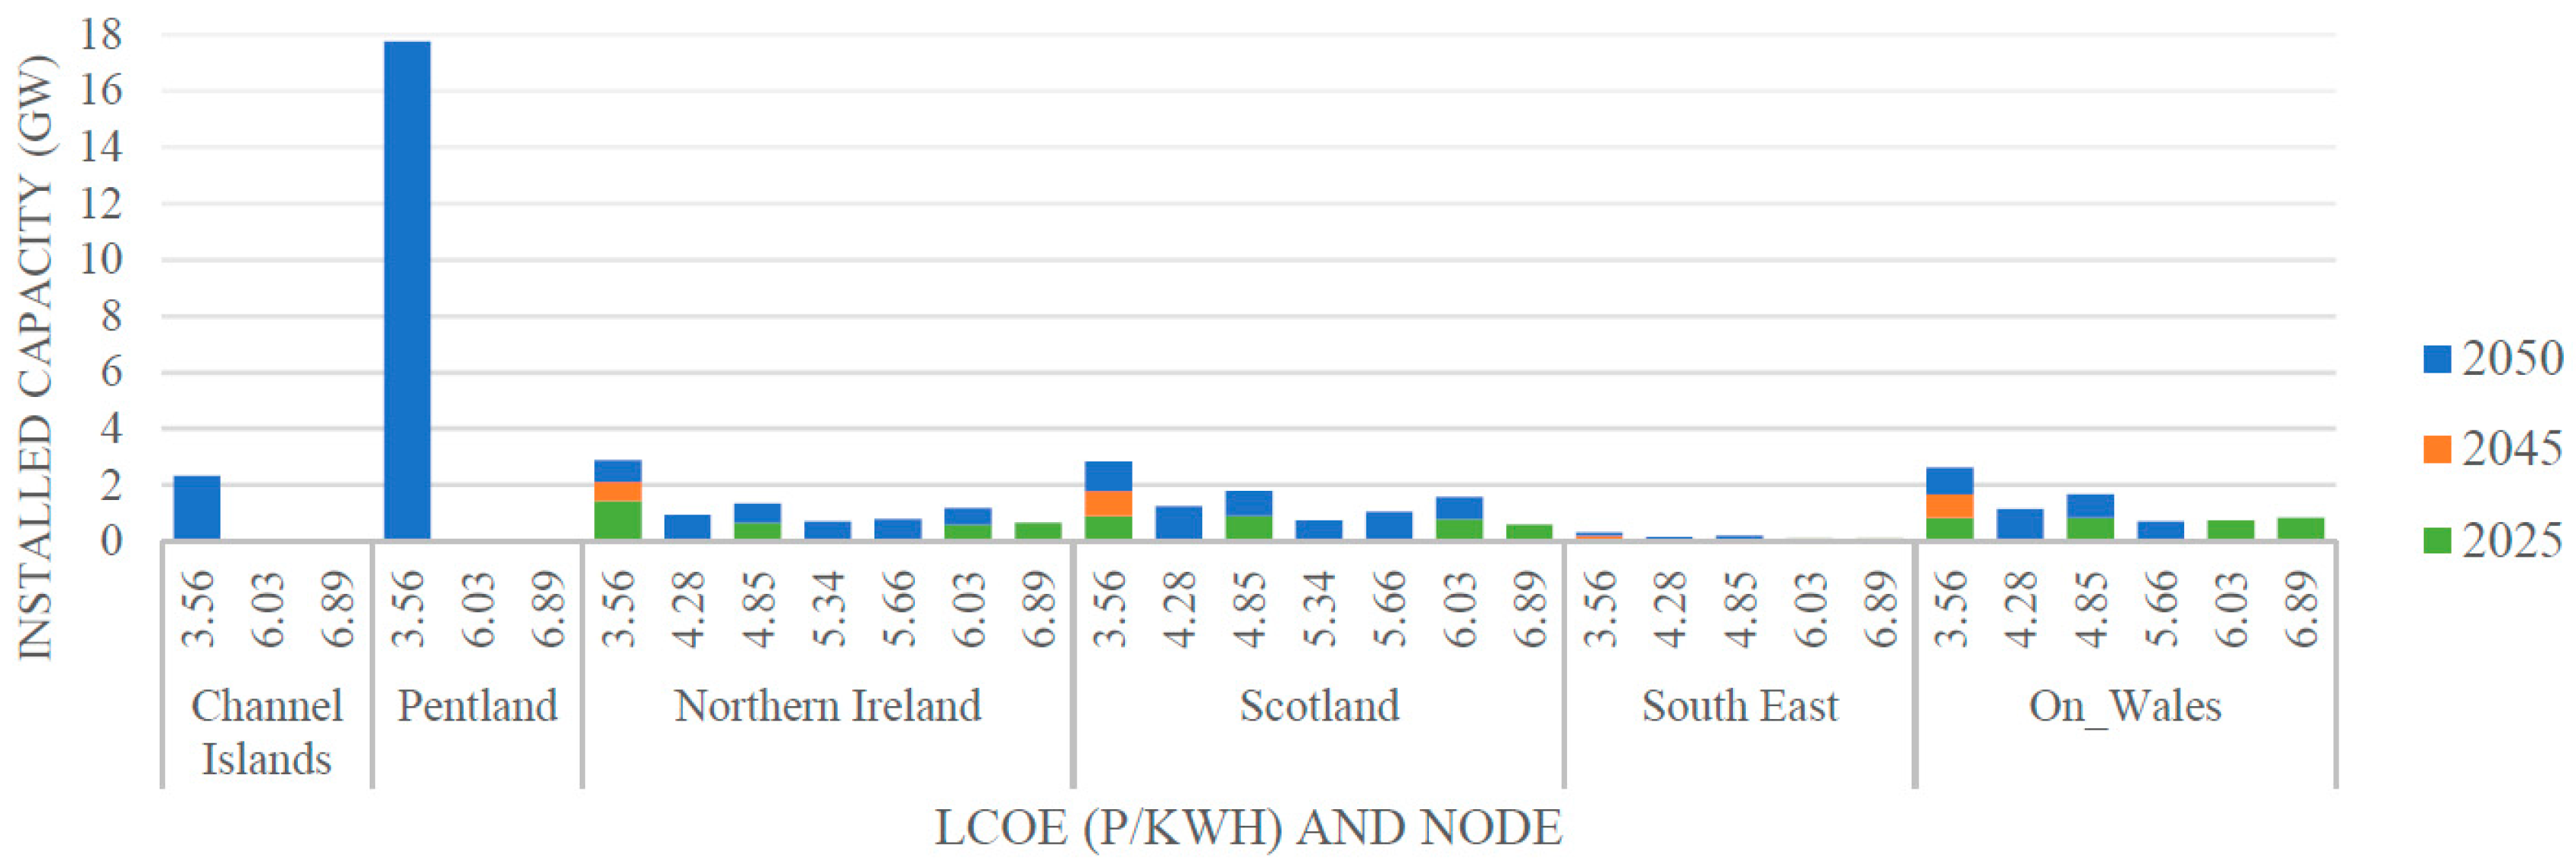
The locations of the installed capacity are summarised in Figure 10 for the least cost optimisation. Capacity is installed at the onshore nodes earlier in the majority of cases which reflects a 2025 LCOE of approximately 10 p/kWh. In order for capacity to be deployed at the offshore nodes, Channel Islands and Pentland, a LCOE of 3.56 p/kWh is required and does not occur until the period 2045–2050.
4.3. Tidal Stream and Wave Comparison
The installed capacity of wave and tidal stream technologies is summarised in Figure 11a,b and compared with the 2050 LCOE. In the least cost optimisation no wave capacity is installed with a LCOE above 4.5 p/kWh whereas for tidal, a small amount is deployed up to 6.9 p/kWh. The 2050 LCOE estimates for offshore fixed and floating wind are also shown on the graph for comparison, and the installed capacity is limited to be within the limits of the UK resource.
The wave and tidal technologies both become more favourable when CCS is not included in the model. In the absence of CCS, more expensive options are required in order to meet carbon targets, such as deeper decarbonisation of the heat and transport sectors. Renewables offer a zero carbon solution to generate power, albeit at higher costs, but their low capacity factors, combined with a lack of unabated flexible supply (in the form of CCGT with CCS), mean that higher levels of capacity are needed to satisfy demand. This all increases the marginal abatement cost, which is the cost of removing an additional unit of carbon from the system. As the cost to decarbonise the system increases, technologies that ordinarily would not form part of a least-cost system become more cost effective (since the lower cost solutions have already been deployed). It is for this reason that wave power remains competitive at LCOEs above 4.5 p/kWh and tidal above 6.9 p/kWh when CCS is unavailable.
The wave results, Figure 11a, show a gradual increase in capacity installed as the LCOE decreases as all wave resources are applied to offshore nodes, and therefore have the additional transmission costs included in all cases. In the least cost optimisation for capacity to be installed, the LCOE is less than fixed and floating wind, whereas in the no CCS case, there is some deployment above this level.
The tidal results, Figure 11b, however, show a steep increase in capacity when the LCOE is less than 4 p/kWh in the least cost optimisation, and less than 7 p/kWh in the no CCS scenario. This indicates the point where the offshore nodes are chosen, Channel Islands and Pentland. Some resources were applied to onshore nodes as the sites are generally less than 10 km from shore. The offshore cable costs are then not included in these LCOE calculations; however, due to the scale of the model, this was deemed an appropriate assumption. In the least cost optimisation deployment occurs at a higher LCOE than offshore wind of approximately 2.8 GW.
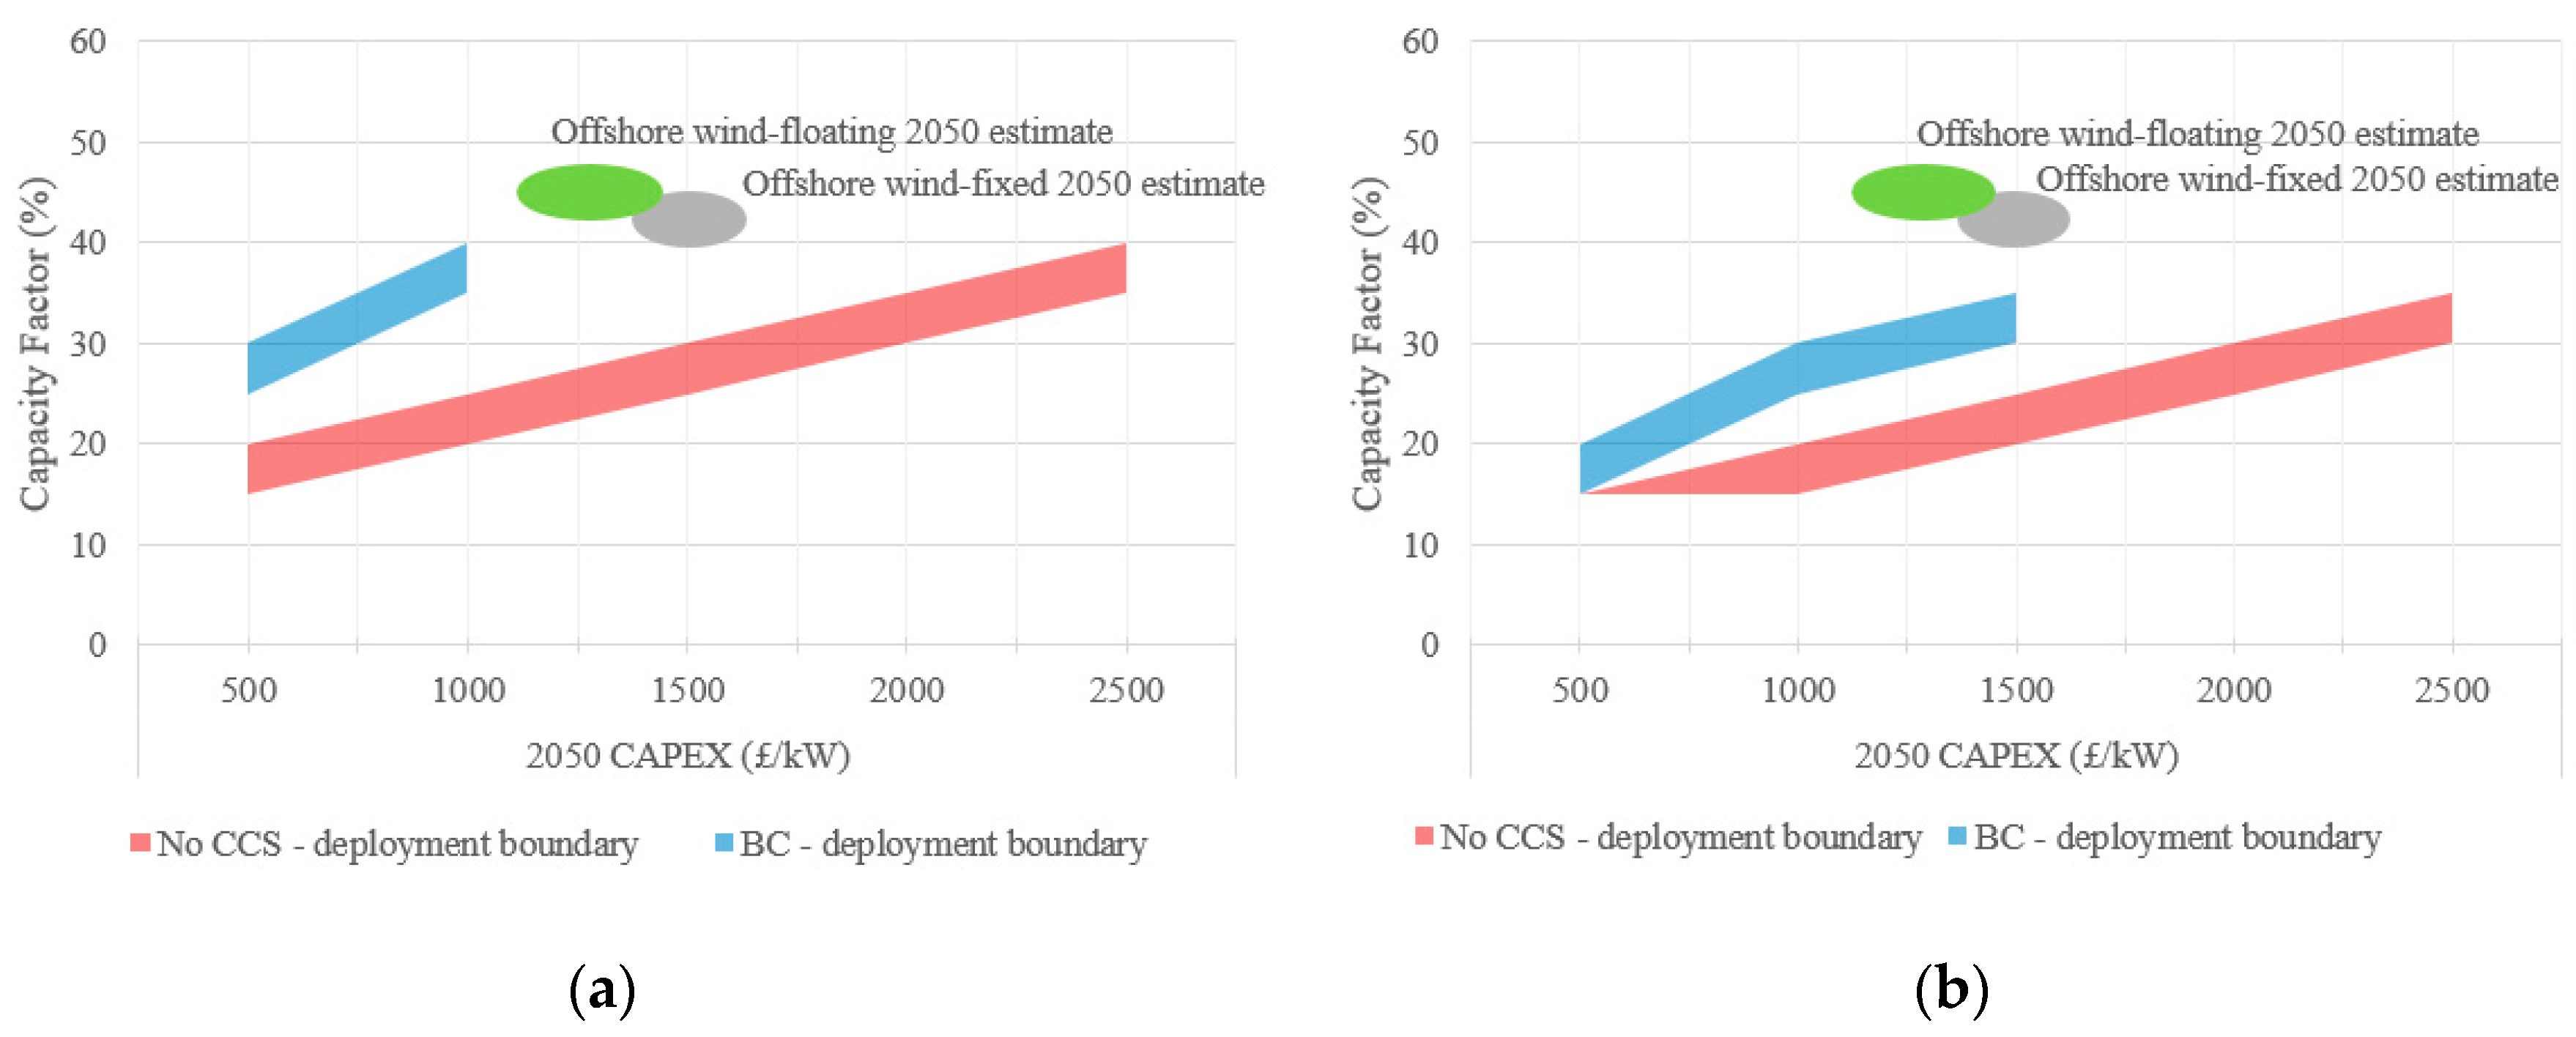
The economic boundaries where deployment of wave and tidal stream occurs are shown in Figure 12a,b for the least cost optimisation (blue) and no CCS (red). The upper boundaries indicate where a deployment greater than 1 MW occurs, and the lower where no deployment occurs. The wave results, Figure 11a show that in the least cost optimisation a CAPEX less than £1000/kW, and capacity factor greater than 30%, or a LCOE less than 4.5 p/kWh is required for deployment. When no CCS is deployed however, the CAPEX can be up to £2500/kW with a capacity factor of 40%, or a capacity factor of 20% could still be economical with a CAPEX £500/kW which equates to a LCOE of less than 9 p/kWh.
For tidal stream, a CAPEX less than £1500/kW with capacity factor greater than 30% is required in the base case for deployment, although a capacity factor of 15% could also be possible with a lower CAPEX of £500/kW. In the no CCS case, deployment occurs at higher CAPEX’s with lower capacity factors which represents a higher LCOE.
The grey area shows the predicted range for fixed offshore wind in 2050, and the green for offshore floating wind taken from the ESME predictions [26]. These fall above the economic boundaries for wave and tidal technologies, as the higher capacity factor enables a higher CAPEX. This forecast has a medium level of uncertainty associated with it based on the historical development of the sector (3.75%), and therefore highlights the challenge of wave and tidal to reduce CAPEX at a faster rate. These CAPEX values do not include the cost of the offshore transmission cable.
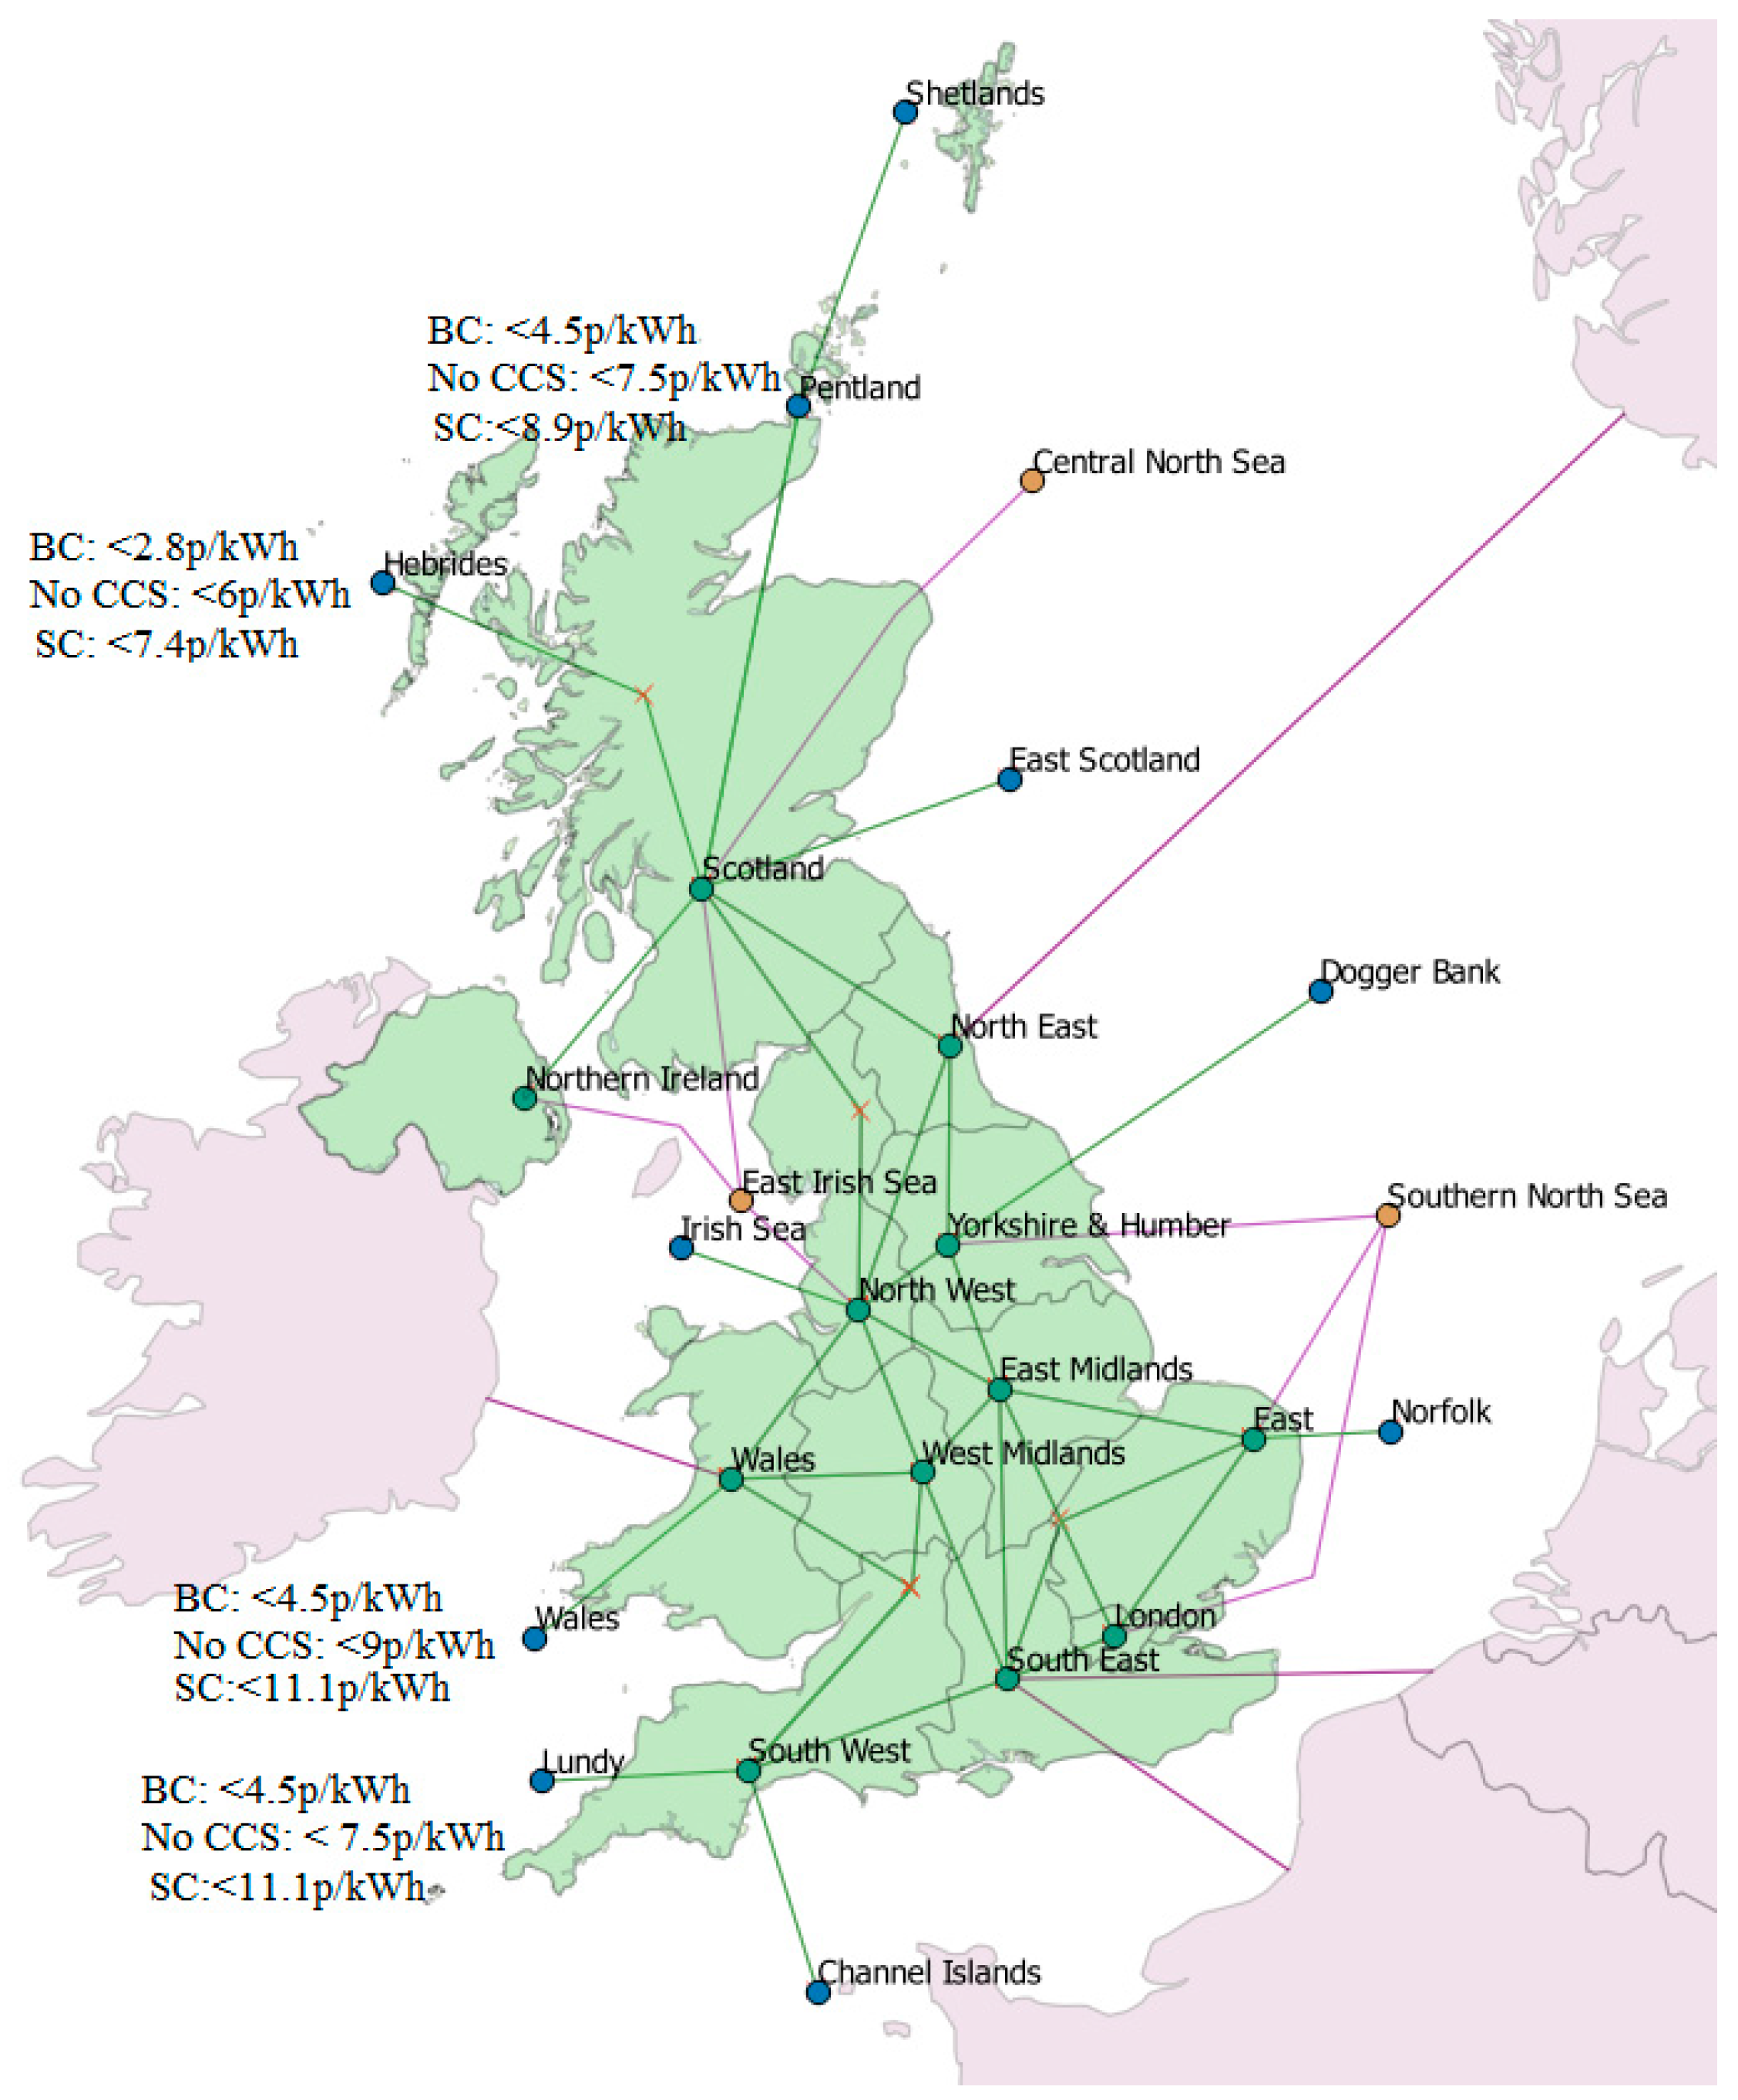
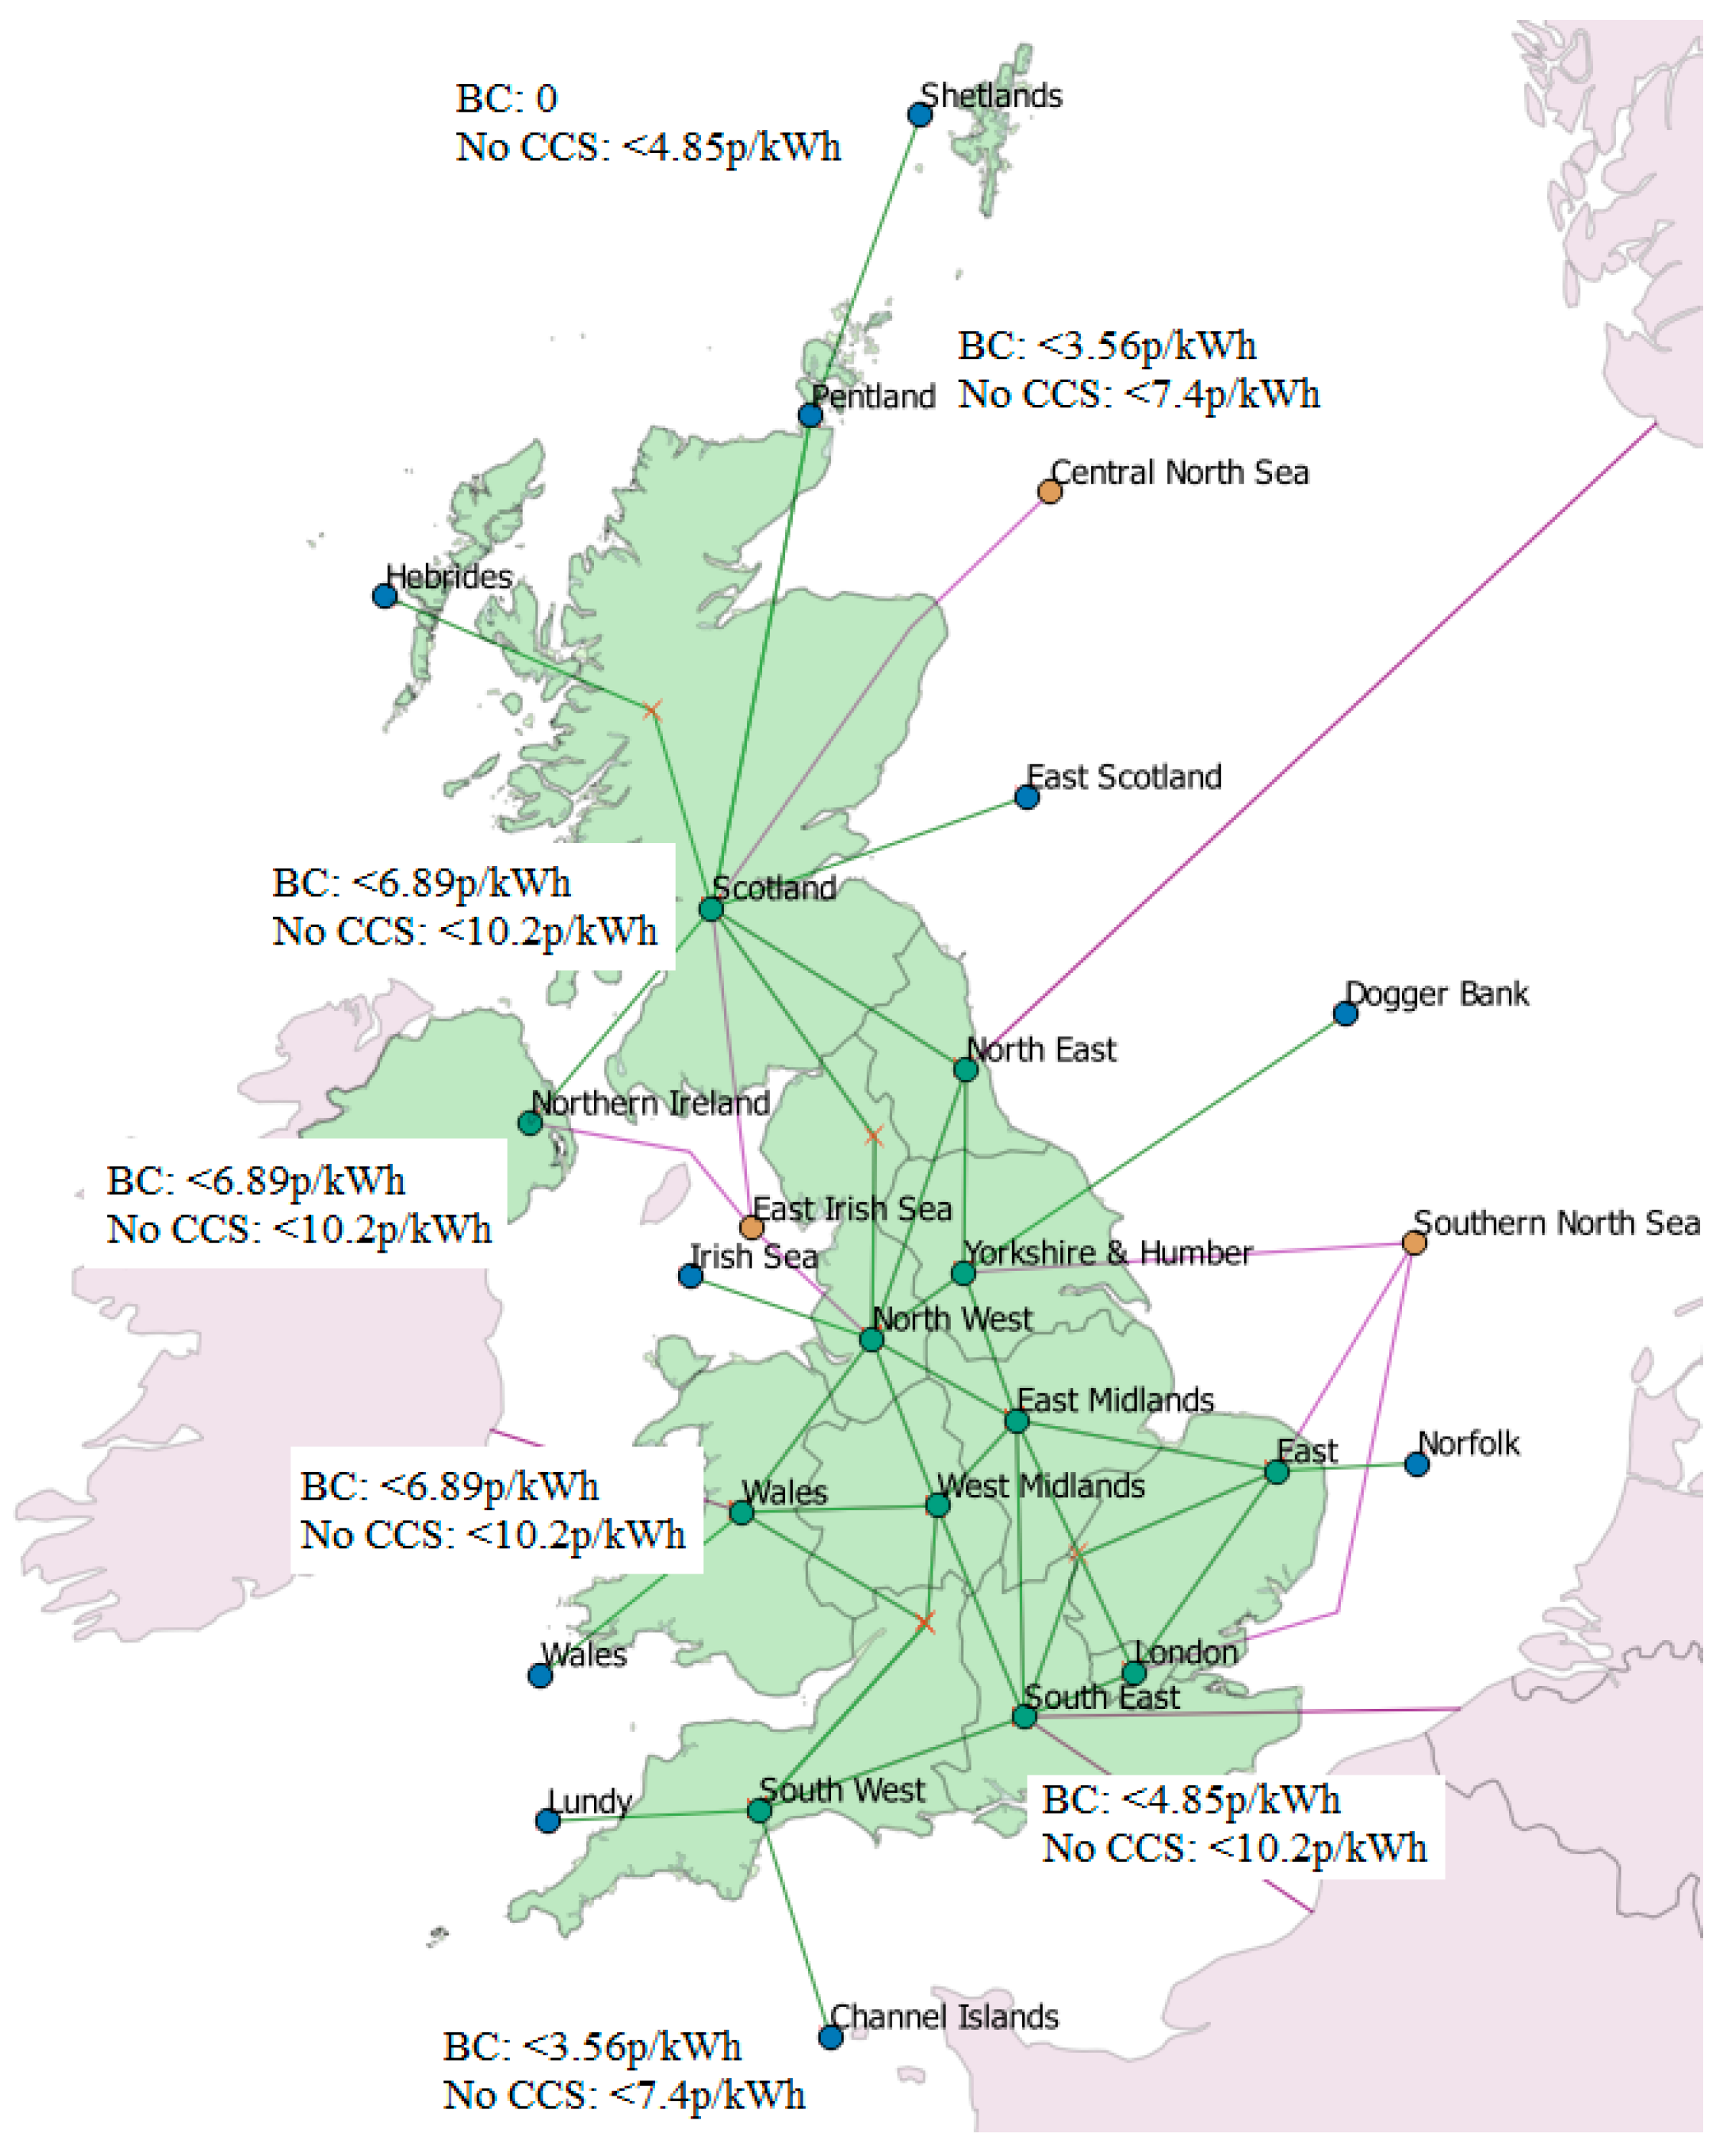
Figure 13 and Figure 14 show the maximum 2050 LCOE values that are required for wave and tidal capacity to be installed at different resource locations around the UK. For wave energy, the more favoured areas are in the south west, although the Pentland node is also chosen, although at a much lower capacity. For tidal, the onshore nodes, often with a much lower resource available, are favoured as no offshore transmission cost is included; the Pentland and Channel nodes with greater resources require a lower LCOE. The Shetland node is not included in any of the wave simulations; however, a small amount of capacity is included in the tidal simulations when CCS is not included.
5. Discussion
One key factor of the ESME model is that it is policy-neutral, and therefore subsidies and support mechanisms of individual technologies are not included in the analysis. Favoured technologies, however, can be identified as having potential, and results can aid policy design to drive the development of new technologies further. While the model is based on available, real data, it is impossible to be certain about future events that may affect the UK’s energy system and the output is designed to illustrate potential whole system designs based on the assumptions outlined in earlier sections. The aim of the results is to compare marine energy deployments in different scenarios as part of the whole system.
The modelling process considers the cost of the technology at the time slice being analysed, and does not take into account the previous deployment that would be required to achieve cost reductions. As considerable reduction depends on learning by doing, the initial stages of deployment would require support for this target to be reached. As wave does not become an economical option until 2045 in most cases, a long term strategy would be required. For deployment to occur earlier than 2040, there is a need for a step change reduction in CAPEX, with the exception of the scenario where the 2050 LCOE is 2.8 p/kWh. The step change case sees deployment at the Wales node in 2020–2025 where the LCOE is approximately 9.8 p/kWh, and is achievable based on a developers estimate. This shows that, if significant reduction can occur in the next 10 years, there is an opportunity for wave to be deployed at grid scale. This would then allow the industry to further reduce costs based on learning by doing and economies of scale, and be competitive to other forms of renewable energy by 2050.
Tidal, however, is installed at the onshore nodes in a capacity up to 2 GW in total in the period 2020–2025. At this time slice, the LCOE would be 10 p/kWh and therefore if this level can be achieved, there is then potential for significant deployment without large subsidies, to allow further reduction by learning by doing, and economies of scale for later time periods.
Although wave and tidal are identified as economical options in some cases, the reality is that, to compete with the more established renewable technologies such as offshore wind and solar, there needs to be an additional competitive advantage. The more established technologies in the model have significant capacity deployed, and therefore are experiencing real cost reductions based on learning, innovation, and economies of scale, whereas the values used for wave and tidal used in this study are very much based on optimistic estimates.
One key advantage with wave is the possibility to co-locate with offshore wind. Swell sea states often occur at different times to peak wind speeds and therefore the overall variability of the two resources can be reduced. Wave spectra are also more predictable than wind, and therefore these factors have the capability to improve the security and stability of the grid. The predictability of tidal is also an advantage to other intermittent renewables.
Scotland has set even greater targets than the UK as a whole, stating a target of 50% renewable energy by 2030. It would be very difficult to achieve this with wind alone, and based on resources available, wave and tidal could form part of this. Although the LCOE limits were lower for deployment in Scotland in all the wave scenarios, cost reduction based on co-location is not included in the model. By sharing infrastructure and operations and maintenance costs, this could potentially increase the economical limits for wave in Scotland.
The majority of the tidal resource is located at the Pentland node in Scotland, and wave at the Hebrides; therefore, significant improvements to the grid would be required if installed capacity in the gigawatt range is to be realized.
The primary reason wave is installed at the south west of the UK in this model is the transmission distance from the offshore to the onshore node. The distance from the Hebrides node to the nearest onshore node is 170 km of offshore cable, and 160 km onshore, compared to the Lundy node which is 70 km offshore and 90 km onshore. As both are greater than 70 km, the HVDC cable would be chosen at a cost of 0.67 £/kW/km with an additional 308.8 £/kW for plant in both cases. Using these values, an array installed in the Hebrides would require an additional £70/kW compared to Lundy for the offshore transmission, hence the reason Lundy is chosen over the Hebrides.
Another reason the majority of the wave capacity is deployed at the Lundy node in the south west, is it is closer to the higher demand centers due to the population density of the UK. This is also the area of the UK with the greatest solar resource, and current grid capacity is high. This could be taken as a positive, as the two resources complement each other, seasonal variability and intermittency could be reduced, and adding storage to the grid could also act as a buffer. It could, however, also make Scotland a more attractive location for installing capacity to spread the generation capacity around the UK. This highlights the importance of the whole systems approach and could be an area of further research.
All scenarios show a large mix of renewables, with solar, offshore wind fixed and floating, nuclear (large and Small Modular Reactors) all included, as well as wave, which shows importance of investing across many technologies to be able to have a low carbon, sustainable future energy system in the UK.
6. Conclusions
This paper demonstrates how ETI’s modelling tool, ESME, can be used to assess the potential of wave and tidal energy on the UKs energy system through different scenarios. Wave and tidal technologies can remain competitive at higher LCOE values under certain conditions such as in a no CCS scenario.
In the least-cost optimization, wave requires a LCOE less than 4.5 p/kWh to be deployed at grid scale by 2050, which is lower than published targets and developers forecasts for wave technologies. When CCS is not included, the economic range for wave energy increases to 9 p/kWh in 2050, and if there is a step reduction in CAPEX, a 2050 LCOE of 11.1 p/kWh sees a deployment of 5.2 GW. These do not include the transmission costs, so if an additional 8% is included (as stated in [21]) these increase to 4.9, 9.7 and 12 p/kWh. The second values fall within the range of the published targets and reinforces the need for an innovative technology, compared to a gradual reduction from learning by doing of current technology, if wave energy is to make a grid level impact by 2050.
The tidal results show an LCOE of less than 7 p/kWh is required for deployment at grid scale, and this increases to 10.2 p/kWh in the no CCS scenario, or 7.5 and 11 p/kWh with an 8% increase for transmission. These results fall within the lower end of the estimates provided in industry reports, and with the earlier deployment, indicate that the tidal industry is developing as previous forecasts anticipated with a total deployment between 2 and 3 GW by 2050.
This translates to a CAPEX of £1000/kW for wave and £1500/kW for tidal with capacity factor 35–40% and 30–35% respectively.
The results indicate that, if marine energy can meet the minimum estimates given by developers and can have the opportunity to deploy devices, hence reducing the LCOE by learning by doing, there is the potential for considerable deployment for marine technology. Wave is generally deployed with significant capacity in the south west of England with a smaller capacity at Wales, and northern Scotland, whereas tidal stream is installed in relatively small capacities at Wales, Northern Ireland and west coast of Scotland. Greater deployment of tidal is at the Pentland node and Channel Islands with a lower LCOE of 3.5 p/kWh.
This piece of work has highlighted areas for potential further investigation, such as using these CAPEX, capacity factor, and deployment rates, and what learning rates and, hence, investment costs are required to achieve this. This would also consider the local grid connections in more detail and show how a realistic deployment strategy could develop in the UK. A more detailed analysis of the effect of the transmission distances and the opportunities for sharing this infrastructure in certain locations with offshore wind, and hence reducing the overall LCOE, could also be included.
The benefits of the wave resource variability to other resources, particularly solar in the south west, should also be considered, as the onshore grid may have greater capability during the winter months, when wave power is likely to be greatest. Considering these aspects would enable a strategic plan for marine energy in the UK to be developed, considering the effects of the whole system and competition from other renewable energy generating technologies.
The aim of the whole system analysis is to identify pathways that enable the UK to meet the carbon reduction targets set by policy. Although this analysis has shown wave and tidal having a relatively small role to play, the energy system will not stop evolving at 2050; it therefore should be necessary to continue research in areas that offer such large potential.
Acknowledgments
The author gratefully acknowledges funding support from ETI and the EPSRC RCUK Energy program for the Industrial Doctoral Centre for Offshore Renewable Energy (IDCORE) (EP/J500847/1). Furthermore, they would like to thank the ETI; Scott Milne and Adam Thirkill for their support and advice in using ESME and achieving these results.
Author Contributions
Anna Stegman conceived and designed the modelling scenarios and wrote the paper; Adrian de Andres provided invaluable feedback and Lars Johanning, Henry Jeffrey and Stuart Bradley provided expert advice.
Conflicts of Interest
The authors declare no conflict of interest.
References
- Strategic Initiative for Ocean Energy (SI Ocean). Wave and Tidal Energy Market Deployment Strategy for Europe. 2014. Available online: https://www.oceanenergy-europe.eu/images/OEF/140037-SI_Ocean_-_Market_Deployment_Strategy.pdf (accessed on 5 December 2016).
- Hannon, M.; Diemen, R. An international assessment of ocean energy innovation performance. In Proceedings of the 23rd World Energy Council, Istanbul, Turkey, 9–13 October 2016. [Google Scholar]
- Kersey, J. Carbon Trust Foreword to UK Wave Resource Study. 2011. Available online: https://www.carbontrust.com/resources/reports/technology/marine-energy/ (accessed on 16 January 2017).
- Black and Veatch. Carbon Trust Foreword to UK Tidal Current Resource and Economics Study. 2011. Available online: https://www.carbontrust.com/resources/reports/technology/marine-energy/ (accessed on 16 January 2017).
- Low Carbon Innovation Coordination Group. Technology Innovation Needs Assessment (TINA) Marine Energy Summary Report; Low Carbon Innovation Coordination Group: Plymouth, UK, 2012. [Google Scholar]
- European Marine Energy Centre (EMEC). Available online: http://www.emec.org.uk/marine-energy/wave-developers/ (accessed on 29 January 2017).
- Department of Energy and Climate Change (DECC). UK Renewable Energy Roadmap. 2011. Available online: https://www.gov.uk/government/collections/uk-renewable-energy-roadmap (accessed on 5 December 2016).
- Ocean Energy Systems (OES). Ocean Energy Systems: Annual Report. 2015. Available online: https://www.ocean-energy-systems.org/library/annual-reports/ (accessed on 5 December 2016).
- BBC News “Pelamis Calls in Administrators”. Available online: http://www.bbc.co.uk/news/uk-scotland-scotland-business-30151276 (accessed on 27 March 2017).
- The Engineer “Aquamarine Power Folds”. Available online: https://www.theengineer.co.uk/wave-goodbye-aquamarine-power-folds-due-to-lack-of-private-sector-support/ (accessed on 27 March 2017).
- Wales Online “Delta Stram Tidal Energy”. Available online: http://www.walesonline.co.uk/business/business-news/deltastream-tidal-energy-device-only-12306961 (accessed on 27 March 2017).
- Lund, H. Renewable energy strategies for sustainable development. Energy 2007, 32, 912–919. [Google Scholar] [CrossRef]
- Fusco, F.; Nolan, G.; Ringwood, J.V. Variability reduction through optimal combination of wind/wave resources—An Irish case study. Energy 2010, 35, 314–325. [Google Scholar] [CrossRef]
- Kalogeri, C.; Galanis, G.; Spyrou, C.; Diamantis, D.; Baladima, F.; Koukoula, M.; Kallos, G. Assessing the European offshore wind and wave energy resource for combined exploitation. Renew. Energy 2017, 101, 244–264. [Google Scholar] [CrossRef]
- Renewable Energy Directive 2016. Available online: https://ec.europa.eu/energy/en/topics/renewable-energy/renewable-energy-directive (accessed on 14 October 2016).
- Her Majesty’s Revenue and Customs (HMRC). Climate Change Act. 2008. Available online: http://www.legislation.gov.uk/ukpga/2008/27/pdfs/ukpga_20080027_en.pdf (accessed on 6 February 2017).
- Scottish Energy Strategy. The Future of Energy in Scotland. 2017. Available online: http://www.gov.scot/Publications/2017/01/3414 (accessed on 5 December 2016).
- Hayward, J.; Behrens, S.; McGarry, S.; Osman, P. Economic modelling of the potential of wave energy. Renew. Energy 2012, 48, 238–250. [Google Scholar] [CrossRef]
- Energy Technologies Institute (ETI)/UK Energy Research Centre (UKERC). Marine Energy Technology Roadmap. 2014. Available online: http://www.eti.co.uk/news/marine-roadmap/ (accessed on 7 September 2016).
- Carbon Trust. Future Marine Energy Development. 2006. Available online: https://www.carbontrust.com/resources/reports/technology/marine-energy/ (accessed on 7 September 2016).
- Ocean Energy Systems (OES). International Levelised Cost of Energy for Ocean Energy Technologies. 2015. Available online: https://www.ocean-energy-systems.org/news/international-lcoe-for-ocean-energy-technology/ (accessed on 5 December 2016).
- Her Majesty’s Revenue and Customs (HMRC). Foreign Exchange Rates. Available online: https://www.gov.uk/government/publications/exchange-rates-for-customs-and-vat-yearly (accessed on 29 January 2017).
- Brand Energy & Infrastructure Services (BEIS). Budget Notice for the Second CFD Allocation Round. 2017. Available online: https://www.gov.uk/government/publications/draft-budget-notice-for-the-second-cfd-allocation-round (accessed on 6 March 2017).
- Pickup, D.; Barwell, P.; Greene, L. Cost Reduction Potential of Large Scale Solar PV; Solar Trade Association: London, UK, 2014. [Google Scholar]
- Energy Technologies Institute (ETI). ESME Data References Book. 2016. Available online: http://www.eti.co.uk/programmes/strategy/esme (accessed on 11 January 2017).
- Energy Technologies Institute (ETI). “Next Generation Capture Technology–Benchmarking and Performance Analysis”. Available online: http://www.eti.co.uk/programmes/carbon-capture-storage/next-generation-capture-technology-benchmarking-and-performance-analysis (accessed on 5 April 2017).
- Mott MacDonald. UK Electricity Generation Costs Update. 2010. Available online: https://www.gov.uk/government/publications/uk-electricity-generation-costs-mott-macdonald-update-2010 (accessed on 6 March 2017).
- Montgomery, D.; Baron, R.; Bernstein, P. Impact on the Economy of the American Clean Energy and Security Act of 2009. 2010. Available online: http://www.coloradomining.org/Content/Release_Pdf/CRA_Waxman-Markey__205–20–09_v8.pdf (accessed on 8 December 2016).
- Pina, A.; Silva, C.A.; Ferrão, P. High-resolution modeling framework for planning electricity systems with high penetration of renewables. Appl. Energy 2013, 112, 215–223. [Google Scholar] [CrossRef]
- Pfenninger, S.; Hawkes, A.; Keirstead, J. Energy systems modeling for twenty-first century energy challenges. Renew. Energy 2014, 33, 74–86. [Google Scholar] [CrossRef]
- Connolly, D.; Lund, H.; Mathiesen, B.V.; Leahy, M. A review of computer tools for analysing the integration of renewable energy into various energy systems. Appl. Energy 2010, 87, 1059–1082. [Google Scholar] [CrossRef]
- Pye, S.; Sabio, N.; Strachan, N. An integrated systematic analysis of uncertainties in UK energy transition pathways. Energy Policy 2015, 87, 673–684. [Google Scholar] [CrossRef]
- Heaton, C. Modelling Low-Carbon Energy System Designs. 2014. Available online: http://www.eti.co.uk/library/modelling-low-carbon-energy-system-designs-with-the-eti-esme-model/ (accessed on 11 January 2017).
- Sinclar Knight Merz Pty Ltd. Growth Scenarios for UK Renewables Generation and Implications for Future Developments and Operation of Electricity Networks; Sinclar Knight Merz Pty Ltd.: Sydney, Australia, 2008. [Google Scholar]
- Strategic Initiative for Ocean Energy (SI Ocean). Ocean Energy: Cost of Energy and Cost Reduction Opportunities. 2013. Available online: https://www.oceanenergy-europe.eu/en/eu-projects/previous-projects/si-ocean (accessed on 11 January 2017).
- Meygen: The Project. Available online: http://www.meygen.com/the-project/ (accessed on 27 March 2017).
- Babarit, A. A database of capture width ratio of wave energy converters. Renew. Energy 2015, 80, 610–628. [Google Scholar] [CrossRef]
- Garrett, C.; Cummins, P. Limits to tidal current power. Renew. Energy 2008, 33, 2485–2490. [Google Scholar] [CrossRef]
- Her Majesty’s Treasury (HM Treasury). The Green Book: Appraisal and Evaluation in Central Government, Updated 2011. Available online: https://www.gov.uk/government/publications/the-green-book-appraisal-and-evaluation-in-central-governent (accessed on 3 February 2017).
- National Grid NETSO. Offshore Development Information Statement (ODIS). 2010. Available online: http://s3.amazonaws.com/zanran_storage/www.nationalgrid.com/ContentPages/111957798.pdf (accessed on 5 December 2016).
- Energy Technologies Institute (ETI). Options, Choices, Actions: UK Scenarios for a Low Carbon Energy System Transition. 2016. Available online: http://www.carbonbrief.org/carbon-capture-delay-could-add-20bn-to-uk-climate-costs\npapers3://publication/uuid/8EE41ACD-BC57-4509-9B38-2DBA092F93F0 (accessed on 5 March 2017).
- Brand Energy & Infrastructure Services (BEIS), National Audit Office. Carbon Capture and Storage: The Second Competition for Government Support Key Facts. 2017. Available online: https://www.nao.org.uk/wp-content/uploads/2017/01/Carbon-Capture-and-Storage-the-second-competition-for-government-support.pdf (accessed on 3 February 2017).
Figure 1.
Schematic diagram of the energy system modelling environment (ESME) model.

Figure 2.
ESME spatial parameters and resource locations.
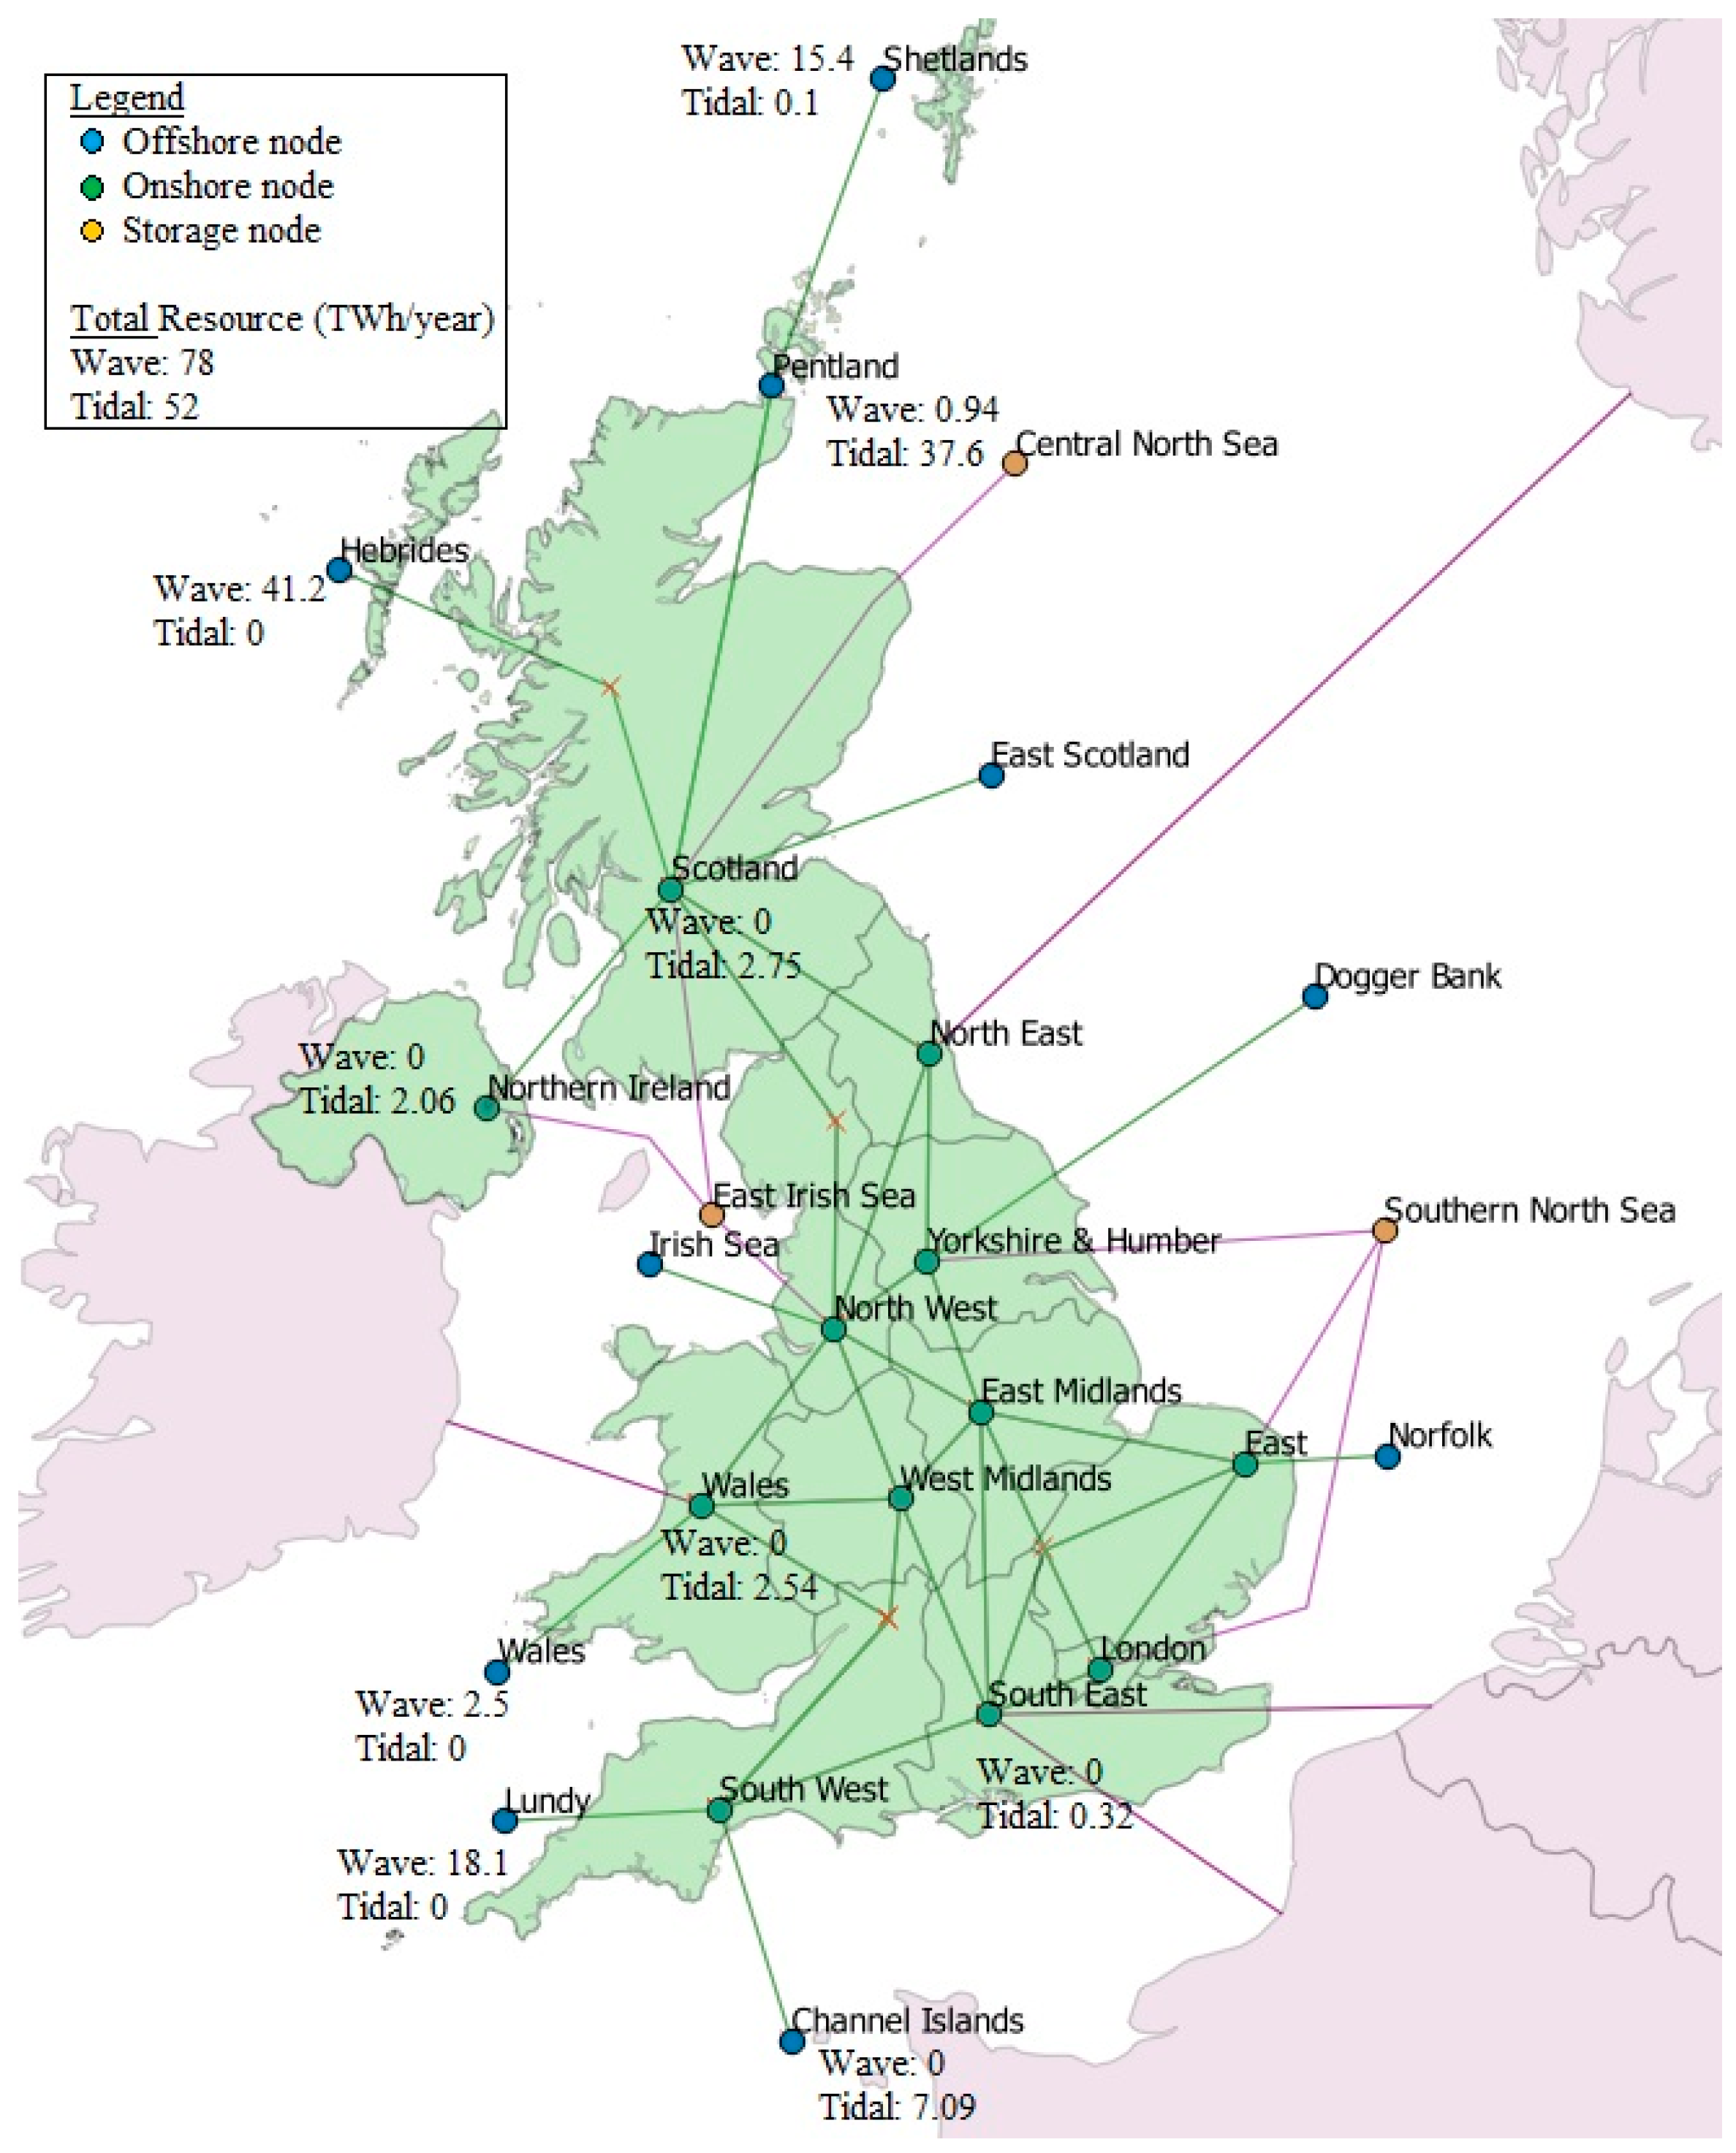
Figure 3.
Capital expenditure (CAPEX) profiles for ESME analysis: (a) wave; (b) tidal.
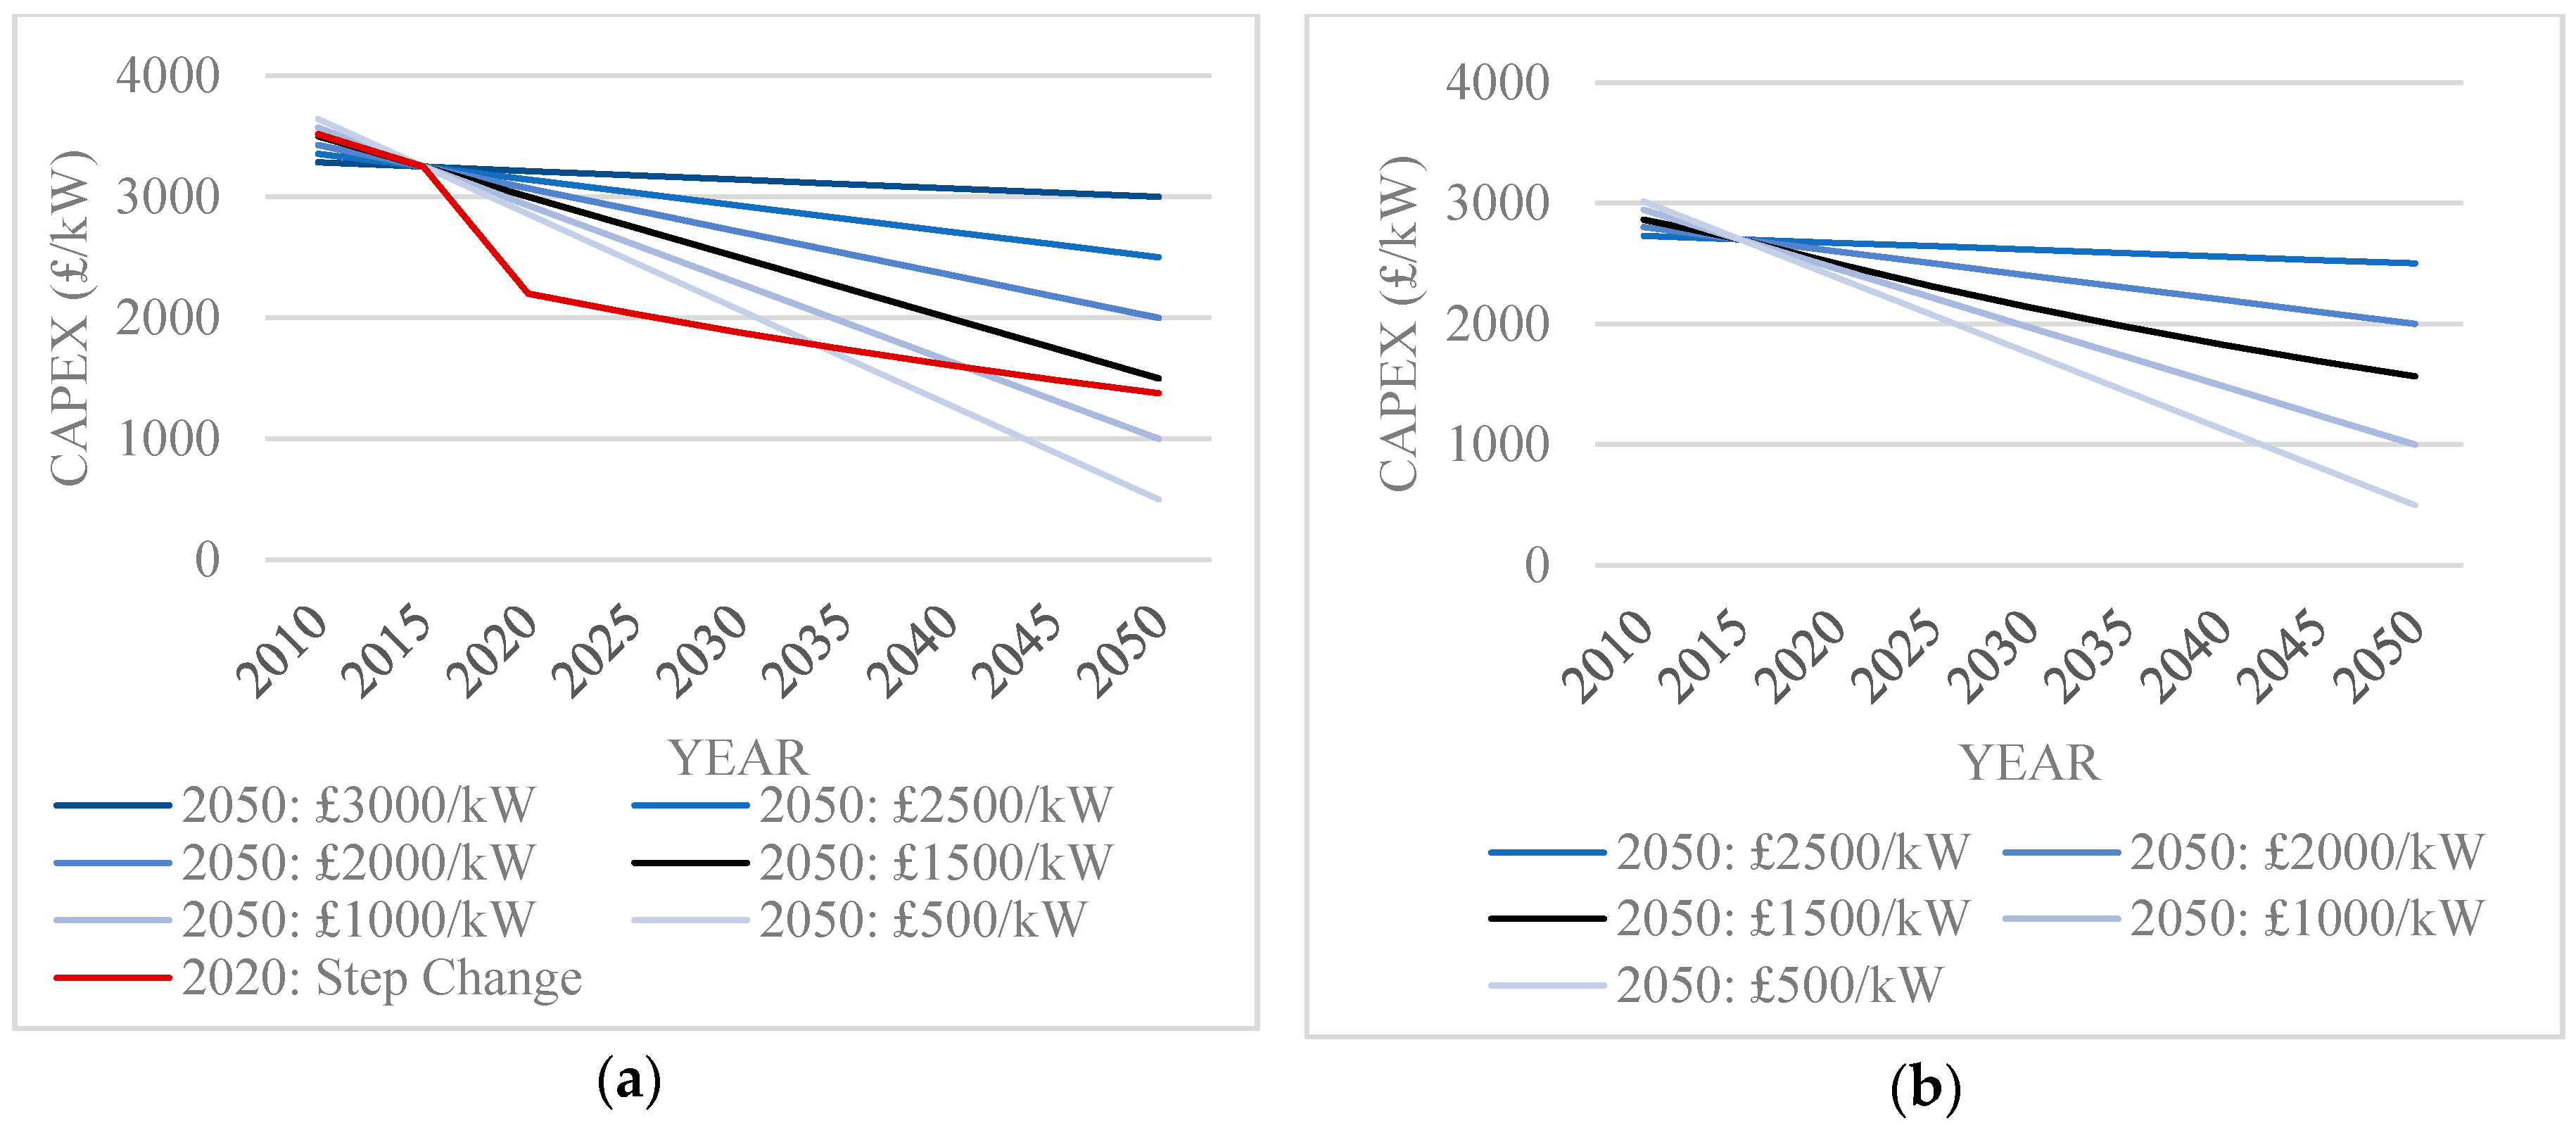
Figure 4.
Projected electricity generation capacity with wave 2050 CAPEX £1000/kW and capacity factor 40% (Base Case).
Figure 4.
Projected electricity generation capacity with wave 2050 CAPEX £1000/kW and capacity factor 40% (Base Case).

Figure 5.
Projected electricity generation capacity with wave 2050 CAPEX £1000/kW and capacity factor 40% (No CCS).
Figure 5.
Projected electricity generation capacity with wave 2050 CAPEX £1000/kW and capacity factor 40% (No CCS).
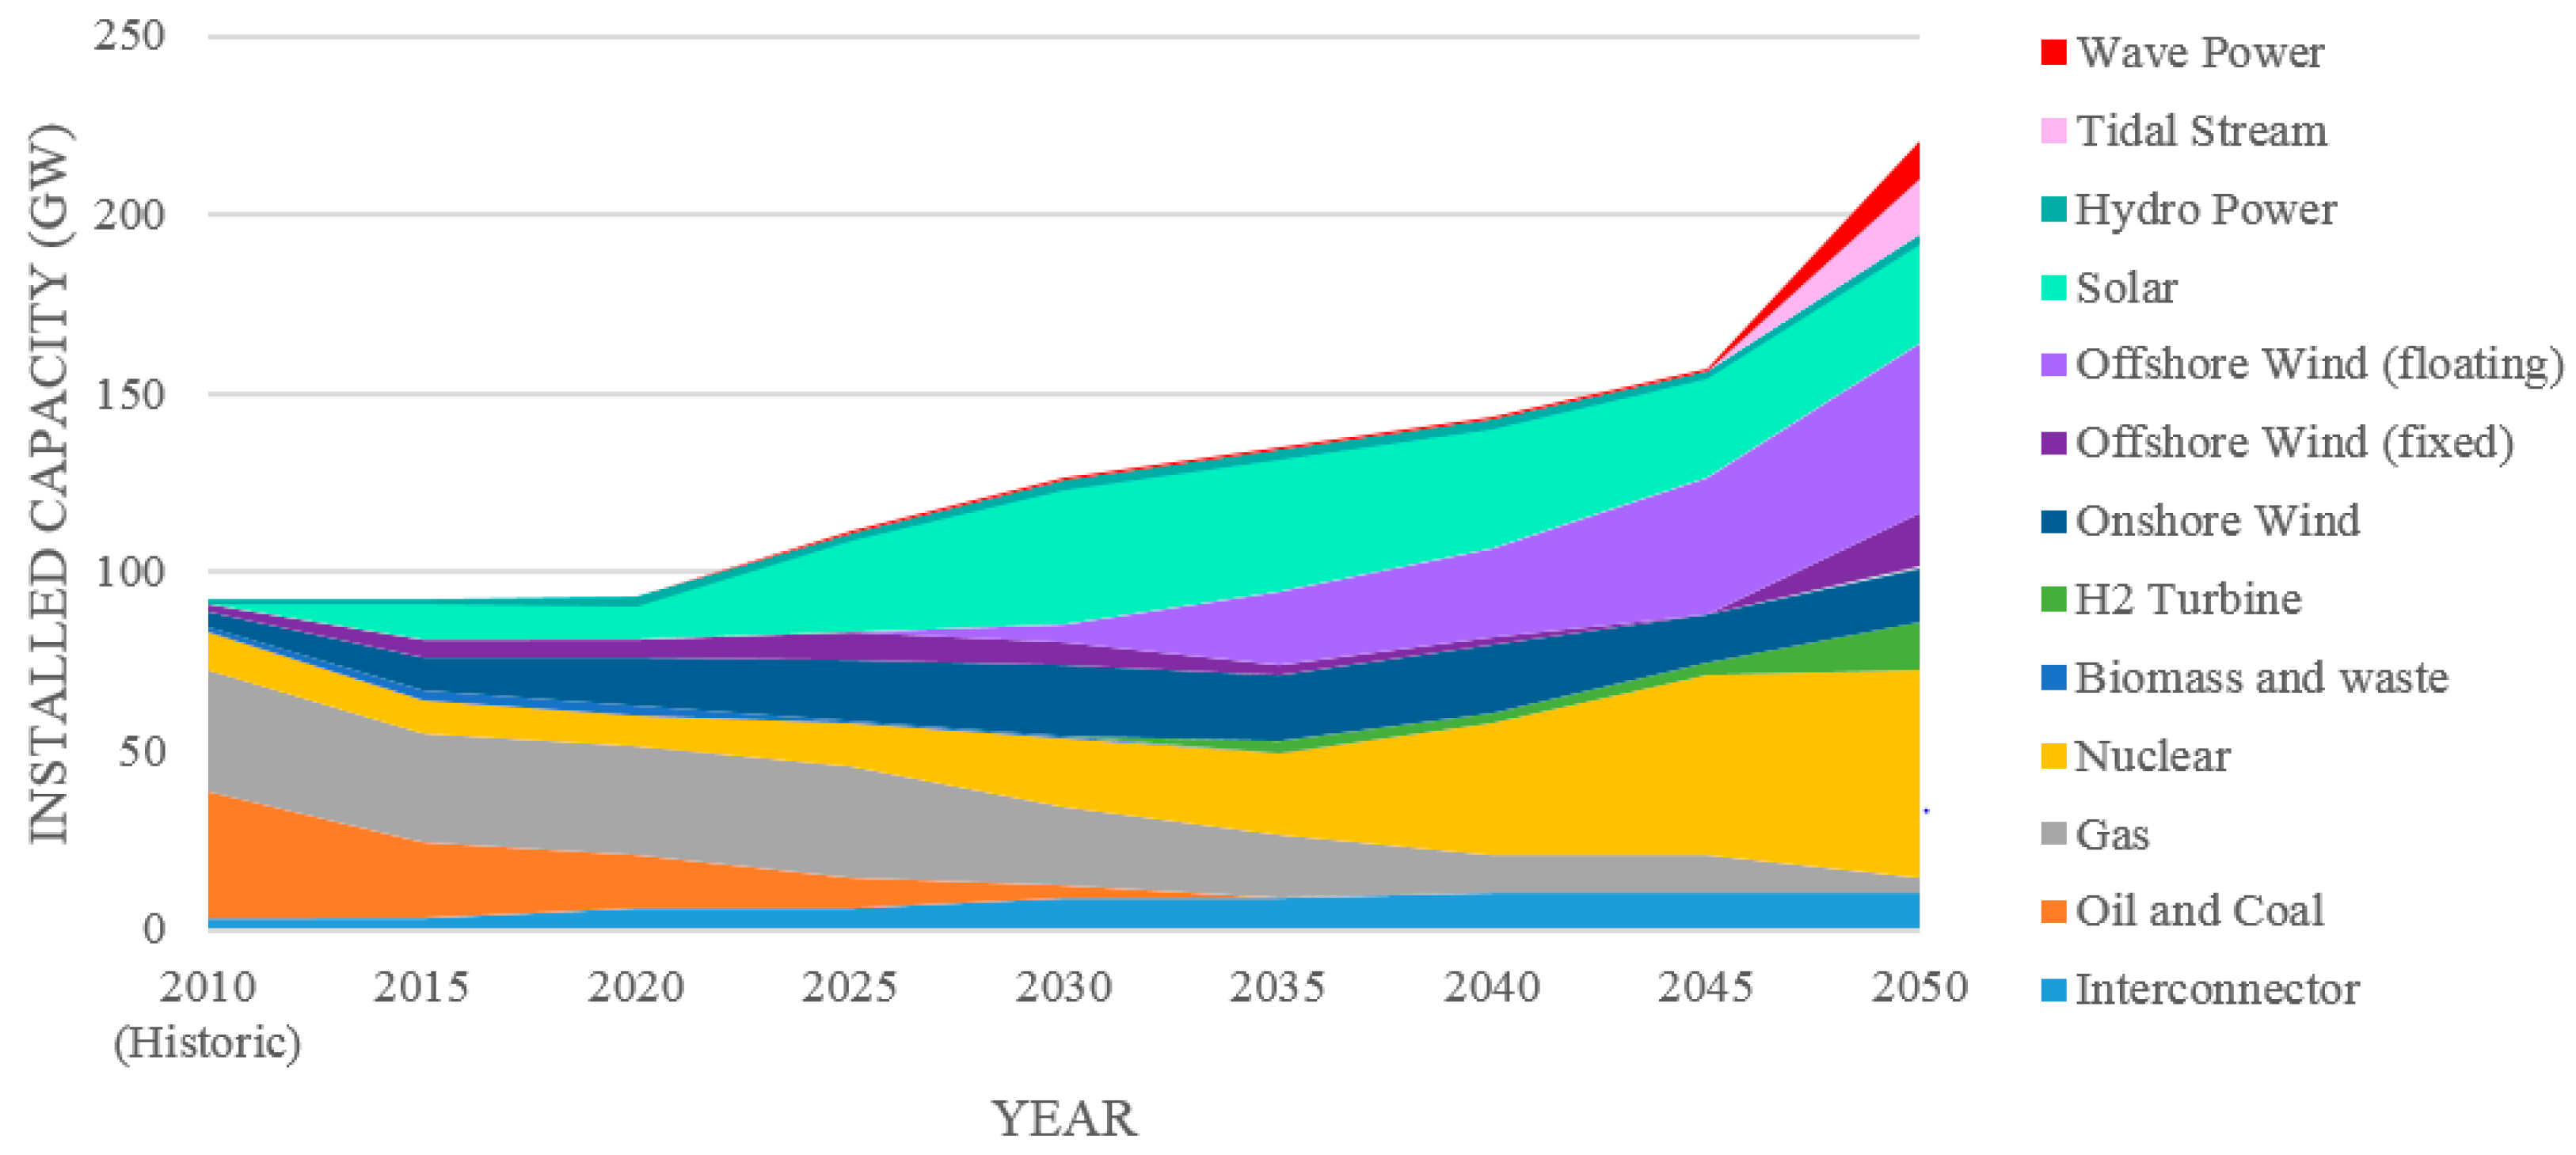
Figure 6.
Location of installed capacity (base case).
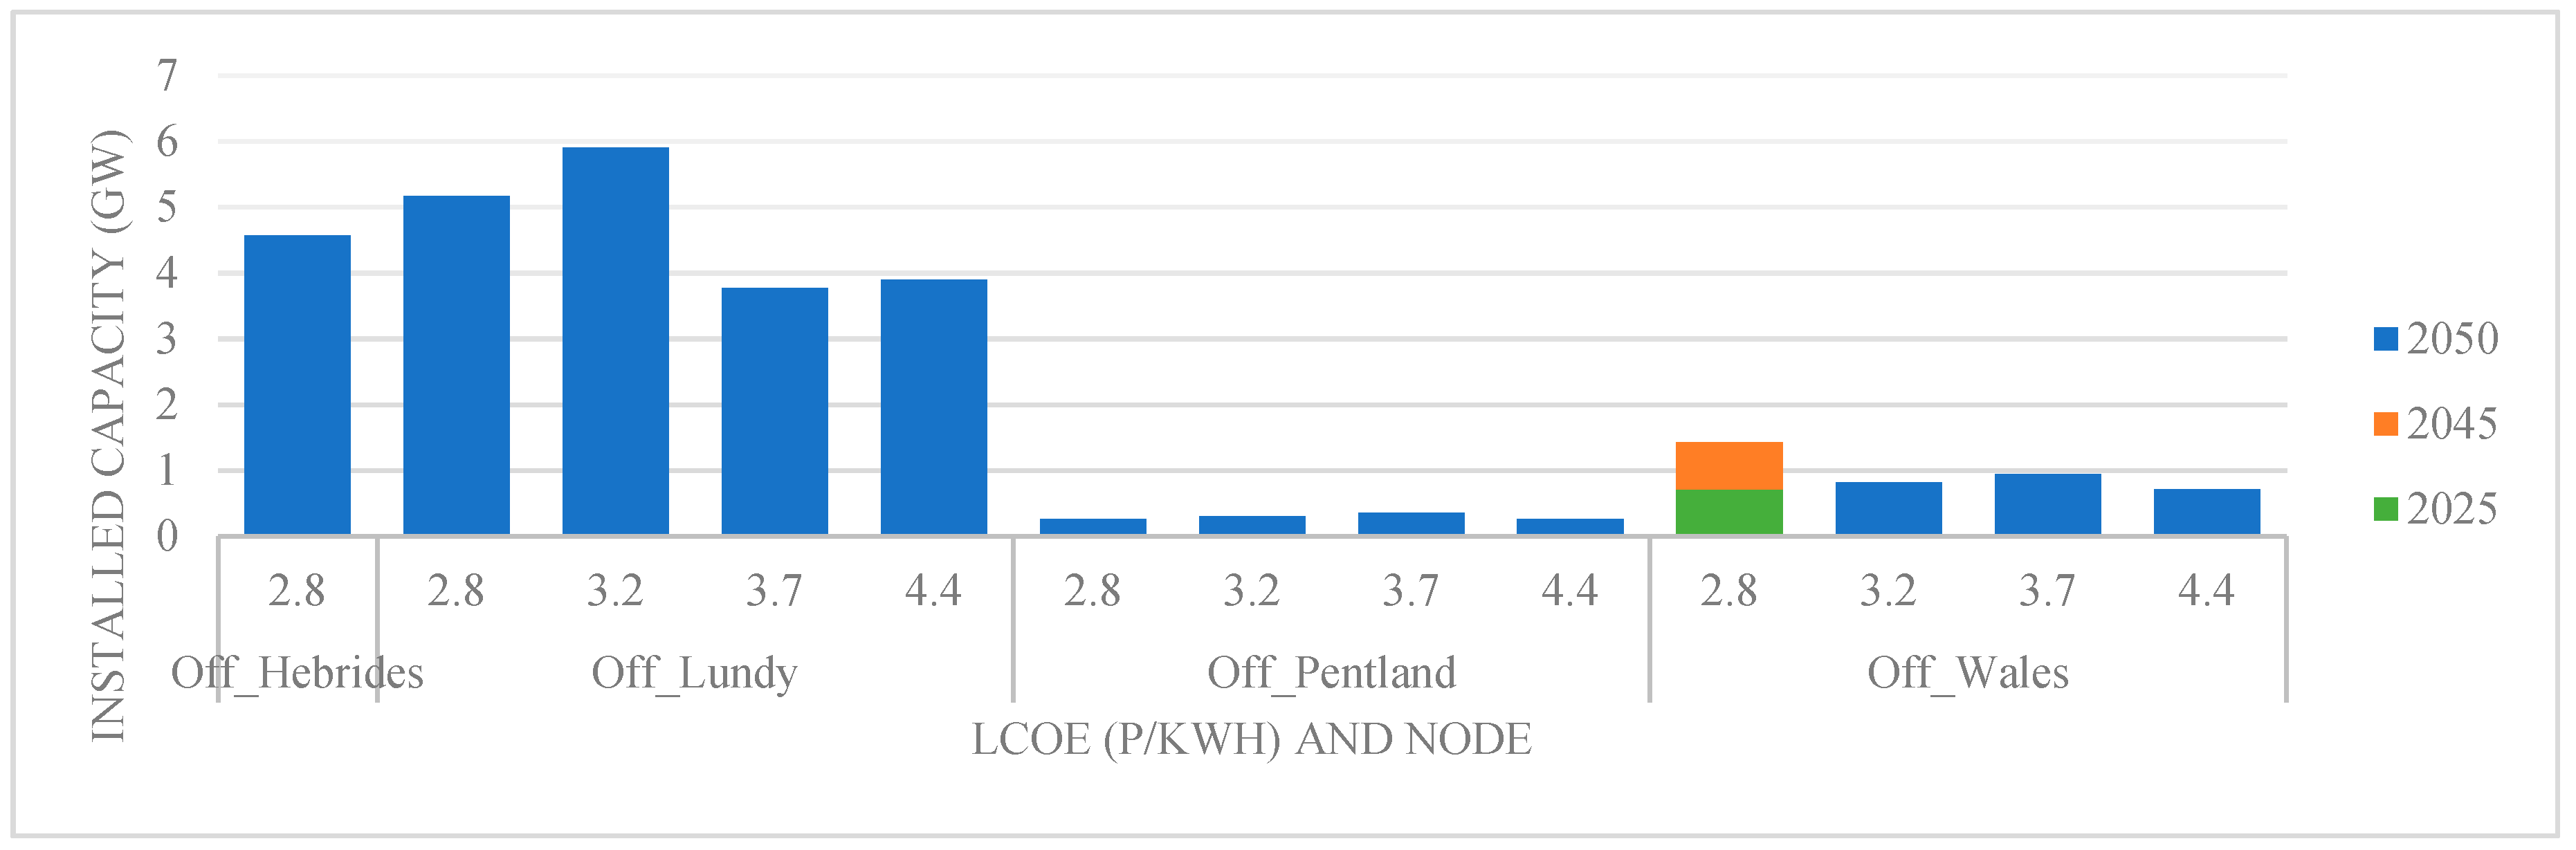
Figure 7.
Location of installed capacity in wave step change scenario.
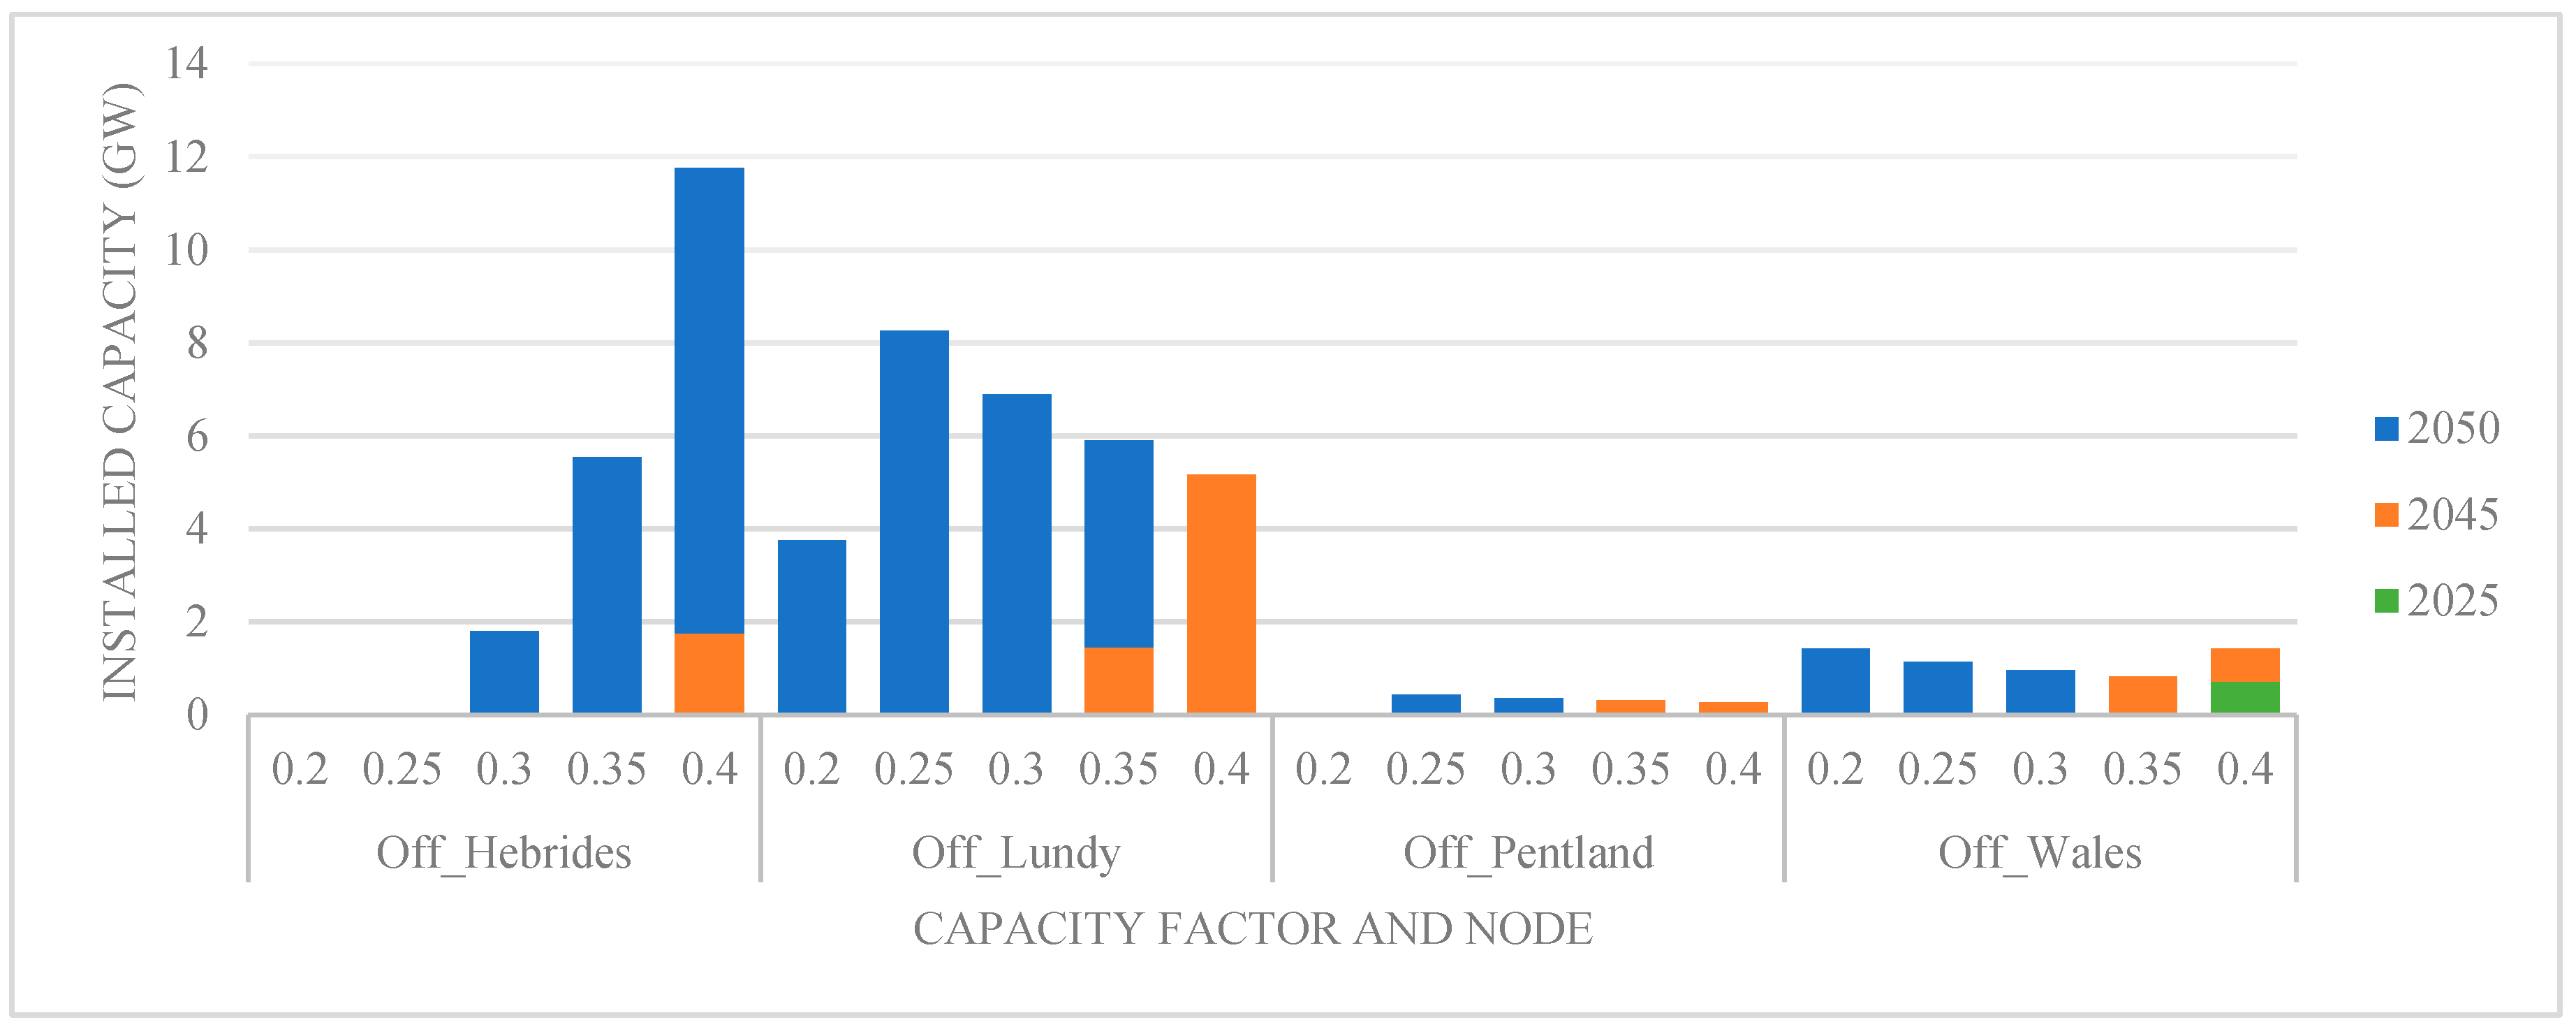
Figure 8.
Projected electricity generation capacity with tidal stream 2050 CAPEX £1000/kW and capacity factor 35% (Base Case).
Figure 8.
Projected electricity generation capacity with tidal stream 2050 CAPEX £1000/kW and capacity factor 35% (Base Case).

Figure 9.
Projected electricity generation capacity with tidal stream 2050 CAPEX £1000/kW and capacity factor 35% (No carbon capture storage (CCS)).
Figure 9.
Projected electricity generation capacity with tidal stream 2050 CAPEX £1000/kW and capacity factor 35% (No carbon capture storage (CCS)).

Figure 10.
Location of installed tidal capacity based on 2050 levelised cost of energy (LCOE) values for least cost optimization.
Figure 10.
Location of installed tidal capacity based on 2050 levelised cost of energy (LCOE) values for least cost optimization.

Figure 11.
Installed capacity with LCOE: (a) wave; (b) tidal stream.
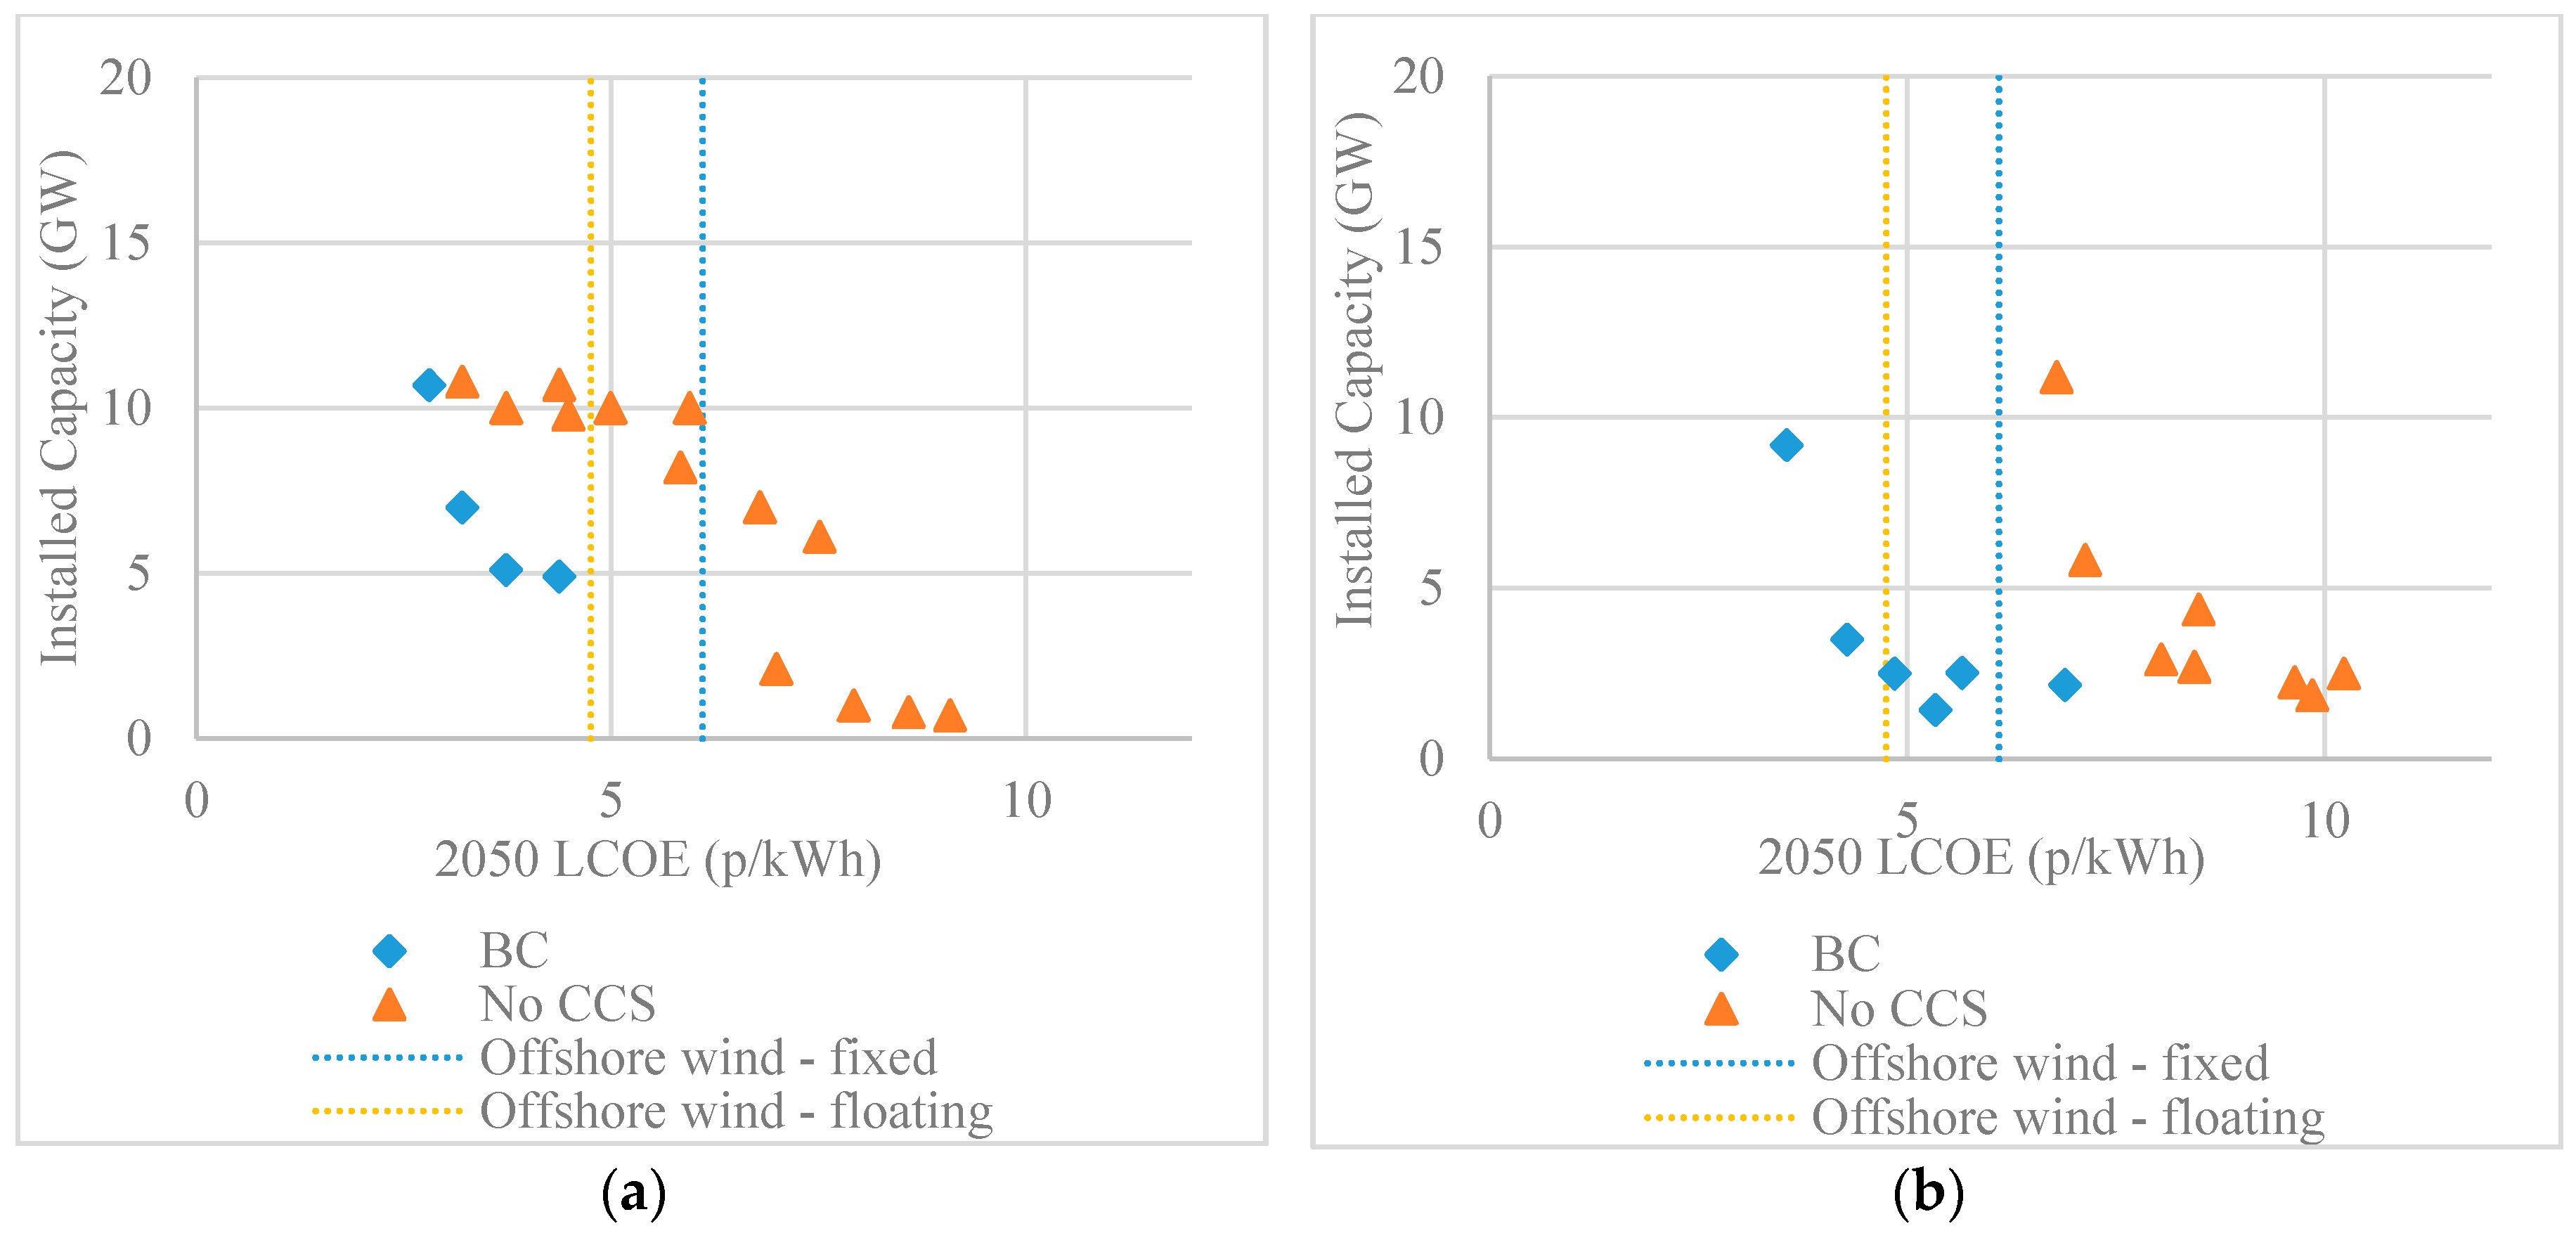
Figure 12.
Economic boundary for deployment in base case and no CCS: (a) wave; (b) tidal stream.

Figure 13.
2050 LCOE values where wave deployment occurs: base case (BC), no CCS, and step change (SC).
Figure 13.
2050 LCOE values where wave deployment occurs: base case (BC), no CCS, and step change (SC).

Figure 14.
2050 LCOE values where tidal deployment occurs: base case (BC), no CCS.


Table 1.
Developer survey results for LCOE parameters (converted to £ using exchange rate $1:£0.81 [22]).
Table 1.
Developer survey results for LCOE parameters (converted to £ using exchange rate $1:£0.81 [22]).
| Deployment Stage | Variable | Wave | Tidal | ||
|---|---|---|---|---|---|
| Min | Max | Min | Max | ||
| First Array | Project Capacity (MW) | 1 | 3 | 0.3 | 10 |
| CAPEX (£/kW) | 3250 | 14,706 | 4144 | 11,863 | |
| OPEX (£/kW per year) | 114 | 1219 | 146 | 943 | |
| Capacity Factor (%) | 22% | 30% | 35% | 37% | |
| LCOE (£/MWh) | 244 | 1422 | 244 | 813 | |
| Second Array | Project Capacity (MW) | 1 | 10 | 0.5 | 28 |
| CAPEX (£/kW) | 2925 | 12,431 | 3494 | 7069 | |
| OPEX (£/kW per year) | 81 | 406 | 122 | 431 | |
| Capacity Factor (%) | 30% | 35% | 35% | 42% | |
| LCOE (£/MWh) | 171 | 544 | 171 | 382 | |
| First Commercial Scale Project | Project Capacity (MW) | 2 | 75 | 3 | 90 |
| CAPEX (£/kW) | 2194 | 7394 | 2681 | 4550 | |
| OPEX (£/kW per year) | 57 | 309 | 73 | 325 | |
| Capacity Factor (%) | 35% | 40% | 35% | 40% | |
| LCOE (£/MWh) | 98 | 382 | 106 | 228 | |
Table 2.
Comparison of LCOE values used in ESME v4.2.
| Technology | 2010 LCOE (p/kWh) | 2050 LCOE (p/kWh) |
|---|---|---|
| Combined Cycle Gas Turbines (CCGT) [26] | 3.80 | 5.40 |
| Nuclear [27,28] | 6.58 | 6.04 |
| Solar farm [24] | 19.85 | 6.01 |
| Onshore wind [28] | 8.29 | 7.09 |
| Offshore wind (fixed) [27] | 13.58 | 6.14 |
Table 3.
Transmission distances for offshore nodes used in ESME v4.2.
| Offshore Node | Offshore Distance (km) | Onshore Distance (km) |
|---|---|---|
| Shetland | 200 | 320 |
| Pentland | 35 | 320 |
| Hebrides | 170 | 160 |
| Wales | 35 | 100 |
| Lundy | 70 | 90 |
| Channel Islands | 125 | 15 |
Table 4.
Transmission cost summary used in ESME v4.2 [34].
Table 4.
Transmission cost summary used in ESME v4.2 [34].
| Costs | 132 kV AC Offshore | HVDC Offshore | 220 kV, 300 MVA Overhead Line Onshore |
|---|---|---|---|
| Fixed: platform, connections (£/kW) | 163.3 | 308.8 | - |
| Cable (£/kW/km) | 2.6 | 0.67 | 1.17 (£350/m) |
Table 5.
Summary of LCOE and installed capacity.
| Capacity Factor (%) | 2050 LCOE (p/kWh) | 2050 Capacity England and Wales (GW) | 2050 Capacity Scotland (GW) |
|---|---|---|---|
| 20 | 11.1 | 5.2 | 0 |
| 25 | 8.9 | 9.4 | 0.4 |
| 30 | 7.4 | 7.9 | 2.1 |
| 35 | 6.4 | 6.7 | 5.8 |
| 40 | 5.6 | 6.5 | 11.9 |
© 2017 by the authors. Licensee MDPI, Basel, Switzerland. This article is an open access article distributed under the terms and conditions of the Creative Commons Attribution (CC BY) license (http://creativecommons.org/licenses/by/4.0/).
Share and Cite
MDPI and ACS Style
Stegman, A.; De Andres, A.; Jeffrey, H.; Johanning, L.; Bradley, S. Exploring Marine Energy Potential in the UK Using a Whole Systems Modelling Approach. Energies 2017, 10, 1251. https://doi.org/10.3390/en10091251
AMA Style
Stegman A, De Andres A, Jeffrey H, Johanning L, Bradley S. Exploring Marine Energy Potential in the UK Using a Whole Systems Modelling Approach. Energies. 2017; 10(9):1251. https://doi.org/10.3390/en10091251
Chicago/Turabian StyleStegman, Anna, Adrian De Andres, Henry Jeffrey, Lars Johanning, and Stuart Bradley. 2017. "Exploring Marine Energy Potential in the UK Using a Whole Systems Modelling Approach" Energies 10, no. 9: 1251. https://doi.org/10.3390/en10091251
Note that from the first issue of 2016, this journal uses article numbers instead of page numbers. See further details here.