
Acquisition System Verification for Energy Efficiency Analysis of Building Materials

1
Department of Mechanical Engineering, Heat Engines and Fluid Mechanics, School of Industrial Engineering, University of Vigo, 36310 Vigo, Spain
2
Defense University Center, Spanish Naval Academy, Plaza de España s/n, 36900 Marín, Spain
*
Author to whom correspondence should be addressed.
Energies 2017, 10(9), 1254; https://doi.org/10.3390/en10091254
Submission received: 4 July 2017
/
Revised: 15 August 2017
/
Accepted: 21 August 2017
/
Published: 23 August 2017
Abstract
:Climate change and fossil fuel depletion foster interest in improving energy efficiency in buildings. There are different methods to achieve improved efficiency; one of them is the use of additives, such as phase change materials (PCMs). To prove this method’s effectiveness, a building’s behaviour should be monitored and analysed. This paper describes an acquisition system developed for monitoring buildings based on Supervisory Control and Data Acquisition (SCADA) and with a 1-wire bus network as the communication system. The system is empirically tested to prove that it works properly. With this purpose, two experimental cubicles are made of self-compacting concrete panels, one of which has a PCM as an additive to improve its energy storage properties. Both cubicles have the same dimensions and orientation, and they are separated by six feet to avoid shadows. The behaviour of the PCM was observed with the acquisition system, achieving results that illustrate the differences between the cubicles directly related to the PCM’s characteristics. Data collection devices included in the system were temperature sensors, some of which were embedded in the walls, as well as humidity sensors, heat flux density sensors, a weather station and energy counters. The analysis of the results shows agreement with previous studies of PCM addition; therefore, the acquisition system is suitable for this application.
1. Introduction
Development is linked to rising energy demand and increasing use of fossil energy sources and their associated emissions, which contribute to climate change. There is a need to reduce energy consumption, a process aided by more efficient buildings, since this sector represents 40% of the European Union’s final energy consumption [1]. With this purpose, regulations that promote the improvement of the energy performance of buildings have been introduced [2].
The building sector aims to reduce the environmental impact of materials and constructive elements and increase energy efficiency through the development of innovations [3]. Precast concrete helps to achieve these objectives, since it is the most sustainable option in both building and infrastructure, by saving time, energy, and resources. The development of lightweight concrete reduces the necessary thickness and material consumption while maintaining the thermal capacity. This can be achieved by adding different compounds, such as phase change materials (PCMs), which decrease temperature fluctuations [4,5]. The material changes phase from solid to liquid via an endothermic reaction when heat is supplied during daytime and vice versa, turning from liquid to solid by an exothermic reaction as long as heat is released during the night, while maintaining a constant temperature throughout both processes [6].
There are different techniques for PCM incorporation into building materials, such as direct addition, immersion, and macro- or micro-encapsulation [7]. In the latter case, the PCM is included in the panels in microcapsules of another material, avoiding liquid leakage when the PCM melts [8,9] and improving heat transfer.
The additive selected for this study is Basf Micronal PCM (DS5007), which contains a special wax mixture microencapsulated (size approximately 5 μm). The main properties of this material are a melting point of 23 °C, an overall storage capacity of 55 kJ/kg, and a latent heat capacity of 41 kJ/kg [10]. The material that changes phase is an aqueous solution of paraffin encapsulated in a film of acrylate polymer. The percentage determined (in this case less than 1%) of these small containers are mixed in the mortar with the other components (such as cement or aggregates) required to obtain concrete with PCM.
This work begins with the construction of two cubicles with prefabricated panels. The first cubicle (considered as a reference) is made of self-compacting concrete. The second cubicle has the same panels but with a phase change material added during their manufacture. The aim of this study is to verify the acquisition system installed in each cubicle based on Supervisory Control and Data Acquisition (SCADA). It consists of a 1-wire bus network with four temperature sensors per panel used to measure temperature ranges inside both cubicles and several additional sensors [11]. This system offers an alternative to others used in different works [12,13], with some strengths that will be highlighted later.
The data collected by the system are analysed in order to confirm that the results agree with the real properties of the PCM. The data should show that the wall with the PCM has a lower temperature range and a lower heat flux than the one without the PCM because this material absorbs energy by changing its phase, inhibiting the rising temperature; therefore, the temperature range is lower [8,9,14,15]. As a result, the addition of the building material increases the wall’s thermal inertia [11,16,17,18,19,20]. The acquisition system should be accurate enough to detect this behaviour; otherwise, it would not be suitable for this application.
2. Principles of Acquisition System
The control of the acquisition system is based on SCADA, which allows interaction between the user and remote devices in real time, as communication is established through an Ethernet network [21]. Therefore, the process is controlled automatically from the computer screen. The main difference between SCADA and other remote-control systems is that the others spread control variables to electronic controllers, hindering the control of the process.
The communication and acquisition system is based on 1-wire technology, a simple monitoring design. The network is called “bus” (1-wire bus network) and it connects all the sensors via one cable. The result is a low-noise and high-efficiency transmission data system. Communications begin with the same sequence of a reset pulse, followed by a presence pulse. The reset pulse starts the operation and synchronizes slave devices. The presence pulse is sent to devices to ready them for operation.
3. Materials and Methods
3.1. Manufacture of Prefabricated Panels
The solid concrete panels are cast in moulds on a surface (usually a smooth steel base) in quality-controlled factories far from the building site. The first step is to clean the mould and apply a release agent to the steel surface with a cloth. Then, reinforced steel and lifting elements are placed in the mould, followed by the temperature sensors, which are attached to the steel structure and embedded in the panel (2 mm under the surface). There are four temperature sensors per panel, placed as shown in Figure 1. The north-facing panel also contains the gateway and none sensor. The mould is filled with self-compacting concrete and cured to the appropriate level of strength. Once cured, the panel is removed from mould, stored, and transported to the site when it is needed.
3.2. Installation
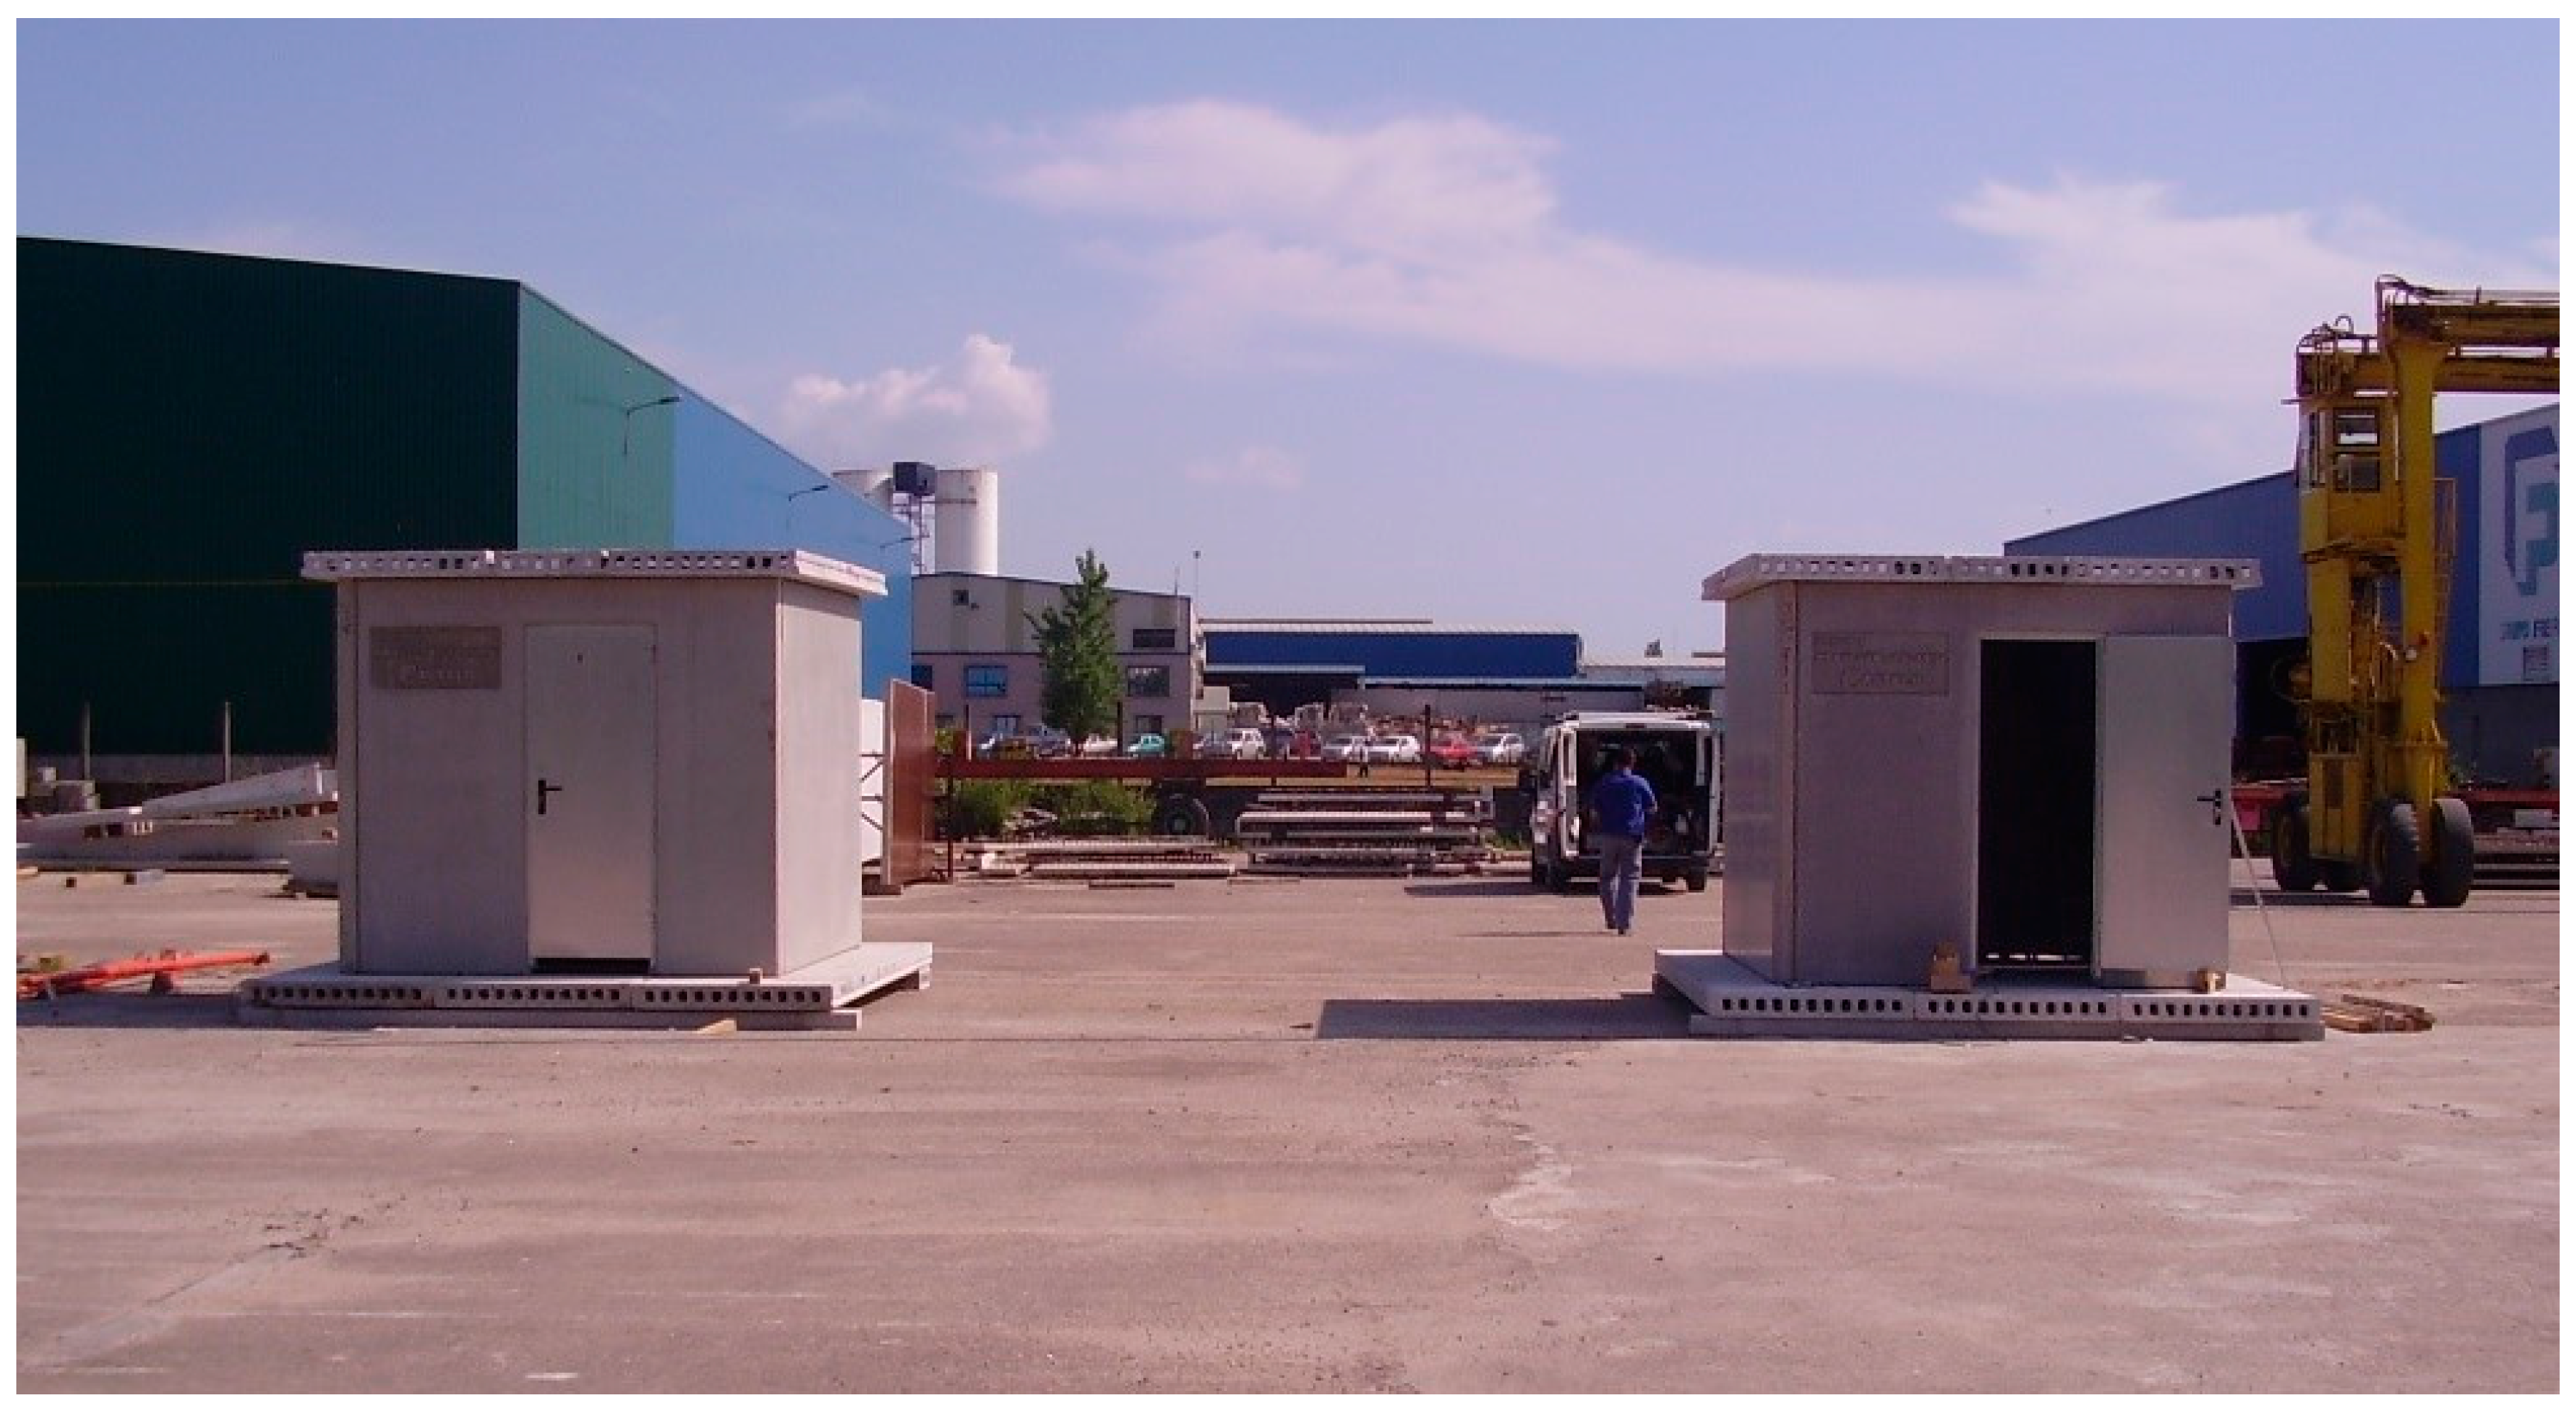
The panels are mounted on a foundation made of a hollow-core slab. The roof is a three-layer panel: hollow-core slab (12 cm), polyurethane foam (5 cm), and reinforced concrete (5–10 cm to achieve a certain inclination to the north wall). Both test rooms have the same dimensions and the same foundation and roof. The dimensions of the cubicles are 250 × 250 cm, and the walls (panels where temperature sensors are placed) are 262 × 239 × 12 cm. The final result can be seen in Figure 2.
The sensors installed in each cubicle are listed herein: embedded temperature sensors, indoor temperature and humidity sensors, and a heat flux sensor in the south panel. The south panel serves as the reference panel, since it is the one with the biggest surface temperature range because it has the longest exposure to direct sunlight. To maintain the indoor temperature level, a heat pump is installed in each cubicle, which may supply heat to or release heat from the room.
3.3. Data Collection Equipment
3.3.1. Data Collected and Sensor Distribution
3.3.2. Hardware
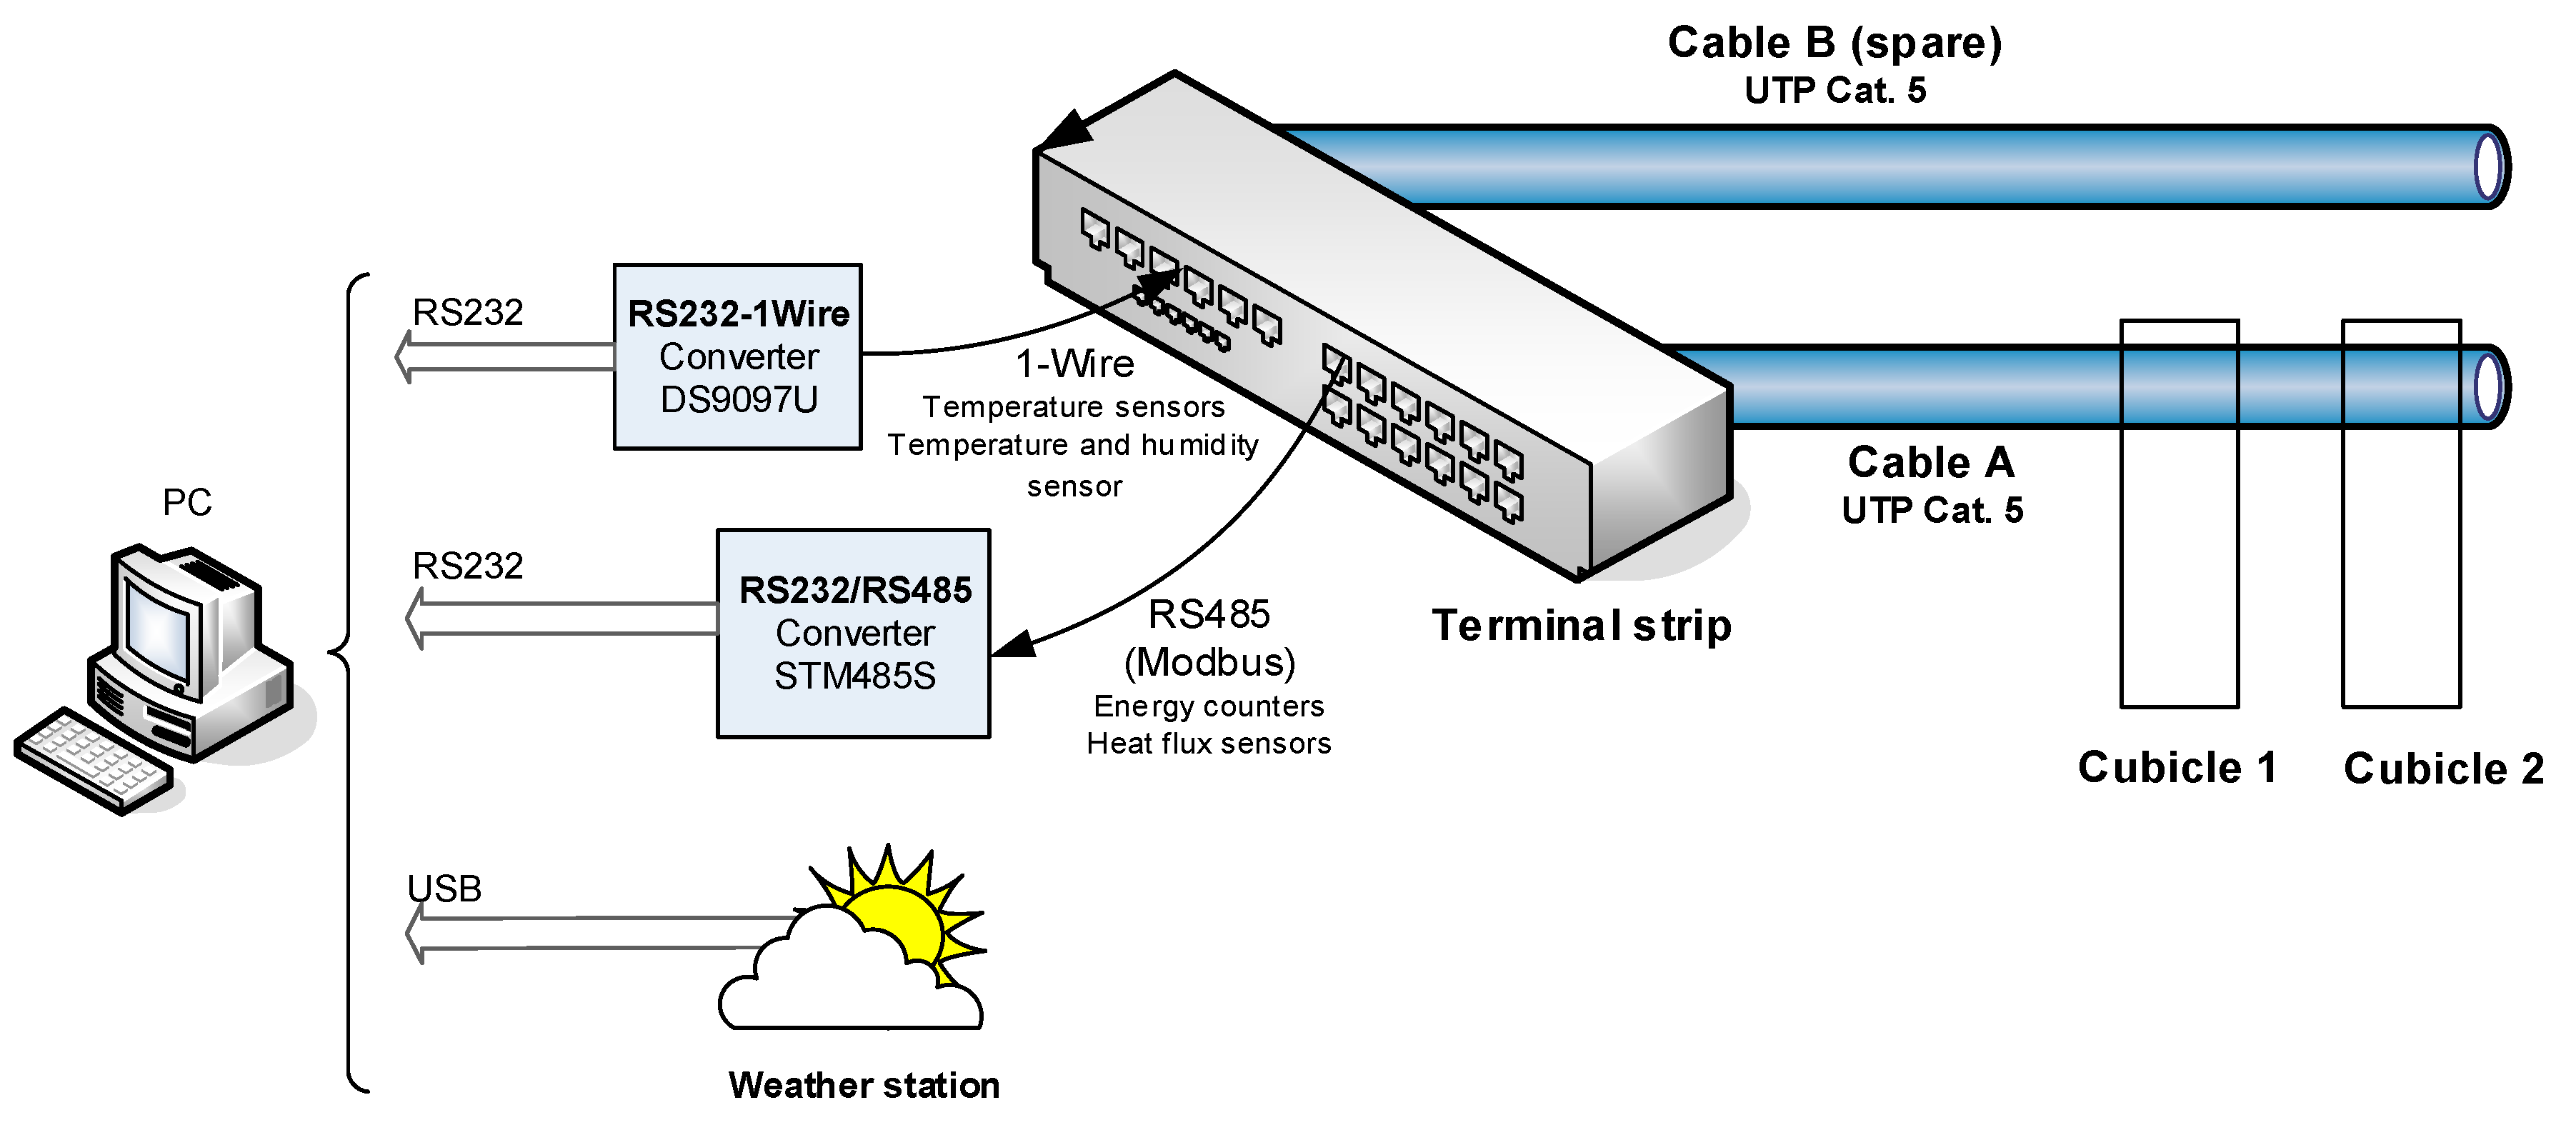
The acquisition system involves two separated Cat. 5 UTP cables (four pairs each); cable A is the one being used and cable B is a spare for future expansion (Figure 4). Cable A joins each cubicle’s sensors with the following materials:
- The 1-Wire bus, which includes temperature sensors (Maxim DS18B20 (Maxim Integrated, San Jose, CA, USA)) and humidity sensors (Maxim DS1923 Hygrochron (Maxim Integrated, San Jose, CA, USA));
- The Modbus RTU, which includes energy counters (MK-30LCD-RS485 (Siemens, Nordborg, Denmark)) to measure each heat pump’s consumption and heat flux sensors (Ahlborn FQA-0801-H (Ahlborn, Holzkirchen, Deutschland)) connected to an analogue module with MODBUS connection (ADAM 4017 (B&B Electronics, Ottawa, IL, USA)).
The data collected by the sensors are stored on the hard disk of an industrial PC, which identifies each device with a 64-bit code. Since each device has a unique code, the number of allowable temperature sensors connected to this 1-wire bus is virtually unlimited.
There is also a weather station (SEN-08311) located on the roof of the reference cubicle connected to the industrial PC via USB.
3.3.3. Wire Connections
Cable A has four pairs of wires. Their connections for signal transport are presented in Table 2.
3.3.4. Power Supply
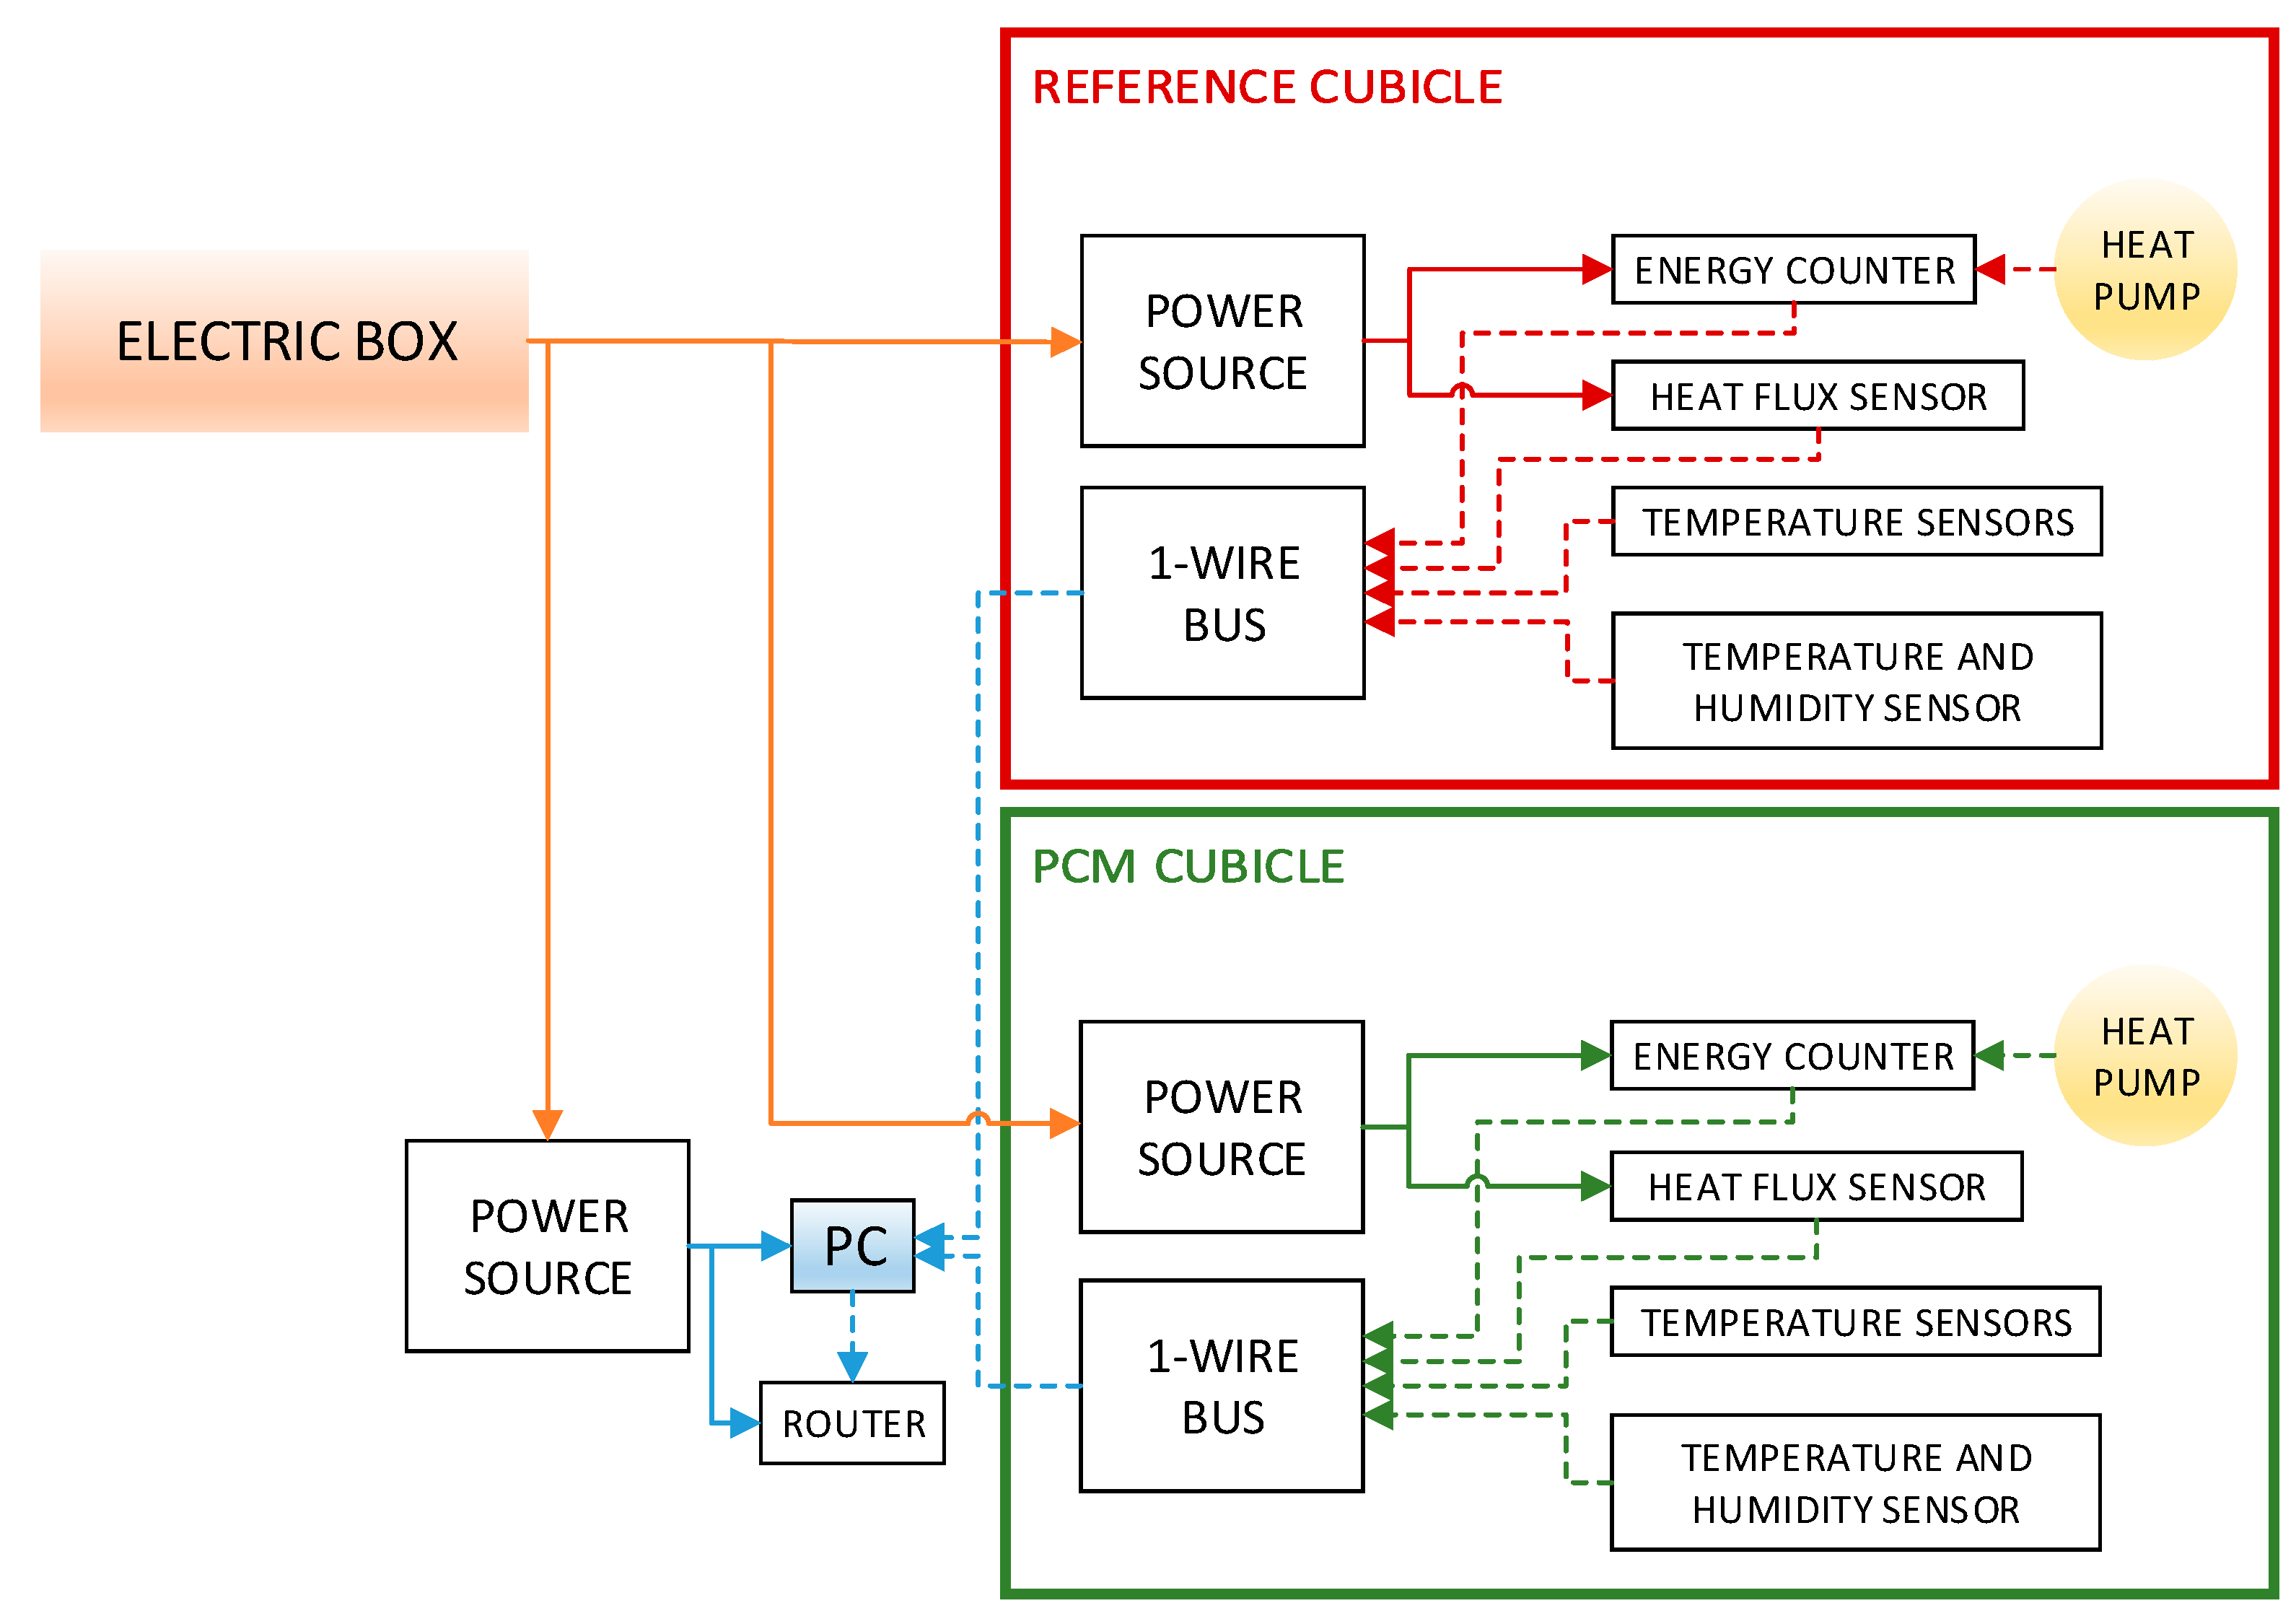
Regarding power supply, an electric breaker box is installed outside the cubicles in order to separate the cubicle wiring from the electricity grid. It consists of a three-phase thermal magnetic circuit breaker, an automatic differential switch, and a three-phase electricity consumption meter to collect data on the global energy that is consumed by a full installation (Figure 5). This electric box gives electricity to the power sources placed in both cubicles and a third one outside, which is connected to the industrial PC and the router.
The power source placed in each cubicle supplies energy to the heat flux sensors and the energy counters. This way, the Modbus RTU does not need a power supply line (there is one spare power supply cable in case the power source is unavailable).
The temperature and humidity sensors do not need any power supply, although one is installed as a spare 1-wire line of 5 V, which provides power in case there is a failure and ensures continuous sensors operation of the sensors.
3.4. Testing Procedure
Once the cubicles are completely assembled and all the units and sensors are installed, the acquisition system can be tested. To prove this application, data are collected during July and December (summer and winter), because these months represent the temperature extremes during the year in the location selected. Heat pumps maintain the indoor temperature of 20 °C. They provide heat to or release heat from the rooms depending on the inside temperature of the rooms. Four rainless days were chosen for testing each month; therefore, the walls were dry during testing.
Since the percentage of additive in the PCM walls is quite low (<1%), the energy storage and the effect in thermal inertia should be limited. To characterise the building materials, the composition, density and thermal conductivity of both types of walls were determined (Appendix A). The results from this analysis show small differences between the walls; therefore, the low addition of the PCM certainly triggers some effects in material behaviour. The effects should be reflected in each wall’s temperature and heat flux evolution. The acquisition system should be accurate enough to register this difference; otherwise, it would not be suitable for this application because small differences in temperature ranges may cause a remarkable difference in the necessary energy consumption for maintaining a comfortable indoor temperature.
4. Results
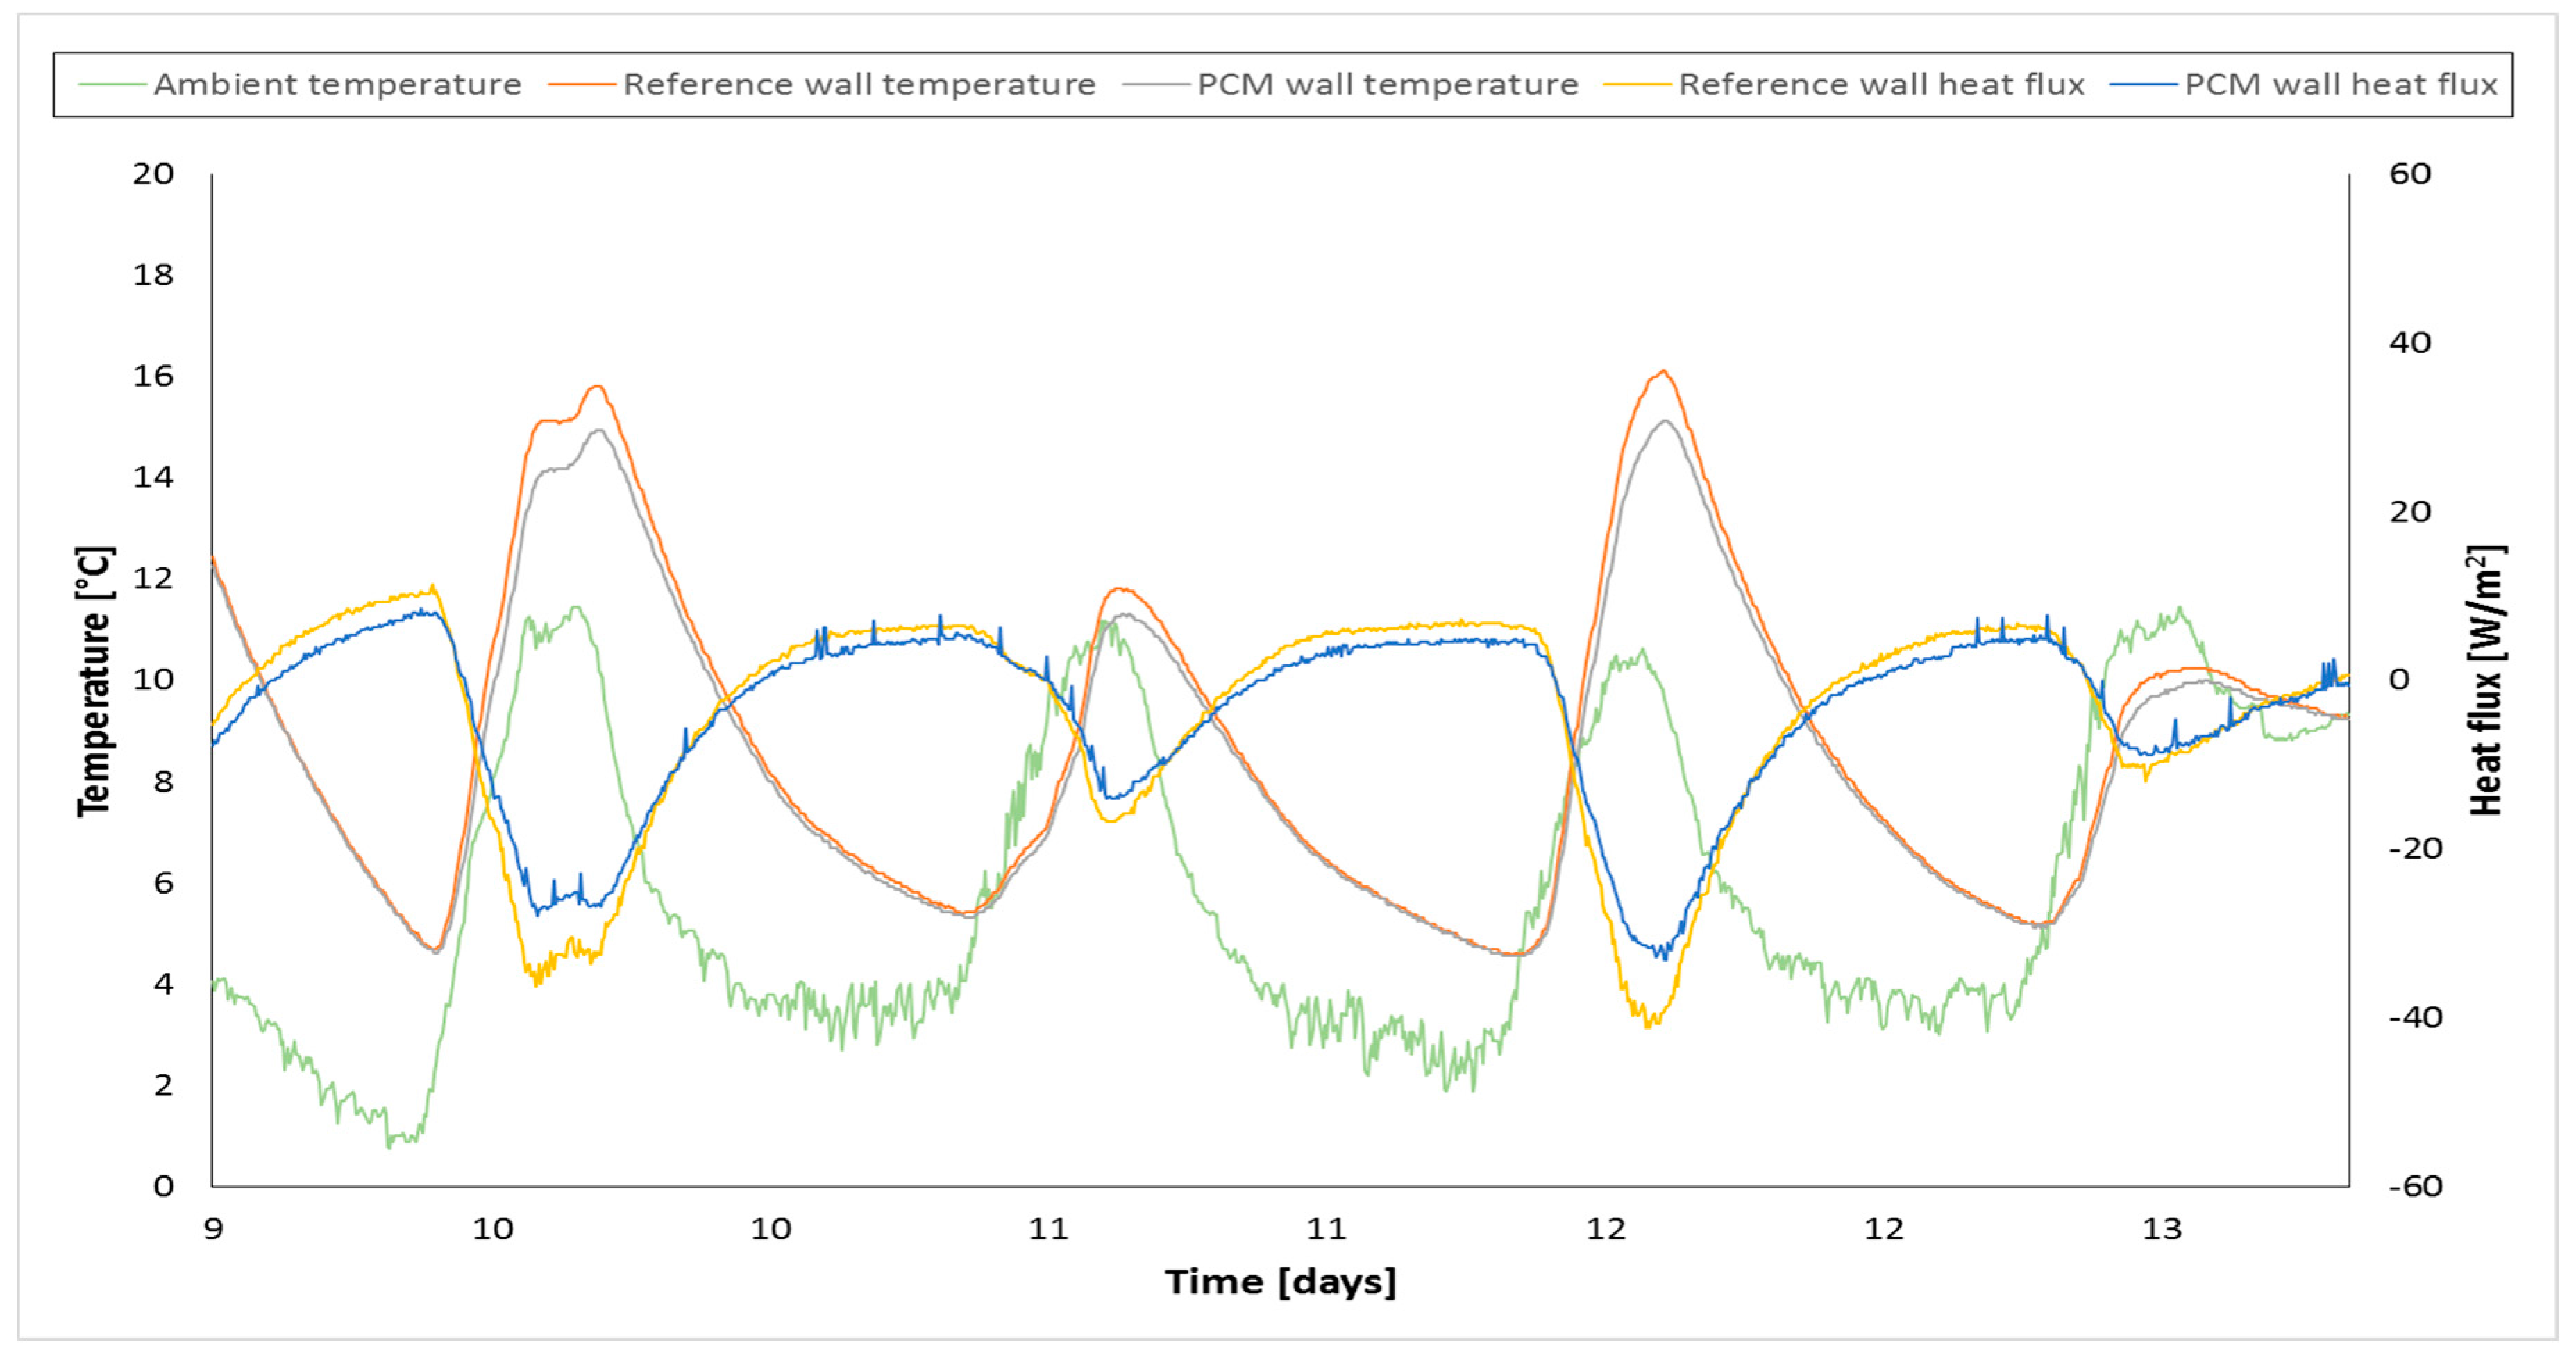
The following graphs depict the data collected from the heat flux sensors, the weather station, and the temperature sensors located on the vertical middle line of the south panels, 1 metre above the ground. The heat flux density was measured at the midpoint of the walls. The first figure shows results obtained from both the reference (without the PCM) and the PCM-added cubicles in July, and the second figure shows the results from December.
Data from both graphs were collected over four days; thus, the outdoor temperature rises and falls four times. All temperatures ascended during the daytime and descended during the night, although the changes in temperature did not occur at exactly the same time each day. With an increasing outdoor temperature, the PCM receives energy, and it changes phase from solid to liquid, thereby storing this energy. At night, the outdoor temperature decreases, and the material releases the stored energy, changing its phase from liquid to solid. A data analysis is presented below.
First, the effect of the PCM on the inner surface temperature is clearly different for each season. In the winter, there is a difference between the temperature ranges of the walls with and without the PCM. The wall without the PCM experiences a temperature range 1 °C wider than the wall with PCM due to the energy absorption from the PCM. Heat is supplied to this material, and its phase changes from solid to liquid at constant temperature; therefore, the energy absorbed in this process does not lead to a temperature increase. In the summer, the difference is less remarkable because of the season’s higher temperature. The PCM’s melting point is 23 °C, and the ambient temperature is over this value most of the time. For this reason, this PCM is nearly ineffective in these conditions. Nevertheless, the PCM’s wall temperature is below the reference at maximum and above the reference at minimum due to the aforementioned the phase change process.
As a result of the reduction of the temperature range triggered by the PCM, it is easier to keep a constant indoor temperature since the influence of outdoor conditions are limited. This means that lower energy consumption is required from heat pumps or other air conditioning systems for maintaining indoor comfort.
The maximum wall temperature difference in Figure 6 is 1 °C. The wall with the PCM presents lower temperatures than the reference, and the gap between them is larger at peaks, when there is a maximum temperature.
In winter, the temperature peak is delayed approximately 1 h for the PCM wall due to its higher thermal inertia. In winter, the temperatures in the morning are quite similar (when they are rising), but the effect becomes significant during the rest of the day. This is appreciable in Figure 6, particularly for the peaks. In the summer (Figure 7), data follow the same pattern, but the temperature curves almost overlap. However, a delay can also be seen at the peaks and troughs. The delay with respect to ambient temperature for both cubicle temperatures is linked to concrete thermal inertia.
The graphs show the heat flux densities through the south walls. Positive values represent the heat moving from the outside to the inside of the cubicles through the south wall, and negative values represent the heat moving from the inside to the outside. When a panel with the PCM receives direct sunlight, the PCM melts, and the panel’s heat flux density is lower than that of a wall without the PCM in both cases (summer and winter) because of the energy stored inside the wall from the phase change process. This energy is released at night, when the material phase changes from liquid to solid, increasing the heat flux density. Once again, the effect is more visible in winter due to the relation between outdoor temperatures and the PCM’s melting point.
As a result, the energy consumption to maintain a comfortable temperature is reduced if a PCM is added to the building materials. When the ambient temperature rises, a percentage of the energy transferred to the wall is stored in it as phase change, reducing the heat flux and allowing an easier conditioning of the cabin. The energy stored is released when the ambient temperature drops, increasing the heat flux and allowing for easier climate conditioning since the indoor temperature does not vary as much as the ambient temperature.
As hypothesised, adding PCM to building materials is linked to a reduction of the energy consumed to achieve an indoor comfort temperature. It contributes to inhibiting the effect of the ambient temperature by storing energy in the wall.
5. Conclusions
This work presents and verifies an acquisition and monitoring system operation. The system was developed in order to obtain real-time data from buildings and to allow remote control of the system. Interest in this application is growing lately due to the need for energy efficient buildings, and the setup described excels with its simplicity, accuracy, and operator integration into the process.
The communication technology chosen was a 1-wire bus network. It creates a simple, fast, and economically feasible acquisition system from sensors; additionally, it allows for the adding, swapping, or removing of an element from the setup at any time. It presents a more simple and economical solution than other technologies that offer similar services, such as wireless communication systems, which require the calibration of the devices. Moreover, the system tested presents a low noise level, and the number of measuring devices that can be integrated into the bus is virtually unlimited. The data acquisition and monitoring system was SCADA, which grants real-time interaction with the user and remote supervision and control automatically.
Two cubicles were built with temperature sensors embedded in the walls, along with additional sensors, to prove that the data acquisition system works properly for this application. There is a reference cubicle made of self-compacting concrete closure panels and a second one made of self-compacting concrete with a microencapsulated phase change material (<1%). Currently, this kind of additive is widely used in building materials; the main purpose of these experimental tests was to prove that the acquisition system was able to register the enhancement provided by the PCM.
The results show what was expected relatively accurately. It should be taken into account that the amount of the PCM added to the panels is limited, so the difference between the cubicles is supposed to be narrow. Nevertheless, greater thermal inertia, a smaller temperature range, and different heat flux can be seen for the PCM walls in comparison to the reference walls, which agrees with the a priori assumptions and conclusions from other works [11,16,17,18,19,20].
Acknowledgments
The authors acknowledge the financial support from grant ED431C 2016-032 from the Agencia Galega de Innovación (GAIN), Xunta de Galicia (Spain).
Author Contributions
Natalia Cid performed the experiments and collaborated in the manuscript write up; Ana Ogando prepared the facility for testing; M. A. Gómez supervised the tests and the article writing.
Conflicts of Interest
The authors declare no conflict of interest.
Appendix A
The construction materials used to make the walls of the cubicles have been characterised in order to compare its properties and assume that the differences in behaviour are due to the PCM addition. Composition, density and thermal conductivity have been determined for both cases. The former is presented in Table A1.

Table A1.
Cubicle panels composition.
| Self-Compacting Concrete | Self-Compacting Concrete with PCM | |
|---|---|---|
| Cement (kg) | 290 | 275 |
| Filler (kg) | 290 | 300 |
| Gravel (kg) | 704 | 710 |
| Sand (kg) | 882 | 915 |
| Plasticizer (L) | 5.3 | 6 |
| Viscosity modifying agent (L) | 1 | - |
| PCM (kg) | - | 11.32 (27.5 L) |
| Water (kg) | 73 | 69 |
| SUM (kg/m3) | 2245 | 2302 |
Appendix A.1. Density Determination
Two cubic pieces (10 × 10 × 10 cm) are produced to determine the density of self-concrete with and without the PCM. They are weighed, and their volume is measured by introducing each piece to a container full of water, then the overflowed liquid is weighed assuming that its density is 1000 kg/m3. The results of this study are plotted in Table A2 (SCC: self-compacting concrete, SCC PCM: self-compacting concrete with PCM).
Table A2.
Experimental data obtained for density determination.
| Material | Cube Weigh (g) | Water Weigh, Overflowed (g) | Volume (cm3) | Density (kg/L) |
|---|---|---|---|---|
| SCC 1 | 2333 | 978 | 977.42 | 2.39 |
| SCC 2 | 2333 | 1019 | 1018.39 | 2.29 |
| SCC 3 | 2333 | 984 | 983.41 | 2.37 |
| SCC 4 | 2333 | 995 | 994.41 | 2.35 |
| SCC 5 | 2332 | 981 | 980.42 | 2.38 |
| SCC average | - | - | - | 2.36 |
| SCC PCM 1 | 2283 | 960 | 959.43 | 2.38 |
| SCC PCM 2 | 2284 | 995 | 994.41 | 2.30 |
| SCC PCM 3 | 2284 | 982 | 981.41 | 2.33 |
| SCC PCM 4 | 2283 | 950 | 949.43 | 2.40 |
| SCC PCM 5 | 2284 | 965 | 964.42 | 2.37 |
| SCC PCM average | - | - | - | 2.36 |
The density is very similar for both materials. Therefore, the PCM addition, in this case and with this composition, does not influence this property. The amount of the PCM added to building materials may modify their properties in such a way that they are no longer suitable for their purpose [22]. For example, if the PCM percentage added is too high, when it melts the wall may not be able to withstand the design loads.
Appendix A.2. Thermal Conductivity Determination
The same test pieces (cubes of 10 × 10 × 10 cm) are used for thermal conductivity determination. They are tested in a heat flow meter (StiroLab LM 305 (StiroLab Material Testing Technology, Sežana, Slovenija)). The software in this unit monitors (between other variables) real-time temperature of the plates that are in direct contact with the test cubes, thermal conductivity and resistance and real-time heat flux through the cubes. Multiple tests are completed for different temperature selections in order to calculate the average thermal conductivity of each material. The results are plotted in Table A3 (self-compacting concrete) and Table A4 (self-compacting concrete with the PCM). Temperature is the one selected for the test, λ is the thermal conductivity, R is the thermal resistance, ΔT is the temperature difference between the plates of the unit, and e is the separation between them.
Table A3.
Experimental data obtained for thermal conductivity determination (SCC).
| Temperature (°C) | λ | R | ΔT | e (mm) |
|---|---|---|---|---|
| 25 | 1.55379 | 0.06449 | 10.45 | 100.20 |
| 25 | 1.56141 | 0.06417 | 10.48 | 100.20 |
| 25 | 1.50138 | 0.06674 | 10.62 | 100.20 |
| 25 | 1.50214 | 0.06670 | 10.64 | 100.20 |
| 25 | 1.52107 | 0.06587 | 10.98 | 100.20 |
| 25 (average) | 1.52796 | 0.06559 | 10.63 | - |
| 30 | 1.54939 | 0.06467 | 11.04 | 100.20 |
| 30 | 1.55099 | 0.06460 | 11.04 | 100.20 |
| 30 | 1.51776 | 0.06602 | 11.17 | 100.20 |
| 30 (average) | 1.53938 | 0.06509 | 11.08 | - |
| 35 | 1.53743 | 0.06517 | 11.55 | 100.20 |
| 35 | 1.45660 | 0.06879 | 11.50 | 100.20 |
| 35 | 1.51026 | 0.06635 | 11.78 | 100.20 |
| 35 (average) | 1.50143 | 0.06677 | 11.71 | - |
Table A4.
Experimental data obtained for thermal conductivity determination (SCC PCM).
| Temperature (°C) | λ | R | ΔT | e (mm) |
|---|---|---|---|---|
| 20 | 1.50353 | 0.06664 | 9.86 | 100.20 |
| 20 | 1.45019 | 0.06909 | 10.04 | 100.20 |
| 20 (average) | 1.47686 | 0.06787 | 9.95 | - |
| 25 | 1.43678 | 0.06974 | 10.69 | 100.20 |
| 25 | 1.46437 | 0.06843 | 10.99 | 100.20 |
| 25 (average) | 1.45058 | 0.06909 | 10.84 | - |
| 30 | 1.44157 | 0.06951 | 11.20 | 100.20 |
| 30 | 1.43385 | 0.06988 | 11.33 | 100.20 |
| 30 (average) | 1.43771 | 0.06969 | 11.27 | - |
| 35 | 1.34984 | 0.07423 | 11.73 | 100.20 |
| 35 | 1.30446 | 0.07681 | 11.79 | 100.20 |
| 35 (average) | 1.32715 | 0.07552 | 11.76 | - |
As it can be seen in Table A3 and Table A4, thermal conductivity is lower for PCM walls compared to the reference walls for different test temperatures. Obviously, thermal resistance is higher for the PCM-added material; therefore, the PCM works as an insulator, reducing the heat flux through the material and delaying the stationary state [23]. Moreover, thermal conductivity decreases with the increasing test temperature for the SCC PCM, and the difference between both materials increases. All in all, the energy efficiency of the building is improved by using building materials with a PCM addition.
References
- European Parliament. Directive 2012/27/EU of the European Parliament and of the Council of 25 October 2012 on energy efficiency. Off. J. Eur. Union 2012, 315, 1–56. [Google Scholar]
- European Parliament. Directive 2010/31/EU of the European Parliament and of the Council of 19 May 2010 on the energy performance of buildings (recast). Off. J. Eur. Union 2010, 18, 13–35. [Google Scholar]
- Santamouris, M. (Ed.) Energy and Climate in the Urban Built Environment; Routledge: New York, NY, USA, 2001. [Google Scholar]
- Feustel, H.E.; Stetiu, C. Thermal Performance of Phase Change Wallboard for Residential Cooling Application; Lawrence Berkeley National Laboratory: Berkeley, CA, USA, 1997.
- Zalba, B.; Marín, J.M.; Cabeza, L.F.; Mehling, H. Review on thermal energy storage with phase change: Materials, heat transfer analysis and applications. Appl. Therm. Eng. 2003, 23, 251–283. [Google Scholar] [CrossRef]
- Baetens, R.; Jelle, B.P.; Gustavsen, A. Phase change materials for building applications: A state-of-the-art review. Energy Build. 2010, 42, 1361–1368. [Google Scholar] [CrossRef]
- Soares, N.; Santos, P.; Gervásio, H.; Costa, J.J.; Simões da Silva, L. Energy efficiency and thermal performance of lightweight steel-framed (LSF) construction: A review. Renew. Sustain. Energy Rev. 2017, 78, 194–209. [Google Scholar] [CrossRef]
- Liu, P.-F.; Lin, Y.-P.; Tzeng, C.-T.; Lai, C.-M. Heat Transfer and Energy Performance of a PVA Wall Tile Containing Macro-Encapsulated PCM. Energies 2016, 9, 652. [Google Scholar] [CrossRef]
- Chung, M.; Park, J. An Experimental Study on the Thermal Performance of Phase-Change Material and Wood-Plastic Composites for Building Roofs. Energies 2017, 10, 195. [Google Scholar] [CrossRef]
- Castellón, C.; Nogués, M.; Roca, J.; Medrano, M.; Cabeza, L.F. Microencapsulated phase change materials (PCM) for building applications. In Proceedings of the Tenth International Conference on Thermal Energy Storage, Galloway, NJ, USA, 31 May–2 June 2006. [Google Scholar]
- Cabeza, L.F.; Castellón, C.; Nogués, M.; Medrano, M.; Leppers, R.; Zubillaga, O. Use of microencapsulated PCM in concrete walls for energy savings. Energy Build. 2007, 39, 113–119. [Google Scholar] [CrossRef]
- Guarino, F.; Dermardiros, V.; Chen, Y.; Rao, J.; Athienitis, A.; Cellura, M.; Mistretta, M. PCM Thermal Energy Storage in Buildings: Experimental Study and Applications. Energy Procedia 2015, 70, 219–228. [Google Scholar] [CrossRef]
- Qin, Y.; Liu, L.; Tie, M.; Zhang, L. Observation and Research on Temperature Distribution of Concrete Box Girder in Diurnal Change of Temperature. In Proceedings of the 2011 International Conference on International Conference on Transportation, Mechanical, and Electrical Engineering, Changchun, China, 16–18 December 2011; pp. 1941–1945. [Google Scholar]
- Gómez, M.A.; Álvarez Feijoo, M.A.; Comesaña, R.; Eguía, P.; Míguez, J.L.; Porteiro, J. CFD Simulation of a Concrete Cubicle to Analyze the Thermal Effect of Phase Change Materials in Buildings. Energies 2012, 5, 2093–2111. [Google Scholar] [CrossRef]
- Seong, Y.-B.; Lim, J.-H. Energy Saving Potentials of Phase Change Materials Applied to Lightweight Building Envelopes. Energies 2013, 6, 5219–5230. [Google Scholar] [CrossRef]
- Oliver, A. Thermal characterization of gypsum boards with PCM included: Thermal energy storage in buildings through latent heat. Energy Build. 2012, 48, 1–7. [Google Scholar] [CrossRef]
- Kuznik, F.; David, D.; Johannes, K.; Roux, J.J. A review on phase change materials integrated in building walls. Renew. Sustain. Energy Rev. 2011, 15, 379–391. [Google Scholar] [CrossRef]
- Chan, A.L.S. Energy and environmental performance of building faç ades integrated with phase change material in subtropical Hong Kong. Energy Build. 2011, 43, 2947–2955. [Google Scholar] [CrossRef]
- Hawes, D.W.; Feldman, D.; Banu, D. Latent heat storage in building materials. Energy Build. 1993, 20, 77–86. [Google Scholar] [CrossRef]
- Hawes, D.W.; Banu, D.; Feldman, D. Latent heat storage in concrete. II. Sol. Energy Mater. 1990, 21, 61–80. [Google Scholar] [CrossRef]
- Mandado Pérez, E.; Marcos Acevedo, J.; Fernández Silva, C.; Armesto Quiroga, J.I. Autómatas Programables y Sistemas de Automatización; Marcombo: Barcelona, Spain, 2009. [Google Scholar]
- Fenollera, M.; Míguez, J.L.; Goicoechea, I.; Lorenzo, J.; Álvarez, M.Á. The influence of phase change materials on the properties of self-compacting concrete. Materials 2013, 6, 3530–3546. [Google Scholar] [CrossRef] [PubMed]
- Borreguero, A.M.; Carmona, M.; Sanchez, M.L.; Valverde, J.L.; Rodriguez, J.F. Improvement of the thermal behaviour of gypsum blocks by the incorporation of microcapsules containing PCMS obtained by suspension polymerization with an optimal core/coating mass ratio. Appl. Therm. Eng. 2010, 30, 1164–1169. [Google Scholar] [CrossRef]
Figure 1.
(a) Location of the surface temperature sensors on the panel; (b) detail of a surface temperature sensor before concrete casting.
Figure 1.
(a) Location of the surface temperature sensors on the panel; (b) detail of a surface temperature sensor before concrete casting.
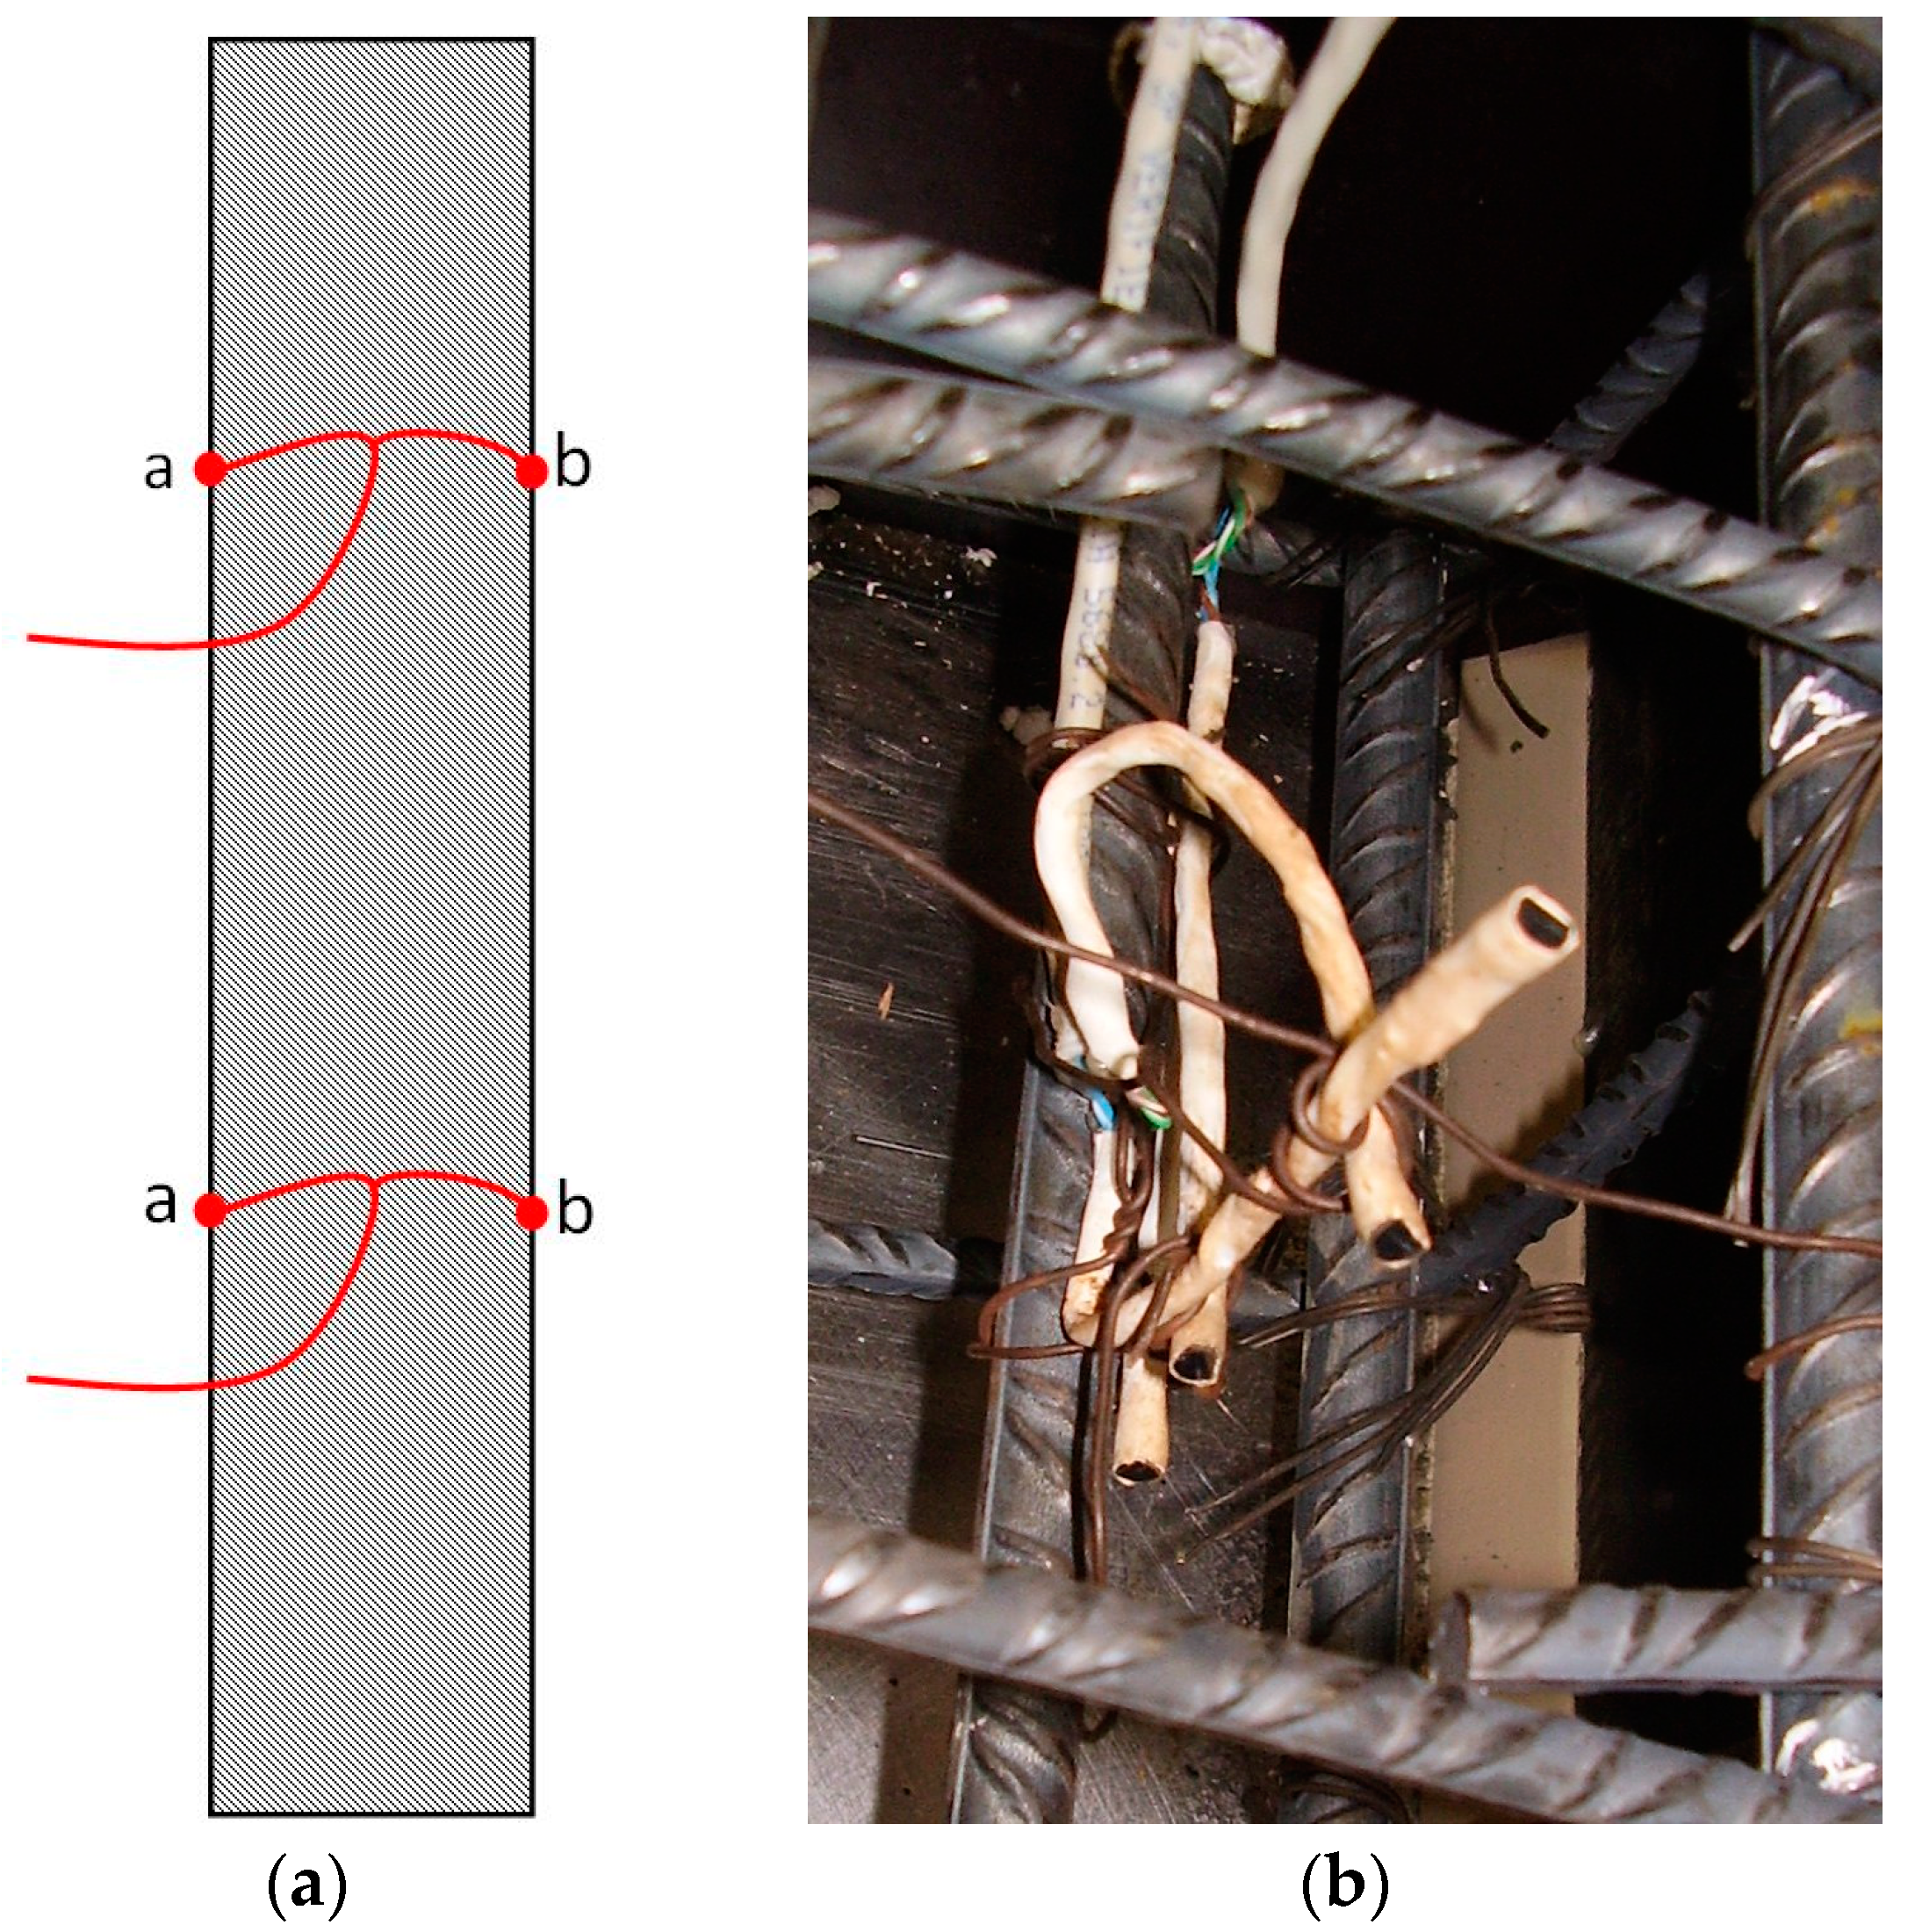
Figure 2.
Experimental cubicles.

Figure 3.
Orientation of cubicles and distribution of sensors and units.
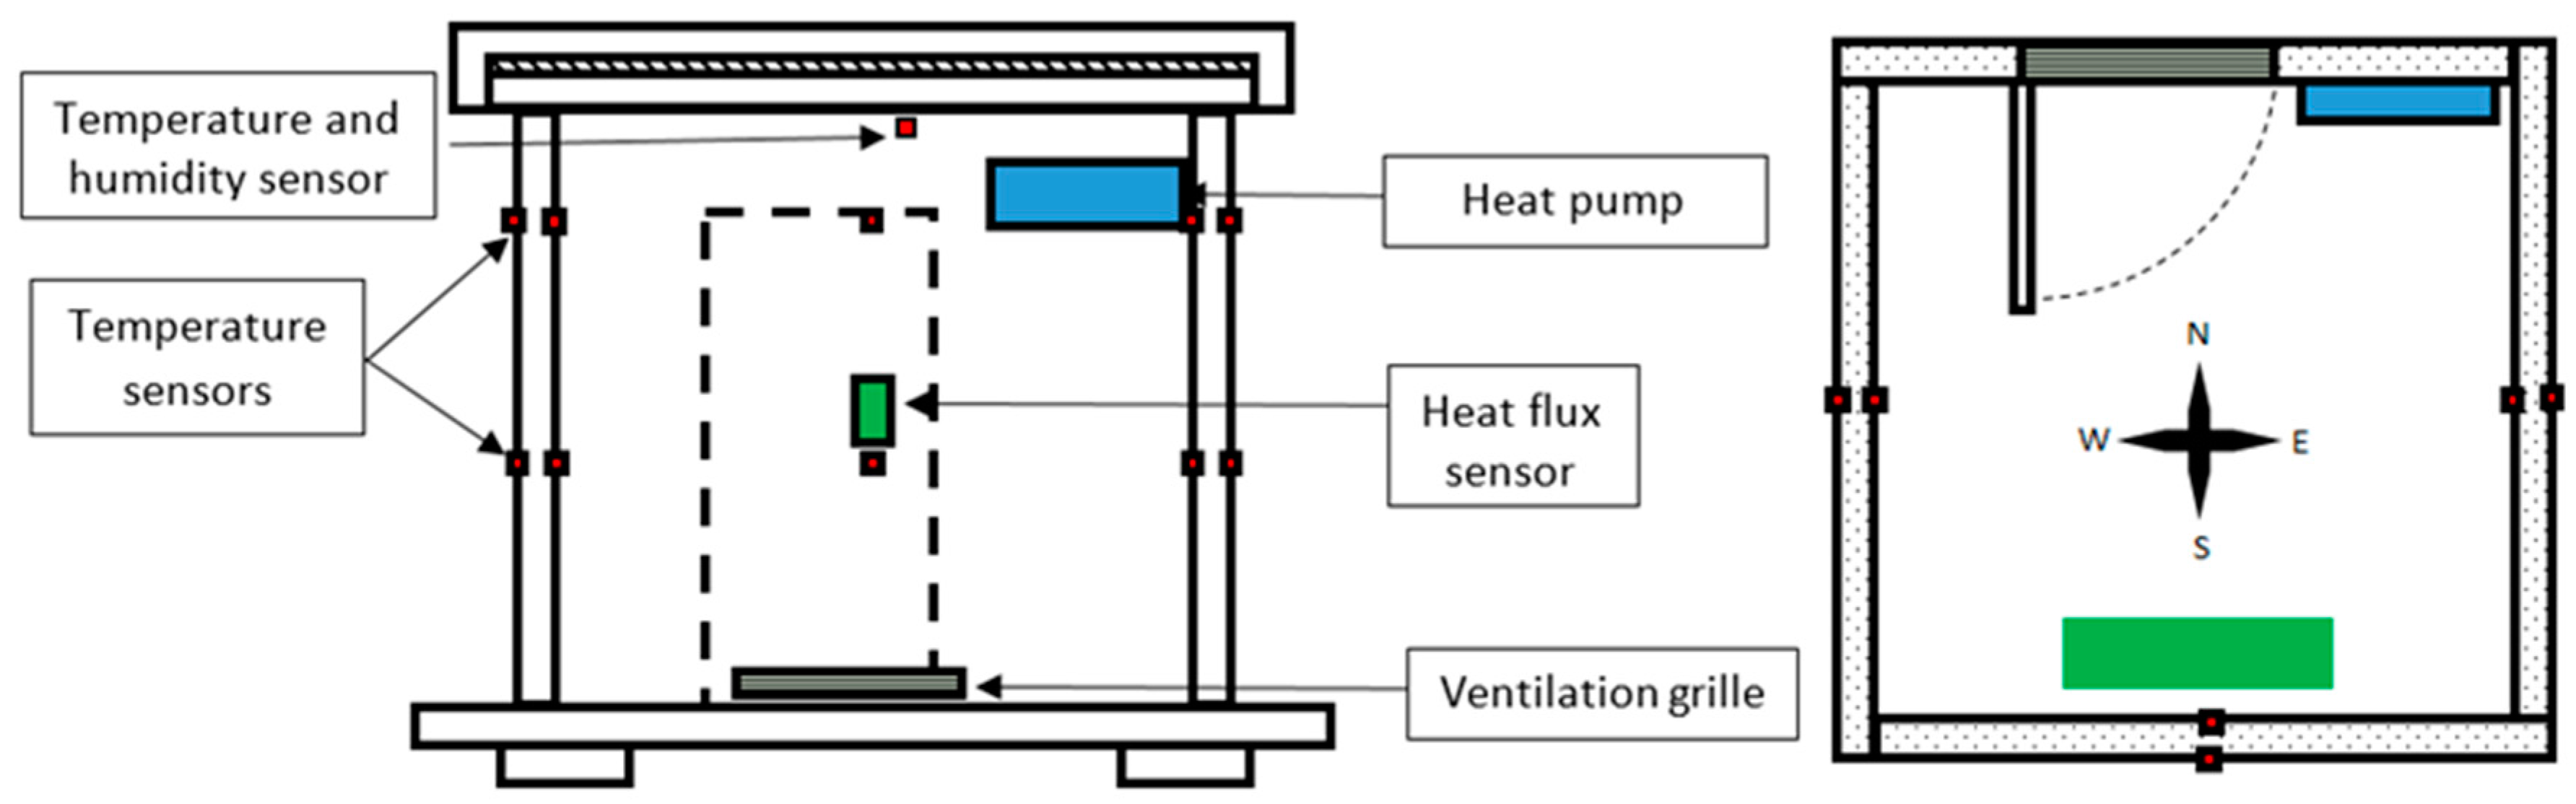
Figure 4.
Network diagram.

Figure 5.
Data collection system and power supply.

Figure 6.
Comparison between interior surface south wall temperatures, outdoor temperature and heat flux through the south wall for both cubicles. Winter (December).
Figure 6.
Comparison between interior surface south wall temperatures, outdoor temperature and heat flux through the south wall for both cubicles. Winter (December).

Figure 7.
Comparison between interior surface south wall temperatures, outdoor temperature and heat flux through the south wall for both cubicles. Summer (July).
Figure 7.
Comparison between interior surface south wall temperatures, outdoor temperature and heat flux through the south wall for both cubicles. Summer (July).
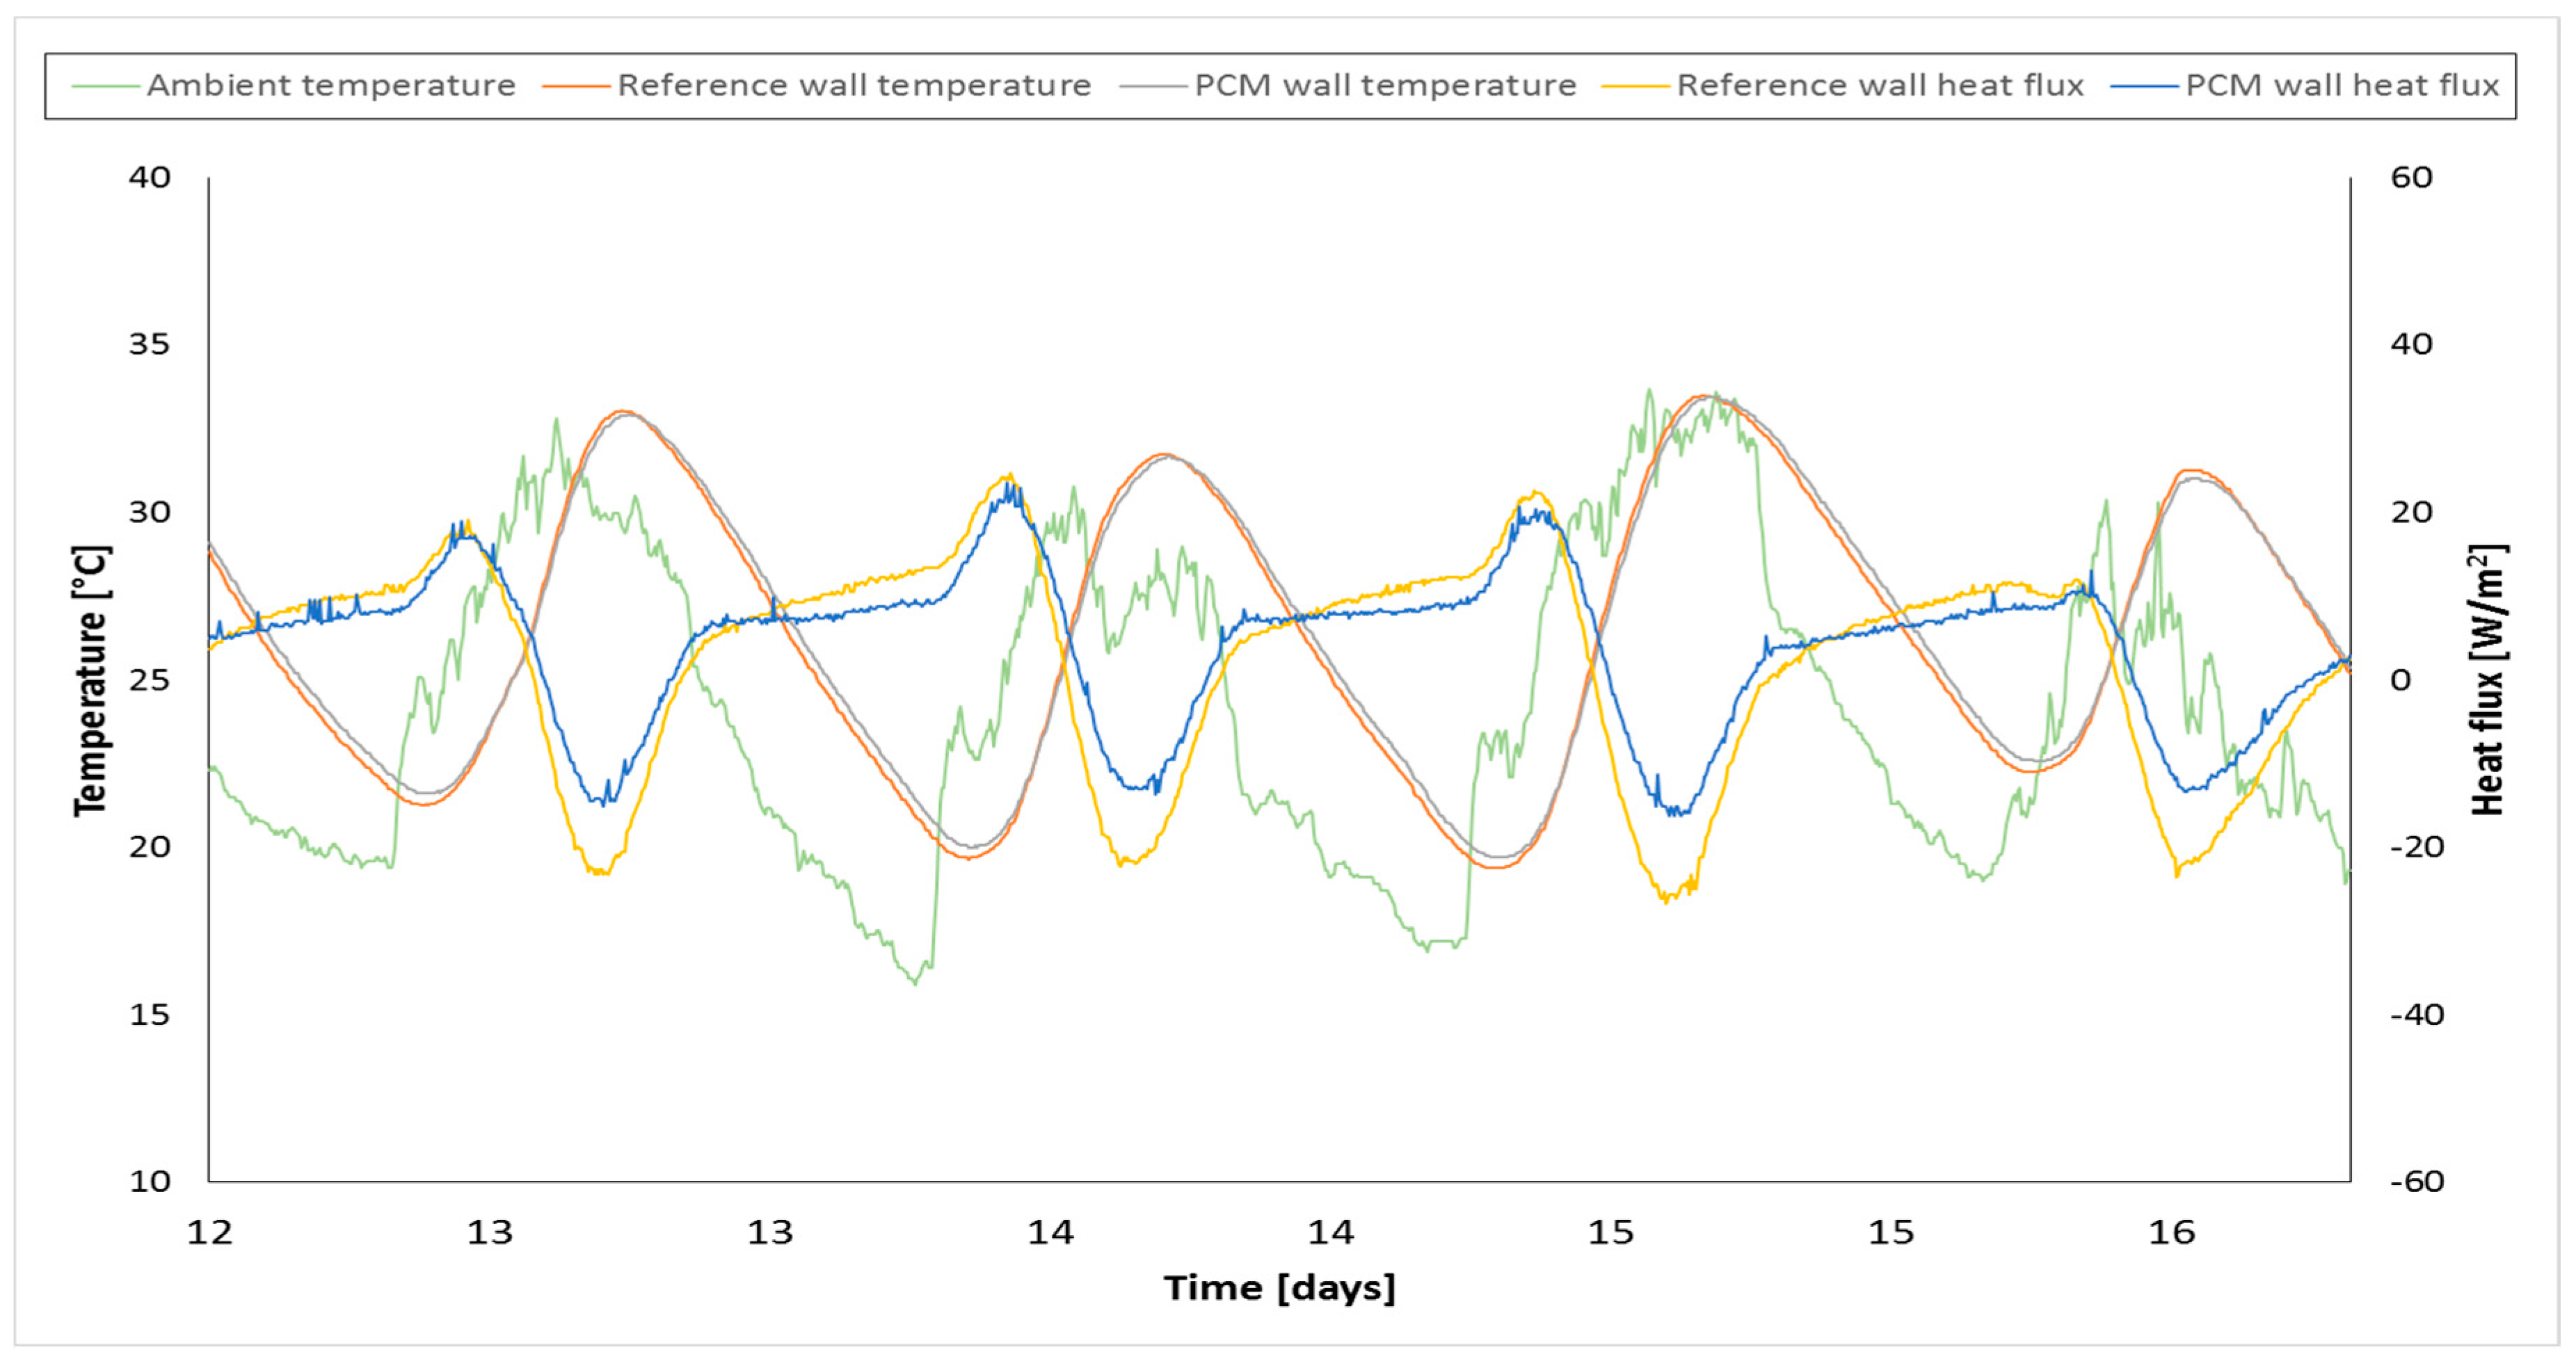
Table 1.
Data collected from each cubicle.
| Data Collection | |
|---|---|
| Outdoor and indoor temperatures | Outdoor and indoor humidity |
| Inner and outer surface temperatures of the panels | Heat flux through the south panels |
| Rainfall data | Wind direction and speed |
| Energy consumption of the heat pumps | - |
Table 2.
Signal and colours distribution for cable A.
| Element | Colour | Signal |
|---|---|---|
| MODBUS ground | Green | MODBUS Gnd |
| Green-White | Free (spare power supply cable) | |
| 1-Wire power supply | Brown | VDD 1-Wire |
| Brown-White | VDD 1-Wire | |
| MODBUS | Orange | −D |
| Orange-White | +D | |
| 1-Wire | Blue | 1-Wire Gnd |
| Blue-White | Data |
© 2017 by the authors. Licensee MDPI, Basel, Switzerland. This article is an open access article distributed under the terms and conditions of the Creative Commons Attribution (CC BY) license (http://creativecommons.org/licenses/by/4.0/).
Share and Cite
MDPI and ACS Style
Cid, N.; Ogando, A.; Gómez, M.A. Acquisition System Verification for Energy Efficiency Analysis of Building Materials. Energies 2017, 10, 1254. https://doi.org/10.3390/en10091254
AMA Style
Cid N, Ogando A, Gómez MA. Acquisition System Verification for Energy Efficiency Analysis of Building Materials. Energies. 2017; 10(9):1254. https://doi.org/10.3390/en10091254
Chicago/Turabian StyleCid, Natalia, Ana Ogando, and M. A. Gómez. 2017. "Acquisition System Verification for Energy Efficiency Analysis of Building Materials" Energies 10, no. 9: 1254. https://doi.org/10.3390/en10091254
Note that from the first issue of 2016, this journal uses article numbers instead of page numbers. See further details here.